dg integrated multistage distribution system expansion planning
TRANSCRIPT
Electrical Power and Energy Systems 33 (2011) 1489–1497
Contents lists available at ScienceDirect
Electrical Power and Energy Systems
journal homepage: www.elsevier .com/locate / i jepes
DG integrated multistage distribution system expansion planning
H. Falaghi a,⇑, C. Singh b,1, M.-R. Haghifam c,2, M. Ramezani a,3
a Department of Electrical Engineering, The University of Birjand, P.O. Box 97175-376, Birjand, Iranb Department of Electrical & Computer Engineering, Texas A&M University, College Station, TX 77843, USAc Faculty of Electrical and Computer Engineering, Tarbiat Modares University, P.O. Box 14115-111, Tehran, Iran
a r t i c l e i n f o a b s t r a c t
Article history:Received 26 June 2010Received in revised form 28 February 2011Accepted 3 June 2011Available online 2 July 2011
Keywords:Distributed generationGenetic algorithmMultistage distribution expansion planningOptimal power flow
0142-0615/$ - see front matter � 2011 Elsevier Ltd. Adoi:10.1016/j.ijepes.2011.06.031
⇑ Corresponding author. Fax: +98 561 2227795.E-mail addresses: [email protected] (H. Falaghi), sin
[email protected] (M.-R. Haghifam), mramezan1 Fax: +1 979 845 6259.2 Fax: +98 21 88004556.3 Fax: +98 561 2227795.
In this paper, a framework is presented to solve the problem of multistage distribution system expansionplanning in which installation and/or reinforcement of substations, feeders and distributed generationunits are taken into consideration as possible solutions for system capacity expansion. The proposed for-mulation considers investment, operation, and outage costs of the system. The expansion methodology isbased on pseudo-dynamic procedure. A combined genetic algorithm (GA) and optimal power flow (OPF)is developed as an optimization tool to solve the problem. The performance of the proposed approach isassessed and illustrated by numerical studies on a typical distribution system.
� 2011 Elsevier Ltd. All rights reserved.
1. Introduction
Expansion planning of the power distribution systems is one ofmajor activities of distribution utilities to deal with electric powerdemand growth. Distribution system expansion planning consistsof defining facilities to be installed and/or reinforced so that thesystem serves the forecasted demand at the lowest cost while sat-isfying operational constraints. Additionally, the system must pro-vide acceptable customer outage profile to ensure that customerreliability requirements are satisfied.
Distribution expansion planning is a highly complex problem,where solution often involves the use of sophisticated mathemati-cal modeling and intensive numerical computation. This probleminvolves a large number of local optimal solutions and when systemsize become large, the number of solutions grows exponentially.
Traditionally, distribution expansion planning is solved in twoways:
� Static approach, which considers only one planning horizon anddetermines the location, type, and capacity of new equipmentthat should be expanded and/or added to the system. In otherwords, full expansion requirements are determined in one plan-ning period [1–5].
ll rights reserved.
[email protected] (C. Singh),[email protected] (M. Ramezani).
� Multistage approach, that defines not only optimal location, typeand capacity of investment, but also the most appropriate timesto carry out such investments, so that the continuing growth ofthe demand is always assimilated by the system in an optimalway. Multistage approach refers to expansion of the system insuccessive plans over several stages, representing the naturalcourse of progression in development [6–12].
The multistage approach, due to the interdependency betweenstages, is far more challenging to formulate and solve but the solu-tion offers a more useful result. In this paper, we analyze the mul-tistage distribution expansion planning (MSDEP) problem.
Today, power system economic and operation environment haschanged as new capacity options are expanded. Distributed Gener-ation (DG) is one of these new options. The introduction of DG inpower system changes the operating features and has significanttechnical and economic advantages. Thus, optimal placement andsizing of DG sources attract active research interests and severalworks have been done in this area [13–15].
Due to the low investment risk and flexibility, DG can be imple-mented as a possible solution in distribution system expansionplanning [16] to provide more diversity of expansion solutionsfor distribution utilities. Adding DG sources to the planning optionsis resulting in challenges in the distribution expansion planningprocess since the traditional planning approach is now no longerappropriate in this new era. Consequently, expansion planningmodeling should now consider not only the substations and feed-ers but also DG sources in expansion planning alternatives. There-fore, new strategies and models for distribution system expansionplanning need to be developed to accommodate this challenge.
Nomenclature
Indicese failure eventsi substationsj feeder sectionsk distributed generation sourcesd load pointst load levelsnf number of potential and existing feeder sectionng number of candidate sites of DG installationns number of candidate and existing substations
Variablesv value of objective function ($/year)ic investment cost of the system ($/year)oc operation cost of the system ($/year)rc reliability cost of the system ($/year)CRF capital recovery factor
ECSSi�t electricity market price at the ith substation during load
level t ($/MW h)ICDG investment cost of DG sources ($/MVA)
ICFDj investment cost of the jth feeder section ($)
ICSSi fixed cost of the ith substation ($)
OCDGk operation cost of the kth DG source ($/MVA h)
PLDd�t real power demand of the dth load point at load level t
(MW)PSS
i�t dispatched real power from the ith substation at load le-vel t (MW)
PDGk�t generated power by the kth DG at load level t (MW)
SDGk�cap total capacity of the kth DG source (MVA)
SDGk�t generated power of the kth DG source (MVA)
SDGRS reserve DG capacity (MVA)
SFDj�cap maximum capacity of the ith feeder section (MVA)
SFDj�t transmitted power in the jth feeder section (MVA) at
load level tSSS
i�cap capacity of the ith substation (MVA)
SSSi�t dispatched apparent power from the ith substation at
load level t (MVA)Tt time duration of load level t (h)kd,e average failure rate affected load point d in case of each
failure event efd(rd,e) the per unit cost of outage, based on the outage time rd,e
at the load point drd,e average restoration time affected load point d in case of
each failure event eVmax, Vmin maximum and minimum allowed operation voltage
(V)Vd-t calculated voltage magnitude at the dth load point dur-
ing load level t (V)ft fitness functiondr discount raten life of the project (year)
SetsS set of existing and new substationsF set of existing and upgraded feeder sectionsG set of all selected DG sourcesT set of all load levelsD set of all demand nodesE set of all failure events
1490 H. Falaghi et al. / Electrical Power and Energy Systems 33 (2011) 1489–1497
Despite the great variety of methods for traditional distributionsystem planning, there are few studies available in the literaturefor the problem considering DG sources. The possibility to considerDG as a feasible alternative to traditional distribution system plan-ning is discussed in [17]. In [18], the authors present a networkcapacity single stage expansion algorithm based on successive elim-ination capable of deferring network expansion by optimally sitingDG sources at new or existing substations. In [19] a distribution sys-tem planning method considering DG for peak cutting is proposedwhich aims to minimize the sum of feeder investments, DG invest-ments, energy loss cost and the additional cost of DG sources. Effectsof DG on substations expansion and reliability costs are not consid-ered in this work. In [20], the authors develop a model for static dis-tribution system planning, considering DG sources. Reliabilitybenefits of DG sources and effect of load variation in the systemare not considered in this work. In [21], a multistage model for dis-tribution system planning considering DG option is presented.However, impact of DG sources on reliability improvement and alsovarying nature of load are not considered in the planning model. Insome other papers, importance of DG consideration in distributionsystem planning has been discussed [22–24].
In this paper, a new procedure for MSDEP is proposed in whichthe DG installation is considered as an option for system expansionplanning in addition to upgrade and/or installation of substationsand feeder sections. The developed model is based on minimiza-tion of overall cost in which reliability is included as customeroutage cost (COC). Then, genetic algorithm (GA) combined withoptimal power flow (OPF) is implemented to solve the optimiza-tion problem in which the optimal installation/upgrade of
substations and feeder sections as well as DG installation require-ments is determined. The pseudo-dynamic procedure [8] is usedfor multistage expansion methodology. Reliability and load varia-tion over the year as well as optimal operation strategy of DGsources over the year is considered in the proposed model. ThisMSDEP model also determines the optimal size and location ofthe reserve feeder sections (feeder sections that are not usuallyoperative except for power transfer between circuits during fail-ures in the distribution system in a radial operation state).
The remainder of this paper is structured as follows: Section 2presents mathematical formulation of the problem. Next, the hy-brid GA–OPF methodology for the solution is provided in Section3. General steps of the proposed multistage expansion planningalgorithm are presented in Section 4. Section 5 presents the resultsobtained with the application of proposed method to a case studybased on a typical distribution system. Finally, conclusions are gi-ven in Section 6.
2. Mathematical formulation
The objective of MSDEP is to supply the loads over the planningstages while the fixed costs corresponding to the investment insubstations, feeder sections and DG sources as well as variablecosts associated with operation and reliability of the system areminimized. The decision variables of the MSDEP are:
� Expansion capacity of existing substations.� Location and capacity of new substations to be installed.� Upgrade of existing feeder sections.
H. Falaghi et al. / Electrical Power and Energy Systems 33 (2011) 1489–1497 1491
� Route and size of new feeder sections to be installed.� Location, capacity, and generated power of DG sources to be
installed.� Construction time of each facility over the planning stages.
In the proposed MSDEP framework, all above decision variablesare determined using mathematical optimization except the lastone (construction time of equipment) which is determined usingpseudo-dynamic approach [8]. In this approach, first a single stage(Static) optimization is formulated and then the optimum expan-sion profile is generated using a series of concatenated single stageemployment of optimization algorithm. In the following subsec-tions, the optimization formulation of the single stage planning isoutlined.
2.1. Optimization problem
Mathematical formulation of the objective function is given inthe following:
Min v ¼ ic þ oc þ rc ð1Þ
ic ¼ CRF
Xi2S
ICSSi þ
Xj2F
ICFDj þ
Xk2G
ICDG SDGk�cap þ SDG
RS
� � !ð2Þ
oc ¼Xt2T
Tt
Xk2G
OCDGk � PDG
k�t þXi2S
ECSSi�t � PSS
i�t
!ð3Þ
rc ¼Xt2T
Tt
8760
Xd2D
Xe2E
PLDd�t � fdðrd;eÞ � kd;e ð5Þ
The problem has the following constraints:– Capacities of the substations
0 6 SSSi�t 6 SSS
i�cap; 8 i 2 S; 8 t 2 T ð6Þ
– Capacities of the feeder sectionsSFD
j�t 6 SFDj�cap; 8 j 2 F; 8 t 2 T ð7Þ
– Capacities of the DG sourcesSDG
k�t 6 SDGk�cap; 8 k 2 G; 8 t 2 T ð8Þ
– Voltage magnitude limitVmin 6 Vd�t 6 Vmax; 8 d 2 D; 8 t 2 T ð9Þ
– Radial network restrictionThe value of the objective function (1) shows annualized cost of
the project in $/year. The first term in this objective function rep-resents the total annual investment cost of new facilities to be in-stalled and expansion cost of existing ones to be expanded. It mustbe noted that investment cost related to the existing equipment isset to zero. The maintenance cost of equipment during a useful life-time is considered as a part of the fixed costs and added to theinvestment costs. The DG investment cost is the sum of each DGunit connected at a node in addition to the cost of a reserve unitat the same node [20]. In (2), CRF is capital recovery factor whichused to convert present amount of total investment cost into anannuity over the life of the project and defined as below [25]
CRF ¼drð1þ drÞn
ð1þ drÞn � 1ð10Þ
where dr is discount rate and n is the life of the project in year.The second term in the objective function (1) represents the an-
nual operation cost of the system which depends on the amount ofpower to be purchased from the main market and/or generated byDG sources over the year. It should be noted that in order to have amore realistic estimate of the operation cost of the system in thepresence of DG sources, we need to evaluate optimal operation
strategy of DG sources considering varying demand levels. To limitthe computational burden, the step-wise yearly load durationcurve has been considered.
The third term in the objective function (1) represents the an-nual reliability cost which is defined as COC. The method of COCevaluation is described in the next subsection.
2.2. COC evaluation
Presence of DG sources in a distribution system can improvesystem reliability. When a circuit outage occurs, the DG can beused to support the alternate feeds through reserve feeders andhence improve the capability to supply the interrupted load points.Also, if the DG has sufficient capacity/capability, it can be operatedin island mode to supply proportion of the system load. In thesecases, there may be a short outage to the customers outside thefaulted zone due to switching actions and disconnecting/re-ener-gizing of DG sources. In this paper, impact of DG on system reliabil-ity is considered and simulated.
The total annual COC of the system is the sum of customer out-age costs for all load levels over the year. The basic procedure usedto evaluate the COC can be summarized in the following steps:
Step 1. Select a load level t from the given load levels in year.Step 2. Find the average failure rate, kd,e, and the restoration timerd,e for affected load point d in case of each failure event eaccording to the network configuration and load transfer capa-bility of alternate supplies (reserve feeders and/or DG sources).Step 3. Evaluate the expected outage cost of the load point dcaused by failure event e at load level t. (i.e., PLD
d�t � fdðrd;eÞ�kd;e, where, fd(rd,e) is the per unit (kW) cost of outage, basedon the outage time rd,e at load point d).Step 4. Repeat step 3 for all failure events in order to calculatethe total outage cost for load point d (i.e.,
Pe2EPLD
d�t � fdðrd;eÞ�kd;e).Step 5. Repeat steps 2–4 for all load points in the system. Thetotal COC of the system, at the load level t is obtained asP
d2D
Pe2EPLD
d�t � fdðrd;eÞ � kd;e.Step 6. Repeat steps 1–5 for different load levels in year andobtain the total COC as
Pt2T
Tt8760
Pd2D
Pe2EPLD
d�t � fdðrd;eÞ � kd;e.
3. Hybrid GA–OPF for optimization
The proposed planning objective and its related constraints for-mulate a mixed-integer nonlinear optimization problem. A heuris-tic optimization technique, based on genetic algorithm (GA) [26]and optimal power flow (OPF) has been applied to optimize theproposed planning model. In this approach discrete decision vari-ables include substations locations and sizes, feeder sections struc-tures and sizes, and DG locations and capacities are generated andsearched by the GA. For each combination of above decision vari-ables, the OPF is used to optimize the operating cost and determinethe amount of power to be generated by the DG sources and im-ported from transmission grid.
Flow-chart of the proposed optimization approach is shown inFig. 1. The main steps of the proposed hybrid GA–OPF approachfor optimizing the planning model are detailed as follows.
3.1. Chromosome codification
The first issue that should be defined is the type of codificationto be used, so that a chromosome represents candidate solution ofthe problem. In the proposed method each chromosome containsinformation about discrete decision variables and has three partsas shown in Fig. 2.
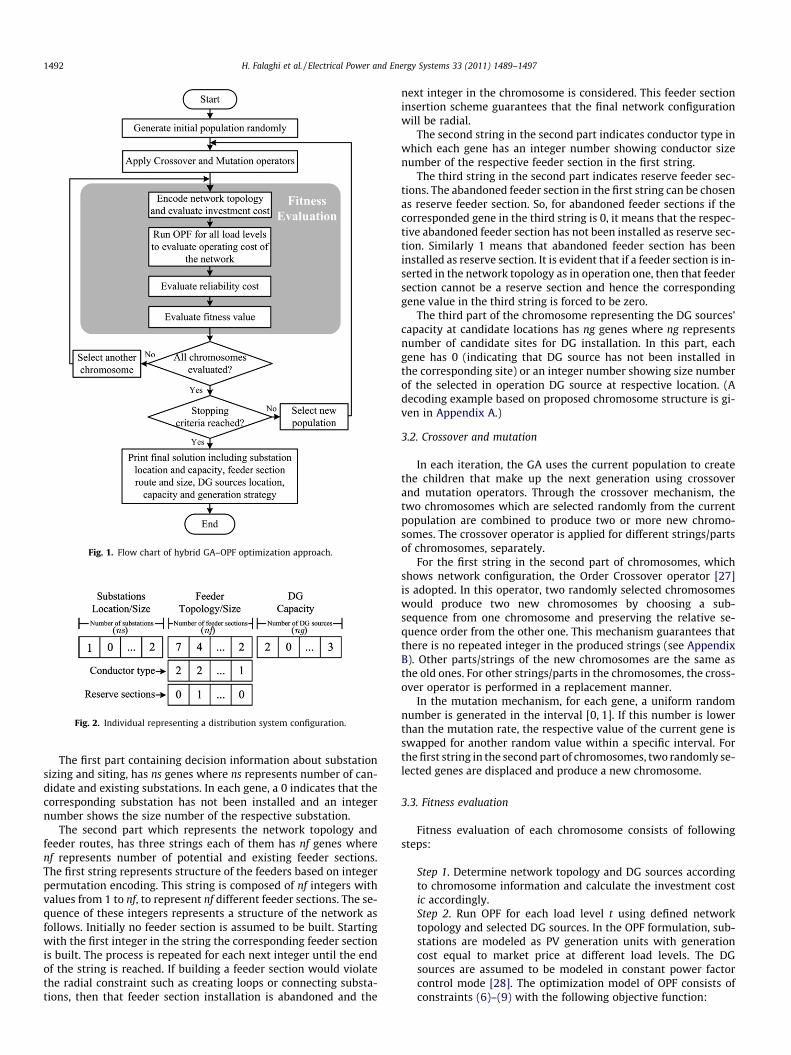
Fig. 1. Flow chart of hybrid GA–OPF optimization approach.
Fig. 2. Individual representing a distribution system configuration.
1492 H. Falaghi et al. / Electrical Power and Energy Systems 33 (2011) 1489–1497
The first part containing decision information about substationsizing and siting, has ns genes where ns represents number of can-didate and existing substations. In each gene, a 0 indicates that thecorresponding substation has not been installed and an integernumber shows the size number of the respective substation.
The second part which represents the network topology andfeeder routes, has three strings each of them has nf genes wherenf represents number of potential and existing feeder sections.The first string represents structure of the feeders based on integerpermutation encoding. This string is composed of nf integers withvalues from 1 to nf, to represent nf different feeder sections. The se-quence of these integers represents a structure of the network asfollows. Initially no feeder section is assumed to be built. Startingwith the first integer in the string the corresponding feeder sectionis built. The process is repeated for each next integer until the endof the string is reached. If building a feeder section would violatethe radial constraint such as creating loops or connecting substa-tions, then that feeder section installation is abandoned and the
next integer in the chromosome is considered. This feeder sectioninsertion scheme guarantees that the final network configurationwill be radial.
The second string in the second part indicates conductor type inwhich each gene has an integer number showing conductor sizenumber of the respective feeder section in the first string.
The third string in the second part indicates reserve feeder sec-tions. The abandoned feeder section in the first string can be chosenas reserve feeder section. So, for abandoned feeder sections if thecorresponded gene in the third string is 0, it means that the respec-tive abandoned feeder section has not been installed as reserve sec-tion. Similarly 1 means that abandoned feeder section has beeninstalled as reserve section. It is evident that if a feeder section is in-serted in the network topology as in operation one, then that feedersection cannot be a reserve section and hence the correspondinggene value in the third string is forced to be zero.
The third part of the chromosome representing the DG sources’capacity at candidate locations has ng genes where ng representsnumber of candidate sites for DG installation. In this part, eachgene has 0 (indicating that DG source has not been installed inthe corresponding site) or an integer number showing size numberof the selected in operation DG source at respective location. (Adecoding example based on proposed chromosome structure is gi-ven in Appendix A.)
3.2. Crossover and mutation
In each iteration, the GA uses the current population to createthe children that make up the next generation using crossoverand mutation operators. Through the crossover mechanism, thetwo chromosomes which are selected randomly from the currentpopulation are combined to produce two or more new chromo-somes. The crossover operator is applied for different strings/partsof chromosomes, separately.
For the first string in the second part of chromosomes, whichshows network configuration, the Order Crossover operator [27]is adopted. In this operator, two randomly selected chromosomeswould produce two new chromosomes by choosing a sub-sequence from one chromosome and preserving the relative se-quence order from the other one. This mechanism guarantees thatthere is no repeated integer in the produced strings (see AppendixB). Other parts/strings of the new chromosomes are the same asthe old ones. For other strings/parts in the chromosomes, the cross-over operator is performed in a replacement manner.
In the mutation mechanism, for each gene, a uniform randomnumber is generated in the interval [0, 1]. If this number is lowerthan the mutation rate, the respective value of the current gene isswapped for another random value within a specific interval. Forthe first string in the second part of chromosomes, two randomly se-lected genes are displaced and produce a new chromosome.
3.3. Fitness evaluation
Fitness evaluation of each chromosome consists of followingsteps:
Step 1. Determine network topology and DG sources accordingto chromosome information and calculate the investment costic accordingly.Step 2. Run OPF for each load level t using defined networktopology and selected DG sources. In the OPF formulation, sub-stations are modeled as PV generation units with generationcost equal to market price at different load levels. The DGsources are assumed to be modeled in constant power factorcontrol mode [28]. The optimization model of OPF consists ofconstraints (6)–(9) with the following objective function:
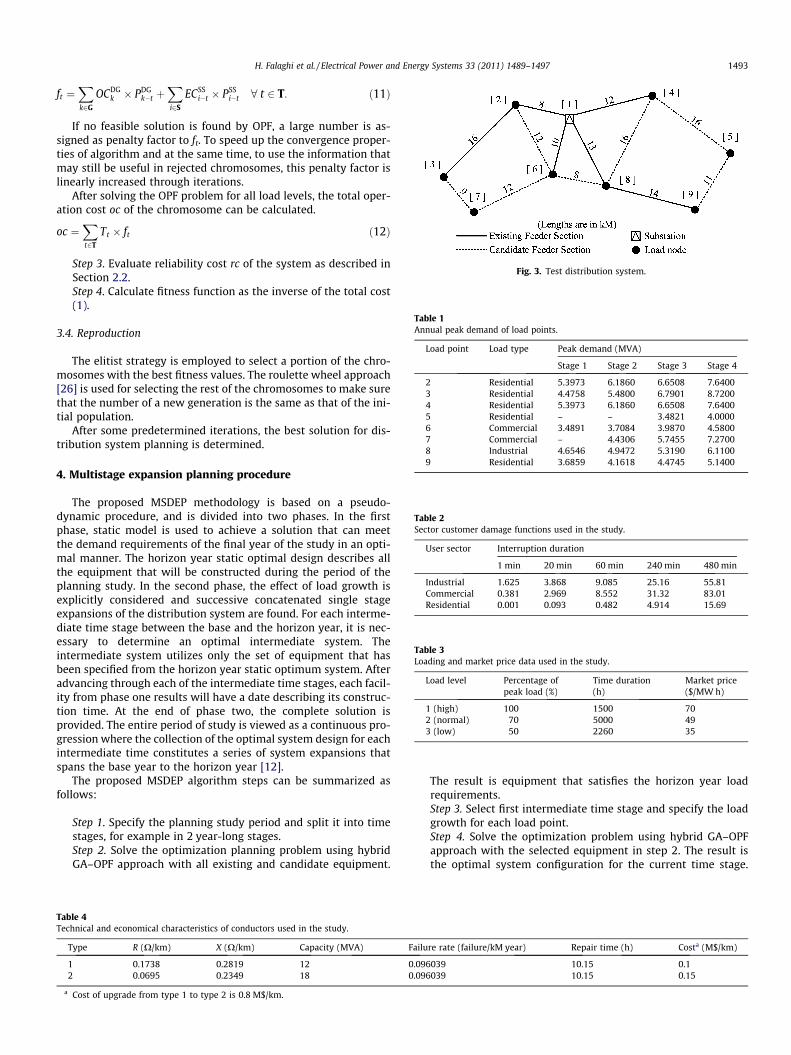
Fig. 3. Test distribution system.
Table 1Annual peak demand of load points.
Load point Load type Peak demand (MVA)
Stage 1 Stage 2 Stage 3 Stage 4
2 Residential 5.3973 6.1860 6.6508 7.64003 Residential 4.4758 5.4800 6.7901 8.72004 Residential 5.3973 6.1860 6.6508 7.64005 Residential – – 3.4821 4.00006 Commercial 3.4891 3.7084 3.9870 4.58007 Commercial – 4.4306 5.7455 7.27008 Industrial 4.6546 4.9472 5.3190 6.11009 Residential 3.6859 4.1618 4.4745 5.1400
Table 2Sector customer damage functions used in the study.
User sector Interruption duration
1 min 20 min 60 min 240 min 480 min
Industrial 1.625 3.868 9.085 25.16 55.81Commercial 0.381 2.969 8.552 31.32 83.01Residential 0.001 0.093 0.482 4.914 15.69
Table 3Loading and market price data used in the study.
Load level Percentage ofpeak load (%)
Time duration(h)
Market price($/MW h)
1 (high) 100 1500 702 (normal) 70 5000 493 (low) 50 2260 35
H. Falaghi et al. / Electrical Power and Energy Systems 33 (2011) 1489–1497 1493
ft ¼Xk2G
OCDGk � PDG
k�t þXi2S
ECSSi�t � PSS
i�t 8 t 2 T: ð11Þ
If no feasible solution is found by OPF, a large number is as-signed as penalty factor to ft. To speed up the convergence proper-ties of algorithm and at the same time, to use the information thatmay still be useful in rejected chromosomes, this penalty factor islinearly increased through iterations.
After solving the OPF problem for all load levels, the total oper-ation cost oc of the chromosome can be calculated.
oc ¼Xt2T
Tt � ft ð12Þ
Step 3. Evaluate reliability cost rc of the system as described inSection 2.2.Step 4. Calculate fitness function as the inverse of the total cost(1).
3.4. Reproduction
The elitist strategy is employed to select a portion of the chro-mosomes with the best fitness values. The roulette wheel approach[26] is used for selecting the rest of the chromosomes to make surethat the number of a new generation is the same as that of the ini-tial population.
After some predetermined iterations, the best solution for dis-tribution system planning is determined.
4. Multistage expansion planning procedure
The proposed MSDEP methodology is based on a pseudo-dynamic procedure, and is divided into two phases. In the firstphase, static model is used to achieve a solution that can meetthe demand requirements of the final year of the study in an opti-mal manner. The horizon year static optimal design describes allthe equipment that will be constructed during the period of theplanning study. In the second phase, the effect of load growth isexplicitly considered and successive concatenated single stageexpansions of the distribution system are found. For each interme-diate time stage between the base and the horizon year, it is nec-essary to determine an optimal intermediate system. Theintermediate system utilizes only the set of equipment that hasbeen specified from the horizon year static optimum system. Afteradvancing through each of the intermediate time stages, each facil-ity from phase one results will have a date describing its construc-tion time. At the end of phase two, the complete solution isprovided. The entire period of study is viewed as a continuous pro-gression where the collection of the optimal system design for eachintermediate time constitutes a series of system expansions thatspans the base year to the horizon year [12].
The proposed MSDEP algorithm steps can be summarized asfollows:
Step 1. Specify the planning study period and split it into timestages, for example in 2 year-long stages.Step 2. Solve the optimization planning problem using hybridGA–OPF approach with all existing and candidate equipment.
Table 4Technical and economical characteristics of conductors used in the study.
Type R (X/km) X (X/km) Capacity (MVA) Failu
1 0.1738 0.2819 12 0.0962 0.0695 0.2349 18 0.096
a Cost of upgrade from type 1 to type 2 is 0.8 M$/km.
The result is equipment that satisfies the horizon year loadrequirements.Step 3. Select first intermediate time stage and specify the loadgrowth for each load point.Step 4. Solve the optimization problem using hybrid GA–OPFapproach with the selected equipment in step 2. The result isthe optimal system configuration for the current time stage.
re rate (failure/kM year) Repair time (h) Costa (M$/km)
039 10.15 0.1039 10.15 0.15
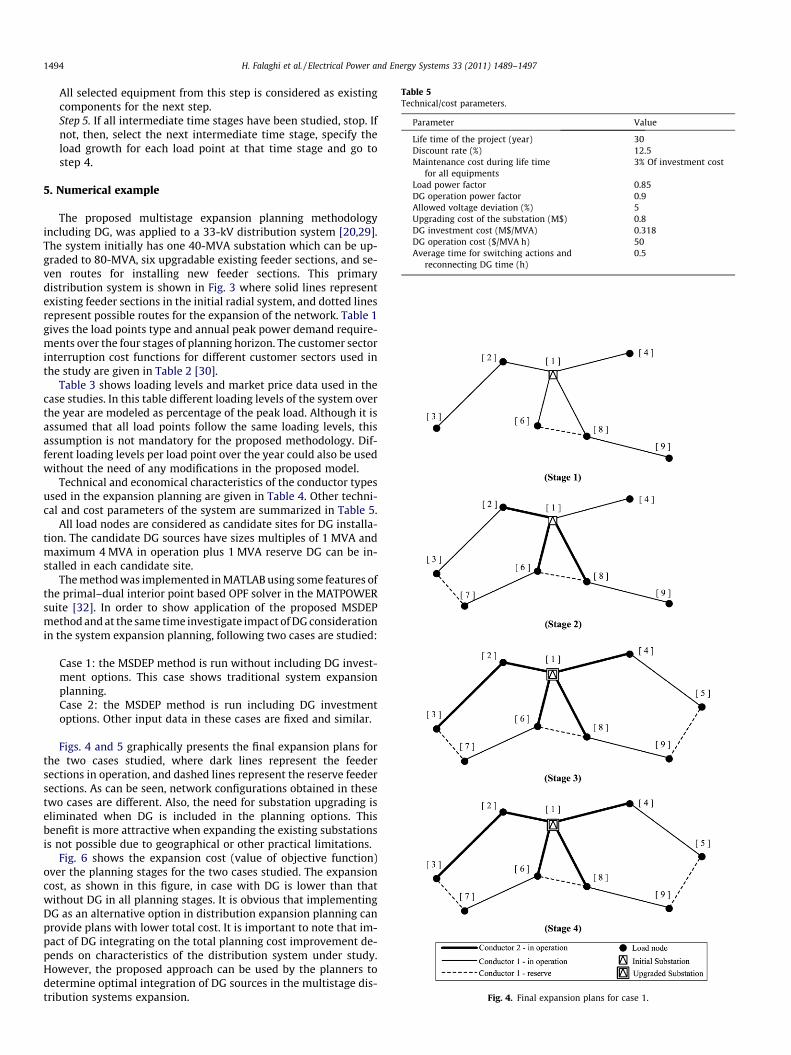
Table 5Technical/cost parameters.
Parameter Value
Life time of the project (year) 30Discount rate (%) 12.5Maintenance cost during life time 3% Of investment cost
1494 H. Falaghi et al. / Electrical Power and Energy Systems 33 (2011) 1489–1497
All selected equipment from this step is considered as existingcomponents for the next step.Step 5. If all intermediate time stages have been studied, stop. Ifnot, then, select the next intermediate time stage, specify theload growth for each load point at that time stage and go tostep 4.
for all equipmentsLoad power factor 0.85DG operation power factor 0.9Allowed voltage deviation (%) 5Upgrading cost of the substation (M$) 0.8DG investment cost (M$/MVA) 0.318DG operation cost ($/MVA h) 50Average time for switching actions and
reconnecting DG time (h)0.5
Fig. 4. Final expansion plans for case 1.
5. Numerical example
The proposed multistage expansion planning methodologyincluding DG, was applied to a 33-kV distribution system [20,29].The system initially has one 40-MVA substation which can be up-graded to 80-MVA, six upgradable existing feeder sections, and se-ven routes for installing new feeder sections. This primarydistribution system is shown in Fig. 3 where solid lines representexisting feeder sections in the initial radial system, and dotted linesrepresent possible routes for the expansion of the network. Table 1gives the load points type and annual peak power demand require-ments over the four stages of planning horizon. The customer sectorinterruption cost functions for different customer sectors used inthe study are given in Table 2 [30].
Table 3 shows loading levels and market price data used in thecase studies. In this table different loading levels of the system overthe year are modeled as percentage of the peak load. Although it isassumed that all load points follow the same loading levels, thisassumption is not mandatory for the proposed methodology. Dif-ferent loading levels per load point over the year could also be usedwithout the need of any modifications in the proposed model.
Technical and economical characteristics of the conductor typesused in the expansion planning are given in Table 4. Other techni-cal and cost parameters of the system are summarized in Table 5.
All load nodes are considered as candidate sites for DG installa-tion. The candidate DG sources have sizes multiples of 1 MVA andmaximum 4 MVA in operation plus 1 MVA reserve DG can be in-stalled in each candidate site.
The method was implemented in MATLAB using some features ofthe primal–dual interior point based OPF solver in the MATPOWERsuite [32]. In order to show application of the proposed MSDEPmethod and at the same time investigate impact of DG considerationin the system expansion planning, following two cases are studied:
Case 1: the MSDEP method is run without including DG invest-ment options. This case shows traditional system expansionplanning.Case 2: the MSDEP method is run including DG investmentoptions. Other input data in these cases are fixed and similar.
Figs. 4 and 5 graphically presents the final expansion plans forthe two cases studied, where dark lines represent the feedersections in operation, and dashed lines represent the reserve feedersections. As can be seen, network configurations obtained in thesetwo cases are different. Also, the need for substation upgrading iseliminated when DG is included in the planning options. Thisbenefit is more attractive when expanding the existing substationsis not possible due to geographical or other practical limitations.
Fig. 6 shows the expansion cost (value of objective function)over the planning stages for the two cases studied. The expansioncost, as shown in this figure, in case with DG is lower than thatwithout DG in all planning stages. It is obvious that implementingDG as an alternative option in distribution expansion planning canprovide plans with lower total cost. It is important to note that im-pact of DG integrating on the total planning cost improvement de-pends on characteristics of the distribution system under study.However, the proposed approach can be used by the planners todetermine optimal integration of DG sources in the multistage dis-tribution systems expansion.
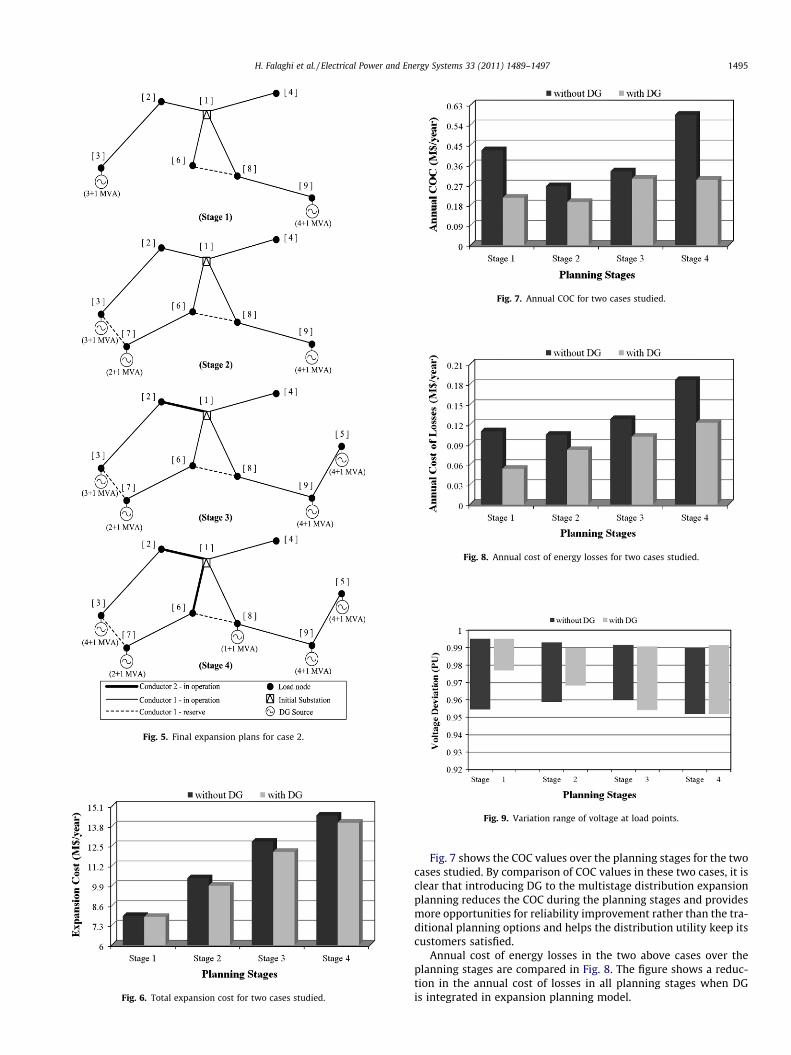
Fig. 5. Final expansion plans for case 2.
Fig. 6. Total expansion cost for two cases studied.
Fig. 7. Annual COC for two cases studied.
Fig. 8. Annual cost of energy losses for two cases studied.
Fig. 9. Variation range of voltage at load points.
H. Falaghi et al. / Electrical Power and Energy Systems 33 (2011) 1489–1497 1495
Fig. 7 shows the COC values over the planning stages for the twocases studied. By comparison of COC values in these two cases, it isclear that introducing DG to the multistage distribution expansionplanning reduces the COC during the planning stages and providesmore opportunities for reliability improvement rather than the tra-ditional planning options and helps the distribution utility keep itscustomers satisfied.
Annual cost of energy losses in the two above cases over theplanning stages are compared in Fig. 8. The figure shows a reduc-tion in the annual cost of losses in all planning stages when DGis integrated in expansion planning model.
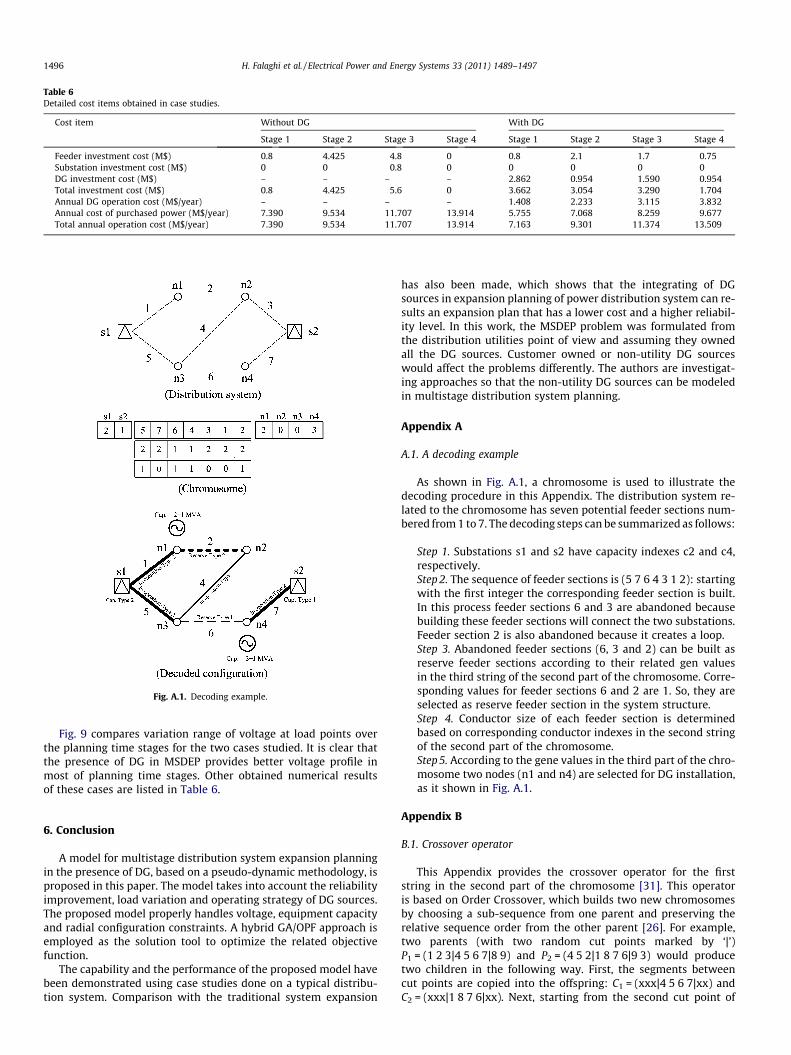
Table 6Detailed cost items obtained in case studies.
Cost item Without DG With DG
Stage 1 Stage 2 Stage 3 Stage 4 Stage 1 Stage 2 Stage 3 Stage 4
Feeder investment cost (M$) 0.8 4.425 4.8 0 0.8 2.1 1.7 0.75Substation investment cost (M$) 0 0 0.8 0 0 0 0 0DG investment cost (M$) – – – – 2.862 0.954 1.590 0.954Total investment cost (M$) 0.8 4.425 5.6 0 3.662 3.054 3.290 1.704Annual DG operation cost (M$/year) – – – – 1.408 2.233 3.115 3.832Annual cost of purchased power (M$/year) 7.390 9.534 11.707 13.914 5.755 7.068 8.259 9.677Total annual operation cost (M$/year) 7.390 9.534 11.707 13.914 7.163 9.301 11.374 13.509
Fig. A.1. Decoding example.
1496 H. Falaghi et al. / Electrical Power and Energy Systems 33 (2011) 1489–1497
Fig. 9 compares variation range of voltage at load points overthe planning time stages for the two cases studied. It is clear thatthe presence of DG in MSDEP provides better voltage profile inmost of planning time stages. Other obtained numerical resultsof these cases are listed in Table 6.
6. Conclusion
A model for multistage distribution system expansion planningin the presence of DG, based on a pseudo-dynamic methodology, isproposed in this paper. The model takes into account the reliabilityimprovement, load variation and operating strategy of DG sources.The proposed model properly handles voltage, equipment capacityand radial configuration constraints. A hybrid GA/OPF approach isemployed as the solution tool to optimize the related objectivefunction.
The capability and the performance of the proposed model havebeen demonstrated using case studies done on a typical distribu-tion system. Comparison with the traditional system expansion
has also been made, which shows that the integrating of DGsources in expansion planning of power distribution system can re-sults an expansion plan that has a lower cost and a higher reliabil-ity level. In this work, the MSDEP problem was formulated fromthe distribution utilities point of view and assuming they ownedall the DG sources. Customer owned or non-utility DG sourceswould affect the problems differently. The authors are investigat-ing approaches so that the non-utility DG sources can be modeledin multistage distribution system planning.
Appendix A
A.1. A decoding example
As shown in Fig. A.1, a chromosome is used to illustrate thedecoding procedure in this Appendix. The distribution system re-lated to the chromosome has seven potential feeder sections num-bered from 1 to 7. The decoding steps can be summarized as follows:
Step 1. Substations s1 and s2 have capacity indexes c2 and c4,respectively.Step 2. The sequence of feeder sections is (5 7 6 4 3 1 2): startingwith the first integer the corresponding feeder section is built.In this process feeder sections 6 and 3 are abandoned becausebuilding these feeder sections will connect the two substations.Feeder section 2 is also abandoned because it creates a loop.Step 3. Abandoned feeder sections (6, 3 and 2) can be built asreserve feeder sections according to their related gen valuesin the third string of the second part of the chromosome. Corre-sponding values for feeder sections 6 and 2 are 1. So, they areselected as reserve feeder section in the system structure.Step 4. Conductor size of each feeder section is determinedbased on corresponding conductor indexes in the second stringof the second part of the chromosome.Step 5. According to the gene values in the third part of the chro-mosome two nodes (n1 and n4) are selected for DG installation,as it shown in Fig. A.1.
Appendix B
B.1. Crossover operator
This Appendix provides the crossover operator for the firststring in the second part of the chromosome [31]. This operatoris based on Order Crossover, which builds two new chromosomesby choosing a sub-sequence from one parent and preserving therelative sequence order from the other parent [26]. For example,two parents (with two random cut points marked by ‘|’)P1 = (1 2 3|4 5 6 7|8 9) and P2 = (4 5 2|1 8 7 6|9 3) would producetwo children in the following way. First, the segments betweencut points are copied into the offspring: C1 = (xxx|4 5 6 7|xx) andC2 = (xxx|1 8 7 6|xx). Next, starting from the second cut point of
H. Falaghi et al. / Electrical Power and Energy Systems 33 (2011) 1489–1497 1497
one parent, the genes from the other parent are copied in the sameorder, omitting symbols already present. On reaching the end ofthe string, this is continued from the first place in the string. Thesequence of the feeder sections in the second parent from thesecond cut point is: 9–3–4–5–2–1–8–7–6. After removal of feedersections 4–7, which are already in the first offspring, we get 9–3–2–1–8. This sequence is placed in the first offspring (starting fromthe second cut point): O1 = (2 1 8|4 5 6 7|9 3). Similarly we obtainanother offspring: O2 = (3 4 5|1 8 7 6|9 2).
References
[1] Ponnavaikko M, Prakasa Rao KS. An approach to optimal distribution systemplanning through conductor gradation. IEEE Trans Power Appl Syst1982;101(6):1735–42.
[2] Fawzi TH, Ali KF, El-Sobki SM. A new planning model for distribution systems.IEEE Trans Power Appl Syst 1983;102(9):3010–7.
[3] Aoki K, Nara K, Satoh T, Kitagawa M, Yamanaka K. New approximateoptimization method for distribution system planning. IEEE Trans PowerSyst 1990;5(1):113–26.
[4] Boulaxis NG, Papadopoulos MP. Optimal feeder routing in distribution systemplanning using dynamic programming technique and GIS facilities. IEEE TransPower Deliv 2002;17(1):242–7.
[5] Zhao H, Wang Z, Yu DC, Chen X. New formulations and hybrid algorithms fordistribution system planning. Electr Power Compon Syst 2007;35(4):445–60.
[6] Sun DI, Farris DR, Cote PJ, Shoults RR, Chen MS. Optimal distribution substationand primary feeder planning via the fixed charge network formulation. IEEETrans Power Appl Syst 1982;101(3):602–9.
[7] Mikic OM. Mathematical dynamic model for long-term distribution systemplanning. IEEE Trans Power Syst 1986;1(1):34–40.
[8] Ramirez IJ, Gonen T. Pseudo-dynamic planning for expansion of powerdistribution systems. IEEE Trans Power Syst 1991;6(1):245–54.
[9] Miranda V, Ranito JV, Proenca LM. Genetic algorithms in optimal multistagedistribution network planning. IEEE Trans Power Syst 1994;9(4):1927–33.
[10] Vaziri M, Tomsovic K, Bose A. A directed graph formulation of the multistagedistribution expansion problem. IEEE Trans Power Deliv 2004;19(3):1335–41.
[11] Kuwabara H, Nara K. Multi-year and multi-state distribution systemsexpansion planning by multi-stage branch exchange. IEEE Trans Power Deliv1997;12(1):457–63.
[12] Temraz HK, Salama MMA. A planning model for siting, sizing and timing ofdistribution substations and defining the associated service area. Electr PowerSyst Res 2002;62(2):17–29.
[13] Barin A, Pozzatti LF, Canha LN, Machado RQ, Abaide AR, Arend G. Multi-objective analysis of impacts of distributed generation placement on theoperational characteristics of networks for distribution system planning. Int JElectr Power Energy Syst 2010;32(10):1157–64.
[14] Khalesi N, Rezaei N, Haghifam MR. DG allocation with application of dynamicprogramming for loss reduction and reliability improvement. Int J Electr PowerEnergy Syst 2011;33(2):288–95.
[15] Khan H, Choudhry MA. Implementation of distributed generation (IDG)algorithm for performance enhancement of distribution feeder underextreme load growth. Int J Electr Power Energy Syst 2010;32(9):985–97.
[16] Dugan RC, McDermott TE, Ball GJ. Distribution planning for distributedgeneration. In: Proc rural electric power conference; 2000. p. C4/1–C4/7.
[17] Dugan RC, McDermott TE, Ball GJ. Planning for distributed generation. IEEE IndAppl Mag 2001;7(2):80–8.
[18] Brown RE, Pan J, Feng X, Koutlev K. Siting distributed generation to defer T&Dexpansion. In: Proc IEEE/PES transmission and distribution conference andexposition, vol. 2; 2001. p. 622–27.
[19] Ouyang W, Cheng H, Zhang X, Yao L. Distribution network planning methodconsidering distributed generation for peak cutting. Energy Convers Manage2010;51(12):2394–401.
[20] El-Khattam W, Hegazy YG, Salama MMA. An integrated distributed generationoptimization model for distribution system planning. IEEE Trans Power Syst2005;20(2):1158–65.
[21] Haffner S, Pereira LFA, Pereira LA, Barreto LS. Multistage model for distributionexpansion planning with distributed generation—Part II: Numerical results.IEEE Trans Power Deliv 2008;23(2):915–23.
[22] Ault GW, McDonald JR. Planning for distributed generation within distributionnetworks in restructured electricity markets. IEEE Power Eng Rev2000;20(2):52–4.
[23] Espie P, Ault GW, Burt GM, McDonald JR. Multiple criteria decision makingtechniques applied to electricity distribution system planning. IEE Proc GenerTransm Distribut 2003;150(5):527–35.
[24] The distribution working group of the IEEE power system planning andimplementation committee, planning for effective distribution. IEEE PowerEnergy Mag 2003; 1(5): 54–62.
[25] Stoll HG. Least-cost electric utility planning. New York: Wiley; 1989.[26] Gen M, Cheng R. Genetic algorithms and engineering design. New York: Wiley;
1997.[27] Michale Wicz Z. Genetic algorithm + data structure = evolution program. New
York: Springer-Verlag; 1996.[28] Harrison GP, Piccolo A, Siano P, Wallace AR. Hybrid GA and OPF evaluation of
network capacity for distributed generation connections. Electr Power Syst Res2008;78(3):392–8.
[29] Quintana VH, Temraz HK, Hipel KW. Two-stage power system distributionplanning algorithm. IEE Proc 1993;140(1):17–29.
[30] Billinton R, Wang P. Distribution system reliability cost/worth analysis usinganalytical and sequential simulation techniques. IEEE Trans Power Syst1998;13(4):1245–50.
[31] Irving MR, Luan WP, Daniel JS. Supply restoration in distribution networksusing a genetic algorithm. Int J Electr Power Energy Syst 2002;24(6):447–57.
[32] Zimmerman RD, Murillo-Sánchez CE, Thomas RJ. MATPOWER steady-stateoperations, planning and analysis tools for power systems research andeducation. IEEE Trans Power Syst 2011;26(1):12–9.