dfs use among digital kenyans · meaningful financial inclusion for people across sub-saharan...
TRANSCRIPT
DFS use among digital KenyansInsights built on privacy
Caribou Data
Recommended citation
Partnership for Finance in a Digital Africa and Caribou Data, “DFS use among digital Kenyans,” Caribou Digital Publishing, 2019.
https://www.financedigitalafrica.org/research/2019/03/dfs-use-among-digital-kenyans/
For questions or comments, please contact us at [email protected].
2
Acknowledgements
The authors of this report are Bryan Pon, Jonathan Donner and Will Croft, based on research conducted by Caribou Data in Kenya.
This research was supported by the Mastercard Foundation, and we are grateful to Mark Wensley, Olga Morawczynski, and Adaora Ogbue for their support and input.
Notes
The views presented in this report are those of the authors and do not necessarily represent the views of the Mastercard Foundation or Caribou Digital.
About the partnership
The Mastercard Foundation Partnership for Finance in a Digital Africa (FiDA) aggregates and synthesizes knowledge, conducts research to address key gaps, and identifies implications for the diverse actors working in the digital finance space. In collaboration with our partners, FiDA strives to inform decisions with facts and accelerate meaningful financial inclusion for people across sub-Saharan Africa. Additional information and resources can be found at financedigitalafrica.org.
About Caribou Data
Caribou Data’s unique privacy- preserving approach provides deep insights into the digital lives of consumers in emerging markets.
Using only anonymous data, we develop granular insights on app, network, content, and transactional behaviors, all structured and protected within our GDPR-compliant differential privacy layer.
The appendix contains further details on these methods.
About
Introduction
3
i
In this section
We describe Caribou Data’s research methodology, and introduce “digital Kenyans”— the target population from which we draw our sample of 1,000 individuals over three months.
Caribou Data
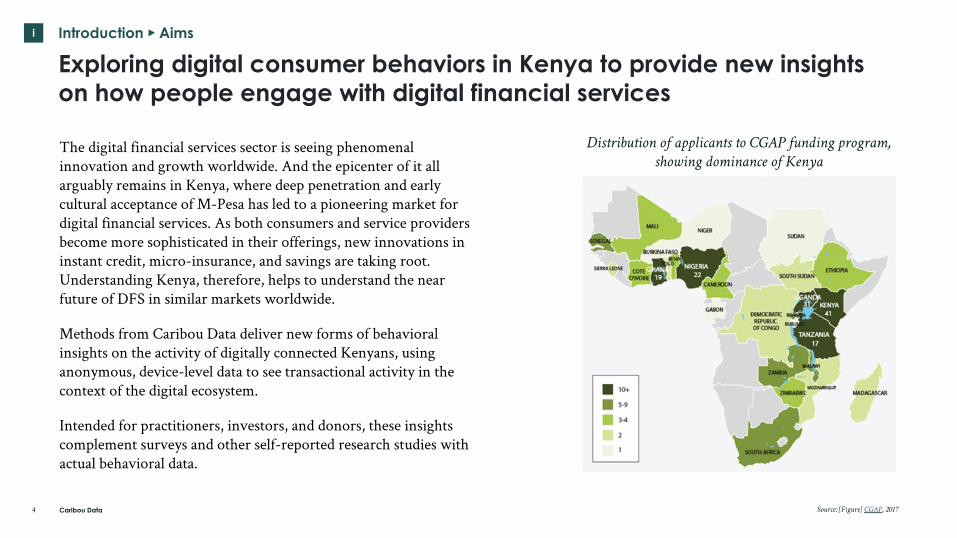
The digital financial services sector is seeing phenomenal innovation and growth worldwide. And the epicenter of it all arguably remains in Kenya, where deep penetration and early cultural acceptance of M-Pesa has led to a pioneering market for digital financial services. As both consumers and service providers become more sophisticated in their offerings, new innovations in instant credit, micro-insurance, and savings are taking root. Understanding Kenya, therefore, helps to understand the near future of DFS in similar markets worldwide.
Methods from Caribou Data deliver new forms of behavioral insights on the activity of digitally connected Kenyans, using anonymous, device-level data to see transactional activity in the context of the digital ecosystem.
Intended for practitioners, investors, and donors, these insights complement surveys and other self-reported research studies with actual behavioral data.
i Introduction ▸ Aims
Exploring digital consumer behaviors in Kenya to provide new insights on how people engage with digital financial services
4 Source: [Figure] CGAP, 2017
Distribution of applicants to CGAP funding program,showing dominance of Kenya
Caribou Data
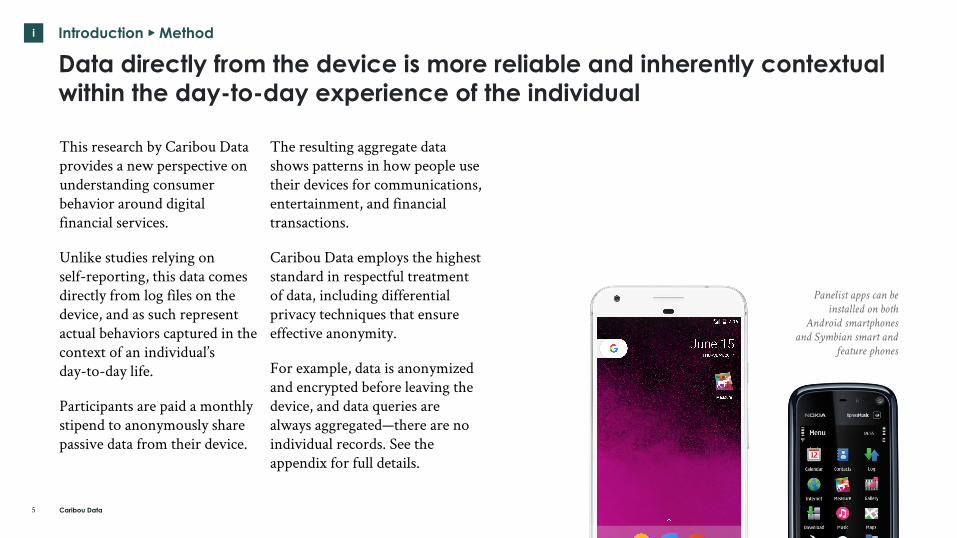
This research by Caribou Data provides a new perspective on understanding consumer behavior around digital financial services.
Unlike studies relying on self-reporting, this data comes directly from log files on the device, and as such represent actual behaviors captured in the context of an individual’s day-to-day life.
Participants are paid a monthly stipend to anonymously share passive data from their device.
Introduction ▸ Method
Data directly from the device is more reliable and inherently contextual within the day-to-day experience of the individual
5
The resulting aggregate data shows patterns in how people use their devices for communications, entertainment, and financial transactions.
Caribou Data employs the highest standard in respectful treatment of data, including differential privacy techniques that ensure effective anonymity.
For example, data is anonymized and encrypted before leaving the device, and data queries are always aggregated—there are no individual records. See the appendix for full details.
Panelist apps can be installed on both
Android smartphones and Symbian smart and
feature phones
i
Caribou Data
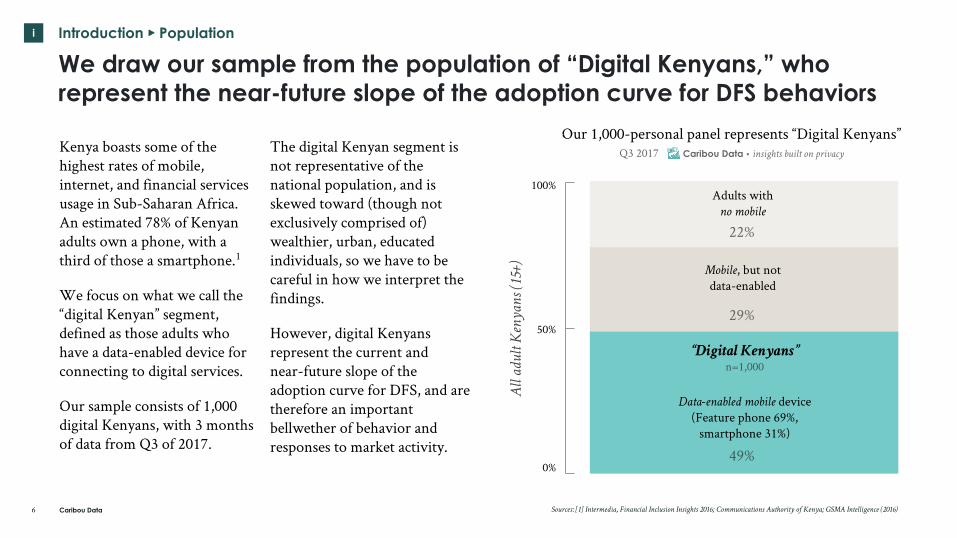
Kenya boasts some of the highest rates of mobile, internet, and financial services usage in Sub-Saharan Africa. An estimated 78% of Kenyan adults own a phone, with a third of those a smartphone.1
We focus on what we call the “digital Kenyan” segment, defined as those adults who have a data-enabled device for connecting to digital services.
Our sample consists of 1,000 digital Kenyans, with 3 months of data from Q3 of 2017.
Introduction ▸ Population
We draw our sample from the population of “Digital Kenyans,” who represent the near-future slope of the adoption curve for DFS behaviors
6
The digital Kenyan segment is not representative of the national population, and is skewed toward (though not exclusively comprised of) wealthier, urban, educated individuals, so we have to be careful in how we interpret the findings.
However, digital Kenyans represent the current and near-future slope of the adoption curve for DFS, and are therefore an important bellwether of behavior and responses to market activity.
All
adul
t Ken
yans
(15+
)
Adults withno mobile
Mobile, but not data-enabled
Sources: [1] Intermedia, Financial Inclusion Insights 2016; Communications Authority of Kenya; GSMA Intelligence (2016)
i
22%
29%
49%
100%
50%
0%
“Digital Kenyans” n=1,000
Data-enabled mobile device (Feature phone 69%,
smartphone 31%)
Our 1,000-personal panel represents “Digital Kenyans”Q3 2017 Caribou Data • insights built on privacy
Caribou Data
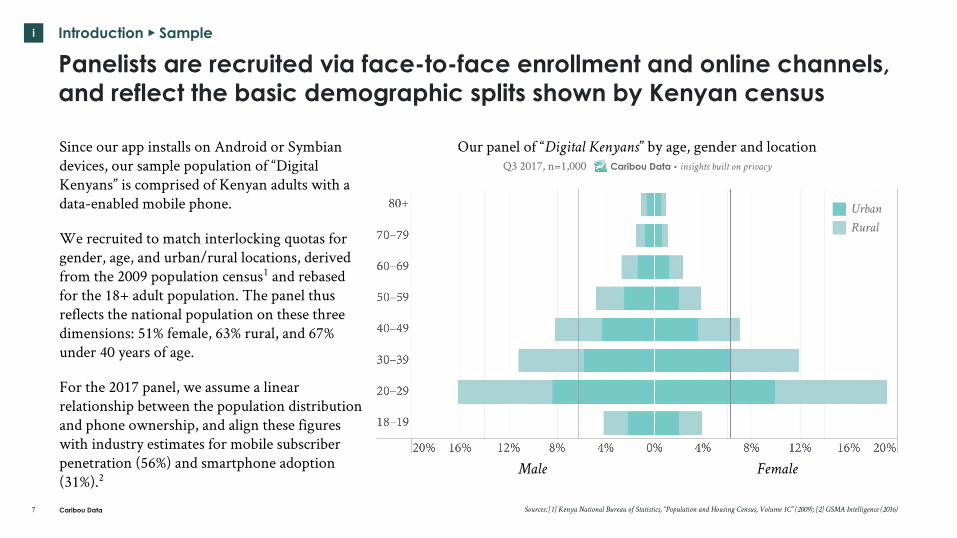
Since our app installs on Android or Symbian devices, our sample population of “Digital Kenyans” is comprised of Kenyan adults with a data-enabled mobile phone.
We recruited to match interlocking quotas for gender, age, and urban/rural locations, derived from the 2009 population census1 and rebased for the 18+ adult population. The panel thus reflects the national population on these three dimensions: 51% female, 63% rural, and 67% under 40 years of age.
For the 2017 panel, we assume a linear relationship between the population distribution and phone ownership, and align these figures with industry estimates for mobile subscriber penetration (56%) and smartphone adoption (31%).2
Introduction ▸ Sample
Panelists are recruited via face-to-face enrollment and online channels, and reflect the basic demographic splits shown by Kenyan census
7 Sources: [1] Kenya National Bureau of Statistics, “Population and Housing Census, Volume 1C” (2009); [2] GSMA Intelligence (2016)
i
Our panel of “Digital Kenyans” by age, gender and locationQ3 2017, n=1,000 Caribou Data • insights built on privacy
Male Female
UrbanRural
Kenyan digital lives
8
In this section
Context is everything. An understanding of how individuals use digital financial services requires an understanding of the broader digital environment in which people live.
ii
Caribou Data
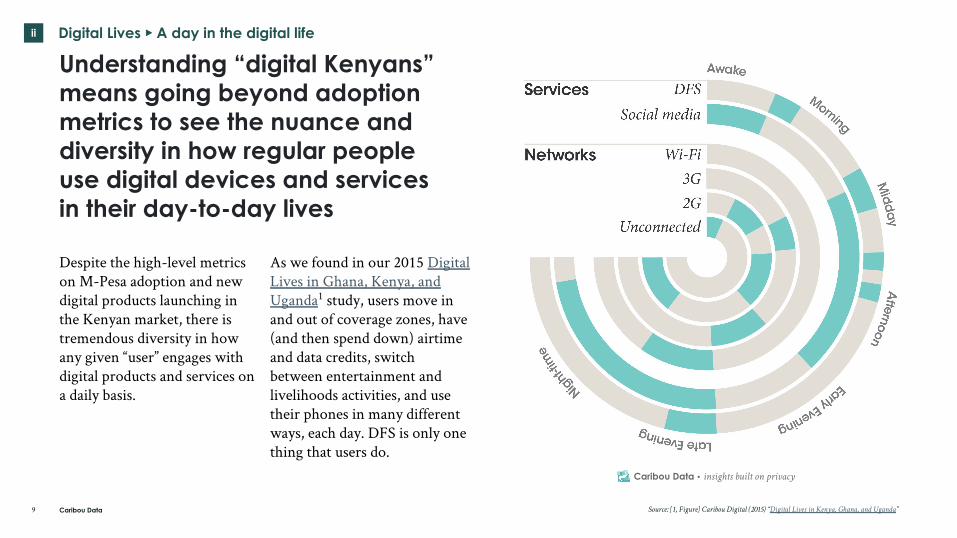
Despite the high-level metrics on M-Pesa adoption and new digital products launching in the Kenyan market, there is tremendous diversity in how any given “user” engages with digital products and services on a daily basis.
Digital Lives ▸ A day in the digital life
Understanding “digital Kenyans” means going beyond adoption metrics to see the nuance and diversity in how regular people use digital devices and services in their day-to-day lives
9
ii
Source: [1, Figure] Caribou Digital (2015) “Digital Lives in Kenya, Ghana, and Uganda”
As we found in our 2015 Digital Lives in Ghana, Kenya, and Uganda1 study, users move in and out of coverage zones, have (and then spend down) airtime and data credits, switch between entertainment and livelihoods activities, and use their phones in many different ways, each day. DFS is only one thing that users do.
Caribou Data • insights built on privacy
Caribou Data
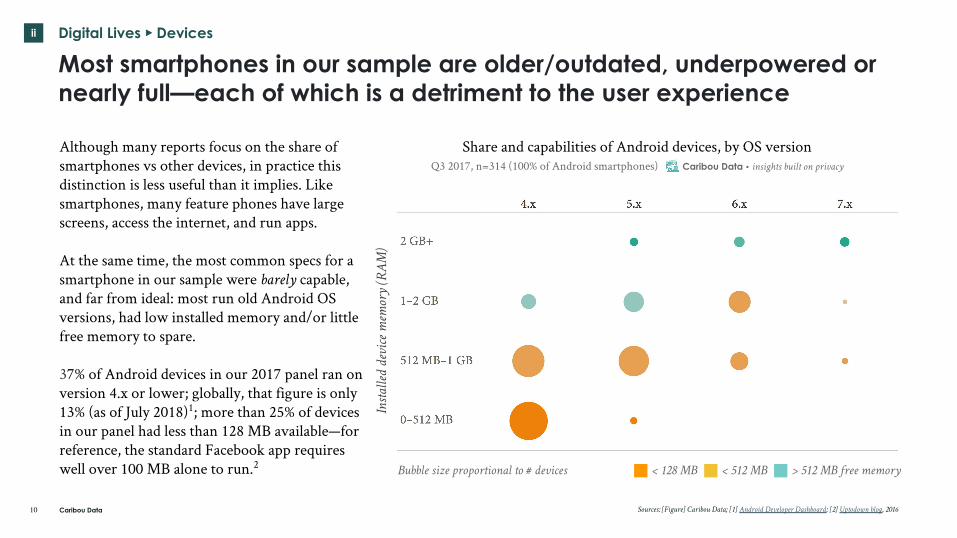
Although many reports focus on the share of smartphones vs other devices, in practice this distinction is less useful than it implies. Like smartphones, many feature phones have large screens, access the internet, and run apps.
At the same time, the most common specs for a smartphone in our sample were barely capable, and far from ideal: most run old Android OS versions, had low installed memory and/or little free memory to spare.
37% of Android devices in our 2017 panel ran on version 4.x or lower; globally, that figure is only 13% (as of July 2018)1; more than 25% of devices in our panel had less than 128 MB available—for reference, the standard Facebook app requires well over 100 MB alone to run.2
Digital Lives ▸ Devices
Most smartphones in our sample are older/outdated, underpowered or nearly full—each of which is a detriment to the user experience
10 Sources: [Figure] Caribou Data; [1] Android Developer Dashboard; [2] Uptodown blog, 2016
ii
Share and capabilities of Android devices, by OS versionQ3 2017, n=314 (100% of Android smartphones) Caribou Data • insights built on privacy
Insta
lled
devi
ce m
emor
y (R
AM
)
< 128 MBBubble size proportional to # devices < 512 MB > 512 MB free memory
Caribou Data
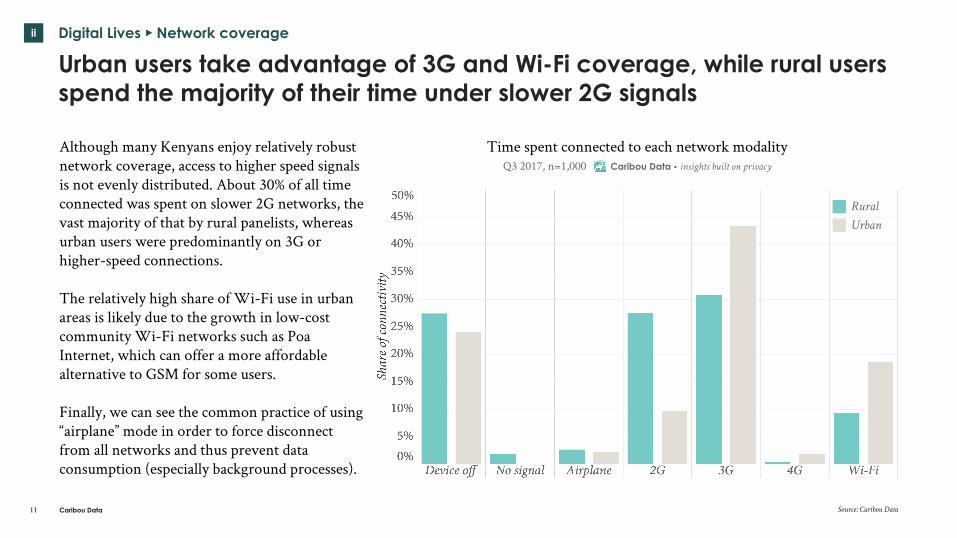
Although many Kenyans enjoy relatively robust network coverage, access to higher speed signals is not evenly distributed. About 30% of all time connected was spent on slower 2G networks, the vast majority of that by rural panelists, whereas urban users were predominantly on 3G or higher-speed connections.
The relatively high share of Wi-Fi use in urban areas is likely due to the growth in low-cost community Wi-Fi networks such as Poa Internet, which can offer a more affordable alternative to GSM for some users.
Finally, we can see the common practice of using “airplane” mode in order to force disconnect from all networks and thus prevent data consumption (especially background processes).
Digital Lives ▸ Network coverage
Urban users take advantage of 3G and Wi-Fi coverage, while rural users spend the majority of their time under slower 2G signals
11
ii
Time spent connected to each network modalityQ3 2017, n=1,000 Caribou Data • insights built on privacy
RuralUrban
Source: Caribou Data
Caribou Data
Size of data bundle purchased (MB)
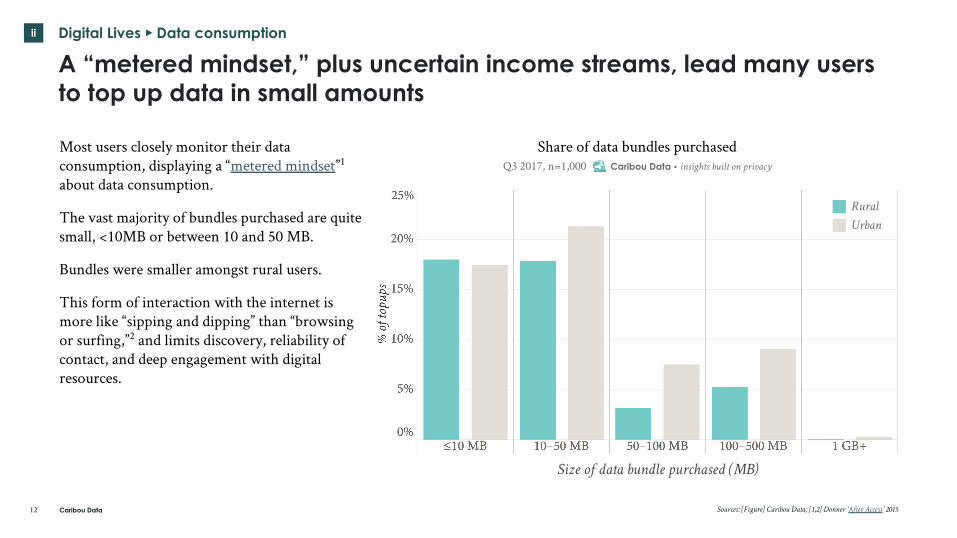
Most users closely monitor their data consumption, displaying a “metered mindset”1 about data consumption.
The vast majority of bundles purchased are quite small, <10MB or between 10 and 50 MB.
Bundles were smaller amongst rural users.
This form of interaction with the internet is more like “sipping and dipping” than “browsing or surfing,”2 and limits discovery, reliability of contact, and deep engagement with digital resources.
Digital Lives ▸ Data consumption
A “metered mindset,” plus uncertain income streams, lead many users to top up data in small amounts
12 Sources: [Figure] Caribou Data; [1,2] Donner ‘After Access’ 2015
ii
Share of data bundles purchasedQ3 2017, n=1,000 Caribou Data • insights built on privacy
RuralUrban
Caribou Data
Digital Lives ▸ DFS in context
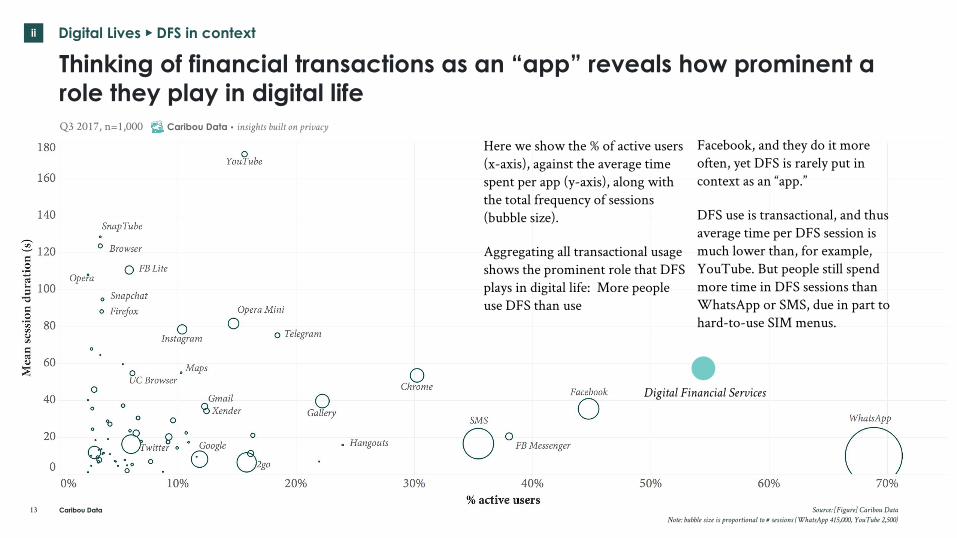
Thinking of financial transactions as an “app” reveals how prominent a role they play in digital life
13
ii
Digital Financial Services
Notes: % active users is the
share of individuals with a given app installed that
bring it into the foreground at least once
in a 30-day period.
Caribou Data Source: [Figure] Caribou DataNote: bubble size is proportional to # sessions (WhatsApp 415,000, YouTube 2,500)
Here we show the % of active users (x-axis), against the average time spent per app (y-axis), along with the total frequency of sessions (bubble size).
Aggregating all transactional usage shows the prominent role that DFS plays in digital life: More people use DFS than use
Facebook, and they do it more often, yet DFS is rarely put in context as an “app.”
DFS use is transactional, and thus average time per DFS session is much lower than, for example, YouTube. But people still spend more time in DFS sessions than WhatsApp or SMS, due in part to hard-to-use SIM menus.
Q3 2017, n=1,000 Caribou Data • insights built on privacy
Digital financial services use
14
In this section
We break down the big numbers to understand the detailed composition of the digital financial services sector in Kenya, exploring not only what digital services are being used, but also who is using them, and how these services fit within the broader context of people's digital activity.
iii
Caribou Data
iii DFS use ▸ User population
15
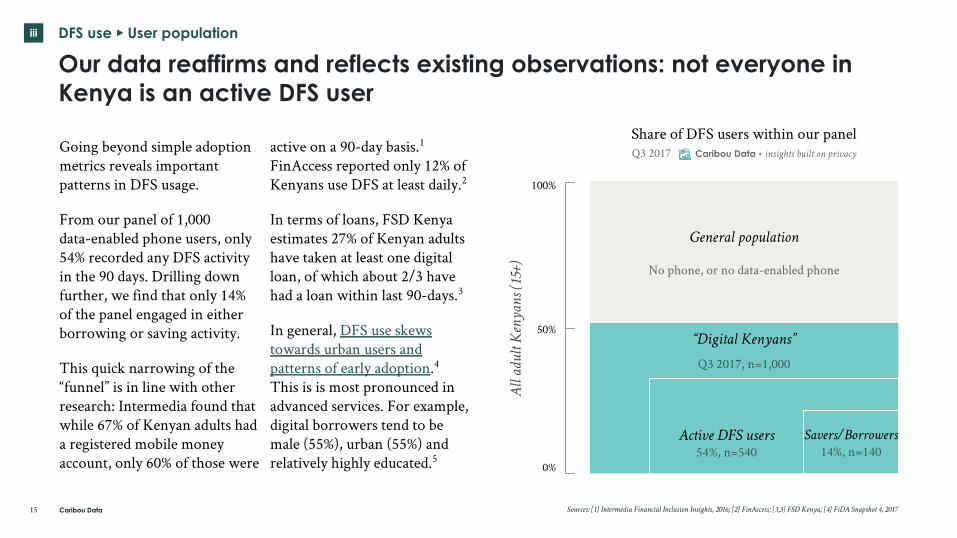
Our data reaffirms and reflects existing observations: not everyone in Kenya is an active DFS user
Sources: [1] Intermedia Financial Inclusion Insights, 2016; [2] FinAccess; [3,5] FSD Kenya; [4] FiDA Snapshot 4, 2017
Going beyond simple adoption metrics reveals important patterns in DFS usage.
From our panel of 1,000 data-enabled phone users, only 54% recorded any DFS activity in the 90 days. Drilling down further, we find that only 14% of the panel engaged in either borrowing or saving activity.
This quick narrowing of the “funnel” is in line with other research: Intermedia found that while 67% of Kenyan adults had a registered mobile money account, only 60% of those were
active on a 90-day basis.1 FinAccess reported only 12% of Kenyans use DFS at least daily.2
In terms of loans, FSD Kenya estimates 27% of Kenyan adults have taken at least one digital loan, of which about 2/3 have had a loan within last 90-days.3
In general, DFS use skews towards urban users and patterns of early adoption.4 This is is most pronounced in advanced services. For example, digital borrowers tend to be male (55%), urban (55%) and relatively highly educated.5
General population
No phone, or no data-enabled phone
“Digital Kenyans”
Q3 2017, n=1,000
Active DFS users54%, n=540
Savers/Borrowers14%, n=140
Share of DFS users within our panelQ3 2017 Caribou Data • insights built on privacy
All
adul
t Ken
yans
(15+
)
100%
50%
0%
Caribou Data
iii DFS use ▸ Tracking flow of funds
16
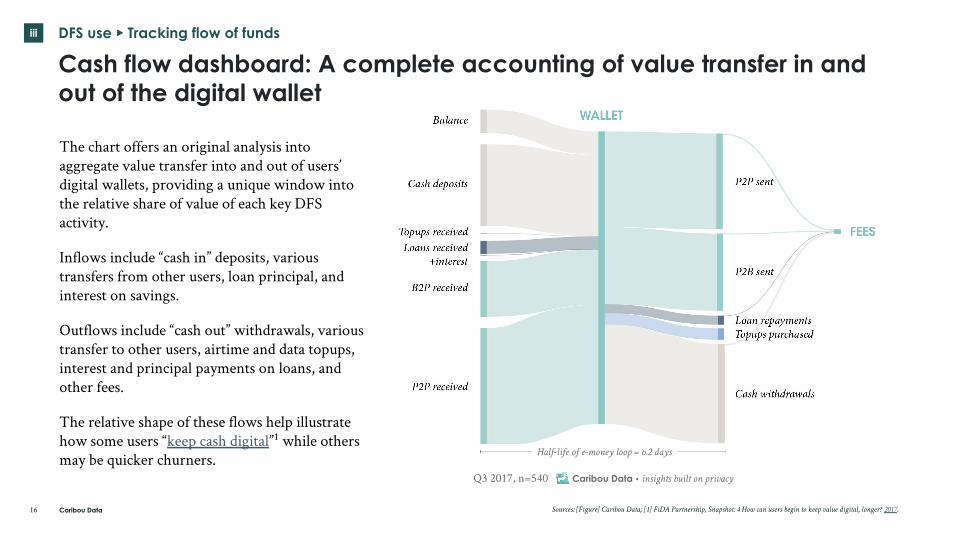
Cash flow dashboard: A complete accounting of value transfer in and out of the digital wallet
Sources: [Figure] Caribou Data; [1] FiDA Partnership, Snapshot: 4 How can users begin to keep value digital, longer? 2017.
The chart offers an original analysis into aggregate value transfer into and out of users’ digital wallets, providing a unique window into the relative share of value of each key DFS activity.
Inflows include “cash in” deposits, various transfers from other users, loan principal, and interest on savings.
Outflows include “cash out” withdrawals, various transfer to other users, airtime and data topups, interest and principal payments on loans, and other fees.
The relative shape of these flows help illustrate how some users “keep cash digital”1 while others may be quicker churners.
Q3 2017, n=540 Caribou Data • insights built on privacy
Half-life of e-money loop = 6.2 days
Caribou Data
iii DFS use ▸ User interfaces
17
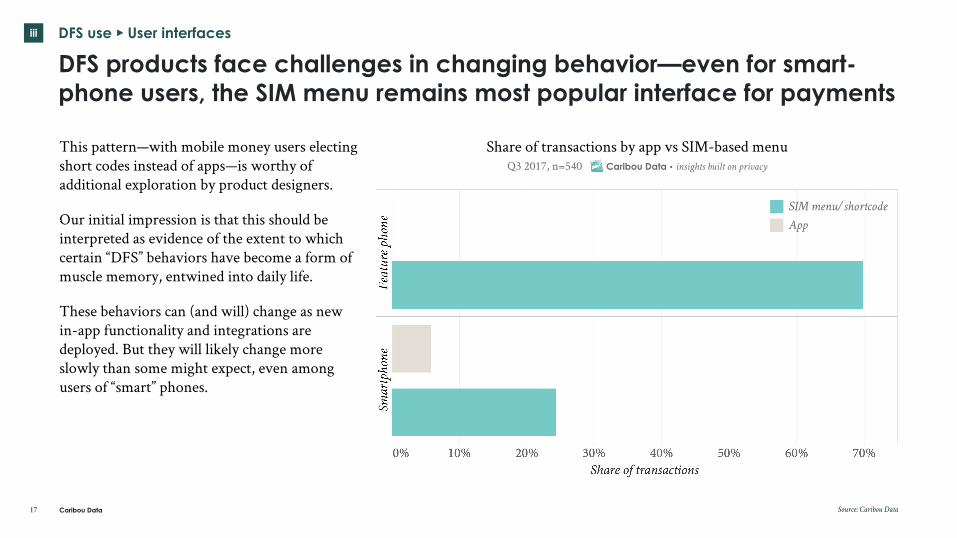
DFS products face challenges in changing behavior—even for smart- phone users, the SIM menu remains most popular interface for payments
This pattern—with mobile money users electing short codes instead of apps—is worthy of additional exploration by product designers.
Our initial impression is that this should be interpreted as evidence of the extent to which certain “DFS” behaviors have become a form of muscle memory, entwined into daily life.
These behaviors can (and will) change as new in-app functionality and integrations are deployed. But they will likely change more slowly than some might expect, even among users of “smart” phones.
Share of transactions by app vs SIM-based menuQ3 2017, n=540 Caribou Data • insights built on privacy
SIM menu/shortcodeApp
Source: Caribou Data
Caribou Data
iii DFS use ▸ Time of day
18
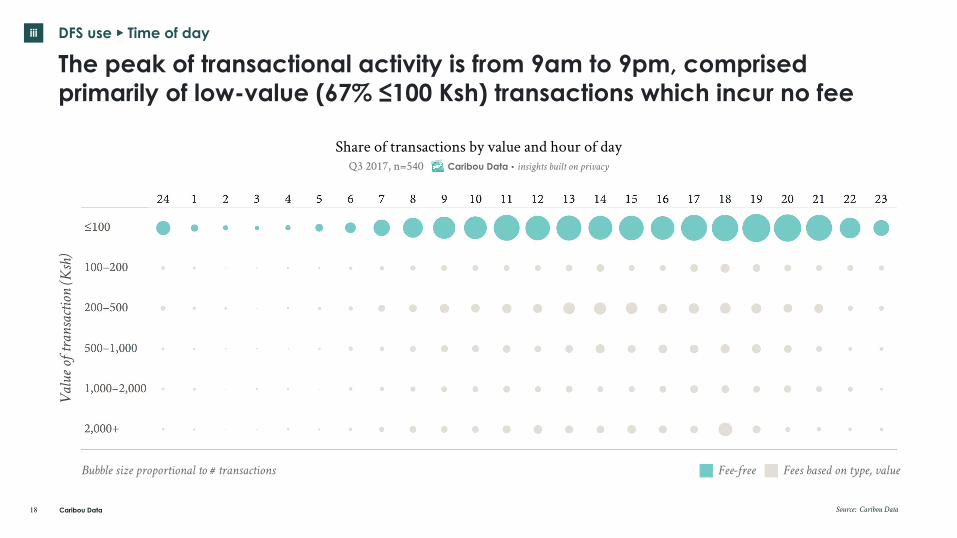
The peak of transactional activity is from 9am to 9pm, comprised primarily of low-value (67% ≤100 Ksh) transactions which incur no fee
Source: Caribou Data
Val
ue o
f tra
nsac
tion
(Ksh
)
Share of transactions by value and hour of dayQ3 2017, n=540 Caribou Data • insights built on privacy
Fee-free Fees based on type, valueBubble size proportional to # transactions
Caribou Data
iii DFS use ▸ Activity by age
19
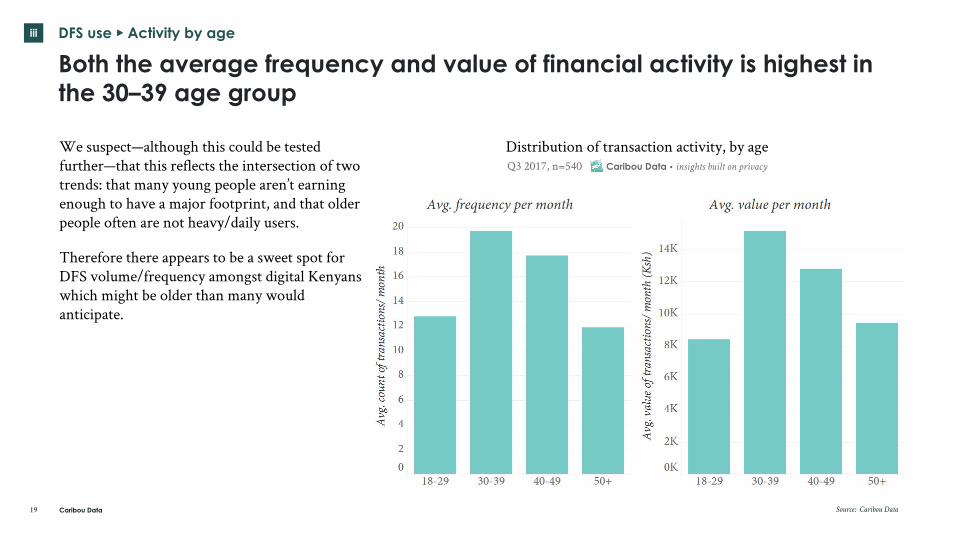
Both the average frequency and value of financial activity is highest in the 30–39 age group
Source: Caribou Data
Distribution of transaction activity, by ageQ3 2017, n=540 Caribou Data • insights built on privacy
We suspect—although this could be tested further—that this reflects the intersection of two trends: that many young people aren’t earning enough to have a major footprint, and that older people often are not heavy/daily users.
Therefore there appears to be a sweet spot for DFS volume/frequency amongst digital Kenyans which might be older than many would anticipate.
Caribou Data
iii
20 Source: [Figure] Caribou Data
DFS use ▸ Location
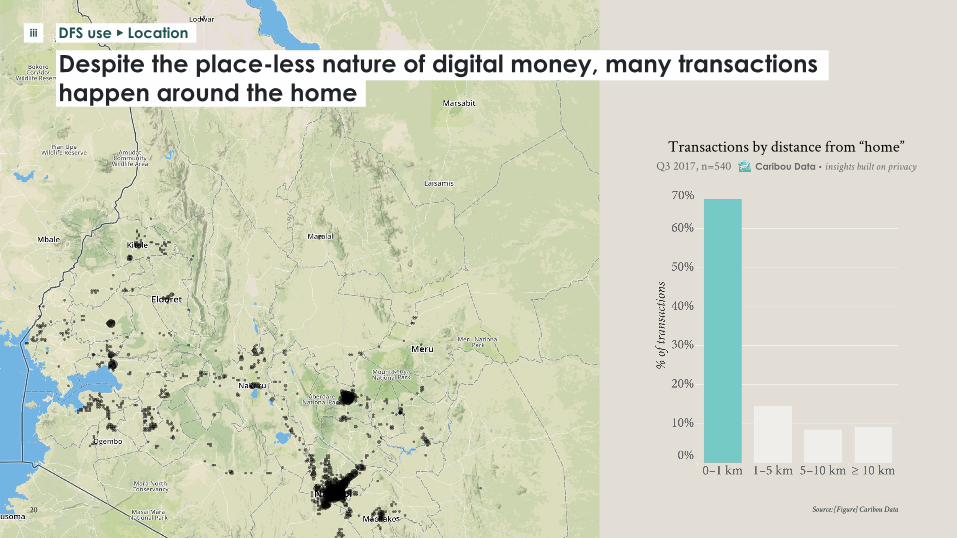
Despite the place-less nature of digital money, many transactions happen around the home
Transactions by distance from “home”Q3 2017, n=540 Caribou Data • insights built on privacy
Exploring advanced DFS use
21
In this section
An illustrative behavior-based “segmentation” focused on differentiating advanced DFS users from casual ones, and linking that to other behaviors and demographics.
iv
Caribou Data
iv Approach ▸ Segmentation
22
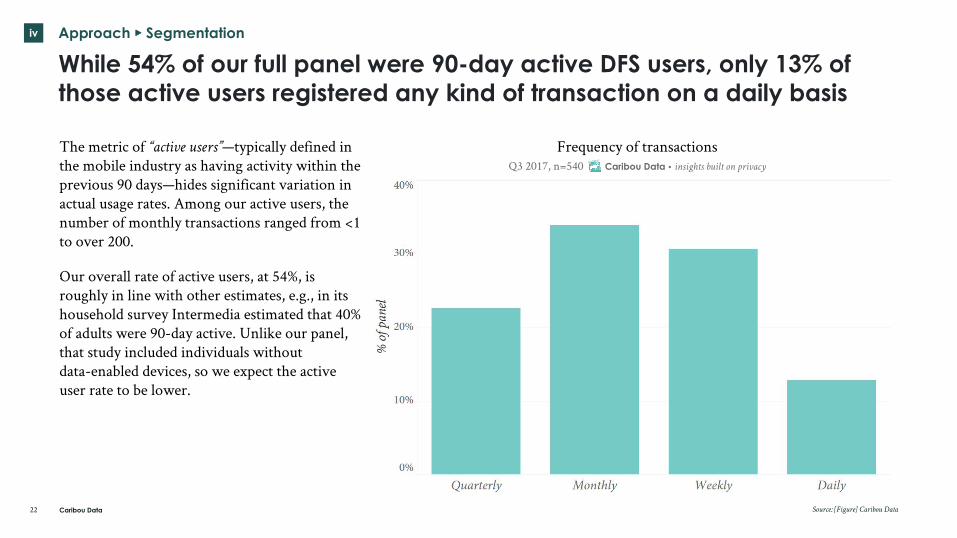
While 54% of our full panel were 90-day active DFS users, only 13% of those active users registered any kind of transaction on a daily basis
Source: [Figure] Caribou Data
The metric of “active users”—typically defined in the mobile industry as having activity within the previous 90 days—hides significant variation in actual usage rates. Among our active users, the number of monthly transactions ranged from <1 to over 200.
Our overall rate of active users, at 54%, is roughly in line with other estimates, e.g., in its household survey Intermedia estimated that 40% of adults were 90-day active. Unlike our panel, that study included individuals without data-enabled devices, so we expect the active user rate to be lower.
Frequency of transactionsQ3 2017, n=540 Caribou Data • insights built on privacy
Caribou Data
iv
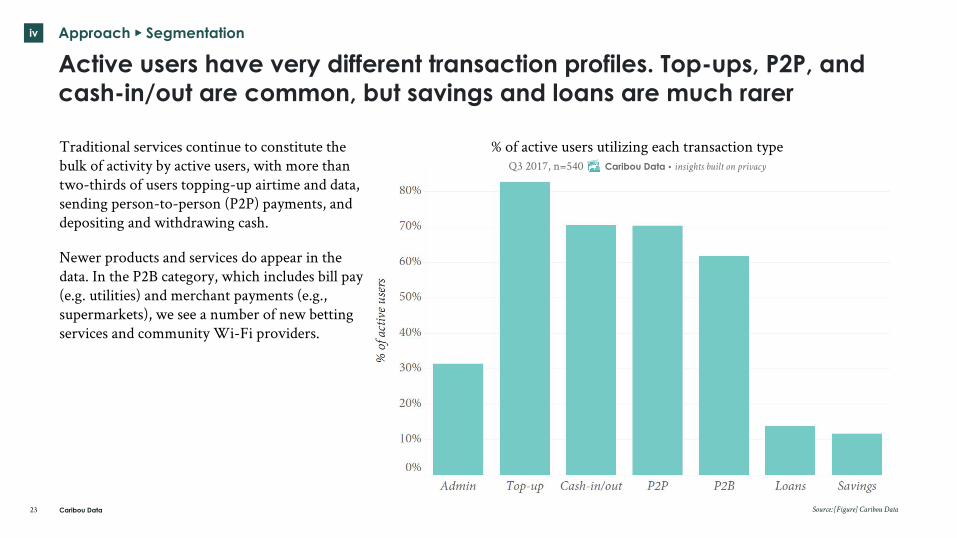
Active users have very different transaction profiles. Top-ups, P2P, and cash-in/out are common, but savings and loans are much rarer
Approach ▸ Segmentation
23 Source: [Figure] Caribou Data
Traditional services continue to constitute the bulk of activity by active users, with more than two-thirds of users topping-up airtime and data, sending person-to-person (P2P) payments, and depositing and withdrawing cash.
Newer products and services do appear in the data. In the P2B category, which includes bill pay (e.g. utilities) and merchant payments (e.g., supermarkets), we see a number of new betting services and community Wi-Fi providers.
% of active users utilizing each transaction typeQ3 2017, n=540 Caribou Data • insights built on privacy
Caribou Data
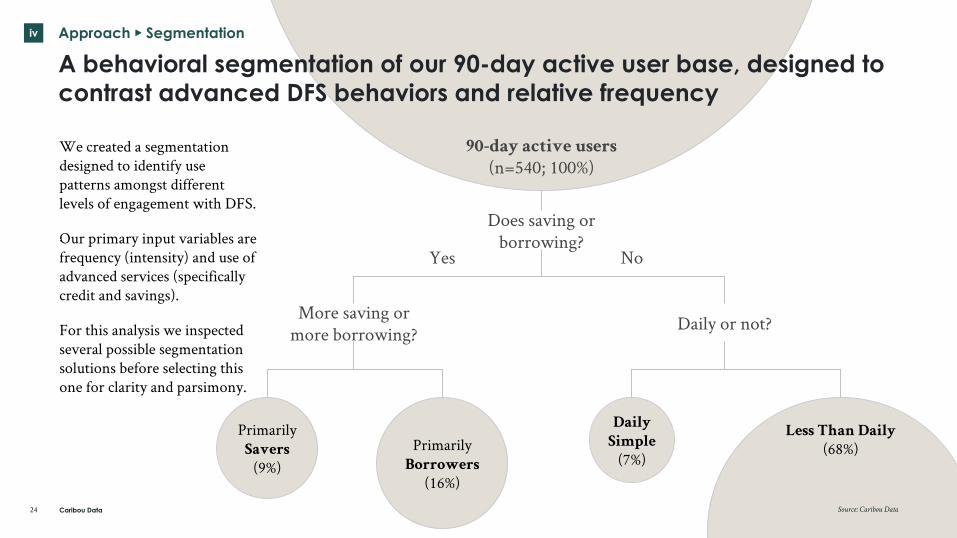
We created a segmentation designed to identify use patterns amongst different levels of engagement with DFS.
Our primary input variables are frequency (intensity) and use of advanced services (specifically credit and savings).
For this analysis we inspected several possible segmentation solutions before selecting this one for clarity and parsimony.
iv Approach ▸ Segmentation
24
More saving or more borrowing? Daily or not?
Daily Simple
(7%)Primarily
Borrowers(16%)
Primarily Savers
(9%)
Less Than Daily (68%)
Yes No
90-day active users(n=540; 100%)
Does saving or borrowing?
A behavioral segmentation of our 90-day active user base, designed to contrast advanced DFS behaviors and relative frequency
Source: Caribou Data
Caribou Data25
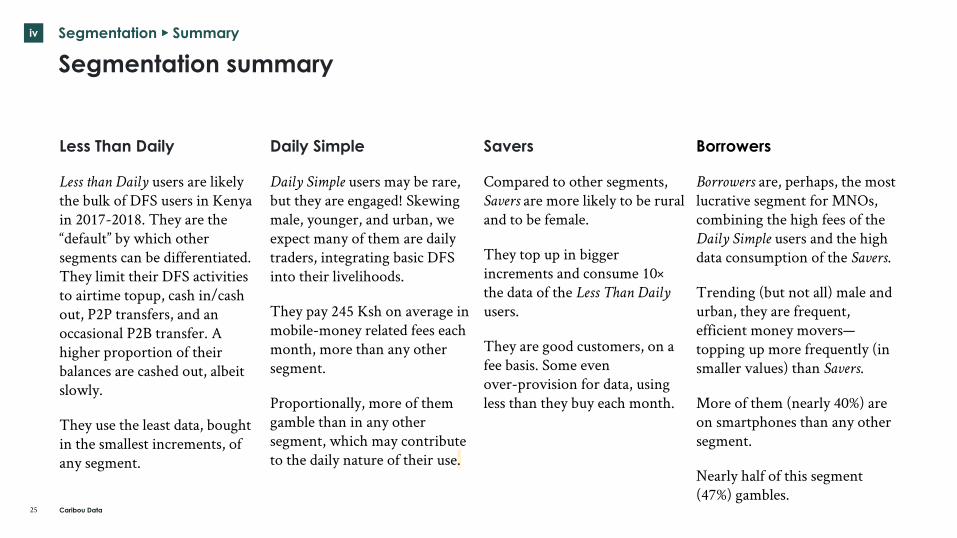
Less Than Daily
Less than Daily users are likely the bulk of DFS users in Kenya in 2017-2018. They are the “default” by which other segments can be differentiated. They limit their DFS activities to airtime topup, cash in/cash out, P2P transfers, and an occasional P2B transfer. A higher proportion of their balances are cashed out, albeit slowly.
They use the least data, bought in the smallest increments, of any segment.
Segmentation summary
Daily Simple
Daily Simple users may be rare, but they are engaged! Skewing male, younger, and urban, we expect many of them are daily traders, integrating basic DFS into their livelihoods.
They pay 245 Ksh on average in mobile-money related fees each month, more than any other segment.
Proportionally, more of them gamble than in any other segment, which may contribute to the daily nature of their use.
Savers
Compared to other segments, Savers are more likely to be rural and to be female.
They top up in bigger increments and consume 10× the data of the Less Than Daily users.
They are good customers, on a fee basis. Some even over-provision for data, using less than they buy each month.
Borrowers
Borrowers are, perhaps, the most lucrative segment for MNOs, combining the high fees of the Daily Simple users and the high data consumption of the Savers.
Trending (but not all) male and urban, they are frequent, efficient money movers— topping up more frequently (in smaller values) than Savers.
More of them (nearly 40%) are on smartphones than any other segment.
Nearly half of this segment (47%) gambles.
iv Segmentation ▸ Summary
Caribou Data
iv Segmentation ▸ Demographics
26
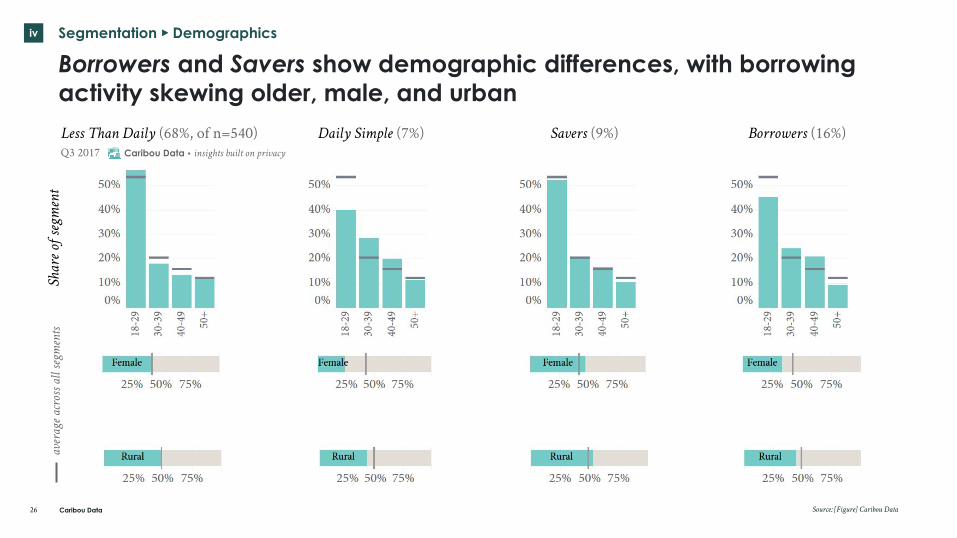
Borrowers and Savers show demographic differences, with borrowing activity skewing older, male, and urban
Source: [Figure] Caribou Data
Less Than Daily (68%, of n=540) Daily Simple (7%) Savers (9%) Borrowers (16%)
Shar
e of s
egm
ent
aver
age a
cros
s all
segm
ents
Q3 2017 Caribou Data • insights built on privacy
Caribou Data
iv Segmentation ▸ Device type
27
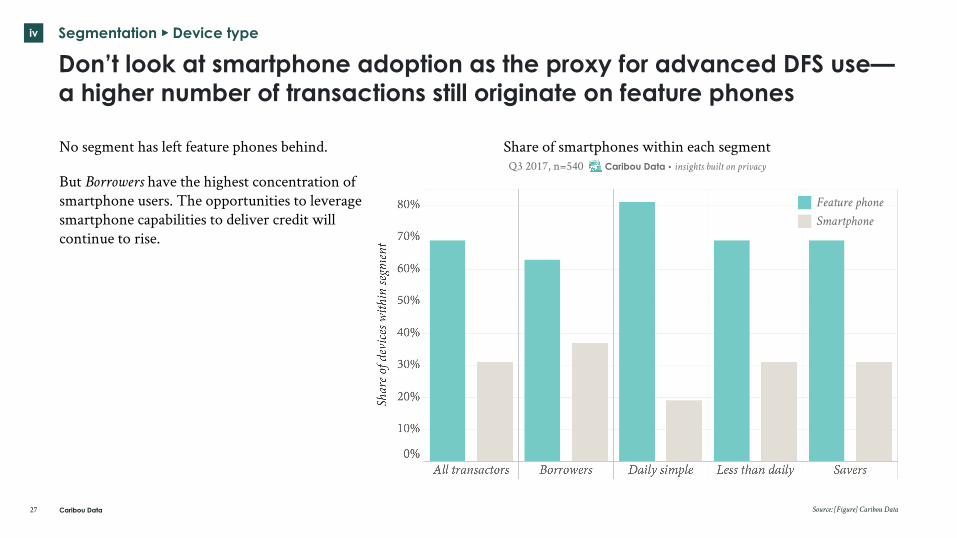
Don’t look at smartphone adoption as the proxy for advanced DFS use—a higher number of transactions still originate on feature phones
No segment has left feature phones behind.
But Borrowers have the highest concentration of smartphone users. The opportunities to leverage smartphone capabilities to deliver credit will continue to rise.
Source: [Figure] Caribou Data
Share of smartphones within each segmentQ3 2017, n=540 Caribou Data • insights built on privacy
Feature phoneSmartphone
Caribou Data
iv Segmentation ▸ Data consumption
28
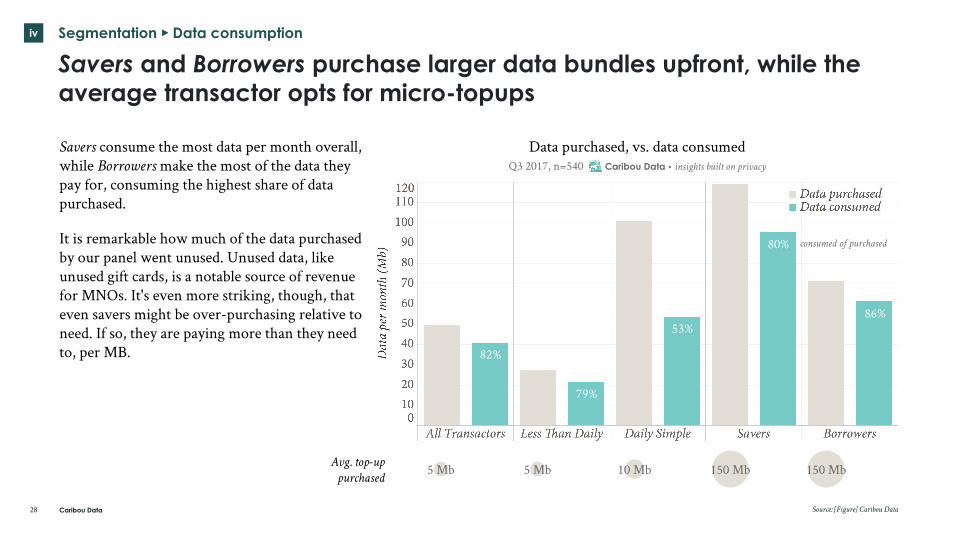
Savers and Borrowers purchase larger data bundles upfront, while the average transactor opts for micro-topups
Source: [Figure] Caribou Data
Savers consume the most data per month overall, while Borrowers make the most of the data they pay for, consuming the highest share of data purchased.
It is remarkable how much of the data purchased by our panel went unused. Unused data, like unused gift cards, is a notable source of revenue for MNOs. It's even more striking, though, that even savers might be over-purchasing relative to need. If so, they are paying more than they need to, per MB.
150 Mb5 Mb 10 MbAvg. top-uppurchased
150 Mb5 Mb
79%
53%
Data purchased, vs. data consumedQ3 2017, n=540 Caribou Data • insights built on privacy
consumed of purchased80%
86%
82%
Caribou Data
iv Segmentation ▸ Revenue
29
Even if you turned off loans, borrowers would still be your best customers—“frequent users of everything”
Source: [Figure] Caribou Data
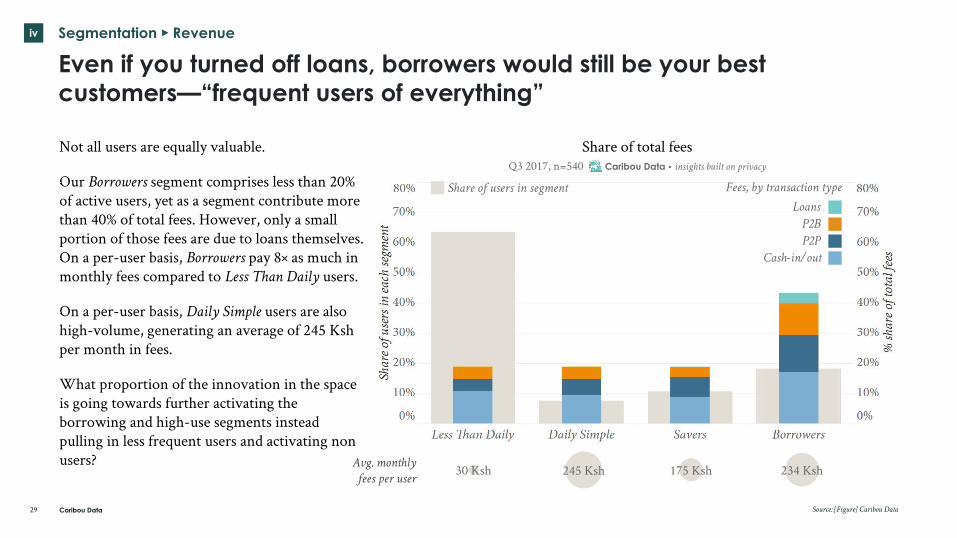
Not all users are equally valuable.
Our Borrowers segment comprises less than 20% of active users, yet as a segment contribute more than 40% of total fees. However, only a small portion of those fees are due to loans themselves. On a per-user basis, Borrowers pay 8× as much in monthly fees compared to Less Than Daily users.
On a per-user basis, Daily Simple users are also high-volume, generating an average of 245 Ksh per month in fees.
What proportion of the innovation in the space is going towards further activating the borrowing and high-use segments instead pulling in less frequent users and activating non users?
30 Ksh 234 KshAvg. monthly fees per user
175 Ksh245 Ksh
Share of total feesQ3 2017, n=540 Caribou Data • insights built on privacy
Cash-in/out
LoansP2BP2P
Fees, by transaction typeShare of users in segment
Caribou Data
iv Segmentation ▸ Messaging
30
DFS transactions are “sandwiched” by automatic AND user driven messaging behaviors
Source: [Figure] Caribou Data
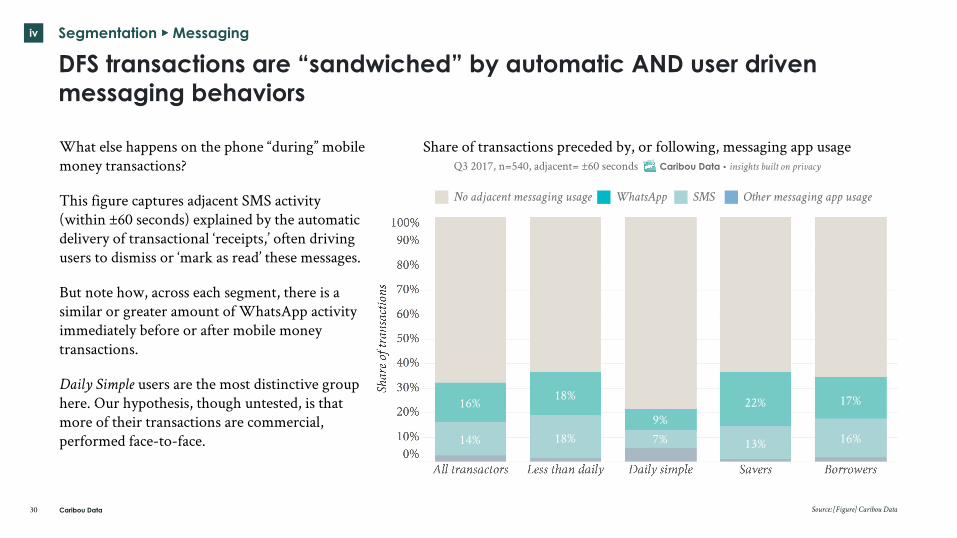
What else happens on the phone “during” mobile money transactions?
This figure captures adjacent SMS activity (within ±60 seconds) explained by the automatic delivery of transactional ‘receipts,’ often driving users to dismiss or ‘mark as read’ these messages.
But note how, across each segment, there is a similar or greater amount of WhatsApp activity immediately before or after mobile money transactions.
Daily Simple users are the most distinctive group here. Our hypothesis, though untested, is that more of their transactions are commercial, performed face-to-face.
Share of transactions preceded by, or following, messaging app usageQ3 2017, n=540, adjacent= ±60 seconds Caribou Data • insights built on privacy
27%
69% 39% 47%
No adjacent messaging usage SMS WhatsApp
16% 18%
9%22% 17%
14% 18% 7% 13% 16%
Other messaging app usage
Caribou Data
iv Segmentation ▸ Gambling
31
Gambling is widespread, but the Daily Simple and Borrowers segments have higher ratios of gamblers, and more frequent gambling activity
Source: [Figure] Caribou Data; [1] Owuor 2018;
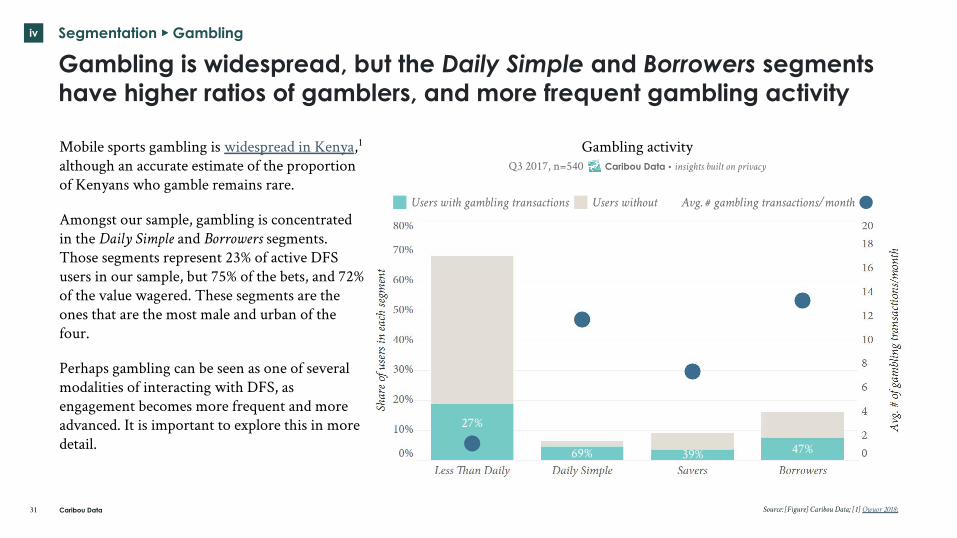
Mobile sports gambling is widespread in Kenya,1 although an accurate estimate of the proportion of Kenyans who gamble remains rare.
Amongst our sample, gambling is concentrated in the Daily Simple and Borrowers segments. Those segments represent 23% of active DFS users in our sample, but 75% of the bets, and 72% of the value wagered. These segments are the ones that are the most male and urban of the four.
Perhaps gambling can be seen as one of several modalities of interacting with DFS, as engagement becomes more frequent and more advanced. It is important to explore this in more detail.
Gambling activityQ3 2017, n=540 Caribou Data • insights built on privacy
Users without
27%
69% 39% 47%
Users with gambling transactions Avg. # gambling transactions/month
Caribou Data
iv Segmentation ▸ Cash flow
32
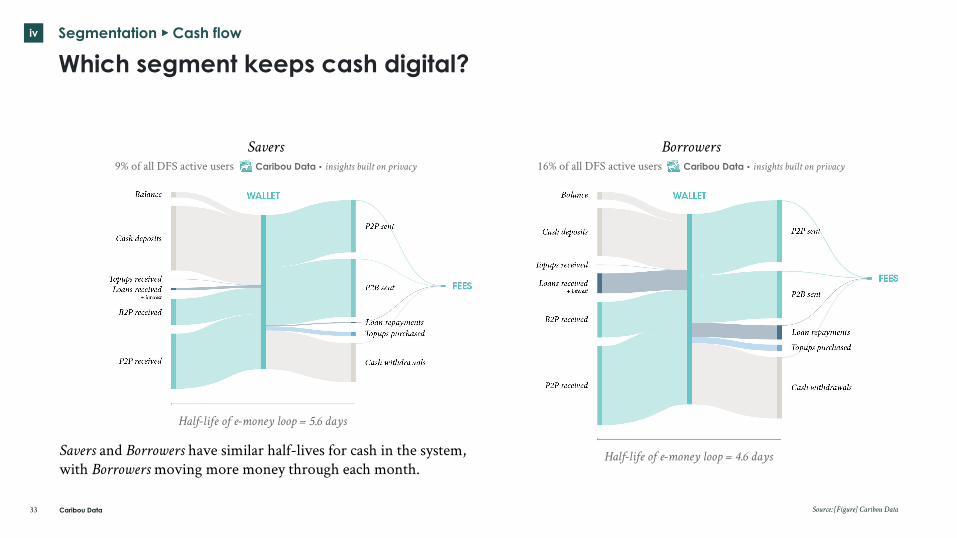
Which segment keeps cash digital?
Source: [Figure] Caribou Data
Daily Simple7% of all DFS active users Caribou Data • insights built on privacy
Less Than Daily68% of all DFS active users Caribou Data • insights built on privacy
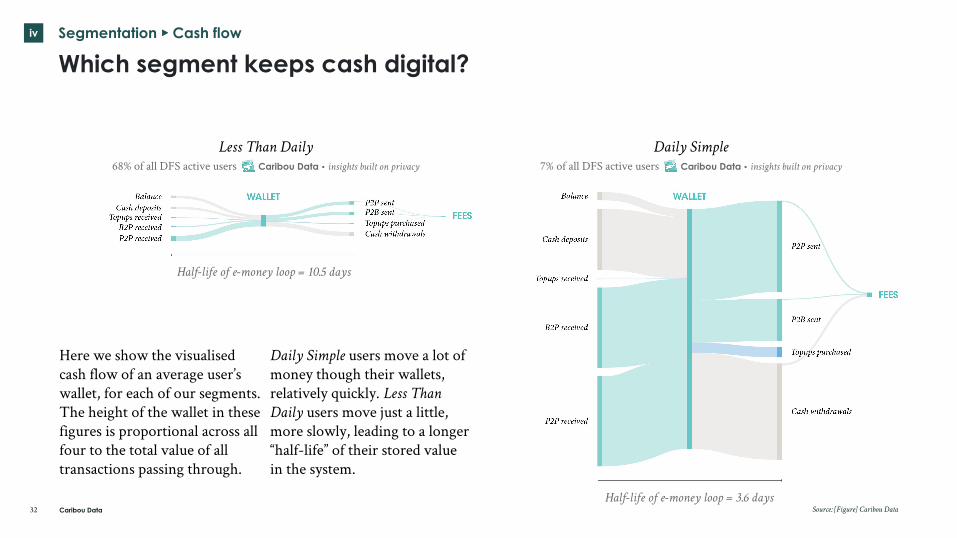
Here we show the visualised cash flow of an average user’s wallet, for each of our segments. The height of the wallet in these figures is proportional across all four to the total value of all transactions passing through.
Daily Simple users move a lot of money though their wallets, relatively quickly. Less Than Daily users move just a little, more slowly, leading to a longer “half-life” of their stored value in the system.
Half-life of e-money loop = 10.5 days
Half-life of e-money loop = 3.6 days
Caribou Data
iv Segmentation ▸ Cash flow
33
Which segment keeps cash digital?
Source: [Figure] Caribou Data
Borrowers16% of all DFS active users Caribou Data • insights built on privacy
Savers9% of all DFS active users Caribou Data • insights built on privacy
Half-life of e-money loop = 5.6 days
Half-life of e-money loop = 4.6 daysSavers and Borrowers have similar half-lives for cash in the system, with Borrowers moving more money through each month.
Concluding remarks
34
In this section
We discuss implications and action steps for the DFS community.
v
Caribou Data
v Concluding remarks
35
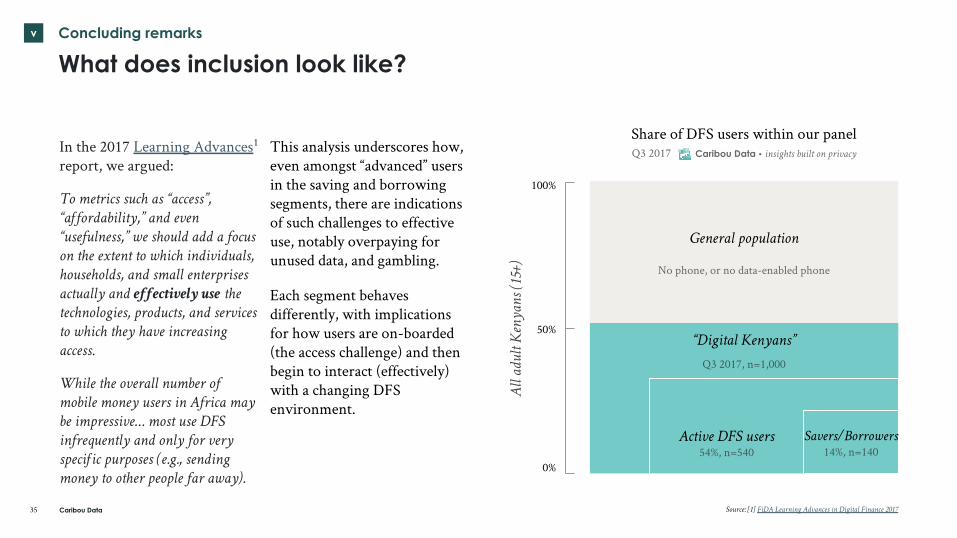
What does inclusion look like?
In the 2017 Learning Advances1 report, we argued:
To metrics such as “access”, “a fordability,” and even “usefulness,” we should add a focus on the extent to which individuals, households, and small enterprises actually and effectively use the technologies, products, and services to which they have increasing access.
While the overall number of mobile money users in Africa may be impressive… most use DFS infrequently and only for very speci ic purposes (e.g., sending money to other people far away).
This analysis underscores how, even amongst “advanced” users in the saving and borrowing segments, there are indications of such challenges to effective use, notably overpaying for unused data, and gambling.
Each segment behaves differently, with implications for how users are on-boarded (the access challenge) and then begin to interact (effectively) with a changing DFS environment.
Source: [1] FiDA Learning Advances in Digital Finance 2017
General population
No phone, or no data-enabled phone
“Digital Kenyans”
Q3 2017, n=1,000
Active DFS users54%, n=540
Savers/Borrowers14%, n=140
All
adul
t Ken
yans
(15+
)
100%
50%
0%
Share of DFS users within our panelQ3 2017 Caribou Data • insights built on privacy
Caribou Data
v Concluding remarks
36
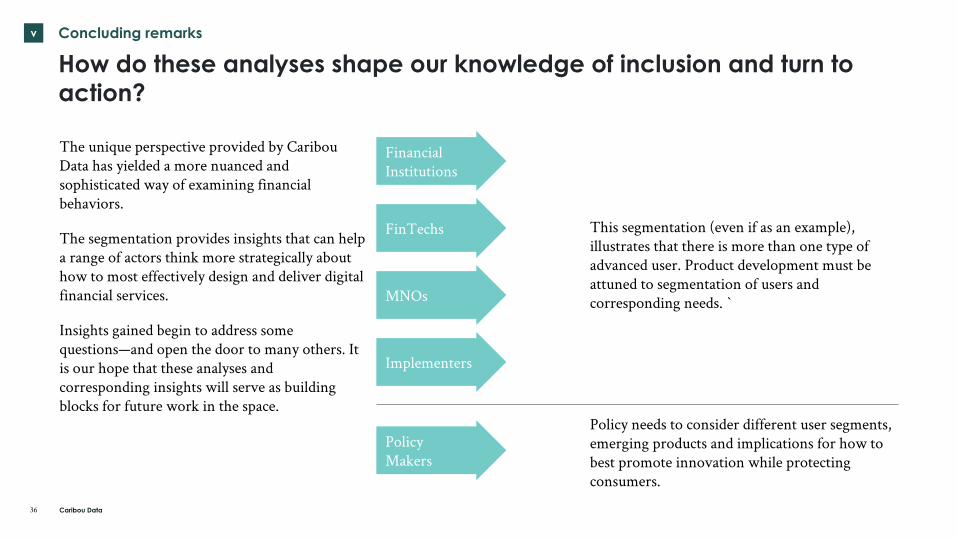
How do these analyses shape our knowledge of inclusion and turn to action?
Financial Institutions
FinTechs
MNOs
Implementers
Policy Makers
This segmentation (even if as an example), illustrates that there is more than one type of advanced user. Product development must be attuned to segmentation of users and corresponding needs. `
Policy needs to consider different user segments, emerging products and implications for how to best promote innovation while protecting consumers.
The unique perspective provided by Caribou Data has yielded a more nuanced and sophisticated way of examining financial behaviors.
The segmentation provides insights that can help a range of actors think more strategically about how to most effectively design and deliver digital financial services.
Insights gained begin to address some questions—and open the door to many others. It is our hope that these analyses and corresponding insights will serve as building blocks for future work in the space.
Caribou Data
v Concluding remarks ▸ For DFS product design
37
This behavioral segmentation of DFS use by “digital Kenyans” with data enabled phones offers insights, but also important questions:
Insights
Design for simplicity. Shortcodes still outpace in-app behaviors. There are still lots of feature phones, and amongst smartphone users, lots of underpowered, old, and “full” phones to contend with.
Less Than Daily users are a long tail, and majority of DFS users even in a leading market like Kenya. Work remains to encourage more regular use of DFS.
Kenya is still a place for small top-ups and a metered mindset.
There is more than one type of advanced user. Segmentations amongst advanced users are a helpful way to identify distinct needs/behaviors.
Intensity begets intensity— Borrowers in particular are deeply engaged with their phones and are high value customers.
Open questions
Do small-scale informal micro enterprises (likely many in the Daily Simple user base) need their own product offerings with a different fee structures?
What are the best ways to move Android users towards in-app behaviors?
How does DFS use interact with messaging use, beyond the proximites we observed in this analysis (ask your users, and explore links between messaging and DFS).
Caribou Data
v Concluding remarks ▸ For DFS policymakers and researchers
38
This behavioral segmentation of DFS use by “digital Kenyans” with data enabled phones offers insights, but also important questions:
Insights
There is plenty of room (and need) for digital Kenyans to move into more advanced and regular DFS use. Only about half of our sample was an active DFS user, and of that, the majority was still infrequent and simple.
Gambling is concentrated amongst heavy Daily Simple users and the Borrowers segment, an inbuilt, potential disadvantage to high-intensity use.
Savers (trending rural and female) and Borrowers (urban and male) are quite distinct, demographically. How might the outreach to each group be tailored to account for this fact?
Open questions
It might be worth exploring nudges and behavioral incentives for saving vs those for borrowing.
Looking at fee breakdowns by segment prompts a question: who is cross-subsidising who? Borrowers emerged as “frequent users of everything” which is good for service providers, but perhaps in a way that distracts innovation away from the long tail or occasional users.
This segmentation is designed to be illustrative rather than canonical, but the splits between Savers and Borrowers, and between Less Than Daily users and Daily Simple users may be worth exploring by the policy community in further detail.
inancedigitalafrica.org
@FiDAPartnership
cariboudata.com
@cariboudata
Appendices
40
In this section
We provide additional details about the methodology, recruitment and privacy considerations.
vi
Caribou Data41
Methodological details and ethical considerations
Data
Data covers a 90-day period from Q3 2017, with a panel of 1,000 users. Data types collected include app usage, network connections including signal strength, approximate location, data consumption, and transactional records.
Panel recruitment
Our local recruitment partner in Kenya was Every1Mobile (E1M), which conducted a mix of online and in-person recruitment to fill the demographic quotas required.
A geographic distribution was not mandated, but our sample resulted in coverage of 45 of 47 Kenyan counties, as defined in the 2010 Constitution of Kenya.
Sample
We recruited to match interlocking quotas for gender and age in urban/rural locations, derived from the 2009 Kenyan population census and rebased for the 18+ adult population.
The resulting panel thus correctly and proportionately reflects female (51%), rural (63%) and younger (67% <40) users
Definitions
For all measures, time and durations are shown in seconds, currency data in Kenyan Shillings (Ksh) and data consumption in Mb. Any measures shown as an average use the median average.
A few common definitions:
▪ Sessions: number of unique app events, where a session is defined as the time between an app being foregrounded (typically ≈launched) and backgrounded (≈quit)
▪ Active: the observation of a behaviour at least once in a rolling 90 day period
▪ Share: as a proportion of the total panel
vi Appendices
Caribou Data42
Methodological details and ethical considerations, cont.
Privacy
Our work is predicated on an absolute commitment to individual privacy, with a baseline of adherence to the GDPR,1 regardless of whether local privacy law offers fewer protections.
Panelists are provided a clear explanation of how their data will be used, and the terms of the remuneration. Online explanations are in English only, but in-person recruiters are able to speak local languages as required.
We ensure effective anonymity of all panelists via processes taken at multiple layers: firstly, the data we collect is stripped of identifiable data before being recorded, and secondly,
Limitations
Like all social science studies, this research has limitations. Most importantly, the sample is composed of data-enabled phone users, which by definition is not representative of all adult Kenyans.
Because we remunerate panelists (approximately $5/month in airtime) to participate, there is possible selection bias toward individuals who find that incentive attractive. In addition, the remuneration could impact some panelists’ behavior in how much they spend on airtime/data. However, if anything we would under capture metered-mindset behaviors.
we utilise di ferential privacy techniques such as obfuscation, non-linear noise, and subsampling into some data types (such as location data), that may otherwise be more likely to be correlated or de-anonymized. All data is encrypted at rest and in transit.
At the analysis level, we employ similar differential techniques, which means that our system reviews every query and the result it would produce, and only returns a result if it is accepted to be non-identifiable; e.g., if a query was very specific and resulted in a very small n, the system would return a null result to protect against de-anonymization.
Despite in-person recruiters speaking local languages, it’s possible that prospective panelists with limited or no English language proficiency were uncomfortable or unable to participate, introducing bias in the sample.
[1] European Union Regulation (EU) 2016/679, “General Data Protection Regulation” (GDPR), https://eur-lex.europa.eu/legal-content/EN/TXT/HTML/?uri=CELEX:32016R0679&from=EN
vi Appendices