device comparability: apples to apples? - confex · device comparability: apples to apples? ......
TRANSCRIPT
Device Comparability: Apples to Apples?
Laurie Laughlin Davis, Ph.D. CCSSO National Conference on Student Assessment
June 26, 2014

Apple to Apple to Android?

3
Device Form Factor
o What is “Form Factor”? oSize, style and shape
o Layout and position of major functional components
oMethod of interaction (mouse, touchscreen, keyboard, etc.)
o Devices with similar form factors can be expected to have higher degrees of comparability o Example: Desktops and laptops (see Powers & Potenza, 1996)
o Example: 10” Android tablets and 10” iPad tablets
o Devices with less similar form factors can be expected to have lesser degrees of comparability o Example: Desktops and smartphones
Copyright © 2013 Pearson Education, Inc. or its affiliates. All rights reserved.

Pearson’s Digital Devices Study History
Qualitative Writing usability study (March 2012) Screen size/item type usability study (Nov 2012) Device features usability study (Feb 2013)
Quantitative Written composition study (Spring 2013)
Tablet to computer comparability study (Spring 2014) 4

5
2013 Written Composition Study (Recap)

6
Conclusions o No differences observed in student writing performance
across study conditions, but consider: o Essay responses relatively short (by design)
o ~275 on average for high school
o ~225 on average for 5th graders
o Essay prompts relatively short with no reference to stimuli like a reading passage
o Screen real estate taken up by onscreen keyboard less of an issue
o Low stakes for students (random drawing for a gift card) o Results may be different if any of these factors are
varied

Spring 2014 Study Design
CCSSO 2013 7
~1000 high school students
Random assignment to condition (computer or tablet)

7 schools from 5 Virginia school divisions volunteered Frederick Prince George Stafford Henrico Isle of Wight
Students were required to be enrolled in or have completed Algebra I, Biology, and English II coursework
Computers included laptops and desktops Tablets were 10” iPads 90 minute testing sessions
Study Design

9
Test Blueprint
MC Hot Spot
Drag and Drop
Fill In the
Blank
Multiple Select
MC
Inline Choice TOTAL
Reading 6 6 8 0 0 0 20 Mathematics 8 0 1 5 4 0 18
Science 12 2 2 2 0 3 21 TOTAL 26 8 11 7 4 3 59
44% 14% 19% 12% 7% 5% 100%
Study Test Form

Targeted data collection: February 2014
The Best Laid Plans…

Targeted data collection: February 2014
Actual data collection: April-June 2014
The Best Laid Plans…

Preliminary Results
Last day of data collection—June 6 Data files received—June 18 Data QC’ed and Phase I analyses completed—June 24 CCSSO presentation—June 26
CCSSO 2013 12
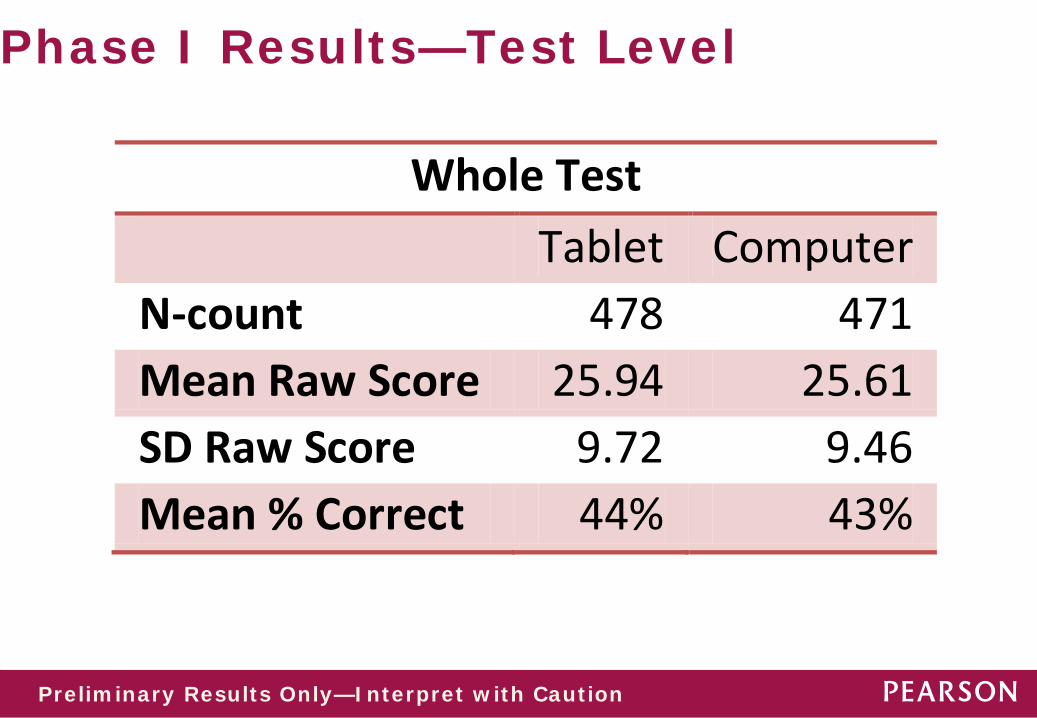
Phase I Results—Test Level
Preliminary Results Only—Interpret with Caution
Whole Test Tablet Computer N-count 478 471 Mean Raw Score 25.94 25.61 SD Raw Score 9.72 9.46 Mean % Correct 44% 43%

Phase I Results—By Subject Area
Preliminary Results Only—Interpret with Caution
Reading Tablet Computer N-count 478 471 Mean Raw Score 9.44 9.05 SD Raw Score 3.12 3.34 Mean % Correct 47% 45%
t=1.83; p=.0673

Phase I Results—By Subject Area
Preliminary Results Only—Interpret with Caution
Science Tablet Computer N-count 478 471 Mean Raw Score 9.11 9.12 SD Raw Score 3.69 3.38 Mean % Correct 43% 43%

Phase I Results—By Subject Area
Preliminary Results Only—Interpret with Caution
Mathematics Tablet Computer N-count 478 471 Mean Raw Score 7.38 7.43 SD Raw Score 4.52 4.47 Mean % Correct 41% 41%
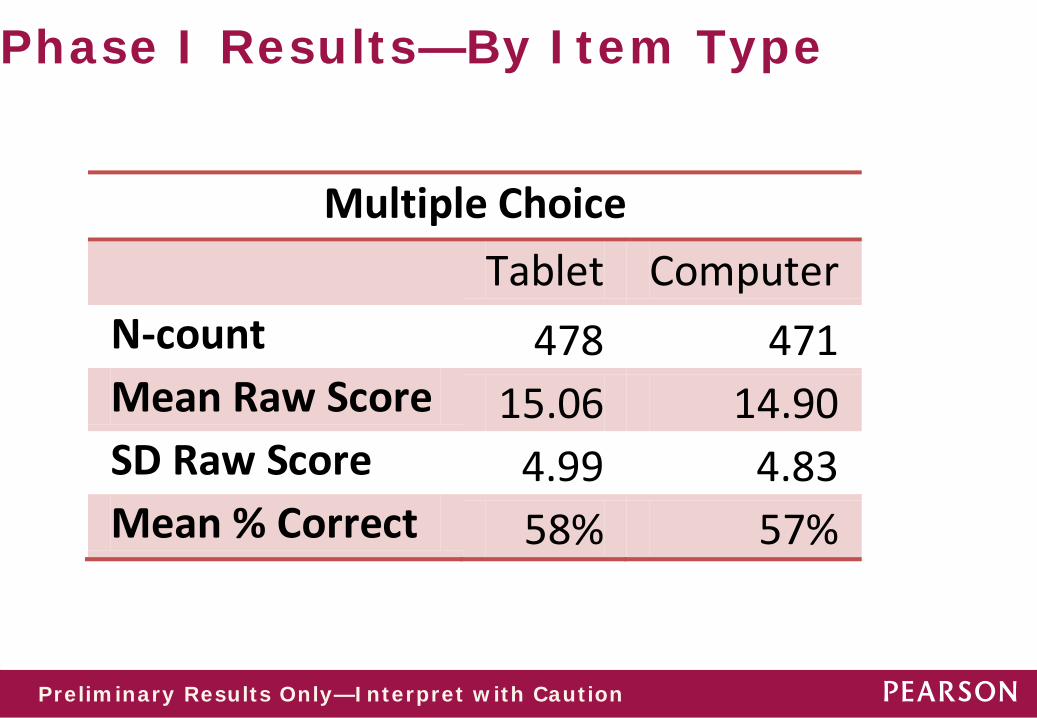
Phase I Results—By Item Type
Preliminary Results Only—Interpret with Caution
Multiple Choice Tablet Computer N-count 478 471 Mean Raw Score 15.06 14.90 SD Raw Score 4.99 4.83 Mean % Correct 58% 57%

Phase I Results—By Item Type
Preliminary Results Only—Interpret with Caution
Drag & Drop/Multiple Select Tablet Computer N-count 478 471 Mean Raw Score 6.29 6.13 SD Raw Score 3.43 3.43 Mean % Correct 27% 27%

Phase I Results—By Item Type
Preliminary Results Only—Interpret with Caution
Fill In the Blank Tablet Computer N-count 477 471 Mean Raw Score 2.75 2.75 SD Raw Score 1.93 1.96 Mean % Correct 39% 39%
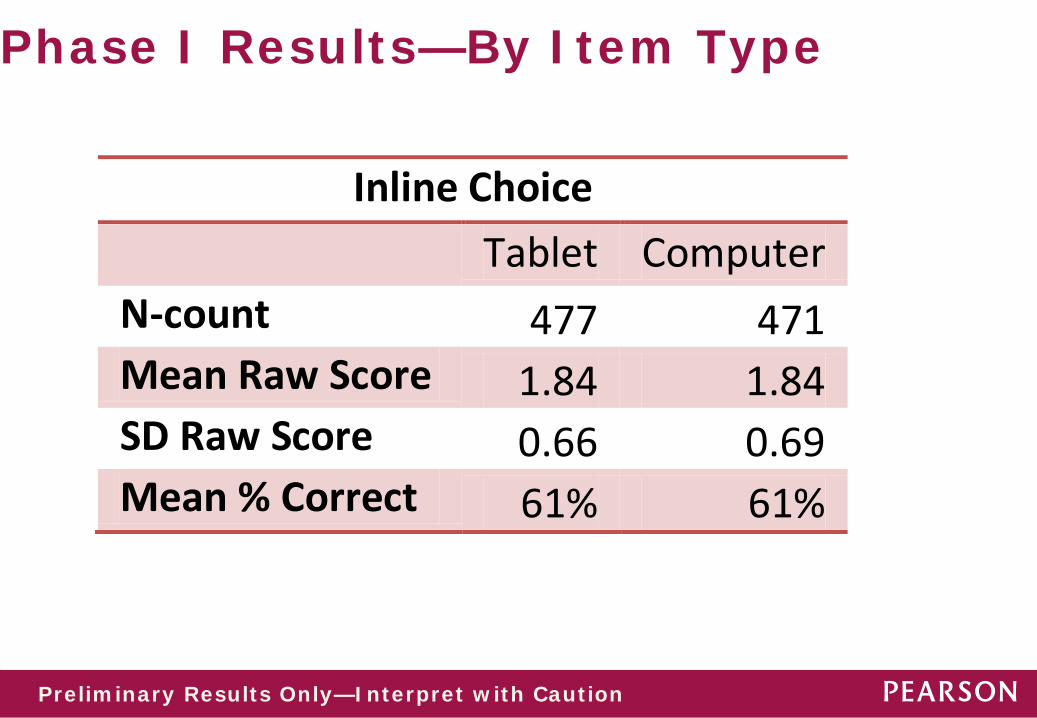
Phase I Results—By Item Type
Preliminary Results Only—Interpret with Caution
Inline Choice Tablet Computer N-count 477 471 Mean Raw Score 1.84 1.84 SD Raw Score 0.66 0.69 Mean % Correct 61% 61%
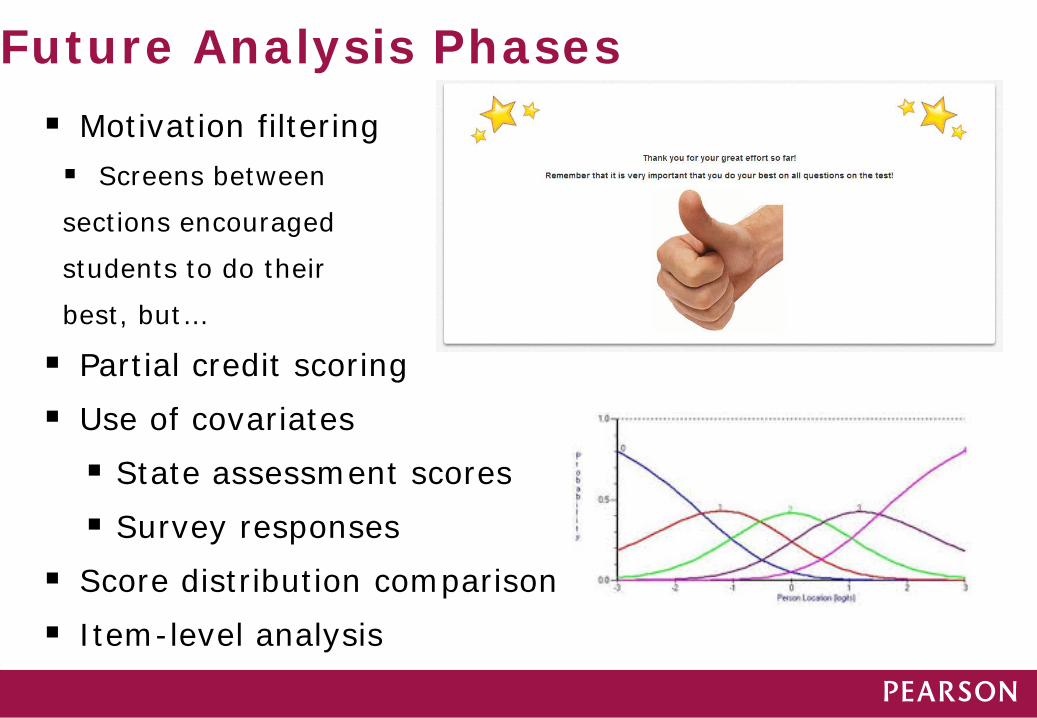
Motivation filtering Screens between
sections encouraged
students to do their
best, but…
Partial credit scoring Use of covariates State assessment scores Survey responses
Score distribution comparison Item-level analysis
Future Analysis Phases

Much analysis work yet to be done with 2014 data But no “show-stoppers” so far that would suggest we
should be concerned about testing on tablets No statistically significant differences between tablet and
computer conditions based on preliminary analyses By subject area or item type
Reading trending toward small significant effect favoring tablet—should monitor with additional data analysis But could also be “running away from” significance
Conclusions

With Thanks
Kathy Shannon—project manager extraordinaire!! Malena McBride Jadie Kong --Data analysis goddesses!!
CCSSO 2013 23

24
Want to Know More?
http://researchnetwork.pearson.com/tablets
Copyright © 2013 Pearson Education, Inc. or its affiliates. All rights reserved.