development of novel chemical biology tools to probe malaria
TRANSCRIPT
Development of Novel Chemical Biology Tools to Probe Malaria Parasite Physiology and Aid in Antimalarial Drug Discovery
by
James R. Abshire
B.S., University of Maryland – College Park (2008)
Submitted to the Department of Biological Engineering
in Partial Fulfillment of the Requirements for the Degree of
DOCTOR OF PHILOSOPHY IN BIOLOGICAL ENGINEERING
at the
MASSACHUSETTS INSTITUTE OF TECHNOLOGY
June 2015
© 2015 Massachusetts Institute of Technology. All rights reserved. Signature of Author ...........................................................................................................................
James R. Abshire Department of Biological Engineering
Certified by .......................................................................................................................................
Jacquin C. Niles Associate Professor, Department of Biological Engineering
Thesis Supervisor Accepted by.......................................................................................................................................
Forest M. White Associate Professor, Department of Biological Engineering
Co-Chair, Course XX Graduate Program Committee
2
This doctoral thesis has been examined by a committee of the Department of Biological Engineering as follows: Certified by .......................................................................................................................................
K. Dane Wittrup Professor, Departments of Chemical Engineering and Biological Engineering
Thesis Committee Chair Certified by .......................................................................................................................................
Jacquin C. Niles Associate Professor, Department of Biological Engineering
Thesis Supervisor Certified by .......................................................................................................................................
Peter C. Dedon Professor, Department of Biological Engineering
Thesis Committee Member

3
Development of Novel Chemical Biology Tools to Probe Malaria Parasite Physiology and Aid in Antimalarial Drug Discovery
by
James R. Abshire
Submitted to the Department of Biological Engineering on April 14, 2015 in partial fulfillment
of the requirements for the degree of Doctor of Philosophy in Biological Engineering ABSTRACT
Malaria remains a major burden to global public health. Antimalarial drugs are a mainstay in efforts to control and eventually eradicate this disease. However, increasing drug resistance threatens to reverse recent gains in malaria control, making the discovery of new antimalarials critical. Antimalarial discovery is especially challenging due to the unique biology of malaria parasites, the scarcity of tools for identifying new drug targets, and the poorly understood mechanisms of action of existing antimalarials. Therefore, this work describes the development of two chemical biology tools to address unmet needs in antimalarial drug discovery.
A particular challenge in antimalarial development is a shortage of validated parasite drug targets. Potent antimalarials with demonstrated clinical efficacy, like the aminoquinolines and artemisinins, represent a promising basis for rational drug development. Unfortunately, the molecular targets of these drugs have not been identified. While both are thought to interact with parasite heme, linking in vitro heme binding with drug potency remains challenging because labile heme is difficult to quantify in live cells. This work presents a novel genetically-encoded heme biosensor and describes its application to quantify labile heme in live malaria parasites and test mechanisms of antimalarial action.
Another challenge is posed by the widespread malaria parasite Plasmodium vivax, which, unlike P. falciparum, cannot be propagated in vitro, hindering research into parasite biology and drug target identification. P. vivax preferentially invades reticulocytes, which are impractical to obtain in continuous supply. The basis for this invasion tropism remains incompletely understood, mainly because current tools cannot directly link molecular binding events to invasion outcomes. This work presents novel methods for immobilizing synthetic receptors on the red blood cell surface. These receptors are used in proof-of-concept experiments to investigate requirements for efficient invasion via a well-characterized P. falciparum invasion pathway, suggesting this method can be used to elucidate molecular mechanisms underlying parasite invasion tropisms. Future receptor designs could promote the invasion of P. vivax into mature red blood cells and potentially facilitate practical in vitro culture. Taken together, these tools present new opportunities for drug discovery to aid efforts in malaria control and eventual eradication. Thesis Supervisor: Jacquin C. Niles Title: Associate Professor of Biological Engineering
4
ACKNOWLEDGEMENTS This thesis represents roughly six years of focused effort, during which I have benefited from the guidance and support of mentors, colleagues, friends, and family. I would first like to thank Doug Lauffenburger and the Department of Biological Engineering for the opportunity to pursue my graduate education at MIT. The BE department has a unique blend of exciting, diverse research and a collegial, supportive environment fostered by both the faculty and the students. I am grateful to have started my scientific career as a part of this community. I would especially like to thank my advisor, Jacquin Niles, for his support and mentorship over the past six years. During my time in his lab, Jacquin has been consistently attentive, encouraging, and thoughtful in helping me approach challenging scientific questions, design and execute research plans, and think critically about results. I would also like to thank my thesis committee, Dane Wittrup, Manoj Duraisingh, and Pete Dedon for their feedback and suggestions along the way. Additionally, I would like to acknowledge several other students, postdocs, and core facility personnel for their assistance. In particular, Ceth Parker, Helena de Puig Guixé, Prabhani Atukorale, Matthew Wohlever, Charlie Knutson, Koli Taghizadeh, Wendy Salmon, and Glenn Paradis have provided technical help in various aspects of my thesis work. Matthew Edwards and Hunter Elliott also provided valuable technical feedback. In addition, I would like to thank Professors Steven Tannenbaum, John Essigmann, Leona Samson, Darrell Irvine, Robert Sauer, Kim Hamad-Schifferli, and Lee Gehrke for use of their equipment and facilities. I would also like to extend my gratitude to the other members and alumni of the Niles Lab. Brian Belmont, Steve Goldfless, and Jeff Wagner were instrumental in much of my day-to-day training as I started working in the lab. Erika Bechtold, Chris Birch, Sumanta Dey, Suresh Ganesan, Sebastian Nasamu, Bridget Wall, and Daiying Xu all provided helpful discussions and feedback. In addition to the technical help, everyone in the lab contributed to a working environment that was both unique (with our diverse musical tastes) and enjoyable. I am also grateful to this group for their friendship both inside and outside the lab. Additionally, I would like to thank Denise MacPhail for her enthusiastic work behind the scenes helping our lab run smoothly. I would also like to thank my BE classmates and as well as my Boston-area friends for helping make my time here so enjoyable. I will always be grateful for their camaraderie and friendship during the challenging and celebratory moments of graduate school. I was fortunate to receive several fellowships that funded my education and research, including the DuPont Presidential Fellowship and the NIGMS Biotechnology Training Program Fellowship. I would especially like to acknowledge the opportunity provided by the BTP fellowship to pursue an industrial internship during my graduate studies. To that end, I would like to thank Eugene Antipov of Amyris, Inc. for his guidance as my mentor during my internship.
5
I would also like to acknowledge some of my early mentors for fostering my interests in science and engineering. I am especially grateful to Professors Daniel Stein, Ann Smith, and William Bentley for the opportunity to conduct research as an undergraduate student at the University of Maryland. Colin Hebert, a graduate student at the time, was instrumental in my early training as my mentor in the Bentley Lab. I would also like to extend my gratitude to Professor Anne Simon and Dr. Bonnie Dixon, whose engaging Biology and Organic Chemistry lectures inspired me to continue my education and explore a career in these fields. I am also grateful to Dr. Xufeng Wu and Dr. John Hammer at the National Institutes of Health for introducing me to molecular biology research and for the opportunity to learn in the Hammer Lab. I am also incredibly grateful to my family, especially to my parents, for their love and support throughout all my endeavors. Having their advice, encouragement, and perspective “just a phone call away” has been truly indispensible. Finally, I would like to thank my wonderful girlfriend Cheryl for her strength, optimism, and good humor, all of which have helped immensely.
6
ATTRIBUTIONS In addition to the general acknowledgements described above, I would like to detail several specific contributions to the work described in this thesis. The fluorescence lifetime measurements described in Chapter 2 were performed in collaboration with Professor Peter So and his postdoctoral fellow Christopher Rowlands. In addition, Suresh Ganesan built and tested several P. falciparum strains that helped inform my strain construction efforts. The text of Chapter 2 represents a collaborative writing effort between Jacquin Niles, Christopher Rowlands, and me, with input from Peter So. Finally, Professor Carolyn Bertozzi and her graduate student Jason Hudak synthesized and provided the aminooxy-functionalized reagents for several of the experiments described in Chapter 3.
7
TABLE OF CONTENTS CHAPTER 1: INTRODUCTION . . . . . . . . . . . . . . . . 11
1.1 Malaria burden and pathogenesis . . . . . . . . . . . . 11
1.2 Malaria chemotherapy and resistance . . . . . . . . . . . 13
1.3 Challenges and opportunities in antimalarial drug development . . . . 15
1.4 Heme metabolism in malaria parasites . . . . . . . . . . 16
1.4.1 Degradation of host cell hemoglobin . . . . . . . . 16
1.4.2 Heme biosynthesis and utilization . . . . . . . . 18
1.4.3 Other potential sources of parasite heme . . . . . . . 19
1.4.4 Role of heme in antimalarial potency . . . . . . . . 20
1.5 In vitro culture of P. vivax . . . . . . . . . . . . . 23
1.6 Invasion of red blood cells by malaria parasites . . . . . . . . 24
1.6.1 Overview of the invasion process . . . . . . . . . 24
1.6.2 Ligand-receptor interactions governing invasion . . . . . 26
1.6.3 Linking ligand-receptor interactions to invasion outcomes . . 27
1.7 Summary of rationale and work presented . . . . . . . . . 28
1.8 References . . . . . . . . . . . . . . . . . . 30
CHAPTER 2: DEVELOPMENT OF A NOVEL GENETICALLY-ENCODED FRET BIOSENSOR AND
QUANTIFICATION OF A LABILE CYTOSOLIC HEME POOL IN LIVE MALARIA PARASITES . . 38
2.0 Note . . . . . . . . . . . . . . . . . . . 38
2.1 Abstract . . . . . . . . . . . . . . . . . . 38
2.2 Introduction . . . . . . . . . . . . . . . . . 39
8
2.3 Methods . . . . . . . . . . . . . . . . . . 42
2.3.1 Molecular cloning . . . . . . . . . . . . . 42
2.3.2 Protein expression and purification . . . . . . . . 42
2.3.3 Absorbance titrations . . . . . . . . . . . . 43
2.3.4 Fluorescence titrations and FRET efficiency calculations . . 44
2.3.5 Fluorescence lifetime spectroscopy . . . . . . . . 44
2.3.6 Malaria parasite culture . . . . . . . . . . . 46
2.3.7 Preparation of giant multilamellar vesicles . . . . . . 46
2.3.8 In situ FRET analysis . . . . . . . . . . . . 47
2.3.9 Western immunoblotting . . . . . . . . . . . 48
2.4 Results . . . . . . . . . . . . . . . . . . . 49
2.4.1 Design and characterization of initial FRET-based heme biosensor 49
2.4.2 Optimization of initial heme biosensor design . . . . . 54
2.4.3 Correlating FRET efficiencies determined by imaging microscopy
and fluorimetry for calibrating heme concentrations . . . . 60
2.4.4 Measuring labile heme in live malaria parasites . . . . . 61
2.4.5 Quantitative analysis of perturbed heme homeostasis by
heme-interacting antimalarials . . . . . . . . . 65
2.5 Discussion . . . . . . . . . . . . . . . . . . 68
2.6 References . . . . . . . . . . . . . . . . . . 72
2.7 Appendix: MATLAB Scripts . . . . . . . . . . . . . 75
2.7.1 Calculate heme concentration and confidence intervals
from image data . . . . . . . . . . . . . 75
9
2.7.2 Calculate average heme concentration and confidence intervals
from bootstrapping data obtained from multiple experiments . 77
CHAPTER 3: USING SYNTHETIC RECEPTORS TO ELUCIDATE HOST CELL REQUIREMENTS
FOR PARASITE INVASION . . . . . . . . . . . . . . . . . 78
3.1 Abstract . . . . . . . . . . . . . . . . . . 78
3.2 Introduction . . . . . . . . . . . . . . . . . 79
3.3 Methods . . . . . . . . . . . . . . . . . . 83
3.3.1 Malaria parasite culture . . . . . . . . . . . 83
3.3.2 Neuraminidase treatment . . . . . . . . . . . 83
3.3.3 Sialyltransferase treatment . . . . . . . . . . 83
3.3.4 Oxime ligation . . . . . . . . . . . . . 84
3.3.5 Flow cytometry . . . . . . . . . . . . . 84
3.3.6 Fluorimetric sialic acid quantitation . . . . . . . . 85
3.3.7 HPLC sialic acid quantitation . . . . . . . . . . 86
3.3.8 Glycophorin extraction and biotinylation . . . . . . . 86
3.3.9 Glycophorin immobilization . . . . . . . . . . 87
3.3.10 Invasion assay . . . . . . . . . . . . . . 88
3.4 Results . . . . . . . . . . . . . . . . . . . 89
3.4.1 Effect of surface receptor density on parasite invasion rates . . 89
3.4.2 Enzymatic restoration of sialic acid receptors . . . . . 91
3.4.3 Enzymatic attachment of sialic acid receptors with an
alternate terminal linkage . . . . . . . . . . . 93

10
3.4.4 Synthetic glycan receptor construction using
aminooxy-functionalized reagents . . . . . . . . 95
3.4.5 Synthetic glycoprotein receptor construction using
biotin-NeutrAvidin interactions . . . . . . . . . 97
3.5 Discussion . . . . . . . . . . . . . . . . . . 101
3.6 References . . . . . . . . . . . . . . . . . . 104
CHAPTER 4: CONCLUSIONS AND FUTURE WORK . . . . . . . . . . . 107
4.1 Parasite heme biology . . . . . . . . . . . . . . . 107
4.2 Antimalarial drug action . . . . . . . . . . . . . . 108
4.3 Antimalarial drug discovery . . . . . . . . . . . . . 109
4.4 Heme sensing in other biological systems . . . . . . . . . 111
4.5 Synthetic receptor development . . . . . . . . . . . . 112
4.6 Towards synthetic receptor use for in vitro culture of P. vivax . . . . 114
4.7 Conclusions . . . . . . . . . . . . . . . . . 115
4.8 References . . . . . . . . . . . . . . . . . . 116

11
CHAPTER 1: INTRODUCTION
1.1 Malaria burden and pathogenesis
Malaria is an ancient parasitic disease that remains a major burden to global public health. In
2013, there were an estimated 198 million cases of malaria worldwide, which led to an estimated
584,000 deaths, mostly in young children living in sub-Saharan Africa1. Nearly half the world’s
population is at risk for malaria infection, with active disease transmission occurring in 97
countries1. While a single malaria infection can be effectively treated and cured with modern
antimalarial drugs, the widespread distribution of the disease, the possibility for repeat infections,
the limited infrastructure in the most severely affected countries, and the lack of an effective
vaccine currently preclude malaria eradication.
Malaria in humans is caused by five species of the eukaryotic parasite genus Plasmodium – P.
falciparum, P. vivax, P. knowlesi, P. malariae, and P. ovale. Of these, P. falciparum and P. vivax
are responsible for the vast majority of malaria morbidity, while P. falciparum infection accounts
for most malaria-associated deaths1. These parasites are transmitted by the bite of an infected
female Anopheles mosquito, where haploid sporozoites are injected from the mosquito’s salivary
glands, and travel to the liver of the host. Sporozoites then multiply within hepatocytes and are
released into the bloodstream as merozoites, which invade and replicate inside red blood cells. P.
vivax infections retain a population of quiescent parasites in the liver, termed hypnozoites, which
can reactivate and cause disease relapse after the blood-stage infection has been cleared2.
The blood stage of infection is solely responsible for the symptoms of malaria, which include
a recurring high fever and anemia9. During this stage, the infective merozoites bind to and invade
the red blood cell, and begin digesting the contents of the red blood cell cytosol. Parasites of this
stage, termed trophozoites, consume more than 75% of the hemoglobin from the host red blood
12
cell3 before undergoing schizogeny to produce daughter merozoites. Rupture of the schizont
releases the daughter merozoites, which can then infect other red blood cells. Once released,
merozoites are only viable for a few minutes, and typically reinvade new host red blood cells
within 90 seconds4. Haploid blood-stage parasites can also differentiate into sexual-stage
gametocytes, through a process that is not fully understood, but appears to involve epigenetic
regulation5 of gametocyte-specific transcription factors6,7. These gametocytes can then be taken
up by a mosquito during a blood meal, where fertilization and oogenesis lead to the production
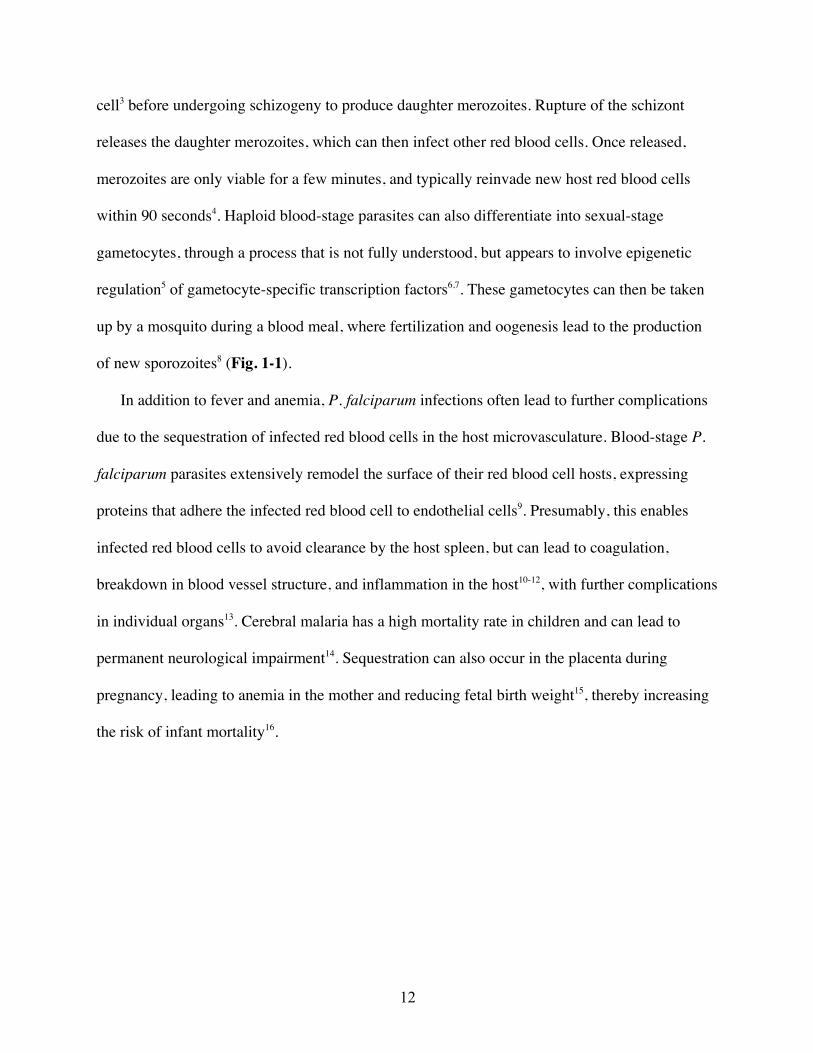
of new sporozoites8 (Fig. 1-1).
In addition to fever and anemia, P. falciparum infections often lead to further complications
due to the sequestration of infected red blood cells in the host microvasculature. Blood-stage P.
falciparum parasites extensively remodel the surface of their red blood cell hosts, expressing
proteins that adhere the infected red blood cell to endothelial cells9. Presumably, this enables
infected red blood cells to avoid clearance by the host spleen, but can lead to coagulation,
breakdown in blood vessel structure, and inflammation in the host10-12, with further complications
in individual organs13. Cerebral malaria has a high mortality rate in children and can lead to
permanent neurological impairment14. Sequestration can also occur in the placenta during
pregnancy, leading to anemia in the mother and reducing fetal birth weight15, thereby increasing
the risk of infant mortality16.
13
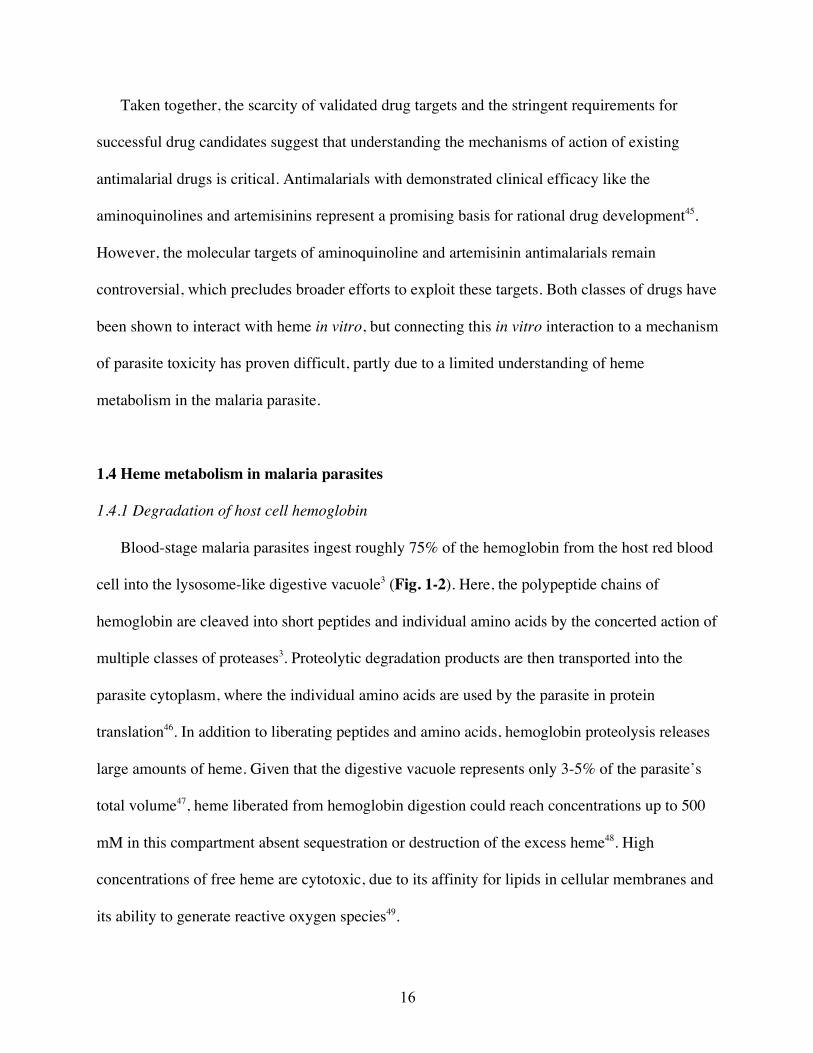
Figure 1-1. Malaria parasite life cycle in both the human host and the mosquito vector. After inoculation by an infected mosquito, sporozoites invade and replicate inside liver cells (A). Rupture of infected liver cells releases merozoites into the bloodstream, where parasites infect red blood cells (B). Blood-stage parasites can differentiate into gametocytes, which are acquired by the mosquito during a blood meal. Gametocyte fertilization occurs in the mosquito and produces new sporozoites (C). Figure from [17].
1.2 Malaria chemotherapy and resistance
Global efforts to control malaria rely on a combination of approaches. Vector control
methods, through both physical barriers (e.g. bed nets) and insecticide spraying, aim to reduce
disease transmission by preventing mosquito bites. While these methods can be effective, bed
nets must be replaced regularly, and mosquito populations can develop resistance to
insecticides18. Development is also ongoing on a variety of malaria vaccines, with over 40
candidates reaching clinical trials19. However, the most advanced vaccine candidate, which
14
targets the circumsporozoite protein20, has achieved only partial protection with approximately
31% efficacy in Phase III trials21. Therefore, chemotherapy remains a mainstay in combating
malaria.
Two of the most important classes of antimalarial drugs, the aminoquinolines and the
artemisinins, have formed the backbone of modern efforts against malaria. The potent
antimalarial activity of chloroquine was first highlighted by clinical trials in the United States
during World War II22, and chloroquine quickly became the most extensively-used antimalarial
drug23. In addition to its rapid activity against blood-stage malaria parasites, chloroquine was
easily administered, safe, and inexpensive24. The extraordinary success of chloroquine, along
with the insecticide DDT, generated optimism in the 1950s and 1960s that malaria would soon
be eradicated25. However, after extensive use as a monotherapy26, widespread resistance to
chloroquine emerged in the 1960s and 1970s, leading to a devastating resurgence of morbidity
and mortality, especially in sub-Saharan Africa27,28. Today, chloroquine is no longer
recommended to treat P. falciparum malaria due to the high rates of resistance in endemic areas29.
Interest in chloroquine remains, however, due to its unmatched combination of safety, and
affordability, and historical efficacy30.
Artemisinins, in combination with other drugs, have become the standard-of-care in treating
chloroquine-resistant malaria. Artemisinins rapidly kill all blood stages of the parasite (including
gametocytes, making them active against transmission), and exhibit the most rapid clearing of
malaria-induced fever of any antimalarial drug class31. However, artemisinin resistance, first
noted as increased parasite clearance times among patients in Cambodia32, now appears to be
spreading across Southeast Asia33. While artemisinin combination therapies are largely still
15
effective in these regions, likely due to action of their partner drugs, rates of treatment failure are
increasing33. Therefore, new antimalarial drugs are urgently needed34.
1.3 Challenges and opportunities in antimalarial drug development
Antimalarial drug discovery is especially daunting due a unique combination of scientific
and public health challenges. While an in vitro culture system for P. falciparum malaria
developed in the 1970s35 has revolutionized our understanding of parasite biology, such a system
does not exist for P. vivax. This has hindered efforts to measure efficacy of current antimalarial
drugs, and identify new drug targets34. Attempts at P. vivax culture have met with only limited
success (discussed below). Therefore, developing a practical method for in vitro culture of P.
vivax is a major priority for malaria research34,36,37.
Even with a practical in vitro culture system, drug development in P. falciparum remains
challenging. Although sequenced in 200238, the genome of P. falciparum remains poorly
understood, as the functions of many predicted gene sequences have not been determined34. In
addition, its extreme A-T richness and sparse toolkit for gene manipulation have hindered drug
development efforts. While exciting new technologies promise to accelerate this process39-41,
identifying promising drug targets remains a top priority42. In addition, public health challenges
in endemic areas place additional constraints on drug development. Future drugs must be well
tolerated when given in combination with other drugs to minimize the need for follow-up care,
which is often limited, and delay the development of resistance. Additionally, drugs must also be
orally bioavailable and rapidly cure the underlying disease to enable practical mass
administration and maximize patient compliance. Finally, drugs must be especially inexpensive
to be broadly accessible to populations in endemic areas43,44.
16
Taken together, the scarcity of validated drug targets and the stringent requirements for
successful drug candidates suggest that understanding the mechanisms of action of existing
antimalarial drugs is critical. Antimalarials with demonstrated clinical efficacy like the
aminoquinolines and artemisinins represent a promising basis for rational drug development45.
However, the molecular targets of aminoquinoline and artemisinin antimalarials remain
controversial, which precludes broader efforts to exploit these targets. Both classes of drugs have
been shown to interact with heme in vitro, but connecting this in vitro interaction to a mechanism
of parasite toxicity has proven difficult, partly due to a limited understanding of heme
metabolism in the malaria parasite.
1.4 Heme metabolism in malaria parasites 1.4.1 Degradation of host cell hemoglobin
Blood-stage malaria parasites ingest roughly 75% of the hemoglobin from the host red blood
cell into the lysosome-like digestive vacuole3 (Fig. 1-2). Here, the polypeptide chains of
hemoglobin are cleaved into short peptides and individual amino acids by the concerted action of
multiple classes of proteases3. Proteolytic degradation products are then transported into the
parasite cytoplasm, where the individual amino acids are used by the parasite in protein
translation46. In addition to liberating peptides and amino acids, hemoglobin proteolysis releases
large amounts of heme. Given that the digestive vacuole represents only 3-5% of the parasite’s
total volume47, heme liberated from hemoglobin digestion could reach concentrations up to 500
mM in this compartment absent sequestration or destruction of the excess heme48. High
concentrations of free heme are cytotoxic, due to its affinity for lipids in cellular membranes and
its ability to generate reactive oxygen species49.
17
To prevent vacuolar damage from free heme accumulation, the parasite sequesters liberated
heme into inert crystals of heme dimers termed hemozoin50,51. However, the mechanism of
hemozoin crystallization in the parasite is not completely understood. Crystallization of β-
hematin, a synthetic analogue of hemozoin, propagates readily from seed crystals in vitro,
suggesting hemozoin crystallization may be autocatalytic52. In vitro, several parasite proteins
localized to the digestive vacuole, namely histidine-rich proteins 2 and 3 (PfHRP2, 3) and heme
detoxification protein (PfHDP) have been shown to expedite the formation of hemozoin53,54.
Interestingly, while knockouts of PfHRP2 and PfHRP3 still form hemozoin55, PfHDP appears to
be essential54. Crystallization can also be nucleated by parasite-derived lipids in vitro56, which
corroborates electron microscopy data showing hemozoin crystals localized near membrane
structures in the digestive vacuole57.
Importantly, heme sequestration into hemozoin is the only known method by which parasites
can detoxify surplus heme. Recent studies in P. falciparum showed that parasites lack heme
oxygenase activity, and that the heme oxygenase-like enzyme encoded in the parasite genome
appears not to degrade heme58. Others have proposed non-enzymatic degradation pathways for
heme in the food vacuole59 and cytosol60 based on in vitro experiments, but it remains unknown
whether these reactions contribute appreciably to heme degradation in the parasite61. Finally, it is
not known whether heme liberated from hemoglobin degradation is able to escape the digestive
vacuole. The acidic pH of the digestive vacuole would tend to protonate the propionate groups of
free heme molecules, perhaps allowing them to diffuse across the vacuolar membrane48,61. Heme
may also exit the digestive vacuole via specific transporters, although none have been
definitively identified61.
18
1.4.2 Heme biosynthesis and utilization
In addition to large-scale hemoglobin degradation and crystallization of the liberated heme,
malaria parasites also contain a complete pathway for heme biosynthesis. Heme biosynthesis in
the parasite spans three organelles – the cytosol, mitochondrion, and apicoplast62,63 (Fig. 1-2).
This is likely a result of endosymbiotic events that left the parasite with two complete heme
biosynthesis pathways, where redundant functions were eliminated over time64. Heme
biosynthesis begins in the parasite mitochondrion, where a condensation reaction combines
succinyl-CoA and glycine to form δ-aminolevulinic acid (ALA). Next, ALA is converted in a
series of steps to coproporphyrinogen III in the parasite apicoplast65,66, and is then oxidized to
protoporphyrinogen IX in the cytosol67. The final conversion steps involving further oxidation
and loading with iron occur in the mitochondrion68,69. Presumably, trafficking of heme
biosynthesis intermediates between the mitochondrion, apicoplast, and cytosol relies on
transporters or specific binding proteins, as cellular membranes are generally impermeable to
these compounds70. How these intermediates are trafficked between parasite organelles remains
to be elucidated62.
The parasite genome encodes only a small number of known hemoproteins38,63,71. Multiple
cytochromes are present in the parasite mitochondrion and function in the electron transport
chain, which appears to be essential for parasite survival. Atovaquone, which binds to
cytochrome b and inhibits electron transport72 is toxic to the parasite73, while certain mutations in
cytochrome b can render parasites atovaquone-resistant74. The electron transport chain is
required, however, for regenerating ubiquinone, the electron acceptor for dihydroorotate
dehydrogenase (DHOD) during pyrimidine biosynthesis. Expressing a yeast DHOD, which is
cytosolic and operates independently of ubiquinone, renders parasites insensitive to atovaquone75,
19
suggesting that other functions of mitochondrial electron transport (such as ATP generation) are
dispensable. While the parasite genome encodes orthologues of cytochrome b5, the functions of
these proteins have not been determined63. Binding to heme has also been demonstrated with
other recombinantly-expressed parasite proteins76, but the physiological relevance of these
interactions has not been specifically addressed61.
1.4.3 Other potential sources of parasite heme
Recent evidence suggests that blood-stage parasites can meet their metabolic needs without
synthesizing heme de novo. First, the penultimate enzyme of the heme biosynthesis pathway,
protoporphyrinogen IX oxidase, requires an electron acceptor coupled to the mitochondrial
electron transport chain68. Given that parasites expressing yeast DHOD survive electron transport
inhibition with atovoquone75, protoporphyrinogen IX oxidase activity appears not to be required
for growth. Other steps in the heme biosynthesis pathway appear dispensable, as well. Double-
crossover knockouts of the first and last enzymes in the heme biosynthesis pathway (δ-
aminolevulinic acid synthase and ferrochelatase, respectively) have been successfully generated
in blood-stage P. berghei77 and P. falciparum78 parasites, which grew normally but were unable
to progress to the mosquito stages, suggesting that heme biosynthesis is only required for the
exoerythrocytic stages of the parasite life cycle.
Therefore, blood-stage parasites are likely able to obtain heme from other sources. In a recent
study, radiolabeled hemoglobin-heme (obtained by incubating mouse reticulocytes with 14C-
ALA) was found in the mitochondrial cytochromes of ferrochelatase-null P. berghei parasites77,
suggesting that hemoglobin-heme can be trafficked outside the digestive vacuole. Additionally, a
micromolar pool of “free” heme has been indirectly measured in the cytosol of erythrocytes79,

20
which may be accessible to the parasite63. Studies with zinc protoporphyrin IX suggest that
parasites in culture can accumulate protoporphyrins added to the extracellular media80, which
may represent another pathway for scavenging. Finally, heme escape from the digestive vacuole
has been suggested, based on the ability of several cytosolic parasite proteins (especially
glyceraldehyde-3-phosphate dehydrogenase [GAPDH] and thioredoxin reductase [TrxR]) to bind
and be regulated by heme76. However, mechanistic details regarding these proposed trafficking
pathways remain to be elucidated.
1.4.4 Role of heme in antimalarial potency
Multiple classes of antimalarial drugs are known to interact with heme. Artemisinin and its
derivatives are potent drugs extensively used for treating P. falciparum malaria. Artemisinin
activity requires an endoperoxide moiety81 which is thought to undergo iron-assisted reductive
cleavage in the parasite to form damaging radicals82. Recent experiments have shown that
inhibiting hemoglobin degradation attenuates artemisinin toxicity83, as does iron chelation84,
implicating heme and ferrous iron as potential activators in the parasite. However, the
mechanism of artemisinin activation remains incompletely understood, partly due to an inability
to quantify pools of labile heme or labile iron in the parasite. Elucidating this mechanism is
particularly critical given the potency of the artemisinins, which is not well understood, and the
recent emergence of artemisinin resistance33. Mechanistic study of artemisinin action could aid in
developing additional artemisinin derivatives and identify validated molecular targets for new
antimalarials.
Chloroquine, in particular, has been one of the most potent and successful drugs ever
developed against an infectious disease25, despite the devastating spread of resistance in the
21
1960s and 1970s85. However, the mechanism(s) of chloroquine action remain controversial.
Chloroquine has been shown to accumulate significantly in the digestive vacuoles of treated
parasites86. In vitro, chloroquine binds both free87 and exposed heme on growing hemozoin
crystals88 and inhibits crystal growth. Additionally, chloroquine-treated parasites contain less
detectable hemozoin89-91, and higher amounts of heme unassociated with hemozoin or
hemoglobin91. Recently, increased extravacuolar iron density has also been observed in
chloroquine-treated parasites91. Taken together, these results support a model where the heme-
chloroquine complex blocks heme detoxification to hemozoin in the digestive vacuole and
causes free heme to accumulate in the parasite. However, a direct link between chloroquine and
toxicity through accumulation of unbound heme has not been demonstrated, partly due to the
inability to reliably quantify unbound heme in live cells.
Other effects of chloroquine treatment have been observed in a series of in vitro and in situ
experiments. Chloroquine has been proposed to target polyamine biosynthesis based on its
activity against ornithine decarboxylase in cultured parasites92. Chloroquine has also shown
inhibitory activity against protein synthesis both in cell-free extracts and in cultured parasites93.
In vitro, chloroquine has been shown to inhibit proteases involved in hemoglobin degradation94,
and to inhibit proposed heme degradation pathways involving hydrogen peroxide59 and
glutathione95. However, the extent to which these interactions contribute to parasite toxicity are
not known. Furthermore, recent studies with chloroquine analogues found that the inhibition of
hemozoin formation was correlated with cytostatic but not cytocidal activity96, suggesting that
chloroquine toxicity may be the result of multiple mechanisms. Further studies are needed to
dissect the mechanism of chloroquine cytotoxicity and elucidate the role(s) played by heme.
22
Resistance to chloroquine has been mapped to mutations in the P. falciparum chloroquine
resistance transporter (PfCRT)97,98, a transmembrane protein associated with the digestive
vacuolar membrane99. While the native role of PfCRT is not known, bioinformatic studies have
suggested a possible function as a transporter of small molecules100,101. Similarly, the role of
PfCRT in determining chloroquine resistance has not been fully defined. Less chloroquine
appears to accumulate in chloroquine-resistant parasites expressing mutant PfCRT than in
sensitive strains102, and similar results have been obtained in experiments using isolated digestive
vacuoles103. This suggests that resistance may be mediated primarily by reducing parasite
exposure to chloroquine, and therefore chloroquine’s mechanism(s) of action may hold promise
for future antimalarial development.
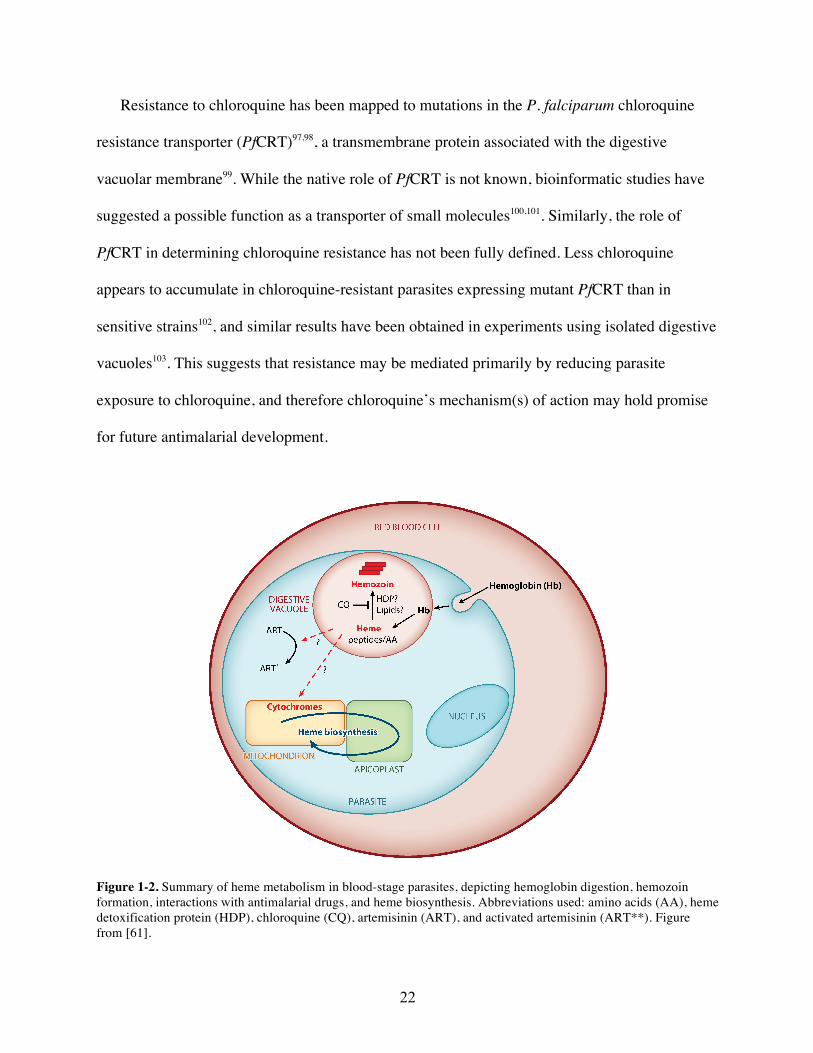
Figure 1-2. Summary of heme metabolism in blood-stage parasites, depicting hemoglobin digestion, hemozoin formation, interactions with antimalarial drugs, and heme biosynthesis. Abbreviations used: amino acids (AA), heme detoxification protein (HDP), chloroquine (CQ), artemisinin (ART), and activated artemisinin (ART**). Figure from [61].
23
1.5 In vitro culture of P. vivax
A landmark 1976 study established a method for continuously propagating P. falciparum
cultures using human red blood cells35, which are readily available. This discovery was critical in
subsequent research into P. falciparum biology, and as of early 2015, had been cited in over
5,000 articles (statistic from Web of Science). However, such a system does not exist for P. vivax,
which is currently impractical to culture in vitro because it preferentially invades reticulocytes
(immature red blood cells)104, which constitute between 0.5% and 1.5% of the circulating cells in
human peripheral blood105. In contrast, P. falciparum invades both reticulocytes and mature red
blood cells efficiently106. Furthermore, reticulocytes mature rapidly into normocytes in vitro, with
a half-life of approximately 30 hours107. Therefore, propagating P. vivax relies on a continuous
supply of a rare and transient blood component to maintain an adequate population of invadable
cells. Studies reporting P. vivax propagation without enriched reticulocytes were either of very
short duration108-112, could not maintain high parasitemia113, or could not be reproduced114,115.
Obtaining enriched reticulocytes for P. vivax culture is difficult and costly. In one study,
reticulocytes were supplied from the blood of a hemochromatosis patient being treated by
therapeutic phlebotomy and enriched by centrifuging the blood cells in homologous plasma.
While this technique resulted in stable P. vivax propagation over a two-week period, total
reticulocyte yields were low (< 20%)105, and these results have not been replicated in other
groups115. Human umbilical cord blood, which is also naturally enriched in reticulocytes, has also
been used for continuous P. vivax culture up to two months116-118. However, these techniques
were unable to maintain high parasitemia. In both cases, these techniques required continuous
access to patient-derived samples that are not readily available. Reticulocytes can also be
generated by differentiating hematopoietic stem cells (HSCs) derived from cord blood, and HSC-
24
derived reticulocytes have been shown to be usable in P. vivax culture119,120. However, this
method is labor-intensive, as HSCs require two weeks of culture to mature into reticulocytes, and
expensive, due to the mixture of growth factors and cytokines required121. Parasites can be
obtained for brief ex vivo studies from infected research animals, as P. vivax also infects New
World monkeys of the Saimiri and Aotus genera105,122. However, maintaining infected research
animals (especially primates) is often cost-prohibitive and raises ethical concerns. In contrast to
these existing methods, an ideal culturing system would propagate this parasite continuously
using human normocytes and other reagents that are readily and inexpensively available.
However, this would depend on overcoming the P. vivax preference for invading reticulocytes,
the basis of which is only partially understood.
1.6 Invasion of red blood cells by malaria parasites
1.6.1 Overview of the invasion process
During the blood stage of malaria infection, parasites bind to and invade red blood cells in a
multi-step process (Fig. 1-3)123. Merozoites released from a bursting schizont quickly associate
with erythrocytes, averaging less than 40 seconds between schizont rupture and contact with a
potential host cell4. This initial contact is mediated by long distance and relatively low-affinity
interactions and can occur with the merozoite in any orientation124. Invasion proteins are then
released to the merozoite surface from secretory organelles termed rhoptries and micronemes,
which are located at the apical end of the merozoite125. Secretion of invasion proteins occurs
shortly before the proteins are needed, which minimizes exposure to the host’s immune system
and slows the development of an immune response126.
25
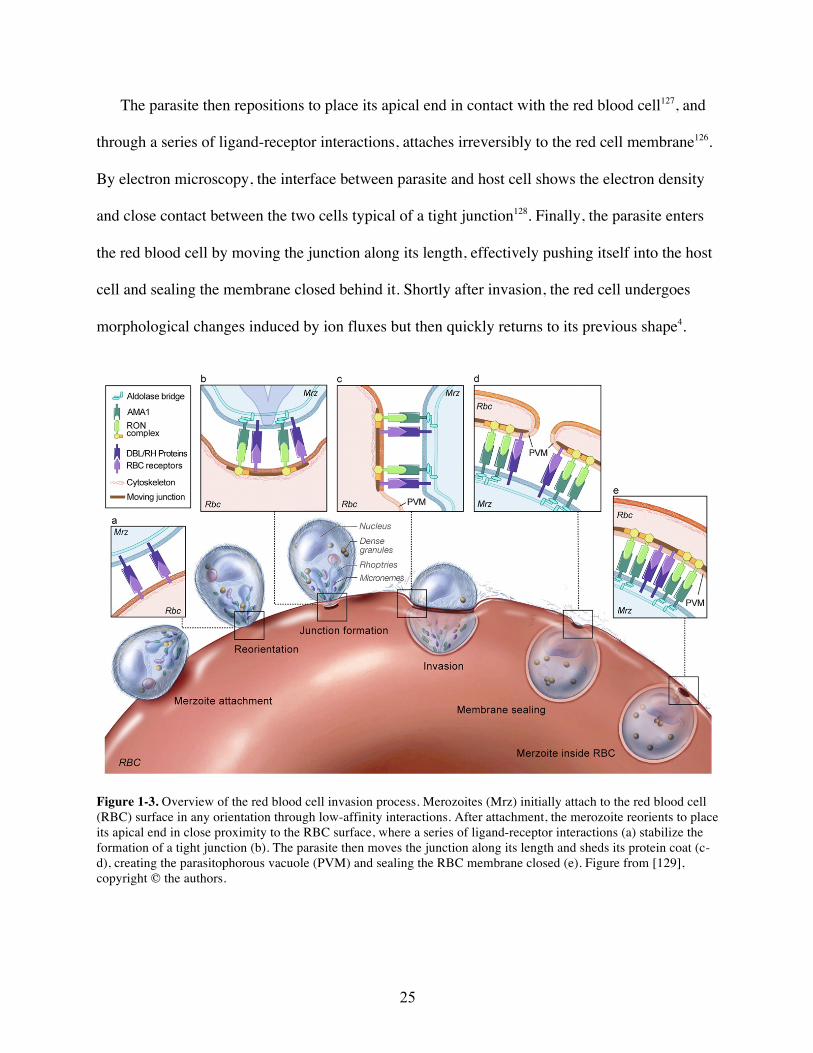
The parasite then repositions to place its apical end in contact with the red blood cell127, and
through a series of ligand-receptor interactions, attaches irreversibly to the red cell membrane126.
By electron microscopy, the interface between parasite and host cell shows the electron density
and close contact between the two cells typical of a tight junction128. Finally, the parasite enters
the red blood cell by moving the junction along its length, effectively pushing itself into the host
cell and sealing the membrane closed behind it. Shortly after invasion, the red cell undergoes
morphological changes induced by ion fluxes but then quickly returns to its previous shape4.
Figure 1-3. Overview of the red blood cell invasion process. Merozoites (Mrz) initially attach to the red blood cell (RBC) surface in any orientation through low-affinity interactions. After attachment, the merozoite reorients to place its apical end in close proximity to the RBC surface, where a series of ligand-receptor interactions (a) stabilize the formation of a tight junction (b). The parasite then moves the junction along its length and sheds its protein coat (c-d), creating the parasitophorous vacuole (PVM) and sealing the RBC membrane closed (e). Figure from [129], copyright © the authors.

26
1.6.2 Ligand-receptor interactions governing invasion
Ligand-receptor interactions that precede tight junction formation define the cell types that
can be invaded by the merozoite and irreversibly begin the invasion process126,130,131 (Fig. 1-3).
Two families of parasite ligands have been identified: the Duffy-binding like (DBL) and
reticulocyte-binding like homologues (Rh), which originate in micronemes132,133 and rhoptries134,
respectively, before release to the merozoite surface. DBL-family proteins are homologous to P.
vivax proteins that bind to the Duffy antigen and mediate invasion135,136. The Rh proteins are
homologous to a family of P. vivax proteins that bind to reticulocytes137,138, and are believed to
underlie the parasite’s reticulocyte-specific invasion tropism, although their cognate receptors
have not yet been identified.
Like P. vivax, P. falciparum expresses ligands from both the DBL and Rh families. Ligand
expression varies by strain, allowing strain-specific differences in host cell preference for
invasion139. The DBL-family proteins EBA-175 (for Erythrocyte Binding Antigen, 175 kDa),
EBA-140, and EBA-181 mediate interactions with sialylated receptors on the red blood cell
surface140. EBA-175 binding to glycophorin A is likely the dominant interaction, as deleting
EBA-175 from a sialic acid-dependent strain results in a switch to sialic acid-independent
pathways for invasion139. Structural data showing EBA-175 co-crystallized with sialyllactose
demonstrates glycan contacts with two DBL domains, suggesting that dimerization of EBA-175
is also important for receptor binding141. Additionally, inhibition studies with glycophorin A
peptides demonstrate that the glycophorin A protein backbone participates in binding, either by
direct contacts to EBA-175 or by maintaining a specific conformation of sialic acid residues140.
27
P. falciparum can also invade host red blood cells through sialic acid-independent pathways
mediated by Rh-family proteins. Of these, only the receptors for PfRh4 (complement receptor
1)142 and PfRh5 (basigin)143 have been identified. PfRh5 appears unique in that it cannot be
disrupted and has limited homology to other proteins in the Rh family, suggesting that it may
have an unrelated function144,145
After engaging receptors on the red cell surface through DBL and Rh-family proteins,
parasites then secrete additional rhoptry proteins into the membrane of the host red blood cell146.
These proteins (termed RONs, for their apparent origin in the rhoptry neck) form a complex that
provides a high-affinity anchor for the merozoite147. The merozoite protein AMA-1 (for Apical
Membrane Antigen-1) then binds to RON2 to form the tight junction and initiate invasion129.
1.6.3 Linking ligand-receptor interactions to invasion outcomes
While multiple ligand-receptor interactions have been identified, it has remained challenging
to link individual binding events to invasion outcomes. Although P. vivax expresses ligands that
preferentially bind reticulocytes, it is unclear whether this preferential binding is solely
responsible for the inability of P. vivax to efficiently invade mature red blood cells. Current
techniques to link ligand-receptor interactions with invasion outcomes rely on protease or
glycosylase treatments that cleave necessary receptors from the host cell surface, or inhibit
binding interactions with soluble competitors. These interventions are limited in their specificity:
protease and glycosylase treatments remove broad classes of receptors from the host cell surface,
and soluble competitors are often added at high concentrations in order to inhibit invasion.
Synthetic receptors represent a promising potential strategy for linking binding events to
invasion outcomes. Providing a specific receptor in trans and promoting invasion into an
28
otherwise-refractory cell type would provide conclusive evidence that particular ligand-receptor
interaction(s) are necessary and/or sufficient for a given invasion tropism. In the case of P.
falciparum, synthetic receptors could demonstrate causal links between engaging various DBL or
Rh proteins and strain-specific invasion preferences. In the case of P. vivax, synthetic receptors
could demonstrate whether engaging the reticulocyte-binding proteins is sufficient to promote
invasion into Duffy-positive mature red blood cells, and potentially facilitate culture system
development.
1.7 Summary of rationale and work presented
This thesis documents the development of novel chemical biology tools to address critical
needs in antimalarial drug discovery. Among these are validated molecular targets to guide drug
discovery efforts. Some of the most potent and successful antimalarial drugs are thought to
interact with parasite heme, although their mechanisms of action remain controversial.
Elucidating the mechanisms of action of these drugs, in the context of a broader understanding of
parasite heme metabolism, would identify validated targets for future drug development efforts.
Currently, heme metabolism and the action of heme-binding drugs are poorly understood
because heme is difficult to quantify in situ. Chapter 2 describes the development of a novel
genetically-encoded biosensor for quantifying labile heme in live cells, and applications in P.
falciparum to derive new insights about parasite heme metabolism and antimalarial drug action.
Another critical need is a method for in vitro propagation of blood-stage P. vivax, which is
currently impractical due to its preference for invading reticulocytes. The molecular basis for this
preference is incompletely understood, precluding culture system development. Chapter 3
describes a chemoenzymatic toolkit for displaying synthetic receptors on the surface of the red
blood cell, which can be used to link molecular interactions with invasion outcomes. Proof-of-

29
concept experiments in P. falciparum demonstrate the utility of this approach for elucidating
structural requirements in a well-understood invasion pathway, and define rules for developing
future synthetic receptor technologies geared towards facilitating in vitro culture of P. vivax
parasites in mature erythrocytes.
30
1.8 References
1. WHO Global Malaria Programme. World Malaria Report 2014. (World Health Organization).
2. Krotoski, W. A. et al. Demonstration of hypnozoites in sporozoite-transmitted Plasmodium vivax infection. Am J Trop Med Hyg 31, 1291–1293 (1982).
3. Goldberg, D. E. Hemoglobin degradation. Curr Top Microbiol Immunol 295, 275–291 (2005).
4. Gilson, P. R. & Crabb, B. S. Morphology and kinetics of the three distinct phases of red blood cell invasion by Plasmodium falciparum merozoites. Int J Parasitol 39, 91–96 (2009).
5. Brancucci, N. M. B. et al. Heterochromatin protein 1 secures survival and transmission of malaria parasites. Cell Host Microbe 16, 165–176 (2014).
6. Kafsack, B. F. C. et al. A transcriptional switch underlies commitment to sexual development in malaria parasites. Nature 507, 248–252 (2014).
7. Sinha, A. et al. A cascade of DNA-binding proteins for sexual commitment and development in Plasmodium. Nature 507, 253–257 (2014).
8. Ghosh, A., Edwards, M. J. & Jacobs-Lorena, M. The journey of the malaria parasite in the mosquito: hopes for the new century. Parasitol. Today (Regul. Ed.) 16, 196–201 (2000).
9. Miller, L. H., Baruch, D. I., Marsh, K. & Doumbo, O. K. The pathogenic basis of malaria. Nature 415, 673–679 (2002).
10. Francischetti, I. M. B., Seydel, K. B. & Monteiro, R. Q. Blood coagulation, inflammation, and malaria. Microcirculation 15, 81–107 (2008).
11. Moxon, C. A., Heyderman, R. S. & Wassmer, S. C. Dysregulation of coagulation in cerebral malaria. Mol Biochem Parasitol 166, 99–108 (2009).
12. Miller, L. H., Ackerman, H. C., Su, X.-Z. & Wellems, T. E. Malaria biology and disease pathogenesis: insights for new treatments. Nature medicine 19, 156–167 (2013).
13. Smith, J. D., Rowe, J. A., Higgins, M. K. & Lavstsen, T. Malaria's deadly grip: cytoadhesion of Plasmodium falciparum-infected erythrocytes. Cell Microbiol 15, 1976–1983 (2013).
14. Idro, R., Marsh, K., John, C. C. & Newton, C. R. J. Cerebral malaria: mechanisms of brain injury and strategies for improved neurocognitive outcome. Pediatr. Res. 68, 267–274 (2010).
15. Steketee, R. W., Nahlen, B. L., Parise, M. E. & Menendez, C. The burden of malaria in pregnancy in malaria-endemic areas. Am J Trop Med Hyg 64, 28–35 (2001).
16. McCormick, M. C. The contribution of low birth weight to infant mortality and childhood morbidity. N. Engl. J. Med. 312, 82–90 (1985).
17. da Silva, A. J. & Moser, M. Malaria. (2002). ID #3405 at <http://phil.cdc.gov/> 18. Liu, N. Insecticide resistance in mosquitoes: impact, mechanisms, and research
directions. Annu. Rev. Entomol. 60, 537–559 (2015). 19. Schwartz, L., Brown, G. V., Genton, B. & Moorthy, V. S. A review of malaria vaccine
clinical projects based on the WHO rainbow table. Malar J 11, 11 (2012). 20. Vekemans, J., Leach, A. & Cohen, J. Development of the RTS,S/AS malaria candidate
vaccine. Vaccine 27 Suppl 6, G67–71 (2009). 21. RTS,S Clinical Trials Partnership et al. A phase 3 trial of RTS,S/AS01 malaria vaccine
31
in African infants. N. Engl. J. Med. 367, 2284–2295 (2012). 22. Loeb, F. et al. ACTIVITY OF A NEW ANTIMALARIAL AGENT, CHLOROQUINE
(SN 7618): Statement Approved by the Board for Coordination of Malarial Studies. JAMA 130, 1069–1070 (1946).
23. Slater, A. F. Chloroquine: mechanism of drug action and resistance in Plasmodium falciparum. Pharmacol. Ther. 57, 203–235 (1993).
24. Sá, J. M., Chong, J. L. & Wellems, T. E. Malaria drug resistance: new observations and developments. Essays Biochem 51, 137–160 (2011).
25. Wellems, T. E. & Plowe, C. V. Chloroquine-resistant malaria. J Infect Dis 184, 770–776 (2001).
26. D'Alessandro, U. & Buttiëns, H. History and importance of antimalarial drug resistance. Trop. Med. Int. Health 6, 845–848 (2001).
27. Trape, J. F. et al. Impact of chloroquine resistance on malaria mortality. C. R. Acad. Sci. III, Sci. Vie 321, 689–697 (1998).
28. Marsh, K. Malaria disaster in Africa. Lancet 352, 924 (1998). 29. Wells, T. N. C., Alonso, P. L. & Gutteridge, W. E. New medicines to improve control
and contribute to the eradication of malaria. Nat Rev Drug Discov 8, 879–891 (2009). 30. Ecker, A., Lehane, A. M., Clain, J. & Fidock, D. A. PfCRT and its role in antimalarial
drug resistance. Trends Parasitol 28, 504–514 (2012). 31. Meshnick, S. R., Taylor, T. E. & Kamchonwongpaisan, S. Artemisinin and the
antimalarial endoperoxides: from herbal remedy to targeted chemotherapy. Microbiol. Rev. 60, 301–315 (1996).
32. Noedl, H. et al. Evidence of artemisinin-resistant malaria in western Cambodia. N. Engl. J. Med. 359, 2619–2620 (2008).
33. Ashley, E. A. et al. Spread of artemisinin resistance in Plasmodium falciparum malaria. N. Engl. J. Med. 371, 411–423 (2014).
34. malERA Consultative Group on Basic Science and Enabling Technologies. A research agenda for malaria eradication: basic science and enabling technologies. PLoS Medicine 8, e1000399 (2011).
35. Trager, W. & Jensen, J. B. Human malaria parasites in continuous culture. Science 193, 673–675 (1976).
36. Mueller, I. et al. Key gaps in the knowledge of Plasmodium vivax, a neglected human malaria parasite. The Lancet Infectious Diseases 9, 555–566 (2009).
37. Price, R. et al. Vivax Malaria: Neglected and Not Benign. American Journal of Tropical Medicine and Hygiene 77, 79 (2007).
38. Gardner, M. J. et al. Genome sequence of the human malaria parasite Plasmodium falciparum. Nature 419, 498–511 (2002).
39. Armstrong, C. M. & Goldberg, D. E. An FKBP destabilization domain modulates protein levels in Plasmodium falciparum. Nature Methods 4, 1007–1009 (2007).
40. Goldfless, S. J., Wagner, J. C. & Niles, J. C. Versatile control of Plasmodium falciparum gene expression with an inducible protein-RNA interaction. Nat Commun 5, 5329 (2014).
41. Wagner, J. C., Platt, R. J., Goldfless, S. J., Zhang, F. & Niles, J. C. Efficient CRISPR-Cas9-mediated genome editing in Plasmodium falciparum. Nature Methods 11, 915–918 (2014).
42. Wells, T. N. & Poll, E. M. When is enough enough? The need for a robust pipeline of high-quality antimalarials. Discov Med 9, 389–398 (2010).
32
43. Nwaka, S. & Hudson, A. Innovative lead discovery strategies for tropical diseases. Nat Rev Drug Discov 5, 941–955 (2006).
44. Gelb, M. H. Drug discovery for malaria: a very challenging and timely endeavor. Current Opinion in Chemical Biology 11, 440–445 (2007).
45. O'Neill, P. M. et al. Isoquine and related amodiaquine analogues: a new generation of improved 4-aminoquinoline antimalarials. J. Med. Chem. 46, 4933–4945 (2003).
46. Rosenthal, P. J. & Meshnick, S. R. Hemoglobin catabolism and iron utilization by malaria parasites. Mol Biochem Parasitol 83, 131–139 (1996).
47. Yayon, A., Timberg, R., Friedman, S. & Ginsburg, H. Effects of chloroquine on the feeding mechanism of the intraerythrocytic human malarial parasite Plasmodium falciparum. J. Protozool. 31, 367–372 (1984).
48. Becker, K. et al. Oxidative stress in malaria parasite-infected erythrocytes: host-parasite interactions. Int J Parasitol 34, 163–189 (2004).
49. Jeney, V. et al. Pro-oxidant and cytotoxic effects of circulating heme. Blood 100, 879–887 (2002).
50. Pagola, S., Stephens, P. W., Bohle, D. S., Kosar, A. D. & Madsen, S. K. The structure of malaria pigment beta-haematin. Nature 404, 307–310 (2000).
51. Egan, T. J. et al. Fate of haem iron in the malaria parasite Plasmodium falciparum. Biochem J 365, 343–347 (2002).
52. Dorn, A., Stoffel, R., Matile, H., Bubendorf, A. & Ridley, R. G. Malarial haemozoin/beta-haematin supports haem polymerization in the absence of protein. Nature 374, 269–271 (1995).
53. Sullivan, D. J., Gluzman, I. Y. & Goldberg, D. E. Plasmodium hemozoin formation mediated by histidine-rich proteins. Science 271, 219–222 (1996).
54. Jani, D. et al. HDP-a novel heme detoxification protein from the malaria parasite. PLoS Pathog 4, e1000053 (2008).
55. Sullivan, D. J. Theories on malarial pigment formation and quinoline action. Int J Parasitol 32, 1645–1653 (2002).
56. Bendrat, K., Berger, B. J. & Cerami, A. Haem polymerization in malaria. Nature 378, 138–139 (1995).
57. Hempelmann, E., Motta, C., Hughes, R., Ward, S. A. & Bray, P. G. Plasmodium falciparum: sacrificing membrane to grow crystals? Trends Parasitol 19, 23–26 (2003).
58. Sigala, P. A., Crowley, J. R., Hsieh, S., Henderson, J. P. & Goldberg, D. E. Direct Tests of Enzymatic Heme Degradation by the Malaria Parasite Plasmodium falciparum. J Biol Chem 287, 37793–37807 (2012).
59. Loria, P., Miller, S., Foley, M. & Tilley, L. Inhibition of the peroxidative degradation of haem as the basis of action of chloroquine and other quinoline antimalarials. Biochem J 339 ( Pt 2), 363–370 (1999).
60. Atamna, H. & Ginsburg, H. Heme degradation in the presence of glutathione. A proposed mechanism to account for the high levels of non-heme iron found in the membranes of hemoglobinopathic red blood cells. J Biol Chem 270, 24876–24883 (1995).
61. Sigala, P. A. & Goldberg, D. E. The peculiarities and paradoxes of Plasmodium heme metabolism. Annu. Rev. Microbiol. 68, 259–278 (2014).
62. Lim, L. & McFadden, G. I. The evolution, metabolism and functions of the apicoplast. Philos. Trans. R. Soc. Lond., B, Biol. Sci. 365, 749–763 (2010).
33
63. van Dooren, G. G., Kennedy, A. T. & Mcfadden, G. I. The use and abuse of heme in apicomplexan parasites. Antioxid Redox Signal 17, 634–656 (2012).
64. Ralph, S. A. et al. Tropical infectious diseases: metabolic maps and functions of the Plasmodium falciparum apicoplast. Nat. Rev. Microbiol. 2, 203–216 (2004).
65. Sato, S., Clough, B., Coates, L. & Wilson, R. J. M. Enzymes for heme biosynthesis are found in both the mitochondrion and plastid of the malaria parasite Plasmodium falciparum. Protist 155, 117–125 (2004).
66. Nagaraj, V. A. et al. Localisation of Plasmodium falciparum uroporphyrinogen III decarboxylase of the heme-biosynthetic pathway in the apicoplast and characterisation of its catalytic properties. Int J Parasitol 39, 559–568 (2009).
67. Nagaraj, V. A., Prasad, D., Arumugam, R., Rangarajan, P. N. & Padmanaban, G. Characterization of coproporphyrinogen III oxidase in Plasmodium falciparum cytosol. Parasitology International 59, 121–127 (2010).
68. Nagaraj, V. A., Arumugam, R., Prasad, D., Rangarajan, P. N. & Padmanaban, G. Protoporphyrinogen IX oxidase from Plasmodium falciparum is anaerobic and is localized to the mitochondrion. Mol Biochem Parasitol 174, 44–52 (2010).
69. Nagaraj, V. A., Prasad, D., Rangarajan, P. N. & Padmanaban, G. Mitochondrial localization of functional ferrochelatase from Plasmodium falciparum. Mol Biochem Parasitol 168, 109–112 (2009).
70. Severance, S. & Hamza, I. Trafficking of heme and porphyrins in metazoa. Chem Rev 109, 4596–4616 (2009).
71. Kořený, L., Oborník, M. & Lukeš, J. Make it, take it, or leave it: heme metabolism of parasites. PLoS Pathog 9, e1003088 (2013).
72. Kessl, J. J. et al. Molecular basis for atovaquone binding to the cytochrome bc1 complex. J Biol Chem 278, 31312–31318 (2003).
73. Srivastava, I. K., Rottenberg, H. & Vaidya, A. B. Atovaquone, a broad spectrum antiparasitic drug, collapses mitochondrial membrane potential in a malarial parasite. J Biol Chem 272, 3961–3966 (1997).
74. Srivastava, I. K., Morrisey, J. M., Darrouzet, E., Daldal, F. & Vaidya, A. B. Resistance mutations reveal the atovaquone-binding domain of cytochrome b in malaria parasites. Mol Microbiol 33, 704–711 (1999).
75. Painter, H. J., Morrisey, J. M., Mather, M. W. & Vaidya, A. B. Specific role of mitochondrial electron transport in blood-stage Plasmodium falciparum. Nature 446, 88–91 (2007).
76. Campanale, N. et al. Identification and characterization of heme-interacting proteins in the malaria parasite, Plasmodium falciparum. J Biol Chem 278, 27354–27361 (2003).
77. Nagaraj, V. A. et al. Malaria parasite-synthesized heme is essential in the mosquito and liver stages and complements host heme in the blood stages of infection. PLoS Pathog 9, e1003522 (2013).
78. Ke, H. et al. The heme biosynthesis pathway is essential for Plasmodium falciparum development in mosquito stage but not in blood stages. Journal of Biological Chemistry 289, 34827–34837 (2014).
79. Liu, S. C., Zhai, S. & Palek, J. Detection of hemin release during hemoglobin S denaturation. Blood 71, 1755–1758 (1988).
80. Sartorello, R. et al. In vivo uptake of a haem analogue Zn protoporphyrin IX by the human malaria parasite P. falciparum-infected red blood cells. Cell. Biol. Int. 34, 859–
34
865 (2010). 81. Brossi, A. et al. Arteether, a new antimalarial drug: synthesis and antimalarial properties.
J. Med. Chem. 31, 645–650 (1988). 82. Meshnick, S. R., Thomas, A., Ranz, A., Xu, C. M. & Pan, H. Z. Artemisinin
(qinghaosu): the role of intracellular hemin in its mechanism of antimalarial action. Mol Biochem Parasitol 49, 181–189 (1991).
83. Klonis, N. et al. Artemisinin activity against Plasmodium falciparum requires hemoglobin uptake and digestion. Proc Natl Acad Sci USA 108, 11405–11410 (2011).
84. Stocks, P. A. et al. Evidence for a common non-heme chelatable-iron-dependent activation mechanism for semisynthetic and synthetic endoperoxide antimalarial drugs. Angew Chem Int Ed Engl 46, 6278–6283 (2007).
85. Payne, D. Spread of chloroquine resistance in Plasmodium falciparum. Parasitol. Today (Regul. Ed.) 3, 241–246 (1987).
86. Ginsburg, H. & Geary, T. G. Current concepts and new ideas on the mechanism of action of quinoline-containing antimalarials. Biochem. Pharmacol. 36, 1567–1576 (1987).
87. Bachhawat, K., Thomas, C. J., Surolia, N. & Surolia, A. Interaction of chloroquine and its analogues with heme: An isothermal titration calorimetric study. Biochem Biophys Res Commun 276, 1075–1079 (2000).
88. Sullivan, D. J., Matile, H., Ridley, R. G. & Goldberg, D. E. A common mechanism for blockade of heme polymerization by antimalarial quinolines. J Biol Chem 273, 31103–31107 (1998).
89. Slater, A. F. & Cerami, A. Inhibition by chloroquine of a novel haem polymerase enzyme activity in malaria trophozoites. Nature 355, 167–169 (1992).
90. Zhang, J., Krugliak, M. & Ginsburg, H. The fate of ferriprotorphyrin IX in malaria infected erythrocytes in conjunction with the mode of action of antimalarial drugs. Mol Biochem Parasitol 99, 129–141 (1999).
91. Combrinck, J. M. et al. Insights into the role of heme in the mechanism of action of antimalarials. ACS Chem Biol 8, 133–137 (2013).
92. Königk, E. & Putfarken, B. Inhibition of ornithine decarboxylase of in vitro cultured Plasmodium falciparum by chloroquine. Tropenmed Parasitol 34, 1–3 (1983).
93. Surolia, N. & Padmanaban, G. Chloroquine inhibits heme-dependent protein synthesis in Plasmodium falciparum. Proc Natl Acad Sci USA 88, 4786–4790 (1991).
94. Gluzman, I. Y. et al. Order and specificity of the Plasmodium falciparum hemoglobin degradation pathway. J Clin Invest 93, 1602–1608 (1994).
95. Ginsburg, H., Famin, O., Zhang, J. & Krugliak, M. Inhibition of glutathione-dependent degradation of heme by chloroquine and amodiaquine as a possible basis for their antimalarial mode of action. Biochem. Pharmacol. 56, 1305–1313 (1998).
96. Gorka, A. P. et al. Cytostatic versus cytocidal activities of chloroquine analogues and inhibition of hemozoin crystal growth. Antimicrob. Agents Chemother. 57, 356–364 (2013).
97. Fidock, D. A. et al. Mutations in the P. falciparum digestive vacuole transmembrane protein PfCRT and evidence for their role in chloroquine resistance. Mol. Cell 6, 861–871 (2000).
98. Wellems, T. E., Walker-Jonah, A. & Panton, L. J. Genetic mapping of the chloroquine-resistance locus on Plasmodium falciparum chromosome 7. Proc Natl Acad Sci USA 88,
35
3382–3386 (1991). 99. Cooper, R. A. et al. Alternative mutations at position 76 of the vacuolar transmembrane
protein PfCRT are associated with chloroquine resistance and unique stereospecific quinine and quinidine responses in Plasmodium falciparum. Mol Pharmacol 61, 35–42 (2002).
100. Martin, R. E. & Kirk, K. The malaria parasite's chloroquine resistance transporter is a member of the drug/metabolite transporter superfamily. Mol. Biol. Evol. 21, 1938–1949 (2004).
101. Tran, C. V. & Saier, M. H. The principal chloroquine resistance protein of Plasmodium falciparum is a member of the drug/metabolite transporter superfamily. Microbiology (Reading, Engl.) 150, 1–3 (2004).
102. Chinappi, M., Via, A., Marcatili, P. & Tramontano, A. On the mechanism of chloroquine resistance in Plasmodium falciparum. PLoS ONE 5, e14064 (2010).
103. Saliba, K. J., Folb, P. I. & Smith, P. J. Role for the plasmodium falciparum digestive vacuole in chloroquine resistance. Biochem. Pharmacol. 56, 313–320 (1998).
104. Kitchen, S. The infection of reticulocytes by Plasmodium vivax. Am J Trop Med Hyg 1, 347 (1938).
105. Golenda, C. F., Li, J. & Rosenberg, R. Continuous in vitro propagation of the malaria parasite Plasmodium vivax. Proc Natl Acad Sci USA 94, 6786–6791 (1997).
106. Wilson, R. J., Pasvol, G. & Weatherall, D. J. Invasion and growth of Plasmodium falciparum in different types of human erythrocyte. Bull World Health Organ 55, 179–186 (1977).
107. Skadberg, O., Brun, A. & Sandberg, S. Human reticulocytes isolated from peripheral blood: maturation time and hemoglobin synthesis. Lab Hematol 9, 198–206 (2003).
108. Bass, C. C. & Johns, F. M. THE CULTIVATION OF MALARIAL PLASMODIA (PLASMODIUM VIVAX AND PLASMODIUM FALCIPARUM) IN VITRO. J Exp Med 16, 567–579 (1912).
109. Brockelman, C. R., Tan-Ariya, P. & Laovanitch, R. Observation on complete schizogony of Plasmodium vivax in vitro. J. Protozool. 32, 76–80 (1985).
110. Sutar, N. K. & Renapurkar, D. M. Effect of liver extract on growth of Plasmodium vivax in vitro. Indian J. Exp. Biol. 29, 286–287 (1991).
111. Zhou, W. Z. & Hu, L. Q. [Erythrocytic schizogony of Plasmodium vivax under various conditions of in vitro cultivation]. Zhongguo Ji Sheng Chong Xue Yu Ji Sheng Chong Bing Za Zhi 9, 258–260 (1991).
112. Chotivanich, K. et al. Ex-vivo short-term culture and developmental assessment of Plasmodium vivax. Trans. R. Soc. Trop. Med. Hyg. 95, 677–680 (2001).
113. Larrouy, G., Magnaval, J. F. & Moro, F. [Obtaining intraerythrocytic forms of Plasmodium vivax by in vitro culture]. Comptes rendus des séances de l'Académie des sciences. Série III, Sciences de la vie 292, 929–930 (1981).
114. Renapurkar, D. M., Pradhan, V. R. & Sutar, N. K. The continuous in vitro cultivation of Plasmodium vivax. IRCS Medical Science 11, 7–8 (1983).
115. Noulin, F., Borlon, C., Van Den Abbeele, J., D’Alessandro, U. & Erhart, A. 1912-2012: a century of research on Plasmodium vivax in vitro culture. Trends Parasitol 29, 286–294 (2013).
116. Borlon, C. et al. Cryopreserved Plasmodium vivax and cord blood reticulocytes can be used for invasion and short term culture. Int J Parasitol 42, 155–160 (2012).
36
117. Devi, C. U., Pillai, C. R., Subbarao, S. K. & Dwivedi, S. C. Short term in vitro cultivation of erythrocytic stages of Plasmodium vivax. Journal of Parasitic Diseases 24, 61–66 (2000).
118. Udomsangpetch, R. et al. Short-term in vitro culture of field isolates of Plasmodium vivax using umbilical cord blood. Parasitology International 56, 65–69 (2007).
119. Panichakul, T. et al. Production of erythropoietic cells in vitro for continuous culture of Plasmodium vivax. Int J Parasitol 37, 1551–1557 (2007).
120. Noulin, F. et al. Cryopreserved reticulocytes derived from hematopoietic stem cells can be invaded by cryopreserved Plasmodium vivax isolates. PLoS ONE 7, e40798 (2012).
121. Giarratana, M.-C. et al. Ex vivo generation of fully mature human red blood cells from hematopoietic stem cells. Nature Biotechnology 23, 69–74 (2005).
122. Lanners, H. N. Prolonged in vitro cultivation of Plasmodium vivax using Trager's continuous-flow method. Parasitol Res 78, 699–701 (1992).
123. Dvorak, J. A., Miller, L. H., Whitehouse, W. C. & Shiroishi, T. Invasion of erythrocytes by malaria merozoites. Science 187, 748–750 (1975).
124. Bannister, L. H. & Dluzewski, A. R. The ultrastructure of red cell invasion in malaria infections: a review. Blood Cells 16, 257–92– discussion 293–7 (1990).
125. Singh, S., Alam, M. M., Pal-Bhowmick, I., Brzostowski, J. A. & Chitnis, C. E. Distinct external signals trigger sequential release of apical organelles during erythrocyte invasion by malaria parasites. PLoS Pathog 6, e1000746 (2010).
126. Cowman, A. F., Berry, D. & Baum, J. The cellular and molecular basis for malaria parasite invasion of the human red blood cell. J Cell Biol 198, 961–971 (2012).
127. Mitchell, G. H. & Bannister, L. H. Malaria parasite invasion: interactions with the red cell membrane. Crit. Rev. Oncol. Hematol. 8, 225–310 (1988).
128. Aikawa, M., Miller, L. H., Johnson, J. & Rabbege, J. Erythrocyte entry by malarial parasites. A moving junction between erythrocyte and parasite. J Cell Biol 77, 72–82 (1978).
129. Srinivasan, P. et al. Binding of Plasmodium merozoite proteins RON2 and AMA1 triggers commitment to invasion. Proc Natl Acad Sci USA (2011).
130. Cowman, A. F. & Crabb, B. S. Invasion of red blood cells by malaria parasites. 124, 755–766 (2006).
131. Tham, W.-H., Healer, J. & Cowman, A. F. Erythrocyte and reticulocyte binding-like proteins of Plasmodium falciparum. Trends Parasitol 28, 23–30 (2012).
132. Adams, J. H. et al. The Duffy receptor family of Plasmodium knowlesi is located within the micronemes of invasive malaria merozoites. 63, 141–153 (1990).
133. Sim, B. K., Toyoshima, T., Haynes, J. D. & Aikawa, M. Localization of the 175-kilodalton erythrocyte binding antigen in micronemes of Plasmodium falciparum merozoites. Mol Biochem Parasitol 51, 157–159 (1992).
134. Rayner, J. C., Galinski, M. R., Ingravallo, P. & Barnwell, J. W. Two Plasmodium falciparum genes express merozoite proteins that are related to Plasmodium vivax and Plasmodium yoelii adhesive proteins involved in host cell selection and invasion. Proc Natl Acad Sci USA 97, 9648–9653 (2000).
135. Adams, J. H. et al. A family of erythrocyte binding proteins of malaria parasites. Proc Natl Acad Sci USA 89, 7085–7089 (1992).
136. Horuk, R. et al. A receptor for the malarial parasite Plasmodium vivax: the erythrocyte chemokine receptor. Science 261, 1182–1184 (1993).
37
137. Galinski, M. R., Medina, C. C., Ingravallo, P. & Barnwell, J. W. A reticulocyte-binding protein complex of Plasmodium vivax merozoites. 69, 1213–1226 (1992).
138. Triglia, T. et al. Identification of proteins from Plasmodium falciparum that are homologous to reticulocyte binding proteins in Plasmodium vivax. Infect Immun 69, 1084–1092 (2001).
139. Duraisingh, M. T., Maier, A. G., Triglia, T. & Cowman, A. F. Erythrocyte-binding antigen 175 mediates invasion in Plasmodium falciparum utilizing sialic acid-dependent and -independent pathways. Proc Natl Acad Sci USA 100, 4796–4801 (2003).
140. Sim, B. K., Chitnis, C. E., Wasniowska, K., Hadley, T. J. & Miller, L. H. Receptor and ligand domains for invasion of erythrocytes by Plasmodium falciparum. Science 264, 1941–1944 (1994).
141. Tolia, N. H., Enemark, E. J., Sim, B. K. L. & Joshua-Tor, L. Structural basis for the EBA-175 erythrocyte invasion pathway of the malaria parasite Plasmodium falciparum. 122, 183–193 (2005).
142. Tham, W.-H. et al. Complement receptor 1 is the host erythrocyte receptor for Plasmodium falciparum PfRh4 invasion ligand. Proc Natl Acad Sci USA 107, 17327–17332 (2010).
143. Crosnier, C. et al. Basigin is a receptor essential for erythrocyte invasion by Plasmodium falciparum. Nature 480, 534–537 (2011).
144. Hayton, K. et al. Erythrocyte binding protein PfRH5 polymorphisms determine species-specific pathways of Plasmodium falciparum invasion. Cell Host Microbe 4, 40–51 (2008).
145. Baum, J. et al. Reticulocyte-binding protein homologue 5 - an essential adhesin involved in invasion of human erythrocytes by Plasmodium falciparum. Int J Parasitol 39, 371–380 (2009).
146. Besteiro, S., Michelin, A., Poncet, J., Dubremetz, J.-F. & Lebrun, M. Export of a Toxoplasma gondii rhoptry neck protein complex at the host cell membrane to form the moving junction during invasion. PLoS Pathog 5, e1000309 (2009).
147. Alexander, D. L., Mital, J., Ward, G. E., Bradley, P. & Boothroyd, J. C. Identification of the moving junction complex of Toxoplasma gondii: a collaboration between distinct secretory organelles. PLoS Pathog 1, e17 (2005).

38
CHAPTER 2: DEVELOPMENT OF A NOVEL GENETICALLY-ENCODED
FRET BIOSENSOR AND QUANTIFICATION OF A LABILE CYTOSOLIC
HEME POOL IN LIVE MALARIA PARASITES
2.0 Note
This chapter is adapted from a manuscript submitted for publication, with Christopher J.
Rowlands, Suresh M. Ganesan, Peter T. C. So, and Jacquin C. Niles as co-authors.
2.1 Abstract
Heme is ubiquitous, yet little is known about the maintenance of labile pools of this cofactor
that ensure its timely bioavailability for proper cell function. Quantitative analysis of labile heme
is of broad fundamental importance to understanding how nature preserves access to the diverse
chemistry heme enables, while minimizing cellular damage caused by its redox-activity. Here,
we have developed a novel, genetically-encoded FRET sensor for quantifying labile heme in
intact cells, and measured the physiologic cytosolic heme pool in the malarial parasite,
Plasmodium falciparum. Our findings indicate that a labile heme pool (~1.1 µM) is stably
maintained throughout parasite development within red blood cells, even during a period
coincident with extensive hemoglobin degradation by the parasite. We also find that the heme-
binding antimalarial drug chloroquine specifically increases labile cytosolic heme, indicative of
homeostatic dysregulation of this pool that may directly relate to the antimalarial activity of this
drug class. We propose that application of this technology in other organisms could similarly
yield new, quantitative insights into fundamental heme biology.
39
2.2 Introduction
Heme is a cofactor of central importance across biology, and plays vital roles in diverse
processes including energy production, oxygen transport, gas sensing and signaling 1 and
catalysis 2. Its inherently high and tunable redox potential together with its diverse ligand-
binding properties make it an extremely versatile cofactor suited to a broad range of chemistries.
Free heme redox cycles in the aerobic and reducing cellular environment, which can induce
potentially cytotoxic oxidative stress. To minimize this, both heme levels and reactivity are
restricted in several ways, including sequestering it into protein scaffolds that determine the
selectivity and specificity of its chemistry, degradation, export and inactivation by physical
processes such as polymerization 2-4. Cells maintain labile pools of critical cofactors to meet
rapidly changing metabolic demands. Such pools for transition metal cofactors including iron
and zinc, which can also be cytotoxic, have been quantitatively defined using an extensive toolkit
5,6. However, similar and generally accessible tools for studying labile heme pools in live cells
have not previously been established. This has precluded achieving a detailed and quantitative
understanding of cellular heme pool composition and dynamics under both physiologic and
perturbed states.
We have been particularly interested in characterizing labile heme pools in the human
malarial parasite, Plasmodium falciparum. This pathogen is a major cause of the 198 million
cases and 584,000 deaths per year due to malaria 7. Several aspects of heme metabolism in P.
falciparum are counterintuitive, and its exquisite sensitivity to heme-interacting antimalarial
drugs suggests a critical and finely balanced role for heme in its biology. During development
within red blood cells (RBCs), P. falciparum takes up and digests between 44-80% of the
hemoglobin in a specialized subcellular digestive vacuole (DV) to release peptides and heme 8-11.
40
The majority of this heme is converted into the relatively redox inert crystalline hemozoin
polymer within the DV 8,10. While the extent of hemoglobin digestion and heme polymerization
is minimal in early stage parasites (rings), this progressively increases as parasites develop
through mid- (trophozoite) and late- (schizont) stages.
It is presently unknown whether hemoglobin-derived heme is quantitatively converted into
hemozoin and exclusively confined to the DV, or whether it escapes the DV to accumulate in
other compartments such as the parasite cytoplasm during normal development. Such a heme
pool may be important for meeting metabolic needs, signaling to coordinate DV biochemistry
with cytosolic and nuclear processes, or simply a consequence the parasite must endure due to its
obligate degradation of hemoglobin. Along these lines, despite liberating large quantities of
heme from hemoglobin that should be more than adequate to meet the parasite’s needs, the P.
falciparum genome encodes a complete heme biosynthetic pathway that appears to be active in
blood stage parasites 12-14. Nevertheless, de novo heme biosynthesis is dispensable during the
blood stage infection, as the genes encoding δ-aminolevulinic acid synthase (ALAS) and
ferrochelatase that are required for de novo heme biosynthesis can be deleted without observable
defects in parasite growth 13,15. Based on these studies, it has been suggested that hemoglobin-
derived heme may escape the DV to completely meet the parasite’s heme requirement. However,
the physiologic levels of bioavailable heme, irrespective of its source, are yet to be defined.
Further highlighting the importance of heme biochemistry in the parasite is the potent
antimalarial activity of chloroquine, an exemplar of the heme-binding 4-aminoquinoline drug
class. These compounds accumulate within the parasite’s DV to disrupt hemozoin formation, and
the unpolymerized heme is proposed to escape the DV to cause toxicity 10. Consistent with this,
electron spectroscopic imaging of fixed, chloroquine-treated parasites revealed a qualitative
41
increase in cytosolic iron content, suggestive of increased heme content in the cytoplasm 16.
However, heme can be degraded in a glutathione-dependent manner to release iron 17, the extent
of which cannot be inferred from the data. Fractionation studies on chloroquine-treated parasites
also support an increase in labile heme, but its precise subcellular distribution cannot be inferred
16. Thus, direct and quantitative evidence of cytosolic heme accumulation in chloroquine-treated
parasites is still lacking, despite the central importance of this knowledge to understanding the
mechanism of action of arguably the most successful antimalarial drug class used to date.
Here, we have addressed the fundamental challenge of directly quantifying labile heme in
live cells by systematically developing, validating, and optimizing a genetically-encoded FRET-
based heme biosensor. Using the optimized biosensor, we demonstrate for the first time that P.
falciparum maintains a labile cytosolic heme pool throughout its blood-stage development.
Furthermore, we directly show that disrupting heme sequestration in the digestive vacuole using
a heme-binding antimalarial drug causes a significant increase in the concentration of cytosolic
labile heme, thus directly linking chloroquine to cell-wide heme perturbation for the first time.
We believe that this novel biosensor will be broadly useful for directly interrogating heme
biology in P. falciparum, and in other organisms.
42
2.3 Methods
2.3.1 Molecular cloning
A fragment of the P. falciparum HRP2 gene (109-916 bp) lacking the N-terminal signal
peptide was amplified by PCR from plasmid MRA-67 (ATCC/MR4) and cloned into pET28b
(Novagen) vectors containing ECFP and EYFP using standard restriction and ligation techniques.
To generate sensors based on truncated PfHRP2, a forward oligonucleotide primer was designed
to anneal to a repeated PfHRP2 sequence motif identified using MEME 42 was used with a fixed
reverse primer to PCR amplify fragments of varying sizes using the PfHRP2 gene as a template.
These were separated by agarose gel electrophoresis, and then cloned into ECFP and EYFP-
containing vectors as above. Fragments mapped to full-length PfHRP2 except for some minor in-
frame insertion/deletion mutations in the histidine-rich repeats. For CH18Y, the oligonucleotide
encoding the heme-binding motif (HHAHHAADA)2 was generated in a Klenow reaction, and
cloned as above. For expression in P. falciparum, coding sequences from pET28b-based vectors
were PCR amplified and cloned using the Gibson Assembly Master Mix (New England Biolabs)
to replace the ENR-GFP fusion protein in plasmid MRA-846 (ATCC/MR4).
2.3.2 Protein expression and purification
Plasmids encoding FRET sensor and control proteins were transformed into E. coli strain
BL21(DE3). Cultures were grown overnight at 37˚C in ZYM-505 media supplemented with
kanamycin. Saturated cultures were diluted 1:200 in kanamycin-containing ZYM-505 media and
grown at 37˚C until OD600 = 0.6-0.8. Protein expression was induced by adding 0.1 mM
isopropyl β-D-1-thiogalactopyranoside (IPTG) for 24 hours at room temperature. Cells were
harvested by centrifugation and pellets were frozen and stored at -80˚C. For protein purification,
43
cell pellets were thawed at room temperature and lysed with B-PER II bacterial protein
extraction reagent (Thermo Scientific) supplemented with lysozyme, Benzonase (Novagen), and
protease inhibitor cocktail (Sigma-Aldrich). Lysates were clarified by centrifugation, and applied
to purification beads that had been previously washed with Equilibration/Wash Buffer (50 mM
Tris-HCl pH 8.0, 200 mM NaCl, 5% glycerol). Hexahistidine-tagged protein constructs were
bound to HisPur Cobalt Resin (Thermo Scientific), while Strep-Tactin Superflow Plus (Qiagen)
was used to bind Strep-tagged proteins. In both cases, lysates were incubated with purification
beads for 1 hour at 4˚C with gentle agitation. Purification beads were then washed extensively
with ice-cold Equilibration/Wash buffer, before loading on to a gravity-flow column.
Hexahistidine tagged proteins were eluted from the column with Elution Buffer H (50 mM Tris-
HCl pH 8.0, 200 mM NaCl, 500 mM imidazole, 5% glycerol). Strep-tagged proteins were eluted
from the column with Elution Buffer S (50 mM Tris-HCl pH 8.0, 200 mM NaCl, 2.5 mM
desthiobiotin, 5% glycerol). Fractions were spectroscopically monitored using a NanoDrop
spectrophotometer (Thermo Scientific), and those containing ECFP and/or EYFP were pooled
and concentrated using Amicon Ultra-15 centrifugal filters (Thermo Scientific). Concentrated
protein solutions were then dialyzed against 2x PBS pH 7.4. Glycerol was then added to 50%
and protein solutions were stored at -20˚C.
2.3.3 Absorbance titrations
Titrations to measure heme binding affinity and stoichiometry were performed as previously
described 18,21. Stock solutions of recombinant protein were prepared in 100 mM HEPES-KOH
pH 7.0. Stock solutions of 1 mM hemin were (Sigma-Aldrich) prepared in DMSO. All
concentrations were verified spectrophotometrically. Heme binding titrations were performed in
44
3 ml-capacity quartz cuvettes at 37˚C with stirring using a Cary 100 Bio Spectrophotometer
(Varian). Heme titrations were performed with 2 ml of 0.5 µM protein solution, using 2 ml of
HEPES-KOH as a reference. For each concentration, heme was added to both the sample and
reference cells and stirred for 5 min before difference spectra were measured. Heme binding was
quantified based on a differential absorption peak at 416 nm. The ∆A416nm versus heme
concentration data were plotted and analyzed using Prism (GraphPad Software, La Jolla, CA).
2.3.4 Fluorescence titrations and FRET efficiency calculations
Hemin stock solution was serially diluted in HEPES-KOH in a 96-well plate. Protein stock
solution was added to 0.5 µM final concentration using a multichannel pipetter, and the plate was
incubated at 37˚C for 5 min. Fluorescence spectra were measured using a Fluoromax-3
fluorimeter (Horiba Jobin Yvon). ECFP was excited at 420 nm, with emission scanning from
440-600 nm. EYFP was excited at 500 nm, with emission scanning from 505-600 nm. FRET
efficiencies were calculated using the ratioA method as previously described 43,44.
2.3.5 Fluorescence lifetime spectroscopy
The multiphoton FLIM microscope consisted of a Ti:Sapphire laser (Tsunami HP, Spectra
Physics, Santa Clara CA, USA), tunable between 780 nm and 880 nm (Supplemental Figure S2).
Power control was achieved using a half waveplate and Glan-Laser polarizer. The beam first
struck a tilted glass coverslip beamsplitter where part of the beam was focused onto a photodiode
in order to create a reference pulse. The majority of the pulse intensity passed through the
beamsplitter to the rest of the microscope. The beam was subsequently reflected off a dichroic
beamsplitter (675DCSX, Chroma Technology Inc., Brattleboro VT, USA) and two
45
galvanometric scanning mirrors (6350, Cambridge Technology, Watertown MA, USA) before
entering the scan lens, which produced a moving focal spot at the image plane of the microscope
(Axiovert 100TV, Zeiss, Göttingen, Germany). The scanning mirrors were controlled using
software written in-house, and the synchronization signals were created using an FPGA (Spartan
XCS30, Xilinx, San Jose CA, USA).
The spot in the image plane was imaged onto the sample by the microscope objective (C-
Apochromat 40× water immersion 44-00-52, Zeiss, Göttingen, Germany), and the resulting
fluorescence emission was captured by the objective, descanned by the scanning mirrors and
passed through the dichroic mirror and filter (ESP650, Chroma Technology, Brattleboro VT,
USA) where it was focused onto a photomultiplier tube (R7400P, Hamamatsu, Bridgewater NY,
USA). The signal from the photomultiplier and the signal from the reference photodiode were
measured by a Time-Correlated Single Photon Counting card (SPC-730, Becker and Hickl,
Berlin, Germany) and the resulting image displayed using the Becker and Hickl software.
The instrument response was compensated for by measuring a sample (Fluorescein in pH 9
DMSO solution, from R14782 reference sample kit, Life Technologies, Grand Island NY, USA,
known lifetime of 4.1 ns) and deconvolving the known decay curve from the measured curve to
yield the instrument response. This instrument response was then deconvolved from every
measured curve to yield a corrected decay curve. After this correction, the exponentially-
decaying section of the curve was taken from the data, and a ‘single exponential decay with
unknown offset’ function was fitted to the data to recover the fluorescence lifetime while
compensating for the small background in the measurement. All calculations were performed
using MATLAB 2011b (MathWorks, Natick MA).
46
2.3.6 Malaria parasite culture
Blood-stage malaria parasites were cultured at 2% hematocrit in 5% O2 and 5% CO2 in RPMI
1640 Medium supplemented with 5 g/l AlbuMAX II (Life Technologies), 2 g/l NaHCO3, 25 mM
HEPES-KOH pH 7.4, 1 mM hypoxanthine, and 50 mg/l gentamicin. Strains were synchronized
using a solution of 0.3 M alanine supplemented with 25 mM HEPES-KOH pH 7.4. Parasite
transfections were performed by pre-loading red blood cells with plasmid DNA by
electroporation. All expression constructs were integrated at the cg6 locus in NF54attB parasites 26
by co-transfecting with the pINT plasmid (MRA-847) 45. For each transfection, 100 µl of washed
red blood cells was mixed with 25-50 µg plasmid DNA and then electroporated with 8 x 1 ms
square pulses at 365 V. Late-stage parasites were then split to 0.1% parasitemia using half of the
loaded RBCs. After 48 hours, transfected cultures were split 1:2 using the remainder of the
loaded RBCs. After another 48 hours, cultures were split again and drug selection was initiated.
Drug-resistant parasites were then cloned via limiting dilution, and clones were screened for
expression of ECFP and/or EYFP using flow cytometry.
2.3.7 Preparation of giant multilamellar vesicles
Stock solutions of 1,2-dioleoyl-sn-glycero-3-phospho-(1'-rac-glycerol) (DOPG) and 1,2-
dioleoyl-sn-glycero-3-phosphocholine (DOPC, Avanti Polar Lipids) in chloroform were mixed
in a 1:1 ratio, and 1 µmol of total lipid was added to a glass scintillation vial. Lipid films were
deposited by overnight evaporation of the chloroform at room temperature. Lipid films were then
hydrated by incubating scintillation vials in a humidified 70˚C oven for 6 hours. Vesicles were
prepared by gently adding protein solutions (0.5 µM protein in 100 mM HEPES-KOH pH 7 plus
47
50 mM sucrose) and incubating overnight at room temperature in the dark. After incubation,
vesicles were washed extensively in HEPES-KOH plus 50 mM glucose and imaged.
2.3.8 In situ FRET analysis
Synchronized late-stage parasite cultures were washed and resuspended in Opti-Klear media
(Marker Gene Technologies) at 0.05% hematocrit for imaging. Culture suspensions were added
to glass-bottom 24-well plates (In vitro Scientific, Sunnyvale, CA) pre-treated with 0.1%
polyethyleneimine. Cultures were imaged using a Nikon Ti microscope using the following
filtersets: ECFP (436nm/20nm EX, 455nm LP, 480nm/40nm EM), FRET (436nm/20nm EX,
455nm LP, 535nm/30nm EM), and YFP (500nm/20nm EX, 515nm LP, 535nm/30nm EM).
Images were acquired using an Andor iXon+ 897 EMCCD camera and MetaMorph acquisition
software (Molecular Devices). Images were processed using Biosensor Processing Software v2.1
46. Briefly, images were shade-corrected using averaged reference images, and segmentation
values were chosen for each channel by manual inspection in order to draw background masks,
which were then grown using a 5-pixel radius. Background subtraction was performed according
to software defaults. The FRET channel was corrected for bleedthrough from CFP and crosstalk
from YFP using correction factors of 0.4 and 0.1, respectively. FRET images were obtained by
calculating the ratio between the corrected FRET channel image and the YFP image. The
resulting FRET images were inspected manually to identify individual cells. Average per-cell
FRET efficiencies for CH49Y and CSY strains were calculated and tabulated using the FIJI
distribution of ImageJ 47. A bootstrapping algorithm with 10,000 iterations was used to estimate
the ratio of averages between CH49Y and CSY FRET distributions, correct for the offset
measured between microscopy and fluorimetry data, and compute a 95% confidence interval.
48
The ratio of averages and the confidence interval bounds were used to calculate heme
concentrations according to the following empirical relationship between normalized EFRETSensor
and heme (Figs. 2-14a and 2-14b):
Normalized EFRETSensor =
!FRET, CH49Y!FRET, CSY
= !.!"!!!!.!"# !"#"
!.!"#!!.!"#$ !"#"
Calculations were performed using MATLAB R2013a software (MathWorks, Natick MA).
2.3.9 Western immunoblotting
Parasites were obtained by lysing 180 µl infected red blood cells with an ice-cold solution of
0.1% saponin (Fluka) in PBS and incubating on ice until solutions cleared. Parasite pellets were
washed extensively with saponin-PBS solution to remove residual hemoglobin and then lysed
with the addition of 200 µl 1X SDS-Urea sample buffer (40 mM Tris base, 80 mM Gly-Gly, 40
mM dithiothreitol, 1.6% SDS and 6.4 M urea adjusted to pH 6.8 with HCl). Parasite lysates were
diluted 1:10 before gel electrophoresis and transfer. Blots were probed with a mouse monoclonal
anti-GFP (B-2) primary antibody (Catalog # SC-9996; Santa Cruz Biotech) diluted 1:2000, and a
goat anti-mouse secondary antibody conjugated to horseradish peroxidase (H+L) (Catalog #
71045; Novagen), and visualized using SuperSignal West Femto chemiluminescent substrate
(Thermo Scientific).
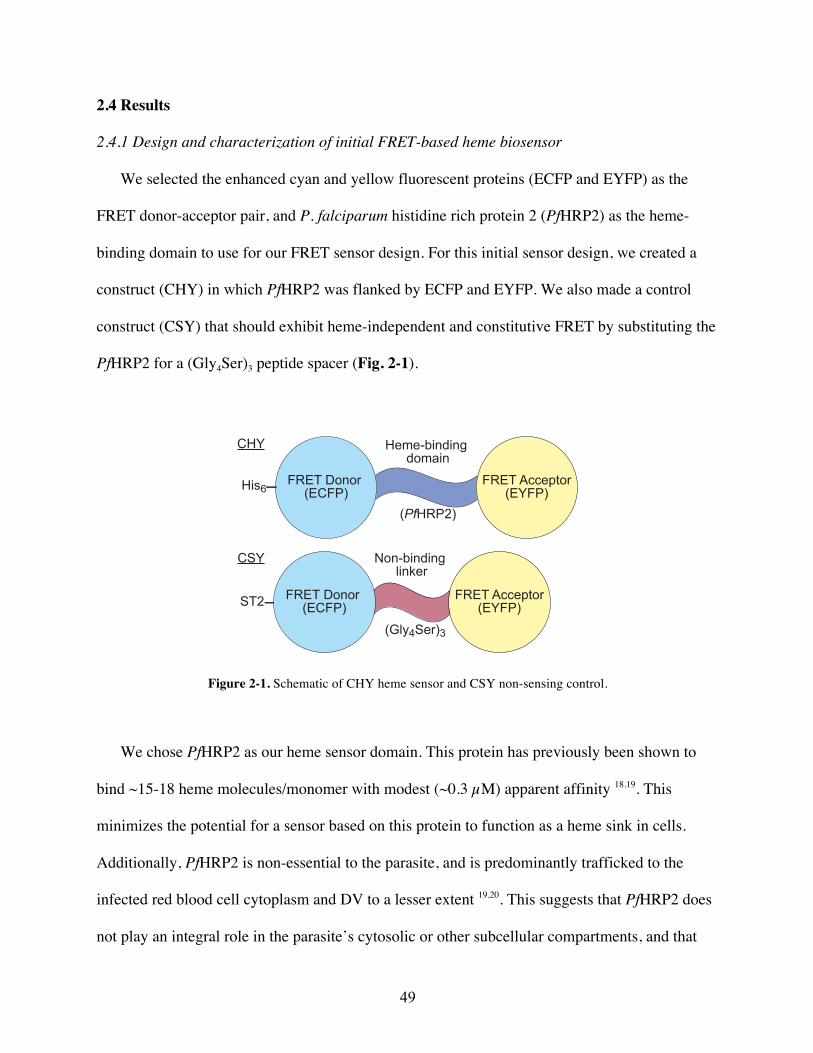
49
2.4 Results
2.4.1 Design and characterization of initial FRET-based heme biosensor
We selected the enhanced cyan and yellow fluorescent proteins (ECFP and EYFP) as the
FRET donor-acceptor pair, and P. falciparum histidine rich protein 2 (PfHRP2) as the heme-
binding domain to use for our FRET sensor design. For this initial sensor design, we created a
construct (CHY) in which PfHRP2 was flanked by ECFP and EYFP. We also made a control
construct (CSY) that should exhibit heme-independent and constitutive FRET by substituting the
PfHRP2 for a (Gly4Ser)3 peptide spacer (Fig. 2-1).
Figure 2-1. Schematic of CHY heme sensor and CSY non-sensing control.
We chose PfHRP2 as our heme sensor domain. This protein has previously been shown to
bind ~15-18 heme molecules/monomer with modest (~0.3 µM) apparent affinity 18,19. This
minimizes the potential for a sensor based on this protein to function as a heme sink in cells.
Additionally, PfHRP2 is non-essential to the parasite, and is predominantly trafficked to the
infected red blood cell cytoplasm and DV to a lesser extent 19,20. This suggests that PfHRP2 does
not play an integral role in the parasite’s cytosolic or other subcellular compartments, and that
FRET Donor (ECFP)
FRET Acceptor(EYFP)
His6
FRET Donor (ECFP)
FRET Acceptor(EYFP)ST2
CHY
CSY
Heme-binding domain
(PfHRP2)
Non-binding linker
(Gly4Ser)3
a
-0.2
0
0.2
0.4
0.6
350 400 450 500 550 600 650 700
Wavelength (nm)
hemeequivalentsadded
b c
d
∆Abs
fe
CHYCSYECFPEYFP
[Heme] (µM)
0 2 4 6 8 10 120.0
0.2
0.4
0.6
∆Abs
41
6
1.0
1.5
2.0
2.5
3.0
CHY
ECFP
CSY
CH
[Heme] (µM)
0 2 4 6 8 10 12
τ (
ns)
hemeequivalentsadded
[Heme] (µM)
No
rma
lize
d E
FR
ET
440
Norm
aliz
ed F
luore
scence
Wavelength (nm)
480 520 560 600
1.2
1.0
0.8
0.6
0.4
0.2
0.00 2 4 6 8 10 12
1.2
1.0
0.8
0.6
0.4
0.2
0.0
CHY
CSY
ECFP

50
expression of PfHRP2 fusion proteins in the cytosol should minimally impinge on its physiologic
role.
We recombinantly expressed and purified both CHY and CSY to characterize their
biochemical and spectroscopic properties in vitro (Fig. 2-2).
Figure 2-2. SDS-PAGE purity analysis of recombinant CHY, CSY, ECFP, EYFP, and CH used for fluorescence lifetime spectroscopy.
We first tested whether flanking PfHRP2 by ECFP and EYFP interfered with its heme
binding properties. Heme binding to PfHRP2 occurs via bis-histidyl ligation, which causes a
shift in the heme Soret peak absorbance from ~396 nm to 416 nm. Monitoring this change by
electronic absorption spectroscopy while titrating heme levels facilitates determination of heme
binding stoichiometry and apparent heme binding affinity to PfHRP2 18,21. Heme titrations with
CHY produced the expected increase in absorbance at 416 nm, consistent with heme binding to
PfHRP2 (Fig. 2-3a). Analysis of these binding data by breakpoint detection and fitting to a
ligand binding with depletion model 21 (Fig. 2-3b), respectively, revealed that CHY bound ~15
heme equivalents/monomer with an apparent KD ~0.25 µM. These data are in good agreement
with previously published data obtained for recombinant PfHRP2 18,19, indicating that fusion to
ECFP and EYFP does not significantly alter its heme binding properties. Furthermore, no heme
S1
CHY
CSY
ECFP
EYFP
CH
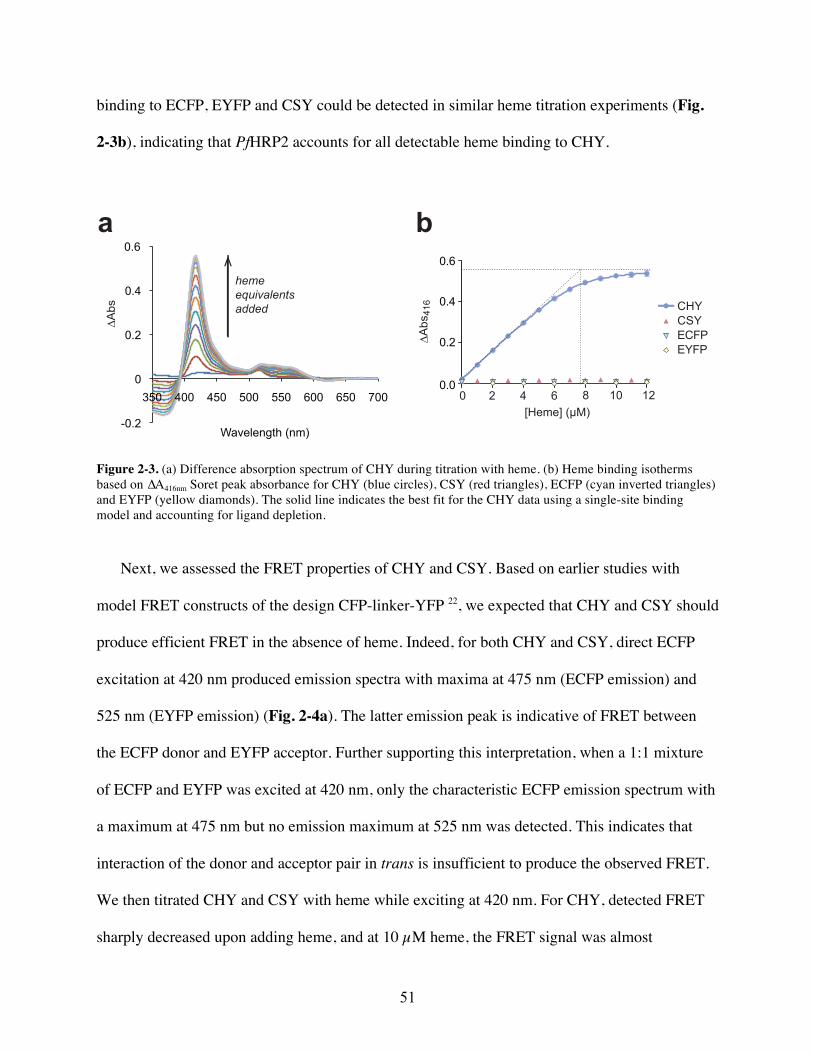
51
binding to ECFP, EYFP and CSY could be detected in similar heme titration experiments (Fig.
2-3b), indicating that PfHRP2 accounts for all detectable heme binding to CHY.
Figure 2-3. (a) Difference absorption spectrum of CHY during titration with heme. (b) Heme binding isotherms based on ∆A416nm Soret peak absorbance for CHY (blue circles), CSY (red triangles), ECFP (cyan inverted triangles) and EYFP (yellow diamonds). The solid line indicates the best fit for the CHY data using a single-site binding model and accounting for ligand depletion.
Next, we assessed the FRET properties of CHY and CSY. Based on earlier studies with
model FRET constructs of the design CFP-linker-YFP 22, we expected that CHY and CSY should
produce efficient FRET in the absence of heme. Indeed, for both CHY and CSY, direct ECFP
excitation at 420 nm produced emission spectra with maxima at 475 nm (ECFP emission) and
525 nm (EYFP emission) (Fig. 2-4a). The latter emission peak is indicative of FRET between
the ECFP donor and EYFP acceptor. Further supporting this interpretation, when a 1:1 mixture
of ECFP and EYFP was excited at 420 nm, only the characteristic ECFP emission spectrum with
a maximum at 475 nm but no emission maximum at 525 nm was detected. This indicates that
interaction of the donor and acceptor pair in trans is insufficient to produce the observed FRET.
We then titrated CHY and CSY with heme while exciting at 420 nm. For CHY, detected FRET
sharply decreased upon adding heme, and at 10 µM heme, the FRET signal was almost
FRET Donor (ECFP)
FRET Acceptor(EYFP)
His6
FRET Donor (ECFP)
FRET Acceptor(EYFP)ST2
CHY
CSY
Heme-binding domain
(PfHRP2)
Non-binding linker
(Gly4Ser)3 -0.2
0
0.2
0.4
0.6
350 400 450 500 550 600 650 700
Wavelength (nm)
hemeequivalentsadded
a b
a
∆Abs
b
CHYCSYECFPEYFP
[Heme] (µM)
0 2 4 6 8 10 120.0
0.2
0.4
0.6
∆Abs
41
6
1.0
1.5
2.0
2.5
3.0
CHY
ECFP
CSY
CH
[Heme] (µM)
0 2 4 6 8 10 12
τ (
ns)
hemeequivalentsadded
[Heme] (µM)
Norm
aliz
ed E
FR
ET
440
No
rma
lize
d F
luo
resc
en
ce
Wavelength (nm)
480 520 560 600
1.2
1.0
0.8
0.6
0.4
0.2
0.00 2 4 6 8 10 12
1.2
1.0
0.8
0.6
0.4
0.2
0.0
CHY
CSY
ECFP

52
completely abrogated (Fig. 2-4a,b). For CSY, only a modest decrease in FRET was detected
upon titrating heme (Fig. 2-4a,b). These data are consistent with CHY functioning as a ‘turn off’
sensor that responds to heme binding to the PfHRP2 domain.
Figure 2-4. (a) Normalized fluorescence intensity spectra for CHY titrated with heme. (b) Normalized FRET efficiency for CHY (blue circles) and CSY (red triangles) fitted to a single-exponential decay model (blue solid line) and a line (red dashed line), respectively.
To gain some insight into why CHY functioned as a ‘turn off’ heme sensor, we compared
heme-dependent ECFP fluorescence lifetimes for ECFP, CSY, CHY, and ECFP-PfHRP2 (CH)
(Figs. 2-2, 2-5, and 2-6).
FRET Donor (ECFP)
FRET Acceptor(EYFP)
His6
FRET Donor (ECFP)
FRET Acceptor(EYFP)ST2
CHY
CSY
Heme-binding domain
(PfHRP2)
Non-binding linker
(Gly4Ser)3 -0.2
0
0.2
0.4
0.6
350 400 450 500 550 600 650 700
Wavelength (nm)
hemeequivalentsadded
a b
a
∆Abs
b
CHYCSYECFPEYFP
[Heme] (µM)
0 2 4 6 8 10 120.0
0.2
0.4
0.6
∆Abs
41
6
1.0
1.5
2.0
2.5
3.0
CHY
ECFP
CSY
CH
[Heme] (µM)
0 2 4 6 8 10 12
τ (
ns)
hemeequivalentsadded
[Heme] (µM)N
orm
aliz
ed E
FR
ET
440
No
rma
lize
d F
luo
resc
en
ce
Wavelength (nm)
480 520 560 600
1.2
1.0
0.8
0.6
0.4
0.2
0.00 2 4 6 8 10 12
1.2
1.0
0.8
0.6
0.4
0.2
0.0
CHY
CSY
ECFP
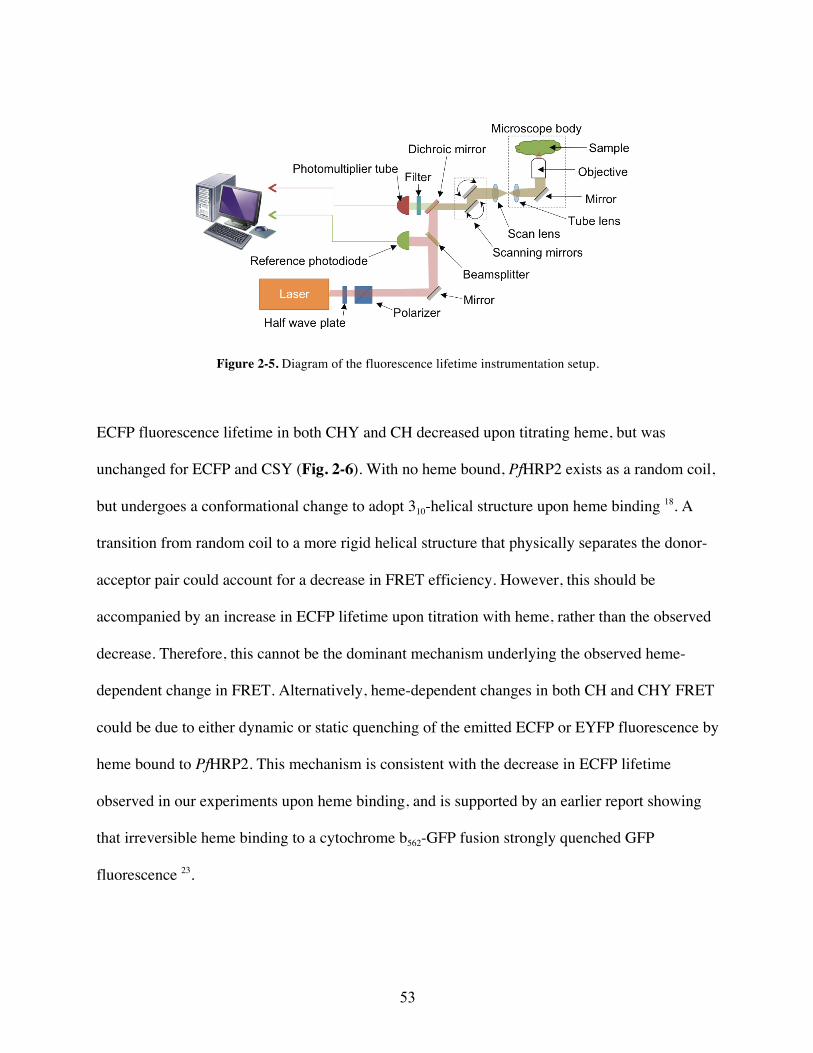
53
Figure 2-5. Diagram of the fluorescence lifetime instrumentation setup.
ECFP fluorescence lifetime in both CHY and CH decreased upon titrating heme, but was
unchanged for ECFP and CSY (Fig. 2-6). With no heme bound, PfHRP2 exists as a random coil,
but undergoes a conformational change to adopt 310-helical structure upon heme binding 18. A
transition from random coil to a more rigid helical structure that physically separates the donor-
acceptor pair could account for a decrease in FRET efficiency. However, this should be
accompanied by an increase in ECFP lifetime upon titration with heme, rather than the observed
decrease. Therefore, this cannot be the dominant mechanism underlying the observed heme-
dependent change in FRET. Alternatively, heme-dependent changes in both CH and CHY FRET
could be due to either dynamic or static quenching of the emitted ECFP or EYFP fluorescence by
heme bound to PfHRP2. This mechanism is consistent with the decrease in ECFP lifetime
observed in our experiments upon heme binding, and is supported by an earlier report showing
that irreversible heme binding to a cytochrome b562-GFP fusion strongly quenched GFP
fluorescence 23.
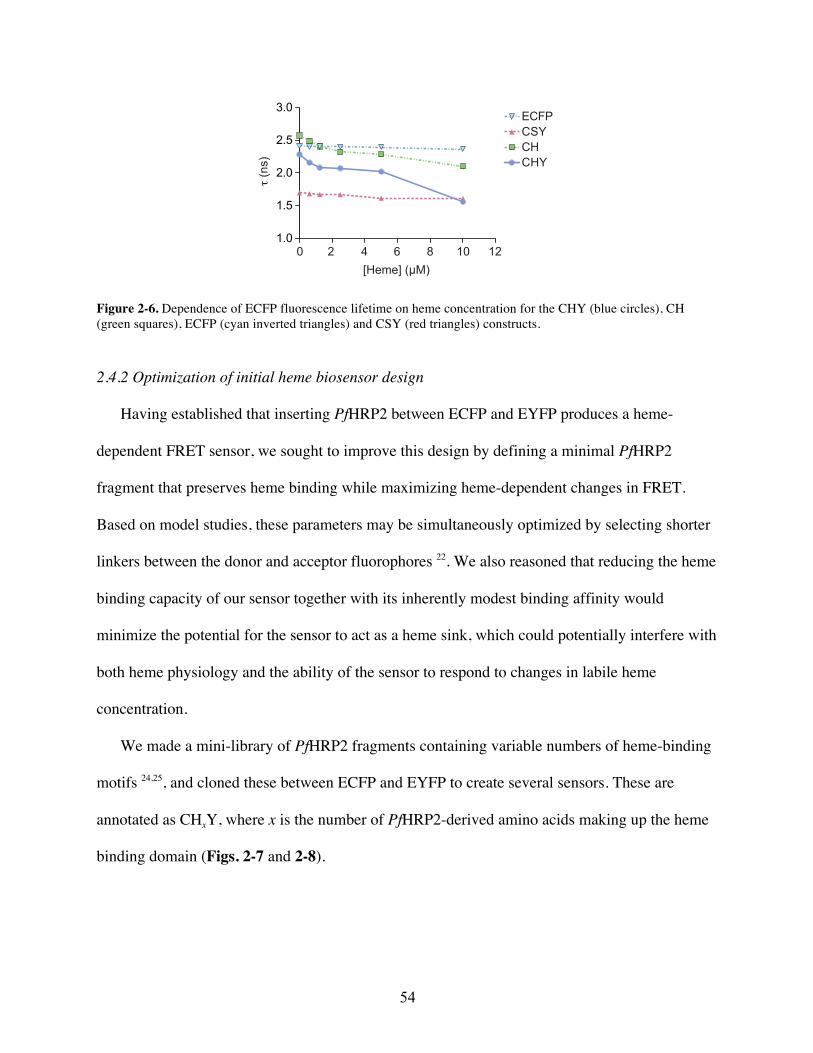
54
Figure 2-6. Dependence of ECFP fluorescence lifetime on heme concentration for the CHY (blue circles), CH (green squares), ECFP (cyan inverted triangles) and CSY (red triangles) constructs.
2.4.2 Optimization of initial heme biosensor design
Having established that inserting PfHRP2 between ECFP and EYFP produces a heme-
dependent FRET sensor, we sought to improve this design by defining a minimal PfHRP2
fragment that preserves heme binding while maximizing heme-dependent changes in FRET.
Based on model studies, these parameters may be simultaneously optimized by selecting shorter
linkers between the donor and acceptor fluorophores 22. We also reasoned that reducing the heme
binding capacity of our sensor together with its inherently modest binding affinity would
minimize the potential for the sensor to act as a heme sink, which could potentially interfere with
both heme physiology and the ability of the sensor to respond to changes in labile heme
concentration.
We made a mini-library of PfHRP2 fragments containing variable numbers of heme-binding
motifs 24,25, and cloned these between ECFP and EYFP to create several sensors. These are
annotated as CHxY, where x is the number of PfHRP2-derived amino acids making up the heme
binding domain (Figs. 2-7 and 2-8).
FRET Donor (ECFP)
FRET Acceptor(EYFP)
His6
FRET Donor (ECFP)
FRET Acceptor(EYFP)ST2
CHY
CSY
Heme-binding domain
(PfHRP2)
Non-binding linker
(Gly4Ser)3 -0.2
0
0.2
0.4
0.6
350 400 450 500 550 600 650 700
Wavelength (nm)
hemeequivalentsadded
a b
a
∆Abs
b
CHYCSYECFPEYFP
[Heme] (µM)
0 2 4 6 8 10 120.0
0.2
0.4
0.6
∆Abs
41
6
1.0
1.5
2.0
2.5
3.0
CHY
ECFP
CSY
CH
[Heme] (µM)
0 2 4 6 8 10 12 τ
(n
s)
hemeequivalentsadded
[Heme] (µM)
No
rma
lize
d E
FR
ET
440
Norm
aliz
ed F
luore
scence
Wavelength (nm)
480 520 560 600
1.2
1.0
0.8
0.6
0.4
0.2
0.00 2 4 6 8 10 12
1.2
1.0
0.8
0.6
0.4
0.2
0.0
CHY
CSY
ECFP
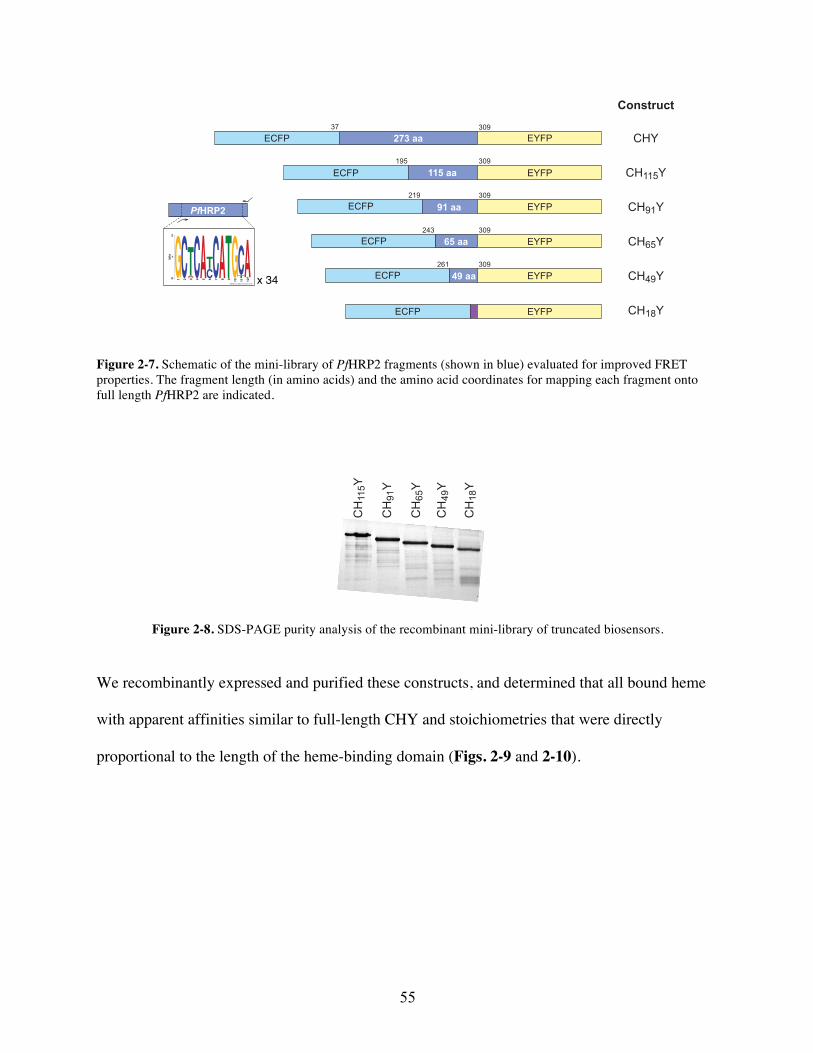
55
Figure 2-7. Schematic of the mini-library of PfHRP2 fragments (shown in blue) evaluated for improved FRET properties. The fragment length (in amino acids) and the amino acid coordinates for mapping each fragment onto full length PfHRP2 are indicated.
Figure 2-8. SDS-PAGE purity analysis of the recombinant mini-library of truncated biosensors.
We recombinantly expressed and purified these constructs, and determined that all bound heme
with apparent affinities similar to full-length CHY and stoichiometries that were directly
proportional to the length of the heme-binding domain (Figs. 2-9 and 2-10).
b
d e
Kd,app (µM)
0.25
0.082
0.050
0.13
0.12
0.067
CHY37 309
273 aaECFP EYFP
CH115Y309195
115 aaECFP EYFP
CH91Y309219
91 aaECFP EYFP
CH65Y309243
65 aaECFP EYFP
CH49Y309261
49 aaECFP EYFPMEME (no SSC)7.2.2012 07:42
0
1
2
bits
1
G2
C3C
AT
4
C5A 6
CT
7
C8A 9T 10
G11
TC
12
TA x 34
PfHRP2
Construct
CH18YECFP EYFP Heme binding domain (amino acids)0 100 200 300
0
5
10
15
20
Hem
e eq
uiva
lent
s bo
und
c
∆EFR
ET
Heme binding domain (amino acids)0 100 200 300
0.2
0.4
0.6
0.00 2 4 6 8 10 12
[Heme] (µM)
0.1
0.2
0.3
0.4
0.5
EFR
ET
[Heme] (µM)
Nor
mal
ized
EFR
ETS
enso
r
0.0
0.2
0.4
0.6
0.8
1.0
0 2 4 6 8 10 12
CHY
0.8
0.0
CHYCSYCH49Y
S3
CH115Y
CH91Y
CH65Y
CH49Y
CH18Y
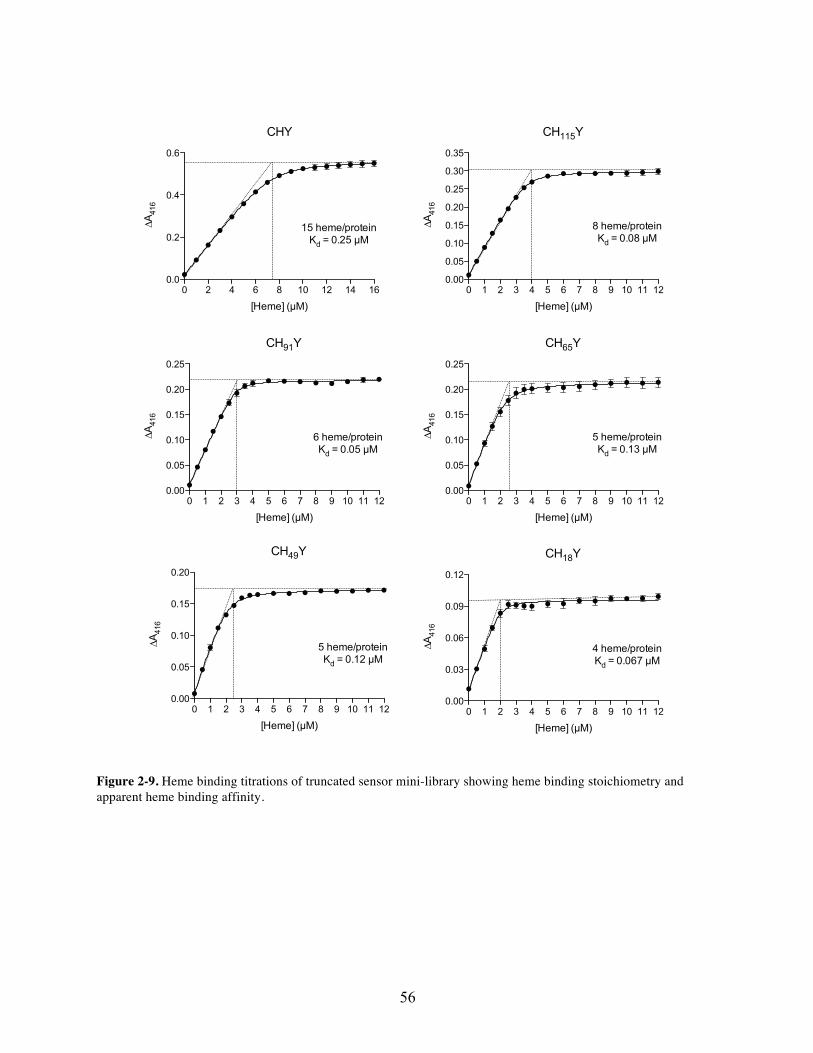
56
Figure 2-9. Heme binding titrations of truncated sensor mini-library showing heme binding stoichiometry and apparent heme binding affinity.
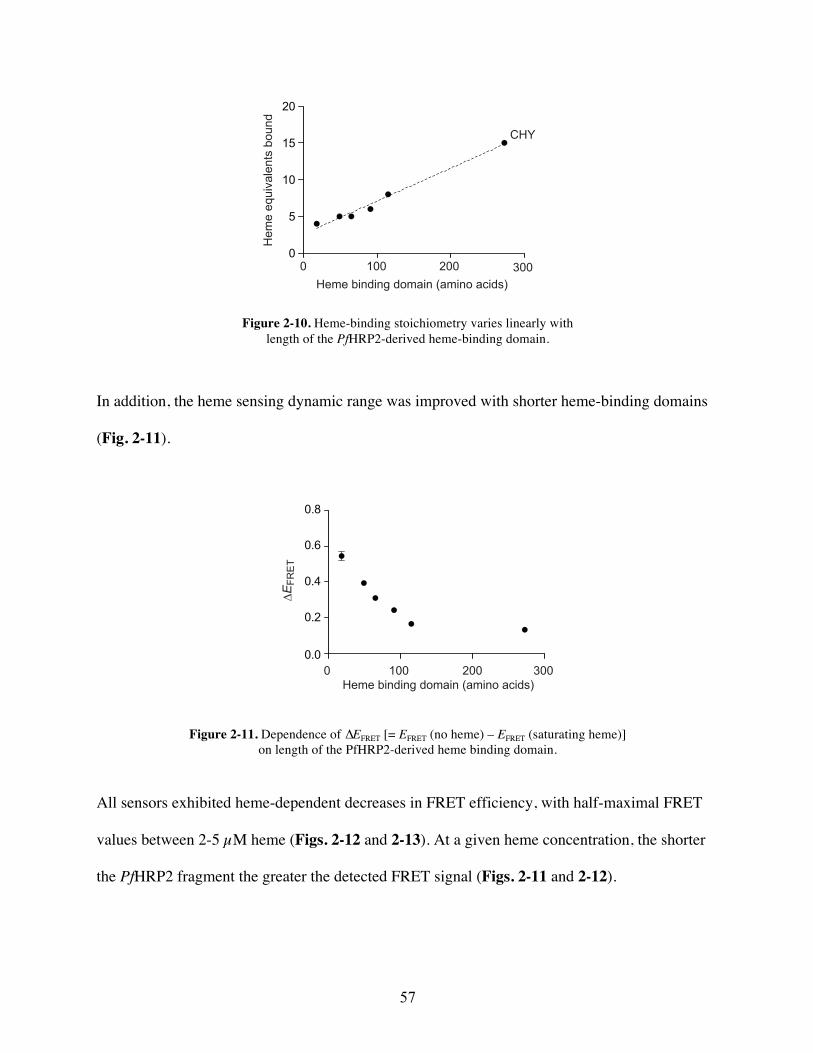
57
Figure 2-10. Heme-binding stoichiometry varies linearly with length of the PfHRP2-derived heme-binding domain.
In addition, the heme sensing dynamic range was improved with shorter heme-binding domains
(Fig. 2-11).
Figure 2-11. Dependence of ∆EFRET [= EFRET (no heme) – EFRET (saturating heme)] on length of the PfHRP2-derived heme binding domain.
All sensors exhibited heme-dependent decreases in FRET efficiency, with half-maximal FRET
values between 2-5 µM heme (Figs. 2-12 and 2-13). At a given heme concentration, the shorter
the PfHRP2 fragment the greater the detected FRET signal (Figs. 2-11 and 2-12).
b
Kd,app (µM)
0.25
0.082
0.050
0.13
0.12
0.067
CHY37 309
273 aaECFP EYFP
CH115Y309195
115 aaECFP EYFP
CH91Y309219
91 aaECFP EYFP
CH65Y309243
65 aaECFP EYFP
CH49Y309261
49 aaECFP EYFPMEME (no SSC)7.2.2012 07:42
0
1
2
bits
1
G
2
C
3CAT
4
C
5A 6
CT
7
C
8A 9T 10
G
11
TC
12
TA x 34
PfHRP2
Construct
CH18YECFP EYFP Heme binding domain (amino acids)0 100 200 300
0
5
10
15
20
Hem
e eq
uiva
lent
s bo
und
a
∆EFR
ET
Heme binding domain (amino acids)0 100 200 300
0.2
0.4
0.6
0.00 2 4 6 8 10 12
[Heme] (µM)
0.1
0.2
0.3
0.4
0.5
EFR
ET
[Heme] (µM)
Nor
mal
ized
EFR
ETS
enso
r
0.0
0.2
0.4
0.6
0.8
1.0
0 2 4 6 8 10 12
CHY
0.8
0.0
CHYCSYCH49Y
b
Kd,app (µM)
0.25
0.082
0.050
0.13
0.12
0.067
CHY37 309
273 aaECFP EYFP
CH115Y309195
115 aaECFP EYFP
CH91Y309219
91 aaECFP EYFP
CH65Y309243
65 aaECFP EYFP
CH49Y309261
49 aaECFP EYFPMEME (no SSC)7.2.2012 07:42
0
1
2
bits
1
G
2
C
3CAT
4
C5A 6
CT
7
C8A 9T 10
G11
TC
12
TA x 34
PfHRP2
Construct
CH18YECFP EYFP Heme binding domain (amino acids)0 100 200 300
0
5
10
15
20
Hem
e eq
uiva
lent
s bo
und
a
∆EFR
ET
Heme binding domain (amino acids)0 100 200 300
0.2
0.4
0.6
0.00 2 4 6 8 10 12
[Heme] (µM)
0.1
0.2
0.3
0.4
0.5
EFR
ET
[Heme] (µM)
Nor
mal
ized
EFR
ETS
enso
r
0.0
0.2
0.4
0.6
0.8
1.0
0 2 4 6 8 10 12
CHY
0.8
0.0
CHYCSYCH49Y

58
Figure 2-12. Heme-dependent changes in FRET efficiency for the mini-library of truncated sensors.
S5
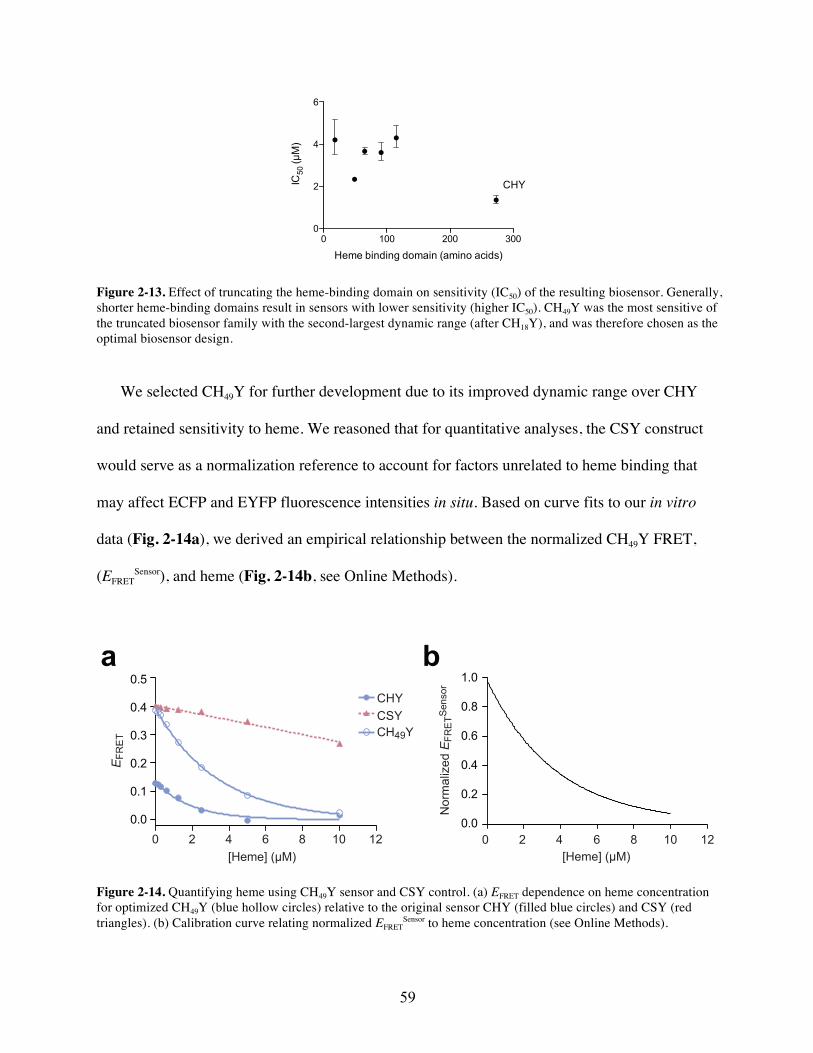
59
Figure 2-13. Effect of truncating the heme-binding domain on sensitivity (IC50) of the resulting biosensor. Generally, shorter heme-binding domains result in sensors with lower sensitivity (higher IC50). CH49Y was the most sensitive of the truncated biosensor family with the second-largest dynamic range (after CH18Y), and was therefore chosen as the optimal biosensor design.
We selected CH49Y for further development due to its improved dynamic range over CHY
and retained sensitivity to heme. We reasoned that for quantitative analyses, the CSY construct
would serve as a normalization reference to account for factors unrelated to heme binding that
may affect ECFP and EYFP fluorescence intensities in situ. Based on curve fits to our in vitro
data (Fig. 2-14a), we derived an empirical relationship between the normalized CH49Y FRET,
(EFRETSensor), and heme (Fig. 2-14b, see Online Methods).
Figure 2-14. Quantifying heme using CH49Y sensor and CSY control. (a) EFRET dependence on heme concentration for optimized CH49Y (blue hollow circles) relative to the original sensor CHY (filled blue circles) and CSY (red triangles). (b) Calibration curve relating normalized EFRET
Sensor to heme concentration (see Online Methods).
S6
b
Kd,app (µM)
0.25
0.082
0.050
0.13
0.12
0.067
CHY37 309
273 aaECFP EYFP
CH115Y309195
115 aaECFP EYFP
CH91Y309219
91 aaECFP EYFP
CH65Y309243
65 aaECFP EYFP
CH49Y309261
49 aaECFP EYFPMEME (no SSC)7.2.2012 07:42
0
1
2
bits
1
G
2
C
3CAT
4
C
5A 6
CT
7
C
8A 9T 10
G
11
TC
12
TA x 34
PfHRP2
Construct
CH18YECFP EYFP Heme binding domain (amino acids)0 100 200 300
0
5
10
15
20H
eme
equi
vale
nts
boun
d
a
∆EFR
ET
Heme binding domain (amino acids)0 100 200 300
0.2
0.4
0.6
0.00 2 4 6 8 10 12
[Heme] (µM)
0.1
0.2
0.3
0.4
0.5
EFR
ET
[Heme] (µM)
Nor
mal
ized
EFR
ETS
enso
r
0.0
0.2
0.4
0.6
0.8
1.0
0 2 4 6 8 10 12
CHY
0.8
0.0
CHYCSYCH49Y
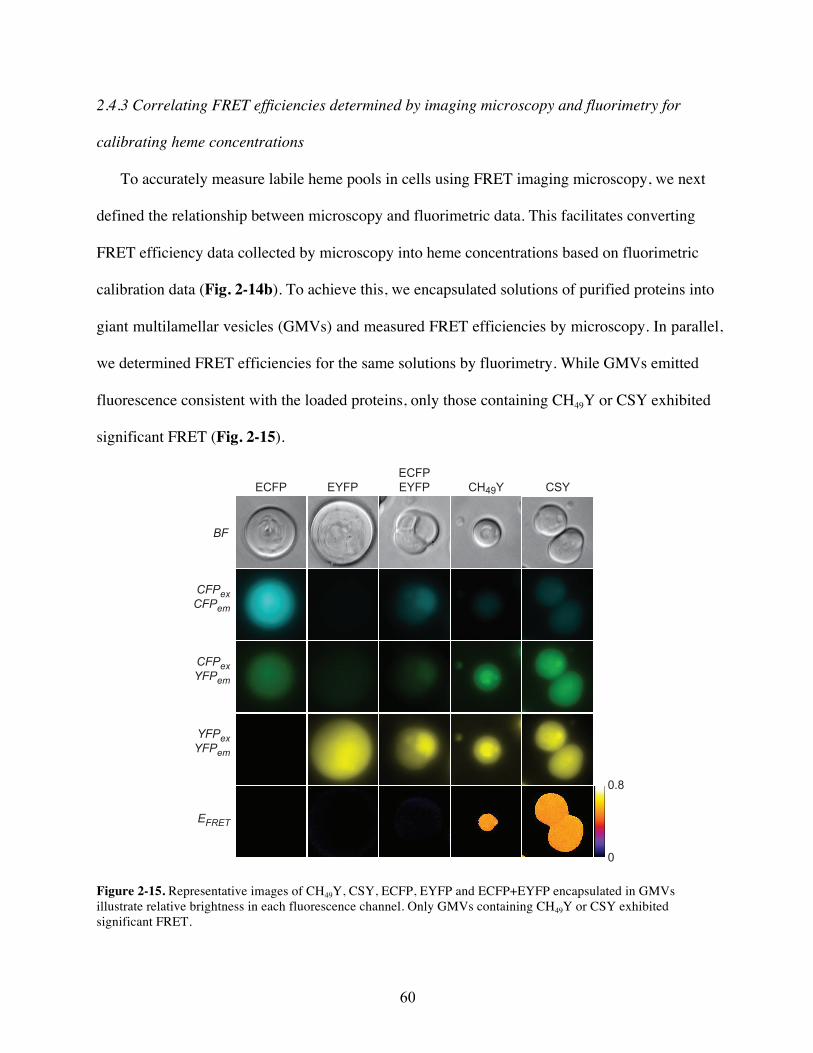
60
2.4.3 Correlating FRET efficiencies determined by imaging microscopy and fluorimetry for
calibrating heme concentrations
To accurately measure labile heme pools in cells using FRET imaging microscopy, we next
defined the relationship between microscopy and fluorimetric data. This facilitates converting
FRET efficiency data collected by microscopy into heme concentrations based on fluorimetric
calibration data (Fig. 2-14b). To achieve this, we encapsulated solutions of purified proteins into
giant multilamellar vesicles (GMVs) and measured FRET efficiencies by microscopy. In parallel,
we determined FRET efficiencies for the same solutions by fluorimetry. While GMVs emitted
fluorescence consistent with the loaded proteins, only those containing CH49Y or CSY exhibited
significant FRET (Fig. 2-15).
Figure 2-15. Representative images of CH49Y, CSY, ECFP, EYFP and ECFP+EYFP encapsulated in GMVs illustrate relative brightness in each fluorescence channel. Only GMVs containing CH49Y or CSY exhibited significant FRET.
bECFP EYFP
ECFPEYFP CH49Y CSY
0.8
0
CFPexCFPem
CFPexYFPem
YFPexYFPem
EFRET
BF
a
c
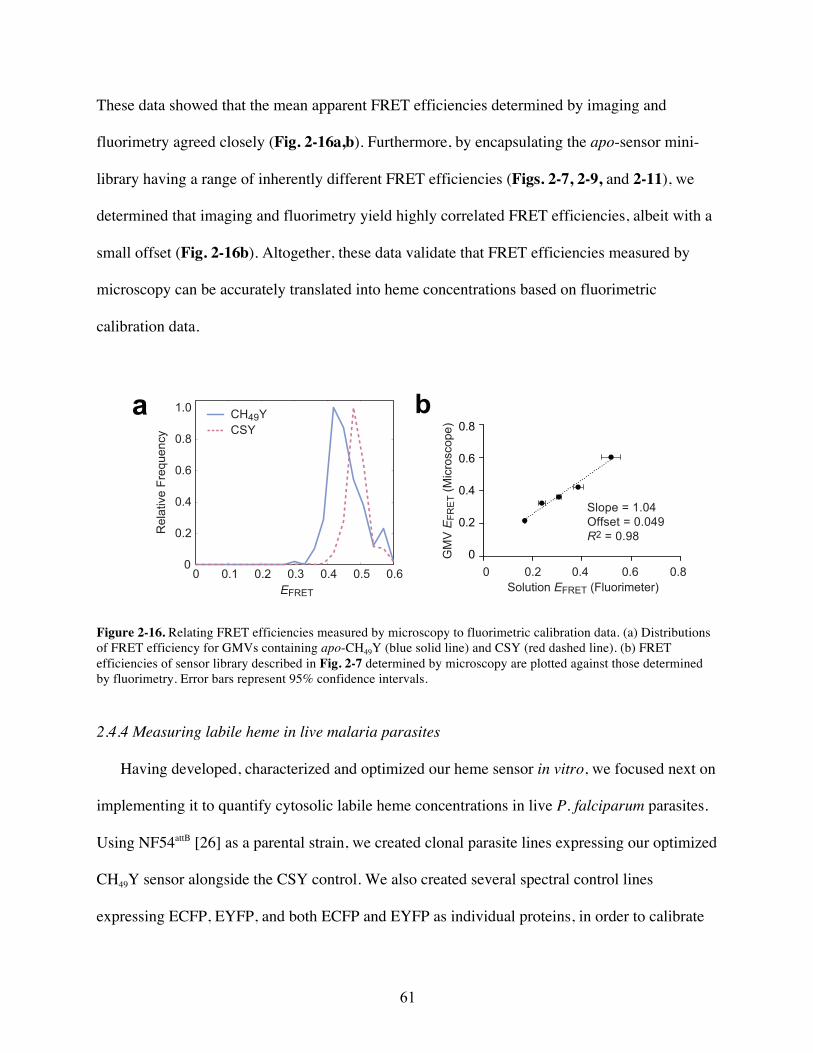
61
These data showed that the mean apparent FRET efficiencies determined by imaging and
fluorimetry agreed closely (Fig. 2-16a,b). Furthermore, by encapsulating the apo-sensor mini-
library having a range of inherently different FRET efficiencies (Figs. 2-7, 2-9, and 2-11), we
determined that imaging and fluorimetry yield highly correlated FRET efficiencies, albeit with a
small offset (Fig. 2-16b). Altogether, these data validate that FRET efficiencies measured by
microscopy can be accurately translated into heme concentrations based on fluorimetric
calibration data.
Figure 2-16. Relating FRET efficiencies measured by microscopy to fluorimetric calibration data. (a) Distributions of FRET efficiency for GMVs containing apo-CH49Y (blue solid line) and CSY (red dashed line). (b) FRET efficiencies of sensor library described in Fig. 2-7 determined by microscopy are plotted against those determined by fluorimetry. Error bars represent 95% confidence intervals.
2.4.4 Measuring labile heme in live malaria parasites
Having developed, characterized and optimized our heme sensor in vitro, we focused next on
implementing it to quantify cytosolic labile heme concentrations in live P. falciparum parasites.
Using NF54attB [26] as a parental strain, we created clonal parasite lines expressing our optimized
CH49Y sensor alongside the CSY control. We also created several spectral control lines
expressing ECFP, EYFP, and both ECFP and EYFP as individual proteins, in order to calibrate
0 0.1 0.2 0.3 0.4 0.5 0.60
0.2
0.4
0.6
0.8
1.0
EFRET
Rel
ativ
e Fr
eque
ncy
a CH49YCSY
b
0
0.2
0.4
0.6
0.8
0 0.2 0.4 0.6 0.8
GM
V E
FRE
T (M
icro
scop
e)
Solution EFRET (Fluorimeter)
Slope = 1.04Offset = 0.049R2 = 0.98
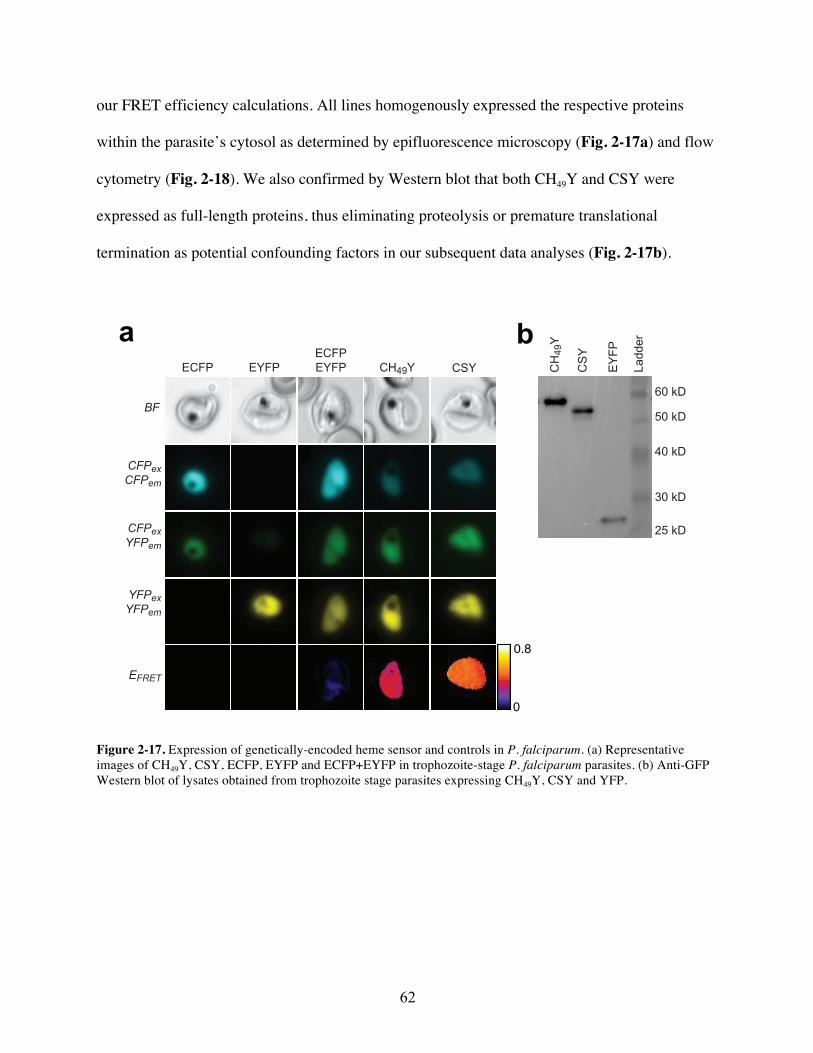
62
our FRET efficiency calculations. All lines homogenously expressed the respective proteins
within the parasite’s cytosol as determined by epifluorescence microscopy (Fig. 2-17a) and flow
cytometry (Fig. 2-18). We also confirmed by Western blot that both CH49Y and CSY were
expressed as full-length proteins, thus eliminating proteolysis or premature translational
termination as potential confounding factors in our subsequent data analyses (Fig. 2-17b).
Figure 2-17. Expression of genetically-encoded heme sensor and controls in P. falciparum. (a) Representative images of CH49Y, CSY, ECFP, EYFP and ECFP+EYFP in trophozoite-stage P. falciparum parasites. (b) Anti-GFP Western blot of lysates obtained from trophozoite stage parasites expressing CH49Y, CSY and YFP.
a
0.8
0
ECFP EYFPECFPEYFP CH49Y CSY
CFPexCFPem
CFPexYFPem
YFPexYFPem
EFRET
BF60 kD
50 kD
40 kD
30 kD
25 kD
CH
49Y
CS
Y
EY
FP
Ladd
erb
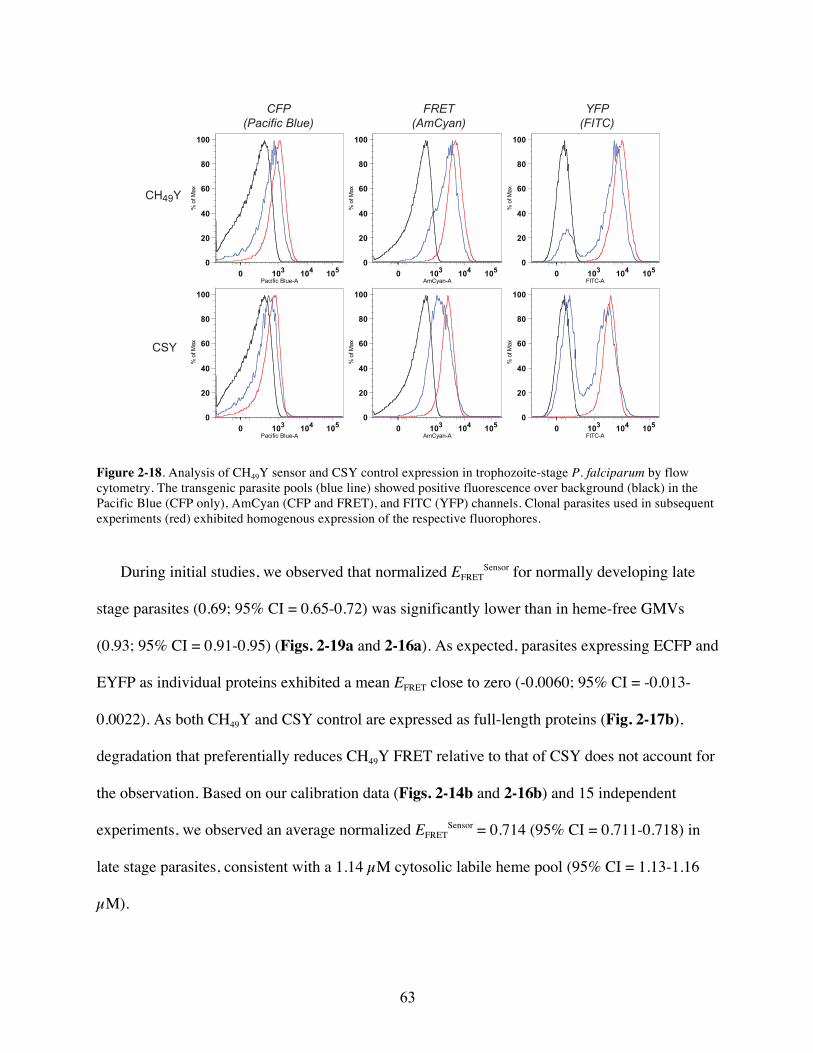
63
Figure 2-18. Analysis of CH49Y sensor and CSY control expression in trophozoite-stage P. falciparum by flow cytometry. The transgenic parasite pools (blue line) showed positive fluorescence over background (black) in the Pacific Blue (CFP only), AmCyan (CFP and FRET), and FITC (YFP) channels. Clonal parasites used in subsequent experiments (red) exhibited homogenous expression of the respective fluorophores.
During initial studies, we observed that normalized EFRETSensor for normally developing late
stage parasites (0.69; 95% CI = 0.65-0.72) was significantly lower than in heme-free GMVs
(0.93; 95% CI = 0.91-0.95) (Figs. 2-19a and 2-16a). As expected, parasites expressing ECFP and
EYFP as individual proteins exhibited a mean EFRET close to zero (-0.0060; 95% CI = -0.013-
0.0022). As both CH49Y and CSY control are expressed as full-length proteins (Fig. 2-17b),
degradation that preferentially reduces CH49Y FRET relative to that of CSY does not account for
the observation. Based on our calibration data (Figs. 2-14b and 2-16b) and 15 independent
experiments, we observed an average normalized EFRETSensor = 0.714 (95% CI = 0.711-0.718) in
late stage parasites, consistent with a 1.14 µM cytosolic labile heme pool (95% CI = 1.13-1.16
µM).
0 103 104 105AmCyan-A
0
20
40
60
80
100
0 103 104 105FITC-A
0
20
40
60
80
100
% o
f Max
0 103 104 105Pacific Blue-A
0
20
40
60
80
100
% o
f Max
0 103 104 105AmCyan-A
0
20
40
60
80
100
% o
f Max
0 103 104 105FITC-A
0
20
40
60
80
100
% o
f Max
0 103 104 105Pacific Blue-A
0
20
40
60
80
100
CH49Y
CSY
CFP(Pacific Blue)
FRET(AmCyan)
YFP(FITC)
% o
f Max
% o
f Max
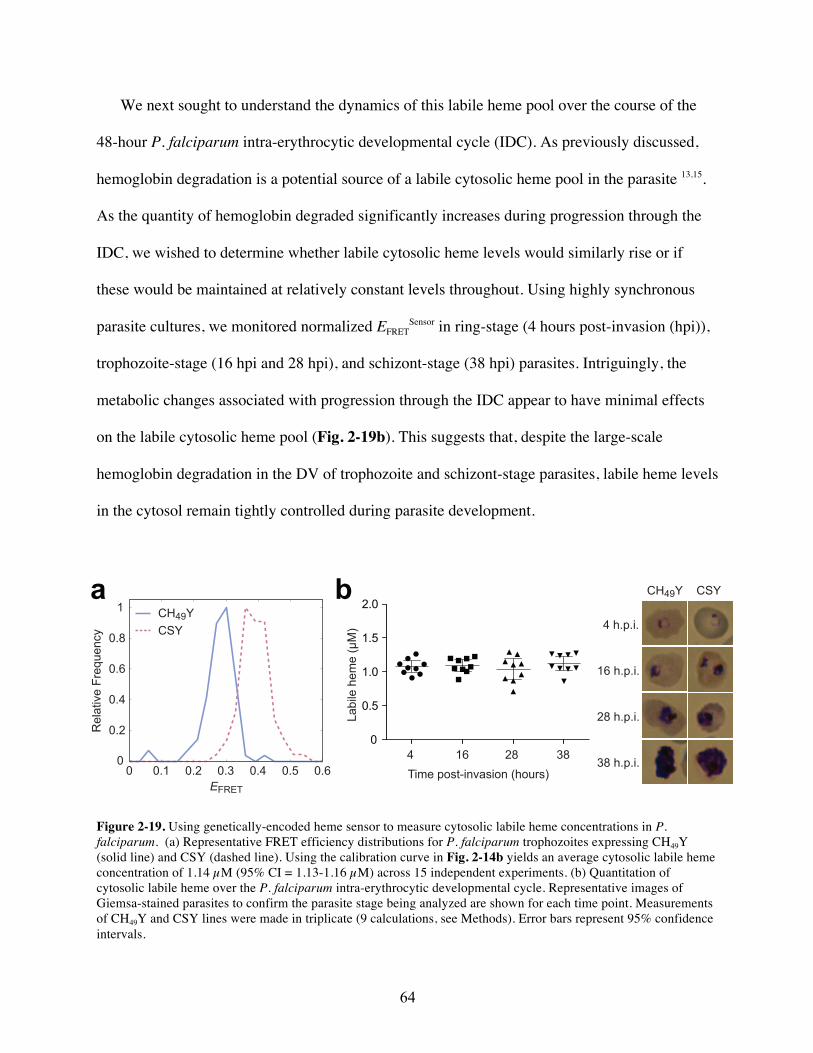
64
We next sought to understand the dynamics of this labile heme pool over the course of the
48-hour P. falciparum intra-erythrocytic developmental cycle (IDC). As previously discussed,
hemoglobin degradation is a potential source of a labile cytosolic heme pool in the parasite 13,15.
As the quantity of hemoglobin degraded significantly increases during progression through the
IDC, we wished to determine whether labile cytosolic heme levels would similarly rise or if
these would be maintained at relatively constant levels throughout. Using highly synchronous
parasite cultures, we monitored normalized EFRETSensor in ring-stage (4 hours post-invasion (hpi)),
trophozoite-stage (16 hpi and 28 hpi), and schizont-stage (38 hpi) parasites. Intriguingly, the
metabolic changes associated with progression through the IDC appear to have minimal effects
on the labile cytosolic heme pool (Fig. 2-19b). This suggests that, despite the large-scale
hemoglobin degradation in the DV of trophozoite and schizont-stage parasites, labile heme levels
in the cytosol remain tightly controlled during parasite development.
Figure 2-19. Using genetically-encoded heme sensor to measure cytosolic labile heme concentrations in P. falciparum. (a) Representative FRET efficiency distributions for P. falciparum trophozoites expressing CH49Y (solid line) and CSY (dashed line). Using the calibration curve in Fig. 2-14b yields an average cytosolic labile heme concentration of 1.14 µM (95% CI = 1.13-1.16 µM) across 15 independent experiments. (b) Quantitation of cytosolic labile heme over the P. falciparum intra-erythrocytic developmental cycle. Representative images of Giemsa-stained parasites to confirm the parasite stage being analyzed are shown for each time point. Measurements of CH49Y and CSY lines were made in triplicate (9 calculations, see Methods). Error bars represent 95% confidence intervals.
0 0.1 0.2 0.3 0.4 0.5 0.60
0.2
0.4
0.6
0.8
1
EFRET
Rel
ativ
e Fr
eque
ncy
CH49YCSY 4 h.p.i.
16 h.p.i.
28 h.p.i.
38 h.p.i.
CH49Y CSY
0
0.5
1.0
1.5
Labi
le h
eme
(µM
)
Time post-invasion (hours)4 16 28 38
2.0a b
65
2.4.5 Quantitative analysis of perturbed heme homeostasis by heme-interacting antimalarials
We next used our heme sensor to gain direct insight into a proposed mechanism of
antimalarial drug action. Heme-interacting antimalarial drugs, such as chloroquine, comprise one
of the most clinically successful classes discovered to date, yet fundamental aspects of their
mechanism of action remain unknown. Indeed, a more detailed understanding of these
mechanisms could potentially be exploited for developing the next generation of antimalarial
drugs that are not immediately susceptible to described resistance mechanisms 27. Heme-binding
antimalarial drugs have been proposed to interfere with detoxification of hemoglobin-derived
heme by inhibiting its polymerization into hemozoin, thereby increasing labile heme
concentrations to toxic levels 10. However, the effects of inhibiting hemozoin formation in the
DV on heme levels in other parasite compartments has been a challenging question to directly
and quantitatively address. Therefore, we sought to use our heme sensor to specifically quantify
changes in the concentration of cytosolic labile heme upon parasite exposure to chloroquine.
We first established that parasites expressing CH49Y and CSY did not show altered
sensitivity to chloroquine by determining IC50 values. We determined that both lines had similar
chloroquine IC50 values of 7.8 nM and 8.4 nM, respectively (Fig. 2-20). These data indicate that
CH49Y does not directly interfere with chloroquine action by sequestering heme and preventing
potential toxic effects associated with any increase in labile heme levels induced by chloroquine.
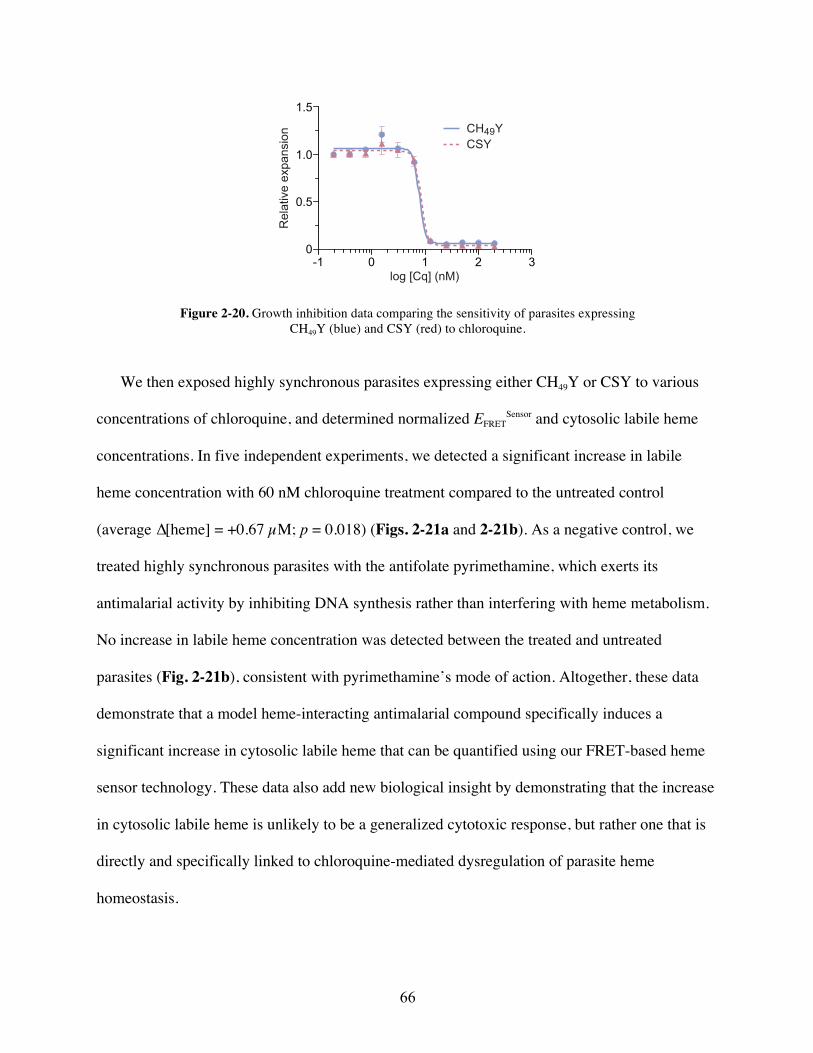
66
Figure 2-20. Growth inhibition data comparing the sensitivity of parasites expressing CH49Y (blue) and CSY (red) to chloroquine.
We then exposed highly synchronous parasites expressing either CH49Y or CSY to various
concentrations of chloroquine, and determined normalized EFRETSensor and cytosolic labile heme
concentrations. In five independent experiments, we detected a significant increase in labile
heme concentration with 60 nM chloroquine treatment compared to the untreated control
(average ∆[heme] = +0.67 µM; p = 0.018) (Figs. 2-21a and 2-21b). As a negative control, we
treated highly synchronous parasites with the antifolate pyrimethamine, which exerts its
antimalarial activity by inhibiting DNA synthesis rather than interfering with heme metabolism.
No increase in labile heme concentration was detected between the treated and untreated
parasites (Fig. 2-21b), consistent with pyrimethamine’s mode of action. Altogether, these data
demonstrate that a model heme-interacting antimalarial compound specifically induces a
significant increase in cytosolic labile heme that can be quantified using our FRET-based heme
sensor technology. These data also add new biological insight by demonstrating that the increase
in cytosolic labile heme is unlikely to be a generalized cytotoxic response, but rather one that is
directly and specifically linked to chloroquine-mediated dysregulation of parasite heme
homeostasis.
log [Cq] (nM)
1.5
1.0
0.5
0
Rel
ativ
e ex
pans
ion
-1 0 1 2 3
CH49YCSY
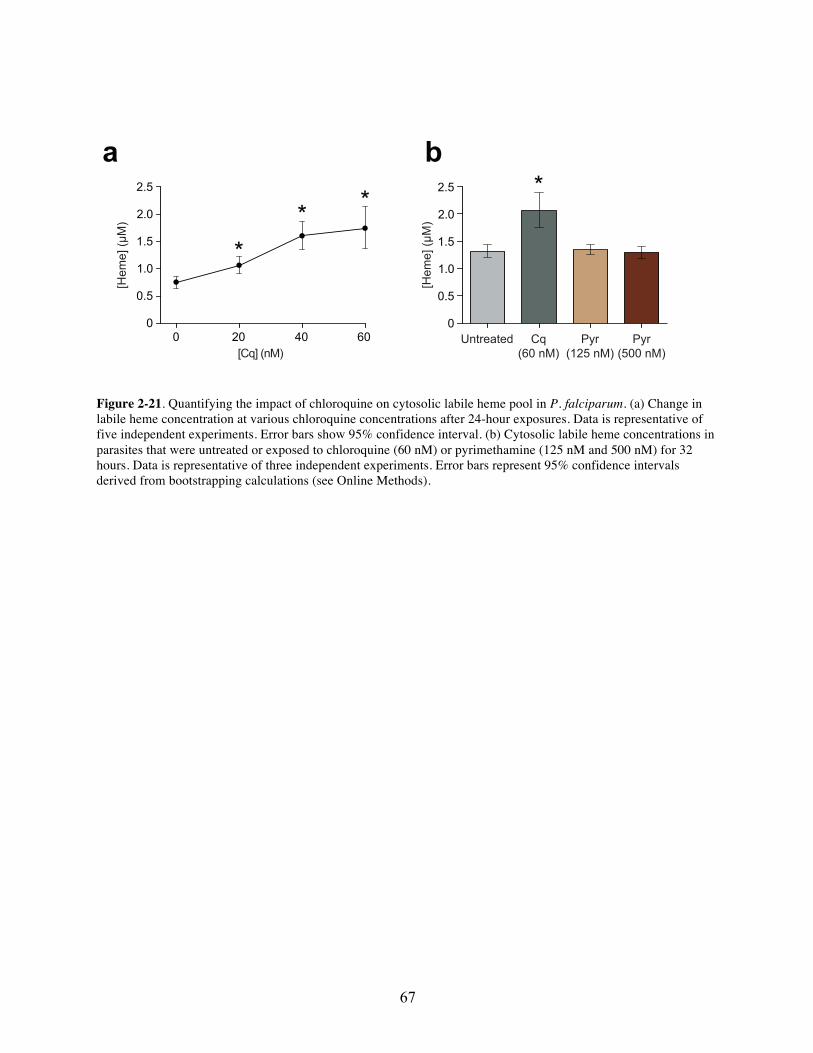
67
Figure 2-21. Quantifying the impact of chloroquine on cytosolic labile heme pool in P. falciparum. (a) Change in labile heme concentration at various chloroquine concentrations after 24-hour exposures. Data is representative of five independent experiments. Error bars show 95% confidence interval. (b) Cytosolic labile heme concentrations in parasites that were untreated or exposed to chloroquine (60 nM) or pyrimethamine (125 nM and 500 nM) for 32 hours. Data is representative of three independent experiments. Error bars represent 95% confidence intervals derived from bootstrapping calculations (see Online Methods).
0
0.5
1.5
2.5
[Cq] (nM)0 20 40 60
ba
2.0
1.0
[Hem
e] (µ
M)
[Hem
e] (µ
M)
Untreated Cq(60 nM)
Pyr(125 nM)
Pyr(500 nM)
0
0.5
1.5
2.5
2.0
1.0
68
2.5 Discussion
Here we report the development, characterization, and application of a novel, FRET-based
heme biosensor to measure cytosolic labile heme levels in live, blood stage P. falciparum
malarial parasites. Our approach is distinct from previous strategies used to measure intracellular
labile heme, in providing the important advantages of obtaining quantitative information using
intact cells and with subcellular resolution. Previous methods have relied on measuring the
heme-dependent activities of L-tryptophan-2,3-dioxygenase and ∂-aminolevulinic acid synthase
(ALAS) 28,29 natively present in the cell type of interest, or recombinantly expressed horseradish
peroxidase (HRP) 30. Fractionation methods have also been reported 16,31. These all require cell
lysis, which makes it difficult to confidently infer subcellular localization of detected labile heme.
Our genetically-encoded sensor facilitates direct visualization of heme in intact cells through
imaging, and can be specifically targeted to different cell compartments using appropriate signal
sequences. Therefore, in principle, it should broadly enable determination of the distribution and
levels of labile heme with subcellular resolution that exceeds previous standards that have relied
on fractionation or bulk cell analyses.
In applying our system to study blood stage P. falciparum, we show for the first time that the
parasite maintains a ~1.1 µM labile cytosolic heme pool throughout its intraerythrocytic
development. Based on earlier work 32, labile heme has been thought to be inherently highly
toxic to the parasite. The observation that heme-binding antimalarial drugs induce accumulation
of membrane-associated heme in treated parasites 33 has further contributed to widespread
acceptance of this hypothesis. This proposal has been based largely on qualitative data, however.
Our findings suggest that malaria parasites do not stringently restrict labile heme. Rather, readily
measurable levels are maintained, and these are consistent with those reported in other
69
eukaryotic cells 34. Thus, it appears that the physiologic requirement for maintaining labile heme
in P. falciparum and other previously studied organisms might be more conserved than
previously thought.
The source of heme used by the parasite to maintain this cytosolic pool is unknown, but
scavenging from the DV, de novo biosynthesis, and uptake from the extracellular compartment
are formal possibilities. Previous qualitative evidence suggests that blood stage parasites
synthesize heme de novo 13,14, but the extent to which this contributes to the heme pool we
measure is unknown. Moreover, recent studies have shown that the parasite’s biosynthetic
pathway is dispensable during blood stage development 13,15, suggesting that biosynthesis may
not be a critical source of heme for the parasite during this stage. Developing parasites are also
known to become increasingly permeable to extracellular low molecular weight solutes via the
new permeability pathway 35, so labile heme could potentially be acquired via this route.
However, the largest obvious flux of heme in blood stage parasites is through hemoglobin
degradation in the DV. Therefore, this seems to be a reasonable candidate source of heme for the
parasite. Additional studies will be needed to definitively address this possibility.
While the exact source and physiologic role(s) of this labile cytosolic heme pool remain to be
defined, our data show that the heme-binding antimalarial drug chloroquine specifically
dysregulates this pool. While chloroquine accumulates to high levels within the DV to interfere
with heme polymerization 10, our data suggest that some of the heme that is not polymerized
escapes the DV to reach the parasite’s cytosol. It is important to emphasize that our sensor likely
responds only to the soluble fraction of released heme, and not the parasite cell membrane-
associated fraction 33. Thus, our measurements do not reflect the total heme flux induced by
chloroquine treatment. This distinction is important, as these two heme pools can potentially
70
induce different outcomes. Membrane-associated heme will likely contribute to cell membrane
damage, while increased soluble heme could either induce cytosolic oxidative stress and/or
directly interfere with critical protein function(s) 36. In this model, both heme pools may directly
contribute to cytotoxicity. Alternatively, as resting labile cytosolic heme levels are already
reasonably high, moderate increases may be tolerated without significantly increased toxicity.
Instead, increases in soluble heme levels may be directly sensed by the parasite to initiate critical
heme-dependent responses, such as changes in transcription 1,37,38, translation and/or proteasome-
mediated protein turnover 39,40, as in other organisms. These may serve to coordinate changes in
DV metabolism with nuclear and cytosolic events that either counteract or exacerbate any
adverse effects induced by increased efflux of labile heme from the DV into the cytoplasm.
The responses to increased heme flux induced by antimalarial compounds likely overlap with
the mechanisms for maintaining heme homeostasis. Guided by our new quantitative
understanding of labile heme levels in P. falciparum, elucidating these mechanisms can stimulate
new therapeutic strategies that recapitulate important aspects of chloroquine’s antimalarial
mode(s) of action, while circumventing resistance mechanisms that have made it increasingly
ineffective. Novel compounds that induce dysregulation of parasite labile heme pools and/or key
heme-regulated processes may be especially promising leads given the extraordinary success of
the 4-aminoquinoline antimalarial drug class.
Here, we have used our technology to examine a longstanding gap in our knowledge of labile
heme pools in the malaria parasite. However, this approach is broadly applicable to studying
other cellular systems where a quantitative understanding of intracellular labile heme pools is
still noticeably absent. For instance, many pathogenic bacteria of human health relevance, such
as S. aureus and N. meningitidis, delicately balance heme synthesis, acquisition, sequestration
71
and degradation/extrusion to minimize toxicity due to excess intracellular heme accumulation 41.
Various molecular mechanisms mediating each of these outcomes and their heme-dependent
responses have been described, and these are clearly linked to pathogenicity 41. However, critical
insights into the actual intracellular heme concentrations that define a toxic threshold or that
integrates these mechanisms to ensure proper heme homeostasis are still lacking. Application of
our technology here could yield new insights into heme homeostasis, and establish a stronger
quantitative basis for the fundamental link between this central cofactor and infectious disease
caused by very distinct pathogens.
72
2.6 References 1. Girvan, H. M. & Munro, A. W. Heme sensor proteins. J Biol Chem 288, 13194-13203,
doi:10.1074/jbc.R112.422642 (2013). 2. Poulos, T. L. Heme enzyme structure and function. Chem Rev 114, 3919-3962,
doi:10.1021/cr400415k (2014). 3. Khan, A. A. & Quigley, J. G. Control of intracellular heme levels: heme transporters and
heme oxygenases. Biochim Biophys Acta 1813, 668-682, doi:10.1016/j.bbamcr.2011.01.008 (2011).
4. Ziegler, J., Linck, R. & Wright, D. W. Heme Aggregation inhibitors: antimalarial drugs targeting an essential biomineralization process. Curr Med Chem 8, 171-189 (2001).
5. Pluth, M. D., Tomat, E. & Lippard, S. J. Biochemistry of mobile zinc and nitric oxide revealed by fluorescent sensors. Annu Rev Biochem 80, 333-355, doi:10.1146/annurev-biochem-061009-091643 (2011).
6. Que, E. L., Domaille, D. W. & Chang, C. J. Metals in neurobiology: probing their chemistry and biology with molecular imaging. Chem Rev 108, 1517-1549, doi:10.1021/cr078203u (2008).
7. WHO Global Malaria Programme. World Malaria Report 2014. (World Health Organization).
8. Egan, T. J. et al. Fate of haem iron in the malaria parasite Plasmodium falciparum. Biochem J 365, 343-347, doi:10.1042/BJ20020793 (2002).
9. Esposito, A. et al. FRET imaging of hemoglobin concentration in Plasmodium falciparum-infected red cells. PLoS ONE 3, e3780, doi:10.1371/journal.pone.0003780 (2008).
10. Francis, S. E., Sullivan, D. J. & Goldberg, D. E. Hemoglobin metabolism in the malaria parasite Plasmodium falciparum. Annu Rev Microbiol 51, 97-123, doi:10.1146/annurev.micro.51.1.97 (1997).
11. Hanssen, E. et al. Soft X-ray microscopy analysis of cell volume and hemoglobin content in erythrocytes infected with asexual and sexual stages of Plasmodium falciparum. J Struct Biol 177, 224-232, doi:10.1016/j.jsb.2011.09.003 (2012).
12. Gardner, M. J. et al. Genome sequence of the human malaria parasite Plasmodium falciparum. Nature 419, 498-511, doi:10.1038/nature01097 (2002).
13. Nagaraj, V. A. et al. Malaria parasite-synthesized heme is essential in the mosquito and liver stages and complements host heme in the blood stages of infection. PLoS Pathog 9, e1003522, doi:10.1371/journal.ppat.1003522 (2013).
14. Surolia, N. & Padmanaban, G. de novo biosynthesis of heme offers a new chemotherapeutic target in the human malarial parasite. Biochem Biophys Res Commun 187, 744-750 (1992).
15. Ke, H. et al. The Heme Biosynthesis Pathway is Essential for Plasmodium falciparum Development in Mosquito Stage but not in Blood Stages. J Biol Chem, doi:10.1074/jbc.M114.615831 (2014).
16. Combrinck, J. M. et al. Insights into the role of heme in the mechanism of action of antimalarials. ACS Chem Biol 8, 133-137, doi:10.1021/cb300454t (2013).
17. Atamna, H. & Ginsburg, H. Heme degradation in the presence of glutathione. A proposed mechanism to account for the high levels of non-heme iron found in the membranes of hemoglobinopathic red blood cells. J Biol Chem 270, 24876-24883 (1995).
73
18. Schneider, E. L. & Marletta, M. A. Heme binding to the histidine-rich protein II from Plasmodium falciparum. Biochemistry 44, 979-986, doi:10.1021/bi048570p (2005).
19. Sullivan, D. J., Gluzman, I. Y. & Goldberg, D. E. Plasmodium hemozoin formation mediated by histidine-rich proteins. Science 271, 219-222 (1996).
20. Akompong, T. et al. Trans expression of a Plasmodium falciparum histidine-rich protein II (HRPII) reveals sorting of soluble proteins in the periphery of the host erythrocyte and disrupts transport to the malarial food vacuole. J Biol Chem 277, 28923-28933, doi:10.1074/jbc.M201968200 (2002).
21. Choi, C. Y., Cerda, J. F., Chu, H. A., Babcock, G. T. & Marletta, M. A. Spectroscopic characterization of the heme-binding sites in Plasmodium falciparum histidine-rich protein 2. Biochemistry 38, 16916-16924 (1999).
22. Evers, T. H., van Dongen, E. M. W. M., Faesen, A. C., Meijer, E. W. & Merkx, M. Quantitative understanding of the energy transfer between fluorescent proteins connected via flexible peptide linkers. Biochemistry 45, 13183-13192, doi:10.1021/bi061288t (2006).
23. Takeda, S., Kamiya, N., Arai, R. & Nagamune, T. Design of an artificial light-harvesting unit by protein engineering: cytochrome b(562)-green fluorescent Protein chimera. Biochem Biophys Res Commun 289, 299-304, doi:10.1006/bbrc.2001.5966 (2001).
24. Pandey, A. V., Joshi, R., Tekwani, B. L., Singh, R. L. & Chauhan, V. S. Synthetic peptides corresponding to a repetitive sequence of malarial histidine rich protein bind haem and inhibit haemozoin formation in vitro. Mol Biochem Parasitol 90, 281-287 (1997).
25. Ziegler, J., Chang, R. T. & Wright, D. W. Multiple-antigenic peptides of histidine-rich protein II of Plasmodium falciparum: Dendrimeric biomineralization templates. J Am Chem Soc {121}, {2395-2400}, doi:{10.1021/ja983220+} (1999).
26. Adjalley, S. H. et al. Quantitative assessment of Plasmodium falciparum sexual development reveals potent transmission-blocking activity by methylene blue. Proc Natl Acad Sci USA 108, E1214-1223, doi:10.1073/pnas.1112037108 (2011).
27. Sidhu, A. B. S., Verdier-Pinard, D. & Fidock, D. A. Chloroquine resistance in Plasmodium falciparum malaria parasites conferred by pfcrt mutations. Science 298, 210-213, doi:10.1126/science.1074045 (2002).
28. Granick, S., Sinclair, P., Sassa, S. & Grieninger, G. Effects by heme, insulin, and serum albumin on heme and protein synthesis in chick embryo liver cells cultured in a chemically defined medium, and a spectrofluorometric assay for porphyrin composition. J Biol Chem 250, 9215-9225 (1975).
29. Lincoln, B. C., Alvarado, A., Setty, N. & Bonkovsky, H. L. Tryptophan 2,3-Dioxygenase in Chick-Embryo Hepatocytes - Studies Inovo and in Culture. Proceedings of the Society for Experimental Biology and Medicine 188, 308-315 (1988).
30. White, C. et al. HRG1 is essential for heme transport from the phagolysosome of macrophages during erythrophagocytosis. Cell Metab 17, 261-270, doi:10.1016/j.cmet.2013.01.005 (2013).
31. Liu, S. C., Zhai, S. & Palek, J. Detection of hemin release during hemoglobin S denaturation. Blood 71, 1755-1758 (1988).
32. Orjih, A. U., Banyal, H. S., Chevli, R. & Fitch, C. D. Hemin lyses malaria parasites. Science 214, 667-669 (1981).
74
33. Ginsburg, H., Famin, O., Zhang, J. & Krugliak, M. Inhibition of glutathione-dependent degradation of heme by chloroquine and amodiaquine as a possible basis for their antimalarial mode of action. Biochem Pharmacol 56, 1305-1313 (1998).
34. Garrick, M. D. et al. Evidence for and consequences of chronic heme deficiency in Belgrade rat reticulocytes. Biochim Biophys Acta 1449, 125-136 (1999).
35. Martin, R. E., Ginsburg, H. & Kirk, K. Membrane transport proteins of the malaria parasite. Mol Microbiol 74, 519-528, doi:10.1111/j.1365-2958.2009.06863.x (2009).
36. Radfar, A., Diez, A. & Bautista, J. M. Chloroquine mediates specific proteome oxidative damage across the erythrocytic cycle of resistant Plasmodium falciparum. Free Radic Biol Med 44, 2034-2042, doi:10.1016/j.freeradbiomed.2008.03.010 (2008).
37. Ogawa, K. et al. Heme mediates derepression of Maf recognition element through direct binding to transcription repressor Bach1. EMBO J 20, 2835-2843, doi:10.1093/emboj/20.11.2835 (2001).
38. Smart, J. L. & Bauer, C. E. Tetrapyrrole biosynthesis in Rhodobacter capsulatus is transcriptionally regulated by the heme-binding regulatory protein, HbrL. J Bacteriol 188, 1567-1576, doi:10.1128/JB.188.4.1567-1576.2006 (2006).
39. Hu, R.-G., Wang, H., Xia, Z. & Varshavsky, A. The N-end rule pathway is a sensor of heme. Proc Natl Acad Sci USA 105, 76-81, doi:10.1073/pnas.0710568105 (2008).
40. Yang, F., Xia, X., Lei, H.-Y. & Wang, E.-D. Hemin Binds to Human Cytoplasmic Arginyl-tRNA Synthetase and Inhibits Its Catalytic Activity. J Biol Chem 285, 39437-39446, doi:10.1074/jbc.M110.159913 (2010).
41. Anzaldi, L. L. & Skaar, E. P. Overcoming the heme paradox: heme toxicity and tolerance in bacterial pathogens. Infect Immun 78, 4977-4989, doi:10.1128/IAI.00613-10 (2010).
42. Bailey, T. L. & Elkan, C. Fitting a mixture model by expectation maximization to discover motifs in biopolymers. Proc Int Conf Intell Syst Mol Biol 2, 28-36 (1994).
43. Clegg, R. M. Fluorescence resonance energy transfer and nucleic acids. Meth Enzymol 211, 353-388 (1992).
44. Kolossov, V. L. et al. Engineering redox-sensitive linkers for genetically encoded FRET-based biosensors. Exp Biol Med (Maywood) 233, 238-248, doi:10.3181/0707-RM-192 (2008).
45. Nkrumah, L. J. et al. Efficient site-specific integration in Plasmodium falciparum chromosomes mediated by mycobacteriophage Bxb1 integrase. Nat Methods 3, 615-621, doi:10.1038/nmeth904 (2006).
46. Hodgson, L., Shen, F. & Hahn, K. Biosensors for characterizing the dynamics of rho family GTPases in living cells. Current protocols in cell biology / editorial board, Juan S Bonifacino [et al] Chapter 14, Unit 14.11.11-26, doi:10.1002/0471143030.cb1411s46 (2010).
47. Schindelin, J. et al. Fiji: an open-source platform for biological-image analysis. Nat Methods 9, 676-682, doi:10.1038/nmeth.2019 (2012).
75
2.7 Appendix: MATLAB Scripts
2.7.1. Calculate heme concentration and confidence intervals from image data
% Takes two column vectors as input: % X = CH49Y FRET Sensor, S = CSY FRET+ Control % Each vector consists of cell-wide averages of FRET efficiency % Vectors of means and variances for each bootstrap sample size means = []; vars = []; bootstrap_ratios = []; resample_number = 10000; % number of times calculation is performed test_resample_size = 0; % test sensitivity to size of bootstrap dataset? if test_resample_size % test how mean & variance are affected by size % of subsamples max_resample_size = 100; % set maximum size of subsample to test for resample_size = 1:max_resample_size bootstrap_ratios = []; % vector of ratios of bootstrapped means for(i = 1:resample_number) % loop for resampling & ratio calculation % resample FRET sensor dataset bootstrap_x = datasample(X, resample_size);
% resample FRET+ control dataset bootstrap_s = datasample(S, resample_size); % calculate ratio of means, converting microscopy to % fluorimetry EFRET values by subtracting y-intercept % (0.04897)... remember that image values are ratio*1000 avg_subset_ratio = (mean(bootstrap_x) - 48.97) /(mean(bootstrap_s) – 48.97); % create output dataset bootstrap_ratios = [bootstrap_ratios; avg_subset_ratio]; end means = [means; mean(bootstrap_ratios)] % mean of output dataset vars = [vars; var(bootstrap_ratios)]; % variance of output datset end xvalues = 1:max_resample_size; plot(xvalues, means); % plot mean vs. subsample size xlabel('Bootstrap Dataset Size') ylabel('FRET Ratio (Sensor/Control)') figure plot(xvalues, vars); % plot variance vs. subsample size xlabel('Bootstrap Dataset Size') ylabel('Variance in FRET Ratio') else % perform bootstrapping on full-size datasets for(j = 1:resample_number) % loop to do resampling & ratio calculation % resample FRET sensor datset bootstrap_x = datasample(X, length(X)); % resample FRET+ control dataset bootstrap_s = datasample(S, length(S));
76
% calculate ratio of means, converting microscopy to % fluorimetry EFRET values by subtracting y-intercept % (0.04897)... remember that image values are ratio*1000 avg_subset_ratio = (mean(bootstrap_x) - 48.97) / (mean(bootstrap_s) - 48.97); % create output dataset bootstrap_ratios = [bootstrap_ratios; avg_subset_ratio]; end hist(bootstrap_ratios, 100); % display histogram of bootstrapped ratios xlabel('FRET Ratio (Sensor/Control)') avgRatio = mean(bootstrap_ratios) % mean of bootstrapped ratios % sort dataset to calculate confidence intervals sorted_ratios = sort(bootstrap_ratios); % 2.5th percentile for two-tailed 95% CI bootstrap_lowCI = sorted_ratios(round(0.025*length(sorted_ratios))) % 97.5th percentile for two-tailed 95% CI bootstrap_highCI = sorted_ratios(round(0.975*length(sorted_ratios))) if ~adtest(bootstrap_ratios) % Anderson-Darling test: is distribution of calculated ratios normal? sigma = sqrt(var(bootstrap_ratios))
% if so, calculate 95% CI based on +/- 2 standard devs from mean normal_lowCI = avgRatio - 2*sigma normal_highCI = avgRatio + 2*sigma end end % Solve for heme concentrations for ratios calculated by bootstrapping syms heme; span = 0.3830; k = 0.2835; plateau = 0; slope = -0.01282; yint = 0.4023; Heme_Avg = double(vpasolve(avgRatio == ((span*exp(-k*heme) + plateau)/(slope*heme + yint)), heme)); Heme_High = double(vpasolve(bootstrap_lowCI == ((span*exp(-k*heme) +
plateau)/(slope*heme + yint)), heme)); Heme_Low = double(vpasolve(bootstrap_highCI == ((span*exp(-k*heme) +
plateau)/(slope*heme + yint)), heme));

77
2.7.2. Calculate average heme concentration and confidence intervals from bootstrapping data
obtained from multiple experiments
% Takes a matrix (master_bootstrap) as input, where each column consists of bootstrap values from a single experiment, and the number of rows is the number of iterations performed for each bootstrapping calculation. The 16 independent experiments in this study yielded a master_bootstrap matrix with dimensions 10000 x 16. for j = 1:length(master_bootstrap) grand_mean(j) = mean(master_bootstrap(j,:)); end hist(grand_mean, 100); % display histogram of bootstrapped ratios xlabel('FRET Ratio (Sensor/Control)') avgRatio = mean(grand_mean) % mean of bootstrapped ratios % sort dataset to calculate confidence intervals sorted_ratios = sort(grand_mean); % 2.5th percentile for two-tailed 95% CI bootstrap_lowCI = sorted_ratios(round(0.025*length(sorted_ratios))) % 97.5th percentile for two-tailed 95% CI bootstrap_highCI = sorted_ratios(round(0.975*length(sorted_ratios))) % Anderson-Darling test: is distribution of calculated ratios normal? if ~adtest(grand_mean) % if so, calculate 95% CI based on +/- 2 standard devs from mean sigma = sqrt(var(grand_mean)) normal_lowCI = avgRatio - 2*sigma normal_highCI = avgRatio + 2*sigma end % Solve for heme concentrations for ratios calculated by bootstrapping syms heme; span = 0.3830; k = 0.2835; plateau = 0; slope = -0.01282; yint = 0.4023; Heme_Avg = double(vpasolve(avgRatio == ((span*exp(-k*heme) +
plateau)/(slope*heme + yint)), heme)); Heme_High = double(vpasolve(bootstrap_lowCI == ((span*exp(-k*heme) +
plateau)/(slope*heme + yint)), heme)); Heme_Low = double(vpasolve(bootstrap_highCI == ((span*exp(-k*heme) +
plateau)/(slope*heme + yint)), heme)
78
CHAPTER 3: USING SYNTHETIC RECEPTORS TO ELUCIDATE HOST CELL
REQUIREMENTS FOR PARASITE INVASION
3.1 Abstract
Research on the parasite P. vivax, a major cause of malaria-associated morbidity, lags behind
that of P. falciparum. Unlike P. falciparum, P. vivax preferentially invades reticulocytes, which
are relatively rare and transient in whole blood, precluding in vitro culture. While P. vivax
merozoites express proteins that preferentially bind reticulocytes, the basis of the parasite’s
invasion tropism remains incompletely understood, mainly due to the inability to link ligand-
receptor binding to invasion. We hypothesize that critical receptors present on the reticulocyte
surface are lost during red blood cell maturation, preventing efficient invasion by the parasite
and precluding propagation in abundant mature red blood cells. Therefore, we have developed a
chemical biology toolkit to immobilize synthetic receptors on the red blood cell surface and
probe the relationship between ligand-receptor interactions and invasion outcomes. Proof-of-
concept experiments using the sialic acid-dependent invasion pathway in P. falciparum
demonstrate that synthetic sialic acid receptors can restore invasion into desialylated red blood
cells, as long as the synthetic glycan exactly recapitulates the native glycan structure. Alternative
receptor structures, which have been shown to inhibit invasion in vitro, appear unable to
facilitate sialic acid-dependent invasion. This suggests that synthetic receptor-based strategies
can provide crucial information about the biochemical context necessary for surface receptors to
support parasite invasion, and can guide future efforts to develop synthetic receptors for P. vivax
culture.
79
3.2 Introduction
The vast majority of human malaria cases are caused by two parasites, Plasmodium
falciparum and P. vivax1. Although P. falciparum causes the majority of malaria-related
mortality, vivax malaria is more widespread and significantly hinders the health, longevity, and
prosperity of the population in endemic areas2. Despite the significant economic and public
health burden imposed by this disease, basic research on P. vivax lags behind that of P.
falciparum2-4. A major advance in P. falciparum research was the development of a practical
method for continuously propagating P. falciparum cultures using mature human red blood cells5
which can be easily obtained. In contrast, P. vivax is extremely difficult to culture in vitro
because it preferentially invades reticulocytes6 which constitute only 1% of the circulating cells
in human whole blood7. Further complicating culture system design is reticulocyte maturation, as
reticulocytes mature rapidly into normocytes in vitro, with a half-life of roughly 30 hours8,
similar to the generation time of blood-stage P. vivax parasites9. Therefore, in vitro culture of P.
vivax relies on a continuous supply of a cell type that is relatively rare and transient in whole
blood.
As a result, long-term in vitro culture of P. vivax is currently impractical because of the labor
and expense involved in obtaining reticulocytes. Reticulocytes can be enriched from human
whole blood using gradient centrifugation, although this process is inefficient and results in low
reticulocyte yields7. Human umbilical cord blood, which is naturally enriched in reticulocytes,
has also been used for P. vivax culture10. However, this method can maintain cultures for only
one month, and requires uninterrupted access to discarded umbilical cords. Infected research
animals can be used to supply P. vivax isolates, as P. vivax also infects Aotus and Saimiri
monkeys11. However, maintaining continuously infected animals for parasite supply is extremely
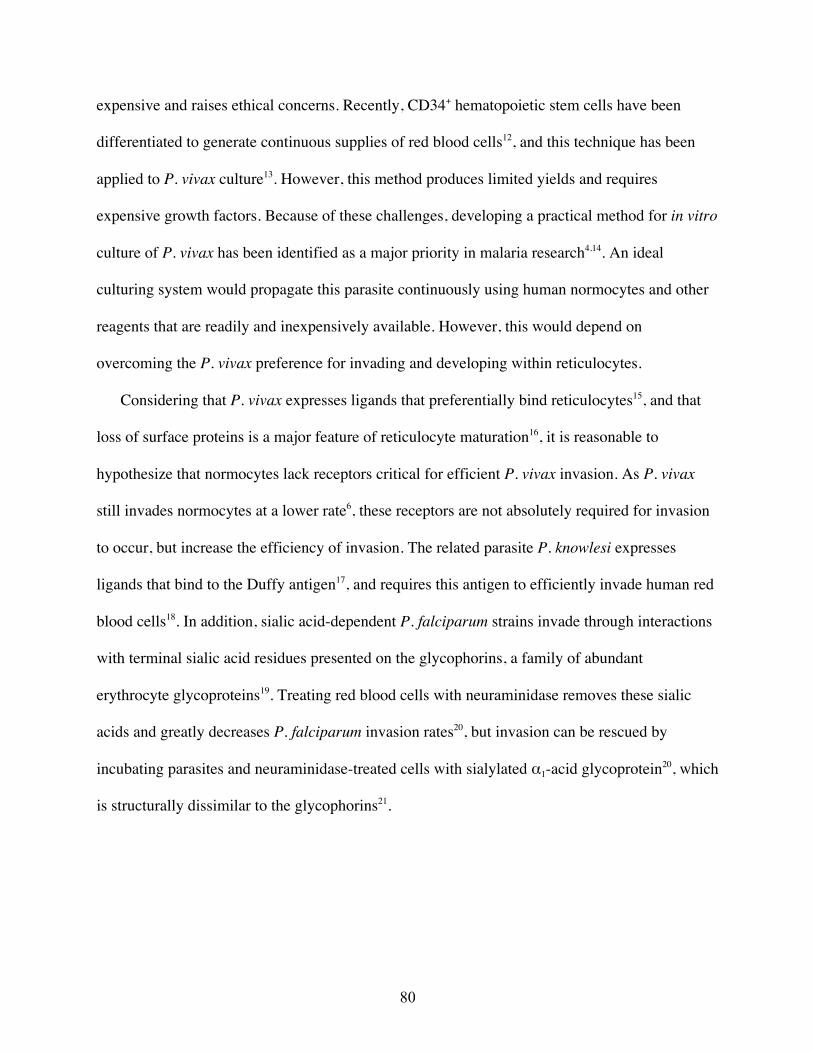
80
expensive and raises ethical concerns. Recently, CD34+ hematopoietic stem cells have been
differentiated to generate continuous supplies of red blood cells12, and this technique has been
applied to P. vivax culture13. However, this method produces limited yields and requires
expensive growth factors. Because of these challenges, developing a practical method for in vitro
culture of P. vivax has been identified as a major priority in malaria research4,14. An ideal
culturing system would propagate this parasite continuously using human normocytes and other
reagents that are readily and inexpensively available. However, this would depend on
overcoming the P. vivax preference for invading and developing within reticulocytes.
Considering that P. vivax expresses ligands that preferentially bind reticulocytes15, and that
loss of surface proteins is a major feature of reticulocyte maturation16, it is reasonable to
hypothesize that normocytes lack receptors critical for efficient P. vivax invasion. As P. vivax
still invades normocytes at a lower rate6, these receptors are not absolutely required for invasion
to occur, but increase the efficiency of invasion. The related parasite P. knowlesi expresses
ligands that bind to the Duffy antigen17, and requires this antigen to efficiently invade human red
blood cells18. In addition, sialic acid-dependent P. falciparum strains invade through interactions
with terminal sialic acid residues presented on the glycophorins, a family of abundant
erythrocyte glycoproteins19. Treating red blood cells with neuraminidase removes these sialic
acids and greatly decreases P. falciparum invasion rates20, but invasion can be rescued by
incubating parasites and neuraminidase-treated cells with sialylated α1-acid glycoprotein20, which
is structurally dissimilar to the glycophorins21.
81
Therefore, we hypothesize that P. vivax is unable to invade normocytes with high efficiency
because critical receptors are lost upon reticulocyte maturation, and that invasion could be
restored by attaching suitable receptors to the normocyte surface (Fig. 3-1).
Figure 3-1. We hypothesize that normocytes (1) are refractory to P. vivax invasion because necessary receptors are missing from the cell surface, and that restoring these interactions in trans (2) should allow invasion to proceed successfully (3).
Due to the aforementioned difficulty of culturing P. vivax in vitro, we turned to the well-
characterized sialic acid-dependent invasion pathway in P. falciparum as a model system for
proof-of-concept studies. The dominant interaction in this pathway is that of the parasite protein
EBA-175 binding to glycophorin A22, one of the most abundant proteins on the red blood cell
surface23. After generating refractory host cells by removing the critical sialic acid residues from
otherwise unaltered human red blood cells, we develop and evaluate multiple methods for
displaying the critical sialic acid receptor in trans. We then use these results to derive parameters
governing productive ligand-receptor interactions that drive sialic acid-dependent parasite
invasion to inform future synthetic receptor designs.
We first quantify the relationship between sialic acid content and invasion efficiency to
establish the theoretical needs for synthetic receptor density on the treated red blood cell surface.
We then use sialyltransferase enzymes to assess the importance of the chemical linkage type
(1) (2) (3)
82
between the terminal sialic acid and the underlying glycan moiety, demonstrating that the
parasite discriminates between native and non-native terminal sialic acid linkages. We finally
demonstrate two broadly applicable biochemical strategies for immobilizing alternate receptor
structures on the cell surface at high density. We show that while our immobilization strategies
are effective, the resulting receptors cannot facilitate parasite invasion, suggesting that
productive ligand-receptor interactions are highly specific to receptor structure.
83
3.3 Methods 3.3.1 Malaria parasite culture
Blood-stage P. falciparum parasites were cultured at 2% hematocrit in 5% O2 and 5% CO2 in
RPMI-complete media (RPMI 1640 Medium supplemented with 5 g/l AlbuMAX II [Life
Technologies], 2 g/l NaHCO3, 25 mM HEPES-KOH pH 7.4, 1 mM hypoxanthine, and 50 mg/l
gentamicin). P. falciparum strains 3D7, Dd2, and W2mef were obtained from the Malaria
Reference and Reagent Resource Center (MR4). Parasite cultures were synchronized by
centrifugation, resuspension in 0.3M L-alanine (Research Products International) supplemented
with 25 mM HEPES-KOH pH 7.4, and incubation for 8 minutes at 37˚C. Cultures were then
centrifuged and resuspended in culture media.
3.3.2 Neuraminidase treatment
Human red blood cells (Research Blood Components, Brighton, MA) were washed in wash
media (RPMI 1640 supplemented with 25 mM HEPES-KOH pH 7.4) and resuspended to 50%
hematocrit. Neuraminidase from C. perfringens (New England Biolabs, Ipswich, MA) was added
and the red blood cell suspension was incubated at 37˚C with gentle mixing for 30 minutes. The
neuraminidase-treated red blood cells were then washed extensively with RPMI-Complete
culture media before use.
3.3.3 Sialyltransferase treatment
Neuraminidase-treated red blood cells were resuspended to 50% hematocrit in α2,3 or α2,6
sialyltransferase reaction solution, consisting of 25 mM buffer, 75 mM NaCl, 100 mM glucose,
10 mg/mL bovine serum albumin, and 4.4 mM CMP-sialic acid (Calbiochem, catalog #233264),
84
and sialyltransferase enzyme. Treatment with α2,3 sialyltransferase was performed at 37˚C in 2-
(N-morpholino)ethanesulfonic acid (MES) pH 6.5 with 20 mU recombinant α2,3(O)-
sialyltransferase from rat (Calbiochem, catalog #566227). Treatment with α2,6 sialyltransferase
was performed at 30˚C in bis-Tris pH 6.0 with 50 mU recombinant β-galactoside-α2,6-
sialyltransferase from Photobacterium damselae JT0160 (Catalog #GEJ-001, Cosmo Bio Ltd.,
Tokyo, Japan). Reactions were incubated for 4 hours with gentle mixing. The red blood cell
suspension was then centrifuged gently. Red blood cells treated with α2,3-sialyltransferase were
washed extensively with RPMI-complete media supplemented with 7% glycerol in order to
prevent osmotic lysis. Glycerol was then removed from the red blood cell suspension by a series
of centrifugation and 1:1 dilution steps with RPMI-complete media. Red blood cells treated with
α2,6 sialyltransferase were washed extensively with hypertonic resealing solution (280 mM
NaCl, 40 mM KCl, 11 mM glucose), then RPMI-HEPES, before resuspending in RPMI-
complete media.
3.3.4 Oxime ligation
Oxime ligations were performed as described previously24, but with several modifications.
Packed red blood cells (40µL per sample) were washed in PBS pH 6.0, then simultaneously
treated with neuraminidase and 5U galactose oxidase (Worthington Biochemical, Lakewood, NJ)
for 30 minutes at 37˚C with gentle mixing. Treated cells were washed in RPMI-complete media,
and then with oxime ligation buffer, containing either 10 mM aniline or 100 mM p-anisidine in
PBS pH 6.8. Aminooxy CF488A dye (Biotium, Hayward, CA) or aminooxy glycans
(synthesized as described25) were added to the indicated final concentrations and the reactions
85
were incubated for 1 hour at room temperature. Treated cells were washed extensively with
RPMI-complete media before analysis or use in an invasion assay.
3.3.5 Flow cytometry
Parasite cultures were briefly centrifuged and resuspended in a solution of 1% formaldehyde
in Alsever’s ACD media (114 mM glucose, 27 mM sodium citrate pH 6.1, and 72 mM NaCl) for
fixing and incubated for one hour at room temperature. For incubations longer than one hour
were performed at 4˚C. Suspensions of fixed cells were diluted 1:10 in staining solution,
containing 10 mM Tris-HCl pH 8.8, 138 mM NaCl, and a 1:5000 dilution of SYBR Green I (Life
Technologies) added before each experiment. Fixed cells were incubated in staining solution
before parasites were counted using the FITC channel of an Accuri C6 flow cytometer (BD
Biosciences).
3.3.6 Fluorimetric sialic acid quantitation
Aliquots of 10µL packed red blood cells were washed and resuspended to 250µL in PBS pH
6.0. Cells were treated with 250U neuraminidase for 30 minutes at 37˚C with gentle mixing.
After neuraminidase treatment, cells were pelleted and 200 µL of each supernatant was harvested
and stored at -80˚C. Standard curves were prepared by serial dilution of N-acetylneuraminic acid
(Sigma-Aldrich) in PBS. Fluorimetric quantitation of sialic acids was performed as described
previously26.
86
3.3.7 HPLC sialic acid quantitation
Samples and standard curves were prepared as described above, except neuraminidase
digestions were performed in 40µL total volume. Supernatants were harvested and sialic acid
was quantified as described previously27. Briefly, cell supernatants were treated with 20µL of a
freshly prepared solution of 0.2 M sodium periodate in 48% phosphoric acid for 20 minutes at
room temperature. To terminate the reaction, 100µL of freshly prepared 10% sodium arsenite in
0.1N sulfuric acid was added slowly, then vortexed until clear and incubated 5 minutes at room
temperature. Finally, 600 µL of thiobarbituric acid (6 mg/mL) was added, and the reaction was
incubated at 100˚C for 15 minutes, then chilled on ice. Prior to injection, each sample was
centrifuged briefly. Samples were analyzed using an 1100 series HPLC system (Agilent
Technologies) equipped with a variable wavelength detector and a 250 x 4.6mm ZORBAX
Eclipse C18 column (Agilent Technologies). Elution was performed isocratically using a running
buffer consisting of 115 mM sodium perchlorate, 30% methanol, and 1% phosphoric acid, and
absorbance was monitored at 549nm.
3.3.8 Glycophorin extraction and biotinylation
Crude glycophorins were extracted from human red blood cells as previously described28.
Briefly, human red blood cells from 450mL blood were divided into 10 ml aliquots and washed
with 40 mL PBS. Washed red blood cells were then lysed via repeated washing with 40 ml ice-
cold 5 mM sodium phosphate pH 8.0 supplemented with 1 mM phenylmethylsulfonyl fluoride
(PMSF). Each tube was incubated on ice for 5 min before centrifuging at 4500g in swinging
buckets for 60 minutes at 2˚C with no braking. Red cell ghosts were washed 6-8 times until the
ghost pellet appeared white with a clear supernatant. Ghosts were then resuspended to 50% in the
87
same buffer supplemented with 1.2 M NaCl. Nine volumes of a 2:1 v:v chloroform methanol
mixture were added to the red cell ghost suspension, and stirred vigorously (with occasional
shaking) for 30 minutes at room temperature. The mixture was then incubated at 4˚C overnight.
The aqueous phase was then recovered and centrifuged at 40,000g for 30 minutes, then dialyzed
extensively into 5 mM ammonium bicarbonate pH 8.3. The dialyzed solution was then
concentrated 10X using centrifugal filters (Amicon Ultra 30,000 MWCO, EMD Millipore). The
concentrated protein solutions were then lyophilized using a SpeedVac vacuum concentrator
(Thermo Scientific) with no heating. Before use, aliquots of extracted glycophorins were
reconstituted in 400 µL PBS pH 8.0, analyzed for purity by SDS-PAGE, and analyzed for
protein concentration using the BCA Protein Assay Kit (Thermo Scientific). Extracted
glycophorins were then biotinylated using 1 mg sulfo-NHS-biotin (Thermo Scientific) per
protein aliquot. The biotinylation reaction was incubated at room temperature for 30 minutes
before extensive dialysis in PBS pH 8.0. Biotinylation was verified using the Fluorescence
Biotin Quantitation Kit (Thermo Scientific), and the biotinylated glycophorins were stored at 4˚C
for up to two weeks.
3.3.9 Glycophorin immobilization
Red blood cells were washed in ice-cold PBS pH 8.0 and resuspended to 10% hematocrit.
From this suspension, approximately 109 red blood cells (100 µL packed) were incubated with
0.5 mg sulfo-NHS biotin for 30 minutes with gentle mixing at room temperature. Biotinylated
red blood cells were then washed and treated with neuraminidase as described above, with 5U
enzyme per µL of packed red blood cells, except that PBS pH 6.0 supplemented with 2 mg/mL
bovine serum albumin was substituted for RPMI-HEPES in the washing step. After
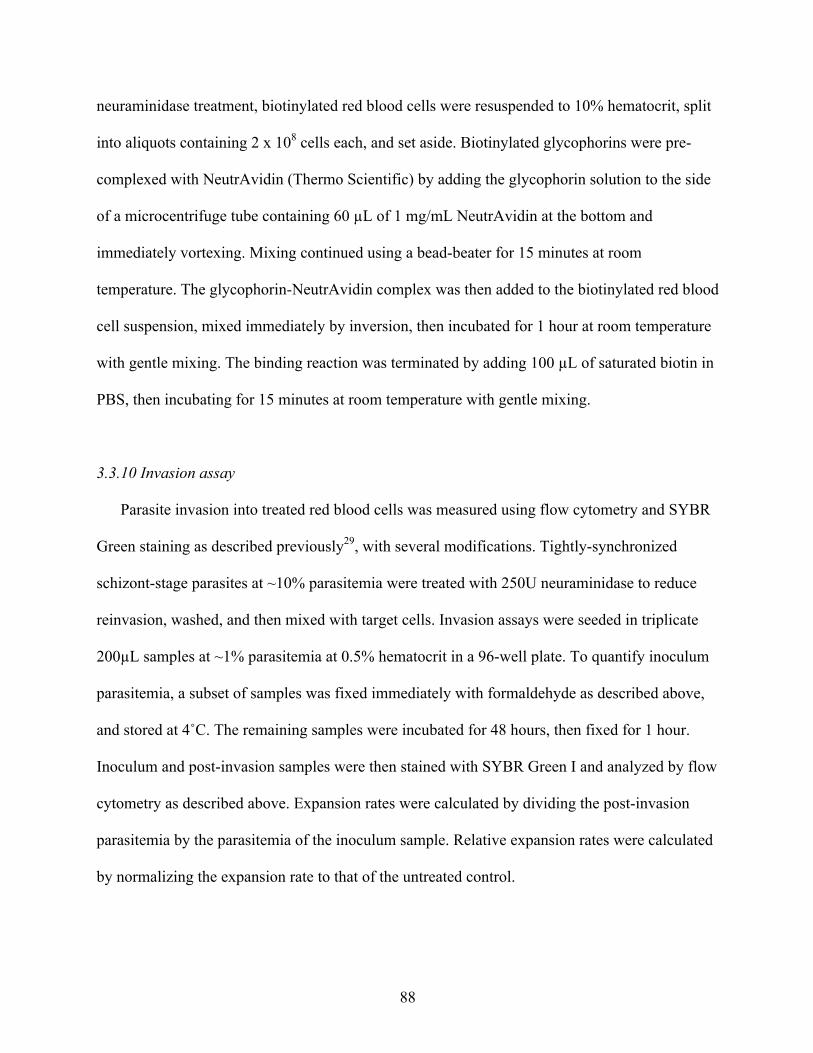
88
neuraminidase treatment, biotinylated red blood cells were resuspended to 10% hematocrit, split
into aliquots containing 2 x 10⁸ cells each, and set aside. Biotinylated glycophorins were pre-
complexed with NeutrAvidin (Thermo Scientific) by adding the glycophorin solution to the side
of a microcentrifuge tube containing 60 µL of 1 mg/mL NeutrAvidin at the bottom and
immediately vortexing. Mixing continued using a bead-beater for 15 minutes at room
temperature. The glycophorin-NeutrAvidin complex was then added to the biotinylated red blood
cell suspension, mixed immediately by inversion, then incubated for 1 hour at room temperature
with gentle mixing. The binding reaction was terminated by adding 100 µL of saturated biotin in
PBS, then incubating for 15 minutes at room temperature with gentle mixing.
3.3.10 Invasion assay
Parasite invasion into treated red blood cells was measured using flow cytometry and SYBR
Green staining as described previously29, with several modifications. Tightly-synchronized
schizont-stage parasites at ~10% parasitemia were treated with 250U neuraminidase to reduce
reinvasion, washed, and then mixed with target cells. Invasion assays were seeded in triplicate
200µL samples at ~1% parasitemia at 0.5% hematocrit in a 96-well plate. To quantify inoculum
parasitemia, a subset of samples was fixed immediately with formaldehyde as described above,
and stored at 4˚C. The remaining samples were incubated for 48 hours, then fixed for 1 hour.
Inoculum and post-invasion samples were then stained with SYBR Green I and analyzed by flow
cytometry as described above. Expansion rates were calculated by dividing the post-invasion
parasitemia by the parasitemia of the inoculum sample. Relative expansion rates were calculated
by normalizing the expansion rate to that of the untreated control.
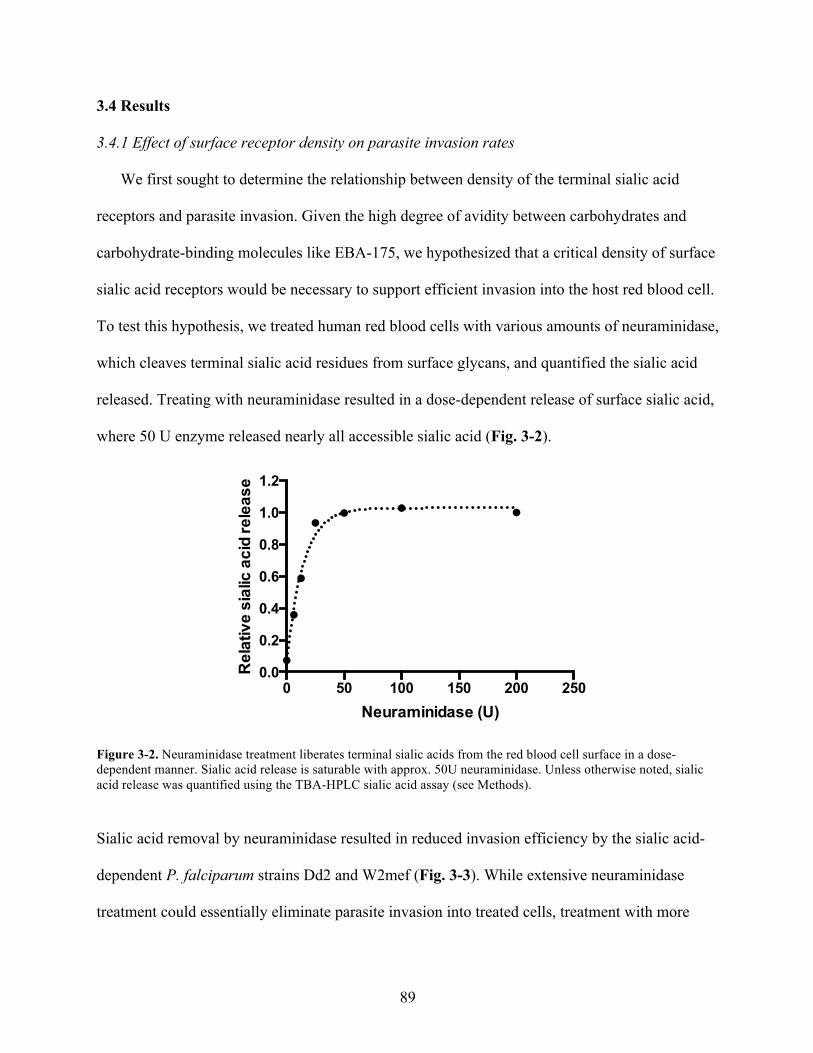
89
3.4 Results
3.4.1 Effect of surface receptor density on parasite invasion rates
We first sought to determine the relationship between density of the terminal sialic acid
receptors and parasite invasion. Given the high degree of avidity between carbohydrates and
carbohydrate-binding molecules like EBA-175, we hypothesized that a critical density of surface
sialic acid receptors would be necessary to support efficient invasion into the host red blood cell.
To test this hypothesis, we treated human red blood cells with various amounts of neuraminidase,
which cleaves terminal sialic acid residues from surface glycans, and quantified the sialic acid
released. Treating with neuraminidase resulted in a dose-dependent release of surface sialic acid,
where 50 U enzyme released nearly all accessible sialic acid (Fig. 3-2).
Figure 3-2. Neuraminidase treatment liberates terminal sialic acids from the red blood cell surface in a dose-dependent manner. Sialic acid release is saturable with approx. 50U neuraminidase. Unless otherwise noted, sialic acid release was quantified using the TBA-HPLC sialic acid assay (see Methods).
Sialic acid removal by neuraminidase resulted in reduced invasion efficiency by the sialic acid-
dependent P. falciparum strains Dd2 and W2mef (Fig. 3-3). While extensive neuraminidase
treatment could essentially eliminate parasite invasion into treated cells, treatment with more
0 50 100 150 200 2500.0
0.2
0.4
0.6
0.8
1.0
1.2
Neuraminidase (U)
Rel
ativ
e si
alic
aci
d re
leas
e
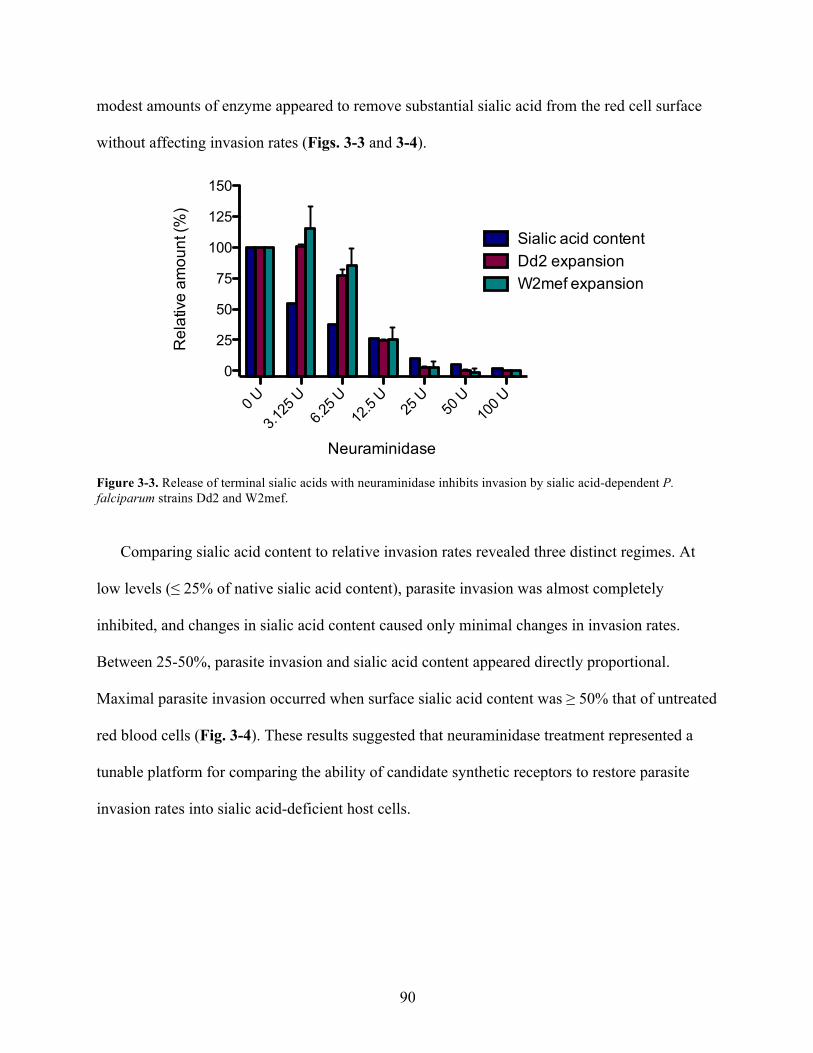
90
modest amounts of enzyme appeared to remove substantial sialic acid from the red cell surface
without affecting invasion rates (Figs. 3-3 and 3-4).
Figure 3-3. Release of terminal sialic acids with neuraminidase inhibits invasion by sialic acid-dependent P. falciparum strains Dd2 and W2mef.
Comparing sialic acid content to relative invasion rates revealed three distinct regimes. At
low levels (≤ 25% of native sialic acid content), parasite invasion was almost completely
inhibited, and changes in sialic acid content caused only minimal changes in invasion rates.
Between 25-50%, parasite invasion and sialic acid content appeared directly proportional.
Maximal parasite invasion occurred when surface sialic acid content was ≥ 50% that of untreated
red blood cells (Fig. 3-4). These results suggested that neuraminidase treatment represented a
tunable platform for comparing the ability of candidate synthetic receptors to restore parasite
invasion rates into sialic acid-deficient host cells.
Invasion correlates with sialic acid content
0 U
3.125
U6.2
5 U12
.5 U
25 U
50 U
100 U
0
25
50
75
100
125
150
Sialic acid contentDd2 expansionW2mef expansion
Neuraminidase
Rel
ativ
e am
ount
(%)
91
Figure 3-4. Efficient invasion of sialic acid-dependent strains into neuraminidase-treated host cells requires only 50% of native sialic acid content. Roughly 1/3 of native sialic acid content can support half-maximal invasion rates.
3.4.2 Enzymatic restoration of sialic acid receptors
Having established that parasite invasion rates are sensitive to sialic acid removal, we next
assessed whether the neuraminidase-induced invasion defect could be reversed by restoring sialic
acid to glycoproteins on the red blood cell surface. We first attempted to restore sialic acid
content by treating sialic acid-deficient red blood cells with a mammalian sialyltransferase that
attaches sialic acid to galactose via an α2,3(O) linkage, the predominant linkage type on human
red blood cells30,31. Incubating neuraminidase-treated cells with α2,3(O)-sialyltransferase and
excess CMP-sialic acid substrate resulted in significant restoration of surface sialic acid content
(Fig. 3-5). Greater restoration occurred on red cells that had been treated more extensively with
neuraminidase.
Invasion correlates with sialic acid content
0 25 50 75 1000
25
50
75
100
125
150
W2mefDd2EC50 = 32%
Sialic acid content (%)
Expa
nsio
n (%
)
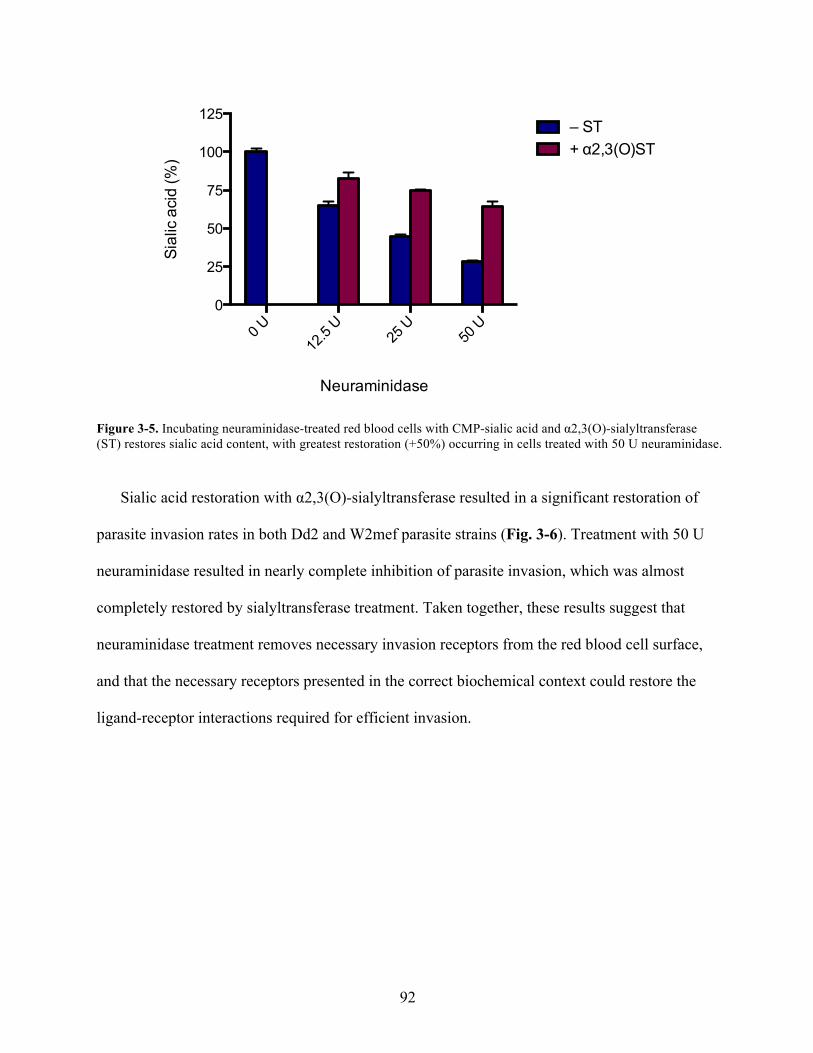
92
Figure 3-5. Incubating neuraminidase-treated red blood cells with CMP-sialic acid and α2,3(O)-sialyltransferase (ST) restores sialic acid content, with greatest restoration (+50%) occurring in cells treated with 50 U neuraminidase.
Sialic acid restoration with α2,3(O)-sialyltransferase resulted in a significant restoration of
parasite invasion rates in both Dd2 and W2mef parasite strains (Fig. 3-6). Treatment with 50 U
neuraminidase resulted in nearly complete inhibition of parasite invasion, which was almost
completely restored by sialyltransferase treatment. Taken together, these results suggest that
neuraminidase treatment removes necessary invasion receptors from the red blood cell surface,
and that the necessary receptors presented in the correct biochemical context could restore the
ligand-receptor interactions required for efficient invasion.
0 U12
.5 U
25 U
50 U
0
25
50
75
100
125– ST+ α2,3(O)ST
Neuraminidase
Sial
ic a
cid
(%)
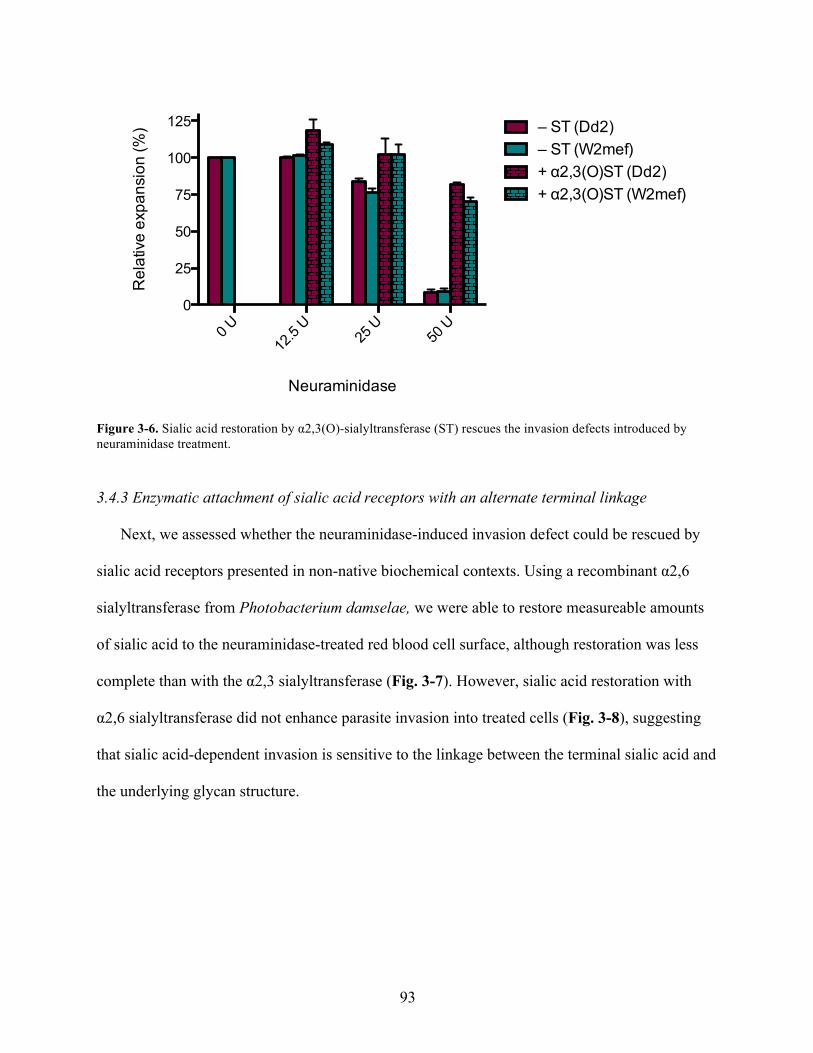
93
Figure 3-6. Sialic acid restoration by α2,3(O)-sialyltransferase (ST) rescues the invasion defects introduced by neuraminidase treatment.
3.4.3 Enzymatic attachment of sialic acid receptors with an alternate terminal linkage
Next, we assessed whether the neuraminidase-induced invasion defect could be rescued by
sialic acid receptors presented in non-native biochemical contexts. Using a recombinant α2,6
sialyltransferase from Photobacterium damselae, we were able to restore measureable amounts
of sialic acid to the neuraminidase-treated red blood cell surface, although restoration was less
complete than with the α2,3 sialyltransferase (Fig. 3-7). However, sialic acid restoration with
α2,6 sialyltransferase did not enhance parasite invasion into treated cells (Fig. 3-8), suggesting
that sialic acid-dependent invasion is sensitive to the linkage between the terminal sialic acid and
the underlying glycan structure.
0 U12
.5 U
25 U
50 U
0
25
50
75
100
125
Neuraminidase
Rel
ativ
e ex
pans
ion
(%) – ST (Dd2)
+ α2,3(O)ST (Dd2)– ST (W2mef)
+ α2,3(O)ST (W2mef)
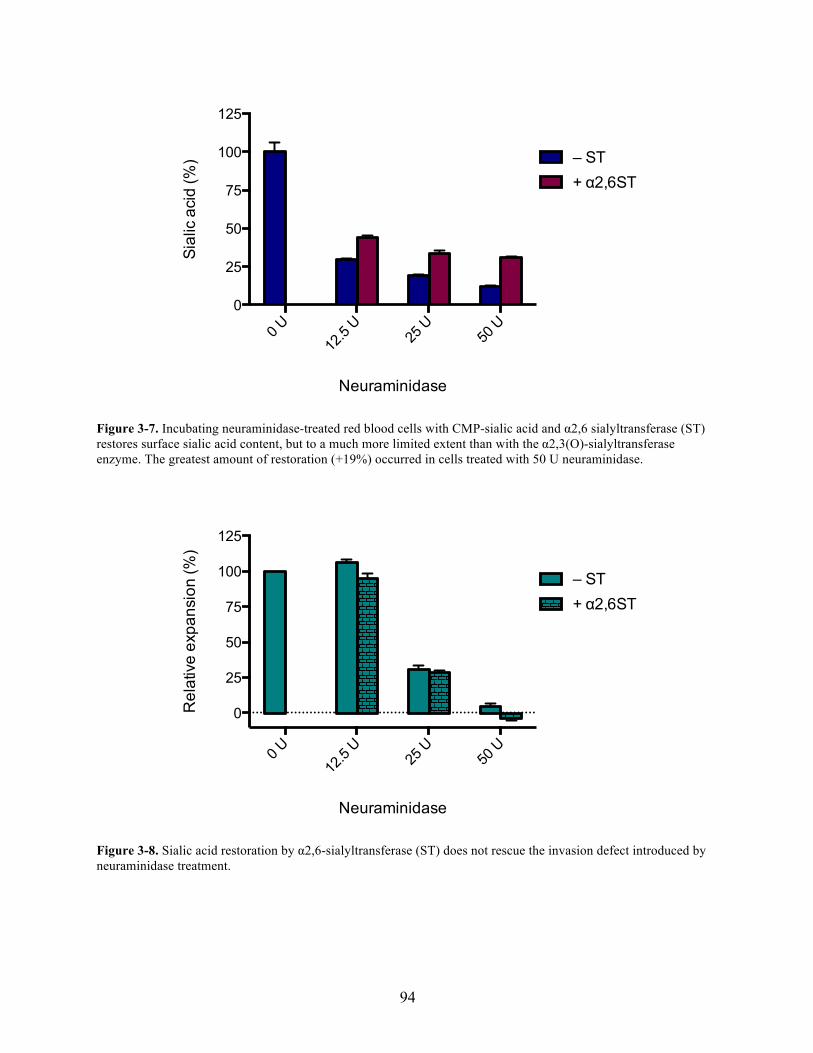
94
Figure 3-7. Incubating neuraminidase-treated red blood cells with CMP-sialic acid and α2,6 sialyltransferase (ST) restores surface sialic acid content, but to a much more limited extent than with the α2,3(O)-sialyltransferase enzyme. The greatest amount of restoration (+19%) occurred in cells treated with 50 U neuraminidase.
Figure 3-8. Sialic acid restoration by α2,6-sialyltransferase (ST) does not rescue the invasion defect introduced by neuraminidase treatment.
0 U12
.5 U
25 U
50 U
0
25
50
75
100
125
– ST+ α2,6ST
Neuraminidase
Sial
ic a
cid
(%)
0 U12
.5 U
25 U
50 U
0
25
50
75
100
125
Neuraminidase
Rel
ativ
e ex
pans
ion
(%)
– ST
+ α2,6ST
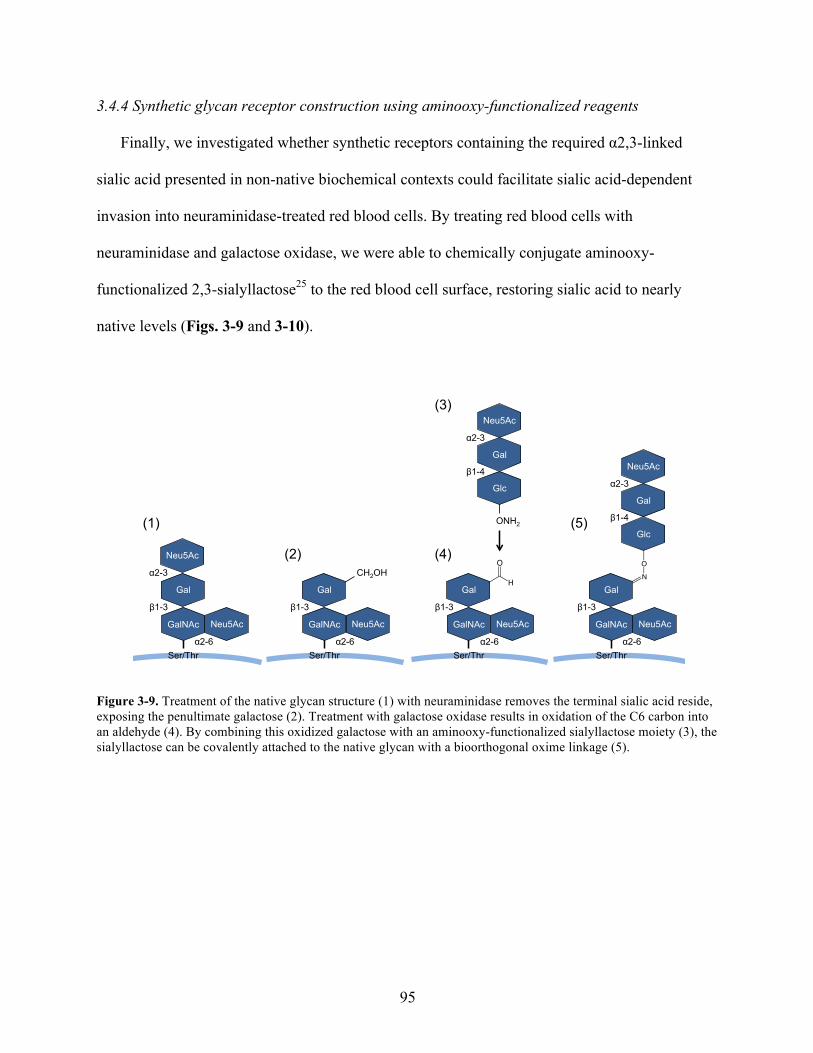
95
3.4.4 Synthetic glycan receptor construction using aminooxy-functionalized reagents
Finally, we investigated whether synthetic receptors containing the required α2,3-linked
sialic acid presented in non-native biochemical contexts could facilitate sialic acid-dependent
invasion into neuraminidase-treated red blood cells. By treating red blood cells with
neuraminidase and galactose oxidase, we were able to chemically conjugate aminooxy-
functionalized 2,3-sialyllactose25 to the red blood cell surface, restoring sialic acid to nearly
native levels (Figs. 3-9 and 3-10).
Figure 3-9. Treatment of the native glycan structure (1) with neuraminidase removes the terminal sialic acid reside, exposing the penultimate galactose (2). Treatment with galactose oxidase results in oxidation of the C6 carbon into an aldehyde (4). By combining this oxidized galactose with an aminooxy-functionalized sialyllactose moiety (3), the sialyllactose can be covalently attached to the native glycan with a bioorthogonal oxime linkage (5).
Gal
GalNAc Neu5Ac
β1-3
α2-6 Ser/Thr
Neu5Ac
Gal
Glc
α2-3
β1-4
N
O
Gal
GalNAc Neu5Ac
β1-3
α2-6 Ser/Thr
O
HCH2OH
Gal
GalNAc Neu5Ac
β1-3
α2-6 Ser/Thr
Gal
GalNAc Neu5Ac
β1-3
α2-6 Ser/Thr
Neu5Ac
α2-3
Neu5Ac
Gal
Glc
α2-3
β1-4
ONH2 (1)
(2)
(3)
(4)
(5)
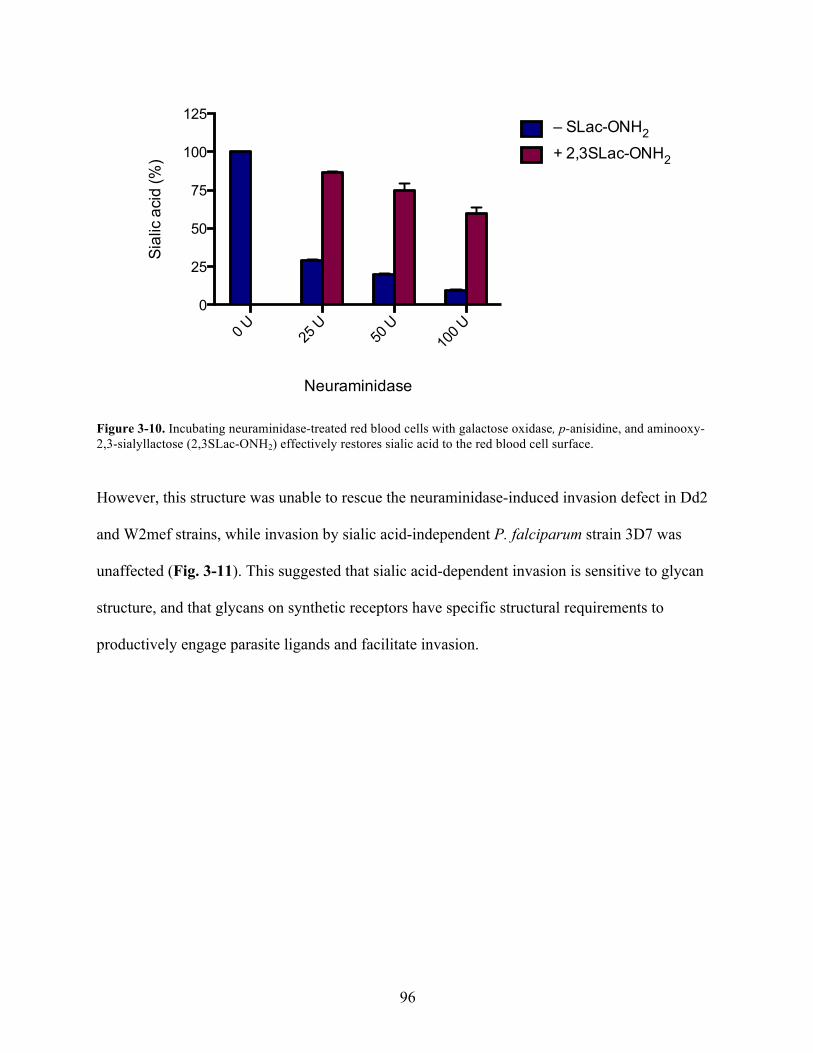
96
Figure 3-10. Incubating neuraminidase-treated red blood cells with galactose oxidase, p-anisidine, and aminooxy-2,3-sialyllactose (2,3SLac-ONH2) effectively restores sialic acid to the red blood cell surface.
However, this structure was unable to rescue the neuraminidase-induced invasion defect in Dd2
and W2mef strains, while invasion by sialic acid-independent P. falciparum strain 3D7 was
unaffected (Fig. 3-11). This suggested that sialic acid-dependent invasion is sensitive to glycan
structure, and that glycans on synthetic receptors have specific structural requirements to
productively engage parasite ligands and facilitate invasion.
0 U 25 U
50 U
100 U
0
25
50
75
100
125– SLac-ONH2
+ 2,3SLac-ONH2
Neuraminidase
Sial
ic a
cid
(%)
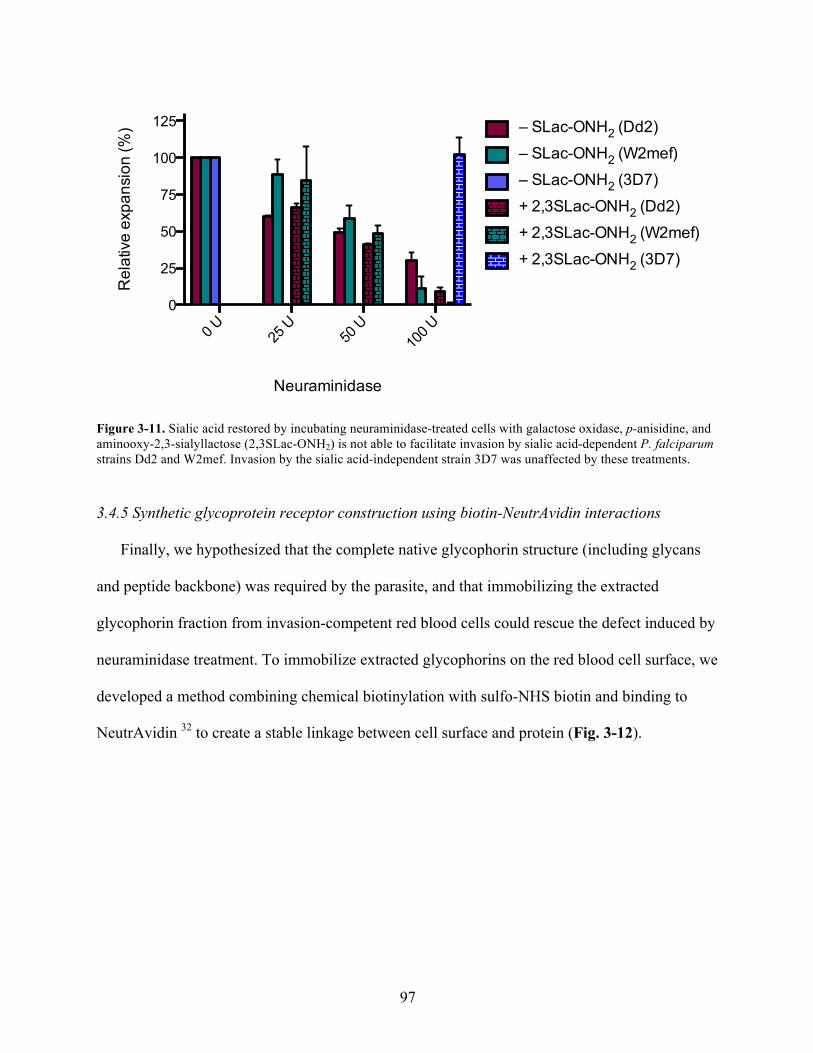
97
Figure 3-11. Sialic acid restored by incubating neuraminidase-treated cells with galactose oxidase, p-anisidine, and aminooxy-2,3-sialyllactose (2,3SLac-ONH2) is not able to facilitate invasion by sialic acid-dependent P. falciparum strains Dd2 and W2mef. Invasion by the sialic acid-independent strain 3D7 was unaffected by these treatments.
3.4.5 Synthetic glycoprotein receptor construction using biotin-NeutrAvidin interactions
Finally, we hypothesized that the complete native glycophorin structure (including glycans
and peptide backbone) was required by the parasite, and that immobilizing the extracted
glycophorin fraction from invasion-competent red blood cells could rescue the defect induced by
neuraminidase treatment. To immobilize extracted glycophorins on the red blood cell surface, we
developed a method combining chemical biotinylation with sulfo-NHS biotin and binding to
NeutrAvidin 32 to create a stable linkage between cell surface and protein (Fig. 3-12).
0 U 25 U
50 U
100 U
0
25
50
75
100
125 – SLac-ONH2 (Dd2)
+ 2,3SLac-ONH2 (Dd2)
– SLac-ONH2 (W2mef)
+ 2,3SLac-ONH2 (W2mef)
Neuraminidase
Rel
ativ
e ex
pans
ion
(%)
– SLac-ONH2 (3D7)
+ 2,3SLac-ONH2 (3D7)
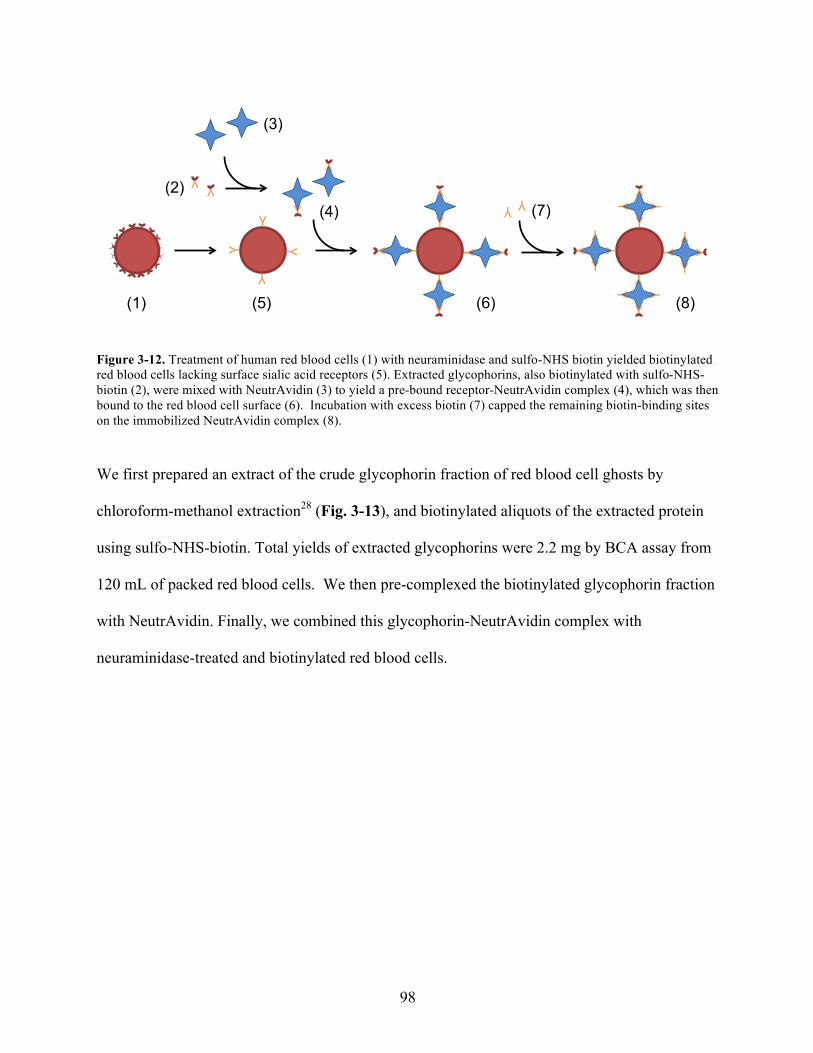
98
Figure 3-12. Treatment of human red blood cells (1) with neuraminidase and sulfo-NHS biotin yielded biotinylated red blood cells lacking surface sialic acid receptors (5). Extracted glycophorins, also biotinylated with sulfo-NHS-biotin (2), were mixed with NeutrAvidin (3) to yield a pre-bound receptor-NeutrAvidin complex (4), which was then bound to the red blood cell surface (6). Incubation with excess biotin (7) capped the remaining biotin-binding sites on the immobilized NeutrAvidin complex (8).
We first prepared an extract of the crude glycophorin fraction of red blood cell ghosts by
chloroform-methanol extraction28 (Fig. 3-13), and biotinylated aliquots of the extracted protein
using sulfo-NHS-biotin. Total yields of extracted glycophorins were 2.2 mg by BCA assay from
120 mL of packed red blood cells. We then pre-complexed the biotinylated glycophorin fraction
with NeutrAvidin. Finally, we combined this glycophorin-NeutrAvidin complex with
neuraminidase-treated and biotinylated red blood cells. Y"
Y"
Y"Y"
Y"Y"
Y"Y"Y"Y" Y"
Y"
Y"Y" Y"
Y"Y"
Y" Y"
Y"
Y"
Y"
Y"
Y"
(1) (5)
(2)
(3)
(4)
(6)
Y"
Y" Y"
Y"
Y"
Y"
Y"
Y"
(8)
Y" Y"
(7)
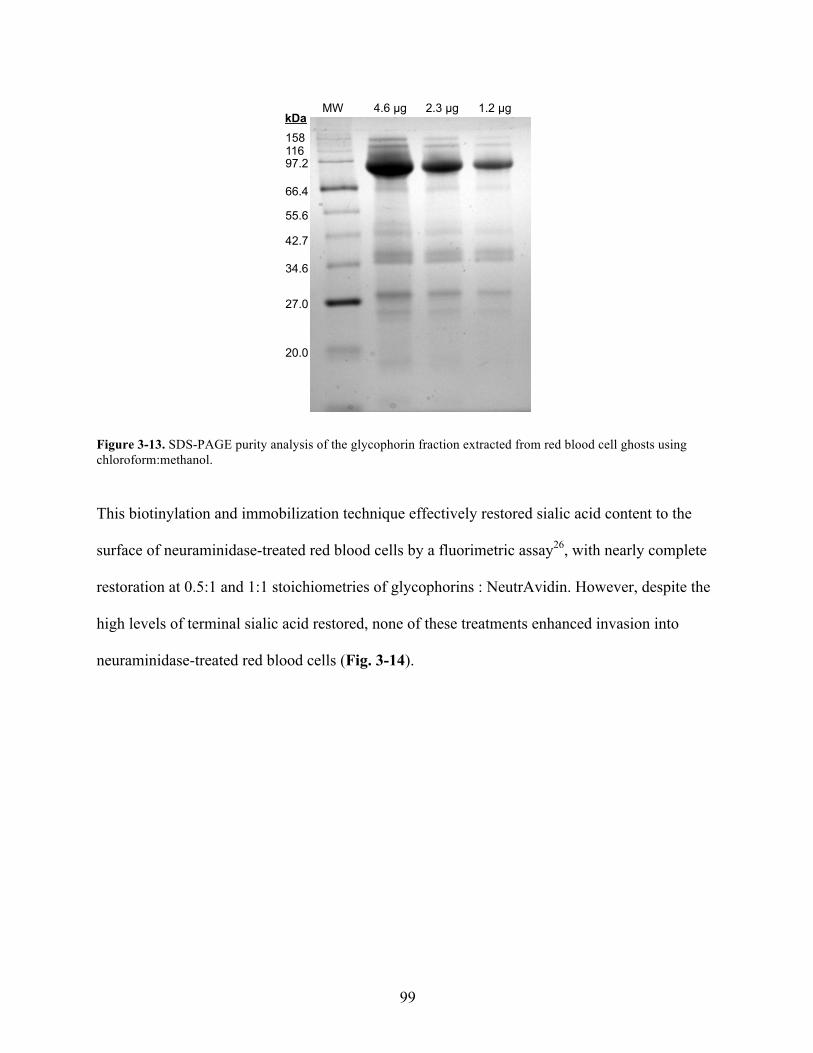
99
Figure 3-13. SDS-PAGE purity analysis of the glycophorin fraction extracted from red blood cell ghosts using chloroform:methanol.
This biotinylation and immobilization technique effectively restored sialic acid content to the
surface of neuraminidase-treated red blood cells by a fluorimetric assay26, with nearly complete
restoration at 0.5:1 and 1:1 stoichiometries of glycophorins : NeutrAvidin. However, despite the
high levels of terminal sialic acid restored, none of these treatments enhanced invasion into
neuraminidase-treated red blood cells (Fig. 3-14).
MW
66.4
55.6
42.7
34.6
27.0
20.0
97.2 116 158
4.6 µg 2.3 µg 1.2 µg kDa
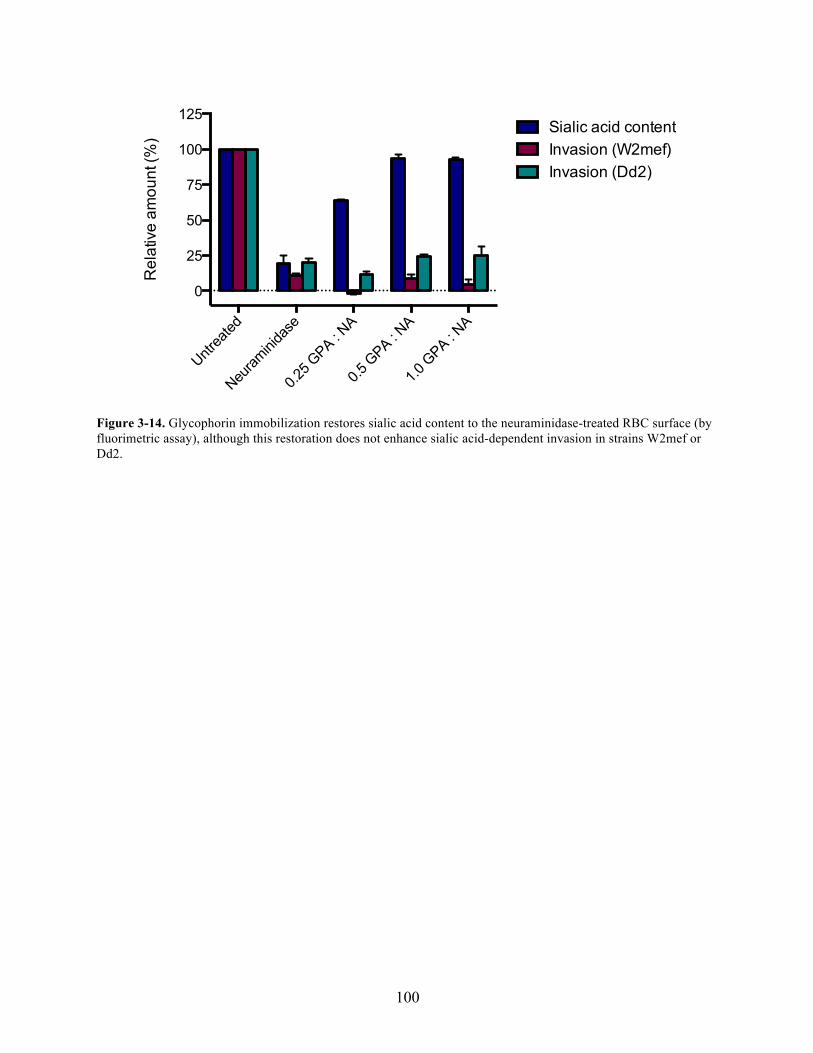
100
Figure 3-14. Glycophorin immobilization restores sialic acid content to the neuraminidase-treated RBC surface (by fluorimetric assay), although this restoration does not enhance sialic acid-dependent invasion in strains W2mef or Dd2.
Untrea
ted
Neuram
inida
se
0.25 G
PA : NA
0.5 G
PA : NA
1.0 G
PA : NA
0
25
50
75
100
125
Rel
ativ
e am
ount
(%)
Sialic acid contentInvasion (W2mef)Invasion (Dd2)
101
3.5 Discussion
Here we demonstrate a proof-of-concept to restore parasite invasion into otherwise refractory
red blood cells by providing the necessary invasion receptors in trans. In a model P. falciparum
system, we were able to quantify the relationship between receptor density and invasion rates,
showing for the first time that parasites require only a fraction of the sialic acid content of human
erythrocytes for efficient sialic acid-dependent invasion. Additionally, by replacing sialic acid
liberated by neuraminidase using a mammalian sialyltransferase that recreates the native α2-3
linkage type, we showed that supplying the requisite invasion receptor could rescue parasite
invasion into otherwise refractory cells.
Our results also demonstrate for the first time that the interaction between sialic acid-binding
parasite ligands and sialylated red cell receptors is highly specific to receptor glycan structure.
Modest sialic acid restoration with a bacterial α2-6 sialyltransferase did not rescue invasion into
neuraminidase-treated cells. While the total amount of sialic acid restored with the α2-6
sialyltransferase was lower (+19% rather than +50%), cells treated with α2-6 sialyltransferase
still contained up to 31% of the sialic acid content of untreated cells (Fig. 3-7), close to our
measured EC50. Therefore, these results suggest that α2-3- and α2-6-linked terminal sialic acids
are not interchangeable as parasite receptors.
Previous studies have indirectly assessed the relationship between sialic acid linkage type
and utility as a receptor for parasite invasion. Soluble sialyllactose has been used to inhibit
binding of EBA-175 to erythrocytes, where it was shown that α2-3-sialyllactose was a more
potent inhibitor of binding than its α2-6-linked counterpart33. However, the IC50 values for each
compound were each above 1 mM, suggesting that these interactions were limited in their
specificity. In addition, the sialic acid analogue 3’-N-acetyl neuraminyl-N-acetyl lactosamine,

102
which contains sialic acid linked α2-3- to a penultimate galactose, has been shown to disrupt
binding of EBA-175 to glycophorin A at micromolar concentrations34. However, this structure is
not found on the surface of the red blood cell. Finally, the crystal structure of EBA-175 was
solved with α2-3-sialyllactose bound35, but to our knowledge similar attempts have not been
made with α2-6-sialyllactose.
Additionally, we demonstrate biocompatible immobilization of aminooxy-functionalized
sugars onto the surface of neuraminidase-treated red blood cells. By conjugating aminooxy-
functionalized α2-3-sialyllactose onto the neuraminidase-treated red blood cell surface through
an oxime linkage, we restored sialic acid content nearly to native levels, and yet this restored
sialic acid was unable to facilitate invasion by the parasite. Importantly, the oxime ligation and
α2-3-sialyllactose immobilization were not toxic to parasite invasion, because the sialic acid-
independent strain 3D7 was still able to invade successfully. These results are consistent with
previous studies showing multiple contacts between EBA-175 and glycans on glycophorin A35,
as well as binding to the glycophorin A peptide backbone 36,37, although the relationships
between these individual contacts and overall invasion rates have not been elucidated. It is
possible that the geometry of the oxime-linked α2-3-sialyllactose synthetic receptor does not
support formation of intermolecular contacts necessary to support invasion.
Finally, we demonstrate a technique for immobilizing biotinylated proteins on the red blood
cell surface. Immobilizing extracted glycophorins through biotin-NeutrAvidin interactions
restored sialic acid on neuraminidase-treated cells to near-native levels, but did not support
parasite invasion. Similar glycophorin preparations have been shown to bind EBA-175
domains33,34 and peptides36 in vitro, suggesting that the immobilized glycophorins could
recapitulate the EBA-175-glycophorin A interaction. However, invasion by the parasite involves

103
multiple ligand-receptor binding events38, and therefore these synthetic receptors may have been
unable to recapitulate the other contacts necessary for productive invasion. However, this would
not explain the restoration of invasion observed when α1-acid glycoprotein was added to
neuraminidase-treated cells. Further investigation will be required to explain these results.
We believe these proof-of-concept experiments can inform future synthetic receptor designs
towards the goal of facilitating P. vivax invasion into mature red blood cells. We observe that
invasion can be restored into target cells lacking cognate receptors by supplying the necessary
interactions in trans, although invasion was only restored when the synthetic receptor structure
matched the native receptor exactly. Given the multiple contacts that must form between parasite
and host cell both within and across ligand-receptor pairs, finding a synthetic receptor design that
can facilitate all the necessary binding events may be challenging. However, we believe the
generalizable immobilization strategies developed here will be useful in future screening efforts
dedicated to finding compatible synthetic receptor structures.
104
3.6 References
1. Miller, L. H., Baruch, D. I., Marsh, K. & Doumbo, O. K. The pathogenic basis of malaria. Nature 415, 673–679 (2002).
2. Mendis, K., Sina, B. J., Marchesini, P. & Carter, R. The neglected burden of Plasmodium vivax malaria. Am J Trop Med Hyg 64, 97–106 (2001).
3. Price, R. et al. Vivax Malaria: Neglected and Not Benign. American Journal of Tropical Medicine and Hygiene 77, 79 (2007).
4. Mueller, I. et al. Key gaps in the knowledge of Plasmodium vivax, a neglected human malaria parasite. The Lancet Infectious Diseases 9, 555–566 (2009).
5. Trager, W. & Jensen, J. B. Human malaria parasites in continuous culture. Science 193, 673–675 (1976).
6. Kitchen, S. The infection of reticulocytes by Plasmodium vivax. Am J Trop Med Hyg 1, 347 (1938).
7. Golenda, C. F., Li, J. & Rosenberg, R. Continuous in vitro propagation of the malaria parasite Plasmodium vivax. Proc Natl Acad Sci USA 94, 6786–6791 (1997).
8. Skadberg, O., Brun, A. & Sandberg, S. Human reticulocytes isolated from peripheral blood: maturation time and hemoglobin synthesis. Lab Hematol 9, 198–206 (2003).
9. Bozdech, Z. et al. The transcriptome of Plasmodium vivax reveals divergence and diversity of transcriptional regulation in malaria parasites. Proceedings of the National Academy of Sciences 105, 16290–16295 (2008).
10. Udomsangpetch, R. et al. Short-term in vitro culture of field isolates of Plasmodium vivax using umbilical cord blood. Parasitology International 56, 65–69 (2007).
11. Nayar, J. K. et al. Studies on a primaquine-tolerant strain of Plasmodium vivax from Brazil in Aotus and Saimiri monkeys. J Parasitol 83, 739–745 (1997).
12. Giarratana, M.-C. et al. Ex vivo generation of fully mature human red blood cells from hematopoietic stem cells. Nature Biotechnology 23, 69–74 (2005).
13. Panichakul, T. et al. Production of erythropoietic cells in vitro for continuous culture of Plasmodium vivax. Int J Parasitol 37, 1551–1557 (2007).
14. NIAID Malaria Working Group. NIAID Research Agenda for Malaria. niaid.nih.gov (2008). at <http://www.niaid.nih.gov/topics/Malaria/Documents/researchagenda.pdf>
15. Galinski, M. R., Medina, C. C., Ingravallo, P. & Barnwell, J. W. A reticulocyte-binding protein complex of Plasmodium vivax merozoites. 69, 1213–1226 (1992).
16. Vidal, M., Mangeat, P. & Hoekstra, D. Aggregation reroutes molecules from a recycling to a vesicle-mediated secretion pathway during reticulocyte maturation. Journal of Cell Science 110 ( Pt 16), 1867–1877 (1997).
17. Haynes, J. D. et al. Receptor-like specificity of a Plasmodium knowlesi malarial protein that binds to Duffy antigen ligands on erythrocytes. J Exp Med 167, 1873–1881 (1988).
18. Miller, L. H., Mason, S. J., Dvorak, J. A., McGinniss, M. H. & Rothman, I. K. Erythrocyte receptors for (Plasmodium knowlesi) malaria: Duffy blood group determinants. Science 189, 561–563 (1975).
19. Camus, D. & Hadley, T. A Plasmodium falciparum antigen that binds to host erythrocytes and merozoites. Science 230, 553 (1985).
20. Friedman, M. J., Blankenberg, T., Sensabaugh, G. & Tenforde, T. S. Recognition and invasion of human erythrocytes by malarial parasites: contribution of sialoglycoproteins to attachment and host specificity. J Cell Biol 98, 1672–1677 (1984).
105
21. Fournier, T., Medjoubi-N, N. & Porquet, D. Alpha-1-acid glycoprotein. Biochim Biophys Acta 1482, 157–171 (2000).
22. Duraisingh, M. T., Maier, A. G., Triglia, T. & Cowman, A. F. Erythrocyte-binding antigen 175 mediates invasion in Plasmodium falciparum utilizing sialic acid-dependent and -independent pathways. Proc Natl Acad Sci USA 100, 4796–4801 (2003).
23. Anstee, D. J. The nature and abundance of human red cell surface glycoproteins. J. Immunogenet. 17, 219–225 (1990).
24. Zeng, Y., Ramya, T. N. C., Dirksen, A., Dawson, P. E. & Paulson, J. C. High-efficiency labeling of sialylated glycoproteins on living cells. Nature Methods 6, 207–209 (2009).
25. Hudak, J. E., Yu, H. H. & Bertozzi, C. R. Protein glycoengineering enabled by the versatile synthesis of aminooxy glycans and the genetically encoded aldehyde tag. J Am Chem Soc 133, 16127–16135 (2011).
26. Matsuno, K. & Suzuki, S. Simple fluorimetric method for quantification of sialic acids in glycoproteins. Anal Biochem 375, 53–59 (2008).
27. Powell, L. D. & Hart, G. W. Quantitation of picomole levels of N-acetyl- and N-glycolylneuraminic acids by a HPLC-adaptation of the thiobarbituric acid assay. Anal Biochem 157, 179–185 (1986).
28. Cochet, S., Volet, G., Cartron, J. P. & Bertrand, O. New procedures for glycophorin A purification with high yield and high purity. J Chromatogr B Biomed Sci Appl 750, 109–119 (2001).
29. Bei, A. K. et al. A flow cytometry-based assay for measuring invasion of red blood cells by Plasmodium falciparum. American Journal of Hematology 85, 234–237 (2010).
30. Fukuda, M., Lauffenburger, M., Sasaki, H., Rogers, M. E. & Dell, A. Structures of novel sialylated O-linked oligosaccharides isolated from human erythrocyte glycophorins. J Biol Chem 262, 11952–11957 (1987).
31. Reid, M. E. & Mohandas, N. Red blood cell blood group antigens: structure and function. Semin. Hematol. 41, 93–117 (2004).
32. Marttila, A. T. et al. Recombinant NeutraLite avidin: a non-glycosylated, acidic mutant of chicken avidin that exhibits high affinity for biotin and low non-specific binding properties. FEBS Lett 467, 31–36 (2000).
33. Orlandi, P. A., Klotz, F. W. & Haynes, J. D. A malaria invasion receptor, the 175-kilodalton erythrocyte binding antigen of Plasmodium falciparum recognizes the terminal Neu5Ac(alpha 2-3)Gal- sequences of glycophorin A. J Cell Biol 116, 901–909 (1992).
34. Bharara, R., Singh, S., Pattnaik, P., Chitnis, C. E. & Sharma, A. Structural analogs of sialic acid interfere with the binding of erythrocyte binding antigen-175 to glycophorin A, an interaction crucial for erythrocyte invasion by Plasmodium falciparum. Mol Biochem Parasitol 138, 123–129 (2004).
35. Tolia, N. H., Enemark, E. J., Sim, B. K. L. & Joshua-Tor, L. Structural basis for the EBA-175 erythrocyte invasion pathway of the malaria parasite Plasmodium falciparum. 122, 183–193 (2005).
36. Jakobsen, P. H. et al. Identification of an erythrocyte binding peptide from the erythrocyte binding antigen, EBA-175, which blocks parasite multiplication and induces peptide-blocking antibodies. Infect Immun 66, 4203–4207 (1998).
37. Sim, B. K., Chitnis, C. E., Wasniowska, K., Hadley, T. J. & Miller, L. H. Receptor and ligand domains for invasion of erythrocytes by Plasmodium falciparum. Science 264, 1941–1944 (1994).
106
38. Baum, J., Maier, A. G., Good, R. T., Simpson, K. M. & Cowman, A. F. Invasion by P. falciparum merozoites suggests a hierarchy of molecular interactions. PLoS Pathog 1, e37 (2005).
107
CHAPTER 4: CONCLUSIONS AND FUTURE WORK 4.1 Parasite heme biology In developing our heme biosensor, we were able to quantify for the first time a labile heme
pool in the cytosol of live malaria parasites, both under normal physiological conditions and
under stresses imposed by aminoquinoline treatment. In its current state of development, this
technology has the potential to address many unanswered questions regarding parasite heme
metabolism, and the mechanisms of action of current antimalarial drugs. In addition, the system
could be further optimized for use in screens to identify potentially promising heme-perturbing
antimalarial compounds.
The heme biosensor described in Chapter 2 could be used to quantify the labile heme pools in
other parasite organelles. In particular, the apicoplast and mitochondria contain many of the
enzymes involved in parasite heme biosynthesis, yet many key details remain to be elucidated.
For example, the parasite heme biosynthesis pathway has its final stages in the mitochondrion,
which is also the location for where most parasite hemoproteins reside. However, a labile heme
pool in the mitochondria has not been identified. Additionally, the heme biosynthesis pathway
involves enzymes localized in the mitochondria, apicoplast, and cytosol. However, it is not
known whether the apicoplast maintains a labile heme pool as well, or whether hypothesized
transporters for heme biosynthesis intermediates between these three compartments could also
transport heme. These questions could be addressed by expressing the heme biosensor in these
organelles, for which N-terminal protein targeting sequences have been identified5,6.
In addition, the source of the parasite’s cytosolic labile heme pool remains to be elucidated.
Although malaria parasites have been shown to biosynthesize heme during the blood stages7, this
is evidently not essential, as pathway enzymes can be chemically inhibited or knocked out with
108
no apparent effect. It is not currently known whether inhibiting heme biosynthesis affects the
cytosolic labile heme pool, and future experiments could compare the concentration of labile
heme between wild-type parasites and those unable to biosynthesize heme. If a deficiency in
heme biosynthesis resulted in cytosolic labile heme being depleted, that would suggest that a
pool of labile heme in the cytosol is not critical to parasite growth. However, if parasites
deficient in heme biosynthesis were still able to maintain a cytosolic labile heme pool, this would
suggest that parasites could obtain necessary heme from other sources. Potential alternate
sources include scavenging from the food vacuole, and import from the red blood cell cytosol.
As protein sequences have been elucidated that mediate trafficking to both of these
compartments, the heme biosensor could in principle be localized to either, although the low pH8
and proteolytic activity in the food vacuole may preclude accurate heme quantitation.
The role of the cytosolic labile heme pool could be further investigated by manipulating
heme concentrations directly. While chloroquine appears to cause labile heme to accumulate in
the parasite cytosol, the effects of depleting cytosolic labile heme are not yet known. Malaria
parasites have recently been shown to lack the ability to degrade heme due to a non-functional
heme oxygenase enzyme9. In conjunction with the heme biosensor, inducibly degrading heme by
expressing a heme oxygenase under translational10 or post-translational11 control could assess the
degree to which a cytosolic labile heme pool is required for parasite growth.
4.2 Antimalarial drug action
In this work, we have demonstrated that chloroquine treatment causes labile heme to
accumulate in the parasite cytosol, directly linking heme dysregulation to chloroquine toxicity.
However, important mechanistic details remain to be elucidated. For instance, the kinetics of
109
heme accumulation following chloroquine treatment could give insight into the underlying
mechanisms of chloroquine-induced heme transport. In addition, coupling these measurements to
assays of parasite viability12 could establish whether heme accumulation in the cytosol correlates
with parasite health, substantiating the role of heme as the toxic effector of chloroquine action.
Additionally, the heme biosensor could be used to gain insight into the mechanisms of action
of other successful antimalarials. For instance, artemisinin and its derivatives are first-line
therapies when used in combination with other drugs. However, the mechanism of artemisinin
action remains controversial. Artemisinin is hypothesized to be activated by heme to form a
reactive radical that can cause oxidative damage, although this has not been directly
demonstrated. Correlating artemisinin toxicity with labile heme concentration could substantiate
this proposed mechanism.
4.3 Antimalarial drug discovery
The potent antimalarial activity of the 4-aminoquinolines, and the parasite’s apparent
inability to develop resistance to their mechanism of action, represent a promising starting point
for antimalarial drug discovery. In principle, the heme biosensor could be used to assess the
heme-perturbing activity of promising antimalarial compounds. For example, the Malaria Box
consists of 400 compounds shown to potently inhibit parasite growth, although their mechanisms
of action have not been fully elucidated13. In principle, our heme biosensor could be used to
identify compounds within this set that cause heme dysregulation. In order to expedite this
screening process and select candidates for further screening, compounds could first be screened
for their ability to inhibit β-hematin formation in vitro. Potent β-hematin inhibitors could then be
tested for their ability to disrupt heme homeostasis using the heme biosensor, identifying the
most promising compounds for future development.
110
However, screening large numbers of compounds using the approaches detailed in Chapter 2
is not likely to be practical, as microscopy-based heme quantitation is time-consuming and labor-
intensive. Flow cytometry presents an attractive alternative to microscopy for FRET quantitation,
based on its ability to rapidly quantify multiple fluorescence parameters with single-cell
resolution. In addition, flow cytometry has been used to detect FRET between ECFP and EYFP14,
and this assay should in principle be adaptable to high-throughput FRET quantitation. One issue
that may arise in flow cytometric FRET quantitation is CFP signal limitation. Although ECFP
signal could be maximized using a laser-filterset combination optimized for CFP, using a
brighter donor fluorophore could significantly improve detection and signal-to-noise ratio in high
throughput experiments. The CFP mutant Cerulean has been widely used as a FRET donor and is
roughly 2.5x brighter15. A newer cyan fluorescent protein, mTurquoise2, is roughly 3.7x brighter
than ECFP, has a longer fluorescence lifetime16, and has been successfully applied to improve
dynamic range of multiple FRET sensors17. In addition, newer variants of EYFP are available
that display greater brightness, robustness to environmental changes, and faster folding18,19.
These proteins have also been successfully implemented as FRET acceptors20.
Developing a second-generation CH49Y sensor with an alternate FRET pair could, in
conjunction with existing CH49Y, allow simultaneous heme quantitation in multiple parasite
compartments. In principle, parasites expressing these sensors could enable quantitative study of
heme fluxes between organelles both under normal physiological conditions but also under
stresses imposed by antimalarial drugs. Such a technique was recently demonstrated in HeLa
cells using Zn2+ biosensors based on cyan/yellow and red/green FRET pairs21 and could
potentially be accessible here. In any case, each additional donor-acceptor pair would need to be
111
evaluated empirically, as substituting donor-acceptor pairs can adversely affect FRET biosensor
performance22.
Finally, the heme-dependent quenching of ECFP detailed in Chapter 2 presents further
opportunities for FRET biosensor development. FRET quantitation by fluorescence lifetime is
advantageous because lifetime is independent from fluorescence intensity, making measurements
robust to changes in excitation intensity, inner filter effects, and detector sensitivity23. Given that
heme has been shown to be an effective quencher of fluorescence in other protein fusions24,25,
fusing the heme binding domain from CH49Y or CHY to a suitable fluorophore could generate a
robust lifetime sensor for heme. An optimal fluorophore would have high brightness and a
monoexponential decay curve, as has been described for the cyan fluorescent protein mTFP126.
This type of sensor could potentially be used in conjunction with recently-developed high
throughput lifetime measurements27,28 to screen for heme-perturbing antimalarials.
4.4 Heme sensing in other biological systems
Finally, the genetically-encodable heme biosensor described in Chapter 2 should be broadly
applicable across biological systems. For example, the well-studied helminth Caenorhabditis
elegans has generated considerable interest as a model system for heme trafficking and
homeostasis, and has been used to elucidate the function of multiple eukaryotic heme
transporters29,30. Applying this sensor to C. elegans should facilitate detailed, quantitative studies
of heme transport within cells and tissues. Additionally, acquisition of heme iron from the host
is an important virulence determinant in pathogenic organisms31. Using the heme biosensor to
quantify labile heme in these organisms could further understanding of heme homeostasis and
also contribute to screening efforts devoted to discovering new antibiotics.
112
4.5 Synthetic Receptor Development
In our proof-of-concept studies, we were able to restore significant amounts of sialic
acid-containing receptors to the surface of neuraminidase-treated red blood cells. However, only
enzymatic reattachment by an α2,3(O)-sialyltransferase was able to rescue the neuraminidase-
induced invasion defect. One key question that remains to be addressed is why the sialic acid
attached with other methods could not function as a receptor for parasite invasion. Two potential
explanations include (1) that the synthetic receptors did not bind to parasite ligands with
sufficient affinity, and (2) that binding to the synthetic receptors created a junction that could not
facilitate downstream processes necessary for invasion to proceed.
The first hypothesis could be tested by performing in vitro binding assays to recombinantly-
expressed parasite ligands. The domain of EBA-175 that mediates binding to sialic acid (Region
II or RII) has been recombinantly expressed and shown to bind to erythrocytes, where binding is
sensitive to neuraminidase treatment1. A similar assay could be employed here – recombinant
EBA-175 RII could be fluorescently labeled and incubated with treated red blood cells. Binding
could be quantified by flow cytometry, and compared between untreated red blood cells, red
blood cells treated with neuraminidase, and neuraminidase-treated cells where sialic acid had
been attached via the methods described in Chapter 3.
Invasion arrest following junction formation could be observed using microscopy. Giemsa
staining during the invasion process could identify merozoites that had attached to the red blood
cell surface but had not invaded successfully. Electron microscopy could be used to examine the
junction between the merozoite and the red blood cell in more detail, yielding structural
information that could identify precisely where the invasion process is blocked.
113
If the tested synthetic receptor structures did not bind EBA-175 with sufficient affinity to
promote invasion, multiple strategies could be used to identify suitable receptor structures with
higher binding affinity. Sialic acid analogues have been shown to display potent inhibition of
EBA-175 binding to glycophorin A by ELISA2. In principle, these analogues could be
synthesized with aminooxy handles and attached to the red blood cell surface using the methods
developed in Chapter 3. Additional glycan structures with high affinity for EBA-175 could be
identified by screening glycan arrays3 where accumulation of fluorescently-labeled protein could
identify glycans with high binding affinity. Azido-functionalized glycans used in array synthesis4
could then be immobilized on the red blood cell surface using the oxime ligation method
described in Chapter 3, combined with commercially-available bifunctional linkers that contain
aminooxy and alkyne chemical handles.
A defect in synthetic receptor-mediated invasion occurring downstream from initial
merozoite binding would suggest several additional hypotheses. In the case of the immobilized
glycophorins, the size or steric properties of the immobilized receptor complex may impede the
formation of other ligand-receptor interactions necessary for invasion to proceed. In addition, the
hydrophobic transmembrane domains of the extracted glycophorins may promote unfavorable
protein-protein interactions. To address these possibilities, sialylated glycophorin peptides could
be prepared by protease-treating intact red blood cells or extracted glycophorin protein, and then
purifying using anion exchange or lectin affinity chromatography. These purified peptides could
then be immobilized on the red cell surface using the biotin-NeutrAvidin system described in
Chapter 3.
More generally, if binding to the synthetic sialic acid receptors does not promote other
ligand-receptor interactions necessary for productive invasion, combinations of receptors could
114
be investigated. Along with the sialic acid receptors described in Chapter 3, binding peptides
could be immobilized that facilitate ligand-receptor interactions that are known to be
indispensible to invasion. If these binding peptides were presented similarly to the synthetic
sialic acid receptors, perhaps this would increase their simultaneous accessibility to parasite
ligands and facilitate invasion.
4.6 Towards synthetic receptor use for in vitro culture of P. vivax
Finally, the immobilization strategies detailed in Chapter 3 could be applied to a more P.
vivax-like model system. In the closely-related parasite P. knowlesi, like in P. vivax, interactions
between the Duffy antigen and the parasite Duffy-binding protein (DBP) are required for
efficient invasion into human red blood cells. The crystal structure of PkDBP has been solved,
and the region of the Duffy antigen necessary for binding has been identified. This PkDBP-
binding peptide could be synthesized with the appropriate biotin- or aminooxy- handle and
immobilized on the surface of Duffy-negative human red blood cells to facilitate P. knowlesi
invasion. Given that P. vivax also expresses a homologous Duffy-binding protein, these
experiments could be directly translated to P. vivax.
Taken together, the outcomes of further synthetic receptor development in P. falciparum and
P. knowlesi could provide valuable insights toward facilitating P. vivax invasion into mature red
blood cells. If improving ligand-receptor affinity proves advantageous in P. falciparum, this
would suggest that efforts should be directed toward identifying high-affinity binders for the P.
vivax reticulocyte-binding proteins. This could be facilitated by affinity maturation of peptide
libraries using established yeast- bacterial- or bacteriophage-display strategies and recombinant
PvRBP domains. Additionally, pulldown experiments with recombinant PvRBP and peptides
115
released from reticulocytes via proteolysis may be useful in identifying potential PvRBP
receptors.
4.7 Conclusions
This thesis describes the development of novel chemical biology tools to address the growing
issue of drug resistance in the parasites responsible for the vast majority of malaria disease
burden. Using a genetically-encoded heme biosensor, we were able to directly link the
antimalarial activity of chloroquine to the perturbation of cytosolic labile heme for the first time.
We also were able to quantify a cytosolic labile heme pool that remains remarkably stable
throughout blood-stage parasite development, despite the large flux of hemoglobin-heme that
occurs during hemoglobin degradation in the trophozoite stage. Given the historical success of
chloroquine and the apparent lack of resistance to its proposed mechanism of action, perturbation
of cytosolic labile heme is likely to represent a promising phenotype to identify in future screens
of antimalarial compounds. Further insights into parasite heme metabolism enabled by this
biosensor may present additional opportunities for chemotherapeutic intervention.
Finally, by developing generalizable methods to immobilize synthetic receptors on the red
blood cell surface, we demonstrated that supplying the necessary receptor could promote parasite
invasion into cell types that were otherwise inaccessible. More broadly, this suggests that using
synthetic receptors can be useful to elucidate structural and biochemical requirements for red cell
receptors to productively engage parasite ligands. Future designs, when presented in appropriate
biochemical contexts, could promote the invasion of P. vivax into mature red blood cells and
potentially facilitate practical in vitro culture. Together, these tools present new opportunities to
gain fundamental insights into parasite biology and mechanisms of antimalarial drug action,
facilitating discovery of new generations of antimalarial drugs.
116
4.8 References
1. Pandey, K. C. et al. Bacterially expressed and refolded receptor binding domain of Plasmodium falciparum EBA-175 elicits invasion inhibitory antibodies. Mol Biochem Parasitol 123, 23–33 (2002).
2. Bharara, R., Singh, S., Pattnaik, P., Chitnis, C. E. & Sharma, A. Structural analogs of sialic acid interfere with the binding of erythrocyte binding antigen-175 to glycophorin A, an interaction crucial for erythrocyte invasion by Plasmodium falciparum. Mol Biochem Parasitol 138, 123–129 (2004).
3. Blixt, O. et al. Printed covalent glycan array for ligand profiling of diverse glycan binding proteins. Proc Natl Acad Sci USA 101, 17033–17038 (2004).
4. Blixt, O. & Razi, N. Chemoenzymatic synthesis of glycan libraries. Meth Enzymol 415, 137–153 (2006).
5. Sato, S., Rangachari, K. & Wilson, R. J. M. Targeting GFP to the malarial mitochondrion. Mol Biochem Parasitol 130, 155–158 (2003).
6. Waller, R. F., Reed, M. B., Cowman, A. F. & McFadden, G. I. Protein trafficking to the plastid of Plasmodium falciparum is via the secretory pathway. EMBO J 19, 1794–1802 (2000).
7. Nagaraj, V. A. et al. Malaria parasite-synthesized heme is essential in the mosquito and liver stages and complements host heme in the blood stages of infection. PLoS Pathog 9, e1003522 (2013).
8. Kuhn, Y., Rohrbach, P. & Lanzer, M. Quantitative pH measurements in Plasmodium falciparum-infected erythrocytes using pHluorin. Cell Microbiol 9, 1004–1013 (2007).
9. Sigala, P. A., Crowley, J. R., Hsieh, S., Henderson, J. P. & Goldberg, D. E. Direct Tests of Enzymatic Heme Degradation by the Malaria Parasite Plasmodium falciparum. J Biol Chem 287, 37793–37807 (2012).
10. Goldfless, S. J., Wagner, J. C. & Niles, J. C. Versatile control of Plasmodium falciparum gene expression with an inducible protein-RNA interaction. Nat Commun 5, 5329 (2014).
11. Armstrong, C. M. & Goldberg, D. E. An FKBP destabilization domain modulates protein levels in Plasmodium falciparum. Nature Methods 4, 1007–1009 (2007).
12. Pasini, E. M., van den Ierssel, D., Vial, H. J. & Kocken, C. H. M. A novel live-dead staining methodology to study malaria parasite viability. Malar J 12, 190 (2013).
13. Spangenberg, T. et al. The open access malaria box: a drug discovery catalyst for neglected diseases. PLoS ONE 8, e62906 (2013).
14. Banning, C. et al. A flow cytometry-based FRET assay to identify and analyse protein-protein interactions in living cells. PLoS ONE 5, e9344 (2010).
15. Rizzo, M. A., Springer, G. H., Granada, B. & Piston, D. W. An improved cyan fluorescent protein variant useful for FRET. Nature Biotechnology 22, 445 (2004).
16. Goedhart, J. et al. Structure-guided evolution of cyan fluorescent proteins towards a quantum yield of 93%. Nat Commun 3, 751 (2012).
17. Woehler, A. Simultaneous Quantitative Live Cell Imaging of Multiple FRET-Based Biosensors. PLoS ONE 8, e61096 (2013).
18. Griesbeck, O., Baird, G. S., Campbell, R. E., Zacharias, D. A. & Tsien, R. Y. Reducing the environmental sensitivity of yellow fluorescent protein. Mechanism and applications. J Biol Chem 276, 29188–29194 (2001).
19. Nagai, T. et al. A variant of yellow fluorescent protein with fast and efficient maturation

117
for cell-biological applications. Nature Biotechnology 20, 87–90 (2002). 20. van der Krogt, G. N. M., Ogink, J., Ponsioen, B. & Jalink, K. A comparison of donor-
acceptor pairs for genetically encoded FRET sensors: application to the Epac cAMP sensor as an example. PLoS ONE 3, e1916 (2008).
21. Miranda, J. et al. New Alternately Colored FRET Sensors for Simultaneous Monitoring of Zn2+ in Multiple Cellular Locations. PLoS ONE 7, (2012).
22. Palmer, A. E., Qin, Y., Park, J. G. & McCombs, J. E. Design and application of genetically encoded biosensors. Trends in Biotechnology 29, 144–152 (2011).
23. PIETRASZEWSKA-BOGIEL, A. & GADELLA, T. W. J. FRET microscopy: from principle to routine technology in cell biology. J Microsc 241, 111–118 (2011).
24. Takeda, S., Kamiya, N. & Nagamune, T. A novel protein-based heme sensor consisting of green fluorescent protein and apocytochrome b(562). Anal Biochem 317, 116–119 (2003).
25. Koga, S. et al. Development of a heme sensor using fluorescently labeled heme oxygenase-1. Anal Biochem 433, 2–9 (2013).
26. Padilla-Parra, S. et al. Quantitative Comparison of Different Fluorescent Protein Couples for Fast FRET-FLIM Acquisition. Biophysical Journal 97, 2368–2376 (2009).
27. Paterson, M. J. et al. A fluorescence lifetime-based assay for serine and threonine kinases that is suitable for high-throughput screening. Anal Biochem 402, 54–64 (2010).
28. Alibhai, D. et al. Automated fluorescence lifetime imaging plate reader and its application to Förster resonant energy transfer readout of Gag protein aggregation. J Biophotonics 6, 398–408 (2013).
29. Rajagopal, A. et al. Haem homeostasis is regulated by the conserved and concerted functions of HRG-1 proteins. Nature 453, 1127–1131 (2008).
30. Chen, C., Samuel, T. K., Sinclair, J., Dailey, H. A. & Hamza, I. An intercellular heme-trafficking protein delivers maternal heme to the embryo during development in C. elegans. Cell 145, 720–731 (2011).
31. Pishchany, G. & Skaar, E. P. Taste for blood: hemoglobin as a nutrient source for pathogens. PLoS Pathog 8, e1002535 (2012).