development of isometric muscular strength …facta.junis.ni.ac.rs/pe/pe201203/pe201203-07.pdf ·...
TRANSCRIPT
FACTA UNIVERSITATIS Series: Physical Education and Sport Vol. 10, No 3, 2012, pp. 231 - 242
Original research article
DEVELOPMENT OF ISOMETRIC MUSCULAR STRENGTH IN ADOLESCENT SOCCER PLAYERS
UDC 796.332:536-7/-053.5
Panteleïmon Nikolaïdis
Laboratory of Human Performance and Rehabilitation, Department of Physical and Cultural Education, Hellenic Army Academy, Greece
Abstract. While muscular strength is a main component of health-related fitness, its development during adolescence in soccer has not been studied sufficiently. The aim of this study was to investigate the effect of age, anthropometric and body composition characteristics on isometric muscular strength. Male adolescent (N=291; aged 12.01-21 y), classified in nine one-year age-groups, child (N=16, aged 7.34-11.97 y) and adult players (N=30; aged 21.12-31.59 y), all members of competitive soccer clubs, performed four tests of strength; the right handgrip, left handgrip, trunk and trunk-legs strength test. The one-way ANOVA revealed significant differences between the child, adolescent and adult age groups with respect to the right handgrip (F10,326=48.9, P<.001, η2=.6), left handgrip (F10,326=47.63, P<.001, η2=.59), trunk (F8,249=20.71, P<.001, η2=.4), trunk-legs (F8,249=19.33, P<.001, η2=.38), and the sum of these four measures expressed either as absolute (F8,249=25.93, P<.001, η2=.45) or as relative to body mass (F8,249=6.5, P<.001, η2=.17). For all the aforementioned parameters, the adult group scored higher than the adolescent one, who performed better than the child group, whilst the age groups in the higher spectrum of adolescence scored better than those in the lower spectrum. Isometric muscular strength measures moderately correlated with age (.54<r<.68, P<.001), even after the effect of body size was partitioned out (.38<r<.42, P<.001). The total increase in isometric strength across adolescence was less in soccer players than in the general population. Since there was discrepancy between muscular strength development in soccer players and general population, our normative data could provide a valuable tool for coaches and fitness trainers in order to track of strength development across adolescence.
Key words: age, force, growth, handgrip test.
Received May 3, 2012 / Accepted December 15, 2012 Corresponding author: Panteleïmon Nikolaïdis, Ph.D Vari 16673, Athens, Greece Phone: + 306977820298 Fax: 302104907557 E-mail: [email protected]
232 P. NIKOLAÏDIS
INTRODUCTION
Performance in soccer results from the combination of physiological, psychological, social and environmental factors. Among the physiological factors, physical fitness was well-studied in elite adult players and recently there was an increasing scientific interest in the physiological predisposition of adolescent soccer players for future excellence (Reilly, Williams, Nevill & Franks, 2000). However, in spite of the popularity of soccer in adolescence and the foundation of several professional schools for young players, few studies were contacted regarding the physiological parameters and particularly the iso-metric muscle strength of these athletes. In addition to the importance of such studies for sport scientists, soccer coaches and fitness trainers, a multidisciplinary concern about this topic was also evolved. The development of muscular strength in childhood and adoles-cence recently attracted the interest of the pediatric community and recommendations re-garding strength training were published (American Academy of Pediatrics, 2008).
Muscular strength is a component of both health-related and sport-related physical fitness. It is defined as the ability of a muscle group to develop maximal contractile force against a resistance in a single contraction and is either static or isometric, which involves no change in muscle length, and dynamic, which involves either eccentric or concentric action (Heyward, 2010). A normal level of strength is necessary for normal healthy liv-ing, while muscle weakness might impair normal functional movement (Prentice, 2007). In a systematic review of muscular strength development in children and adolescents, the association of inadequate strength with increased injury risk, muscular imbalance, de-creased self-esteem and body image was also highlighted (Manno, 2008).
In addition to this health-related role of muscular strength, research carried out on children (Cortis et al., 2009; Hansen, Bangsbo, Twisk & Klausen, 1999), adult and older male (Cortis et al., 2009) and female soccer players (Nikolaidis, 2010a) suggested that isometric strength is associated with performance. In a study of child (12 years old (y), N=40), adult (26 y, N=42) and older soccer players and sedentary individuals (59 y, N=32), regardless of their age, soccer players showed better performance in handgrip strength than their sedentary counterparts (Cortis et al., 2009). Elite 11 year-old soccer players had greater values of handgrip strength than their non-elite counterparts (30.4 kg vs. 25.9 kg respectively; Hansen et al., 1999). Besides, starter elite female players had higher relative muscular strength, assessed from the sum of four measures (right and left handgrip, trunk and trunk-legs) than their substitutes (4.47 kg.kg-1 of body mass vs. 4.06 kg.kg-1 of body mass respectively; Nikolaidis, 2010a). Dynamic muscular strength, measured by the vertical jump, was higher in elite than non-elite soccer players (Ostojić, 2000).
Isometric muscular strength in soccer was already investigated in the higher spectrum of childhood and in the lower spectrum of adolescence (Canhadas, Silva, Chaves & Portes, 2010; Hansen et al., 1999), as well as in the higher spectrum of adolescence (Manna, Khanna & Dhara, 2010). In the general population, this physical fitness pa-rameter was studied in a wide range of adolescents (Ortega et al., 2011; Ortega et al., 2008; Georgiadis, 1991). A study on muscular strength on a small sample (N=23) of child, adolescent and adult vegetarian population was also conducted (Hebbelinck, Clarys & De Malsche, 1999). Nevertheless, no comprehensive research related to isometric strength in a wide range of adolescent soccer players was ever conducted.
Contrary to that, studies that covered a wider range of adolescence were carried out with respect to dynamic muscular strength. This form of muscular strength estimated by
Development of Isometric Muscular Strength in Adolescent Soccer Players 233
the countermovement vertical jump, increased by 20.59% in soccer players aged 11 to 18 (40.8±4.7 cm and 49.2±7.1 cm; Le Gall, Beillot & Rochcongar, 2002), while it increased by 46.77% in adolescents aged 11 to 18 (31±6.2 cm and 45.5±9.6 cm; Hertogh, Micallef & Mercier, 1992). Considering the findings of these studies, it was assumed that differ-ences in dynamic muscular strength between soccer players and the general population decreased across adolescence and the higher rate of increase in this physical fitness pa-rameter occurred in the latter group. Other parameters of musculoskeletal fitness were also investigated in soccer players, e.g. muscular endurance. Compared to adult soccer players, adolescent players had lower values of muscular endurance, though the differ-ence was not statistically significant (Nikolaidis, 2010b).
To sum up what is already known about this topic, four points should be emphasized; (a) that there are indications of the association between isometric muscular strength and soccer performance, based on studies that revealed better scores in soccer players than in the general population or better scores of starters than of substitutes, (b) studies carried out on general population revealed an increase in isometric muscular strength all through adolescence, (c) studies conducted on a relatively narrow chronological range of adoles-cent soccer players reinforced these findings, and (d) based on studies on dynamic mus-cular strength, it was proposed that strength increased across adolescence less in soccer players than in the general population. Therefore, the aim of this study was to (i) examine isometric muscular strength in adolescent soccer players with respect to the general population, (ii) examine whether the development of this physical fitness parameter in soccer players followed similar fluctuations as in the general population, (iii) compare scores between different age-groups of adolescents, (iv) compare scores between child, adolescent and adult players, (v) investigate the influence of anthropometric and body composition characteristics on isometric strength, and (vi) establish reference data for isometric muscular strength in adolescent soccer players.
MATERIALS AND METHODS
Participants and procedures
In this study, a non-experimental, descriptive-correlation design was used to examine the effect of age on isometric muscular strength across adolescence. Testing procedures were performed during the 2009-2010 competition season. Research was carried out in accordance with the ethical standards of the Helsinki Convention of 1975; written in-formed consent was received from all the players or parents following a verbal explana-tion of the experimental design and potential risks of study. Though adolescence is a dif-ficult period to define in terms of chronological age, because of variation in the time of its onset and termination, the suggested range is between 10 and 22 years in boys (Ma-lina, Bouchard & Bar-Or, 2004), and it is the period that makes up a foundation stone for future athletic excellence. Male adolescents (N=291; aged 12.01-21 years), classified in nine one-year age-groups (a group under thirteen U13, aged 12.01-13 y; U14, 13.06-14 y, U15, 14.03-14.99 y, U16, 15.01-15.98 y; U17, 16.02-16.99 y; U18, 17.01-17.96 y; U19, 18.02-19 y; U20, 19.03-19.96 y; U21, 20.01-21 y), child (a control group, U12, N=16, aged 7.34-11.97 y) and adult players (a control group, C, N=30; aged 21.12-31.59 y), all of them members of competitive soccer clubs volunteered for this study. The players were acquainted with the testing procedures used in this study through pre-investigation
234 P. NIKOLAÏDIS
familiarization sessions. They visited the testing laboratory once; anthropometric and body composition data were obtained followed by four measures of isometric muscular strength (right and left handgrip, back strength, combined back-and-leg test).
Matrials and methods
Height and body mass were measured by using a stadiometer (SECA, Leicester, UK) and an electronic scale (HD-351, Tanita, Illinois, USA), respectively. Percent of body fat (BF) was calculated from the sum of 10 skinfolds (cheek, wattle, chest I, triceps, sub-scapular, abdominal, chest II, suprailiac, thigh and calf) using a skinfold calliper (Har-penden, West Sussex, UK), based on the formula proposed by Parizkova (1978): BF = -41.32 + 12.59 • logex, where x is the sum of the 10 skinfolds. The handgrip strength test is reliable and is suggested as a measure of muscular strength in the young population (Artero et al 2011; Adam, Klissouras, Ravazzlo, Renson & Tuxworth, 1988). Generally, isometric strength measures are valid and reliable (Froberg & Lammert 1996). In a com-parison between three handgrip dynamometers (Jamar, DynEx and Takei) Takei was found to be more reliable and valid (Espana-Romero et al., 2010). An isometric handgrip strength test was performed, in which the participants were asked to stand with their el-bow bent at approximately 90˚. They were instructed to squeeze the handle of the hand-grip dynamometer (Takei, Tokyo, Japan) as hard as possible for 5 seconds. Two trials were performed for each hand, with a 1-min rest between the trials. The better one of the two trials was recorded as the maximal effort for each hand (Heyward, 2010; Skinner, 2005). In addition, two isometric tests were performed with a back strength dynamometer (Takei, Tokyo, Japan); in the first test (the back strength test), their legs and backs were straightened to allow the bar to be at the level of the patella, while in the second test (combined back-and-leg test), the chain length on the dynamometer was adjusted so that the participants squatted over the dynamometer with their knees flexed at approximately 30˚ (Heyward 2010; Skinner, 2005). Measurements were recorded to the nearest 0.1 kg.
Data and statistical analyses
Results were presented as mean±st.dev. Data sets were checked for normality by us-ing the Shapiro-Wilks normality test and visual inspection. The effects of age on the muscular strength outcomes were examined by the Pearson moment correlation coeffi-cient (r), and partial correlations between the strength and age, adjusted for anthropomet-ric data (body mass and height), were calculated. Differences between the age-groups were assessed by using a one-way analysis of variance. A correction for multiple com-parisons was undertaken by using the Bonferroni method. The significance level was set at alpha=0.05. Statistical analyses were performed by using SPSS v.17.0 statistical soft-ware (SPSS Inc., Chicago, IL, USA).
Development of Isometric Muscular Strength in Adolescent Soccer Players 235
RESULTS
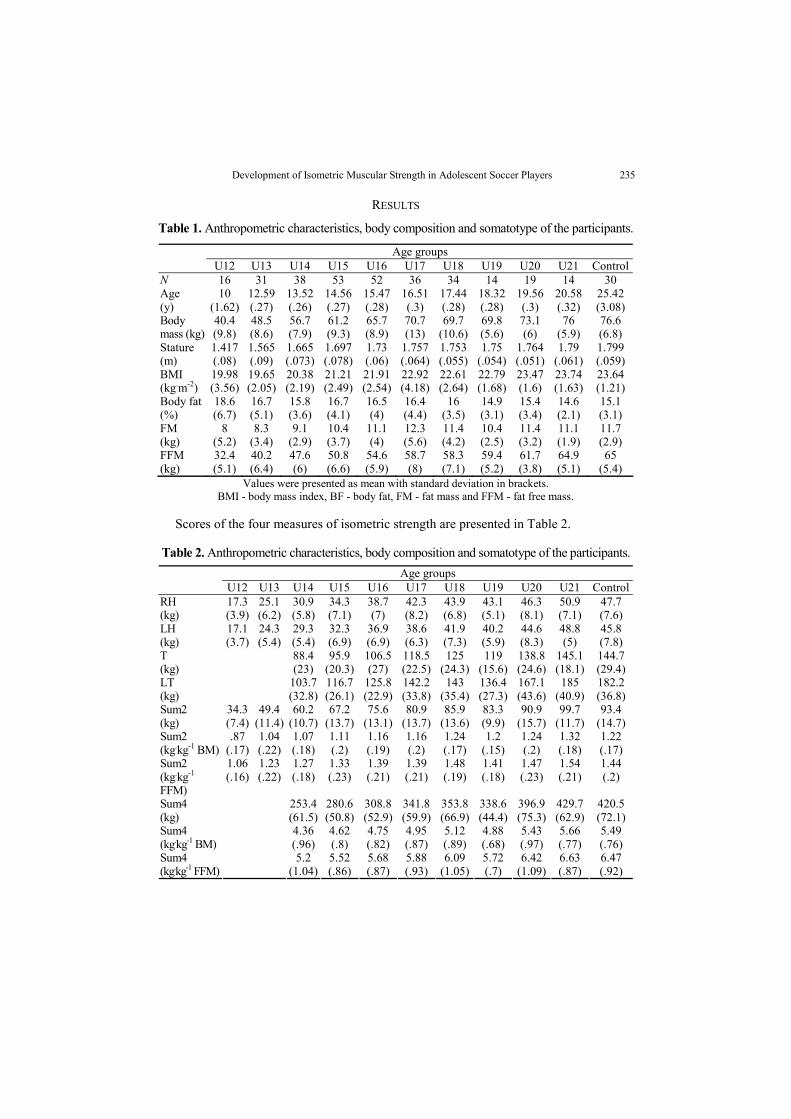
Table 1. Anthropometric characteristics, body composition and somatotype of the participants.
Age groups U12 U13 U14 U15 U16 U17 U18 U19 U20 U21 Control
N 16 31 38 53 52 36 34 14 19 14 30 Age (y)
10 (1.62)
12.59 (.27)
13.52 (.26)
14.56 (.27)
15.47 (.28)
16.51 (.3)
17.44 (.28)
18.32 (.28)
19.56 (.3)
20.58 (.32)
25.42 (3.08)
Body mass (kg)
40.4 (9.8)
48.5 (8.6)
56.7 (7.9)
61.2 (9.3)
65.7 (8.9)
70.7 (13)
69.7 (10.6)
69.8 (5.6)
73.1 (6)
76 (5.9)
76.6 (6.8)
Stature (m)
1.417 (.08)
1.565 (.09)
1.665 (.073)
1.697 (.078)
1.73 (.06)
1.757 (.064)
1.753 (.055)
1.75 (.054)
1.764 (.051)
1.79 (.061)
1.799 (.059)
BMI (kg.m-2)
19.98 (3.56)
19.65 (2.05)
20.38 (2.19)
21.21 (2.49)
21.91 (2.54)
22.92 (4.18)
22.61 (2.64)
22.79 (1.68)
23.47 (1.6)
23.74 (1.63)
23.64 (1.21)
Body fat (%)
18.6 (6.7)
16.7 (5.1)
15.8 (3.6)
16.7 (4.1)
16.5 (4)
16.4 (4.4)
16 (3.5)
14.9 (3.1)
15.4 (3.4)
14.6 (2.1)
15.1 (3.1)
FM (kg)
8 (5.2)
8.3 (3.4)
9.1 (2.9)
10.4 (3.7)
11.1 (4)
12.3 (5.6)
11.4 (4.2)
10.4 (2.5)
11.4 (3.2)
11.1 (1.9)
11.7 (2.9)
FFM (kg)
32.4 (5.1)
40.2 (6.4)
47.6 (6)
50.8 (6.6)
54.6 (5.9)
58.7 (8)
58.3 (7.1)
59.4 (5.2)
61.7 (3.8)
64.9 (5.1)
65 (5.4)
Values were presented as mean with standard deviation in brackets. BMI - body mass index, BF - body fat, FM - fat mass and FFM - fat free mass.
Scores of the four measures of isometric strength are presented in Table 2.
Table 2. Anthropometric characteristics, body composition and somatotype of the participants.
Age groups U12 U13 U14 U15 U16 U17 U18 U19 U20 U21 Control
RH (kg)
17.3 (3.9)
25.1 (6.2)
30.9 (5.8)
34.3 (7.1)
38.7 (7)
42.3 (8.2)
43.9 (6.8)
43.1 (5.1)
46.3 (8.1)
50.9 (7.1)
47.7 (7.6)
LH (kg)
17.1 (3.7)
24.3 (5.4)
29.3 (5.4)
32.3 (6.9)
36.9 (6.9)
38.6 (6.3)
41.9 (7.3)
40.2 (5.9)
44.6 (8.3)
48.8 (5)
45.8 (7.8)
T (kg)
88.4 (23)
95.9 (20.3)
106.5 (27)
118.5 (22.5)
125 (24.3)
119 (15.6)
138.8 (24.6)
145.1 (18.1)
144.7 (29.4)
LT (kg)
103.7 (32.8)
116.7 (26.1)
125.8 (22.9)
142.2 (33.8)
143 (35.4)
136.4 (27.3)
167.1 (43.6)
185 (40.9)
182.2 (36.8)
Sum2 (kg)
34.3 (7.4)
49.4 (11.4)
60.2 (10.7)
67.2 (13.7)
75.6 (13.1)
80.9 (13.7)
85.9 (13.6)
83.3 (9.9)
90.9 (15.7)
99.7 (11.7)
93.4 (14.7)
Sum2 (kg.kg-1 BM)
.87 (.17)
1.04 (.22)
1.07 (.18)
1.11 (.2)
1.16 (.19)
1.16 (.2)
1.24 (.17)
1.2 (.15)
1.24 (.2)
1.32 (.18)
1.22 (.17)
Sum2 (kg.kg-1 FFM)
1.06 (.16)
1.23 (.22)
1.27 (.18)
1.33 (.23)
1.39 (.21)
1.39 (.21)
1.48 (.19)
1.41 (.18)
1.47 (.23)
1.54 (.21)
1.44 (.2)
Sum4 (kg)
253.4 (61.5)
280.6 (50.8)
308.8 (52.9)
341.8 (59.9)
353.8 (66.9)
338.6 (44.4)
396.9 (75.3)
429.7 (62.9)
420.5 (72.1)
Sum4 (kg.kg-1 BM)
4.36 (.96)
4.62 (.8)
4.75 (.82)
4.95 (.87)
5.12 (.89)
4.88 (.68)
5.43 (.97)
5.66 (.77)
5.49 (.76)
Sum4 (kg.kg-1 FFM)
5.2 (1.04)
5.52 (.86)
5.68 (.87)
5.88 (.93)
6.09 (1.05)
5.72 (.7)
6.42 (1.09)
6.63 (.87)
6.47 (.92)
236 P. NIKOLAÏDIS
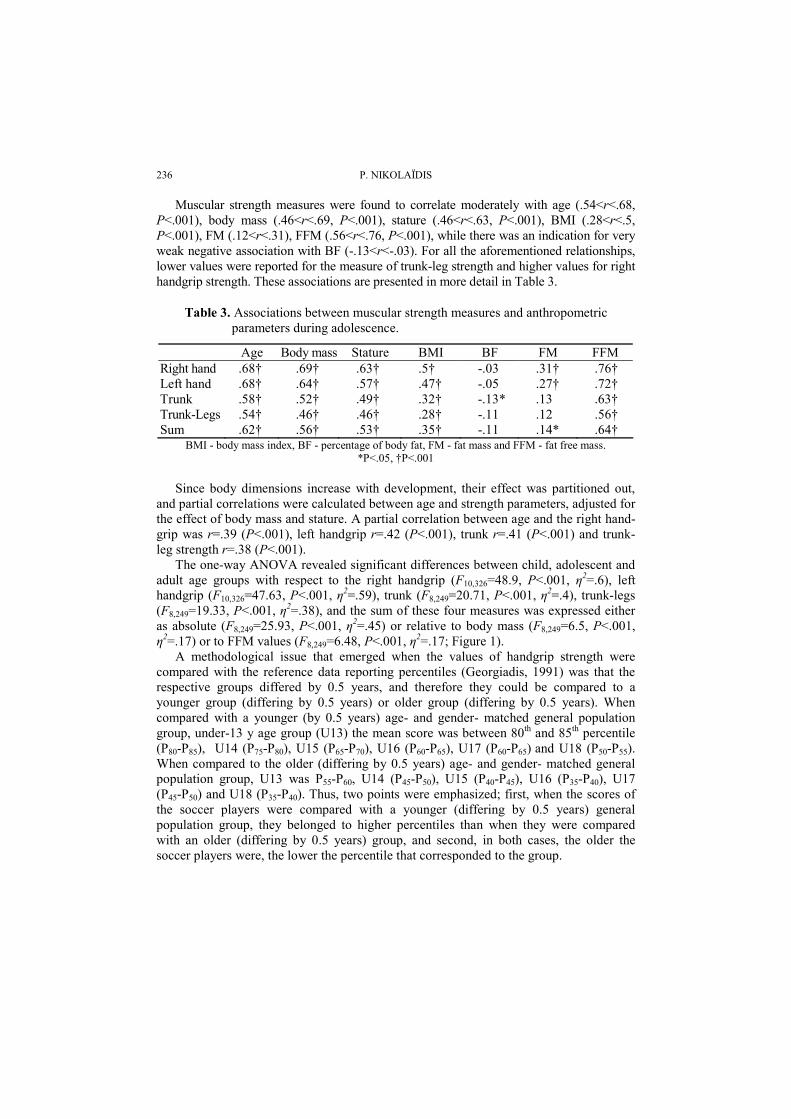
Muscular strength measures were found to correlate moderately with age (.54<r<.68, P<.001), body mass (.46<r<.69, P<.001), stature (.46<r<.63, P<.001), BMI (.28<r<.5, P<.001), FM (.12<r<.31), FFM (.56<r<.76, P<.001), while there was an indication for very weak negative association with BF (-.13<r<-.03). For all the aforementioned relationships, lower values were reported for the measure of trunk-leg strength and higher values for right handgrip strength. These associations are presented in more detail in Table 3.
Table 3. Associations between muscular strength measures and anthropometric parameters during adolescence.
Age Body mass Stature BMI BF FM FFM Right hand .68† .69† .63† .5† -.03 .31† .76† Left hand .68† .64† .57† .47† -.05 .27† .72† Trunk .58† .52† .49† .32† -.13* .13 .63† Trunk-Legs .54† .46† .46† .28† -.11 .12 .56† Sum .62† .56† .53† .35† -.11 .14* .64†
BMI - body mass index, BF - percentage of body fat, FM - fat mass and FFM - fat free mass. *P<.05, †P<.001
Since body dimensions increase with development, their effect was partitioned out, and partial correlations were calculated between age and strength parameters, adjusted for the effect of body mass and stature. A partial correlation between age and the right hand-grip was r=.39 (P<.001), left handgrip r=.42 (P<.001), trunk r=.41 (P<.001) and trunk-leg strength r=.38 (P<.001).
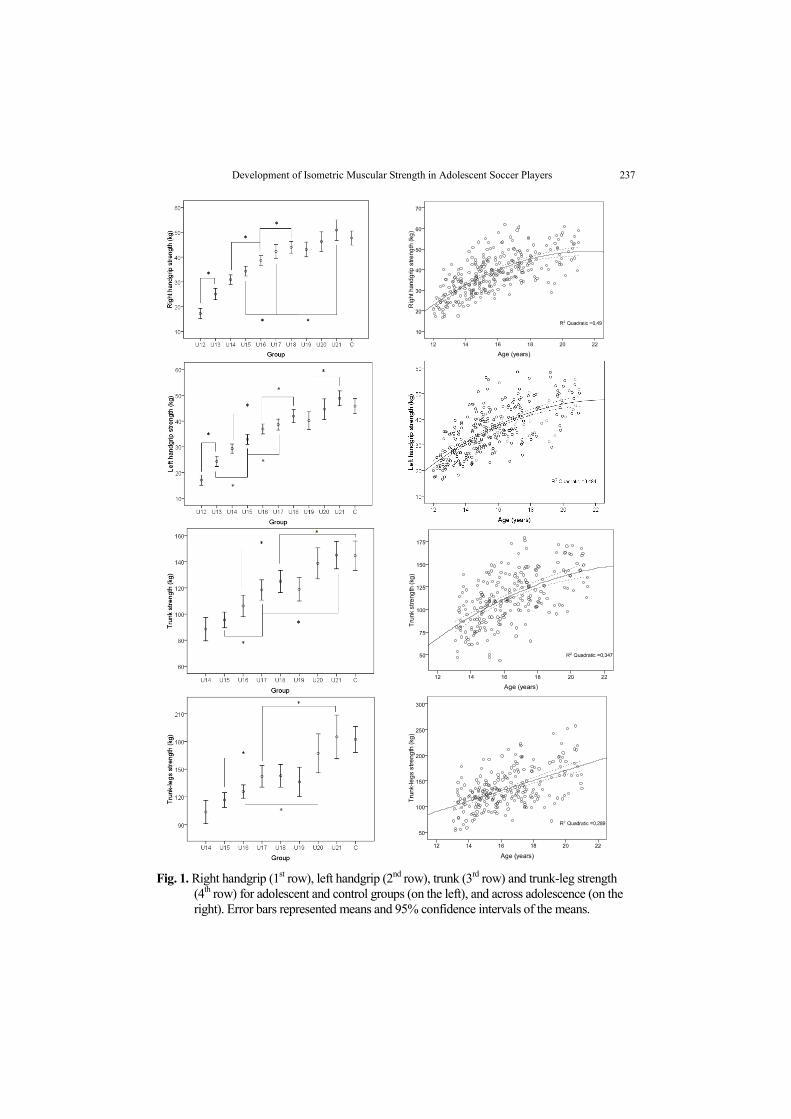
The one-way ANOVA revealed significant differences between child, adolescent and adult age groups with respect to the right handgrip (F10,326=48.9, P<.001, η2=.6), left handgrip (F10,326=47.63, P<.001, η2=.59), trunk (F8,249=20.71, P<.001, η2=.4), trunk-legs (F8,249=19.33, P<.001, η2=.38), and the sum of these four measures was expressed either as absolute (F8,249=25.93, P<.001, η2=.45) or relative to body mass (F8,249=6.5, P<.001, η2=.17) or to FFM values (F8,249=6.48, P<.001, η2=.17; Figure 1).
A methodological issue that emerged when the values of handgrip strength were compared with the reference data reporting percentiles (Georgiadis, 1991) was that the respective groups differed by 0.5 years, and therefore they could be compared to a younger group (differing by 0.5 years) or older group (differing by 0.5 years). When compared with a younger (by 0.5 years) age- and gender- matched general population group, under-13 y age group (U13) the mean score was between 80th and 85th percentile (P80-P85), U14 (P75-P80), U15 (P65-P70), U16 (P60-P65), U17 (P60-P65) and U18 (P50-P55). When compared to the older (differing by 0.5 years) age- and gender- matched general population group, U13 was P55-P60, U14 (P45-P50), U15 (P40-P45), U16 (P35-P40), U17 (P45-P50) and U18 (P35-P40). Thus, two points were emphasized; first, when the scores of the soccer players were compared with a younger (differing by 0.5 years) general population group, they belonged to higher percentiles than when they were compared with an older (differing by 0.5 years) group, and second, in both cases, the older the soccer players were, the lower the percentile that corresponded to the group.
Development of Isometric Muscular Strength in Adolescent Soccer Players 237
Fig. 1. Right handgrip (1st row), left handgrip (2nd row), trunk (3rd row) and trunk-leg strength (4th row) for adolescent and control groups (on the left), and across adolescence (on the right). Error bars represented means and 95% confidence intervals of the means.
238 P. NIKOLAÏDIS
DISCUSSION
Based on our findings, it is suggested that isometric muscular strength in soccer play-ers increased disproportionally with respect to the general population across adolescence, which is in accordance with the results of studies on dynamic strength (Le Gall et al 2002; Hertogh et al., 1992). Therefore, the muscular strength development pattern was determined to be sport-dependent and the need for sport-specific normative data was con-firmed. Considering the significant association of isometric muscular strength measures with body mass (BM) and fat free mass (FFM), our data were scrutinized in the light of previous findings concerning either absolute or relative measures of strength.
The sum of the right and left handgrip strength in U13 is similar with the reference data in soccer (Canhadas et al., 2010), either when expressed as absolute (49.4 kg vs. 46.1 kg) or as relative to BM (1.04 kg.kg-1 BM vs. 1.14 kg.kg-1 BM) or to FFM values (1.23 kg.kg-1 FFM vs. 1.34 kg.kg-1 FFM), while respective values in U14 were 60.2 kg vs. 54.5 kg, 1.07 kg.kg-1 BM vs. 1.17 kg.kg-1 BM and 1.27 kg.kg-1 FFM vs. 1.37 kg.kg-1 FFM. In the aforementioned study, lower values were reported in U11 (37.7 kg, 1.09 kg.kg-1 BM and 1.28 kg.kg-1 FFM) and U12 (40.5 kg, 1.13 kg.kg-1 BM and 1.31 kg.kg-1 FFM). In a study on soccer players, in which handgrip strength of the dominant hand was 27.6 kg in U16, 31.2 kg in U19, 36.2 kg in U23and 39.8 kg in adults, lower values were reported regarding mean and variability scores of the study conducted by Manna et al. (2010). Thus, our findings were in agreement with previous studies (Canhadas et al., 2010; Manna et al., 2010) suggesting that as the age increased, the better the isometric strength was, and that there was less increment in relative BM or FFM than in absolute values of strength. In a vegetarian population, young adults (58±8.9 kg, 18-30 years, N=8) were stronger than adolescents (32.3±3.6 kg, 12-17 years, N=10), who were stronger than chil-dren (18.4±2.1 kg, 6-11 years, N=5; Hebbelinck et al., 1999), as well.
Similar values were reported about the general population either when the outcome was the dominant handgrip strength (Georgiadis, 1991) or the average of the right and left hand (Ortega et al., 2011). Handgrip strength was 21 (5.3) kg in 12 y old boys, mean value with standard deviation in brackets, 26 (7.5) kg in 13 y, 31 (7.8) kg in 14 y, 36 (8.1) kg in 15 y, 41 (8.2) kg in 16 y, 43 (8.4) kg in 17 y and 46 (7.9) kg in 18 y (Georgiadis, 1991), while it was 27 (6.3) kg in 13 y, 32.1 (7.8) kg in 14 y, 37.4 (7.9) kg in 15 y, 41.6 (7.3) kg in 16 y and 45.3 (6.1) kg in 17 y (Ortega et al., 2011). Muscular strength, esti-mated by the sum of the right and left handgrip test scores, increased by 47.4% in adoles-cents aged 13 to 18.5 (53.8±13.3 kg and 79.3±13.2 kg respectively; Ortega et al., 2008).
Compared with the general population (Heyward, 2010), the adult control group of soccer players, who participated in our study, had lower values for the right handgrip (47.7 kg vs. 54.5 kg), left handgrip (45.8 kg vs. 49 kg), trunk (144.7 kg vs. 151 kg), trunk-leg strength (182.2 kg vs. 186.5 kg) and the sum of the four measures in absolute (420.5 kg vs. 441 kg) and relative to body mass values (5.49 vs. 6.15), which were char-acterized as “average”. The adult control group had a right handgrip (47.7 kg vs. 49.1 kg) and sum of the right and left handgrip strength expressed either in absolute (93.4 kg vs. 96.8 kg) or relative to body mass values (1.22 kg.kg-1 BM vs. 1.32 kg.kg-1 BM), but lower than those reported by Thomas & Reilly (1979).
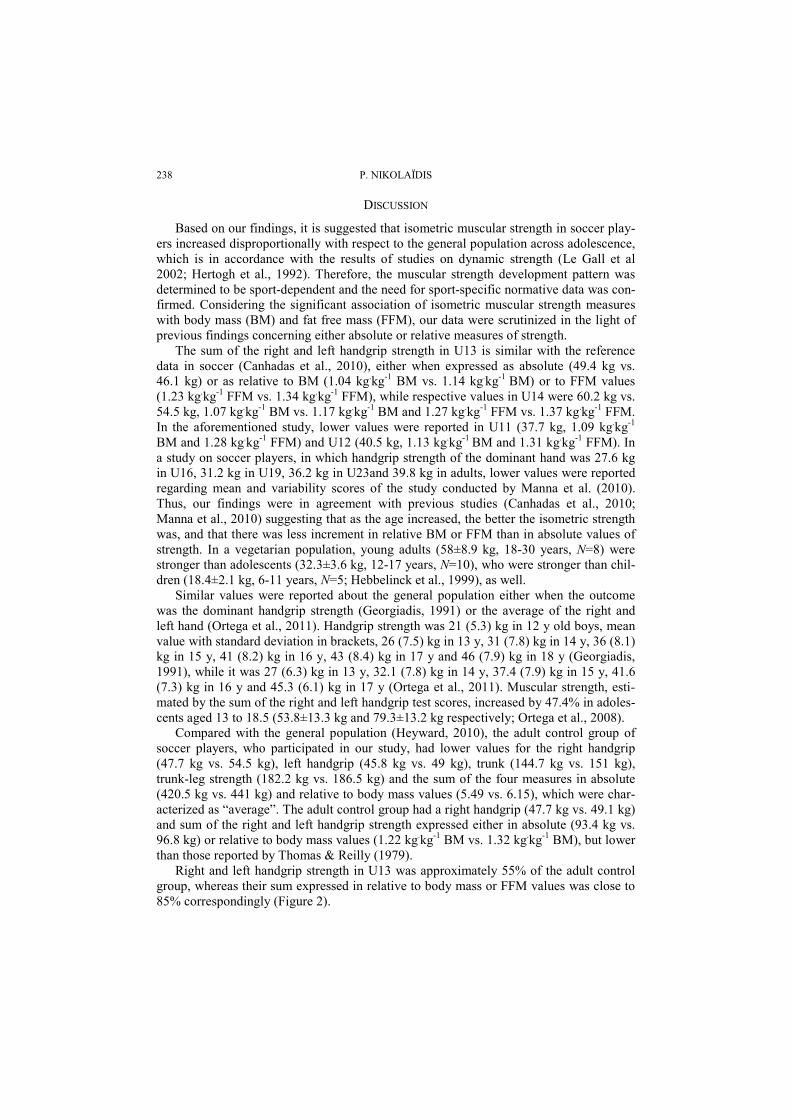
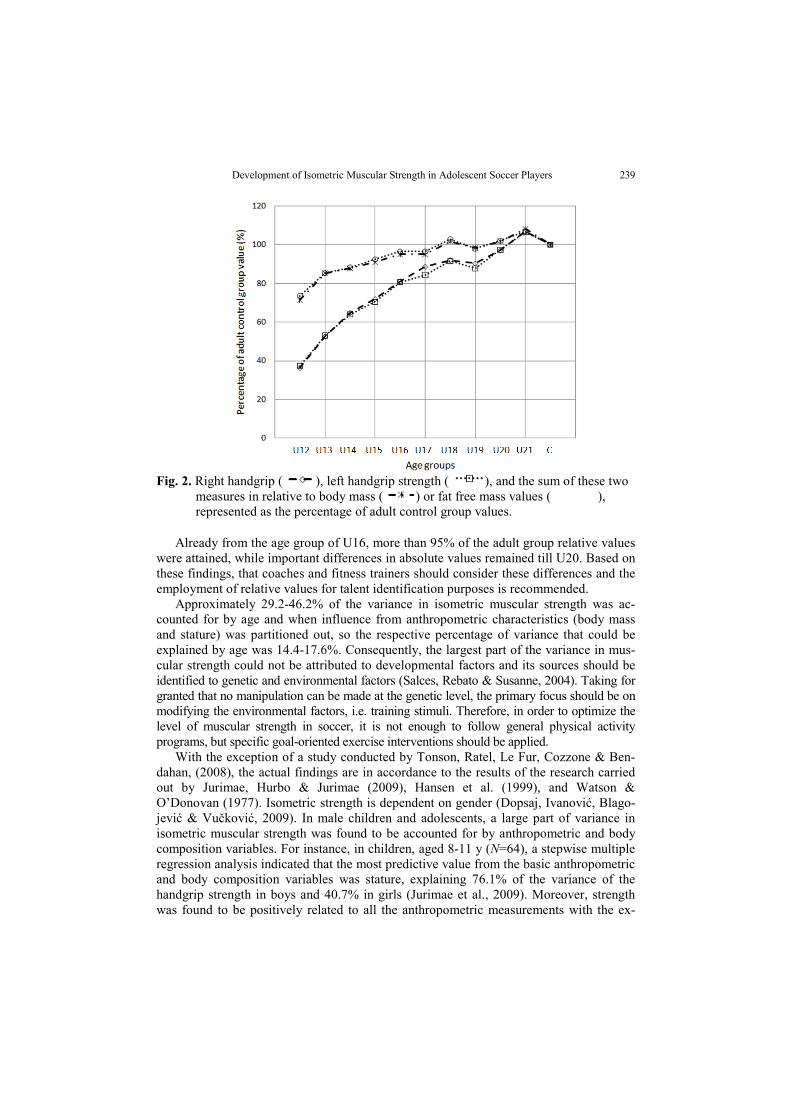
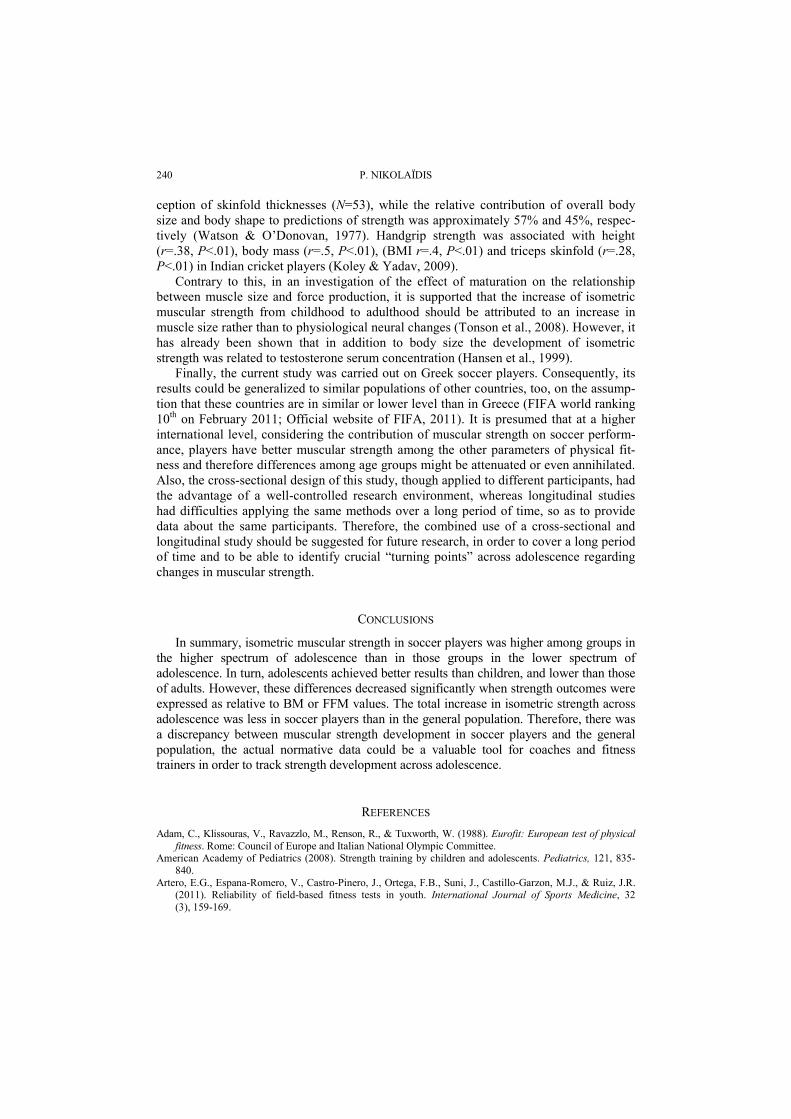
Right and left handgrip strength in U13 was approximately 55% of the adult control group, whereas their sum expressed in relative to body mass or FFM values was close to 85% correspondingly (Figure 2).
Development of Isometric Muscular Strength in Adolescent Soccer Players 239
Fig. 2. Right handgrip ( ), left handgrip strength ( ), and the sum of these two
measures in relative to body mass ( ) or fat free mass values ( ), represented as the percentage of adult control group values.
Already from the age group of U16, more than 95% of the adult group relative values were attained, while important differences in absolute values remained till U20. Based on these findings, that coaches and fitness trainers should consider these differences and the employment of relative values for talent identification purposes is recommended.
Approximately 29.2-46.2% of the variance in isometric muscular strength was ac-counted for by age and when influence from anthropometric characteristics (body mass and stature) was partitioned out, so the respective percentage of variance that could be explained by age was 14.4-17.6%. Consequently, the largest part of the variance in mus-cular strength could not be attributed to developmental factors and its sources should be identified to genetic and environmental factors (Salces, Rebato & Susanne, 2004). Taking for granted that no manipulation can be made at the genetic level, the primary focus should be on modifying the environmental factors, i.e. training stimuli. Therefore, in order to optimize the level of muscular strength in soccer, it is not enough to follow general physical activity programs, but specific goal-oriented exercise interventions should be applied.
With the exception of a study conducted by Tonson, Ratel, Le Fur, Cozzone & Ben-dahan, (2008), the actual findings are in accordance to the results of the research carried out by Jurimae, Hurbo & Jurimae (2009), Hansen et al. (1999), and Watson & O’Donovan (1977). Isometric strength is dependent on gender (Dopsaj, Ivanović, Blago-jević & Vučković, 2009). In male children and adolescents, a large part of variance in isometric muscular strength was found to be accounted for by anthropometric and body composition variables. For instance, in children, aged 8-11 y (N=64), a stepwise multiple regression analysis indicated that the most predictive value from the basic anthropometric and body composition variables was stature, explaining 76.1% of the variance of the handgrip strength in boys and 40.7% in girls (Jurimae et al., 2009). Moreover, strength was found to be positively related to all the anthropometric measurements with the ex-
240 P. NIKOLAÏDIS
ception of skinfold thicknesses (N=53), while the relative contribution of overall body size and body shape to predictions of strength was approximately 57% and 45%, respec-tively (Watson & O’Donovan, 1977). Handgrip strength was associated with height (r=.38, P<.01), body mass (r=.5, P<.01), (BMI r=.4, P<.01) and triceps skinfold (r=.28, P<.01) in Indian cricket players (Koley & Yadav, 2009).
Contrary to this, in an investigation of the effect of maturation on the relationship between muscle size and force production, it is supported that the increase of isometric muscular strength from childhood to adulthood should be attributed to an increase in muscle size rather than to physiological neural changes (Tonson et al., 2008). However, it has already been shown that in addition to body size the development of isometric strength was related to testosterone serum concentration (Hansen et al., 1999).
Finally, the current study was carried out on Greek soccer players. Consequently, its results could be generalized to similar populations of other countries, too, on the assump-tion that these countries are in similar or lower level than in Greece (FIFA world ranking 10th on February 2011; Official website of FIFA, 2011). It is presumed that at a higher international level, considering the contribution of muscular strength on soccer perform-ance, players have better muscular strength among the other parameters of physical fit-ness and therefore differences among age groups might be attenuated or even annihilated. Also, the cross-sectional design of this study, though applied to different participants, had the advantage of a well-controlled research environment, whereas longitudinal studies had difficulties applying the same methods over a long period of time, so as to provide data about the same participants. Therefore, the combined use of a cross-sectional and longitudinal study should be suggested for future research, in order to cover a long period of time and to be able to identify crucial “turning points” across adolescence regarding changes in muscular strength.
CONCLUSIONS
In summary, isometric muscular strength in soccer players was higher among groups in the higher spectrum of adolescence than in those groups in the lower spectrum of adolescence. In turn, adolescents achieved better results than children, and lower than those of adults. However, these differences decreased significantly when strength outcomes were expressed as relative to BM or FFM values. The total increase in isometric strength across adolescence was less in soccer players than in the general population. Therefore, there was a discrepancy between muscular strength development in soccer players and the general population, the actual normative data could be a valuable tool for coaches and fitness trainers in order to track strength development across adolescence.
REFERENCES
Adam, C., Klissouras, V., Ravazzlo, M., Renson, R., & Tuxworth, W. (1988). Eurofit: European test of physical fitness. Rome: Council of Europe and Italian National Olympic Committee.
American Academy of Pediatrics (2008). Strength training by children and adolescents. Pediatrics, 121, 835-840.
Artero, E.G., Espana-Romero, V., Castro-Pinero, J., Ortega, F.B., Suni, J., Castillo-Garzon, M.J., & Ruiz, J.R. (2011). Reliability of field-based fitness tests in youth. International Journal of Sports Medicine, 32 (3), 159-169.
Development of Isometric Muscular Strength in Adolescent Soccer Players 241
Canhadas, I.L., Silva, R.L.P., Chaves, C.R., & Portes, L.A. (2010). Anthropometric and physical fitness characteristics of young male soccer players. Rev Bras Cineantropom Desempenho Hum, 12 (4), 239-245.
Cortis, C., Tessitore, A., Perroni, F., Lupo, C., Pesce, C., Ammendolia, A., & Capranica, L. (2009) Interlimb coordination, strength and power in soccer players across the lifespan. Journal of Strength and Conditioning Research, 23 (9), 2458-2466.
Dopsaj, M., Ivanović, J., Blagojević, M., & Vučković, G. (2009). Descriptive functional and sexual dimorphism of explosive isometric hand grip force in healthy university students in Serbia. Facta Universitatis series Physical Education and Sport, 7 (2), 125-139.
Espana-Romero, V., Ortega, F.B., Vicente-Rodriguez, G., Artero, E.G., Rey, J.P., & Ruiz, J.R. (2010). Elbow position affects handgrip strength in adolescents: validity and reliability of Jamar, DynEx and TKK dynamometers. Journal of Strength and Conditioning Research, 24 (1), 272-277.
Froberg, K., & Lammert, O. (1996). Development of muscle strength during childhood. In: Bar-Or O. The child and adolescent athlete. Oxford: Blackwell science, pp.25-41.
Georgiadis, G. (1991). Biological potential of adolescent Greeks. Doctoral dissertation. University of Athens. In Greek. Hansen, L., Bangsbo, J., Twisk, J., & Klausen, K. (1999). Development of muscle strength in relation to training level
and testosterone in young male soccer players. Journal of Applied Physiology, 87 (3), 1141-1147. Hebbelinck, M., Clarys, P., & De Malsche, A. (1999). Growth, development and physical fitness of Flemish
vegetarian children, adolescents and young adults. American Journal of Clinical Nutrition, 70S: 579-585. Hertogh, C., Micallef, J.P., & Mercier, J. (1992). Puissance anaérobie maximale chez l’adolescent- étude transversale
(Maximal anaerobic power in adolescent-transversal study. Science and Sports, 7, 207-213. In French. Heyward, V.H. (2010). Advanced fitness assessment and exercise prescription. Champaign:Human Kinetics, 6th
edition, p. 129, 274. Jurimae, T., Hurbo, T., & Jurimae, J. (2009). Relationship of handgrip strength with anthropometric and body
composition variables in prepubertal children. HOMO, 60 (3), 225-238. Koley, S, & Yadav, M.K. (2009). An association of hand grip strength with some anthropometric variables in
Indian cricket players. Facta Universitatis series Physical Education and Sport, 7 (2), 113-123. Le Gall, F., Beillot, J., & Rochcongar, P. (2002). Evolution de la puissance maximale anaérobie au cours de la
croissance chez le footballeur (Evolution of the maximal anaerobic power in soccer players during the growing period). Science and Sports, 17 (4), 177-188.
Malina, R.M., Bouchard, C., & Bar-Or, O. (2004). Growth, maturation and physical activity. Champaign: Human Kinetics, pp.3-20.
Manna, I., Khanna, G.L., & Dhara, P.C. (2010). Effect of training on physiological and biochemical variables of soccer players of different age groups. Asian J Sports Med, 1 (1), 5-22.
Manno, R. (2008) Muscle strength development in children and adolescents: Training and physical conditioning. Medicina dello Sport, 61, 273-297.
Nikolaidis, P.T. (2010a). Physiological characteristics of elite Greek female soccer players. Medicina dello Sport, 63 (3), 343-352.
Nikolaidis, P. (2010b). Core stability of male and female football players. Biomedical Human Kinetics, 2, 30-33. Official Website of FIFA. (2011) Retrieved 02.03.2011 on World Wide Web:
http://www.fifa.com/worldfootball/ranking/lastranking/gender=m/fullranking.html. Ortega, F.B., Artero, E.G., Ruiz, J.R., Espana-Romero, V., Jimenez-Pavon, D., Vicente-Rodriguez, G. et al.
(2011) Physical fitness levels among European adolescents: the HELENA study. British Journal of Sports Medicine, 45 (1), 20-29.
Ortega, F.B., Ruiz, J.R., Castillo, M.J., Moreno, L.A., Urzanqui, A., Gonzalez-Gross, M. et al. (2008). Health-related physical fitness according to chronological and biological age in adolescents. The AVENA study. Journal of Sports Medicine and Physical Fitness, 48, 371-379.
Ostojić, S.M. (2000). Physical and physiological characteristics of elite Serbian soccer players. Facta Universitatis series Physical Education and Sport, 1 (7), 113-123.
Parizkova, J. (1978). Lean body mass and depot fat during autogenesis in humans. In: Parizkova, J., & Rogozkin, V. (Editors): Nutrition, Physical Fitness and Health: International Series on Sport Sciences. Baltimore, MA: University Park Press, p.22.
Prentice, W.E. (2007). Impaired muscle performance: regaining strength and endurance. In: Voight, M.L., Hoogneboom, B.J., Prentice, W.E. (editors). Musculoskeletal interventions, techniques for therapeutic exercise. USA: McGraw-Hill, p.135.
Reilly, T., Williams, A.M., Nevill, A., & Franks, A. (2000). A multidisciplinary approach to talent identification in soccer. Journal of Sports Sciences, 18 (9), 695-702.
Salces, I., Rebato, E., & Susanne, C. (2004). Genetic and environmental sources on familial transmission in Biscayan families III. The dynamometric strength. HOMO, 54 (3), 275-288.
242 P. NIKOLAÏDIS
Skinner, J.S. (2005). Exercise Testing and Exercise Prescription for Special Cases: Theoretical Basis and Clinical Application. Baltimore, MD: Lippincott Williams & Wilkins.
Thomas, V., & Reilly, T. (1979). Fitness assessment of English league soccer players through the competitive season. British Journal of Sports Medicine, 13, 103-109.
Tonson, A., Ratel, S., Le Fur, Y., Cozzone, P., & Bendahan, D. (2008). Effect of maturation on the relationship between muscle size and force production. Medicine and Science in Sports and Exercise, 40 (5), 918-925.
Watson, A.W., & O’Donovan, D.J. (1977). Factors relating to the strength of male adolescents. Journal of Applied Physiology, 43 (5), 834-838.
RAZVOJ IZOMETRIJSKE MIŠIĆNE SNAGE KOD FUDBALERA ADOLESCENATA
Panteleïmon Nikolaïdis
Dok je mišićna snaga glavna komponenta fitnesa, njen razvoj tokom perioda adolescencije u fudbalu nije dovoljno istražena. Cilj ovog istraživanja bio je da se prouče posledice starosti, antropometrijskih i telesnih karakteristika na izometrijsku mišićnu snagu. Adolescenti (N=291; starosti 12.01-21), klasifikovani su u devet starosnih grupa, grupu dece (N=16, starosti 7.34-11.97) i odraslih igrača (N=30; starosti 21.12-31.59), od kojih su svi bili aktivni članovi fudbalskih klubova i koji su kao zadatak imali četiri testa snage; stisak desne ruke, stisak leve ruke, test snage tela i test snage tela i nogu. ANOVA je ukazala na značajne razlike između grupe dece, adolescenata i odraslih u pogledu stiska desne ruke (F10,326=48.9, P<.001, η2=.6), stiska leve ruke (F10,326=47.63, P<.001, η2=.59), snage trupa (F8,249=20.71, P<.001, η2=.4), snage trupa i nogu (F8,249=19.33, P<.001, η2=.38), i zbir ovih mera je pirkazan ili kao apsolutna vrednost (F8,249=25.93, P<.001, η2=.45) ili u odnosu na telesnu masu (F8,249=6.5, P<.001, η2=.17). U pogledu svih parametara, grupa odraslih je postigla veće vrednosti od adolescenata, koji su imali bolje vrednosti od grupe dece, dok su starosne grupe u višem spektru adolescencije imale bolje vrednosti od onih u nižem spektru. Mera izometrijske mišićne snage je bila u blagoj korelaciji sa godinama starosti (.54<r<.68, P<.001), čak i nakon što je isključen uticaj veličine tela (.38<r<.42, P<.001). Ukupan porast izometrijske snage tokom adolescencije je bio manji kod fudbalera nego kod opšte populacije. S obzirom na razliku između razvoja mišićne snage kod fudbalera i opšte populacije, naši normativnih podaci mogu da budu korisno sredstvo za trenere i fitness trenere, koji bi tako mogli da prate razvoj snage tokom adolescencije.
Ključne reči: starost, snaga, rast, test stiska ruke.