development of fracture mechanics - nasa · abstract fracture mechanics properties of 6a-6v-2sn...
TRANSCRIPT

MCR-74-43Contract NAS9-13599
FinalReport C( /3 / ?
January 1974
Developmentof Fracture MechanicsData for 6A-6V-2 SnTitanium Alloy
(NASA-CR-134209) DEVELOPMENT AND FRACTURE N74-20127
MECHANICS DATA FOR 6Al-6V-2 Sn TITANIUM
ALLOY Final Report (Martin Marietta
Corp.) .~" CSCL 11F UnclasC1 G3/17 33466
Reproduced by
NATIONAL TECHNICALINFORMATION SERVICE
US Department of CommerceSpringfield, VA. 22151
https://ntrs.nasa.gov/search.jsp?R=19740012014 2018-06-09T23:23:21+00:00Z

MCR-74-43Contract NAS9-13599
FinalReportPreliminary January 1974
------------------------------------------------------DEVELOPMENT OF FRACTUREMECHANICS DATA FOR 6AR-6V-2SnTITANIUM ALLOY
By
C. F. Fiftal and E. J. Beck
MARTIN MARIETTA CORPORATIONDENVER DIVISIONDenver, Colorado 80201
FOREWORD
The work described in this report was performed by the MartinMarietta Corporation under Contract NAS9-13599 for the Lyndon B.Johnson Space Center of the National Aeronautics and Space Admini-stration. Mr. J. W. Smith acted as Technical Monitor for the con-tract at JSC.
This final report is submitted in compliance with the report-ing requirements of the contract, DRL Item 2, MA-183T.
ii

ABSTRACT
Fracture mechanics properties of 6A-6V-2Sn titanium in the
annealed, solution-treated, and aged condition are presented.
Tensile, fracture toughness, cyclic flaw growth, and sus-
tained-load threshold tests were conducted in this evaluation.
Both surface flaw and compact tension-specimen geometries were
employed. Temperatures and/or environments used were -650 F
(2200K) air, ambient, 3000 F (4220 K) air, and room-temperature
air containing 10 and 100% relative humidity.
iii

ACKNOWLEDGEMENTS
The author expresses appreciation to Mr. Jack LeBeau for con-ducting the majority of the experimental testing and to Mr. Chuck
Toth and Mr. Dick King for their assistance in testing.
Special thanks go to Mr. Ted Kiefer for his help with data
reduction and to Mr. Emory Beck, Program Manager, for histechnical advice.
iv

CONTENTS
Page
I. Introduction . . . . . . . . . . . . . . . . . . . .II. Material Specifications . . . . . . . . . . . 3III. Specimen Design ....... . . .. . . . * * 6IV. Test Methods and Results . . . .... .* 10
A. Tensile Tests . .. . * ................ . . 10B. Fracture Toughness Tests ... * * ..... . . . 10
1. Compact Tension . ... . . . . . . . . * . 102. Surface-Flaw Tests ...... *...... 14
C. Sustained-Load Threshold Tests . ...... . 22D. Cyclic Crack Growth Tests . * * ......... . 22
1. Surface-Flaw Tests ............. 222. Compact Tension Tests . . ......* 29
V. Discussion of Results and Conclusions . ...... . 35
Appendixes
A. Cyclic Crack Growth Data from Surface-Flaw A-I thruTests at Room Temperature *............ A-4
B. Cyclic Crack Growth Data from Compact Tension Tests B-1 thruin 10% Relative Humidity Air .... . * . . . . .. B-12
C. Cyclic Crack Growth Data from Compact Tension Tests C-1 thruin 100% Relative Humidity Air * . * . * . . . . C-10
D. Cyclic Crack Growth Data from Compact Tension Tests D-1 thruat -65 F (2200K) . . . . . . . . . . . . . . . . . D-14
E. Cyclic Crack Growth Data from Compact Tension E-1 thruTests at 3000F (4220K) . . . . . . . . . E-14
v

FIGURES
Page
1. Sample Locations in Forged Bar . . . . . . . . . . . 5
2. Tensile Specimen . . . . . . . . . . . . . . .. . 7
3. Surface Flaw Specimen ............... 8
4. Compact Tension Specimen . . . . .. . ...... 9
5. Compact Tension Sample with Extensometer inEnvironmental Chamber of Fatigue Testing Machine . . 13
6. Fracture Toughness of 6Af-6V-2Sn Titanium (CTS) . . 19
7. Fracture Surface of Surface Flaw Specimen ShowingMultiple Cyclic Growth Increments . . . . . . . .. 27
8. Crack Growth Rates for 6A-6V-2Sn Titanium at
Room Temperature from Surface-Flaw Tests . . . . .. 28
9. Compliance Calibration Curve for 6A1-6V-Sn
Titanium Compact Tension Specimens . . ... . ... . 30
10. Crack Growth Rates for 6A1-6V-Sn Titanium atRoom Temperature in 10% Relative Humidity Air . . . 31
11. Crack Growth Rates for 6A1-6V-Sn Titanium at
Room Temperature in 100% Relative Humidity Air . . . 32
12. Crack Growth Rate for 6A1-6V-2Sn Titanium at 33-650F .. . . . . . . . . .
13. Crack Growth Rate for 6A1-6V-2Sn Titanium at300 F (422 K) . . .. ... ............... 34
vi

TABLES
Page
1. Test Program . . . . . . . . . . . . . . . . . . . 2
2. Chemical Analysis (%-by weight) . . . . . . . . . 4
3. Tensile Properties for 6AI-6V-2Sn Titanium . . .. 11&12
4. Fracture Toughness for Annealed 6Af-6V-Sn Titaniumfrom Compact Tension Tests . . . . . . . . . . .. 15&16
5. Fracture Toughness for STA 6Aj-6V-Sn Titaniumfrom Compact Tension Tests . ........... 17&18
6. Fracture Toughness for 6AO-6V-2Sn Titanium fromSurface Flaw Tests at Room Temperature . . . . . . 20&21
7. Sustained-Load Threshold for Annealed 6A 2 -6V-2SnTitanium . . . . . . . . . . ... .... . . 23&24
8. Sustained-Load Threshold for STA 6A1-6V-SnTitanium . . . . . . . . . . ....... . . . 25&26
vii

I. INTRODUCTION
Implementation of fracture control measures to ensure opera-tional safety of Space Shuttle hardware depends to a considerableextent on the availability of representative mechanical propertydata that includes static fracture toughness (KIc), sustained-
load threshold (KTH), and cyclic crack growth rates (da/dN).
Titanium 6AI-6V-2Sn (6-6-2) is an attractive candidate for SpaceShuttle structural applications because it has one of the higheststrength/density ratios of any structural material. Its ultimateselection will critically depend on knowing its fracture charac-teristics.
For this program, titanium 6-6-2 was tested in the annealedand solution-treated and aged condition. The fracture charac-teristics determined were:
1. Static fracture toughness (FT) as a function of tempera-ture, using compact tension (CT) and surface-flawed (SF)specimens;
2. Sustained-load threshold as a function of relativehumidity, using CT specimens;
3. Cyclic crack propagation rates as functions of tem-perature and relative humidity, using CT and SF speci-mens.
The test program is outlined in Table 1.

Table 1 Test Program
Test Type* Sample Type* No. Samples Environment Temperature
Material - Annealed 6-6-2 Titanium
T RB 3 Ambient RT
FT CT 3 Ambient -65oF(2200K)FT CT 3 Ambient 3000F(4220 K)FT+ CT 3 Ambient RTFT SF (5) 10RH Air RTSL CT 6 10RH Air RTSL CT 6 100RH Air RTCompliance CT 2 Ambient RTCP CT Ambient -650F(2200K)CP CT 6 Ambient 300°F(4220K)CP CT 4 10RH Air RTCP SF (5) 10RH Air RTCP CT 4 100RH Air RT
Material - Solution Treated and Aged 6-6-2 Titanium
T RB 3 Ambient RTFT CT 3 Ambient -65°F(2200K)
FT CT 3 Ambient 3000F(4220 K)FT CT 3 Ambient RTFT+ SF (4) 10RH Air RTSL CT 5 10RH Air RTSL CT 5 100RH Air RTCP CT Ambient -650F(220 K)CP CT 6 Ambient 3000F(422 0K)CP CT 4 10RH Air RTCP+ SF (4) 10RH Air RTCP CT 4 100RH Air RT
*Abbreviations:T - Tensile CT - Compact Tension
FT - Fracture Toughness SF - Surface Flaw
SL - Sustained Load RB - Round BarCP - Crack Propagation RH - Relative Humidity
Fracture toughness and crack propagation data obtained fromsame samples.
2

II. MATERIAL SPECIFICATIONS
Titanium 6-6-2 in the mill annealed condition was purchased
from the Wyman-Gordon Company as forged bar (ICA Heat No. K4137)
approximately 3.8 in. (9.65 cm) square x 15 ft (457 cm) long.A chemical analysis is shown in Table 2. The material is well
within the composition specifications set by MIL-T-9047E forthis alloy.
Tensile, compact tension, and surface-flaw specimen blanks
were cut from the forged bar to the nominal sizes shown in Fig.I. Samples were longitudinally oriented with respect to graindirection and their locations in the original forging were identi-fied. Half of the material was left in the annealed condition(as received) for evaluation and the other half heat treated to
the solution-treated and aged condition (STA) according to thefollowing schedule:
Solution treated at 16000F (11440K) for 30 minutes;
Water quenched;
Aged at 1000 0F (8010K) for 6 hours;
Air cooled.
The surface of the material was coated with Turco pretreatbefore heat treatment to protect against high-temperature oxida-tion.
3

Table 2 Chemical Analysis (% by weight)
Mill Heat No. C Fe 0 H N V Sn A, Cu Ti (wt %)
TMCA K4137 0.026 0.55 0.188- 0.0043- 0.015 5.30 2.00 5.40 0.48 Bal0.193 0.0045
Nominal Composi- 0.05 0.35- 0.20 0.015 0.04 5.00- 1.50- 5.00- 0.35-tion MIL-T-9047E max 1.00 max max max 6.00 2.50 6.00 1.00 Bal
Certified by Wyman Gordon Co.

Tensile Blank eO No Req Size Condition
D '12 1 x 1+ x 8 Mill AnnealS _ . I - - -/ -
3.8 -1t--Stock 10 1121 13 +
-I-- -I- -I 71 81 9 T + Tensile Specimen
k3.8HStock A
Compact Tension Blank Condition-- No Req Size Condition
84 1 x 3.5 x 3.8 Mill Anneal
, -- -- 2A/," " A & C - Blanks are from SurfaceB - Blanks are from Center
toO 1A, (2B"
3.8 W7Stock
-S o8k S3o8k- CT Speciman
Surface Flaw Blank 0- No. Req Size Condition
. --- - - 10 1 x 3.8 x 12 Mill Anneal-_ I30-
I/ 1 & 3 - Blanks are from Surface
-29-1, 2 - Blanks are from Center
S/29-, " I e
Stock, 29-3
3.8 T 8 8SF Specimen
Stock Stock
Fig. 1 SampZe Locations in Forged Bar
5

III. SPECIMEN DESIGN
Sample designs for the tensile and surface-flaw specimens are
shown in Fig. 2 and 3, respectively. The tensile sample is astandard (ASTH E8) 0.505-in.-diameter (1.282 cm) round bar. Thesurface-flaw sample was designed with sufficient width and thick-
ness to provide restraint required for plane strain behavior.
The compact tension specimen shown in Fig. 4 has been designed
in general accordance with specifications in ASI E399 for 1-in.
(2.54 cm) thickness. The H/W ratio is equal to 0.6, but the W/B
ratio was increased to 2.5. This allowed sufficient width for
cyclic crack growth data without exceeding an a/W ratio of about
0.65. This same specimen design was used for static fracture
toughness and sustained-load threshold data using an a/W ratio
of 0.50. The compact tension specimen is oriented in the RW
orientation with respect to the original forging. The loading
direction is parallel to the longitudinal grain direction and the
plane of the flaw is perpendicular to the longitudinal grain
direction.
A further consideration was incorporated in the design of this
specimen--maximum net section stress is no more than 0.80 Sy during
cyclic crack growth and static fracture toughness testing. All
testing conditions met this criterion except annealed material at
300 F (4220K). Because of extremely high fracture toughness (Z100
ksiin., 110 MN/m3 / 2 ) at this temperature, the maximum net section
stress was almost equal to Sy during fracture toughness and cyclic
crack growth testing for this single condition.
6

(21.59)8.50
3.000 + .010 2.500 + .010 '
(7.62) (6.35) j .002
. +((.005)
(0.953)0.375 + .005
(1.27) rad (typ) (1,905
0.500 + .002dia dia 0.750
-A-+.010
Number Required: 12 Dimensions in Inches (cm)
Note: Avoid Undercutting Reduced Section at Fillet Tangent Points
Fig. 2 Tensile Specimen

7 0 (2.54)
1.000
a - +0,.005
12,00 (30.48)
3.70(9.40)
Number Required; 10 Dimensions in Inches (cm)
Fig. 3 Surface Flaw Specimen
8

(1.295)0.510 + 0.005 Dia.
(typ)
o T -0
0 0.062 oo o 0.070 r, - - -
A 1 .005o(.012) 0 +
RW Orientation
(6.350) (2.540)1.000
2.500 + .010 l 1.000_ + .010
3.125 + .010
(7.938)
No.Specimen Type Dimension "L" Req.
Static Fracture Toughness 1.050 + .010
(2.667) 42Sustained Load Threshold 1.050 + .010
(2.667)Cylic Flaw Growth 0.700 + .010 42
(1.778)
Total Number Required: 84
Dimensions in Inches (cm)
Fig. 4 Compact Tension Specimen
9

IV. TEST METHODS AND RESULTS
A. Tensile Tests
Tensile properties for ANN and STA 6-6-2 titanium are given in
Table 3. These tests were conducted using ASM E8 procedures. A
2-in. Class B-1 extensometer was placed on each sample to measure
strain. Strain versus load was autographically recorded for each
sample, thus allowing determination of modulus and yield strength.
B. Fracture Toughness Tests
1. Compact Tension
All compact tension fracture toughness samples shown in Fig.
4 were precracked at room temperature in tension fatigue using
an "R" ratio of 0.10. The annealed samples were precracked at a
maximum load of 3000 lb (K : 18 ksi/T-.) and the STA samplesmax
at a maximum load of 2500 lb (K z 15 ksi iT.). These stressmax
intensities are 31% and 49% of the room temperature KIc , respec-
tively. All flaws were precracked to a length of about 1.25 in.(3.18 cm) or a/W equal to 0.5.
Tests at -65 (220 K) and 3000F (4220K) were conducted in a com-mercial environmental chamber that used IN2 for cooling and resis-
tance wire elements for heating.
Before tensile testing to failure, samples were instrumented
with a COD extensometer, as shown in Fig. 5. With this device,
a load-versus-COD autographic plot was obtained from each fracture
sample. Each plot was then analyzed using AST'I E399 data reduc-
tion procedures to obtain KQ:
K = YPQ (1)Q BW
Wessel, E. T., "State of the Art of The WOL Specimen for KIc Frac-
ture Toughness Testing." Jour. Engr. Fracture Mechanics. Vol. 1,
No. 1, June 1968, p 77-103.
10

Table 3 Tensile Properties for 6Al-6V-2Sn Titanium
Sample Initial Initial Initial Yield Ultimate Final Final Yield Ultimate Reduction ElasticNo. Diameter, Gage Area, Load, Load, Diameter, Gage Strength, Strength, Elongation, of Area Modulus,
Length, Length,
Do, Lo' A02 PY9 PU' Df, Lf, Sy, SU, El, RA, E,
in. in. in. kips kips in. in. ksi ksi % % ksi x 103
Annealed
7-A 0.501 2.02 0.1970 29.1 30.2 0.378 2.34 147.7 153.3 15.8 43.0 15.9
8-A 0.502 1.97 0.1978 29.5 30.7 0.383 2.29 149.1 155.2 16.2 41.8 15.7
9-A 0.500 1.98 0.1963 29.3 30.5 0.375 2.29 149.3 155.4 15.7 43.8 15.8
Average 148.7 154.6 15.9 42.9 15.8
Solution-Treated and Aged
10-H 0.500 2.00 0.1963 35.9 37.7 0.471 2.13 182.9 192.1 6.5 11.3 16.0
12-H 0.497 1.99 0.1939 35.7 37.6 0.453 2.13 184.1 193.9 7.0 16.9 15.2
13-H 0.498 1.99 0.1947 35.9 37.2 0.432 2.18 184.4 191.1 9.5 24.8 15.7
Average 183.8 192.4 7.7 17.7 15.6
Iw-

Table 3 Tensile Properties for 6Aj-6V-2Sn Titanium b. International Units (S.I.)
Sample Initial Initial Initial Yield Ultimate Final Final Yield Ultimate Reduction Elastic
No. Diameter, Gage Area, Load, Load, Diameter, Gage Strength, Strength, Elongation of Area Modulus,
Length, Length,
Do, Lo' Ao2' PY PU' Df, Lf Sy 2 SU' 2 El, RA, E,
cm cm cm KN KN cm cm MN/m MN/m % % MN/m2
Annealed
7-A 1.273 5.13 0.500 129 134 0.960 5.94 1018 1057 15.8 43.0 110
8-A 1.275 5.00 0.502 131 137 0.973 5.82 1028 1070 16.2 41.8 108
9-A 1.27 5.03 0.499 130 136 0.953 5.82 1029 1072 15.7 43.8 109
Average 1019 1065 15.9 42.9 109
Solution-Treated and Aged
10-H 1.270 5.08 0.499 160 168 1.196 5.41 1261 1324 6.5 11.3 110
12-H 1.262 5.05 0.499 159 167 1.151 5.41 1269 1337 7.0 16.9 104
13-H 1.265 5.05 0.495 160 166 1.098 5.54 1271 1318 9.5 24.8 108
Average 1267 1327 7.7 17.7 108

Fig. 5 Compact Tension Sample with Extensometer in Environmental Chamber
of Fatigue Test Machine This page is reproduced at the
back of the report by a differentreproduction method to providebetter detail.
13

where Y = 29.6 - 185.5 ( ) + 655.7 (1)2 _ 1017.0 ( )3
+ 638.9 ()4.
In all cases [Pmax/PQ ratio for a Type I curve was much less
than 1.1, so KQ was a valid KIc'
The fracture toughness values from compact tension tests forannealed and STA titanium 6-6-2 are shown in Tables 4 and 5, re-spectively, and are plotted as a function of temperature in Fig.6. These values were used as baseline data for selection of loadlevels for subsequent sustained-load threshold tests.
2. Surface-Flaw Tests
Surface-flaw fracture-toughness samples shown in Fig. 3 wereEDM notched and precracked by bending fatigue using an R ratio of0.10. Both annealed and STA samples were precracked at a maximumload of 9000 lb, corresponding to an outer fiber stress of 22 ksi.This is equivalent to an S/Sy ratio of 0.15 for the annealed
samples and 0.12 for the STA samples. These samples were furthercycled in tension fatigue to obtain crack growth rate data.Further description of the test procedure is in Section IV-D.After fatigue cycling, the samples were tested to failure in ten-sion. A load-versus-deflection autographic plot was obtainedfor each fracture sample. From fracture load, a value of KIc
was calculated using the following stress intensity expressionfor a surface flaw
K = 1.154 h * (2)
where Q = flaw shape parameter
= 2 - .212(S ) 2
and 4 = complete elliptic integral of the second kind
i/ 2
= f1 c2 a sin 2 e dO
The fracture toughness values from surface flaw tests for annealedand STA titanium 6-6-2 are given in Table 6.
.Irwin, G. R., "Crack Extension Force for a Part-Through Crack ina Plate." J. Appl. Mechanics. Transactions ASME. December 1962,
14 p 651-654.

Table 4 Fracture Toughness for Annealed 6AZ-6V-2Sn Titanium from Compact Tension Tests
Sample Thickness Effective Half Crack Half-Height Crack Length Fracture Fracture
No. Width Height Length Eff. Width Eff. Width Load Toughness
B W H a H/W a/W Y* P KI**q Ic
in. in. in. in. kip ksi .
-650F
7B-A-FT 1.008 2.498 1.503 1.299 0.602 0.520 14.15 7.37 47.2
8C-A-FT 1.007 2.502 1.500 1.312 0.600 0.524 14.29 7.34 47.7
10B-A-FT 1.003 2.503 1.502 1.297 0.600 0.518 14.10 5.88 37.6
KAV = 44.2
Room Temperature
3B-A-FT 0.995 2.495 1.503 1.301 0.602 0.521 14.18 8.79 57.3
13B-A-FT 1.006 2.501 1.500 1.300 0.600 0.520 14.15 8.88 56.9
20C-A-FT 0.999 2.499 1.501 1.299 0.601 0.520 14.15 9.55 61.7
KAV = 58.6
3000F
lB-A-FT 1.003 2.502 1.502 1.279 0.600 0.511 13.89 16.80 105.2
7C-A-FT 1.004 2.499 1.503 1.288 0.601 0.515 14.01 16.50 104.6
10C-A-FT 1.002 2.495 1.500 1.300 0.601 0.521 14.18 17.70 114.4
KAV = 108.1
Y= 29.6 - 185.5(-') + 655.7( 2 - 1017.0( )3 + 638.9(
P /aK = Y BW

Table 4 Fracture Toughness for Annealed 6Aj-6V-2Sn Titanium from Compact Tension Tests b. International Units (S.I.)
Sample Thickness Effective Half Crack Half-Height Crack Length Fracture Fracture
No. Width Height Length Eff. Width Eff. Width Load Toughness
B W H a H/W a/W Y* Pq KI* 3
cm cm cm cm KN MN/-__
2200K
7B-A-FT 2.560 6.345 3.818 3.300 0.602 0.520 14.15 32.8 51.9
8C-A-FT 2.558 6.355 3.81 3.333 0.600 0.524 14.29 32.7 52.4
10B-A-FT 2.548 6.358 3.815 3.294 0.600 0.518 14.10 26.2 41.3
KAV = 48.6
Room Temperature
3B-A-FT 2.527 6.337 3.818 3.305 0.602 0.521 14.18 39.0 63.0
13B-A-FT 2.555 6.353 3.810 3.302 0.600 0.520 14.15 39.5 62.5
20C-A-FT 2.538 6.348 3.813 3.230 0.601 0.520 14.15 42.5 67.8
KAV 69.4
4220 K
LB-A-FT 2.548 6.355 3.815 3.249 0.600 0.511 13.89 74.7 115.6
7C-A-FT 2.550 6.348 3.818 3.272 0.601 0.515 14.01 73.4 115.0
10C-A-FT 2.545 6.337 3.810 3.302 0.601 0.521 14.18 78.7 125.7
KAV = 118.8
*Y = 29.6 -185.5 (,) + 655.7 )2 -1017.0 ( )3 + 638.9 (7)4
**K= Y q
BW

Table 5 Fracture Toughness for STA 6A-6V-2Sn Titanium from Compact Tension Tests
Sample Thickness, Effective Half Crack Half Weight, Crack Length, Fracture FractureNo. Width, Height, Length, Eff Width Eff Width Load, Toughness,
B, W, H, a, H/W a/W Y* P , KIc*'
in. in. in. in. kips ksi Vl .
-650F
2B-H-FT 1.010 2.494 1.501 1.326 0.602 0.532 14.54 4.32 28.7
18C-H-FT 1.005 2.499 1.504 1.267 0.602 0.507 13.77 4.67 28.8
19C-H-FT 1.007 2.496 1.500 1.283 0.601 0.514 13.96 4.42 27.8
KAV 28.4
Room Temperature
4B-H-FT 1.006 2.502 1.499 1.296 0.599 0.518 14.10 4.74 30.2
6C-H-FT 1.007 2.501 1.502 1.278 0.601 0.511 13.89 4.91 30.6
15A-H-FT 1.005 2.498 1.504 1.290 0.602 0.516 14.03 4.97 31.6
KAV = 30.8
3000F
5C-H-FT 1.015 2.497 1.501 1.278 0.601 0.512 13.91 8.73 54.2
15C-H-FT 1.001 2.501 1.503 1.292 0.601 0.517 14.07 8.69 55.5
17B-H-FT 1.009 2.499 1.503 1.272 0.601 0.509 13.83 7.99 49.4
KAV = 53.0
* = 29.6 - 1855( + 655.7( )2 - 1017.0( O( + 638.9( )
P Va**K = Y
BW

Table 5 Fracture Toughness for STA 6A1-6V-2Sn Titanium from Compact Tension Tests b. International Units (S.I.)
Sample Thickness Effective Half Crack Half Weight, Crack Length, Fracture FractureNo. Width, Height, Length, Eff. Width Eff. Width Load Toughness,
B W H a H/W a/W Y* Pq, K **q Ic 3
cm cm cm cm KN MN/m --
-650F
2B-H-FT 2.565 6.335 3.813 3.368 0.602 0.532 14.54 19.2 31.5
18C-H-FT 2.553 6.348 3.820 3.218 0.602 0.507 13.77 20.8 31.7
19C-H-FT 2.558 6.340 3.811 3.258 0.601 0.514 13.96 19.6 30.6
KAV = 31.2
Room Temperature
4B-H-FT 2.555 6.335 3.808 3.292 0.599 0.518 14.10 21.0 33.2
6C-H-FT 2.558 6.353 3.815 3.246 0.601 0.511 13.89 21.8 33.6
15A-H-FT 2.553 6.345 3.820 3.277 0.602 0.516 14.03 22.1 34.7
KAV 33.8
3000F
5C-H-FT 2.578 6.342 3.813 3.246 0.601 0.512 13.91 38.8 60.0
15C-H-FT 2.543 6.353 8.598 3.282 0.601 0.517 14.07 38.6 61.0
17B-H-FT 2.563 6.348 3.818 3.231 0.601 0.509 13.83 35.5 54.3
KAV 58.2
*Y = 29.6 - 185.5( ) + 655.7 )2 - 1017.0 ( )3 + 638.9 ( )
**K = Y P
BW

120
O
120
o a Annealed
0 6
4 0
U
S 660
04o
-100, 0 100 200 300
Temperature, T, OF0 I I I
200 300 400
Temperature, *K
Fig. 6 Fracture Toughness of 6Ak-6V-2Sn Titanium (CTS)
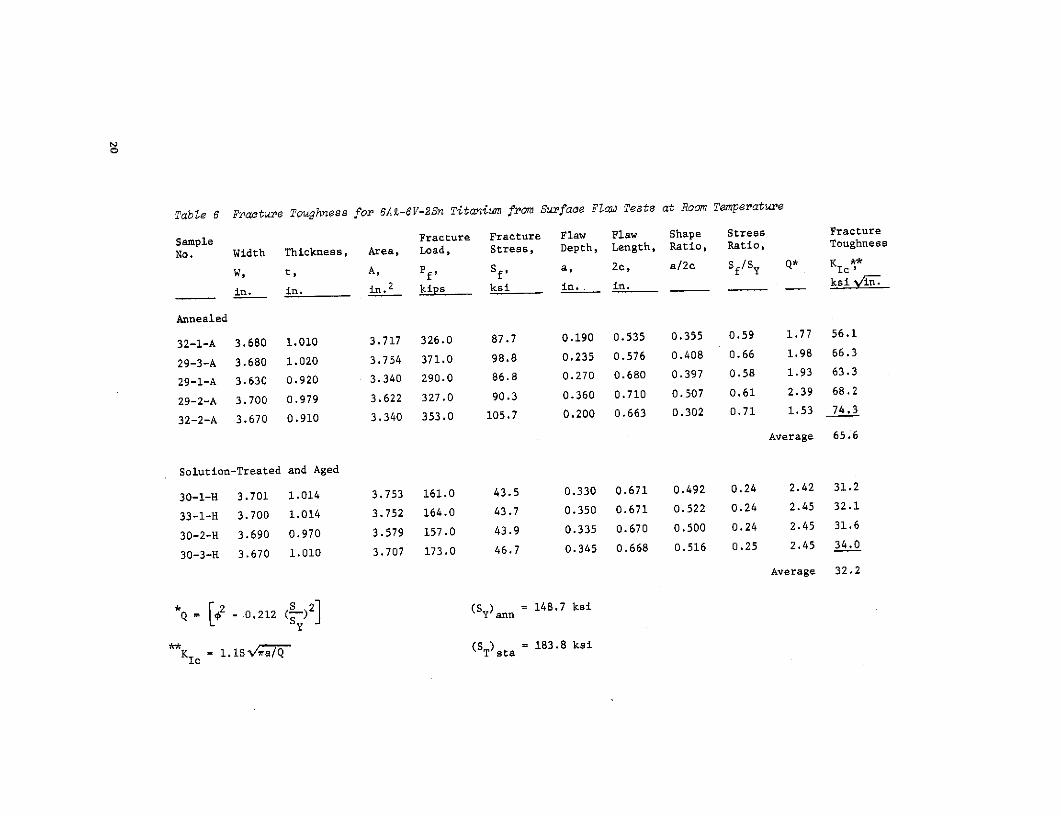
TabZe 6 Fracture Toughness for 6Ak-6V-2Sn Titanium from Surface Flaw Tests at Room Temperature
Sample Fracture Fracture Flaw Flaw Shape Stress Fracture
No. Width Thickness, Area, Load, Stress, Depth, Length, Ratio, Ratio, Toughness
W, t, A, Pf, Sf, a, 2c, a/2c S /Sy Q* K Ic*
in. in. in. 2 kips ksi in.. in. ksi \-{.
Annealed
32-1-A 3.680 1.010 3.717 326.0 87.7 0.190 0.535 0.355 0.59 1.77 56.1
29-3-A 3.680 1.020 3.754 371.0 98.8 0.235 0.576 0.408 0.66 1.98 66.3
29-1-A 3.630 0.920 3.340 290.0 86.8 0.270 0.680 0.397 0.58 1.93 63.3
29-2-A 3.700 0.979 3.622 327.0 90.3 0.360 0.710 0.507 0.61 2.39 68.2
32-2-A 3.670 0.910 3.340 353.0 105.7 0.200 0.663 0.302 0.71 1.53 74.3
Average 65.6
Solution-Treated and Aged
30-1-H 3.701 1.014 3.753 161.0 43.5 0.330 0.671 0.492 0.24 2.42 31.2
33-1-H 3.700 1.014 3.752 164.0 43.7 0.350 0.671 0.522 0.24 2.45 32.1
30-2-H 3.690 0.970 3.579 157.0 43.9 0.335 0.670 0.500 0.24 2.45 31.6
30-3-H 3.670 1.010 3.707 173.0 46.7 0.345 0.668 0.516 0.25 2.45 34.0
Average 32.2
Q = 2 - .0.212 S )2] (Sy)ann = 148.7 ksi
**K = 1.1S V'aQ (ST sta = 183.8 ksi

Table 6 Fracture Toughness for 6AI -6V-2Sn Titanium from Surface Flaw Tests at Room Temperatureb. International Units (S.I.)
Sample Width Thickness, Area, Fracture Fracture Flaw Flaw Shape Stress FractureNo. Load Stress Depth Length Ratio Ratio Toughness
W t A Pf Sf, a, 2c, a/2c Sf/Sy Q* Kc*2 2 3cm cm cm KN MN/m cm cm MN/m
Annealed
32-1-A 9.348 2.565 23.98 1450 665 0.483 0.901 0.355 0.59 1.77 61.6
29-3-A 9.348 2.591 24.22 1650 681. 0.597 1.463 0.408 0.66 1.98 72.9
29-1-A 9.220 2.337 21.55 1290 599 0.686 1.728 0.397 0.58 1.93 69.6
29-2-A 9.398 2.497 23.37 1455 623 0.914 1.803 0.507 0.61 2.39 74.9
32-2-A 9.322 2.311 21.55 1570 730 0.506 1.684 0.302 0.71 1.53 61.6
Average 72.1
Solution-Treated and Aged
30-1-H 9.401 2.576 24.21 716 300 0.838 1.704 0.492 0.24 2.42 34.3
33-1-H 9.398 2.576 24.21 729 301 0.889 1.704 0.522 0.24 2.45 35.3
30-2-H 9.373 2.464 24.25 696 302 0.851 1.702 0.500 0.24 2.45 34.7
30-3-H 9.322 2.565 23.92 770 321 0.876 1.697 0.516 0.25 2.45 37.4
Average 35.4

C. Sustained-Load Threshold Tests
All compact tension sustained-load threshold samples shown inFig. 4 were precracked by tension fatigue in the same manner asthe fracture toughness samples.
Sustained load tests were run for a 100-hr, in deadweightloaded creep racks in a 10 or 100% relative humidity (RH) airenvironment. Environmental control was achieved with simple wellestablished techniques. For 100% RH, a water-saturated wick com-pletely surrounded the test specimen. For 10% RH, normal labora-tory air (approximately 20% RH) was further dried by using a closedcontainer containing a layer of silica gel.
After exposure, the samples were fatigue marked at loads simi-lar to those used for precracking, and broken open. Any evidenceof subcritical crack growth was easily detected--appearing as adark band between the two fatigue zones. Growth was measuredusing a measuring microscope with a micrometer stage. Sustained-load threshold results for annealed and STA titanium 6-6-2 aregiven in Tables 7 and 8, respectively.
D. Cyclic Crack Growth Tests
1. Surface-Flaw Tests
Precracking of the surface-flaw crack propagation samplesshown in Fig. 3 was described in Section IV-B. After precracking,all samles were cycled at room temperature in tension fatigueusing an R ratio of 0.03 and a cyclic frequency of 2-4 cps. Cyclicloads were selected to obtain growth rates of one to 100 pin.per cycle. Each surface flaw was incrementally grown to a da ofabout 0.070 in. (.177 cm) for each increment. Each incrementwas distinguished by heat tinting at 9000F (7550K) for 10 to 15minutes. After fracture, the actual growth in each increment wasmeasured on the plane of the fracture surface using a measuringmicroscope. Figure 7 shows typical multiple cyclic growth incre-ments in a titanium 6-6-2 surface-flaw sample.
Flaw growth rates (da/dN) were determined by dividing theincremental growth (A a) by the incremental cycles (A N). Cor-responding cyclic stress intensity ranges were calculated usingthe stress intensity expression for a surface flaw (Eq. 2). Ap-pendix A). Crack growth rates for annealed and STA titanium 6-6-2from surface flaw tests are shown as a function of stress intensityrange in Fig. 8.
22

Table 7 Sustained-Load Threshold for Annealed 6Ak-6V-2Sn Titanium
StressSample Effective Crack Crack Length Sustained Stress Intensity Crack Expo ureNo. Thickness, Width, Length Eff Width Load, Intensity, Ratio, Growth, Time
B, W, a, a/W Y P, K K/KIc Aa, t, hr
in. in. in. kips ksi_- _. in.
10% Relative Humidity Air
23A-A-SL 1.003 2.500 1.297 0.519 14.13 8.57 55.0 0.94 ---- 0.25
3C-A-SL 1.008 2.497 1.315 0.527 14.38 7.17 47.0 0.80 0.249 10.5
9B-A-SL 1.009 2.501 1.285 0.514 13.96 5.87 36.8 0.63 0.004 100.0
21B-A-SL 0.987 2.494 1.297 0.520 14.15 5.37 35.2 0.60 0.004 100.0
27A-A-SL 1.006 2.502 1.272 0.508 13.80 4.97 30.6 0.52 0.004 100.3
28C-A-SL 0.991 2.503 1.321 0.528 14.42 4.08 27.3 0.47 0.0005 100.1
KTH z 0.45 (26.4 ksi-V1.)
100% Relative Humidity Air
17A-A-SL 1.009 2.497 1.319 0.528 14.42 8.57 56.3 0.96 ---- 0.01
9A-A-SI, 1.005 2.503 1.312 0.524 14.29 6.77 44.0 0.75 0.101 100.0
5B-A-SL 1.003 2.501 1.278 0.511 13.89 5.37 33.6 0.57 0.004 100.0
17C-A-SL 1.005 2.504 1.224 0.489 13.29 4.97 29.0 0.50 0.001 100.0
22A-A-SL 0.980 2.499 1.277 0.511 13.89 4.47 28.6 0.49 0.001 100.4
12A-A-SL 1.006 2.500 1.274 0.510 13.86 3.58 22.3 0.38 None 100.4
KTH - 0.43 (25.2 ksi Vin.)
Y 29.6 - 185.5 () + 655.7 (a)2 -1017.0 (3 + 638.9 (a)
K = Y BW KIc= 58.6 ksi .
Time less than 100 hrs indicates sample fractured during test.

Table 7 Sustained-Load Threshold for Annealed 6A1 -6V-2Sn Titanium b. International Units (S.I.)
StressSample Effective Crack Crack Length, Sustained Stress Intensity Crack ExposureNo. Thickness Width, Length Eff Width Load, Intensity, Ratio, Growth, Time +
B, W, a, a/W Y* P, K** K/KIc A, t, hr
cm cm cm KN MN/m - cm
10% Relative Humidity Air
23A-A-SL 2.548 6.350 3.294 0.519 14.13 38.1 60.4 0.94 ---- 0.25
3C-A-SL 2.560 6.342 6.509 0.527 14.38 18.5 51.6 0.80 0.632 10.5
9B-A-SL 2.562 6.353 3.264 0.514 13.96 26.1 40.4 0.63 0.010 100.0
21B-A-SL 2.507 6.335 3.294 0.520 14.15 23.9 38.7 0.60 0.010 100.0
27A-A-SL 2.555 6.355 3.231 0.508 13.80 22.1 33.6 0.52 0.010 100.3
28C-A-SL 2.517 6.358 3.355 0.528 14.42 18.1 30.0 0.47 0.001 100.1
100% Relative Humidity Air
17A-A-SL 2.563 6.342 3.335 0.528 14.42 38.1 61.9 0.96 ---- 0.01
9A-A-SL 2.553 6.358 3.334 0.524 14.29 30.1 48.4 0.75 0.257 100.0
5B-A-SL 2.548 6.353 3.246 0.511 13.89 23.9 37.0 0.57 0.010 100.0
17C-A-SL 2.552 6.360 3.109 0.489 13.29 22.1 31.9 0.50 0.003 100.0
22A-A-SL 2.489 6.348 3.244 0.511 13.89 22.1 31.4 0.49 0.003 100.4
12A-A-SL 2.555 6.350 3.236 0.510 13.86 15.9 24.5 0.38 None 100.4
KH 0.43 (27.7 MN/m3 / 2
Y = 29.6 - 185.5 ( ) + 655.7 (2 - 1017.0 3 + 638.9 ()0.43 (27.7
**K = Y P K = 64.4 MN/m
3 / 2
BW Ic
+ Time less than 100 hours indicates sample procured during test.

Table 8 Sustained-Load Threshold for STA 6Ak-6V-2Sn Titanium
StressSample Effective Crack Crack Length, Sustained Stress Intensity Crack Expo ureNo. Thickness, Width, Length Eff Width Load, Intensity, Ratio, Growth, Time
B, W, a, a/W Y* P, K K/KIc Aa, t, hr
in. in. in. kips ksifin , in.
10% Relative Humidity Air
26A-H-SL 1.005 2.501 1.274 0.509 13.83 4.18 26.0 0.84 0.0010 112.0
22B-H-SL 1.002 2.499 1.263 0.505 13.72 3.88 23.9 0.78 0.0005 100.2
21C-H-SL 0.998 2.501 1.282 0.513 13.95 3.48 22.0 0.71 <0.0005 100.0
20A-H-SL 1.006 2.502 1.290 0.516 14.04 3.28 20.8 0.68 None 100.8
24B-H-SL 1.008 2.500 1.284 0.514 13.96 2.98 18.7 0.61 None 100.2
KTH z 0.69 (21.3 ksi V1i.)
100% Relative Humidity Air
25A-H-SL 1.009 2.502 1.293 0.517 14.07 4.18 26.5 0.86 0.0015 112.0
20B-H-SL 1.004 2.502 1.277 0.510 13.86 3.88 24.2 0.79 0.0010 100.0
23C-H-SL 1.002 2.501 1.291 0.516 14.04 3.48 22.1 0.72 0.0005 100.0
26C-H-SL 1.003 2.498 1.296 0.519 14.13 3.28 21.1 0.68 None 100.8
21A-H-SL 1.006 2.501 1.280 0.512 13.92 2.98 18.6 0.60 None 100.2
KTH 0.70 (21.6 ksi /in.)
Y = 29.6 - 185.5 () + 655.7 ( 2 1017.0 ()3 + 638.9
*K Y KY = 30.8 ksi Ni-.

Table 8 Sustained-Load Threshold for STA 6Ai-6V-2Sn Titanium b. International Units (S.I.)
StressSample Effective Crack Crack Length, Sustained Stress Intensity Crack ExposureNo. Thickness Width, Length Eff Width Load, Intensity, Ratio, Growth, Time +
B, W, a, a/W Y* P, K** K/KIc aa, t, hr
cm cm cm KN MN/m 2- cm
10% Relative Humidity Air
26A-H-SL 2.553 6.353 3.235 0.509 13.83 18.6 28.6 0.84 0.003 112.0
22B-H-SL 2.545 6.348 3.201 0.505 13.72 17.3 26.3 0.78 - 0.001 100.2
21C-H-SL 2.535 6.353 3.256 0.513 13.95 15.5 24.2 0.71 0.001 100.0
20A-H-SL 2.555 6.355 3.278 0.516 14.04 14.6 22.9 0.68 None 100.8
24B-H-SL 2.560 6.350 3.261 0.514 13.96 13.3 20.6 0.61 None 100.2
KTH _ 0.69 (23.4 MN/m3/2)
100% Relative Humidity Air
25A-H-SL 2.563 6.355 3.284 0.517 14.07 18.6 29.1 0.86 0.004 112.0
20B-H-SL 2.550 6.355 3.244 0.510 13.86 17.3 26.6 0.79 0.003 100.0
23C-H-SL 2.545 6.352 3.279 0.516 14.04 15.5 24.3 0.72 - 0.001 100.0
26C-H-SL 2.548 6.345 3.292 0.519 14.13 14.6 23.2 0.68 None 100.8
21A-H-SL 2.555 6.353 3.251 0.512 13.92 13.3 20.4 0.60 None 100.2
KTH , 0.70 (23.7 MN/m3 /2
*Y= 29.6 - 185.5 (-) + 655.7 2 1017.0 (~)3 + 638.9 (a )
**K f Y P / a K = 34.0 MN/m3 /2
BW Ic

41
044
Ak
i
27

100100 -
- K IC = 65.6 ksiinch, 72.1 MNm3/2 (A)
60
40
IC
10 0 a
d10 - -
. 6
4-
UShape Ratio, ~ 0.4 - 0.5
O Annealed* Solution-Treated and Aged
2- Frequency, 2 - 4 cps
1 L I I I I I I I I I I3 .4 .6 .8 1 2 4 6 8 10 20 40 60 80 100 200
Crack Growth Rate, da/dn, _-in./cycle
I I I I I I I I I l l I I I I I I l I I I100 1000
Crack Growth Rate, da/dN, nm/cycle
Fig. 8 Crack Growth Rates for 6AZ-6V-2Sn Titanium at Room Temperature from Surface-FZaw Tests

2. Compact Tension Tests
All compact tension crack propagation samples shown in Fig. 4were precracked at room temperature by tension fatigue using anR ratio of 0.10. The annealed samples were precracked at a maxi-
mum load of 4000 lb (Kax 17 ksiJin., 19 MN/m3/2) and the STA
samples at a maximum load of 3500 lb (Kax 15 ksi in., 17 MN/m3/2
These stress intensities are 29 and 49% of the room temperature(KIc) respectively. All flaws were precracked to a length of about
0.87, or a/W equal to 0.35.
Environmental control for testing at -650F (2200 K), 3000F(4220 K), 10% RH, and 100% RH was identical to that used for thefracture-toughness and sustained-load threshold samples.
After precracking, all samples were cycled in tension fatigueusing an R ratio of about 0.05 and a cyclic frequency of 10 cps.Cyclic loads were selected to obtain growth rates of one to 100 pin.per cycle. Each flawed sample was incrementally grown in the a/Wrange 0.35 to 0.65 using a Aa of about 0.070 in. (0.175 cm) foreach increment. Specimen compliance was measured at room tempera-ture with a COD extensometer after each growth increment. Theactual growth in each increment was determined from the experi-mental compliance calibration curve given in Fig. 9, which showscompliance as a function of relative crack length.
The calibration specimenswere incrementally grown at amedium to high level of stress intensity. Growth increments weredelineated by fatigue marking at a low level of stress intensity.After fracture, the actual crack length after each increment wasmeasured on the plane of the fracture surface using a measuringmicroscope. The crack length (a) was taken as the average ofthree measurements across the crack front per ASTM E399. Fromthese data, the compliance calibration curve shown in Fig. 9 wasgenerated.
Flaw growth rates (da/dN) were determined by dividing theincremental growth (Aa) by the incremental cycles (A N). Cor-responding cyclic stress intensity ranges were calculated usingthe stress intensity expression for a compact tension specimen(Eq. 1). An outline of the calculations for each sample is pre-sented in Appendices B, C, D, and E. Crack growth rates for an-nealed and STA titanium 6-6-2 from compact tension tests areshown as a function of stress intensity range in Fig. 10 (RT-10% RH), 11 (RT-100% RH), 12 (-65 0 F, 220 0 K), and 13 (3000 F,422 0 K).
29

Symbol0 A
800 - Specimen No. 3A-A-CP 5A-A-CP
B - 1.002 inch 1.010 inch
2.545 cm 2.565 cm
H - 1.502 inch 1.502 inch
3.815 cm 3.815 cm
W - 2.501 inch 2.498 inch
6.353 cm 6.345 cm
6.0 H0.601
400
U u
r-q~
0.40
200 0 a/W0.60
Fig. 9 Compliance Calibration Curve for 6A9-6V-2Sn Titanium Compact Tension Specimens
30

100100-
KIC = 58.6 ksiinch, 64.4 MN/m3/2 (A)
N 0
8) K = 30.8 ksi inch, 33.8 MN/m3 /2
(STA
10e
U) a
10-----
H
S0 Annealed
- Solution-Treated and Aged
Frequency, 10 cps
0.7 1 10 100 500
Crack Growth Rate, da/dn, pin./cycle
I I I I I I I I I I I I I I I I I I I I I I I
100 1000 10000
Crack Growth Rate, da/dN, nm/cycle
Fig. 10 Crack Growth Rates for 6A2-6V-2Sn Titanium at Room Temperture in 10% ReZative Humidity Air

100100 -
K = 58.6 ksiinch, 64.4 MN/m3/2 (A)IC
N
- OE
a KIC = 30.8 ksiinch, 33.8 MN/m3/2 (STA)
0 0C
4h10 -0 Annealed10 a *Solution-Treated and Aged
W ar. r- Frequency, 10 cps
I I I I I I I I I I I I I I I I
0.7 10 100 500
Crack Growth Rate, da/dn, pin./cycle
I I I I 11111 I I I I 11111 I I I 111111100 1000 10000
Crack Growth Rate, da/dN, nm/cycle
Fig. 11 Crack Growth Rates for 6AZ-6V-2Sn Titanium at Room Temperature in 100% Relative Humidity Air

100100 -- O- Annealed (A)
0- Solution Treated & Aged (STA
S - KI 44.2 ksiiinic, 48.6 MN/m3/2 (A)
S -----KIc = 28.4 ksii-nch, 31.2 MN/m3/2(STA) O
10 1
; I I I I I I I I I I , , I 110 100
I Crack Growth Rate, da/dN, P-inch/cycle
100 1000
Crack Growth Rate, da/dN, nm/cycle
Figure 12 Crack Growth Rates for 6Ak-6V-2Sn Titanium at -65°F

100 100 KIC = 108.0 ksivinch, 118.7 MN/Nm
3 2 (A)
K = 53.0 ksi/inch, 58.2 MN/m3/ 2 (STA) 0
-
bg 0
a 10' 10
4.4
O Annealed
* Solution-Treated and Aged
Frequency, 10 cps
1 10 100 800
Crack Growth Rate, da/dn, pin./cycle
'I I I I I I I I I I I Ii I I 1 1
100 1000 10000
Crack Growth Rate, da/dN, nm/cycle
Fig. 1.3 Crack Growth Rates for 6Ak-6V-2Sn Titanium at 3000F

V. DISCUSSION OF RESULTS AND CONCLUSIONS
Tensile property data for annealed and STA titanium 6AA-6V-2Snexceed minimum properties required by MIL-T-9047E. Yield and ulti-mate strengths are gener lly about 10% higher than for the morewidely used titanium 6AI-4V alloy.
Over the range from -65 to 3000F (220 to 422 0K), the fracturetoughness of STA material is less sensitive to temperature thanthat of annealed material. Room temperature fracture toughnessvalues for the STA condition, from compact tension and surface-flawtests, are within 4% of each other; however, for the annealed con-dition, the surface-flaw KIc was 12% higher. Comparison of surface-
flaw results with those for compact tension is often difficult ifone is looking for the most appropriate test for design purposes.Provided width and thickness restraint is sufficient, the surface-flaw test is more attractive because it represents typical flawsin aerospace hardware. However, apparent values of KIc from
surface-flaw tests are generally slightly higher than from compacttension tests, which give lower bound values. One reason for thismay be that, while the compact tension stress intensity expressionis exact, the surface-flaw stress-intensity expression is only ap-proximate, requiring the use of correction factors. The fracturetoughness of STA titanium 6-6-2 is generally about 30% lower thanfor titanium 6A1-4V STA. Annealed toughness values for both alloysare similar.
There appears to be no relative humidity effect on sustained-load threshold stress intensity (KTH) for either annealed or STA
titanium 6-6-2. For annealed material, KTH was approximately 43
to 45% of KIc, or 26 ksi\l. (29 MN/m3/2). For the STA condi-
tion, KTH was 69 to 70% of KIc, or 21 ksiin. (23 MN/m3/2). It
is interesting that both threshold stress intensities are veryclose, indicating that crack initiation and propagation behaviormight also be the same at low stress intensities. KTH for ti-
tanium 6-6-2 appears to be about 45% lower than for STA titanium6-4, whose KTH is approximately 0.9 KIc.
Crack growth rates for annealed and STA titanium at room tem-perature are similar up to a stress intensity of about 20 ksi4in.
(22 MN/m3). At higher stress intensities (20 to 30 ksi in.,3/222 to 33 MN/m ), the growth rate is higher in the STA material
because K is approaching KIc. Relative humidity appears to have
35

no effect on the flaw growth rate. The crack growth rate curvesfrom compact tension tests and surface-flaw tests are identical.Flaw growth rates in titanium 6-6-2 are generally higher than fortitanium 6-4.
Crack growth rates for annealed and STA titanium at 3000F(4220K) are similar up to a stress intensity of about 35 ksi in.
(39 MN/m3/2). At higher stress intensities (35 to 50 ksiJ .,3/2
38 to 55 MN/m ), the growth rate is higher in the STA materialbecause K is approaching KIc. Crack growth rates at 3000 F (4220 K)
are significantly less than at room temperature. At -650F (2200 K)growth rates are slightly more than at room temperature, with STAmaterial having a faster growth rate than annealed material at allstress intensities.
In general, titanium 6AP-6V-2Sn is a stronger, but more brittlematerial than titanium 6A-4V. Sustained load threshold for flaw
growth is especially low, being about 21 ksi4n. (23 MN/m3/2).Titanium 6Aj-6V-2Sn can be used for Space Shuttle application onlyin areas where low fracture toughness will not be a problem andweight savings can be achieved from the increased strength.
36

APPENDIX A
Cyclic Crack Growth Data from Surface-FlawTests at Room Temperature
PI

Table A-i Crack Growth Rates for 6A -6V-2Sn Titanium from Surface Flaw Tests at Room Temperature
a. U.S. Customary Units
Annealed Solution Treated and Aged
Specimen No. 32-1-A 29-3-A 29-1-A 29-2-A 32-2-A 30-1-H 33-1-H 30-2-H 30-3-H
W, in. 3.680 3.680 3.630 3.700 3.670 3.701 3.700 3.690 3.670t, in. 1.010 1.020 0.920 0.979 0.910 1.014 1.014 0.970 1.010
A, in.2 3.717 3.754 3.340 3.622 3.340 3.753 3.752 3.579 3.707
Pmax, kips 111.0 195.0 140.0 218.0 54.0 131.0 92.0 136.0 152.0
Pmin' kips 5.0 5.0 4.0 6.0 1.0 4.0 2.0 4.0 6.0
Smax, ksi 29.9 51.9 41.9 60.2 16.2 34.9 24.5 38.0 41.0
Smin' ksi 1.3 1.3 1.2 1.7 0.3 1.1 0.5 1.1 1.6
Initial Crack Data
ao, in. 0.105 0.125 0.125 0.140 0.130 0.175 0.165 0.175 0.170
(2c)o, in. 0.327 0.363 0.385 0.391 0.381 0.381 0.380 0.380 0.380
(a/2c)o 0.321 0.344 0.325 0.358 0.341 0.459 0.434 0.432 0.447
(Qo) 1.70 1.79 1.72 1.84 1.77 2.27 2.16 2.15 2.21
O(K)o, ks i(. 13.9 26.2 21.6 31.6 8.4 18.2 12.9 20.0 21.2
Crack Growth Data (Band 1)
al, in. 0.158 0.185 0.210 0.260 0.165 0.250 0.250 0.250 0.250
(2c)1, in. * 0.408 0.473 0.531 0.526 0.524 0.526 0.519 0.521 0.521
(a/2c)1 0.387 0.391 0.395 0.494 0.315 0.475 0.482 0.480 0.480

Table A-i (cont)
Annealed Solution Treated and Aged
Specimen No. 32-1-A 29-3-A 29-1-A 29-2-A 32-2-A 30-1-H 33-1-H 30-2-H 30-3-H
(Q1) 1.95 1.97 1.99 2.44 1.68 2.35 2.39 2.38 2.38
(AK) 1 , ksi in. 16.0 30.3 25.9 37.5 9.7 21.5 15.1 23.4 25.0
Oa, in. 0.053 0.060 0.085 0.120 0.035 0.075 0.085 0.075 0.080
(AK)0-1, avg' ks in. 14.9 28.3 23.7 34.6 9.0 19.9 14.0 21.7 23.1
AN1, cycles 5500 1800 2700 1283 85,000 8372 43,000 7600 7103
(Aa/AN), (uin./cycle) 9.6 33.3 31.5 93.5 0.41 9.0 2.0 9.9 11.3
Crack Growth Data (Band 2)
a2 , in. 0.190 0.235 0.270 0.360 0.200 0.330 0.350 0.335 0.345
(2c)2, in. 0.535 0.408 0.397 0.507 0.302 0.492 0.522 0.500 0.516
(a/2c)2 0.355 0.408 0.397 0.507 0.302 0.492 0.522 0.500 0.516
(Q2) 1.83 2.04 2.00 2.46 1.63 2.43 2.46 2.46 2.46
(AK) 2 , ksi T. 18.0 33.7 29.2 43.9 10.8 24.2 17.6 26.5 28.7
Aa, in. 0.032 0.050 0.060 0.100 0.035 0.080 0.100 0.085 0.095
(AK)1-2, avg' ksi-iT. 17.0 32.0 27.5 40.7 10.3 22.9 16.3 24.9 26.9
AN 2 , cycles 7000 1100 2070 900 87,000 4904 25,525 2850 3470
(Aa/AN), (pin./cycie) 4.6 45.5 29.0 111.1 0.4 16.3 3.9 29.8 27.4

Table A-i Crack Growth Rates for 6A -6V-2Sn Titanium from Surface Flaw Tests at Room Temperature
b. International Units (S.I.)
Annealed Solution Treated and Aged
Specimen No. 32-1-A 29-3-A 29-1-A 29-2-A 32-2-A 30-1-H 33-1-H 30-2-H 30-3-H
W, cm 9.347 9.347 9.220 9.398 9.322 9.401 9.398 9.373 9.320
t, cm 2.565 2.591 2.337 2.487 2.311 2.516 2.576 2.464 2.565
A, cm2 23.98 24.21 21.54 23.36 21.54 24.21 24.20 23.09 23.91
P max, N 493 667 662 969 240 582 409 604 676
Pmin, N 22 22 17 26 41 17 8 17 26
S MN/m2 206 357 288 415 111 240 168 262 282max
Sin, MN/m 2 9 9 6 11 2 6 3 6 11min
Initial Crack Data
ao, cm 0.267 0.318 0.318 0.356 0.330 0.445 0.419 0.445 0.432
(2c)o, cm 0.831 0.922 0.978 0.993 0.968 0.968 0.965 0.965 0.965(a/2c) 0.321 0.344 0.325 0.358 0.341 0.459 0.434 0.432 0.447
(Qo) 1.70 1.79 1.72 1.84 1.77 2.27 2.16 2.15 2.21(AK)o, MN/m 15.2 28.7 23.7 34.7 9.2 20.0 14.1 21.9 23.3
Crack Growth Data (Band 1)
al, cm 0.401 0.470 0.533 0.660 0.419 0.635 0.635 0.635 0.635
(2c)1 , cm 1.219 1.201 1.349 1.336 1.331 1.336 1.318 1.323 1.323
(a/2c)1 0.387 0.391 0.395 0.494 0.315 0.475 0.482 0.480 0.480
(QI) 1.95 1.97 1.99 2.44 1.68 2.35 2.39 2.38 2.38

Table A-i (cont)
Annealed Solution Treated and Aged
Specimen No. 32-1-A 29-3-A 29-1-A 29-2-A 32-2-A 30-1-H 33-1-H 30-2-H 30-3-H
(AK)1, MN/m 3 / 2 17.5 33.1 28.4 41.2 10.6 23.6 16.5 25.7 27.4
Aa, cm 0.135 0.152 0.216 0.305 0.085 0.191 0.216 0.191 0.203
(AK) avg MN/m3/2 16.3 31.1 28.0 38.0 9.8 21.8 15.3 23.8 25.3
( K)0-1, avg'
N 1, cycles 5500 1800 2700 1283 85,000 8372 43,000 7600 7103
(Aa/AN), (nm/cycle) 243 845 792 2374 10 228 50 251 287
Crack Growth Data (Band 2)
a2 , cm 0.483 0.597 0.686 0.914 0.508 0.838 0.889 0.851 0.876
(2c)2, cm 1.359 1.037 1.008 1.288 0.767 1.249 1.326 1.270 1.317
(a/2c)2 0.355 0.408 0.397 0.507 0.302 0.492 0.522 0.500 0.516
(Q2) 1.83 2.04 2.00 2.46 1.63 2.43 2.46 2.46 2.46
(AK)2 MN/m3/2 19.7 37.0 32.0 48.2 11.8 26.5 19.0 29.0 31.0
Aa, cm .0813 .127 .1524 .254 .0889 .203 .254 .2159 .2413
(AK) g' MN/m3/2 18.6 35.1 30.2 44.7 11.3 25.1 17.9 27.3 29.5
N2 , cycles 7000 1100 2070 900 87,000 4904 25,525 2850 3470
(Aa/AN), (nm/cycle) 116 1155 736 2821 10 414 99 756 695

APPENDIX B
Cyclic Crack Growth Data from Compact TensionTests in 10% Relative Humidity Air
s-I

Table B-1 Specimen 11B-A-CP a. U.S. Customary Units
Spec No. Environment B, in. W, in. P max lb Pmin' lb
11B-A-CP 10% RH-RT 1.008 2.499 3000 200
x C a/W a Aa, Y AK AKAV AN da/dn
pin./lb in. in. ksiJin. ksi in. cycles pin./cycle
1 1.74 0.364 0.910 11.12 11.792 1.96 0.390 0.975 11.44 12.54 12.16 50,000 1.300.122 11.44 1254 13.39 50,000 2.443 2.42 0.439 1.097 0.135 12.22 14.23 15.38 34,000 3.974 3.05 0.493 1.232 0.080 13.40 16.53 17.38 15,000 5.33
0.080 17.38 15,000 5.335 3.53 0.525 1.312 14.31 18.226 3.97 0.549 1.372 0.060 15.07 19.71 18.97 9,000 6.67
0.072 1507 19.71 20.78 8,000 9.007 4.60 0.578 1.444 0.093 16.36 21.86 23.57 7,000 13.298 5.57 0.615 1.537 18.35 25.289 6.59 0.644 1.609 0.072 20.34 28.69 4,000 18.00
0.050 30.08 2,000 25.0010 7.48 0.664 1.659 21.99 31.48

Table B-I Specimen 11B-A-CP b. International Units (S.I.)
Spec No. Environment B, cm W, cm P , N Pmin' Nmax min
11B-A-CP 10% RH-RT 2.560 6.348 13,300 890
x C a/W a, \a, Y AK AKAV -N da/dn
nm/N cm cm /IN/m3/ MN/m3/2 cycle nm/cycle
1 9.93 0.364 2.31 11.12 12.960.165 13.36 50,000 33
2 11.19 0.390 2.47 11.44 13.780.310 14.71 50,000 61
3 13.81 0.439 2.78 0.310 12.22 15.64 16.90 34,000 004 17.41 0.493 3.12 0.343 13.40 18.165 20.15 0.525 3.33 0.203 14.31 20.02 19.10 15,000 135
0.152 20.84 9,000 1656 22.66 0.549 3.48 0.183 15.07 21.66 2.8,000
0.183 22.83 8,000 2287 26.26 0.578 3.66 16.36 24.02
0.236 25.90 7,000 3378 31.80 0.615 3.90 18.35 27.78
0.183 29.65 4,000 4579 37.63 0.644 4.08 20.34 31.52
10 42.71 0.127 33.05 2,000 63510 42.71 0.664 4.21 21.99 34.59

Table B-2 Specimen 4C-A-CP a. U.S. Customary Units
Spec No. Environment B, in. W, in. Pmax, lb Pmin, lb
4C-A-CP 10% RH-RT 1.007 2.499 4000 200
x C, a/W ai, Aa, Y AK, AKAV, AN, da/dn,pin./b in. in. ksi in ksi cycles pin/cycle
1 1.80 0.371 0.927 11.20 16.272 2.03 0.398 0.995 Ii.55 17.400.087 11.55 17.40 18.21 15,000 5.803 2.36 0.433 1.082 0.085 12.11 19.02 19.93 12,000 7.084 2.72 0.467 1.167 0.085 12.78 2083 19.93 12,000 7.085 3.28 0.510 1.274 0.153 13.86 23.63 22.23 10,000 10.70_6 4.45 0.571 1.427 16.05 28.96 26.30 10,000 15.30
IJi

-,-B-2 Spc imel 40-A-CF b. International Units (S.I.)
Spec No. Environment B, cm W, cm Pmax, N Pmin' N
4C-A-CP 10% RH-RT 2.558 6.348 17,800 890
x C a/W a, Aa, Y AK 3KAV AN daldn
nm/N cm cm i /m3/2 MN/m3 / 2 cycle nm/cycle
10.28 0.371 2.35 11.20 17.88 18.50 15,000 115
10.28 0.371 2.35 0.173 11.55 19.12 20.01 15,000 147
2 11.59 0.398 2.52 0.221 12.11 20.90 21.90 12,000 179
3 13.48 0.433 2.74 0.216 12.78 22.89 24.43 10,000 271
4 15.53 0.467 2.95 0.272 13.86 25.97 28.90 10,000 388
5 18.73 0.510 3.23 0.389 16.05 31.87
6 25.41 0.571 3.62

Table B-3 Specimen 6A-A-CP a. U.S. Customary Units
Spec No. Environment B, in. W, in. P max lb Pmin' lb
6A-A-CP 10% RH-RT 1.009 2.501 5,000 250
x C, a/W ai, Aa, Y AK, AKAV, AN, da/dn,
pin./1b in. in. ksi i. ksi in. cycles pin./cycle
1 1.746 0.364 0.910 11.12 19.180.0304 19.86 6,000 5.072 1.846 0.376 0.940 11.26 20.540.0854 21.44 6,000 14.233 2.142 0.410 1.025 11.73 22.350.0654 23.13 5,000 13.084 2.383 0.436 1.090 12.16 23.910.0755 24.92 5,000 15.105 2.705 0.466 1.165 12.76 25.930.0930 27.38 4,000 23.256 3.185 0.503 1.258 13.66 28.840.0725 30.21 3,000 24.177 3.647 0.532 1.331 14.54 31.580.0746 33.26 2,500 29.848 4.240 0.562 1.406 15.66 34.950.1270 38.72 2,000 63.50
9 5.508 0.613 1.533 18.23 42.4910 8.136
IJ

q Table B-3 Specimen 6A-A-CP b. International Units (S.I.)
Spec No. Environment B, cm W, cm P , N P , N
6A-A-CP 10% RH-RT 2.562 6.353 22,200 1100
x C a!W a, Aa, Y AK AKAV AN da/dn
nm/N cm cm MN/m3/2 MN/m3/2 cycle nm/cycle
1 9.97 0.364 2.31 0077 11.12 20.08 21.82 6,000 128
2 10.54 0.376 2.39 0.217 11.26 22.57 23.56 6,000 361
3 12.23 0.410 2.60 0.166 11.73 24.57 25.42 5,000 332
4 13.61 0.436 2.77 0.192 12.16 26.27 27.38 5,000 383
5 15.45 0.466 2.96 0.236 12.76 28.49 30.09 4,000 590
6 18.19 0.503 3.20 0.184 13.66 31.69 33.20 3,000 613
7 20.83 0.532 3.38 0.190 14.54 34.70 36.55 2,500 757
8 24.21 0.562 3.57 0.323 15.66 38.40 42.55 2,000 1612
9 31.45 0.613 3.89 18.23 46.69 75010 46.46

Table B-4 Specimen 22C-A-CP a. U.S. Customary Units
Spec No. Environment B, in. W, in. Pmax, lb P min lb
22C-A-CP 10% RH-RT 1.004 2.503 6000 200
x C, a/W a, Aa, Y AK, AKAV, AN, da/dn,
pin./lb in. in. ksi'in. ksifin. cycles pin./cycle
1 1.76 0.367 0.919 11.16 24.682 1.87 0.380 0.951 0.038 11.31 25.46 25.93 2,000 19.003 2.00 0.395 0.989 11.51 26.414 2.15 0.411 1.029 11.74 27.490.045 28.13 2,000 22.505 2.32 0.429 1.074 12.04 28.78 2813 2,000 22.50
6 2.59 0.456 1.141 0.067 12.55 30.94 29.86 2,000 33.50
7 2.83 0.476 1.191 0.050 12.98 32.710.073 34.15 2,000 36.50
8 3.22 0.505 1.264 0.073 13.72 35.60 34.15 2,000 36.50
9 3.73 0.537 1.344 0.080 14.71 39.37 37.48 100 53.3310 4.36 0.568 1.422 0.078 15.91 43.80 41.58 900 86.67
11 5.03 0.596 1.492 17.26 48.67
12 7.04 0.654 1.637 0.145 21.13 62.41 55.54 500 290.00

Table B-4 Specimen 22C-A-CP b. International Units (S.I.)
Spec No. Environment B, cm W, cm P , N P min' Nmax' min'
22C-A-CP 10% RH-RT 2.560 6.360 26,700 900
x C a/W a, a, Y K AKAV AN da/dn
nm/N cm cm MN/m 3 / 2 MN/m3/2 cycle nm/cycle
1 10.05 0.367 2.33 11.16 27.120.081 27.55 3,000 271
2 10.68 0.380 2.42 11.31 27.980.097 28.49 2,000 482
3 11.47 0.395 2.52 11.51 29.020.102 29.61 2,000 508
4 12.28 0.411 2.61 0.114 11.74 30.2130.915 13.25 0.429 2.73 12.04 31.626 14.79 0.456 2.90 0.170 12.55 34.0032.81 2000 850
0.127 34.96 2,000 6357 16.16 0.476 3.03 0.185 12.98 35.94 37.52 2,00. 9278 13.39 0.505 3.21 0.211 13.72 39.12 41.83 1500 1,3549 21.30 0.537 3.41 14.71 43.26
0.198 45.69 900 2,20110 24.90 0.568 3.61 15.91 43.800.178 50.80 600 2,96311 28.74 0.596 3.79 17.26 53.48
0.368 61.03 500 7,36612 40.70 0.654 4.16 21.13 68.58

Table B-5 Specimen 1A-H-CP a. U.S. Customary Units
Spec No. Environment B, in. W, in. P max, lb Pmin' lb
1A-H-CP 10% RH-RT 1.003 2.500 3000 200
x C, a/W a, Aa, Y AK, AKAV, AN, da/dn,
Ain./lb in. in. ksifn. ksi1in. cycles Ain./cycle
1 1.77 0.367 0.918 11.16 11.942 1.89 0.382 0.955 0.037 11.33 12.38 12.84 30,000 2.43
0.073 12.84 30,000 2.433 2.15 0.411 1.028 11.74 13.30 14.04 30,000 3.400.102 14.04 30,000 3.404 2.56 0.452 1.130 12.47 14.790.080 15.48 15,500 5.165 2.93 0.484 1.210 13.17 16.1700 5.0.075 16.94 13,000 5.776 3.35 0.514 1.285 13.97 17.70
0.073 18.56 9,000 8.117 3.85 0.543 1.358 14.92 19.42
Table B-6 Specimen 6B-H-CP a. U.S. Customary Units
Spec No. Environment B, in. W, in. Pmax, lb Pmin' lb
6B-H-CP 10% RH-RT 1.004 2.497 3500 200
x C, a/W a, Aa, Y AK, AKAV, AN, da/dn,
Ain./lb in. in. ksi if . ksi in. cycles Ain./cycle
1 1.76 0.367 0.916 11.16 14.060.050 14.40 12,000 4.172 1.93 0.387 0.966 11.40 14.750.002 14. 7 12,000 0.173 1.94 0.388 0.968 11.41 14.79 14.77 12,000 0.170.028 14.99 12,000 2.33
4 2.04 0.399 0.996 11.56 15.200.048 15.57 12,000 4.00
5 2.22 0.418 1.044 11.85 15.94 12,0006 2.34 0.431 1.076 0.032 12.07 16.49 16.21 12,000 2.677 2.52 0.448 1.119 0.043 12.39 17.25 1687 12,000 3.58
0.042 17.66 12,000 3.508 2.69 0.465 1.161 12.74 18.079 2.97 0.488 1.219 0.057 13.27 19.28 18.68 12,000 4.75
10 3.33 0.513 1.281 0.062 13.95 20.78 20.03 12,000 5.170.090 22.06 12,000 7.5011 3.97 0.549 1.371 15.15 23.340.120 25.59 10,000 12.0012 5.06 0.597 1.491 17.32 27.83

Table B-5 Specimen lA-H-CP b. International Units (S.1.)
Spec No. Environment B, cm W, cm P m N P Nmax ' min'
IA-H-CP 10% RH-RT 2.545 6.350 13,300 900
x C a/W a, Aa, Y AK AKAV AN da/dn
nm/N cm cm MN/m 3 / 2 MN/m3/2 cycle nm/cycle
1 10.11 0.367 2.33 11.16 13.122 10.79 0.382 2.43 11.33 13.60
0.185 14.11 30,000 613 12.28 0.411 2.61 11.74 14.61
0.259 15.43 30,000 664 14.62 0.452 2.87 0.203 12.47 16.25 17.01 15,500 1310.203 17.01 15,500 131
5 16.73 0.484 3.07 0.191 13.17 17.77 18.61 13,000 1465 16.73 0.484 3.07 13.17 17.77
6 19.13 0.514 3.26 13.97 19.45
7 21.98 0.543 3.45 14.92 21.34
Table B-6 Specimen 6B-H-CP b. International Units (S.I.)
Spec No. Environment B, cm W, cm P N Pin' Nmax, min'
6B-H-CP 10% RH-RT 2.548 6.344 15,600 900
x C a/W a, Aa, Y AK AKAV AN da/dn
nm/N cm cm MN/m3 / 2 MN/m3 / 2 cycle nm/cycle
1 10.05 0.367 2.33 0.127 11.16 15.45 15.82 12,000 1052 11.02 0.387 2.45 0.005 11.40 16.21 16.23 12,000 43 11.08 0.388 2.46 0.071 11.41 16.25 16.47 12,000 594 11.65 0.399 2.53 0.121 11.56 16.70 17.11 12,000 1015 12.68 0.418 2.65 0.081 11.85 17.52 17.81 12,000 676 13.36 0.431 2.73 12.07 18.120.109 18.54 12,000 907 14.39 0.448 2.84 0.107 12.39 18.95 19.86 12,000 888 15.36 0.465 2.95 12.74 19.860.145 20.53 12,000 1209 16.96 0.488 3.10 0.158 13.27 21.19 22.01 12,000 131
10 19.02 0.513 3.25 0.229 13.95 22.83 24.24 12,000 19011 22.67 0.549 3.48 0.305 15.15 25.65 28.12 10,000 30412 28.89 0.597 3.79 17.32 30.58

Table B-7 Specimen 13A-H-CP a. U.S. Customary Units
Spec No. Environment B, in. W, in. Pmax, lb Pmin' lb
13A-H-CP 10% RH-RT 1.003 2.503 4000 200
x C, a/W a, Aa, Y AK, AKAV, AN, da/dn
pin./1b in, in. ksii-Tn. ksi in cycles Vin./cycle
1 1.75 0.365 0.914 11.13 16.120.047 16.49 41,000 1.15
2 1.91 0.384 0.961 11.36 16.860.055 17.33 40,000 1.38
3 2.10 0.406 1.016 11.67 17.790.058 18.35 30,000 1.93
4 2.32 0.429 1.074 12.04 18.900.067 19.59 30,000 2.23
5 2.60 0.456 1.141 12.55 20.280.105 21.58 24,000 4.38
6 3.11 0.498 1.246 13.53 22.87
Table B-8 Speciment 25C-H-CP a. U.S. Customary Units
Spec No. Environment B, in. W, in. P i lb P i , lbmax' min'
25C-H-CP 10% PH-RT 1.000 2.498 5000 250
x C, a/W a, ba, Y AK, AKAV, AN, da/dn
pin./1b in. in. ks in. ksiin. cycles pin./cycle
1 1.64 0.351 0.877 10.99 19.560.025 19.79 4,000 6.252 1.72 0.361 0.902 11.09 20.02
0.032 20.33 4,000 8.003 1.83 0.374 0.934 11.24 20.64
0.050 21.17 4,000 12.504 1.99 0.394 0.984 11.49 21.700.043 22.17 3,000 14.335 2.15 0.411 1.027 11.74 22.630.055 23.29 2,500 22.006 2.36 0.433 1.082 12.11 23.95
0.035 24.40 1,000 35.007 2.50 0.447 1.117 12.37 24.850.040 25.40 1,000 40.008 2.68 0.463 1.157 12.69 25.960.035 26.48 500 70.009 2.84 0.477 1.192 13.00 26.99
0.047 27.76 0500 94.0010 3.09 0.496 1.239 13.47 28.52

Table B-7 Specimen 13-A-H-CP b. International Units (S.I.)
Spec No. Environment B, cm W, cm P max' N P Nmax min'
13A-H-CP 10% RH-RT 2.548 6.358 17,800 900
x C a/W a, a, Y AK AKAV A\ da/dn
nm/N cm cm N/m 3 /2 MN/m3/2 cycle nm/cycle
1 9.99 0.365 2.32 11.13 17.710.119 18.12 41,000 29
2 10.91 0.384 2.44 11.36 18.530.140 19.04 40,000 35
3 11.99 0.406 2.58 11.67 19.550.148 20.16 30,000 49
4 13.32 0.429 2.72 12.04 20.770.170 21.53 30,000 565 14.85 0.456 2.90 12.55 22.28
0.267 23.71 24,000 1116 17.76 0.498 3.17 13.53 25.13
Table B-8 Specimen 25C-H-CP b. International Units (S.I.)
Spec No. Environment B, cm W, cm P , N P . Nmax main
25C-H-CP 10% RH-RT 2.540 6.345 22,200 1100
x C a/W a, da, Y AK dKAV AN da/dn
nm/N cm cm MN/m3/2 MN/m3/2 cycle nm/cycle
1 9.34 0.351 2.23 10.99 21.490.064 21.75 4,000 158
2 9.82 0.361 2.29 11.09 22.000.081 22.34 4,000 203
3 10.45 0.374 2.37 11.24 22.680.127 23.26 4,000 317
4 11.36 0.394 2.50 11.49 23.840.109 24.36 3,000 363
5 12.28 0.411 2.61 11.74 24.870.140 25.59 2,500 558
6 13.48 0.433 2.75 12.11 26.320.089 26.81 1,000 889
7 14.27 0.447 2.84 12.37 27.310.102 27.91 1,000 1,016
8 15.30 0.463 2.94 12.69 28.530.089 26.10 500 1,7789 16.22 0.477 3.03 13.00 29.660.120 30.50 500 2,38710 17.64 0.496 3.15 13.47 31.34

APPENDIX C
Cyclic Crack Growth Data from Compact TensionTests in 100% Relative Humidity Air

Table C-1 Specimen 4A-A-CP a. U.S. Customary Units
Spec No. Environment B, in. W, in. P lb P min' lbmax' min'
4-A-CP 100% RH-RT 1.010 2.475 3000 200
x C, a/W a, Aa, Y AK, AKAV, AN, da/dN,
-in./ib in. in. ksi/in. ksi /n. cycles pin./cycle
1 1.72 0.361 0.893 11,09 11.742 1.86 0.378 0.936 0.043 11.28 12.23 11.98 50,000 0.863 2.01 0.396 0.980 0.044 11.52 12.78 12.51 60,000 0.736A 2.27 0.424 1.049 0.069 11.95 13.71 13.25 90,000 0.777 2.42 0.439 1.087 0.038 12.22 14.22 13.97 20,000 1.908 2.83 0.476 1.178 0.091 12.98 15.79 15.01 40,000 2.289 3.19 0.504 1.247 0.069 13.69 17.26 16.53 20,000 3.45
10 4.02 0.551 1.364 0.117 15.22 19.92 18.59 30,000 3.9011 4.88 0.588 1.455 0.091 6.85 2277 21.35 10,000 9.1012 6.16 0.632 1.564 0.109 19.47 27.28 25.03 8,000 13.6313 7.19 0.657 1.626 0.062 21.38 30.54 3,000 20.6714 8.40 2,000
Table C-2 Specimen 1OA-A-CP a. U.S. Customary Units
Spec No. Environment B, in. W, in. P , lb P min' lbmax' min'
10A-A-CP 100% RH-RT 1.004 2.475 4000 200
x C, a/W a, Aa, Y AK, AKAV, AN, da/dN,
Iin./1b in. in. ksi Vin. ksiVn cycles pin./cycle
1 1.78 0.368 0.911 11.17 16.292 2.20 0.417 1.032 0.223 11.84 18.41 21.01 1,000 17.153 3.24 0.507 1.255 13.77 23.614 4.04 0.552 1.366 0.111 15.26 27.28 25.44 7,000 15.860.183 31.78 4,000 45.755 5.93 0.626 1.549 0.070 19.06 36.28 38.71 500 140.006 7.06 0.654 1.619 21.13 41.13

Table C-1 Specimen 4A-A-CP b. International Units (S.I.)
Spec No. Environment B, cm W, cm P , N Pmin' N
4-A-CP 100% RH-RT 2.565 6.287 13,300 900
x C a/W a, Aa, Y AK AK AN da/dnAV
nm/N cm cm MN/m 3/2 MN/m3 / 2 cycle nm/cycle
1 9.82 0.361 2.27 0.109 11.09 12.9013.16 50000 212 10.62 0.378 2.38 11.28 13.44
0.112 13.75 60,000 183 11.48 0.396 2.49 11.52 14.04
0.175 14.56 90,000 196A 12.96 0.424 2.65 11.95 13.71
0.097 15.35 20,000 487 13.82 0.439 2.76 12.22 15.63
0.231 16.49 40,000 578 15.16 0.476 2.99 12.98 17.35
0.175 18.16 20,000 879 18.22 0.504 3.16 13.69 18.97
0.297 20.43 30,000 9910 22.96 0.551 3.47 15.22 21.89
0.231 23.46 10,000 23111 27.87 0.588 3.70 16.85 25.02
0.277 27.50 8,000 34612 35.17 0.632 3.97 19.47 29.98
0.158 31.77 3,000 52513 41.06 0.657 4.13 21.38 33.5614 47.97
Table C-2 Specimen 10A-A-CP b. International Units (S.I.)
Spec. No. Environment B, cm W, cm Pax N Pmin' N
10OA-A-CP 100% RH-RT 2.550 6.287 17,800 900
x C a/W a, da, Y AK AKAV AdN da/dn
3/2 -3/2nm/N cm cm MN/m MN/m cycle nm/cycle
1 10.16 0.368 2.31 11.17 17.90 19.06 15,000 204
2 12.56 0.417 2.62 11.84 20.23
3 18.50 0.507 3.19 0.566 13.77 25.94 23.09 13,000 4350.282 27.96 7,000 402
4 23.07 0.552 3.47 15.26 30.00 34.92 4,000 1,1625 33.86 0.626 3.93 0.465 19.06 39.87
6 40.31 0.654 4.11 21.13 45.19

Table C-3 Specimen 14B-A-CP a. U.S. Customary Units
Spec. No. Environment B, in. W, in. P , lb P , lb
14B-A-CP 100% RH-RT 1.000 2.499 5000 250
x C, a/W a, Aa, Y AK, AKAV, AN, da/dn,
pin./lb in in. ksi/-. ksi fi/, cycles pin./cycle
1 1.0722 1.800 0.371 0.927 11.20 20.50 6,000
0.040 20.91 6,000 6.673 1.928 0.387 0.967 11.40 21.31
0.023 21.55 6,000 3.834 2.090 0.396 0.990 11.52 21.79 22.74 6,000 13.67
0.082 22.74 6,000 13.675 2.313 0.429 1.072 12.04 23.69
0.070 24.61 6,000 11.676 2.605 0.457 1.142 12.57 25.537 3.000 0.490 1.224 0.063 13.32 28.02 29.11 4,000 15.75
0.063 29.11 4,000 15.758 3.363 0.515 1.287 14.00 30.209 3.870 0.545 1.362 0.075 15.00 33.27
10 4.524 0.575 1.437 0.075 16.22 36.97 36.00 2,000 37.500.042 38.20 1,000 42.00
11 4.928 0.592 1.479 17.05 39.4312 5.608 0.616 1.539 18.41 43.43 41.43 600 100.0013 6.823 0.649 1.622 0.083 20.73 50.19 46.81 400 207.5014 7.392 0.662 1.654 0.032 21.81 53.32 51.76 100 320.0015 7.961 5016 8.421 30
2017 8.888
2018 10.169 20
C'

Table C-3 Specimen 14B-A-CP b. International Units (S.I.)
Spec No. Environment B, cm W, cm P, N P Nmax' min
14B-A-CP 100% RH-RT 2.540 6.348 22,200 1100
x C a/W a, a, Y AK AKAV N da/dn
nm/N cm cm MN/m 3 / 2 MN/m3 / 2 cycle nm/cycle
1 6.122 10.28 0.371 2.35 11.20 22.523 11.01 0.387 2.46 11.40 23.41 22.98 6,000 169
0.058 23.68 6,000 974 11.93 0.396 2.52 11.52 23.94
0.208 24.99 6,000 3475 13.21 0.429 2.72 12.04 26.03
0.178 27.04 6,000 2966 14.88 0.457 2.90 12.57 28.05 29.42 5,000 416
0.208 29.42 5,000 4167 17.13 0.490 3.11 0.160 13.32 30.798 19.20 0.515 3.27 0.191 14.00 33.18 35.83 3,000 635
0.191 35.83 3,000 6359 22.10 0.545 3.46 15.00 36.5610 25.83 0.575 3.65 0.191 16.22 40.62 41.98 1,000 1,06611 28.14 0.592 3.76 0.152 17.05 43.3345.52 600 54012 32.02 0.616 3.91 18.41 47.72
0.211 51.43 400 5,2700.081 56.87 100 8,128
13 38.96 0.649 4.12 0.081 2. 56.87 00 8,12814 42.21 0.662 4.20 21.81 58.59 5015 45.46 3016 48.09 2017 50.75 2018 58.07

Table C-4 Specimen 11C-A-CP a. U.S. Customary Units
Spec No. Environment B, in. W, in. Pmax, lb Pmin' lb
11C-A-CP 100% RH-RT 1.009 2.495 6000 200
x C, a/W a, Aa, Y AK, AKAV, AN, da/dn,
pin./lb in. in. ksi i-n. ksi Vi . cycles pin./cycle
1 1.695 0.358 0.893 11.06 24.08 25.33 3,0000.067 25.33 3,000 "22.332 1.916 0.385 0.961 11.37 24.83 27.38 3,000 30
3 2.250 0.422 1.053 0.092 11.92 28.19 30.03 2,500 46.000.115 30.03 2,500 46.004 2.727 0.468 1.168 12.80 31.88 34.28
5 3.388 0.516 1.287 0.120 14.03 36.69 1,500 80.006 3.906 0.546 1.362 0.075 15.03 40.43 38.56 600 125.007 4.253 0.563 1.405 0.042 15.70 42.88 41.65 200 210.00
8 4.549 0.576 1.437 0.032 16.27 44.94 43.91 50 320.009 4.772 0.585 1.460 0.022 16.70 46.49 45.72 50 440.00
0.040 47.98 50 800.0010 5.153 0.601 1.499 17.54 49.470.072 52.66 50 1,440.0011 6.096 0.630 1.572 19.33 55.84
Table C-5 Specimen 27B-H-CP a. U.S. Customary Units
Spec No. Environment B, in. W, in. P max, lb Pmin' lb
27B-H-CP 100% RH-RT 1.006 2.497 3000 200
x C, a/W a, Aa, Y AK, AKAV, AN, da/dn,
pin./1b in. in. ksi/in. ksi Vi-n. cycles pin./cycle
1 1.714 0.361 0.901 11.09 11.740.030 11.91 20,000 1.502 1.826 0.373 0.931 11.22 12.070.065 12.47 30,000 2.173 2.035 0.399 0.996 11.56 12.87 13.600.105 13.60 30,000 3.504 2.437 0.441 1.101 12.26 14.340.135 15.50 25,000 5.40
5 3.063 0.495 1.236 13.45 16.676 3.894 0.545 1.361 0.125 15.00 19.50 18.08 15,000 8.337 4.983 0.594 1.483 0.122 17.16 23.29 7,000 17.438 5.347 0.608 1.518 17.93 24.63
LA

Table C-4 Specimen 11C-A-CP b. International Units (S.I.)
Spec No. Environment B, cm W, cm P , N Pmin' N
11C-A-CP 100% RH-RT 2.563 6.337 27,000 900
x C a/W a, Aa, Y AK KAV AN da/dn
nm/N cm cm M/m 3 / 2 MN/m3 / 2 cycle nm/cycle
1 9.68 0.358 2.27 0.170 11.06 26.46 27.83 3,000 567
2 10.94 0.385 2.44 0.234 11.37 27.28 30.09 3,000 7793 12.85 0.422 2.67 0.292 11.92 30.98 33.00 2,500 1,168
15.57 0.468 2.97 0.305 12.80 35.03 37.67 1,500 2,0325 19.35 0.516 3.27 0.305 14.03 40.31 42.37 600 3,1755 1922.30 0.546 3.46 0.191 15.03 44.43 45.77 200 5,3347 24.29 0.563 3.57 0.107 15.70 47.12 48.25 100 8,128
8 25.98 0.576 3.65 0.056 16.27 49.38 50.24 50 11,1769 26.96 0.585 3.71 16.70 51.08 52.72 50 20,320
10 29.42 0.601 3.81 0.183 17.54 54.36 57.86 50 36,576
11 34.81 0.630 3.99 19.33 61.36
Table C-5 Specimen 27B-H-CP b. International Units (S.I.)
Spec No. Environment B, cm W, cm P max N Pmin, N
27B-H-CP 100% RH-RT 2.555 6.342 13,300 900
x C a/W a, Aa, Y UK A KAV AN da/dn
nm/N cm cm MN/m3 / 2 MN/m3 / 2 cycle nm/cycle
1 9.79 0.361 2.29 0.076 11.09 12.90 13.09 20,000 38
2 10.43 0.373 2.37 0.165 11.22 13.26 13.70 3000055
3 11.62 0.399 2.53 0.267 11.56 14.14 14.94 30,000 890.267 89.26 15.76
4 13.92 0.441 2.80 0.343 12.26 15.76 17.03 25,000 137
5 17.49 0.495 3.14 0.318 13.45 18.32 19.87 15,000 212
6 22.24 0.545 3.46 15.00 21.43 23.51 7,000 4437 28.45 0.594 3.77 0.089 17.16 25.59 26.33 1,000 889
8 30.53 0.608 3.86 17.93 27.06

Table C-6 Specimen 19A-H-CP a. U.S. Customary Units
Spec No. Environment B, in. W, in. P lb P lbmax' min'
19A-H-CP 100% RH-RT 1.005 2.500 3500 200
x C, a/W a, Aa, Y AK, AKAV, AN, da/dn,
pin./1b in. in. ksi ii. ksi /In. cycles pin./cycle
1 1.619 0.348 0.870 10.96 13.500.012 13.54 10,000 1.20
2 1.666 0.353 0.882 0.025 11.01 13.590.025 13.75 10,000 2.50
3 1.744 0.363 0.907 0033 11.11 13.910.033 14.12 10,000 3.304 1.820 0.376 0.940 12.26 14.340.032 14.57 10,000 3.20
5 1.953 0.389 0.972 11.43 14.800.040 15.10 10,000 4.00
6 2.089 0.405 1.012 11.65 15.407 2.292 0.427 1.068 0.056 12.00 16.29 15.85 0,000 5.60
0.060 16.83 9,500 6.328 2.541 0.451 1.128 12.49 17.36
0.070 18.06 7,500 9.339 2.860 0.479 1.198 13.06 18.76
0.070 19.56 6,000 11.6710 3.235 0.507 1.268 13.77 20.360.060 21.16 4,000 15.0011 3.616 0.531 1.328 14.51 21.96
0.022 22.28 1,000 22.0012 3.797 0.540 1.350 14.82 22.61
0.028 23.04 1,000 28.0013 4.000 0.551 1.378 15.22 23.46
0.034 24.06 1,000 34.0014 4.304 0.565 1.412 15.79 24.64
Table C-7 Specimen ZC-H-CP a. U.S. Customary Units
Spec No. Environment B, in. W, in. P , lb P . , lbmax minm
2C-H-CP 100% RH-RT 1.000 2.503 4000 200
x C, a/W a, Aa, Y AK, AKAV, AN, da/dn,
pin./1b in. in. ksii'/iWn ksii/i- cycles pin./cycle
1 1.648 0.352 0.881 011.00 15.68 16.03 15,000 3.202 1.793 0.371 0.929 11.20 16.39
0.065 16.92 15,000 4.333 2.025 0.397 0.994 11.54 17.46 18.234 2.333 0.430 1.076 0.082 12.06 18.99 15,000 5.47
0.203 21.42 15,000 13.535 3.292 0.511 1.279 13.89 23.85
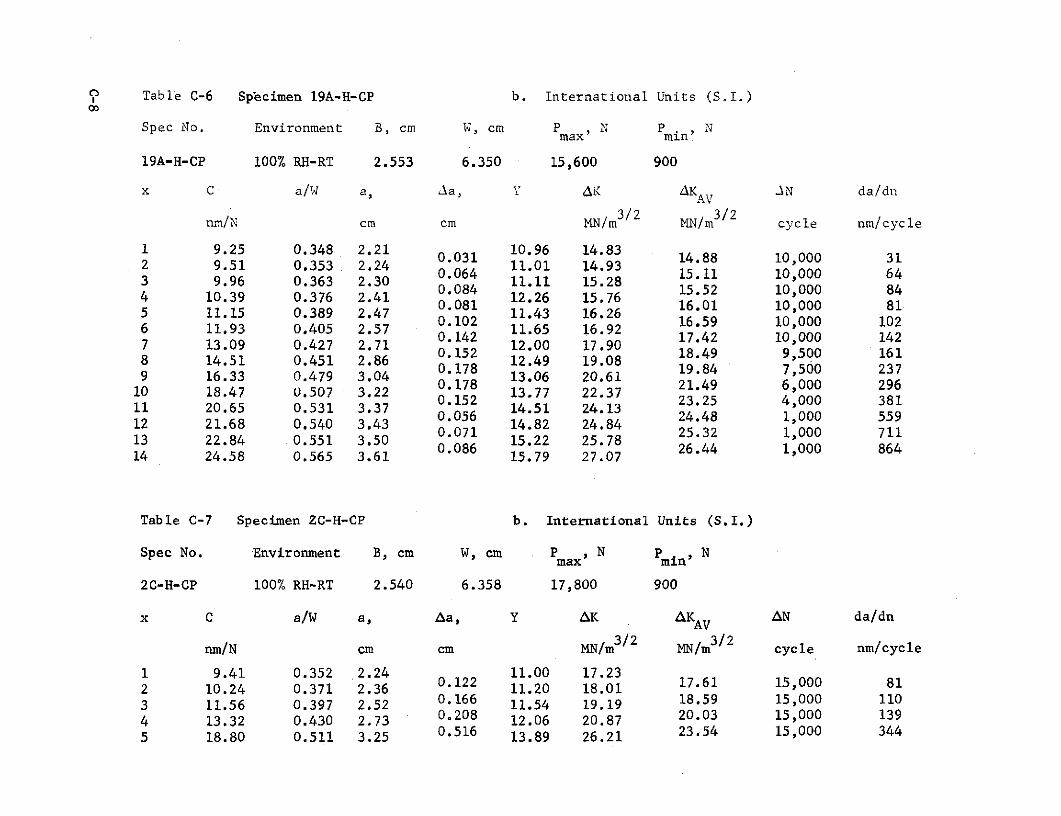
S Table C-6 Specimen 19A-H-CP b. International Units (S.I.)00
Spec No. Environment B, cm W, cm P N P Nmax min
19A-H-CP 100% RH-RT 2.553 6.350 15,600 900
x C a/W a, Aa, Y AA KAV -N da/dn
nm/N cm cm MN/m3/2 MN/m3 /2 cycle nm/cycle
1 9.25 0.348 2.21 10.96 14.830.031 14.88 10,000 312 9.51 0.353 2.24 0.064 11.01 14.930.064 15.11 10,000 643 9.96 0.363 2.30 11.11 15.28 15.52 100.084 15.52 10,000 844 10.39 0.376 2.41 12.26 15.76 16.01 100.081 16.01 10,000 81
5 11.15 0.389 2.47 11.43 16.260.102 16.59 10,000 1026 11.93 0.405 2.57 11.65 16.92000 10.142 17.42 10,000 1427 13.09 0.427 2.71 12.00 17.90 18.49 9,500 1610.152 18.49 9,500 1618 14.51 0.451 2.86 12.49 19.08 7,5 2370.178 19.84 7,500 2379 16.33 0.479 3.04 13.06 20.6100 20.178 21.49 6,000 29610 18.47 0.507 3.22 13.77 22.37,0000.152 23.25 4,000 38111 20.65 0.531 3.37 14.51 24.130.056 24.48 1 000 55912 21.68 0.540 3.43 14.82 24.84 25.32 1,000 7110.071 25.32 1,000 71113 22.84 .0.551 3.50 15.22 25.78 26.440.086 26.44 1,000 86414 24.58 0.565 3.61 15.79 27.07
Table C-7 Specimen ZC-H-CP b. International Units (S.I.)
Spec No. Environment B, cm W, cm P , N Pin' Nmax min
2C-H-CP 100% RH-RT 2.540 6.358 17,800 900
x C a/W a, Aa, Y AK AKAV AN da/dn
nm/N cm cm MN/m3/2 MN/m3/2 cycle nm/cycle
1 9.41 0.352 2.24 11.00 17.232 10.24 0.371 2.36 0.122 11.20 18.01 17.61 15,000 813 11.56 0.397 2.52 0.166 11.54 19.19 18.59 15,000 110
4 13.32 0.430 2.73 0.208 12.06 20.87 20.03 15,000 1395 18.80 0.511 3.25 0.516 13.89 26.21 23.54 15,000 344

Table C-8 Specimen IC-H-CP a. U.S. Customary Units
Spec No. Environment B, in. W, in. Pmax, lb P min' lb
IC-H-CP 100% RH-RT 1.004 2.502 5000 250
x C, a/W a, Aa, Y AK, AKAV, AN, da/dn,
pin./lb in. in. ksiVN. ksiiN/V cycles pin./cycle
1 1.617 0.348 0.871 10.96 19.352 1.701 0.359 0.898 0.027 11.07 19.84 19.591 3,000 9.003 1.800 0.371 0.928 0.030 11.20 20.410.030 20.71 3,000 10.004 1.905 0.383 0.958 0.030 11.35 21.01 21.32 3,000 10.005 2.000 0.395 0.988 0.058 11.51 21.63 22.28 3,000 19.336 2.217 0.418 1.046 11.85 22.937 2.658 0.461 1.153 12.65 25.70

Table C-8 Specimen 1C-H-CP b. International Units (S.I.)
o Spec No. Environment B, cm W, cm Pmax, N Pin N
1C-H-CP 100% RH-RT 2.550 6.355 22,200 1100
x C a/W a, Aa, Y AK AKAV AN da/dn
3/9 3/2nm/N cm cm MN/m 2 MN/m cycle nm/cycle
1 9.23 0.348 2.21 10.96 21.26 21.53 3,000 229
2 9.71 0.359 2.28 0.068 11.07 21.80 22.11 3,000 254
3 10.28 0.371 2.36 0.076 11.20 22.43 22.76 3,000 2544 10.88 0.383 2.43 0.076 11.35 23.09 23.43 3,000 254
5 11.42 0.395 2.50 0.147 11.51 23.77 24.48 3,000 491
6 12.66 0.418 2.66 0.272 11.85 25.20 26.71 3,000 906
7 - 15.18 0.461 2.93 12.65 28.24

APPENDIX D
Cyclic Crack Growth Data from CompactTension Tests at -650F
(2200K)

Table D-1 Specimen 11A-A-CP a. U.S. Customary Units
Spec. No. Environment B, in. W, in. P , lb P lb
11A-A-CP -65 F 1.009 2.497 2,500 200
x C, a/W a, Aa, Y AK, AKAV, AN, da/dN
pin./ b in. in. ks i Vn. ks i V . cycles pin./cycles
1 1.71 0.359 0.898 11.07 9.572 1.84 0.376 0.940 0.025 11.26 9.97 10.08 12,000 0.20
0.025 10.08 122,000 0.203 1.93 0.386 0.965 11.39 10.204 2.05 0.400 1.000 11.58 10.56 10.83 78,000 0.64
0.050 10.83 78,000 0.645 2,23 0.420 1.050 11.89 11.11
0.058 11.89 11.11 11.46 60,000 0.976 2.47 0.443 1.108 0.045 12.29 11.80 12.10 40,000 1.137 2.66 0.461 1.153 0,060 12.65 12.39 12.83 30,000 2.008 2.94 0.485 1.213 0,050 13.20 13,26 13.66 25,000 2.00
9 3.21 0.505 1.263 13.72 14.070.087 14.89 24,000 3.63
10 3.81 0.540 1.350 14.82 15.71 1670 15,500 5.4811 4.51 0.574 1.345 16.18 17.69 18.93 12,000 7.0812 5.36 0.608 1.520 0.085 17.93 2017
0.098 22.02 9,000 10.89213 6.77 0.647 1.618 00 20.58 23,88
I-

Table D-l Specimen 1A-A-CP b. International Units (S.I.)
Spec No. Environment B, cm W, cm P N P N
11A-A-CP -650F 2.563 6.342 11,100 900
x C a/W a, Aa, Y AK KAV AN da/dn
nm/N cm cm 'N/m3/2 MN/m3/2 cycle nm/cycle
1 9.76 0.359 2.28 0.110 11.07 10.52 10.74 120,000 92 10.51 0.376 2.39 11.26 10.963 11.02 0.386 2.45 0.090 11.39 11.21 11.40 45,000 204 11.71 0.400 2.54 0.127 11.58 11.60 11.90 78,000 165 12.73 0.420 2.67 11.89 12.21
0.147 12.59 60,000 256 14.10 0.443 2.81 0.114 12.29 12.970 0 29
0.114 13.30 40,000 297 15.19 0.461 2.93 0.152 12.65 13.61 14.10 30000 518 16.79 0.485 3.08 0.127 13.20 14.57 15.09 25,000 519 18.33 0.505 3.21 13.72 15.46
0.221 16.36 24,000 9210 21.76 0.540 3.43 0.216 14.82 17.26 1.35 15,500 13911 25.75 0.574 3.42 0.216 16.18 19.44 20.80 12,000 18012 30.61 0.608 3.86 0.249 17.93 22.16 24.20 9,000 27713 38.66 0.647 4.11 20.58 26.24

Table D-2 Specimen 15B-A-CP a. U.S. Customary Units
Spec. No. Environment B, in. W, in. Pmax lb P min lb
15B-A-CP -650F 1.005 2.498 3,000 200
x C, a/W a, Aa, Y AK, AKAV, AN, da/dN
Ain./lb in. in. ksi/Ti. ksiV i. cycles pin./cycles
1 1.73 0.362 0.905 0.068 11.10 11.78 12.17 45,000 1.512 1.95 0.389 0.973 0.050 11.43 12.57 12.89 27,250 1.83
3 2.13 0.409 1.023 0.065 11.71 13.21 13.67 25,000 2.60
4 2.38 0.435 1.088 0.070 12.15 14.13 14.58 24,000 2.92
5 2.68 0.463 1.158 0.077 12.70 15.23 15.93 17,000 4.536 3.07 0.494 1.235 0.088 13.42 16.63 17.57 15,000 5.877 3.60 0.529 1.323 0.052 14.44 18.51 19.18 7,000 7.438 3.98 0.550 1.375 0.058 15.18 19.85 20.69 7,000 8.29
9 4.48 0.573 1.433 0.097 16.14 21.53 23.30 7,000 13.86
10 5.48 0.612 1.530 0.040 18.17 2507 25.94 3,000 13.33
11 6.01 0.628 1.570 0.060 19.19 26.82 28.34 2,500 24.00
12 6.96 0.652 1.630 20.97 29.85
13 7.85

Table D-2 Specimen 15B-A-CP b. International Units (S.I.)
Spec No. Environment B, cm W, cm P , N Pmin, N
15B-A-CP 2190K 2.553 2.345 13,300 900
x C a/W a, Aa, Y AK AKAV AN da/dn
nm/N cm cm MN/m3/2 MN/m3/2 cycle nm/cycle
1 9.88 0.362 2.299 0.173 11.10 12.94 13.37 45,000 382 11.15 0.389 2.471 .127 11.43 13.81 14.16 27,250 473 12.16 0.409 2.598 0.165 11.71 14.52 15.02 25,000 664 13.59 0.435 2.764 0.178 12.15 15.53 16.02 24,000 740.178 16.02 24,000 745 15.30 0.463 2.941 0.196 12.70 16.746 17.53 0.494 3.137 0.234 13.42 18.27 19.30 15,000 1497 20.56 0.529 3.360 0.132 14.44 20.34 21.08 7,000 1888 22.73 0.550 3.493 0.147 15.18 21.81 22.73 7,000 2109 25.58 0.573 3.640 0.246 16.14 23.66 25.60 7,000 352
10 31.29 0.612 3.886 0.102 18.17 28.65 28.5011 34.32 0.628 3.988 0.152 19.19 29.47 31.14 2,500 61012 39.74 0.652 4.140 20.97 32.80
13 44.82

Table D-3 Specimen 16C-A-CP a. U.S. Customary Units
Spec. No. Environment B, in. W, in. P , lb P , lbmax min
16C-A-CP -650F 1.003 2.504 3,500 200
x C, a/W a, Aa, Y AK, AKAV, AN, da/dN
Min./lb in. in. ksi/Tin. ksisVin. cycles Ain./cycles
1 1.78 0.369 0.924 11.18 14.120.035 14.36 12,000 2.922 1.91 0.383 0.959 11.35 14.60 14.78 120.025 14.78 12,000 2.083 1.99 0.393 0.984 11.48 14.97 15.51 15,000 4.670.070 15.51 15,000 4.674 2.24 0.421 1.054 11.91 16.05 16.72 15,000 5.000.075 16.72 15,000 5.005 2.55 0.451 1.129 12.45 17.380.060 17.98 10,300 5.836 2.82 0.475 1.189 12.96 18.577 3.28 0.510 1.277 0.088 13.86 20.59 21.51 6,000 11.338 3.75 0.537 1.345 14.71 22.42 23.68 5,500 14.000.077 23.68 5,500 14.009 4.36 0.568 1.422 15.92 24.9310 5.15 0.600 1.502 17.48 28.160.081 30.18 2,000 40.5011 6.15 0.632 1.583 19.47 32.190.032 33.15 1,500 21.3312 6.67 0.645 1.615 20.42 34.10 .... 1,500 ---13 8.71 - --- ---
'-I

Table D-3 Spbcimen 16C-A-CP b. International Units (S.I.)
Spec No. Environment B, cm W, cm Pmax, N Pin' N
16C-A-CP 2190K 2.548 6.360 15,600 900
x C a/W a, Aa, Y AK AKAV AN da/dn
nm/N cm cm N/m3/2 MN/m3 / 2 cycle nm/cycle
1 10.16 0.369 2.346 0.089 11.18 15.52 15.78 12,000 742 10.91 0.383 2.436 0.064 11.35 16.04 16.24 12,000 53
3 11.36 0.393 2.499 0.178 11.48 16.45 17.04 15,000 119
4 12.79 0.421 2.677 0.191 11.91 17.64 18.37 15,000 127
5 14.56 0.451 2.868 0152 12.45 19.10 19.77 10,300 1466 16.10 0.475 3.020 0.224 12.96 20.41 21.51 9,000 2487 18.73 0.510 3.244 0.173 13.86 22.62 23.64 6,000 2888 21.44 0.537 3.416 0.196 14.71 24.64 26.02 5,500 356
9 24.90 0.568 3.612 0.203 15.92 27.39 29.17 3,500 58110 29.41 0.600 3.815 0.206 17.48 30.94 33.16 2,000 1,02910 19.47 35370.206 36.31,500 5
11 35.12 0.632 4.021 0.081 19.47 35.37 1,500 542
12 38.09 0.645 4.102 20.42 37.47 1,50013 49.74

Table D-4 Specimen 18A-A-CP a. U.S.. Customary Units
Spec. No. Environment B, in. W, in. P , lb Pmin , lb
18A-A-CP -65 F 1.002 2.496 4,000 200
x C a/W a, Aa, Y AK, AKAV, AN, da/dN
Pin./lb in. in. ksi VIn. ks i/7in. cycles pin./cycles
1 1.80 0.371 0.926 11.20 16.370.047 16.76 12,000 3.922 1.96 0.390 0.973 0048 11.44 17.14 17.56 i0,000 4.80
3 2.13 0.409 1.021 0.070 11.71 17.98 18.65 11,000 6.364 2.39 0.437 1.091 0.00 12.18 19.32 20.44 12,000 8.335 2.84 0.477 1.191 0097 13.01 21.55 22.87 8,000 12.136 3.37 0.516 1.288 14.04 24.19 25.43 5,000 15.007 3.92 0.546 1.363 0065 15.03 26.67 27.94 2,500 26.008 4.47 0.572 1.428 16.09 29.21 31.46 2,500 36.80
0.092 31.46 2,500 36.809 5.39 0.609 1.520 17.99 33.70 37.360.112 37.36 1,525 73.4410 7.05 0.654 1.632 21.14 41.02 500 73411 8.7950011 8.79 ---- ---

Table D-4 Specimen 18A-A-CP b. International Units (S.I.)
Spec No. Environment B, cm W, cm Pmax' N Pmin, N
18A-A-CP 2190K 2.545 6.342 17,800 900
x C a/W a, Aa, Y AK AK AN da/dn
nm/N cm cm MN/m3 / 2 MN/m3/2 cycle nm/cycle
1 10.28 0.371 2.352 0.119 11.20 17.99 18.42 12,000 100
2 11.19 0.390 2.471 0.122 11.44 18.93 19.29 10,000 122
3 12.16 0.409 2.593 11.71 19.76 20.49 11,000 1624 13.65 0.437 2.771 0.178 12.18 21.23 22.46 12,000 212
5 16.22 0.477 3.025 0.246 13.01 23.68 25.13 8,000 308
19.24 0.516 3.272 0.191 14.04 26.58 27.94 5,000 381
7 22.38 0.546 3.462 0.165 15.03 29.30 30.70 2,500 660
8 25.52 0.572 3.627 0.234 16.09 32.10 2,500 935
9 30.78 0.609 3.861 0.285 17.99 37.03 41.05 1,525 1,865
10 40.26 0.654 4.145 21.14 45.07 50011 50.19

Table D-5 Specimen 24C-A-CP a. U.S. Customary Units
Spec. No. Environment B, in. W, in. P ax, lb P in' lb
24C-A-CP -65 F 1.002 2.498 5,000 200
x C, a/W a, Aa, Y AK AKAV, AN da/dN
in./lb in. in. ksi/ T . ksiN/Vn. cycles pin./cycle
1 1.90 0.383 0.957 0.050 11.35 21.28 21.83 4,000 12.502 2.07 0.403 1.007 0.047 11.62 22.37 22.92 5,000 9.403 2.25 0.422 1,054 0.085 11.92 23.46 24.57 5,000 17.004 2.59 0.456 1.139 0.093 12.55 25.67 27.10 5,000 18.605 3.05 0.493 1.232 0.072 13.40 28.52 29.83 2,000 36,006 3.47 0.522 1.304 0.080 14.22 31.137 4.06 0.554 1.384 0.097 15.34 34.61 37.27 1,200 80.838 4.95 0.593 1.481 0.090 17.11 39.3243.12 600 150.009 6.04 0.629 1.571 19.26 46.31
Table D-6 Specimen 8A-H-CP a. U.S. Customary Units
Spec. No. Environment B, in. W, in. Pmax' lb P in lb
8A-H-CP -65 F 1.005 2.502 2,500 200
x C, a/W a, Aa, Y AK AKAV, AN da/dN
Ain./lb in. in. ksi/TIn, ksi -Vn cycles Ain./cycle
1 1.75 0.365 0.913 11.13 9.73 9.79 37,000 0.322 1.79 0.370 0.925 0.060 11.19 9.84 10.14 37,000 1.620.060 10.14 37,000 1.623 2.00 0.394 0.985 11.49 10.44 10.74 25,000 2.204 2.20 0.416 1.040 0.048 11.82 11.03 11.41 25,000 1.92
01048 11.41 25,000 1.92
5 2.38 0.435 1.088 0,035 12.15 11.59 11.81 30000 1.170.035 11.81 30,0006 2.52 0.449 1.123 0.070 12.41 12.03 12.52 25,000 2.807 2.84 0.477 1.193 0.067 13.01 13.00 13.53 20,000 3.358 3.20 0.504 1.260 0.043 13.69 14.06 14.43 11,500 3.749 3.46 0.521 1.303 0.082 14.19 14.81 15.67 13,000 6.3110 4.08 0.554 1.385 0.058 15.34 16.52 17.23 8,000 7.2511 4.58 0.577 1.443 0.067 16.32 17.94 18.92 6,000 11.17
12 5.24 0.604 1.510 17.70 19.90 4,550 ---13 8.30 ....---.

Table D-5 Specimen 24C-A-CP b. International Units (S.I.)
Spec No. Environment B, cm W, cm P max N Pmin N
24C-A-CP 2190K 2.545 6.345 22,200 900
x C a/W a, Aa, Y AK AKAV AN da/dn
nm/N cm cm MN/m3/2 MN/m3/2 cycle nm/cycle
1 10.85 0.383 2.430 0.127 11.35 23.99 23.99 4,000 3182 11.82 0.403 2.558 0.119 11.62 24.58 25.18 5,000 2390.119 25.18 5,000 2393 12.84 0.422 2.678 0.216 11.92 25.78 27.00 5,000 432
4 14.79 0.456 2.893 0.236 12.55 28.21 29.78 5,000 4725 17.42 0.493 3.129 0.183 13.40 31.34 32.78 2,000 9146 19.81 0.522 3.312 0.183 14.22 34.21 36.12 1,800 1,1297 23.18 0.554 3.515 0.246 15.34 38.0340.95 1,200 2,0538 20.27 0.593 3.762 0.229 17.11 43.20 47.38 600 3,8109 34.49 0.629 3.990 19.26 50.89
Table D-6 Specimen 8A-H-CP b. International Units (S.I.)
Spec No. Environment B, cm W, cm Pax N Pin N
8A-H-CP 2190K 2.553 6.355 11,100 900
x C a/W a, Aa, Y AK AKAV AN da/dn
nm/N cm cm MN/m3/2 MN/m3/2 cycle nm/cycle
1 9.99 0.365 2.431 0.031 11.13 10.69 10.76 37,000 82 10.22 0.370 2.350 0.152 11.19 10.81 11.14 37,000 43 11.42 0.394 2.502 0.14052 11.49 11.47 11.14 37,000 414 12.56 0.416 2.642 0.122 11.82 12.12 12.55 25,00 495 13.59 0.435 2.764 0.089 12.15 12.74 12.98 30,000 306 14.39 0.449 2.852 0.178 12.41 13.22 13.76 25,000 717 16.21 0.477 3.030 0.178 13.01 14.28 13.76 25,000 718 18.27 0.504 3.200 0.170 13.69 15.45 14.87 20,000 859 19.76 0.521 3.310 0.109 14.19 16.27 15.86 11,500 95
10 23.30 0.554 3.518 0.208 15.34 18.15 17.22 13,000 16011 26.15 0.577 3.640 0.147 16.32 19.71 18.93 8,000 184
0.170 20.79 6,000 28412 29.92 0.604 3.835 17.70 21.87 4,55013 47.39

Table D-7 Specimen 12B-H-CP a. U.S. Customary Units
Spec. No. Environment B, in. W, in. P , lb P in' lb
12B-H-CP -65 F 1.003 2.500 3000 200
x C, a/W a, Aa, Y AK, AKAV, AN, da/dN
Min./lb in. in. ksi/1 In. ksi/W. cycles pin./cycle
1 1.87 .379 0.947 11.30 12.290.048 12.58 20,000 2.402 2.03 .398 0.995 0060 11.55 12.87 13.27 20,000 3.003 2.25 .422 1.055 0.050 11.92 13.67 14.04 13,000 3.854 2.45 .442 1.105 0080 12.28 14.41 15.07 16,000 5.005 2.81 .474 1.185 12.94 15.73
0.100 16.71 13,000 7.696 3.34 .514 1.285 0.062 13.98 17.69 18.43 7,000 8.867 3.77 .539 1.347 0.058 14.78 19.16 19.95 3,500 16.57058 19.95 3,500 16.578 4.23 .562 1.405 0.085 15.66 20.73 22.14 2,000 42.509 5.03 .596 1.490 17.27 23.54
Table D-8 Specimen 13C-H-CP a. U.S. Customary Units
Spec. No. Environment B, in. W. in. P , lb P in' lb
13C-H-CP -650F 1.008 2.475 3,5000 200
x C, a/W a, Aa, Y AK, IKAV, AN, da/dN
pin./lb in. in. ksiN/Tn. ksiV~,/T. cycles pin./cycle
1 1.81 0.371 0.918 11.20 14.202 1.94 0.388 0.960 0.042 11.41 14.79 14.50 12,000 3.503 2.17 0.413 1.022 0.062 11.78 15.75 15.27 15,100 4.11
4 2.39 0.436 1.079 0.057 12.16 16.71 16.23 10,000 5.70
5 2.82 0.475 1.176 0.097 12.96 18.58 17.64 10,000 9.706 3.27 0.509 1.260 0.084 13.83 20.53 19.56 5,000 16.807 3.64 0.531 1.314 0.054 14.51 21.99 21.26 2,500 21.608 4.08 0.554 1.371 0.057 15.34 23.76 22.87 2,000 28.50
9 5.11 0.599 1.483 0.112 17.43 28.07 25.91 260 431.00

Table D-7 Specimen 12B-H-CP b. International Units (S.I.)
Spec No. Environment B, cm W, cm Pmax' N Pmin' N
12B-H-CP 219 0K 2.548 6.350 13,300 900
x C a/W a, Aa, Y AK AKAV AN. da/dn
nm/N cm cm MN/m3 / 2 MN/m3 / 2 cycle nm/cycle
1 10.68 0.379 2.405 0.122 11.30 13.50 13.82 20,000 612 11.59 0.398 2.527 0.152 11.55 14.14 14.58 20,000 763 12.85 0.422 2.680 0127 11.92 15.02 15.43 13,000 984 13.99 0.442 2.807 0.203 12.28 15..83 16.56 16,000 127
5 16.05 0.474 3.010 0.254 12.94 17.28 18.36 13,000 1956 19.07 0.514 3.264 0152 13.98 19.44 20.25 7,000 2257 21.53 0.539 3.421 0.147 14.78 21.05 21.92 3,500 4218 24.15 0.562 3.569 0.216 15.66 22.78 24.33 2,000 1,0809 28.72 0.596 3.785 17.27 25.86
Table D-8 Specimen 13C-H-CP b. International Units (S.I.)
Spec No. Environment B, cm W, cm Pmax' N Pmin, N
13C-H-CP 2190K 2.560 6.287 15,600 900
x C a/W a, Aa, Y AK AKAV AN da/dn
3/2 3/2nm/N cm cm MN/m3/2 MN/m3/2 cycle nm/cycle
1 10.34 0.371 2.332 11.20 15.60 15.93 12,000 89
2 11.08 0.388 2.405 0.106 11.41 18.25 16.78 15,100 1043 12.39 0.413 2.596 0.145 11.78 17.31 17.83 10,000 1454 13.65 0.436 2.741 0.246 12.16 18.36 19.38 10,000 2465 16.10 0.475 2.987 0.213 12.96 20.42 21.49 5,000 4276 18.67 0.509 3.200 0.13 13.83 22.56 23.36 2,500 549
0.137 14.51 24.167 20.79 0.531 3.338 0.145 14.51 24.16 25.13 2,000 7248 23.30 0.554 3.483 0.285 15.34 26.11 28.47 260 10,9479 29.18 0.599 3.767 17.43 30.84

Table D-9 Specimen 16A-H-CP a. U.S. Customary Units
Spec. No. Environment B, in. W, in. P , lb P., lbmax min'
16A-H-CP -65 F 0.997 2.498 4,000 200
x C, a/W a, Aa, Y AK, AKAV AN da/dN
pin./Ib in, in. ksiVtn. ksiv in. cycles pin./cycles
1 1.73 0.362 0.905 11.10 16.11 16.63 12,000 5.422 1.94 0.388 0.970 11.41 17.14 17.91 11,000 7.73
0.085 17.91 11,000 7.733 2.26 0.422 1.055 11.92 18.67 19.31 5,000 12.600.063 19.31 5,000 12.604 2.51 0.447 1.118 12.37 19.94000 20.000.100 21.12 5,000 20.005 2.97 0.487 1.218 13.26 22.29 22.97 3,5000.050 22.97 3,500 14.306 3.25 0.507 1.268 13.77 23.650.082 24.95 730 112.007 3.81 0.540 1.350 14.82 26.26
Table D-10 Specimen 18B-H-CP a. U.S. Customary Units
Spec. No. Environment B, in. W, in. P , lb P , lbmax main'
18B-H-CP -650F 1.003 2.488 4,500 200
x C, a/W a, Aa, Y AK, AKAV' AN, da/dN
pin./1b in. in. ksiV T,. ksi/,in. cycles Ain./cycles
1 1.70 0.359 0.893 11.07 18.020.045 18.42 6,000 7.502 1.85 0.377 0.938 11.27 18.810.132 20.16 9,000 14.673 2.33 0.430 1.070 12.06 21.50
0.154 23.50 2,600 59.234 3.03 0.492 1.224 13.37 25.50

Table D-9 Specimen 16A-H-CP b. International Units (S.I.)
Spec No. Environment B, cm W, cm P , N Pmin N
16-A-H-CP 2190K 2.532 6.345 17,793 890
x C a/W a, Aa, Y AK AKAV AN da/dn
nm/N cm cm MN/m3/2 MN/m3 / 2 cycle nm/cycle
1 9.88 0.362 2.299 0.165 11.10 17.70 18.27 12,000 1382 11.08 0.388 2.464 11.41 18.83 19.68 11,000 1963 12.91 0.422 2.680 0.160 11.92 20.52 21.22 5,000 3204 14.33 0.447 2.840 0.254 12.37 21.91 23.21 5,000 5085 16.96 0.487 3.094 0.127 13.26 24.49 25.24 3,500 3636 18.56 0.507 3.221 0.208 13.77 25.99 27.42 730 2,8447 21.76 0.540 3.429 14.82 28.85
Table D-10 Specimen 18B-H-CP b. International Units (S.I.)
Spec No. Environment B, cm W, cm Pmax' N Pmin' N
18B-H-CP 2190K 2.548 6.320 20,000 200
x C a/W a, Aa, Y AK AKAV AN da/dn
3 / 2 3 / 2
nm/N cm cm MN/m MN/m cycle nm/cycle
1 9.71 0.359 2.268 0.114 11.07 19.80 20.24 6,000 1902 10.56 0.377 2.383 0.335 11.27 20.67 22.15 9,000 373
3 13.31 0.430 2.718 12.06 23.62 25.82 2,600 1,5044 17.30 0.492 3.109 13.37 28.02

APPENDIX E
Cyclic Crack Growth Data from CompactTension Tests at 3000 F
(4220 K)

Table E-1 Specimen 28B-A-CP a. U.S. Customary Units
Spec No. Environment B, in. W, in. P lb P lbmax' min'
28B-A-CP 300 0F 0.999 2.500 5500 200
x C, a/W a, Aa, Y AK, AKAV, AN, da/dn,
pin./lb in. in. ksiV/n. ksiiV/n. cycles pin./cycle
1 1.85 0.377 0.942 11.27 23.220.031 23.6 4,000 7.7
2 1.95 0.389 0.973 11.43 23.930.047 24.5 2,000 23.5
3 2.12 0.408 1.020 11.70 25.060.035 25.5 2,000 17.5
4 2.25 0.422 1.055 11.92 25.970.055 26.7 2,000 27.5
5 2.47 0.444 1.110 12.31 27.510.055 28.4 2,250 24.4
6 2.71 0.466 1.165 12.76 29.230.033 29.8 1,000 33.0
7 2.86 0.479 1.198 13.05 30.310.062 31.5 1,500 41.3
8 3.19 0.504 1.260 13.69 32.620.020 33.0 700 28.6
9 3.32 0.512 1.280 13.92 33.420.043 34.3 1,000 43.0
10 3.59 0.529 1.323 14.44 35.23
Table E-2 Specimen 2A-A-CP a. U.S. Customary Units
Spec No. Environment B, in. W, in. Pmax lb Pmin lb
2A-A-CP 300OF 1.000 2.505 6000 200
x C, a/W a, Aa, Y AK, AKAV, AN, da/dn
pin./1b in. in. ksivT/e ksi/iVn. cycles pin./cycle
1 2.4 0.410 1.027 11.73 27.510.043 28.12 3,000 14.3
2 2.30 0.427 1.070 12.01 28.730.077 29.97 3,000 25.7
3 2.14 0.458 1.147 12.59 31.210.028 31.69 2,000 14.0
4 2.75 0.469 1.175 12.83 32.17

Table E-1 SpeCimen 28B-A-CP b. International Units (S.I.)
Spec No. Environment B, cm W, cm P max N
28B-A-CP 422 K 2.538 6.350 24,500 900
x C a/W a, Aa, Y AK AKAV aN da/dn
nm/N cm cm MN/m3/2 MN/m3/2 cycle nm/cycle
1 10.56 0.377 2.392 11.27 25.510.079 25.93 4,000 196
2 11.13 0.389 2.471 11.43 26.29,0000.119 26.92 2,000 5973 12.11 0.408 2.591 11.70 27.542 2,0000.089 28.02 2,000 445
4 12.85 0.422 2.680 11.92 28.540.140 29.34 2,000 6995 14.10 0.444 2.819 12.31 30.230.140 31.21 2,250 620
6 15.48 0.466 2.959 12.76 32.120.084 32.74 1,000 8387 16.33 0.479 3.043 13.05 33.01
0.158 34.61 1,500 1,0498 18.22 0.504 3.200 13.69 35.840.051 36.26 700 7269 18.96 0.512 3.251 13.92 36.720.109 37.69 1,000 1,09210 20.50 0.529 3.360 14.44 38.71
Table E-2 Specimen 2A-A-CP b. International Units (S.I.)
Spec No. Environment B, cm W, cm P , N Pmn' Nmax min
x C a/W a, Aa, Y AK AKAV AN da/dn
nm/N cm cm MN/m3/2 MN/m3/2 cycle nm/cycle
1 13.70 0.410 2.609 0.109 11.73 30.23 30.90 3,000 3632 13.33 0.427 2.718 12.01 31.57
0.156 32.93 3,000 6523 12.22 0.458 2.913 12.59 34.29
0.071 34.82 2,000 3564 15.70 0.469 2.985 12.83 35.35

Table E-3 Specimen 9C-A-CP a. U.S. Customary Units
Spec. No. Environment B, in. W, in. P , lb P., lbmax min'
9C-A-CP 3000 F 1.008 2.499 8000 200
x C, a/W a, Aa, Y AK, AKAV, AN, da/dn,
pin./lb in. in. ksiN,- ksiVin. cycles pin./cycle
1 1.73 0.362 0.905 0.035 11.10 32.690.035 33.3 2,000 17.52 1.84 0.376 0.940 11.26 33.820.087 35.3 3,000 29.03 2.15 0.411 1.027 11.74 36.850.045 37.7 2,000 22.5
4 2.32 0.429 1.072 12.04 38.620.055 39.8 1,000 55.05 2.54 0.451 1.127 12.45 40.920.058 42.3 1,000 58.0
6 2.80 0.474 1.185 12.94 43.61 45.6 900 82.20.074 45.6 900 82.27 3.20 0.504 1.259 13.69 47.570.045 48.9 500 90.0
8 3.48 0.522 1.304 14.22 50.260.063 52.4 450 140.09 3.93 0.547 1.367 15.07 54.57
10 4.42 0.570 1.424 0.038 16.00 59.12 60.8 125 304.00.038 60.8 125 304.011 4.77 0.585 1.462 16.70 62.500.015 63.2 75 200.012 4.90 0.591 1.477 17.00 63.970.052 66.8 156 333.313 5.48 0.612 1.529 18.17 69.600.060 73.3 100 600.014 6.29 0.636 1.589 19.75 77.08

Table E-3 Specimen 9C-A-CP b. International Units (S.I.)
Spec No. Environment B, cm W, cm P , N -P ' Nmax min'
9C-A-CP 422oK 2.560 6.348 35,600 900
x C a/W a, Aa, Y AK KAV AN da/dn
nm/N cm cm MN/m3/2 MN/m3/2 cycle nm/cycle
1 9.88 0.362 2.299 0.089 11.10 35.92 36.59 2,000 4452 10.51 0.376 2.388 0.221 11.26 27.16 38.79 3,000 7373 12.28 0.411 2.609 0.114 11.74 40.49 41.43 2,000 5724 13.25 0.429 2.723 0.140 12.04 42.44 43.73 1,000 1,3975 14.50 0.451 2.862 0.147 12.45 44.96 46.48 1,000 1,4736 16.00 0.474 3.010 0.147 12.94 47.92 50.11 900 2,0887 18.27 0.504 3.198 0.144 13.69 52.27 53.73 500 2,2868 14.220.055.1 53.73 500. 2,2868 19.87 0.522 3.312 0.160 14.2257.57 450 3,5569 22.44 0.547 3.472 0.145 15.07 59.96 62.41 275 5,265
10 25.24 0.570 3.617 0.096 16.00 64.96 66.81 125 7,72211 27.24 0.585 3.713 0.096 16.70 68.68 69.44 75 5,08012 27.98 0.591 3.752 0.038 17.00 70.2912 27.98 0.591 3.752 0.132 17.00 70.29 73.40 156 8,46613 31.29 0.612 3.88 0.152 18.17 76.48 80.54 100 15,24014 35.92 0.636 4.036 19.75 84.70

Table E-4 Specimen 14A-A-CP a. U.S. Customary Units
Spec No. Environment B, in. W, in.
14A-A-CP 300F 1.007 2.471
x C, a/W a, Aa, Y AK, AKAV, AN, da/dn
Sin./lb in. in. ksii/in. ksi /in. cycles pin./cycle
P max= 10,000 P = 200
1 1.98 0.392 0.969 11.47 44.450.061 45.9 1,500 40.7
2 2.21 0.417 1.030 11.84 47.360.097 49.9 1,000 97.0
3 2.60 0.456 1.127 12.55 52.44
P = 4,500 P min 200max min
4 4.11 0.556 1.374 15.42 31.240.044 32.3 1,500 29.3
5 4.50 0.574 1.418 16.18 33.300.047 34.5 1,300 36.2
6 4.96 0.593 1.465 17.11 35.780.023 36.4 600 38.3
7 5.20 0.602 1.488 17.59 37.080.014 37.5 500 28.0
8 5.35 0.608 1.502 17.93 37.970.018 38.5 300 60.0
9 5.57 0.615 1.520 18.35 39.090.032 40.2 400 80.0
10 5.99 0.628 1.552 19.19 41.320.017 42.0 300 56.7
11 6.27 0.635 1.569 19.68 42.590.012 43.1 225 53.3
12 6.47 0.640 1.581 20.04 43.570.047 45.6 600 78.3
13 7.28 0.659 1.628 21.55 47.54 50014 8.38

M b. International Units (S.I.)0 Table E-4 Specimen 14A-A-CP
Spec No. Environment B, cm W, cm Pmax' N Pmin' N
14A-A-CP 4220K 2.558 5.514
x C a/W a, Aa, Y AK AKAV AN da/dn
3/2 3/2nm/N cm cm MN/m3/2 MN/m3/2 cycle nm/cycle
N = 44,900 N = 900max min
1 11.31 0.392 2.461 0.158 11.47 48.90 49.98 1,500 1,0342 12.62 0.417 2.616 0.246 11.84 52.04 55.01 1,000 2,4643 14.85 0.456 2.862 12.55 57.62
N = 20,000 N = 900max min
4 23.47 0.556 3.490 0112 15.42 34.33 3549 1,500 7445 25.70 0.574 3.602 0.119 16.18 36.59 37.91 1,300 9206 28.32 0.593 3.721 17.11 39.32 4000 600 9737 29.69 0.602 3.280 0.036 17.59 30.74 41.21 500 7118 30.55 0.608 3.815 0.046 17.93 41.72 42.30 300 1,5249 31.81 0.615 3.861 0.081 18.35 42.95 44.17 400 2,03210 34.20 0.628 3.442 0.043 19.19 45.40 46.15 300 1,44011, 35.80 0.635 3.990 0.035 19.68 46.79 47.36 225 1,35412 36.95 0.640 4.016 0.119 20.04 47.88 50.11 600 1,98913 41.57 -0.659 .135 21.55 52.2414 47.85

Table E-5 Specimen 16B-A-CP a. U.S. Customary Units
Spec No. Environment B, in. W, in. Pmax, lb Pmin' lb
16B-A-CP 300 0 F 1.004 2.505 12,000 200
x C, a/W a, Aa, Y AK, AKAV, AN, da/dn,
Pin./lb in. in. ksi vin. ksivin. cycles pin./cycle
1 1.88 0.381 0.954 11.32 51.900.088 54.27 1,000 88.02 2.19 0.416 1.042 11.82 56.6517 400 207.50.083 59.17 400 207.5
3 2.52 0.449 1.125 12.41 61.69
Table E-6 Specimen 26B-A-CP a. U.S. Customary Units
Spec No. Environment B, in. W, in. P max ib P min, lb
26B-A-CP 300OF 1.002 2.504 14,000 200
x C, a/W a, Aa, Y AK, AKAV, AN, da/dn,
pin./ib in. in. ksiVin. ksiVi n. cycles pin./cycle
1 1.97 0.391 0.979 11.45 62.340.078 64.86 500 156.0
2 2.26 0.422 1.057 11.92 67.380.145 73.13 200 725.0
3 2.87 0.480 1.202 13.08 78.88

Table E-5 Specimen 16B-A-CP b. International Units (S.I.)
Spec No. Environment B, cm W, cm P m N Pin Nmax min
16B-A-CP 4220K 2.550 6.363 53,400 900
x C a/W a, Aa, Y AK AKAV AN da/dn
nm/N cm cm MN/m3/2 MN/m3/2 cycle nm/cycle
1 10.74 0.381 2.423 11.32 57.032 12.51 0.416 2.647 0.223 11.82 62.253 14.39 0.449 2.858 12.41 67.78 65.01 400 5,270
Table E-6 Specimen 26B-A-CP b. International Units (S.I.)
Spec No. Environment B, cm W, cm Pax , N Pmin N
26B-A-CP 4220K 2.545 6.360 62,300 900
x C a/W a, Aa, Y AK AKAV AN da/dn
nm/N cm cm MN/m3/2 MN/m3/2 cycle nm/cycle
1 11.25 0.391 2.487 11.45 68.500.198 71.27 500 3,9622 12.91 0.422 2.685 11.92 74.040.368 80.36 200 18,4153 16.39 0.480 3.053 13.08 66.67

Table E-7 Specimen 23B-H-CP a. U.S. Customary Units
Spec No. Environment B, in. W, in. P lb P. , lb
23B-H-CP 300 0F 0.908 2.503 3700 200
x C, a/W a, Aa, Y AK, AKAV, AN, da,dn,
I in./lb in. in. ksi /Vn. ksivi cycles pin./cycle
1 1.85 0.377 0.944 11.27 16.860.032 17.1 7,000 4.6
2 1.96 0.390 0.976 11.44 17.400.058 17.9 10,000 5.8
3 2.17 0.413 1.034 11.78 18.450.035 18.8 5,000 7.0
4 2.30 0.427 1.069 12.01 19.135 2.44 0.441 1.104 0.057 12.26 19.84 20.5 5,200 11.0
0.057 20.5 5,200 11.06 2.68 0.464 1.161 12.72 21.10
0.045 21.7 4,000 11.37 2.89 0.482 1.206 13.12 22.20
0.028 22.6 2,500 11.28 3.04 0.493 1.234 13.40 22.930.040 23.5 3,000 13.39 3.27 0.509 1.274 13.83 24.05
0.053 24.9 4,000 13.310 3.61 0.530 1.327 14.48 25.68
Table E-8 Specimen 7A-H-CP a. U.S. Customary Units
Spec No. Environment B, in. W, in. Pmax' lb P min' lb
7A-H-CP 300OF 1.003 2.503 4500 200
x C, a/W a, Aa, Y AK, AKAV, AN, da/dn,
pin./lb in. in. ksiVi/, ksii/Vin cycles pin./cycle
1 1.81 0.372 0.931 11.21 18.540.045 18.94 9,000 5.0
2 1.96 0.390 0.976 11.44 19.35210.065 20.02 9,000 7.2
S 3 2.19 0.416 1.041 11.82 20.68

Table E-7 Specimen 23B-H-CP b. International Units (S.I.)
Spec No. Environment B, cm W, cm Pax' N Pmin' N
23B-H-CP 4220 K 2.306 6.358 16,500 900
x C a/W a, Aa, Y AK AKAV AN da/dn
nm/N cm cm MN/m3/2 MN/m3/2 cycle nm/cycle
1 10.56 0.377 2.398 0081 11.27 18.53 18.79 7,000 117
2 11.19 0.390 2.479 0.147 11.44 17.40 19.67 10,000 147
3 12.39 0.413 2.626 0.089 11.78 20.27 5,000 1784 13.13 0.427 2.715 0.089 12.0121.43 4,500 198
0.089 21.435 13.43 0.441 2.804 0.145 12.26 21.80 22.53 5,200 279
6 15.30 0.464 2.951 0.114 12.72 3.18 23.84 4,000 287
7 16.50 0.482 3.063 0.071 13.12 22.20 24.83 2,500 284
.8 17.35 0.493 3.134 0.102 13.40 5.20 25,82 3,000 338
9 18.67 0.509 3.235 0.135 13.83 6.43 27.36 4,000 33810 20.61 0.530 3.371 14.48 8 . 72
Table E-8 Specimen 7A-H-CP b. International Units (S.I.)
Spec No. Environment B, cm W, cm P ax N Pmin' N
7A-H-CP 4220 K 2.548 6.358 20,000 900
x C a/W a, Aa, Y 4K AKAV AN da/dn
nm/N cm cm /m 3 / 2 MN/m3 / 2 cycle nm/cycle
1 10.34 0.372 2.365 0.114 11.21 0.37 20.81 9,000 1272 11.19 0.390 2.379 0.165 11.44 1.26 22.00 9,000 183
0.165 22.00 9,000 1833 12.51 0.416 2.644 11.82 2.72

Table E-9 Specimen 8B-H-CP a. U.S. Customary Units
Spec No. Environment B, in. W, in. P lb P. , lbmax' min'
8B-H-CP 300 0F 1.006 2.501 5000 200
x C, a/W a, Aa, Y AK, AKAV, AN, da/dn,
iin./lb in. in. ksiiN,/ ksiviSE cycles pin./cycle
1 1.71 0.359 0.898 11.07 20.00.040 20.4 9,000 4.4
2 1.83 0.375 0.938 11.25 20.80.077 21.6 10,000 7.7
3 2.11 0.406 1.015 11.67 22.40.053 23.0 5,000 10.6
4 2.30 0.427 1.068 12.01 23.75 2.46 0.443 1.108 0.107 12.29 24.7 26.3 1,500 71.3
0.107 26.3 1,500 71.36 2.95 0.486 1.215 13.22 27.8
0.041 28.5 1,800 22.87 3.17 0.502 1.256 13.64 29.2
Table E-10 Specimen 14C-H-CP a. U.S. Customary Units
Spec No. Environment B, in. W, in. P lb P i lb
14C-H-CP 3000F 1.001 2.498 6000 200
x C, a/W a, Aa, Y AK, AKAV, AN, da/dn,
1iin./lb in. in. ksi Vi- ksilV/-, cycles pin./cycle
1 1.73 0.361 0.902 11.09 24.40.052 25.1 5,000 10.4
2 1.89 0.382 0.953 11.34 25.70.100 27.0 7,000 14.3
3 2.26 0.422 1.054 11.92 28.40.075 29.6 3,000 25.0
4 2.55 0.452 1.129 12.47 30.70.023 31.1 3,000 7.7
5 2.65 0.461 1.152 12.65 31.50.109 33.6 1,000 109.06 3.21 0.505 1.261 13.72 35.70.048 36.8 800 60.07 3.51 0.524 1.309 14.28 37.9
0.047 39.1 400 117.58 3.84 0.543 1.356 14.92 40.3
0.025 41.0 200 125.09 4.05 0.553 1.381 0.025 15.30 41.7
10 4.97 0.594 1.484 17.16 48.4

Table E-9 Specimen 8B-H-CP b. International Units (S.I.)
Spec No. Environment B, cm W, cm Pmax' N Pmin' N
8B-H-CP- 4220 K 2.555 6.352 22,200 900
x C a/W a, Aa, Y AK AV AN da/dn
nm/N cm cm MN/m MN/m3 / 2 cycle nm/cycle
1 5.76 0.359 2.281 0.102 11.07 21.98 22.42 9,000 112
2 10.45 0.375 2.383 0.196 11.25 22.8623.73 0,000 196
0.135 25.27 5,000 2693 12.05 0.406 2.378 0.135 12.01.67 24.61 25.27 5,000 269044 13.13 0.427 2.712 0.102 12.01 25.04 26.59 7,000 145
14.05 0.443 2.814 0.272 12.29 27.14 28.90 1,500 1,8116 16.84 0.486 3.086 0.102 13.22 30.55 1,800 579
7 18.10 0.502 3.086 13.64 32.08
Table E-10 Specimen 14C-H-CP b. International Units (S.I.)
Spec No. Environment B, cm W, cm Pmax' N Pmin' N
14C-H-CP 4229K 2.543 6.345 26,700 900
x C a/W a, Aa, Y AK AKAV AN da/dn
3/2 3/2nm/N cm cm MN/m3/2 MN/m cycle nm/cycle
1 9.88 0.361 2.291 0.132 11.09 26.81 27.58 5,000 264
2 10.79 0.382 2.321 11.34 28.240.254 29.67 7,000 3630.191 32.52 3,000 6353 12.90 0.422 2.678 12.47 31.21 32.52 3,000 63573
4 14.56 0.452 2.868 0.058 12.47 33.73 34.17 3,000 1965 15.13 0.461 2.926 0.277 12.65 34.611,000 2,769
6 18.33 0.505 3.202 0.122 13.72 39.23 36.92 800 1,5247.3 00 3200.122 14.28 41.64
7 20.04 0.524 3.325 0.199 14.28 41.64 40.44 400 2,9858 21.93 0.543 3.444 0.064 14.92 44.28 45.05 200 3,1759 28.84 0.553 3.508 0.262 49.56 150 17,44210 28.38 0.594 3.769 17.16 53.18

Table E-11 Specimen 19B-H-CP a. U.S. Customary Units
Spec No. Environment B, in. W, in. P max lb Pmin' lb
19B-H-CP 300 0F 1.007 2.495 7000 200
x C, a/W a, Aa, Y AK, AKAV, AN, da/dn,
pin./Ib in. in. ksi/1n. ksiN/I n cycles pin./cycle
1 1.82 0.373 0.931 0.052 11.23 29.32 30.1 4,000 13.02 1.99 0.394 0.983 11.49 30.85
0.082 32.2 3,000 27.33 2.29 0.427 1.065 0.058 12.01 33.55 34.6 2,000 29.04 2.53 0.450 1.123 0.035 12.43 35.64 36.3 2,000 17.55 2.68 0.464 1.158 12.72 37.01
0.119 39.8 550 216.46 3.31 0.512 1.277 0.065 13.92 42.57 250 260.07 3.75 0.538 1.342 14.75 46.248 4.02 0.551 1.375 15.22 48.30
Table E-12 Specimen 27C-H-CP a. U.S. Customary Units
Spec No. Environment B, in. W, in. P max Ilb Pmin' lb
27C-H-CP 3000 F 0.948 2.499 8000 200
x C, a/W a Aa, Y AK, AKAV, AN, da/dn,
pin./lb in. in. ksiv4i- ksivi n cycles pin./cycle
1 1.88 0.381 0.952 11.32 36.380.073 37.73 2,000 36.5
2 2.14 0.410 1.025 11.73 39.09 40.78 1,000 80.03 2.45 0.442 1.105 0.144 12.28 42.47 46.21 750 192.04 3.14 0.500 1.249 13.58 49.96
iO

Table E-11 Specimen 19B-H-CP b. International Units (S.I.)
Spec No. Environment B, cm W, cm P ax, N Pin' N
19B-H-CP 4220K 2.558 6.338 31,100 900
x C a/W a, Aa, Y AK AKAV AN da/dn
3/2 3/2nm/N cm cm MN/m3/2 MN/m3/2 cycle nm/cycle
1 10.39 0.373 2.365 11.23 32.210.132 33.07 4,000 3302 11.36 0.394 2.500 11.49 33.900.208 35.38 3,000 6933 13.08 0.427 2.705 12.01 36.870.147 38.02 2,000 7374 14.45 0.450 2.852 12.43 39.16 2,0000.089 39.89 2,000 4455 15.30 0.464 2.941 12.72 40.6700.302 43.73 550 5,4976 18.90 0.512 3.243 13.92 46.780.165 48.79 250 6,6047 21.44 0.538 3.409 14.75 50.81 51.97 68 12,327
8 22.96 0.551 3.492 15.22 53.07
Table E-12 Specimen 27C-H-CP b. International Units (S.I.)
Spec No. Environment B, cm W, cm Pmax' N Pmin' N
27C-H-CP 4220K 2.408 6.348 35,600 900
x C a/W a, Aa, Y dK KAV LN da/dn
nm/N cm cm MN/m3/2 MN/m3/ 2 cycle nm/cycle
1 10.74 0.381 2.418 11.32 39.970.185 41.46 2,000 9272 12.22 0.410 2.604 11.73 42.950.203 44.81 1,000 2,0323 13.99 0.442 2.807 12.28 46.670.366 50.78 750 4,8774 17.92 0.500 3.173 13.58 54.90