development of a rapid diagnostic platform for … · development of a rapid diagnostic platform...
TRANSCRIPT
DEVELOPMENT OF A RAPID DIAGNOSTIC PLATFORM
FOR NUCLEIC ACID TESTING OF INFECTIOUS
PATHOGENS
Vorgelegt von
Diplom-Ingenieur
Pranav Patel
aus Ahmedabad
Von der Fakultät III – Prozesswissenschaft
der Technischen Universität Berlin
zur Erlangung des akademischen Grades
Doktor der Ingenieurwissenschaften
‐Dr.‐Ing.‐
genehmigte Dissertation
Promotionsauschuss: Vorsitzender: Prof. Dr.-Ing. Vera Meyer Berichter: Prof. Dr. Matthias Niedrig Berichter: Prof. Dr. Roland Lauster Berichter: Prof. Dr. Jens Kurreck Tag der wissenschaftliche Aussprache: 16. August 2012
Berlin 2012 D 83


The presented Ph.D. thesis was conducted from June 2009 to July 2012 at Robert Koch
Institute, Berlin, Germany under supervision of Prof. Dr. Matthias Niedrig.


I
DECLARATION OF AUTHORSHIP
I certify that the work presented here is, to the best of my knowledge and belief, original
and the result of my own investigations, except as acknowledged. The present work has
not been submitted, either in part or completely, for a degree at this or any other
University.
Date: _______________ Sign: _______________

III
ABSTRACT
Multiple factors, including climate change, economic development, human demographics
and behavior, international tourism and global trade, have contributed to the emergence
and spread of infectious diseases in many countries worldwide thus becoming a major
public health problem. Besides the natural incidents, the potential use of infectious
pathogens for bioterror attack is an additional risk to the human population. Anthrax,
severe acute respiratory syndrome (SARS), dengue (DEN), malaria, yellow fever (YF),
west nile (WN) fever, bird flu (H5N1), swine flu (H1N1 2009), and hemolytic uremic
syndrome and bloody diarrhea (e.g. EHEC O104:H4) are some of the recent emerging
and re-emerging infectious diseases that have caused outbreaks of human diseases.
The burden of morbidity and mortality associated with these infectious diseases affects
the human population globally and causes widespread social panic.
The recent advances in biochemical methods and microfluidic technologies open a new
perspective for point-of-care diagnostics of infectious pathogens. This can eliminate the
high complexity associated with molecular testing currently performed in large hospitals,
reference- and research-laboratories. However, cost‐effectiveness, commercial
availability, automation, and integrated diagnostic platforms are still the essential targets
to develop affordable diagnostic tests.
This thesis focuses on the establishment of novel biochemical methods and the
development of diagnostic platforms for the rapid detection of infectious diseases. All the
important methods of nucleic acid testing including sample pre-treatment, sample
preparation, nucleic acid amplification, and detection have been developed to overcome
the major existing problems for the development of molecular diagnostics and tested for
the rapid detection of recent emerging and re-emerging infectious pathogens.
This work presents the achievements made towards establishing molecular diagnostic
platforms ranging from high-tech to a simple platform using the existing and newly
developed nucleic acid detection techniques. On one hand, an automated microfluidic
diagnostic platform was developed utilizing a novel sample preparation and isothermal
amplification technologies for biodefense applications. On the other hand, the same
techniques were combined with existing simple biosensor devices such as fluorescence
readers and lateral flow strips to develop molecular diagnostics of emerging and re-
emerging pathogens such as influenza viruses and flaviviruses. Some of these
techniques were successfully applied for the molecular diagnostics of infectious diseases
in reference laboratories and low-resource settings, while other techniques are going to
be tested under real conditions for the detection of infectious pathogens.
In conclusion, simple and accurate diagnostic tests were developed to combat the
infectious diseases, and alternative approaches were explored in order to make these
techniques available and accessible to wider range of people. Furthermore, some of
these diagnostic methods could be an useful tool for the detection of emerging and re-
emerging diseases. They would have a beneficial impact on public health care permitting
the important assistance for patient management, disease surveillance, epidemiological
studies, and rapid identification of infectious diseases in emergencies.

V
ZUSAMMENFASSUNG
Mehrere Faktoren wie z.B. die Klimaveränderung, die wirtschaftliche und demographische Entwicklung, menschliches Verhalten sowie internationaler Tourismus und Handel, haben weltweit zum Auftreten und zur Ausbreitung von Infektionskrankheiten geführt. Dies hat in vielen Ländern zu einem großen Problem der öffentlichen Gesundheit beigetragen. Die potenzielle Nutzung von Infektionserregern für bioterroristische Angriffe ist neben dem natürlichen Auftreten der Erreger ein zusätzliches Risiko für die Bevölkerung. Anthrax, schweres akutes Atemnotsyndrom (SARS), Dengue (DEN), Malaria, Gelbfieber (YF), West-Nil (WN), Vogelgrippe (H5N1), Schweinegrippe (H1N1 2009), hämolytisch-urämisches Syndrom und blutiger Durchfall (z.B. EHEC O104: H4) sind einige der kürzlich aufgetretenen „Emerging“ und „Re-emerging“ Infektionskrankheiten, die Krankheitsausbrüche beim Menschen verursacht haben. Die mit diesen Infektionskrankheiten verbundene Belastung durch Morbidität und Mortalität betrifft die menschliche Population weltweit und verursacht oft soziale Ängste.
Die aktuellen Fortschritte von biochemischen Methoden und Mikrofluidik-Technologien öffnen eine völlige neue Perspektive bei der Point-of-Care-Diagnostik für Infektionserreger. Die momentan angwendeten molekularen Teste sind sehr Komplex und daher können sie derzeit nur in großen Krankenhäusern, Referenz- und Forschungs-Laboren durchgeführt werden. Die wesentlichen Aufgaben zur Entwicklung günstiger diagnostischer Teste wären daher Wirtschaftlichkeit, kommerzielle Verfügbarkeit, Automatisierung und integrierte Diagnostik-Plattformen.
In dieser Arbeit geht es um die Etablierung neuer biochemischer Methoden und um die Entwicklung von diagnostischen Plattformen für die schnelle Erkennung von Infektionskrankheiten. Hierzu wurden wichtige Methoden der Nukleinsäure-Testung einschließlich Probenaufreinigung, Probenvorbereitung, Nukleinsäureamplifikation und Detektion weiterentwickelt, um die bestehenden Probleme der molekularen Diagnostik zu überwinden. Mit dieser neuen Methode wurde dann die schnelle Erkennung einiger kürzlich aufgetretener „Emerging“ und „Re-emerging“ Infektionserreger getestet.
Diese Arbeit präsentiert die erfolgreichen Schritte zur Etablierung von molekulardiagnostischen Plattformen (von „High-Tech“ bis zu einfacheren Plattformen) durch Nutzung von bestehenden und neu entwickelten Nukleinsäure-Nachweis-Techniken. Zum einen wurde eine automatisierte diagnostische Plattform basierend auf Mikrofluidik entwickelt. Dabei wurde eine neuartige Probenvorbereitung und isothermale Amplifikationstechnologie zwecks biologischer Sicherheit eingesetzt. Zum anderen wurden die gleichen Techniken mit vorhandenen einfachen Biosensoren wie Fluoreszenzdetektoren und Lateral-Flow-Streifen kombiniert, um die molekulare Diagnostik von „Emerging“ und „Re-emerging“ Infektionserregern wie Flavi-Viren und Influenza-Viren zu entwickeln. Einige dieser Techniken wurden erfolgreich zur molekularen Diagnostik von Infektionskrankheiten sowohl in Referenzlaboratorien als auch in einfach ausgestatteten Einrichtungen angewendet, wo auch zukünftig andere Techniken unter realen Bedingungen zur Erkennung von Infektionserregern getestet werden sollen.
Zusammengefasst sind einfache und präzise diagnostische Teste zur Bekämpfung von Infektionskrankheiten entwickelt worden. Dazu wurden auch alternative Ansätze entwickelt, um Verfügbarkeit und Zugang zu dieser Technik auch für wenig entwickelte Gebiete mit Bedarf zu erleichtern. Darüber hinaus eignen sich einige dieser diagnostischen Verfahren als nützliches Werkzeug zum Nachweis von „Emerging“ und „Re-emerging“ Krankheiten und können für die öffentliche Gesundheitsversorgung

vorteilhaft sein. Sie könnten eine wichtige Hilfe für Patienten-Management, Überwachung von Krankheiten und epidemiologische Studien sein, sowie die schnelle Identifizierung von Infektionskrankheiten in Notfällen ermöglichen.
VII
ABBREVIATIONS
µTAS Micro-total-analytical systems
BA Bacillus anthracis
BHQ Black hole quenchor
CDC Centre of Disease Control and Prevention
ChikV Chikungunya virus
CMC Carboxy methyl cellulose
CP 19 Camelpox virus 19
CPE Cytopathic effects
Ct Threshold cycle
ddNTP Dideoxynucleotide
DENV Dengue virus
ELISA Enzyme-linked immunosorbent assay
FAM 6-carboxy-fluorescine
FCS Fetal calf serum
Ftu Francisella tularensis
GAPDH Glyceraldehyde-3-phosphate dehydrogenase
Geq Genome equivalents
HA Haemagglutanin
HDA Helicase dependent amplification
IFA Immunofluorescence assay
IVD in-vitro diagnostics
ivRNA in vitro transcribed RNA
JEV Japanese Encephalitis virus
LAMP Loop-mediated amplification
LFS Lateral flow stripe
LNA Locked nucleotide
LOC Lab-on-chip
MAGs Magnetic beads
MARV, MbgV Marburg virus
MDx Molecular disgnostics
MGB Minor groove binder
NALF Nucleic acid based lateral flow assay
NASBA Nucleic acid sequence based amplification
NAT Nucleic acid testing
Pan-Flavi assay Pan-Flavivirus real-time RT-qPCR
PCR Polymerase chain reaction
PFU Plaque forming units
PK Proteinase K
PRNT Plaque reduction neutralization tests
RAH Rapid amplification/hybridization
real-time qPCR Quantitative real-time PCR
real-time RT-qPCR Quantitative real-time RT-PCR
RPA Recombinase polymerase amplification
RSSEV Russian Spring Summer Encephalitis virus
RT-PCR reverse transcriptase-polymerase chain reaction
RVFV Rift valley fever virus
rxn Reactions
SAEs Severe adverse events
SARS Severe acute respiratory syndrome
SDA Strand displacement amplification
SigV Sigma virus
SLEV Saint Louis encephalitis virus
S-OIV A Swine-origin influenza A
SONDE Szenario-orientierte Notfall Diagnostik für den Feld Einsatz
TBEV Tick-borne encephalitis virus
TCID 50 Tissue Culture Infection Dose 50
THF Tetrahydrofuran
TMA Transcription-mediated amplification
USUV Usutu virus
VACV Vaccinia virus
WHO World health organisation
WNV West nile virus
YFV Yellow fever virus
Ype Yersinia pestis
ZEBO Ebola virus Zaire
IX
PUBLICATIONS
Parts of this work have been published at the following journals or conferences
Publications related to this Work
1. RapidSTRIPE H1N1 test for detection of the pandemic swine origin influenza A (H1N1) virus. Patel P, Graser E, Robst S, Hillert R, Meye A, Hillebrand T, Niedrig M. J Clin Microbiol. 2011 Apr; 49(4):1591-3. Epub 2011 Jan 19.
2. Molecular diagnosis of flaviviruses. Domingo C, Patel P, Linke S, Achazi K, Niedrig M. Future Virology 6 (9): 1059-1074.DOI 10.2217/fvl.11.77 (2011).
3. Development of one-step quantitative reverse transcription PCR for the rapid detection of flaviviruses. Patel P, Landt O, Kaiser M, Faye O, Koppe T, Lass U, Sall AA, Niedrig M Virology Journal in progress
Other Publications
4. RNA interference inhibits replication of tick-borne encephalitis virus in vitro. Achazi K, Patel P, Paliwal R, Radonić A, Niedrig M, Donoso-Mantke O. Antiviral Res. 2012 Jan; 93(1):94-100. Epub 2011 Nov 9.
5. Advanced yellow fever virus genome detection in point-of-care facilities and reference laboratories. Domingo C, Patel P, Yillah J, Weidmann M, Méndez JA, Nakouné ER, Niedrig M. Clinical Microbiology in accepted
Conferences
1. Enrichment of viruses by AJ enrichment kit Pranav Patel, Timo Hillebrand & Niedrig M Presented as a talk at Life Science Conference, 05.05.-06.05.2010, Jena
2. Development Of A Rapid Diagnostic Platform For Detection Of Category A Biothreat Pathogens In The Field Pranav Patel, Manfred Weidmann, Katharina Achazi, Sonja Linke, Oliver Strohmeier, Daniel Mark, Thomas van Oordt, Josef Drexler, Michael Eberhard, Felix von Stetten and Matthias Niedrig Presented as a poster at 10th ASM Biodefence and Emerging Diseases conference, Washington DC, USA, 2012 & BMBF-Innovationsforum "Zivile Sicherheit" Berlin, Germany

XI
CONTENTS
Abstract _____________________________________________________________ III
Zusammenfassung ____________________________________________________ V
Abbreviations ________________________________________________________ VII
Publications _________________________________________________________ IX
Acknowledment ______________________________________________________ XV
Background _________________________________________________________ 17
Infectious pathogens ________________________________________________ 17
Molecular diagnostics of infectious diseases ____________________________ 19
Objectives of this Ph.D. thesis ________________________________________ 23
Chapter 1. Integrated microfluidic diagnostic Platform ___________________ 25
Development of a rapid diagnostic platform for detection of category A Biothreat
pathogens in the field _______________________________________________ 25
A Introduction ___________________________________________________ 27
A.1 Biological Threat Agents ____________________________________________ 27
A.2 Integrated Molecular Diagnostic platform _______________________________ 29
A.3 Lab-on-chip platform for nucleic acid testing _____________________________ 30
A.4 Centrifugal LabDisc platform for Nucleic acid testing_______________________ 32
A.5 Aim of this study __________________________________________________ 34
B Materials and Methods ___________________________________________ 36
B.1 Cell culture _______________________________________________________ 36
B.2 Classic virology methods ____________________________________________ 37
B.3 Sample pre-treatment ______________________________________________ 39
B.4 Purification of nucleic acids __________________________________________ 41
B.5 Nucleic acid amplification and detection ________________________________ 42
B.6 Quantitative Taqman real-time PCR ___________________________________ 44
B.7 Recombinase polymerase amplification for nucleic acid amplification __________ 46
B.8 Centrifugal LabDisc platform _________________________________________ 48
B.9 Cloning of DNA fragments and preparation of standard plasmid for PCR _______ 50
B.10 Transformation with the calcium chloride method _________________________ 51
B.11 DNA sequencing __________________________________________________ 51
C Results _______________________________________________________ 53
C.1 Development of methods for the Lab-on-chip platform _____________________ 53
C.2 Development and optimizing NAT methods for the Centrifugal LabDisc platform _ 56
D Discussion ____________________________________________________ 73
D.1 Development of methods for the Lab-on-chip platform _____________________ 73
D.2 Development of molecular methods for the Centrifugal LabDisc platform _______ 74
D.3 Establishment and Optimization of nucleic acid detection ___________________ 79
D.4 “Sample to Answer” testing of RPA LabDisc for the detection of biothreat agents_ 80
Chapter 2. Real-time PCR platform ____________________________________ 83
Development of one-step real-time reverse transcription PCR for the rapid
detection of flaviviruses _____________________________________________ 83
A Introduction ___________________________________________________ 85
A.1 Flaviviruses ______________________________________________________ 85
A.2 Diagnosis of flaviviruses _____________________________________________ 86
A.3 Aim of this study ___________________________________________________ 88
B Materials and Methods __________________________________________ 89
B.1 Viruses and isolation of viral RNA _____________________________________ 89
B.2 Taqman primers and probe __________________________________________ 89
B.3 Pan-Flavivirus real-time RT-PCR assay _________________________________ 90
B.4 Specific real-time RT-PCR for different flaviviruses ________________________ 91
C Results _______________________________________________________ 93
C.1 Design and optimization of Pan-Flavi assay _____________________________ 93
C.2 Evaluation of specificity of the Pan-Flavi assay ___________________________ 95
C.3 Evaluation of sensitivity of the Pan-Flavi assay ___________________________ 95
C.4 Comparison of the Pan-Flavi assay with virus species-specific real-time RT-PCR 95
D Discussion ____________________________________________________ 98
Chapter 3. RapidSTRIPE Detection System ____________________________ 101
RapidSTRIPE H1N1 test for diagnosis of the pandemic swine-origin Influenza A
(H1N1) ___________________________________________________________ 101
A Introduction __________________________________________________ 103
A.1 Swine Origin Influenza A (H1N1) virus _________________________________ 103
A.2 Diagnosis of S-OIV A (H1N1) ________________________________________ 103
A.3 Aim of this study __________________________________________________ 104
B Materials and Methods _________________________________________ 105
B.1 Virus strains and clinical specimens ___________________________________ 105
B.2 RNA extraction and cDNA synthesis __________________________________ 105
B.3 Reverse transcription quantitative real-time PCR (RT-qPCR) _______________ 106
B.4 Oligonucleotides for lateral flow strip test ______________________________ 106
B.5 Lateral flow strip (LFS) assay based on nucleic acid amplification ___________ 107
C Results ______________________________________________________ 109
C.1 Sensitivity of the LFS assay and comparison with RT-qPCR _______________ 109
C.2 Specificity of the LFS assay _________________________________________ 110
C.3 Diagnostic performance of the rapidSTRIPE H1N1 Assay KF system ________ 111
C.4 Instrument, cost and work load ______________________________________ 112
D Discussion ___________________________________________________ 114
Chapter 4. Recombinase Polymerase amplification assay for low-resource
settings 117
Recombinase Polymerase amplification assay for the detection of Yellow fever
virus in low-resource settings _______________________________________ 117
A Introduction __________________________________________________ 119
A.1 Yellow fever virus _________________________________________________ 119
A.2 Vaccination and adverse events after vaccination ________________________ 120
A.3 Diagnosis of YFV _________________________________________________ 120
A.4 Aim of this study _________________________________________________ 121
B Materials and Methods __________________________________________ 122
B.1 Viruses and isolation of viral RNA ____________________________________ 122
B.2 Primer and probe for RPA __________________________________________ 122
B.3 Real-time PCR and plasmid standard _________________________________ 122
B.4 Lateral-flow stripe RPA assay _______________________________________ 123
B.5 Real-time RPA assay ______________________________________________ 124
C Results ______________________________________________________ 125
C.1 Development of LFS-RPA assay for YFV ______________________________ 125
C.2 Performance of the LFS-RPA assay and comparison with RT-qPCR _________ 126
C.3 Specificity of the LFS assay _________________________________________ 127
C.4 Testing clinical samples ____________________________________________ 129
C.5 Performance of real-time RPA assay for YFV ___________________________ 129
D Discussion ___________________________________________________ 131
General conclusion and Outlook _______________________________________ 135
References _________________________________________________________ 137
Supplementary data __________________________________________________ 147
Lab equipment and materials ________________________________________ 147

List of chemicals and enzymes ______________________________________ 148
Media for cell culture _______________________________________________ 149
Cell lines _________________________________________________________ 150
XV
ACKNOWLEDMENT
First, I would like to thank Prof. Dr. Matthias Niedrig for giving me the opportunity to do
my Ph.D. thesis in his lab and his guidance throughout my Ph.D. I am very thankful to
my supervisor Sonja Linke and Katharina Achazi for their excellent guidance during my
Ph.D. I would also like to thank our colleagues from SONDE project Manfred Weidmann
& Frank Hufert from Dept. of Virology, Göttingen; Oliver Strohmeier & Thomas Van Oordt
from HSG-IMIT, Freiburg; Josef Drexler & Michael Eberhard from Qiagen Lake
Constance; Timo Hillebrand & Elmara Graser from AJ Innuscreen and Olfert Landt from
TIb MolBiol for their kind support, guidance, and valuable discussions.
Furthermore, I would like to thank Cristina Domingo, Ellen Zimowski, Hewad Laraway,
Nina Stock, Nadine Litzba, Patricia Bußmann, Anette Teichmann, and Marco Kaiser for
technical assistance concerning lab, advice, and encouragement during my work.
I am feeling glad to be a part of AG Niedrig, ZBS1 and thankful to all the members of
our department at Robert Koch Institute. I am never going to forget the extraordinary
atmosphere of the group, which made me feel like home. All the celebrations, sport
activities, and outgoing activities of the group help me a lot to make hard work easy-
going.
Once I am very thankful to Regina Schaedler, Katharina Achazi, Vipul Patel, and
Gregory Stevens for the critical reading and correction of this manuscript. I am grateful
to my wife for sharing the good moments with me and supporting me throughout my
Ph.D.
This PhD was supported by the German Ministry of Education and Research (BMBF)
joint research project S.O.N.D.E. In this context, I am also thankful to BMBF.

17
BACKGROUND
INFECTIOUS PATHOGENS
Infectious pathogens are disease-causing organisms such as viruses, bacteria, fungi, or
parasites. They have threatened humankind throughout the history and today pose a
considerable threat to global health. There have been a number of epidemic diseases
caused by infectious pathogens recorded in last centuries, such as a plague, cholera,
influenza, measles, smallpox, malaria and typhoid, which claimed the life of millions
(Fauci 2001; Feldmann, Czub et al. 2002; Morens, Folkers et al. 2004). Through
vaccination and the use of antibiotics, humans have tried to combat infectious diseases,
but the rapid evolution of microorganisms has allowed them to escape from these
defenses. In addition, some of the zoonotic pathogens have evolved as major human
pathogens through the adaptation to new hosts and new environments. Multiple factors,
including economic development and land use, human demographics and behavior,
international travel and commerce as well as climate changes are contributing to the
emergence and spread of infectious diseases worldwide, which represent today a major
public health problem (Morens, Folkers et al. 2004).
In recent years, infectious diseases have been classified into the following categories:
emerging diseases (newly appeared diseases), re-emerging diseases (old diseases
which occur again) and deliberately emerging diseases (diseases which are caused by
the deliberate release of infectious pathogens through bioterrorism, or use of
bioweapons) (Fauci 2006). In the past 30 years, more than 50 emerging pathogens have
been identified (Fauci 2001; Olano and Walker 2011). Some important examples of the
recent emerging diseases are acquired immunodeficiency syndrome (Human
immunodeficiency virus (HIV)), hemorrhagic diseases (Ebola virus, Marburg virus, Sabia
virus, Hantaan virus), hepatitis (Hepatitis A, B, C, D and E virus), encephalitic diseases
(Hendra virus, Nipah virus), severe acute respiratory syndrome (SARS), respiratory
diseases (H5N1 influenza virus and H1N1 influenza virus), drugs-resistant
staphylococcus aureus and hemolytic uremic syndrome and bloody diarrhea
(Escherichia coli O157:H7, EHEC O104:H4).
Infectious pathogens
18
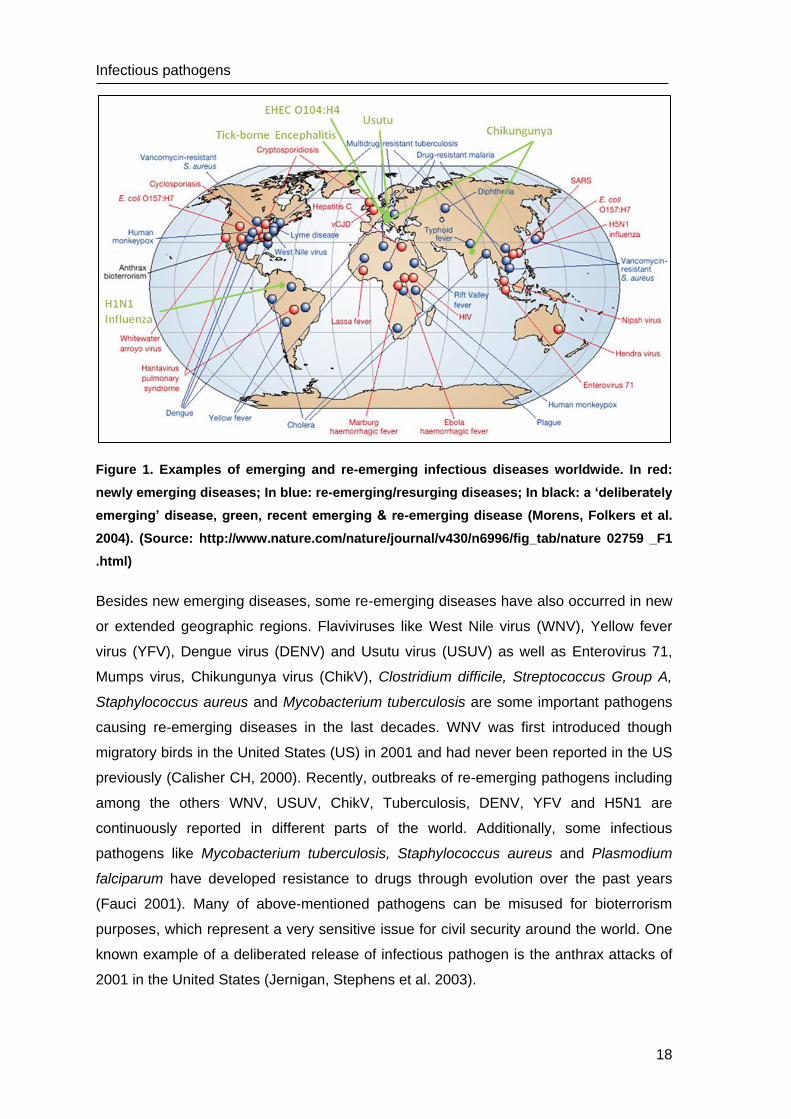
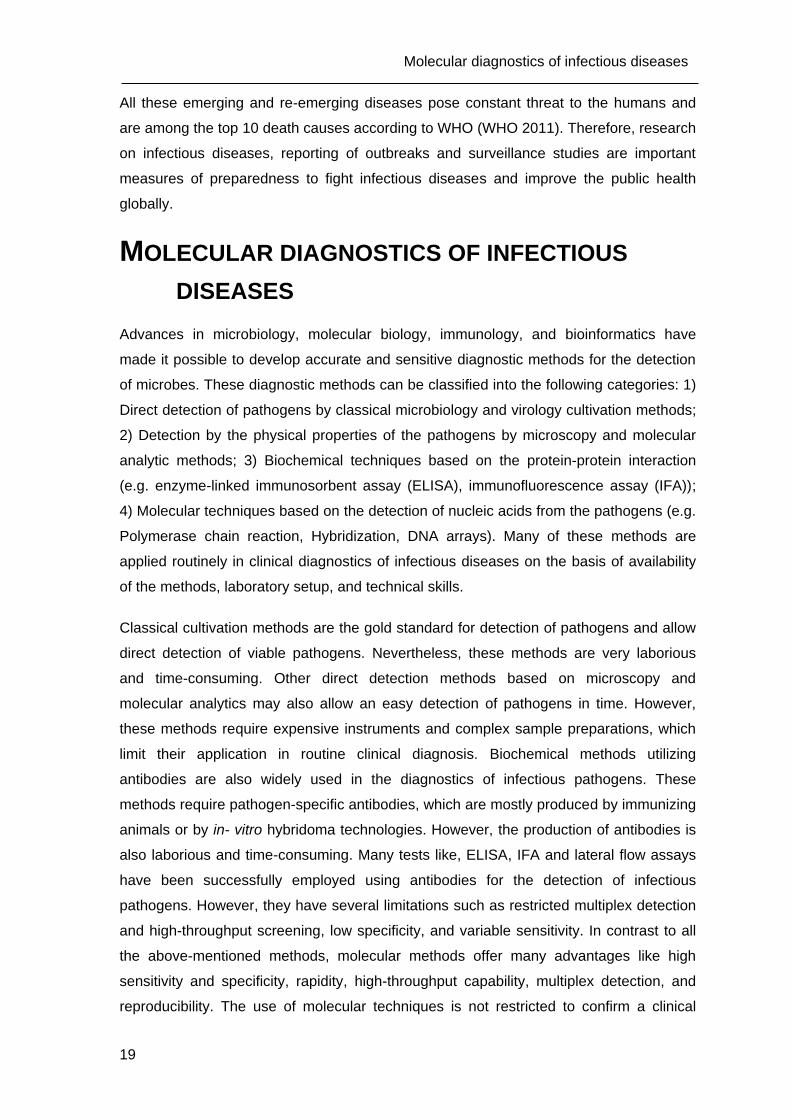
Figure 1. Examples of emerging and re-emerging infectious diseases worldwide. In red:
newly emerging diseases; In blue: re-emerging/resurging diseases; In black: a ‘deliberately
emerging’ disease, green, recent emerging & re-emerging disease (Morens, Folkers et al.
2004). (Source: http://www.nature.com/nature/journal/v430/n6996/fig_tab/nature 02759 _F1
.html)
Besides new emerging diseases, some re-emerging diseases have also occurred in new
or extended geographic regions. Flaviviruses like West Nile virus (WNV), Yellow fever
virus (YFV), Dengue virus (DENV) and Usutu virus (USUV) as well as Enterovirus 71,
Mumps virus, Chikungunya virus (ChikV), Clostridium difficile, Streptococcus Group A,
Staphylococcus aureus and Mycobacterium tuberculosis are some important pathogens
causing re-emerging diseases in the last decades. WNV was first introduced though
migratory birds in the United States (US) in 2001 and had never been reported in the US
previously (Calisher CH, 2000). Recently, outbreaks of re-emerging pathogens including
among the others WNV, USUV, ChikV, Tuberculosis, DENV, YFV and H5N1 are
continuously reported in different parts of the world. Additionally, some infectious
pathogens like Mycobacterium tuberculosis, Staphylococcus aureus and Plasmodium
falciparum have developed resistance to drugs through evolution over the past years
(Fauci 2001). Many of above-mentioned pathogens can be misused for bioterrorism
purposes, which represent a very sensitive issue for civil security around the world. One
known example of a deliberated release of infectious pathogen is the anthrax attacks of
2001 in the United States (Jernigan, Stephens et al. 2003).
19
Molecular diagnostics of infectious diseases
All these emerging and re-emerging diseases pose constant threat to the humans and
are among the top 10 death causes according to WHO (WHO 2011). Therefore, research
on infectious diseases, reporting of outbreaks and surveillance studies are important
measures of preparedness to fight infectious diseases and improve the public health
globally.
MOLECULAR DIAGNOSTICS OF INFECTIOUS
DISEASES
Advances in microbiology, molecular biology, immunology, and bioinformatics have
made it possible to develop accurate and sensitive diagnostic methods for the detection
of microbes. These diagnostic methods can be classified into the following categories: 1)
Direct detection of pathogens by classical microbiology and virology cultivation methods;
2) Detection by the physical properties of the pathogens by microscopy and molecular
analytic methods; 3) Biochemical techniques based on the protein-protein interaction
(e.g. enzyme-linked immunosorbent assay (ELISA), immunofluorescence assay (IFA));
4) Molecular techniques based on the detection of nucleic acids from the pathogens (e.g.
Polymerase chain reaction, Hybridization, DNA arrays). Many of these methods are
applied routinely in clinical diagnostics of infectious diseases on the basis of availability
of the methods, laboratory setup, and technical skills.
Classical cultivation methods are the gold standard for detection of pathogens and allow
direct detection of viable pathogens. Nevertheless, these methods are very laborious
and time-consuming. Other direct detection methods based on microscopy and
molecular analytics may also allow an easy detection of pathogens in time. However,
these methods require expensive instruments and complex sample preparations, which
limit their application in routine clinical diagnosis. Biochemical methods utilizing
antibodies are also widely used in the diagnostics of infectious pathogens. These
methods require pathogen-specific antibodies, which are mostly produced by immunizing
animals or by in- vitro hybridoma technologies. However, the production of antibodies is
also laborious and time-consuming. Many tests like, ELISA, IFA and lateral flow assays
have been successfully employed using antibodies for the detection of infectious
pathogens. However, they have several limitations such as restricted multiplex detection
and high-throughput screening, low specificity, and variable sensitivity. In contrast to all
the above-mentioned methods, molecular methods offer many advantages like high
sensitivity and specificity, rapidity, high-throughput capability, multiplex detection, and
reproducibility. The use of molecular techniques is not restricted to confirm a clinical
Molecular diagnostics of infectious diseases
20
diagnosis, but it has also led to the discovery of new pathogens, the detection of
outbreaks, and the identification of geographical distributions of pathogens.
Since the development of Polymerase Chain Reaction (PCR) in the early 80´s, molecular
testing based on nucleic acid amplification has revolutionized the field of molecular
biology, and this technology has emerged as an ideal healthcare tool. PCR based
methods are the dominant technology for nucleic acid amplification, and have become a
new gold standard for diagnostic testing in microbiological laboratories (Cirino, Musser et
al. 2004). PCR amplifies DNA through a repeated cycle of heating and cooling using a
thermal cycler. There are many diagnostic markers available for the PCR technology
utilizing genomic sequences and genes of pathogens. The availability of an online
genome database allows the easy development of the required assay components like
primers and probes. Furthermore, many well-established protocols and commercial kits
are available to perform PCR, which allows also rapid development of sensitive and
specific assay with high reproducibility. There are many different formats of PCR
available such as conventional PCR, reverse transcriptase PCR (RT-PCR), nested PCR,
multiplex PCR and real-time PCR. The major benefits of real-time PCR over other PCR
methods are rapidly in time, low risk of a contamination, high specificity, and high
sensitivity. Real-time PCR is now replacing the conventional cell culture and traditional
PCR methods for the molecular diagnostics of infectious diseases (Ratcliff, Chang et al.
2007).
Real-time PCR is based on real-time monitoring of increase of a fluorescence signal
during DNA amplification. In molecular diagnostics, the main formats of real-time PCR
are SybrGreen, hydrolysis probes (Taqman), molecular beacons probes or hybridization
probes (FRET) (Holland, Abramson et al. 1991; Tyagi and Kramer 1996; Mangasser-
Stephan, Tag et al. 1999; Ponchel, Toomes et al. 2003). The SybrGreen is a dsDNA
binding dye and emits fluorescence upon excitation, which can be monitored during DNA
amplification in a SybrGreen based real-time PCR. In contrast, the hydrolysis probes
containing a reporter fluorescent dye on the 5' end, and a quencher dye on the 3' end,
were used in a Taqman real-time PCR. During DNA amplification, the polymerase with
5´exonuclease activity cleaves the probe and separates the reporter dye from the
quencher dye. This allows the detection of fluorescence signal in real-time (Fig. 2). The
Nowadays Taqman real-time PCR is the most widely used method in molecular
diagnostics and basic research.
21
Molecular diagnostics of infectious diseases
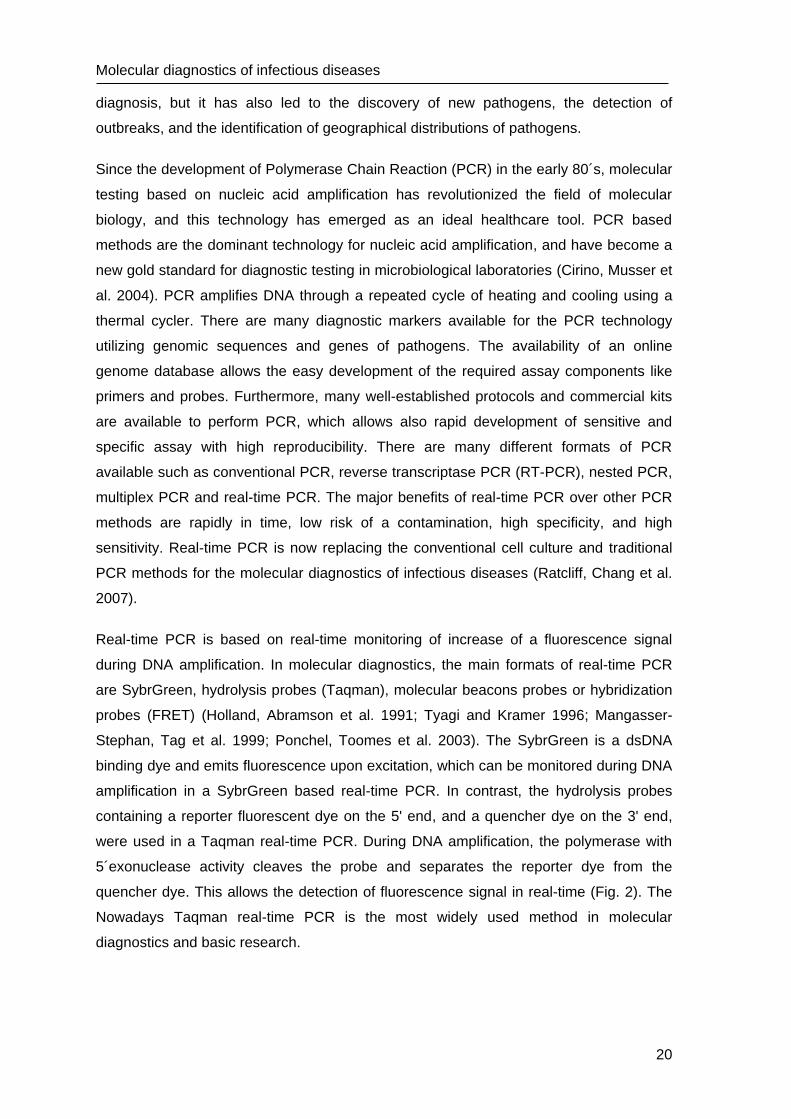
Figure 2. Overview of Taqman probe based real-time PCR. I) The TaqMan probe is dual
labeled oligonucleotide with a reporter dye at the 5’ end and acceptor dye at 3’ end. The
polymerases with 5’-nuclease activity used in the polymerase chain reaction (PCR) cleave
hydrolysis probes during the DNA extension step, which separates the detectable reporter
fluorophore (in green) from a quencher (in red). Fluorescence emitted when excited by an
external light source (h ) at each PCR cycle is proportional to the amount of product
formed. II) An example of real-time PCR instrument (ABI 7500 by Applied Biosystems) III) A
typical amplification plot of real-time PCR is shown. The ΔRn in logarithmic scale is shown
on the y-axis, where ΔRn represents the normalized reporter signal minus the baseline
signal. The cycle number is shown on the x-axis. IV) A typical standard curve derived from
the amplification of serial dilution series of the plasmid standards.
As an alternative to PCR, varieties of isothermal methods have been developed in the
past 10 years. Some of the most important isothermal methods include Strand
Displacement Amplification (SDA), Nucleic Acid Sequence Based Amplification
(NASBA), Loop-mediated Amplification (LAMP), Helicase Dependent Amplification
(HDA) and Recombinase Polymerase Amplification (RPA) as reviewed previously
(Niemz A 2011). These isothermal amplification methods just require a single constant
temperature for DNA amplification and provide sensitive amplification of DNA within an
hour. In the recent years, many of these techniques are being used to develop the point-
of-care diagnostics, and are becoming a true competitor to PCR based methods.
Molecular diagnostics of infectious diseases
22
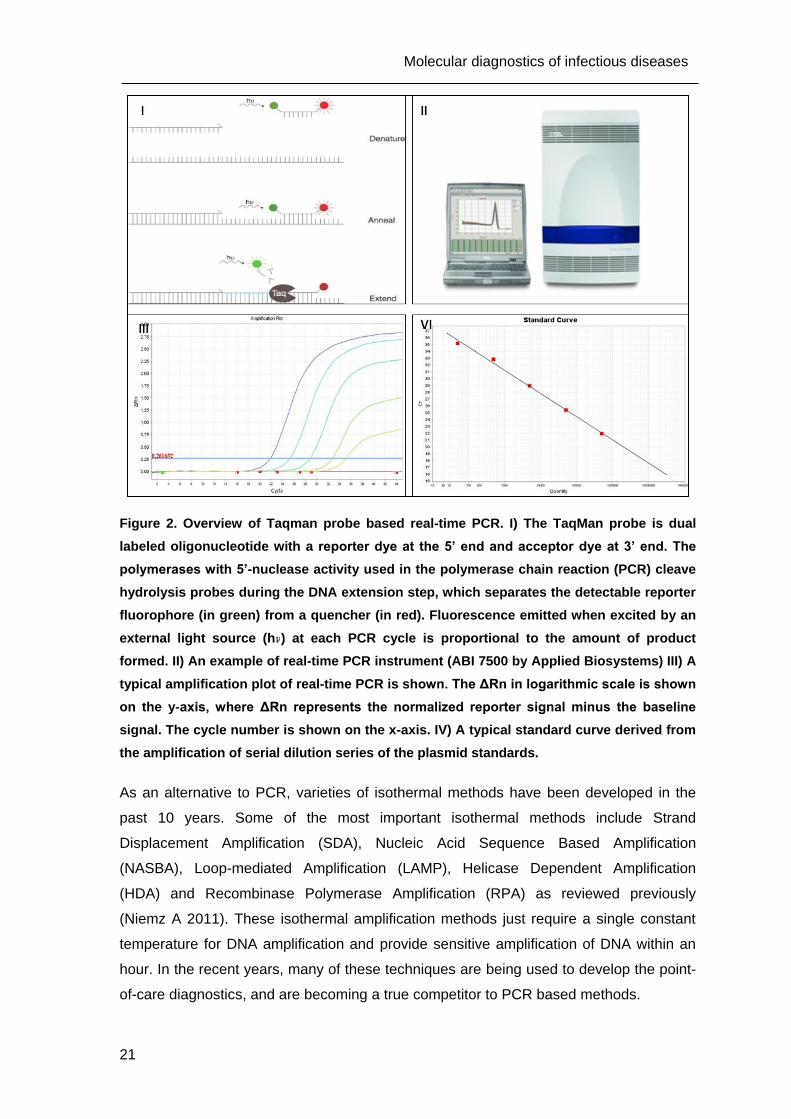
Figure 3. Overview of recombinase polymerase amplification (RPA) techniques. I) Scheme
of RPA reaction. A recombinase-primer complex scans a DNA helix and initiates primer
binding. Single strand DNA binding proteins stabilize the separated strain; then DNA
amplified analogue to PCR, but only constant 37 °C is needed. II) RPA exo probe contains
dT(FAM) - THF - dT(BHQ) site. Exonuclease III cuts THF and small probe section is
released which seperates quencher from fluorophore and allows the emission of
fluorescence. Fluorescence can be monitored in real-time by using the ESE Tubescanner
(Qiagen Lake Constant). III) RPA nfo probe contains THF site and is labeled with
fluorophore at 5´-end and block at 3´-end. Nfo cuts THF and small probe is released.
Polymerase elongates the DNA strand at site of cleavage. The amplification products can
be detected by lateral flow strip or gel electrophoresis as endpoint analysis. (Source:
www.twistDx.com, (Piepenburg, Williams et al. 2006))
RPA was first described in 2006 (Piepenburg, Williams et al. 2006) and is one of the
most promising next generation molecular diagnostic method. RPA employs prokaryotic
recombinase and other proteins including UvsX, UvsY, Gp32 and Bacillus subtilis (Bsu)
Pol I. The UvsX recombinase protein forms a complex with primers and guides the
primer to find homologous sequences in DNA without the need of a heating step. Once
the homologous sequence is found, primers bind to the target sequence through a D-
loop formation and displace the parental strand. This reaction is assisted by UvsY and
Gp32 proteins. Primers are then extended by Bsu Pol I, which lead to DNA amplification
(Fig. 3 I). The RPA reaction has some analogy to PCR such as oligonucleotide-primed
23
Objectives of this Ph.D. thesis
DNA synthesis and exponential amplification of DNA. However, RPA works at ambient
temperatures of from 24 °C to 45 °C, obviating the need for sophisticated heating
devices. This is a major advantage over PCR and other isothermal methods.
Furthermore, different detection formats are available for RPA. Utilizing oligonucleotide-
probes, the RPA reaction can be monitored by the fluorescence detection in real-time, or
can be detected as endpoint analysis by using gel electrophoresis or lateral flow strip
(LFS) (Fig. 3 II and III).
Nowadays molecular testing is used in various fields such as basic research, medical
diagnostics, agriculture, biodefense, and food testing. In the future, molecular testing
may become a component of routine laboratory work for detecting infectious pathogens,
to monitor the outbreaks, and to provide important data for surveillance and
epidemiological studies, thus improving the public health system.
OBJECTIVES OF THIS PH.D. THESIS
Recent advances in nucleic acid amplification technology have revolutionized the field of
molecular diagnostics and, In-Vitro Diagnostics (IVD) has become a fast-growing
industry worldwide. The application of molecular diagnostic tools opens a new
perspective of diagnostics for infectious pathogens, even in less developed clinical
settings. However, only a small number of the potentially capable laboratories are using
the molecular diagnostics due to the high cost of these techniques and the shortage of
commercial kits, well-equipped laboratories, and trained personnel. In contrast, point-of-
care testing would eliminate the high complexity associated with molecular testing
currently performed in large hospitals, reference and research laboratories. However,
cost-effectiveness, commercial availability, automation, and integrated diagnostic
platforms are still the essential targets to make this approach a success.
The aim of this Ph.D. work is to develop and establish methods for a complete workflow
of nucleic acid diagnostics including sample pre-treatment, sample preparation, nucleic
acid amplification, and detection. These methods should be sensitive and specific but
also accessible, rapid and affordable, so they can be widely implemented in diagnostic
laboratories. Furthermore, these methods would be used in combination with microfluidic
systems to develop integrated molecular diagnostic platforms or nucleic acid testing
(NAT) for low-resource settings, in order to overcome the challenges of developing a
“sample to answer” platform.
Objectives of this Ph.D. thesis
24
This thesis is divided into four chapters.
In the first chapter, novel biochemical methods including all steps of NAT have been
established for the detection of biothreat pathogens. These methods were then
implemented on the centrifugal microfluidic platform to obtain a “sample to answer”
platform, which should allow fully automated and rapid identification of biothreat
pathogens in emergencies.
The second chapter describes a molecular diagnostic method based on real-time PCR
for the identification of important flaviviruses, which can be used in well-equipped
reference laboratories to confirm flavivirus infections.
The third chapter is reserved for an alternative molecular diagnostic system combining
rapid PCR with a lateral flow strip as an endpoint analysis, which was specially
developed for the diagnosis of pandemic H1N1 2009 influenza virus in low-resource
settings.
In the last chapter, an instrument-free molecular diagnostic method utilizing an
isothermal amplification was developed for the detection of yellow fever virus in low-
resource and in-field settings.
Finally, these molecular diagnostic platforms were compared with each other in a general
conclusion.
25
Chapter 1.INTEGRATED MICROFLUIDIC
DIAGNOSTIC PLATFORM
DEVELOPMENT OF A RAPID DIAGNOSTIC
PLATFORM FOR DETECTION OF CATEGORY A
BIOTHREAT PATHOGENS IN THE FIELD

27
A INTRODUCTION
A.1 BIOLOGICAL THREAT AGENTS
Biological threat agents are highly contagious microorganisms (bacteria, viruses and
fungi), or toxins produced by these microorganisms. They are present in nature but could
also be genetically engineered. The natural or deliberate release of such agents can
cause the death in humans, animals or plants, lead to panic and enormous economic
loss. The Centre of Disease Control and Prevention (CDC), USA, has categorized
biothreat agents into categories “A”, “B”, or “C” according to potential threat, efficiency of
transmission, and severity of illness caused (Table A-1). Category “A” threats include
Botulinum toxin and important infectious agents such as Smallpox viruses, Bacillus
anthracis, Yersinia pestis, Francisella tularensis and hemorrhagic fever disease-causing
RNA viruses. The pathogens from Category “A” pose the highest risk in term of public
health, as they can be transmitted easily from person to person and cause high mortality
rates among the population causing widespread panic. Category “B” threats include
agents such as Burkholderia pseudomallei, Coxiella burnetii (Q fever), Brucella species
(brucellosis), Burkholderia mallei, many foodborne & waterborne pathogens and Ricin
toxin. In contrast to category “A” pathogens, category “B” pathogens spread at lower
speed and cause moderate or low death rates. Category “C” threats include emerging
pathogens, which could be engineered for mass dissemination in the future because of
their availability and ease of production as well as their potential threat (CDC Factsheet
Bioterrorism Agents).
In the last three decades, progress in biotechnology and genetic engineering has
revolutionized the field of molecular biology. On one hand, these technologies are used
in biological and medical research for peaceful purposes, on the other hand, they can be
misused to develop and produce biological weapons. A well-known example of
bioterrorism attack is the use of Anthrax spores after 9th Sep. 2001 in the US. Such
biological weapons pose a significant danger and were being produced mainly for
military purposes. Nevertheless, bioweapons are not the only option for bioterrorism, as
the use of naturally occurring foodborne and waterborne pathogens can cause the
similar damage in terms of death and social disruption. Therefore, monitoring, rapid
screening and surveillance studies of biological threat agents are important for
identifying, controlling their spread, taking appropriate quarantine measures, and
providing better patient treatment in a timely manner.
Chapter 1-Introduction
28
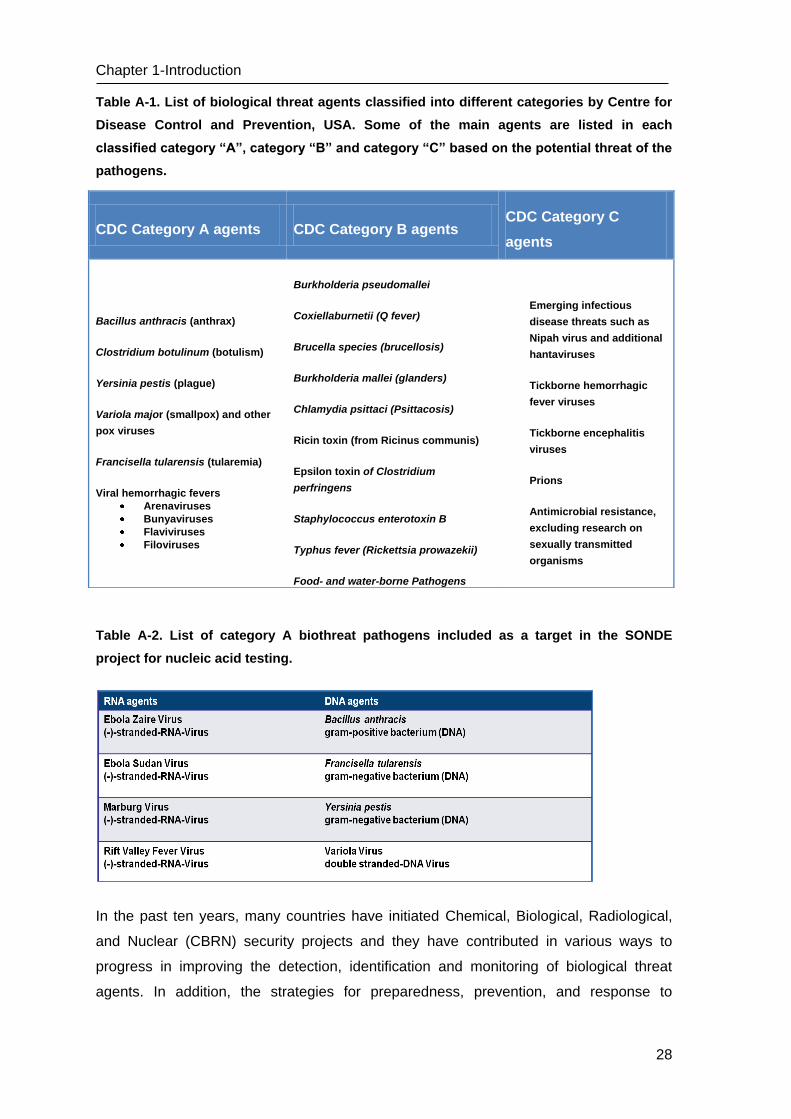
Table A-1. List of biological threat agents classified into different categories by Centre for
Disease Control and Prevention, USA. Some of the main agents are listed in each
classified category “A”, category “B” and category “C” based on the potential threat of the
pathogens.
Table A-2. List of category A biothreat pathogens included as a target in the SONDE
project for nucleic acid testing.
In the past ten years, many countries have initiated Chemical, Biological, Radiological,
and Nuclear (CBRN) security projects and they have contributed in various ways to
progress in improving the detection, identification and monitoring of biological threat
agents. In addition, the strategies for preparedness, prevention, and response to
CDC Category A agents CDC Category B agents CDC Category C
agents
Bacillus anthracis (anthrax)
Clostridium botulinum (botulism)
Yersinia pestis (plague)
Variola major (smallpox) and other
pox viruses
Francisella tularensis (tularemia)
Viral hemorrhagic fevers
Arenaviruses
Bunyaviruses
Flaviviruses
Filoviruses
Burkholderia pseudomallei
Coxiellaburnetii (Q fever)
Brucella species (brucellosis)
Burkholderia mallei (glanders)
Chlamydia psittaci (Psittacosis)
Ricin toxin (from Ricinus communis)
Epsilon toxin of Clostridium
perfringens
Staphylococcus enterotoxin B
Typhus fever (Rickettsia prowazekii)
Food- and water-borne Pathogens
Emerging infectious
disease threats such as
Nipah virus and additional
hantaviruses
Tickborne hemorrhagic
fever viruses
Tickborne encephalitis
viruses
Prions
Antimicrobial resistance,
excluding research on
sexually transmitted
organisms
29
Chapter 1-Introduction
biological threat agents have improved due to various funding research programs related
to Biosecurity. In the “Szenario-orientierte Notfall Diagnostik für den Feld Einsatz”
(SONDE) project, some of the important bacterial and viral biothreat agents from CDC
category A list has been included in nucleic acid testing (NAT) by microfluidic molecular
diagnostic platform (Table A-2).
A.2 INTEGRATED MOLECULAR DIAGNOSTIC PLATFORM
Nucleic acid testing (NAT) of infectious microorganism is an important method in
molecular diagnostics (MDx), and applied in fields ranging from basic research and
clinical diagnostics to monitoring of food-borne pathogens and biodefense applications.
NAT is typically done in centralized laboratories using complex and expensive
instruments and requires highly trained personnel. Therefore, these time-consuming NAT
methods are restricted to stationary facilities and cannot be applied for mobile and point-
of-need diagnostics. In contrast, an integrated MDx platform offers advantages such as
rapid diagnostics, easy operation, and on-site testing under low-resource settings.
A common integrated MDx platform for NAT includes three main steps: sample
preparation, amplification, and detection. Sample preparation methods are based on
chemical and mechanical lysis, which release the nucleic acids (RNA/DNA) from the
microorganism and serve as a template in NAT. After isolation of nucleic acids, the target
region is amplified using polymerase chain reaction (PCR) or isothermal amplification
methods. The successive amplification of the target is detected either during
amplification in real-time, or at the end of the reaction as an endpoint analysis. Most of
these techniques (real-time quantitative PCR, loop mediated amplification etc.) use
detection of a fluorescence signal or turbidity in real-time.
In the past ten years, many efforts have been made to develop an integrated MDx
platform, which allows an automated analysis of samples including all three steps of
NAT. More recently, several fully integrated large and small MDx platforms for NAT are
commercially available and are presented in Table A-2. Examples of large MDx platforms
are Gen-probe Tigris, Roche Cobas, Siemens Versant and Becton Dickenson Viper
systems, which are floor-standing automated devices employing complex robotics. Major
benefits of these large platforms include the ability to process large numbers of samples
and cost-efficiency. However, they are mainly used in centralized laboratories due to
their high complexity. In contrast, small MDx platforms utilize Lab-on-chip or microfluidic
technologies to integrate all the important steps of NAT in disposable cartridges, which
can be used in portable devices. These have been successfully demonstrated by small
Chapter 1-Introduction
30
MDx platforms like Cepheid GeneXpert, Becton Dickenson BD Max, Enigma ML, Idaho
technology Filmarray, Nanoshere Varigene and Iquum Liat analyzer. These systems
allow the rapid detection of samples within one hour and can be applied in low-resource,
in-field, and point-of-need settings.
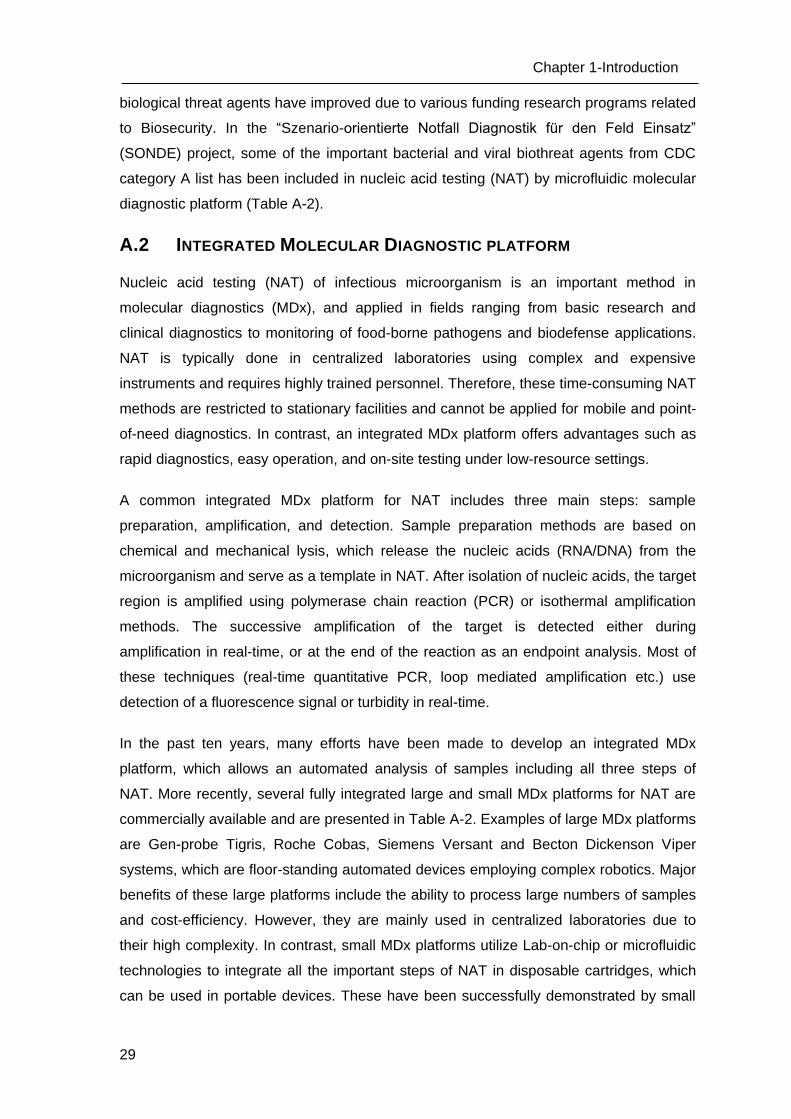
Table A-3. A List of large and small molecular diagnostic (MDx) platforms for nucleic acid
testing (NAT). Large MDx platforms are indicated by black text and small MDx platform are
presented in red text.
A.3 LAB-ON-CHIP PLATFORM FOR NUCLEIC ACID TESTING
Lab-on-chip (LOC) devices, also known as micro-total-analytical systems (µTAS) are
miniaturized analytical devices, which integrate the workflow of laboratory methods in
single small devices. The size of LOC devices range from a fingertip to a credit card.
They are fabricated in glass, polymer, or silicon using processes such as lithography,
chemical etching, and laser machining. Major advantages of these devices are the
handling of µL to nL volumes, low consumption of reagents, short response time and low
production costs. Advances in LOC technology have revolutionized the field of
biotechnology and medicine in recent decades, where LOC based devices were used in
NAT, protein analysis, proteomics and genomics. More recently, the use of LOC has
dramatically increased in the field of point-of-care (POC) diagnostics, as reviewed
previously (Yager, Edwards et al. 2006; Mark, Haeberle et al. 2010; Gulliksen, Keegan et
al. 2012).
31
Chapter 1-Introduction
As a part of the consortium of the BMBF funded SONDE project, the Institute of
Microsystems Engineering (IMTEK) from the University of Freiburg has developed a
state-of-the-art LOC based integrated MDx platform. The idea was to integrate the steps
of molecular diagnostics: enrichment of pathogens, sample preparation, target
amplification, and detection on one or more chips. These chips are fabricated using
glass wafers and platinum electrodes, as described previously (Vulto, Dame et al. 2010;
Podszun, Vulto et al. 2012). The microfluidic structure and phaseguides were formed
within dry film resist by lamination and lithographic techniques. The concept of this LOC
and fabricated chip are presented in Figure A-1. The whole workflow of diagnostic
methods can be performed using one or more chip modules, which can be later
fabricated as a single module.
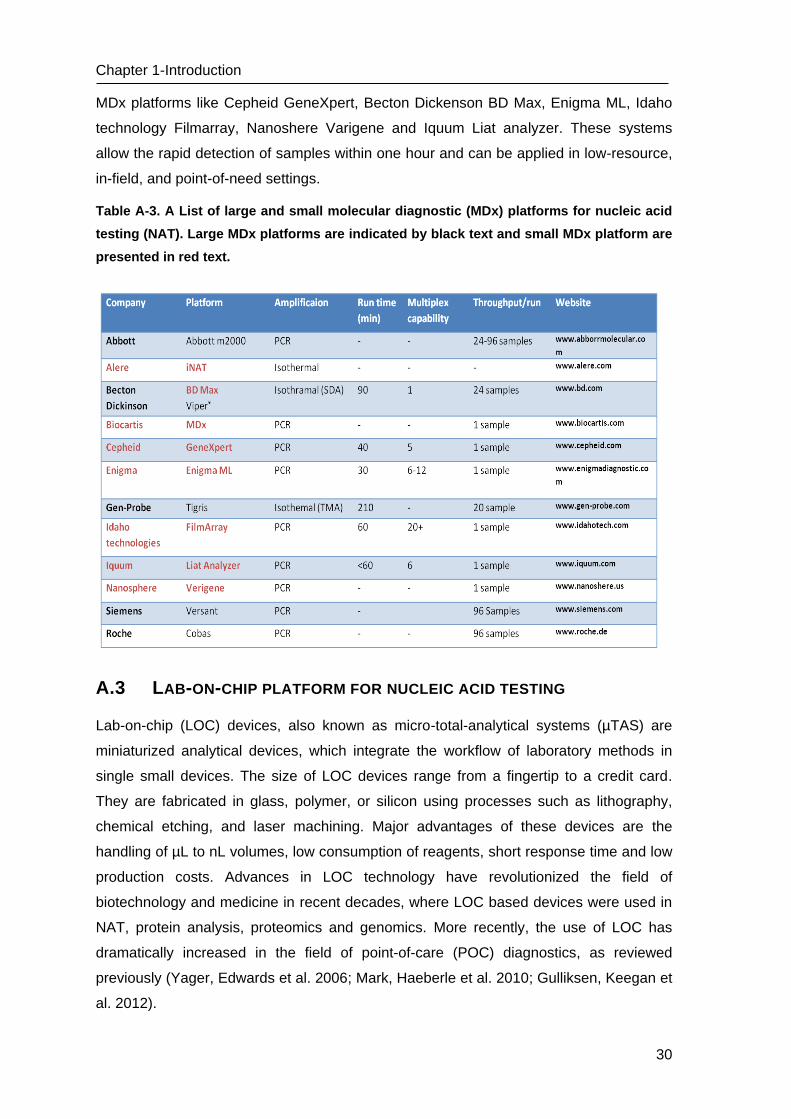
Figure A-1. The Lab-on-chip platform developed by IMTEK, University of Freiburg. I) The
concept of LOC is presented in three diagnostic steps; A: Sample preparation by thermo-
electrolysis of pathogens after enrichment and purification of nucleic acids on a small
poly-acrylamide gel by on-chip gel electrophoresis, B: Amplification of the target region by
Polymerase Chain Reaction (PCR) or isothermal amplification methods, C: Detection of
amplified products by fluorescence measurement. II) The photograph of the microfluidic
chip including phaseguide structures, different square chambers, platinum electrodes, and
inlet and outlet connections (Source: IMTEK, University of Freiburg; (Vulto, Dame et al.
2010)).
Chapter 1-Introduction
32
The LOC technology by IMTEK is a hybrid device, which integrates fluidic and electronic
components on the same chip, allowing precise liquid handling and sample testing (Fig.
A-1). Physical properties of bacteria and viruses are used to trap them to one electrode
according to their surface charges. Subsequently the trapped agents are lysed by
thermo-electrolysis without need of any chemical reagents or enzymes. After lysis,
nucleic acids from the samples are fragmented and purified by on-chip gel
electrophoresis within 10 min. Finally, the purified nucleic acids are analyzed using PCR
or isothermal amplification methods by on- or off-chip testing. The whole process of LOC
testing can be done using a disposable chip and a portable LOC device.
A.4 CENTRIFUGAL LABDISC PLATFORM FOR NUCLEIC ACID TESTING
Another type of LOC system, which uses centrifugal forces for liquid handling, mixing,
metering, and initiating reactions, is referred as a lab-on-disc (LabDisc) platform. In the
past 10 years, the centrifugal LabDisc platform has been intensively developed for
biomedical applications, and progress in this technology has made it one of the most
promising biological analysis platforms in molecular diagnostics (Gorkin, Park et al. 2010;
Siegrist, Amasia et al. 2010).
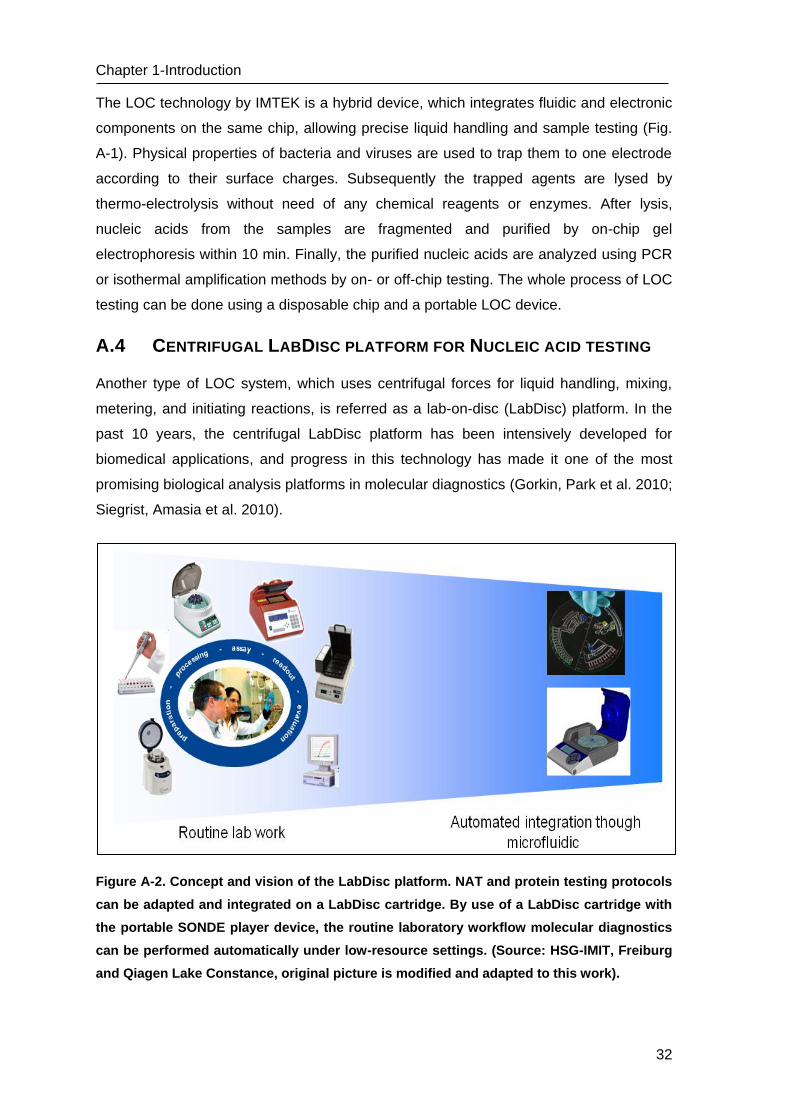
Figure A-2. Concept and vision of the LabDisc platform. NAT and protein testing protocols
can be adapted and integrated on a LabDisc cartridge. By use of a LabDisc cartridge with
the portable SONDE player device, the routine laboratory workflow molecular diagnostics
can be performed automatically under low-resource settings. (Source: HSG-IMIT, Freiburg
and Qiagen Lake Constance, original picture is modified and adapted to this work).
33
Chapter 1-Introduction
In contrast to common state-of-the-art LOC systems, the centrifugal LabDisc platform
offers many advantages such as minimal instrumentation, simple liquid handling due to
passive components and centrifugal forces, compact microfluidic design and automation
and integration of different processes. Piccolo system by Abaxis, Gyrolab workstation of
Gyros and GeneDisc system by Pall are some of the examples of commercial diagnostic
devices based on a centrifugal microfluidic platform.
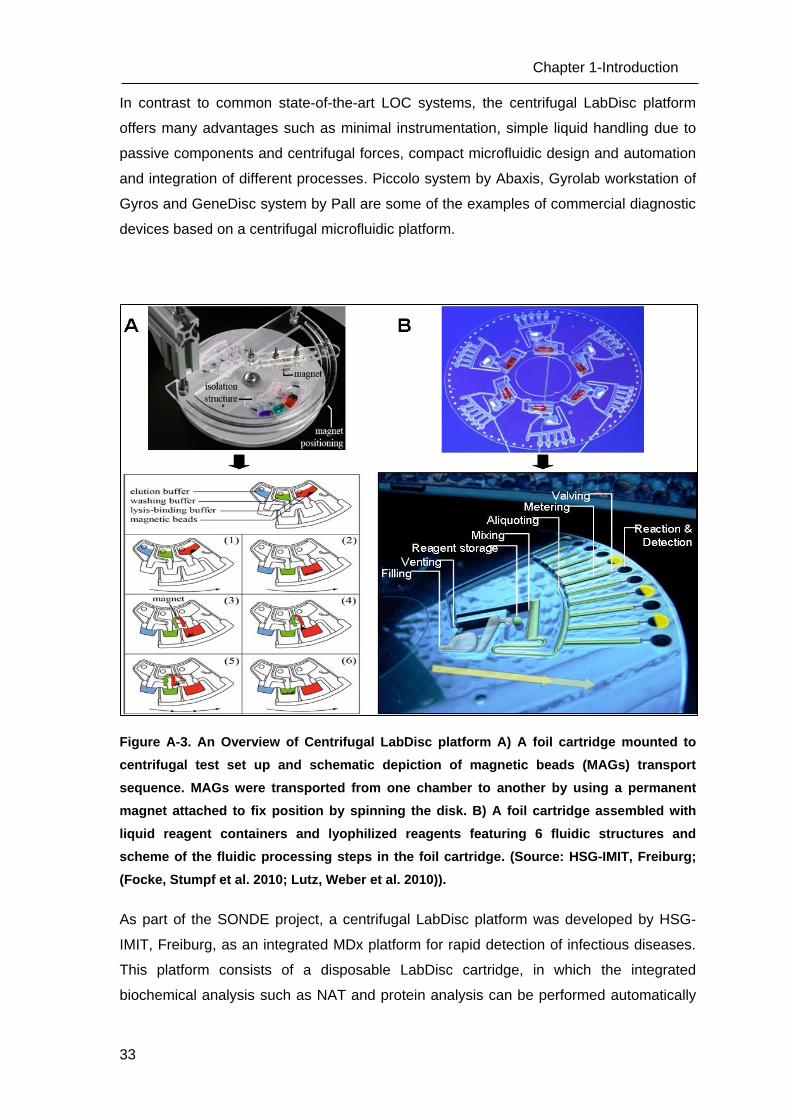
Figure A-3. An Overview of Centrifugal LabDisc platform A) A foil cartridge mounted to
centrifugal test set up and schematic depiction of magnetic beads (MAGs) transport
sequence. MAGs were transported from one chamber to another by using a permanent
magnet attached to fix position by spinning the disk. B) A foil cartridge assembled with
liquid reagent containers and lyophilized reagents featuring 6 fluidic structures and
scheme of the fluidic processing steps in the foil cartridge. (Source: HSG-IMIT, Freiburg;
(Focke, Stumpf et al. 2010; Lutz, Weber et al. 2010)).
As part of the SONDE project, a centrifugal LabDisc platform was developed by HSG-
IMIT, Freiburg, as an integrated MDx platform for rapid detection of infectious diseases.
This platform consists of a disposable LabDisc cartridge, in which the integrated
biochemical analysis such as NAT and protein analysis can be performed automatically
Chapter 1-Introduction
34
(Figure A-2). The LabDisc is adapted from the common pharmaceutical blister packaging
technology and fabricated using a biocompatible Cyclo Olefin polymer (COP) foil by
micro-thermoforming as described previously (Focke, Stumpf et al. 2010; Focke, Stumpf
et al. 2010). The fabricated LabDisc cartridge contains microfluidic channels and reaction
chambers. There are no active components such as pumps and valves as the fluid flow
is controlled by centrifugal forces. All microfluidic operations like liquid transport,
metering, aliquoting and mixing of reaction and sample separation are simply controlled
by the spinning frequency of the LabDisc (Fig. A-3). For cartridge processing, a portable
device the “SONDE player” was developed by the company Qiagen Lake Constance (a
partner in the SONDE consortium), which includes a disc motor, magnets for bead
transport, heating coil and fan for biochemical assays, detectors for a fluorescence and
luminescence detection, and the software . This device is small and portable, making it a
suitable device in combination with the LabDisc platform for point-of-care diagnostics.
A.5 AIM OF THIS STUDY
The increased threat of infectious diseases and bioterrorist incidents pose danger to
public. In response to such a threat, a system for rapid detection and identification of
biothreat agents is needed. Therefore, the SONDE project intends to develop a suitcase-
size platform for the detection of category A biothreat pathogens by nucleic acid and
antigen detection. The consortium of the SONDE project unifies leading competences in
the microsystems technology and the molecular diagnostics. There are seven project
partners from research institutes (Centre for biological security (ZBS), Robert Koch
Institute (RKI); Institute of Virology at University of Gottingen (UMG); Department of
Microsystem technology (IMTEK & HSG-IMIT), Freiburg; Centre for material research
Freiburg (FMF) and Institute of Molecular Medicine and Cell research (IMMZ) and
industry (Qiagen Lake Constance). The microfluidic platforms offer a great solution for
adapting a NAT onto an automated platform by eliminating the need of laboratories with
a highly complex MDx instrument. Therefore, the SONDE consortium focuses on the
research, design, and development of microfluidic platforms for the rapid detection of
biothreat pathogens.
The aim of this work was to develop and establish the following molecular methods,
which can be later integrated into the bio-analytical systems (the Lab-on-chip platform
and the centrifugal LabDisc platform).
Development of a virus model system for on-chip enrichment analysis on the Lab-
on-chip platform
35
Chapter 1-Introduction
Development of an enrichment method for viral pathogens from large volume
samples
Development of a sample preparation method for the biothreat agents
Establishment and optimization of nucleic acid detection protocols for the
biothreat agents (real-time PCR and real-time RPA assays)
Testing of the final “sample to answer” MDx platform
These methods should also fulfil the following important criteria: easy to perform, minimal
use of instruments, ambient condition for reagent storage, scalable reagent volume and
time effectiveness. Furthermore, the developed integrated MDx platform should be
optimized to obtain a “sample to answer” diagnostic system for biothreat pathogens and
should be compared to the manual laboratory and commercially available systems.
Chapter 1-Materials and Methods
36
B MATERIALS AND METHODS
B.1 CELL CULTURE
B.1.1 CULTIVATION OF ADHERENT CELLS
The most common method of cell culture is cultivation in a cell culture flask. Depending
on the cell line, the cultivation conditions and medium compositions, different types of
cell culture flask are used. Eukaryotic cell lines and one insect cell line were used for the
experiments. Vero E6 and Vero B4 cells were cultivated at 37 °C and 5 % CO2 using D-
MEM media with 5 % fetal calf serum (FCS) and 1 % glutamine. PS cells were cultivated
at 37 °C using L-15 media with 5 % FCS and 1 % glutamine. In contrast to eukaryotic
cell lines, C6/36 cell line was cultivated at 28 °C using L-15 media with 5 % FCS.
Frozen cells were thawed in a water bath at 50 °C, and cells were resuspended in 9 ml
fresh cell culture media. Cells were centrifuged at 1000 x g, and cell pellet was
resuspended in fresh 20 ml of cell culture media. Cells were then cultivated in a cell
culture flask (175 cm2) and placed in an appropriate incubator according to cell culture
media, and cultivated for 3 to 5 days. Cell sub culturing must be done at a particular
frequency to maintain cell lines. At a density of 90 %-100 %, medium was removed from
the cell culture flask, and cells were washed with PBS. Trypsin was applied to the cell for
the detachment of cells from their matrix and each other. Excessive trypsin was removed
from the cells and the flask was incubated at 37 °C until the cells dissociated from the
flask surface. Fresh medium was then added to the cells and the cells were resuspended
by pipetting. Cells were sub-cultured in a new flask at normal inoculation density, and
incubated at 37 °C with or without 5 % CO2, depending on the medium.
The cultivation of C6/36 cell line differed from usual adherent cell culture. At a density of
90 %-100 % cells, the media were removed from the cells, and fresh media was added.
C6/36 cells were removed from the cell flask surface using a cell scraper. Cells were
diluted in order to maintain log phase growth. After splitting, cells were incubated at
28 °C. Cell culture were regularly tested for mycoplasma contamination by mycoplasma
PCR.
B.1.2 ESTIMATION OF CELL NUMBER
The cell number was estimated by direct microscopic measurement. 10-20 µl cell
suspension was applied to a Neubauer counting chamber, and four outer cell chambers
were counted directly by microscope. The counted cell number was multiplied by factor
37
Chapter 1-Materials and Methods
of ¼* 104 to calculate the initial cell number per milliliter. If the cell suspension was
diluted, a dilution factor was taken into account.
B.2 CLASSIC VIROLOGY METHODS
B.2.1 VIRUS CULTIVATION AND INACTIVATION
Most of the viral pathogens used in this study were obtained as inactivated material.
Yellow fever virus 17D (YFV 17D), Camelpox virus (CP 19), Rift valley fever virus
(RVFV) and Sigma virus (SigV) were cultivated under BSL-2 or BSL-3 conditions
according to the relevant biosafety requirements. YFV 17D and RVFV were cultivated in
Vero E6 cells, whereas CP 19 was cultivated in HEp-2 cells. Sigma virus was cultivated
in C6/36 cells.
For virus cultivation, 50-100 µl of the virus stock solution was added to a monolayer of
cells. Cells were incubated for up to 6 days at optimal growth conditions and observed
over time for the cytopathic effects (CPE). The cell culture was harvested when CPE
were clearly visible and 60-80 % of the cells were dying. Cells with cell culture
supernatant were centrifuged at 4000 x g, and the supernatant was stored at minus
80 °C.
For virus inactivation, virus containing cell culture supernatant was heated to 56 °C for
1 h and subsequently gamma-irradiated at 40 kilo Grey.
B.2.2 PLAQUE ASSAY FOR TITRATION OF VIRUS SUSPENSION
The plaque assay is a method to determine the total number of infectious virus particles
in any given virus suspension. The infectious units are presented as plaque forming units
per ml (PFU/ml).
For determination of the virus titer, serial dilution of virus suspension was prepared and
seeded to a defined quantity of cells. The virus spreads from infected cells to adjacent
cells. After attachment of cells to the flask surface and viral infection, the suspension was
overlaid by viscous carboxymethyl cellulose (CMC) solution preventing further diffusion
of viruses. After a certain time duration, so-called plaques are formed on the cell
monolayer because of the cytopathic effect of the virus on cells. Each plaque is formed
from a single infectious virus particle thus allowing an accurate calculation of the virus
titer. These plaques can be detected visually. The infectivity titer is expressed in PFU/ml
and obtained by the following equation:
Chapter 1-Materials and Methods
38
.
For a YFV plaque assay, accurate 10 fold serial dilution of virus suspension was
prepared in L-15 cell culture media. A suspension of 200 µl PS cells at a concentration of
6*105 cells/ml was seeded in each well of 24 well plate. The same amount of virus
dilution was added to each well; then the plate was incubated at 37 °C for 4 h. After 4 h,
400 µl of CMC overlay media (1.6 % CMC in L-15 cell culture media) was added to each
well. For negative controls, the same amount of media was added to the well instead of
virus dilution. The well plate was incubated for 4 days at 37 °C. After 4 days incubation,
the media was removed from the well plate and cells were fixed with 3.7 % formaldehyde
for 15 min. The plaques were stained with a naphthalene black solution for 20 min.
Plates were dried; then plaques counted directly.
In contrast to the plaque assay of YFV, the plaque assay for RVFV and CP 19 virus was
performed using 200 µl of Vero E6 cells at a concentration of 1.6*106 cells/ml. The virus
dilutions and CMC media were prepared in D-MEM cell culture media. All other
procedures were as described above.
B.2.3 TCID50 ASSAY FOR TITRATION OF VIRUS SUSPENSION
Many viruses do not cause plaques in the plaque assay. In this case, Tissue Culture
Infection Dose 50 (TCID50) method is used to determine virus titer based on detection of
cytopathic effects caused by viruses in cell culture. TCID50 is also a simple method to
quantify virus titer. It is defined as the dilution of virus that is needed to infect the 50 % of
inoculated cells. Usually the TCID50 assay is performed in a 96 well plate. In case of pure
cytopathic effect (CPE), plaques can be stained by the naphthalene black solution.
Calculation of TCID50 is based on a counting of positive infected wells. These data can
be used to determine TCID50 of the virus suspension by following equation of the
Spearman-Kärber method:
Virus titration of Ljungan virus was performed on Vero B4 cells in a 96-well plate by
using 10-fold serial dilutions of the sample from 10−1 to 10−8 according to standard
procedures. 100 µl of 1*104 vero B4 cells/ml were plated into a 96-well plate and 100 µl
of virus dilutions were added to each well in quadruplet. Plates were inoculated at 37 °C
and 5 % CO2 for 10 days. After 10 days, the media were removed and cells were fixed
with 3.7 % formaldehyde per well for 15 min. Formaldehyde was then removed, and cells
39
Chapter 1-Materials and Methods
were stained with naphthalene black. The virus titer in TCID50 was estimated by
determining the virus dilution and counting the number of wells showing cytopathic
effects by the Spearman-Kärber method.
B.2.4 VIRUS PURIFICATION BY ULTRACENTRIFUGATION
The virus supernatant of YFV 17D and CP 19 were purified by ultracentrifugation to
obtain concentrated and purified virus particles. YFV 17D virus supernatant (180 ml) was
concentrated by ultracentrifugation through 45 ml of 25 % sucrose, prepared on
phosphate-buffered saline (PBS), in a Beckman type 19 rotor using a 250 ml vessel at
19,000 rpm and 4 °C for 14 h. CP 19 virus supernatant (180 ml) was concentrated by
ultracentrifugation through 45 ml of 30 % sucrose, prepared on PBS, in Beckman type 19
rotor using a 250 ml vessel at 18,000 rpm and 4 °C for 3 h. In both cases, the
supernatant was removed from the vessels and the virus pellet was dissolved in 1 ml of
Tris pH9 buffer overnight at 4 °C. then virus suspensions were stored at -80 °C.
B.2.5 LABELING OF VIRUSES
The enveloped particles of YF 17D and CP 19 particles primarily contain proteins, lipids
and viral nucleic acids. Lipid membranes and structural proteins of the viruses can be
labeled with lipophilic carbocyanine dyes DiOC6(3). To stain the viral particles,
suspensions containing virus particles were incubated with a DiOC6(3), 10 µM final
concentration and incubated at room temperature for 20 min, after which they were
subjected to 18,000x g centrifugation for 10 min (CP 19) and 45 min (YFV 17D). The
supernatant was removed, and the virus pellet was rinsed in distilled water and
centrifuged again at 18,000x g for 10 or 45 min. The virus pellet was then resuspended
in distilled water and kept at 4 °C until further use.
B.3 SAMPLE PRE-TREATMENT
B.3.1 VIRUS ENRICHMENT BY USING LAB-ON-CHIP TECHNIQUES
Macro- to micro-volume concentration of viable bacteria was successfully performed in a
microfluidic chip (Podszun, Vulto et al. 2012). The enrichment principle is based on free
flow electrophoresis and is demonstrated for Gram positive bacteria. Bacteria from a
suspension flow were trapped on a gel interface that separates the trapping location from
integrated actuation electrodes in order to enable non-destructive trapping (Fig B-1). This
method was tested to concentrate viruses on the chips. The chips were fabricated using
the full wafer fabrication process, as described previously (Vulto, Podszun et al. 2011).
Chapter 1-Materials and Methods
40
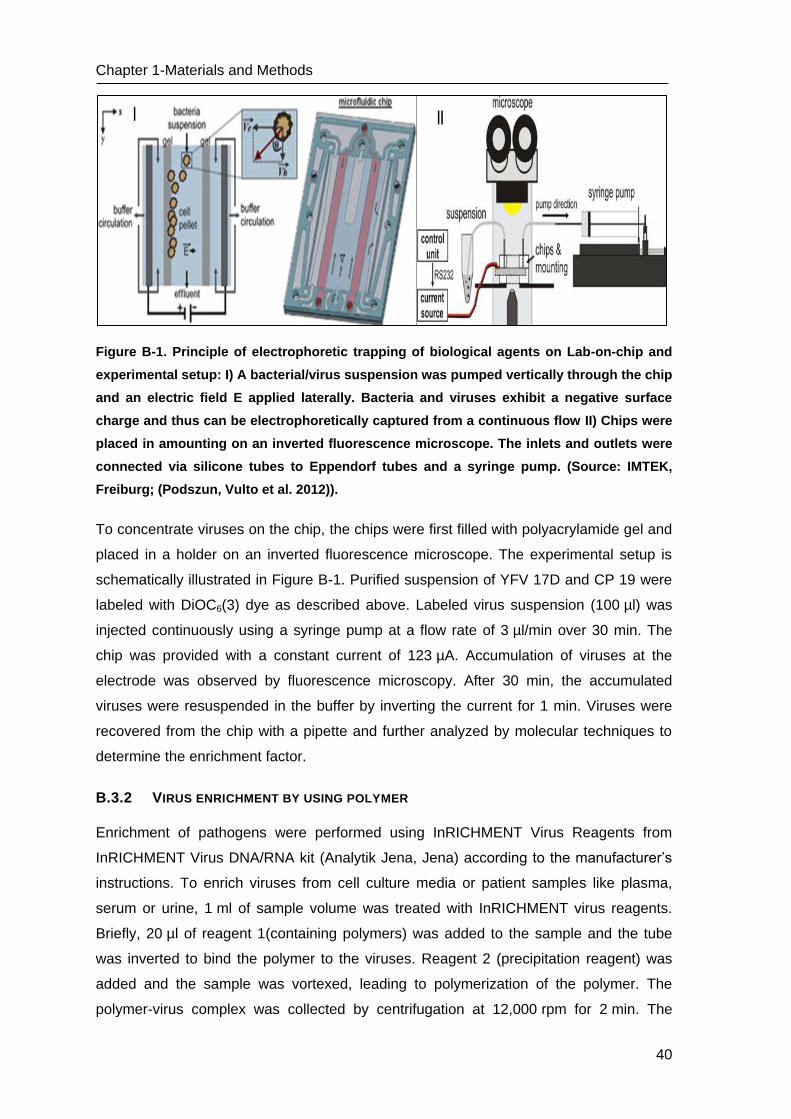
Figure B-1. Principle of electrophoretic trapping of biological agents on Lab-on-chip and
experimental setup: I) A bacterial/virus suspension was pumped vertically through the chip
and an electric field E applied laterally. Bacteria and viruses exhibit a negative surface
charge and thus can be electrophoretically captured from a continuous flow II) Chips were
placed in amounting on an inverted fluorescence microscope. The inlets and outlets were
connected via silicone tubes to Eppendorf tubes and a syringe pump. (Source: IMTEK,
Freiburg; (Podszun, Vulto et al. 2012)).
To concentrate viruses on the chip, the chips were first filled with polyacrylamide gel and
placed in a holder on an inverted fluorescence microscope. The experimental setup is
schematically illustrated in Figure B-1. Purified suspension of YFV 17D and CP 19 were
labeled with DiOC6(3) dye as described above. Labeled virus suspension (100 µl) was
injected continuously using a syringe pump at a flow rate of 3 µl/min over 30 min. The
chip was provided with a constant current of 123 µA. Accumulation of viruses at the
electrode was observed by fluorescence microscopy. After 30 min, the accumulated
viruses were resuspended in the buffer by inverting the current for 1 min. Viruses were
recovered from the chip with a pipette and further analyzed by molecular techniques to
determine the enrichment factor.
B.3.2 VIRUS ENRICHMENT BY USING POLYMER
Enrichment of pathogens were performed using InRICHMENT Virus Reagents from
InRICHMENT Virus DNA/RNA kit (Analytik Jena, Jena) according to the manufacturer’s
instructions. To enrich viruses from cell culture media or patient samples like plasma,
serum or urine, 1 ml of sample volume was treated with InRICHMENT virus reagents.
Briefly, 20 µl of reagent 1(containing polymers) was added to the sample and the tube
was inverted to bind the polymer to the viruses. Reagent 2 (precipitation reagent) was
added and the sample was vortexed, leading to polymerization of the polymer. The
polymer-virus complex was collected by centrifugation at 12,000 rpm for 2 min. The
41
Chapter 1-Materials and Methods
supernatant was discarded and the pellet of polymer-virus complex was resuspended in
50-100 µl of reagent 3. The proteinase K was not added, so samples were not lysed after
enrichment.
B.4 PURIFICATION OF NUCLEIC ACIDS
B.4.1 PURIFICATION OF TOTAL NUCLEIC ACIDS FROM BACTERIAL AND VIRAL
PATHOGENS
For conventional extraction of DNA/RNA from 200 µl bacteria or virus samples,
Chemagic NA body fluid kit, innuPREP virus DNA/RNA kit or Instant MP basic kit were
used according to the manufacturer’s instructions. The DNA/RNA was eluted in 60-
100 µl of RNase free sterile water.
B.4.2 PURIFICATION OF NUCLEIC ACIDS FROM LARGE VOLUME SAMPLE UP TO 1 ML
For extraction of viral RNA from 1 ml samples the following kits were used according to
the manufacturer’s instructions: QIAamp UltraSens Virus kit (Qiagen, Hilden, Germany),
High Pure Viral Nucleic Acid Large Volume Kit (Roche Diagnostics, Mannheim,
Germany) and InRICHMENT Virus DNA/ RNA Kit (Analytik Jena AG, Jena, Germany).
RNA was eluted in 60 µl RNase free sterile water.
B.4.3 PREPARATION OF PLASMID DNA ON SMALL SCALE
Alkaline lysis is a basic method for any kind of DNA preparations. Qiagen Miniprep kit is
used for plasmid DNA preparation. Mini scale preparation is very fast and can yield large
quantities of DNA. Briefly, a pellet was recovered from a 2 ml overnight bacterial culture
and resuspended in 250 µl solution A and solution B subsequently. This preparation was
mixed up thoroughly and incubated for 30 seconds to lyse bacteria. Solution C was
added and mixed up. This solution is centrifuged for 5 min, and clear supernatant was
applied to a spin column. Plasmid DNA binds to the spin filter during incubation of 1
minute. After centrifugation of the spin column, 750 µl wash buffer was added to remove
other contaminants. Finally, the plasmid DNA was eluted with 50-100 µl elution buffer
(TE/ DNase-free RNase) and stored at -20 °C.
B.4.4 DETERMINING THE CONCENTRATION OF NUCLEIC ACIDS SOLUTION
A measurement of the optical density at 260 nm is a simple and fast method to
determine the concentration of nucleic acids in a solution. This measurement requires a
photometer with an ultraviolet (UV) lamp. The concentration of nucleic acids can be
Chapter 1-Materials and Methods
42
calculated from the absorbance measured at 260 nm, the dilution factor, and a specific
multiplication factor. The multiplication factor is specific to RNA or DNA.
Information about protein contaminants can be obtained from the ratio of OD260 to OD280,
and exact calculation of nucleic acid is possible. A nucleic acid measurement was carried
out by biophotometer with the use of an ultra-micro cuvettes or nanodrop. It is not
possible to measure concentration below 100 ngusing very low volume.
B.5 NUCLEIC ACID AMPLIFICATION AND DETECTION
B.5.1 REVERSE TRANSCRIPTION POLYMERASE CHAIN REACTION (RT-PCR)
The reverse transcription of RNA into cDNA was performed using the reverse
transcriptase innuScript RT enzyme. In brief, 10 µl RNA was mixed with 5 µl of RT-
master mix containing 1.5 µl of 10 x RT-buffer, 4 µM of dNTPs, 1.4 mM of DTT, 1 µM of
random primer and RT-enzyme. The temperature parameters were set for 30 min at
55 °C and 10 min at 95 °C on a thermal cycler (Analytik Jena AG/Biometra, Jena,
Germany).
For cDNA synthesis using the SuperScript™ II RT enzyme, 11.6 μl purified RNA was
added in a 20 μl reaction volume with 4 μl 5× First-Strand Buffer (Invitrogen, Karlsruhe,
Germany), 4 μl of 0.1 M DTT (Invitrogen), 0.4 μl of dNTPs (25 mM each) and 1 µM of
random primer. The template RNA and primer were heated up to 65 °C for 5 min and
rapidly cooled to 4 °C. After addition of 1 μl of SuperScript™ II RT (200 U/μl) (Invitrogen),
samples were incubated for 60 min at 42 °C for reverse transcription. The reaction was
stopped by enzyme inactivation at 75 °C for 15 min and cooled to 4 °C. The cDNA were
stored at −20 °C until further use.
B.5.2 POLYMERASE CHAIN REACTION
Polymerase chain reaction (PCR) is a simple method for the amplification of a target
DNA fragment. PCR is widely used in clinical laboratories for molecular detection of
pathogens. For amplification of DNA or cDNA, PCR was performed using the Platinum
Taq polymerase in a total volume of 25 µl containing PCR buffer, primer pair,
magnesium chloride, primers and 2.5 µl of template DNA (Table B-2). Thermal cycling
was done on a PCR cycler under the following conditions: 15 min at 95 °C; 40 cycles of
15 s at 95 °C, 30 s at 60 °C and 30 s at 72 °C; 10 min at 72 °C. After PCR reaction, the
products were analyzed by gel electrophoresis. The used primers are listed in Table B-1.

43
Chapter 1-Materials and Methods
Table B-1. List of oligonucleotides used for PCR
PCR system & name of oligonucleotide
Primer & Probe
Sequence in orientation 5´-> 3´ Tm (°C)
Cloning, sequencing
M13 F Forward gTAAAACgACggCCAgT 50 M13 R Reverse AACAgCTATgACCATg 50
Promoter primer SP6 Forward ATTTAggTgACACTATAg 60
Promoter primer T7 Reverse TAATACgACTCACTATAggg 60
Mycoplasma testing
GPO-3 Forward gggAgCAAACaggAtTagATACCCT 60
MGSO Reverse TgCACCATCTgTCACTCTgTTAACCTC 60
Internal control GAPDH F Forward CCATggAgAAggCTggggCT 60
GAPDH R Reverse ggTggTgCAggAggCATTgCT 60
Table B-2. PCR reaction mixture and cycler conditions
Reagents Volume [µL] Time T [°C] cycle
dest. Water 13.4 10 min 94
10 x Taq-Buffer 2.5 30 sec 94
dNTPs (10 mM) 0.5 120 sec 50-60 40 cycles
MgCl2 (50 mM) 0.75 30 sec 72
Forward Primer (10 µM) 0.5 10 min 72
Reverse Primer (10 µM) 0.5 Hold 4
Platinum®Taq (5 U/µL) 0.1
DNA 2.5
B.5.3 AGAROSE GEL ELECTROPHORESIS
Agarose gel electrophoresis is the simplest and most common method for separating
and identifying DNA fragments of different sizes (0.5 to 25 kb fragments). Depending on
the size of the fragments, an agarose gel of specific concentration (1 %- or 2 %- agarose
gel) was prepared to separate DNA fragments effectively. Agarose was heated with
electrophoresis buffer, until it dissolved completely and then gel was spread in a gel tank
with a comb. After the gel becomes harder, it was placed into a flow migration chamber.
The gel was then covered with electrophoresis buffer. The DNA solution was pipetted
into sample wells and a voltage was applied. The DNA migrates through the gel under
application of the electrical field. Ethidium bromide was added as a DNA staining dye
directly in the agarose gel before pouring it into the gel tank. After sufficient migration,
the gel was observed under UV light.
B.5.4 COLONY PCR
Colony PCR is a method to determine the correct insertion of a cloning fragment into a
plasmid in a bacterial clone. The clones were selected with tips and directly dipped into
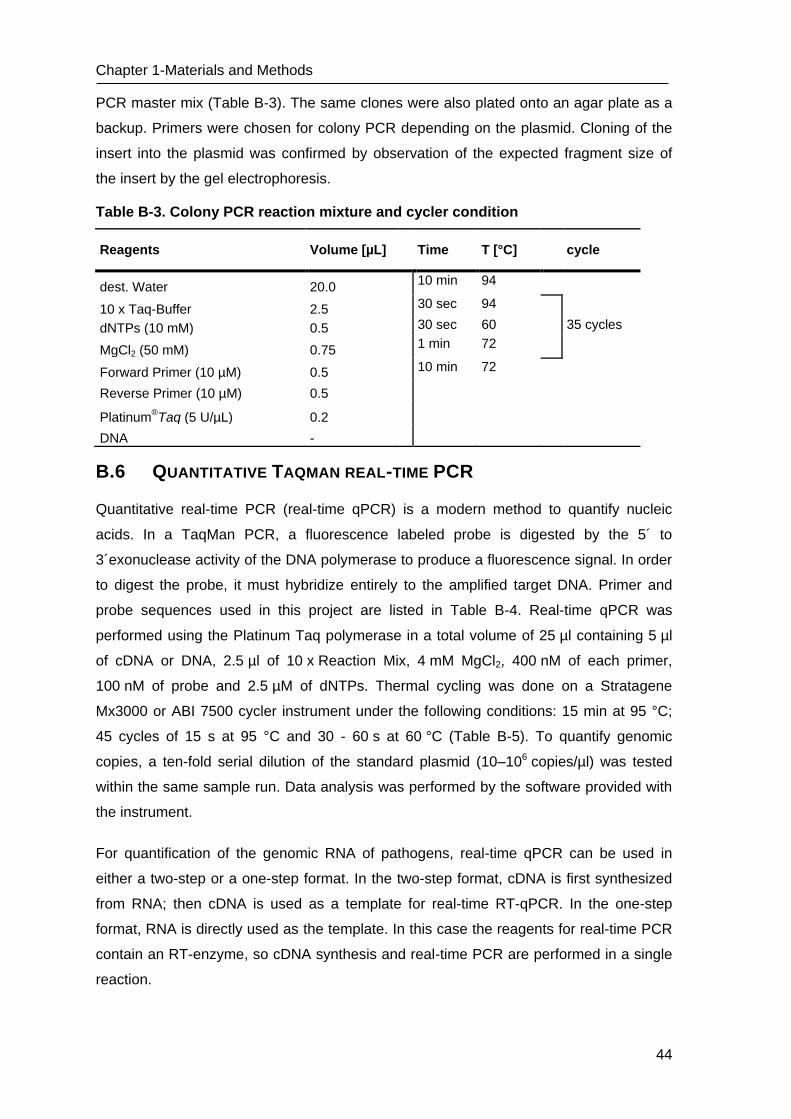
Chapter 1-Materials and Methods
44
PCR master mix (Table B-3). The same clones were also plated onto an agar plate as a
backup. Primers were chosen for colony PCR depending on the plasmid. Cloning of the
insert into the plasmid was confirmed by observation of the expected fragment size of
the insert by the gel electrophoresis.
Table B-3. Colony PCR reaction mixture and cycler condition
Reagents Volume [µL] Time T [°C] cycle
dest. Water 20.0 10 min 94
10 x Taq-Buffer 2.5 30 sec 94
dNTPs (10 mM) 0.5 30 sec 60 35 cycles
MgCl2 (50 mM) 0.75 1 min 72
Forward Primer (10 µM) 0.5 10 min 72
Reverse Primer (10 µM) 0.5
Platinum®Taq (5 U/µL) 0.2
DNA -
B.6 QUANTITATIVE TAQMAN REAL-TIME PCR
Quantitative real-time PCR (real-time qPCR) is a modern method to quantify nucleic
acids. In a TaqMan PCR, a fluorescence labeled probe is digested by the 5´ to
3´exonuclease activity of the DNA polymerase to produce a fluorescence signal. In order
to digest the probe, it must hybridize entirely to the amplified target DNA. Primer and
probe sequences used in this project are listed in Table B-4. Real-time qPCR was
performed using the Platinum Taq polymerase in a total volume of 25 µl containing 5 µl
of cDNA or DNA, 2.5 µl of 10 x Reaction Mix, 4 mM MgCl2, 400 nM of each primer,
100 nM of probe and 2.5 µM of dNTPs. Thermal cycling was done on a Stratagene
Mx3000 or ABI 7500 cycler instrument under the following conditions: 15 min at 95 °C;
45 cycles of 15 s at 95 °C and 30 - 60 s at 60 °C (Table B-5). To quantify genomic
copies, a ten-fold serial dilution of the standard plasmid (10–106 copies/µl) was tested
within the same sample run. Data analysis was performed by the software provided with
the instrument.
For quantification of the genomic RNA of pathogens, real-time qPCR can be used in
either a two-step or a one-step format. In the two-step format, cDNA is first synthesized
from RNA; then cDNA is used as a template for real-time RT-qPCR. In the one-step
format, RNA is directly used as the template. In this case the reagents for real-time PCR
contain an RT-enzyme, so cDNA synthesis and real-time PCR are performed in a single
reaction.
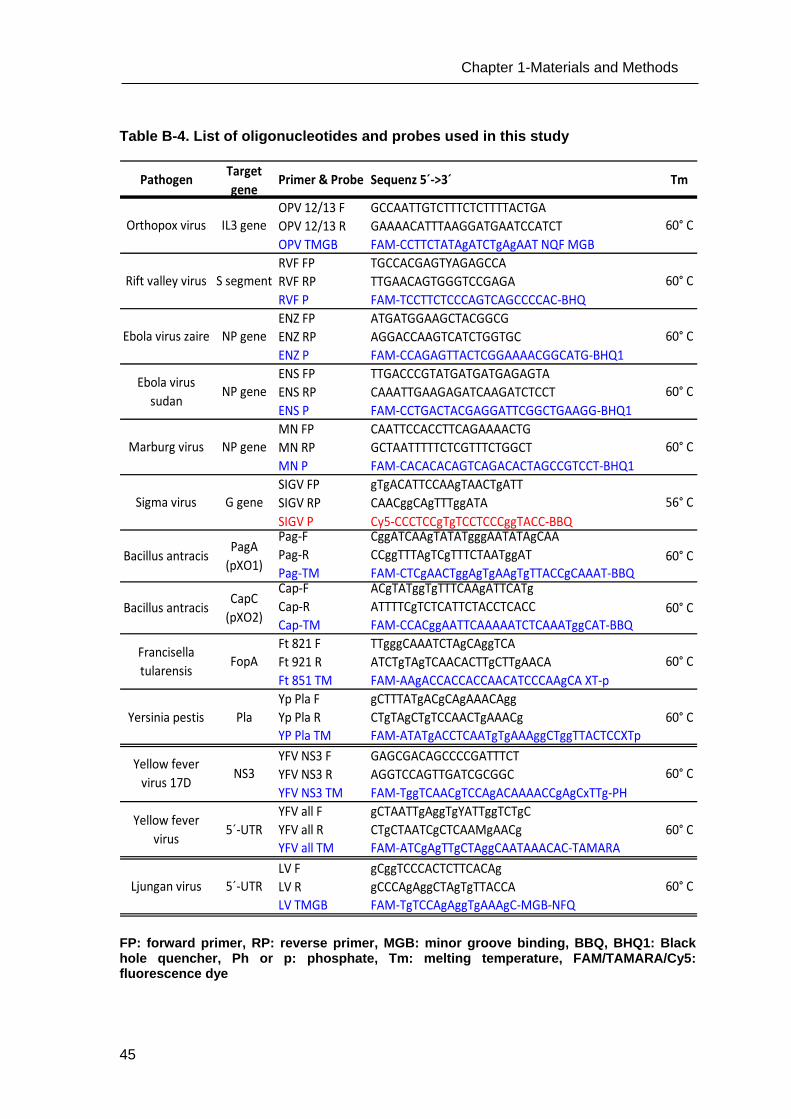
45
Chapter 1-Materials and Methods
Table B-4. List of oligonucleotides and probes used in this study
FP: forward primer, RP: reverse primer, MGB: minor groove binding, BBQ, BHQ1: Black hole quencher, Ph or p: phosphate, Tm: melting temperature, FAM/TAMARA/Cy5: fluorescence dye
PathogenTarget
genePrimer & Probe Sequenz 5´->3´ Tm
OPV 12/13 F GCCAATTGTCTTTCTCTTTTACTGA
OPV 12/13 R GAAAACATTTAAGGATGAATCCATCT
OPV TMGB FAM-CCTTCTATAgATCTgAgAAT NQF MGB
RVF FP TGCCACGAGTYAGAGCCA
RVF RP TTGAACAGTGGGTCCGAGA
RVF P FAM-TCCTTCTCCCAGTCAGCCCCAC-BHQ
ENZ FP ATGATGGAAGCTACGGCG
ENZ RP AGGACCAAGTCATCTGGTGC
ENZ P FAM-CCAGAGTTACTCGGAAAACGGCATG-BHQ1
ENS FP TTGACCCGTATGATGATGAGAGTA
ENS RP CAAATTGAAGAGATCAAGATCTCCT
ENS P FAM-CCTGACTACGAGGATTCGGCTGAAGG-BHQ1
MN FP CAATTCCACCTTCAGAAAACTG
MN RP GCTAATTTTTCTCGTTTCTGGCT
MN P FAM-CACACACAGTCAGACACTAGCCGTCCT-BHQ1
SIGV FP gTgACATTCCAAgTAACTgATT
SIGV RP CAACggCAgTTTggATA
SIGV P Cy5-CCCTCCgTgTCCTCCCggTACC-BBQPag-F CggATCAAgTATATgggAATATAgCAA
Pag-R CCggTTTAgTCgTTTCTAATggAT
Pag-TM FAM-CTCgAACTggAgTgAAgTgTTACCgCAAAT-BBQCap-F ACgTATggTgTTTCAAgATTCATg
Cap-R ATTTTCgTCTCATTCTACCTCACC
Cap-TM FAM-CCACggAATTCAAAAATCTCAAATggCAT-BBQ
Ft 821 F TTgggCAAATCTAgCAggTCA
Ft 921 R ATCTgTAgTCAACACTTgCTTgAACA
Ft 851 TM FAM-AAgACCACCACCAACATCCCAAgCA XT-p
Yp Pla F gCTTTATgACgCAgAAACAgg
Yp Pla R CTgTAgCTgTCCAACTgAAACg
YP Pla TM FAM-ATATgACCTCAATgTgAAAggCTggTTACTCCXTp
YFV NS3 F GAGCGACAGCCCCGATTTCT
YFV NS3 R AGGTCCAGTTGATCGCGGC
YFV NS3 TM FAM-TggTCAACgTCCAgACAAAACCgAgCxTTg-PH
YFV all F gCTAATTgAggTgYATTggTCTgC
YFV all R CTgCTAATCgCTCAAMgAACg
YFV all TM FAM-ATCgAgTTgCTAggCAATAAACAC-TAMARA
LV F gCggTCCCACTCTTCACAg
LV R gCCCAgAggCTAgTgTTACCA
LV TMGB FAM-TgTCCAgAggTgAAAgC-MGB-NFQ
FluSw H1 F236 TgggAAATCCAgAgTgTgAATCACT
FluSw H1 R318 CgTTCCATTgTCTgAACTAgRTgTT
FluSw H1 TM FAM-CCACAATgTAggACCATgAgCTTgCTgT-BBQ
Flavi all S TACAACATgATggggAARAgAgARAA
DEN4 F AACATgATgggRAAACgTgAGAA
Flavi all AS gTgTCCCAgCCNgCKgTgTCATCWgC
FAM-Tg+gTWYATgT+ggYTNg+gRgC-BBQ
FAM-CCgTgCCATATggTATATgTggCTgggAgC-BBQ
FAM-TTTCTggAATTTgAAgCCCTgggTTT-BBQ
Yersinia pestis Pla 60° C
Bacillus antracisCapC
(pXO2)60° C
Francisella
tularensisFopA 60° C
Sigma virus G gene 56° C
Bacillus antracisPagA
(pXO1)60° C
NP gene 60° C
Ebola virus
sudanNP gene 60° C
Marburg virus NP gene 60° C
Orthopox virus IL3 gene 60° C
Yellow fever
virus 17DNS3 60° C
Rift valley virus S segment 60° C
Ebola virus zaire
Yellow fever
virus
Ljungan virus 5´-UTR 60° C
Influ A/H1N1
2009 virus HA 60° C
5´-UTR 60° C
Pan-flavivirus
assay
(Detection of
different
falviviruses)
NS5 60° C
Flavi all probe 3
mix
Chapter 1-Materials and Methods
46
For quantification of the RNA of pathogens, QuantiTect virus kit, Transcriptor One-Step
RT-PCR Kit or AgPath-ID One-Step RT-PCR Kit were used according to the
manufacturer´s instructions. When commercial kits were used for one-step real-time RT-
qPCR, the primer and probe concentrations and protocol were optimized and adapted to
the reagents. Either published assays from project partners or in-house real-time qPCR
were used in this study (Table B-4) (Ellerbrok, Nattermann et al. 2002; Weidmann,
Muhlberger et al. 2004; Weidmann, Sanchez-Seco et al. 2008; Kramski, Drozd et al.
2011).
Table B-5. Real-time qPCR reaction mixture and cycler conditions
Reagents Volume [µL] Time T [°C] cycle
Dest. Water 14.05 10 min 95
10 x Taq-Buffer 2.5 15 sec 95 45 cycles
dNTPs (10 mM) 0.5 30 sec 60
MgCl2 (50 mM) 0.75 10 min 72
Forward Primer (10 µM) 0.75
Reverse Primer (10 µM) 0.75
Probes (10 µM) 0.25 each 0.25
Platinum®Taq (5 U/µL) 0.2
DNA 5.0
B.7 RECOMBINASE POLYMERASE AMPLIFICATION FOR NUCLEIC ACID
AMPLIFICATION
Recombinase Polymerase Amplification (RPA) was used as an isothermal amplification
method and alternative approach to PCR for nucleic acid amplification. There are
different commercial RPA kits (TwistDx, Cambridge, UK) available with options for
electrophoresis, fluorescent and lateral flow detection methods and for DNA and RNA
targets. In contrast to this, the real-time RPA assay was used to detect the DNA
amplification from target DNA or RNA by real-time fluorescence measurements using a
fluorescence reader.
B.7.1 REAL-TIME RPA ASSAY
The real-time RPA assay was performed using either the TwistAmp exo kit or the
TwistAmp exo RT kit according to manufacturer’s instruction. The TwistAmp exo RT kit
contains in addition to the RPA reagents, an RT-enzyme which provides the DNA
amplification from RNA targets. In final experiments, only the TwistAmp exo RT kit were
used for DNA amplification from both DNA and RNA targets. Briefly, 37.7 μl of
rehydration solution was mixed with 2.1 μl of each primer (10 µM) and 0.6 µl of target
47
Chapter 1-Materials and Methods
specific RPA exo probe (10 µM). Master mix (42.5 µl) was then added to the dry reagent
pellet and mixed by pipetting the reaction mixture. Template genomic DNA or RNA from
the pathogen (5 µl) was added to this mixture. Finally, 3.5 µl of Mg(OAC)2 (280 mM) was
added to the solution to start the reaction. Tubes containing reactions were vortexed and
centrifuged shortly, and placed in the ESE Quant Tubescanner for real-time monitoring
of fluorescence. The reaction was performed at 39 °C for 15-20 min. Data were analyzed
by the Tubescanner studio software Version 1.0. All the real-time RPA assays were
developed by our project partner from the Department of Virology Göttingen, UMG
(Euler, Wang et al. 2012; Euler, Wang et al. 2012; Podszun, Vulto et al. 2012).
B.7.2 OPTIMIZATION OF REAL-TIME RPA ASSAYS FOR THE LABDISC PLATFORM
A real-time RPA assay for the LabDisc was optimized for 10 µl volumes. RPA reactions
of 50 µl, 20 µl and 10 µl were prepared as shown in table B-6. To prepare 20 µl and 10 µl
of RPA reaction, a master mix for 50 µl of reaction was prepared normally and distributed
in 18 µl and 9 µl to tubes. Subsequently, template (DNA/RAN) and water were added to
tubes for 20 µl and 10 µl of RPA reactions (Table B-6).
Table B-6. RPA reaction mixture for 50 µl, 20 µl and 10 µl of reaction volumes.
Reagents 50 µl volume 20µl volume 10µl volume
RPA Buffer 36.7 14.68 7.34
Probe TM [10 µM] 0.6 0.24 0.12
Forward Primer [10 µM]* 2.1 0.84 0.42
Reverse Primer [10 µM]* 2.1 0.84 0.42
Magnesium acetate 3.5 1.4 0.7
Master mix 45 18 9
Template DNA/RNA 1 1 1
Dry reagent* 1x 1x 1x
PCR Water 4 1 0
Total 50µl 20µl 10µl
*These parameters were changed for testing 20 µl and 10 µl of RPA reactions.
Two following parameters were changed and tested for optimization of 20 µl and 10 µl of
RPA reaction: 1) Use of double amount of primers and probe 2) Use of 1.5 X dry RPA
reagents. All RPA reactions were carried out at 41 °C for 15-20 min using the ESE Quant
tubescanner, and data was analyzed by IsoAmp software.

Chapter 1-Materials and Methods
48
B.8 CENTRIFUGAL LABDISC PLATFORM
B.8.1 TESTING OF REAL-TIME RPA ASSAY ON THE GENESLICE
Optimized RPA assay in a 10 µl reaction volume was tested using the GeneSlice
cartridge and the LabDisc platform. The GeneSlice cartridge contains the microfluidic
structure for aliquoting, which has eight reaction chambers for nucleic acid testing.
Briefly, 73 μl of rehydration solution, 4.2 µl of forward/reverse primer (10 µM each), 1.2 µl
of probe (10 µM), 7 µl of Mg(OAC)2 (280 mM) and 10 µl of the DNA/RNA template were
mixed to a final volume of 100 µl. Master mix (100 µl) were then added to the 3 X dry
reagent pellet and mixed by pipetting the reaction mixture. After this, 90 µl of reaction
mixture was pipetted in the GeneSlice and placed in a GeneSlice holder (Fig. B-2).
Figure B-2. The GeneSlice cartridge and holder for the LabDisc platform. The GeneSlice
contains the microfluidic structure for aliquoting of the reaction in a 10 µl of reaction in
each of the eight chambers. (Source: HSG-IMIT, Freiburg)
The prepared GeneSlice holder was then placed in the SONDE player and the RPA
reaction mixture aliquoted in the GeneSlice at a final reaction volume of 10 µl. Eight RPA
reactions of 10 µl were simultaneously measured in the SONDE player at a constant
temperature of 41 °C for 20-25 min. The Data was finally analyzed by IsoAmp Software.
B.8.2 SAMPLE TO ANSWER TESTING OF LABDISC PLATFORM USING RPA LABDISC
CARTRIDGE
The RPA LAbDisc was designed and fabricated as described previously (Focke, Stumpf
et al. 2010). Primers and probe of the RPA assays were dried at room temperature on
the RPA LabDisc as shown in Figure B-3. Three RPA reagent pellets were then placed
in the mixing chamber on the RPA LabDisc and the RPA LabDisc was sealed with a
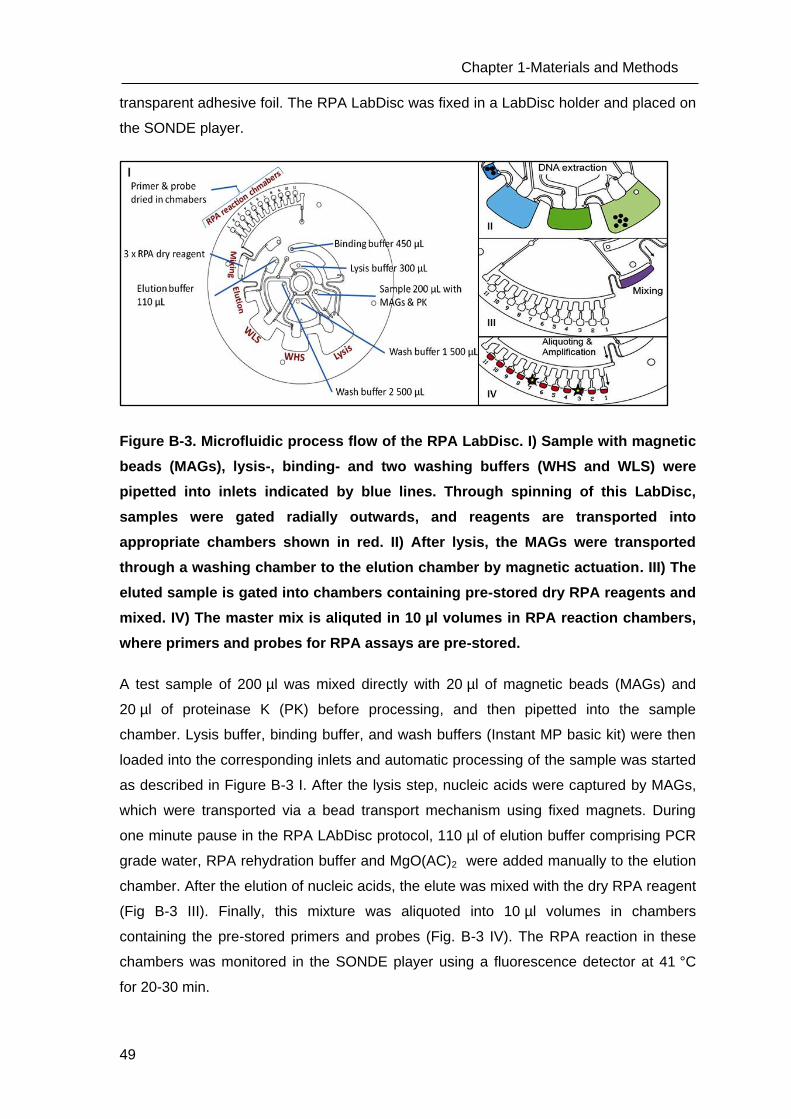
49
Chapter 1-Materials and Methods
transparent adhesive foil. The RPA LabDisc was fixed in a LabDisc holder and placed on
the SONDE player.
Figure B-3. Microfluidic process flow of the RPA LabDisc. I) Sample with magnetic
beads (MAGs), lysis-, binding- and two washing buffers (WHS and WLS) were
pipetted into inlets indicated by blue lines. Through spinning of this LabDisc,
samples were gated radially outwards, and reagents are transported into
appropriate chambers shown in red. II) After lysis, the MAGs were transported
through a washing chamber to the elution chamber by magnetic actuation. III) The
eluted sample is gated into chambers containing pre-stored dry RPA reagents and
mixed. IV) The master mix is aliquted in 10 µl volumes in RPA reaction chambers,
where primers and probes for RPA assays are pre-stored.
A test sample of 200 µl was mixed directly with 20 µl of magnetic beads (MAGs) and
20 µl of proteinase K (PK) before processing, and then pipetted into the sample
chamber. Lysis buffer, binding buffer, and wash buffers (Instant MP basic kit) were then
loaded into the corresponding inlets and automatic processing of the sample was started
as described in Figure B-3 I. After the lysis step, nucleic acids were captured by MAGs,
which were transported via a bead transport mechanism using fixed magnets. During
one minute pause in the RPA LAbDisc protocol, 110 µl of elution buffer comprising PCR
grade water, RPA rehydration buffer and MgO(AC)2 were added manually to the elution
chamber. After the elution of nucleic acids, the elute was mixed with the dry RPA reagent
(Fig B-3 III). Finally, this mixture was aliquoted into 10 µl volumes in chambers
containing the pre-stored primers and probes (Fig. B-3 IV). The RPA reaction in these
chambers was monitored in the SONDE player using a fluorescence detector at 41 °C
for 20-30 min.
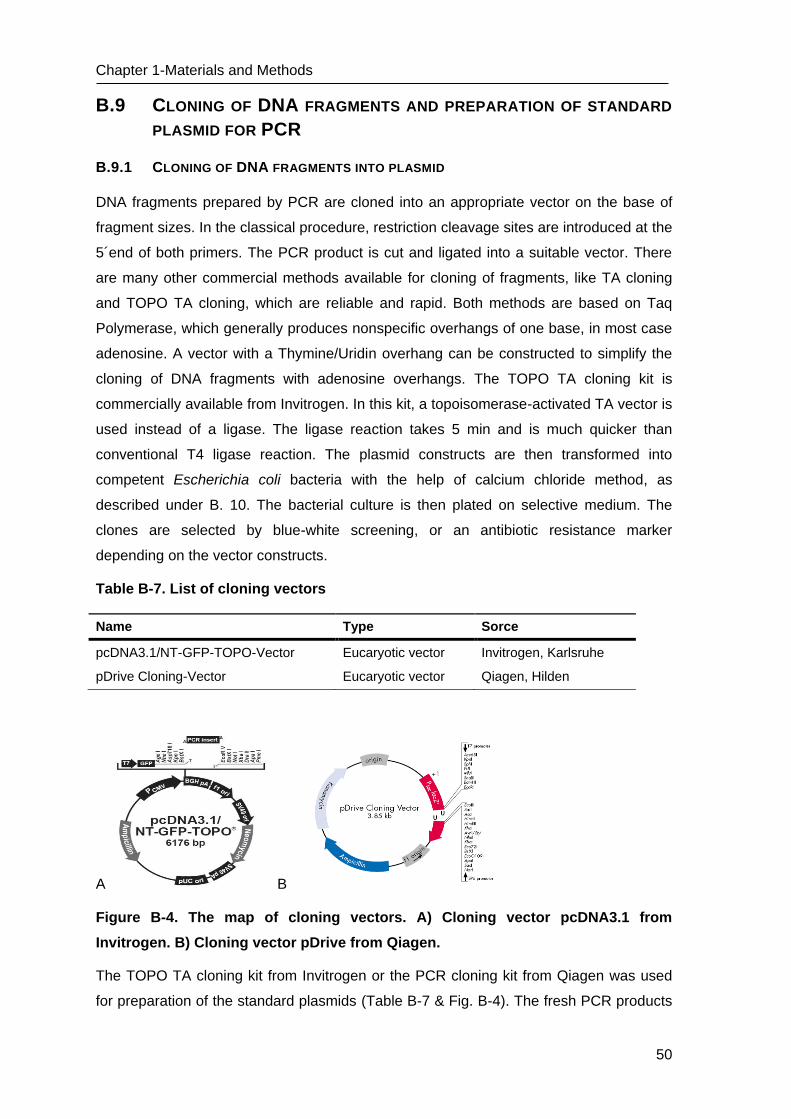
Chapter 1-Materials and Methods
50
B.9 CLONING OF DNA FRAGMENTS AND PREPARATION OF STANDARD
PLASMID FOR PCR
B.9.1 CLONING OF DNA FRAGMENTS INTO PLASMID
DNA fragments prepared by PCR are cloned into an appropriate vector on the base of
fragment sizes. In the classical procedure, restriction cleavage sites are introduced at the
5´end of both primers. The PCR product is cut and ligated into a suitable vector. There
are many other commercial methods available for cloning of fragments, like TA cloning
and TOPO TA cloning, which are reliable and rapid. Both methods are based on Taq
Polymerase, which generally produces nonspecific overhangs of one base, in most case
adenosine. A vector with a Thymine/Uridin overhang can be constructed to simplify the
cloning of DNA fragments with adenosine overhangs. The TOPO TA cloning kit is
commercially available from Invitrogen. In this kit, a topoisomerase-activated TA vector is
used instead of a ligase. The ligase reaction takes 5 min and is much quicker than
conventional T4 ligase reaction. The plasmid constructs are then transformed into
competent Escherichia coli bacteria with the help of calcium chloride method, as
described under B. 10. The bacterial culture is then plated on selective medium. The
clones are selected by blue-white screening, or an antibiotic resistance marker
depending on the vector constructs.
Table B-7. List of cloning vectors
A B
Figure B-4. The map of cloning vectors. A) Cloning vector pcDNA3.1 from
Invitrogen. B) Cloning vector pDrive from Qiagen.
The TOPO TA cloning kit from Invitrogen or the PCR cloning kit from Qiagen was used
for preparation of the standard plasmids (Table B-7 & Fig. B-4). The fresh PCR products
Name Type Sorce
pcDNA3.1/NT-GFP-TOPO-Vector Eucaryotic vector Invitrogen, Karlsruhe
pDrive Cloning-Vector Eucaryotic vector Qiagen, Hilden
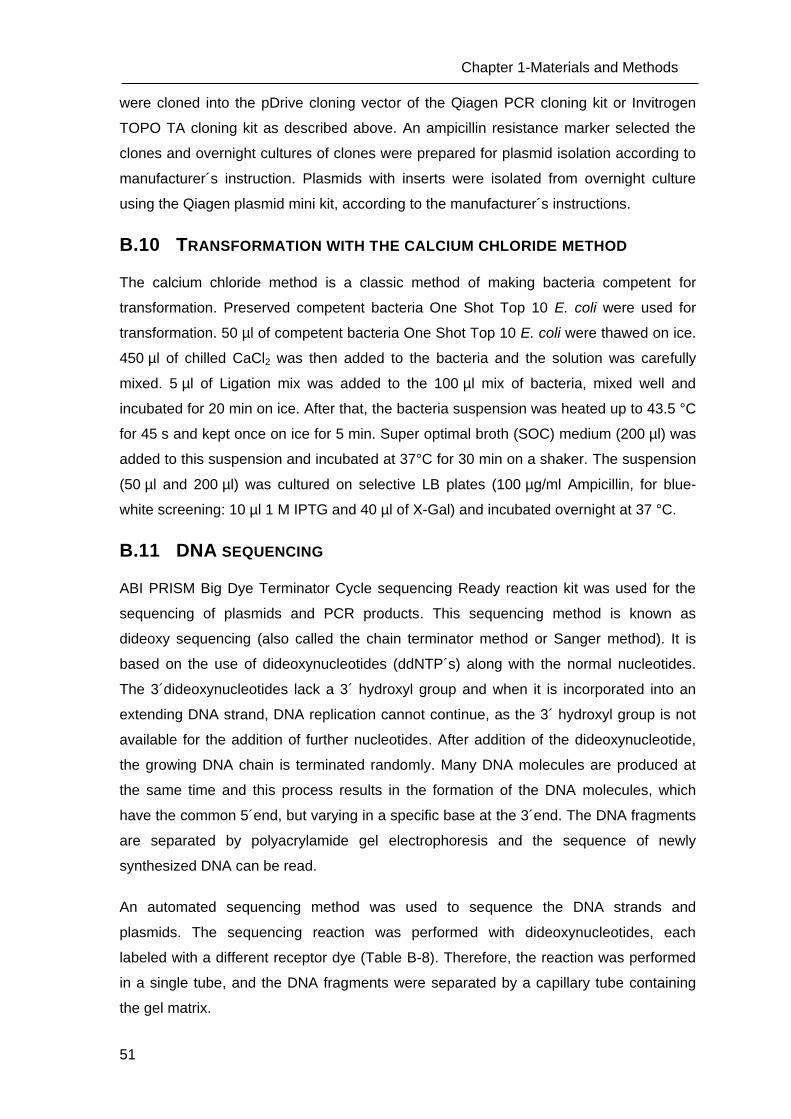
51
Chapter 1-Materials and Methods
were cloned into the pDrive cloning vector of the Qiagen PCR cloning kit or Invitrogen
TOPO TA cloning kit as described above. An ampicillin resistance marker selected the
clones and overnight cultures of clones were prepared for plasmid isolation according to
manufacturer´s instruction. Plasmids with inserts were isolated from overnight culture
using the Qiagen plasmid mini kit, according to the manufacturer´s instructions.
B.10 TRANSFORMATION WITH THE CALCIUM CHLORIDE METHOD
The calcium chloride method is a classic method of making bacteria competent for
transformation. Preserved competent bacteria One Shot Top 10 E. coli were used for
transformation. 50 µl of competent bacteria One Shot Top 10 E. coli were thawed on ice.
450 µl of chilled CaCl2 was then added to the bacteria and the solution was carefully
mixed. 5 µl of Ligation mix was added to the 100 µl mix of bacteria, mixed well and
incubated for 20 min on ice. After that, the bacteria suspension was heated up to 43.5 °C
for 45 s and kept once on ice for 5 min. Super optimal broth (SOC) medium (200 µl) was
added to this suspension and incubated at 37°C for 30 min on a shaker. The suspension
(50 µl and 200 µl) was cultured on selective LB plates (100 µg/ml Ampicillin, for blue-
white screening: 10 µl 1 M IPTG and 40 µl of X-Gal) and incubated overnight at 37 °C.
B.11 DNA SEQUENCING
ABI PRISM Big Dye Terminator Cycle sequencing Ready reaction kit was used for the
sequencing of plasmids and PCR products. This sequencing method is known as
dideoxy sequencing (also called the chain terminator method or Sanger method). It is
based on the use of dideoxynucleotides (ddNTP´s) along with the normal nucleotides.
The 3´dideoxynucleotides lack a 3´ hydroxyl group and when it is incorporated into an
extending DNA strand, DNA replication cannot continue, as the 3´ hydroxyl group is not
available for the addition of further nucleotides. After addition of the dideoxynucleotide,
the growing DNA chain is terminated randomly. Many DNA molecules are produced at
the same time and this process results in the formation of the DNA molecules, which
have the common 5´end, but varying in a specific base at the 3´end. The DNA fragments
are separated by polyacrylamide gel electrophoresis and the sequence of newly
synthesized DNA can be read.
An automated sequencing method was used to sequence the DNA strands and
plasmids. The sequencing reaction was performed with dideoxynucleotides, each
labeled with a different receptor dye (Table B-8). Therefore, the reaction was performed
in a single tube, and the DNA fragments were separated by a capillary tube containing
the gel matrix.
Chapter 1-Materials and Methods
52
Table B-8. Reaction mixture for sequencing and cycler conditions
Reagents Volume [µL] Time T [°C] cycle
dest. Water 5.0 1-2 min 96
6 x BigDye buffer 1.5 10 sec 96
BigDye 3.1 mix 1.0 5 sec 45-60 25 cycles
Primer (10 µM) 0.5 4 min 60
Mix 8.0 Hold 4
DNA template[10-20 ng] 2.0
Total volume 10
53
Chapter 1-Results
C RESULTS
On behalf of the SONDE project, our collaborative project partners developed two
microfluidic platforms in parallel: the lab-on-chip, and the LabDisc. The main aim of this
study was to develop or establish basic methods for the nucleic acid testing workflow for
the detection of category “A” biothreat pathogens, and to optimize these methods for
their integration into the microfluidic MDx platform. Finally, the developed MDx platform
would tested for detection of the biothreat agents and the results compared with the
manual laboratory methods.
C.1 DEVELOPMENT OF METHODS FOR THE LAB-ON-CHIP PLATFORM
The Lab-on-chip (LOC) method combines three diagnostic steps: target enrichment,
nucleic acid purification, and nucleic acid detection. In this work, target enrichment on
lab-on-chip is presented only. The small amount of sample volume (10 µl to 100 µl) can
be applied to a miniaturized molecular diagnostic system like the LOC. This factor limits
the sensitivity of molecular biological assays. Therefore, an approach to concentrate the
pathogen has been tested on a LOC in order to enhance the sensitivity of the diagnostic
system.
C.1.1 DEVELOPMENT OF METHOD FOR LABELING OF VIRUSES WITH A FLUORESCENCE
DYE
The ability to concentrate of bacteria on an LOC system was successfully demonstrated
previously (Puchberger-Enengl, Podszun et al. 2011). To demonstrate the concentration
of viruses on this LOC system, two viruses were used as model organisms: 1) YFV 17D
as a model for small RNA viruses, and 2) CP 19 as a model for DNA viruses. Both of
these viruses were cultivated on cell culture in large amounts, and purified using
ultracentrifugation as described in Materials and Methods. The purified viruses were then
labeled with a DiOC6(3) fluorescence dye as described above in the methods. To check
the quality of the labeled viruses, 10 µl of fluorescently labeled CP 19 and YFV 17D in
10-fold dilutions were dried directly on a glass slide and fixed with 4 % of formaldehyde
for 20 min. Then, the slides were analyzed under a fluorescence microscope. The
fluorescently labeled CP 19 and their aggregates were clearly visible as green spots
under the fluorescence microscope (Fig. C-1). Similarly, fluorescently labeled YFV 17D
aggregates were also visible as green spots (data not shown). These labeled viruses are
used in the next steps to investigate the microfluidic capture of viruses on the LOC
system.
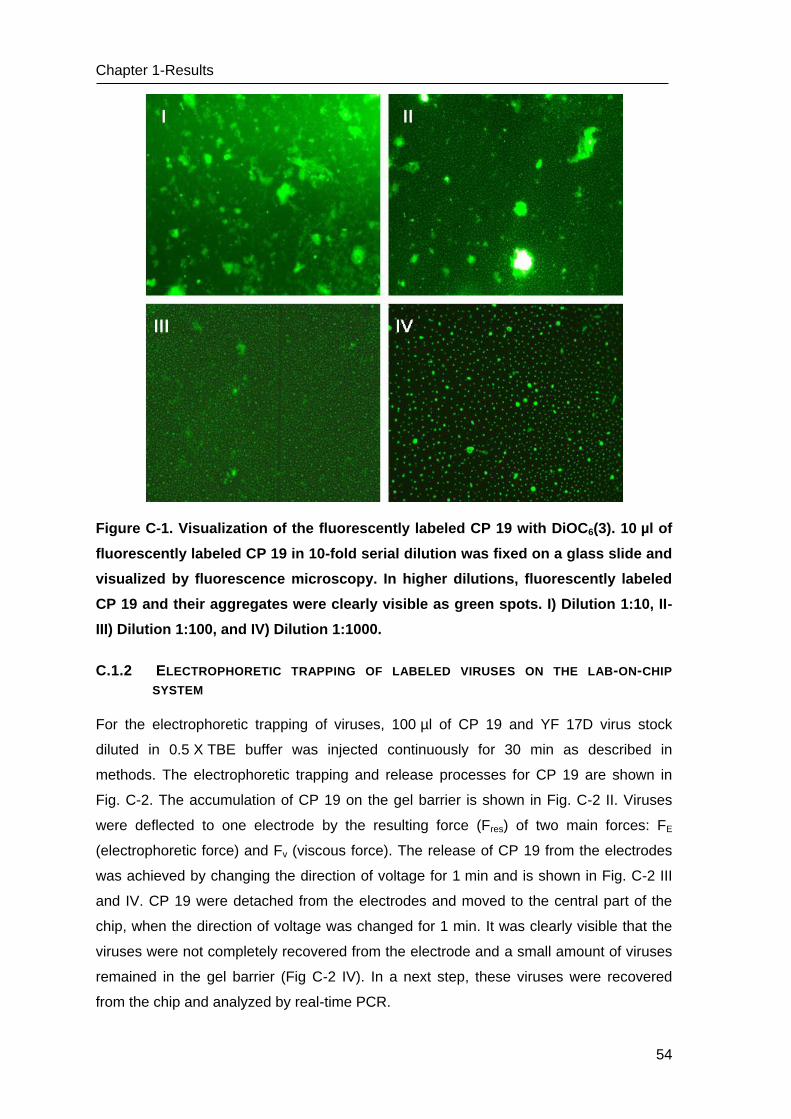
Chapter 1-Results
54
Figure C-1. Visualization of the fluorescently labeled CP 19 with DiOC6(3). 10 µl of
fluorescently labeled CP 19 in 10-fold serial dilution was fixed on a glass slide and
visualized by fluorescence microscopy. In higher dilutions, fluorescently labeled
CP 19 and their aggregates were clearly visible as green spots. I) Dilution 1:10, II-
III) Dilution 1:100, and IV) Dilution 1:1000.
C.1.2 ELECTROPHORETIC TRAPPING OF LABELED VIRUSES ON THE LAB-ON-CHIP
SYSTEM
For the electrophoretic trapping of viruses, 100 µl of CP 19 and YF 17D virus stock
diluted in 0.5 X TBE buffer was injected continuously for 30 min as described in
methods. The electrophoretic trapping and release processes for CP 19 are shown in
Fig. C-2. The accumulation of CP 19 on the gel barrier is shown in Fig. C-2 II. Viruses
were deflected to one electrode by the resulting force (Fres) of two main forces: FE
(electrophoretic force) and Fv (viscous force). The release of CP 19 from the electrodes
was achieved by changing the direction of voltage for 1 min and is shown in Fig. C-2 III
and IV. CP 19 were detached from the electrodes and moved to the central part of the
chip, when the direction of voltage was changed for 1 min. It was clearly visible that the
viruses were not completely recovered from the electrode and a small amount of viruses
remained in the gel barrier (Fig C-2 IV). In a next step, these viruses were recovered
from the chip and analyzed by real-time PCR.
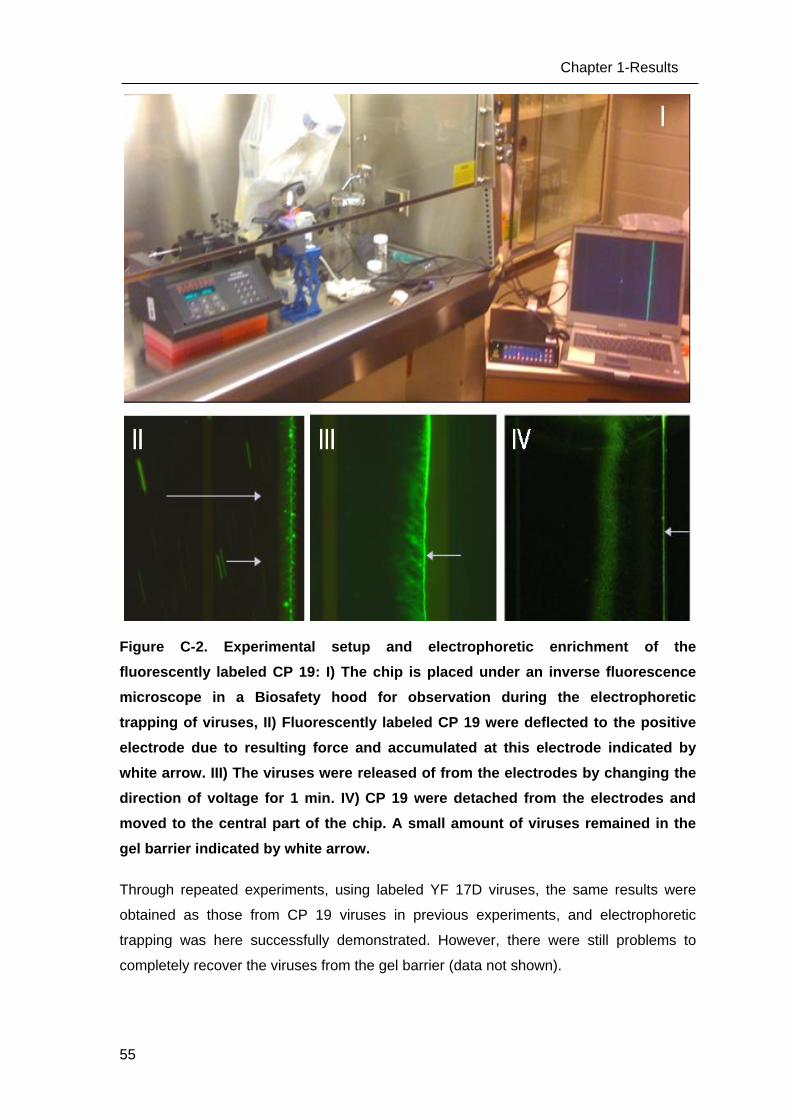
55
Chapter 1-Results
Figure C-2. Experimental setup and electrophoretic enrichment of the
fluorescently labeled CP 19: I) The chip is placed under an inverse fluorescence
microscope in a Biosafety hood for observation during the electrophoretic
trapping of viruses, II) Fluorescently labeled CP 19 were deflected to the positive
electrode due to resulting force and accumulated at this electrode indicated by
white arrow. III) The viruses were released of from the electrodes by changing the
direction of voltage for 1 min. IV) CP 19 were detached from the electrodes and
moved to the central part of the chip. A small amount of viruses remained in the
gel barrier indicated by white arrow.
Through repeated experiments, using labeled YF 17D viruses, the same results were
obtained as those from CP 19 viruses in previous experiments, and electrophoretic
trapping was here successfully demonstrated. However, there were still problems to
completely recover the viruses from the gel barrier (data not shown).
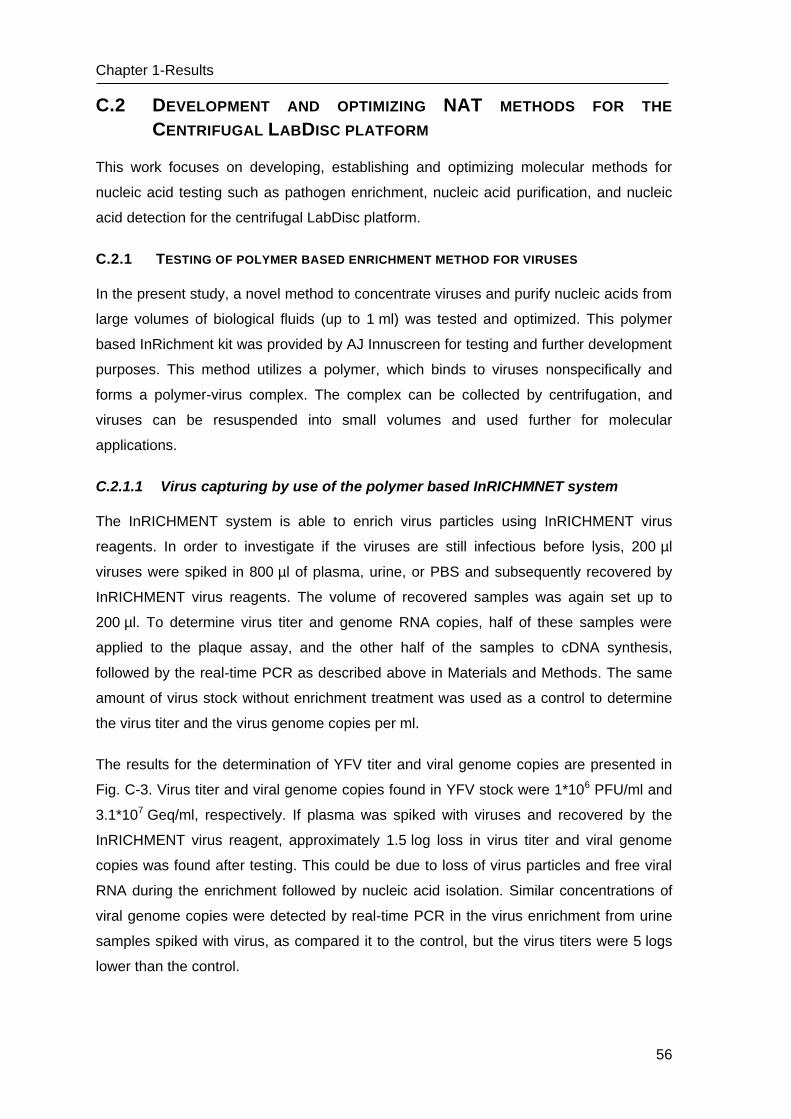
Chapter 1-Results
56
C.2 DEVELOPMENT AND OPTIMIZING NAT METHODS FOR THE
CENTRIFUGAL LABDISC PLATFORM
This work focuses on developing, establishing and optimizing molecular methods for
nucleic acid testing such as pathogen enrichment, nucleic acid purification, and nucleic
acid detection for the centrifugal LabDisc platform.
C.2.1 TESTING OF POLYMER BASED ENRICHMENT METHOD FOR VIRUSES
In the present study, a novel method to concentrate viruses and purify nucleic acids from
large volumes of biological fluids (up to 1 ml) was tested and optimized. This polymer
based InRichment kit was provided by AJ Innuscreen for testing and further development
purposes. This method utilizes a polymer, which binds to viruses nonspecifically and
forms a polymer-virus complex. The complex can be collected by centrifugation, and
viruses can be resuspended into small volumes and used further for molecular
applications.
C.2.1.1 Virus capturing by use of the polymer based InRICHMNET system
The InRICHMENT system is able to enrich virus particles using InRICHMENT virus
reagents. In order to investigate if the viruses are still infectious before lysis, 200 µl
viruses were spiked in 800 µl of plasma, urine, or PBS and subsequently recovered by
InRICHMENT virus reagents. The volume of recovered samples was again set up to
200 µl. To determine virus titer and genome RNA copies, half of these samples were
applied to the plaque assay, and the other half of the samples to cDNA synthesis,
followed by the real-time PCR as described above in Materials and Methods. The same
amount of virus stock without enrichment treatment was used as a control to determine
the virus titer and the virus genome copies per ml.
The results for the determination of YFV titer and viral genome copies are presented in
Fig. C-3. Virus titer and viral genome copies found in YFV stock were 1*106 PFU/ml and
3.1*107 Geq/ml, respectively. If plasma was spiked with viruses and recovered by the
InRICHMENT virus reagent, approximately 1.5 log loss in virus titer and viral genome
copies was found after testing. This could be due to loss of virus particles and free viral
RNA during the enrichment followed by nucleic acid isolation. Similar concentrations of
viral genome copies were detected by real-time PCR in the virus enrichment from urine
samples spiked with virus, as compared it to the control, but the virus titers were 5 logs
lower than the control.
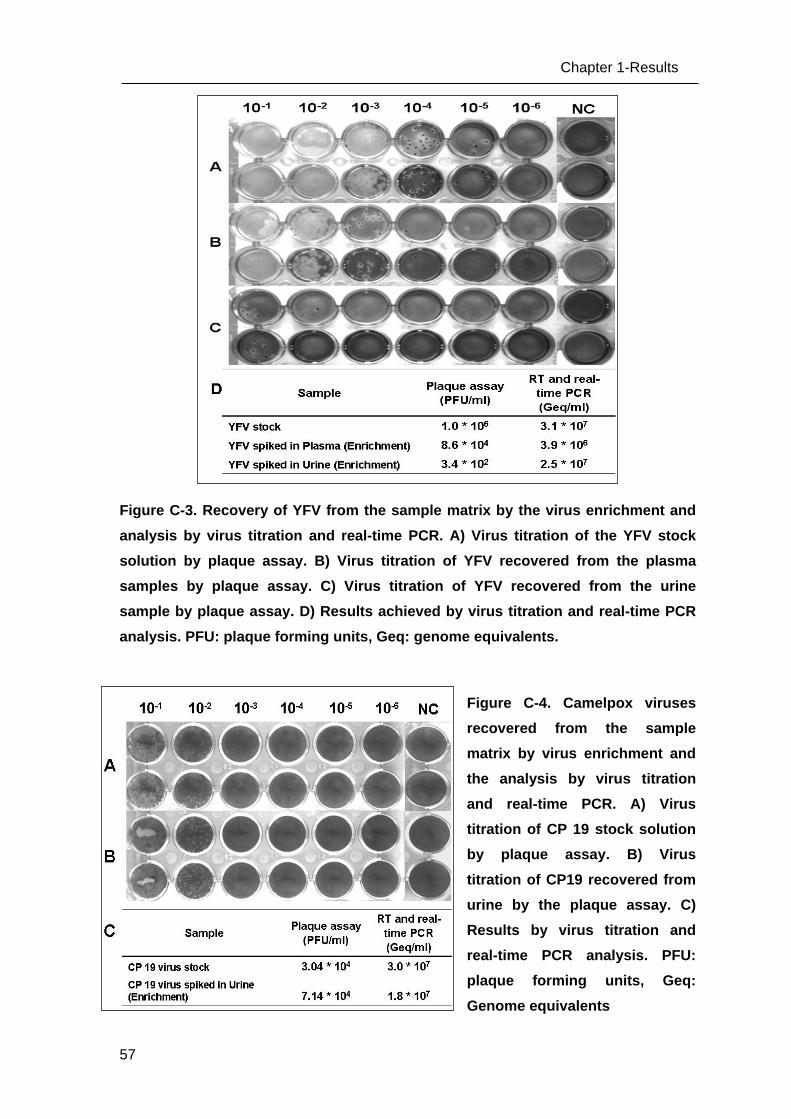
57
Chapter 1-Results
Figure C-3. Recovery of YFV from the sample matrix by the virus enrichment and
analysis by virus titration and real-time PCR. A) Virus titration of the YFV stock
solution by plaque assay. B) Virus titration of YFV recovered from the plasma
samples by plaque assay. C) Virus titration of YFV recovered from the urine
sample by plaque assay. D) Results achieved by virus titration and real-time PCR
analysis. PFU: plaque forming units, Geq: genome equivalents.
Figure C-4. Camelpox viruses
recovered from the sample
matrix by virus enrichment and
the analysis by virus titration
and real-time PCR. A) Virus
titration of CP 19 stock solution
by plaque assay. B) Virus
titration of CP19 recovered from
urine by the plaque assay. C)
Results by virus titration and
real-time PCR analysis. PFU:
plaque forming units, Geq:
Genome equivalents
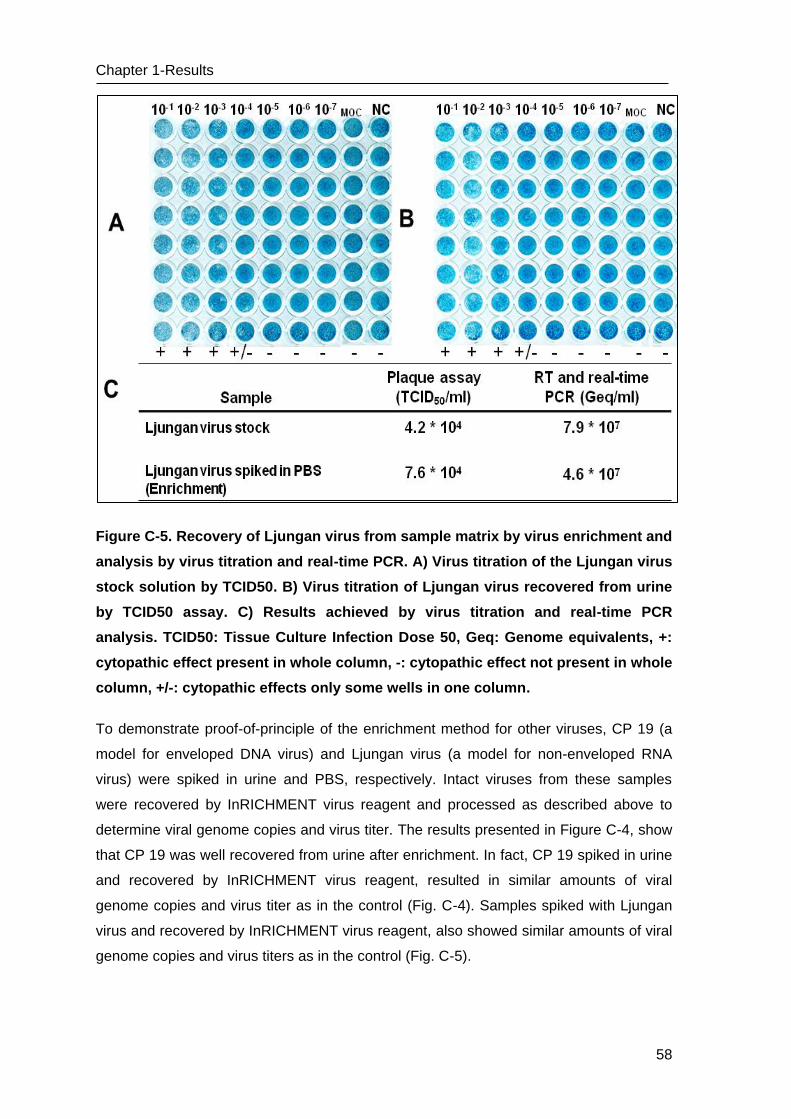
Chapter 1-Results
58
Figure C-5. Recovery of Ljungan virus from sample matrix by virus enrichment and
analysis by virus titration and real-time PCR. A) Virus titration of the Ljungan virus
stock solution by TCID50. B) Virus titration of Ljungan virus recovered from urine
by TCID50 assay. C) Results achieved by virus titration and real-time PCR
analysis. TCID50: Tissue Culture Infection Dose 50, Geq: Genome equivalents, +:
cytopathic effect present in whole column, -: cytopathic effect not present in whole
column, +/-: cytopathic effects only some wells in one column.
To demonstrate proof-of-principle of the enrichment method for other viruses, CP 19 (a
model for enveloped DNA virus) and Ljungan virus (a model for non-enveloped RNA
virus) were spiked in urine and PBS, respectively. Intact viruses from these samples
were recovered by InRICHMENT virus reagent and processed as described above to
determine viral genome copies and virus titer. The results presented in Figure C-4, show
that CP 19 was well recovered from urine after enrichment. In fact, CP 19 spiked in urine
and recovered by InRICHMENT virus reagent, resulted in similar amounts of viral
genome copies and virus titer as in the control (Fig. C-4). Samples spiked with Ljungan
virus and recovered by InRICHMENT virus reagent, also showed similar amounts of viral
genome copies and virus titers as in the control (Fig. C-5).

59
Chapter 1-Results
C.2.1.2 Analysis of polymer and concentrated viruses in polymer by Electron
microscopy
To investigate the functionality of the InRICHMENT reagents, the virus samples were
analyzed for polymer-virus complexes by electron microscopy after enrichment.
Orthopox virus particles have a size of 200x300 nm and a typical morphology. Therefore,
they are easy to detect by electron microscopy. The Camelpox virus was chosen with the
virus titer of 1.5*109 PFU/ml for this study. 50 µl of virus supernatant was added to PBS
to a final volume of 1 ml and recovered by InRICHMENT reagents into 50 µl of reagent 3.
This should completely dissolve the polymer complex. This sample was analyzed by
electron microscopy after appropriate inactivation of the virus.
Polymer from InRICHMENT kit forms
complexes when the precipitation reagent
was added to the polymer. The structure of
polymer complexes was revealed under
the electron microscope. The polymer
forms threadlike structure with a thickness
of about 5 - 10 nm, which are again
complexes in dense networks (Fig. C-6 A-
B). The typical morphology of orthopox
viruses was visible by electron microscopy
in the control with Camelpox virus (Fig.C-6
C). In the sample, where Camelpox viruses
were recovered by InRICHMENT reagents,
virus aggregates were clearly visible and
the polymer structure was completely
dissolved, as expected. The Camelpox
viruses were surrounded by an excess of
membrane debris of cell origin from the
virus supernatant (Fig. C-6 D-F). The
results here suggest that the viruses and
cell membrane debris were captured by
the dense and complex network of the
polymer and could be collected in a pellet
through centrifugation.
Figure C-6. Electron micrographs of
polymer and Camelpox virus. A-B) Electron
micrograph of polymer complex. C)
Electron micrograph of Camelpox virus. D-
F) Electron micrograph of polymer-virus
complex after enrichment. Bars: A = 500
nm, B = 200 nm, C = 200 nm, D = 200 nm, E
= 1 µm, F = 1 µm.
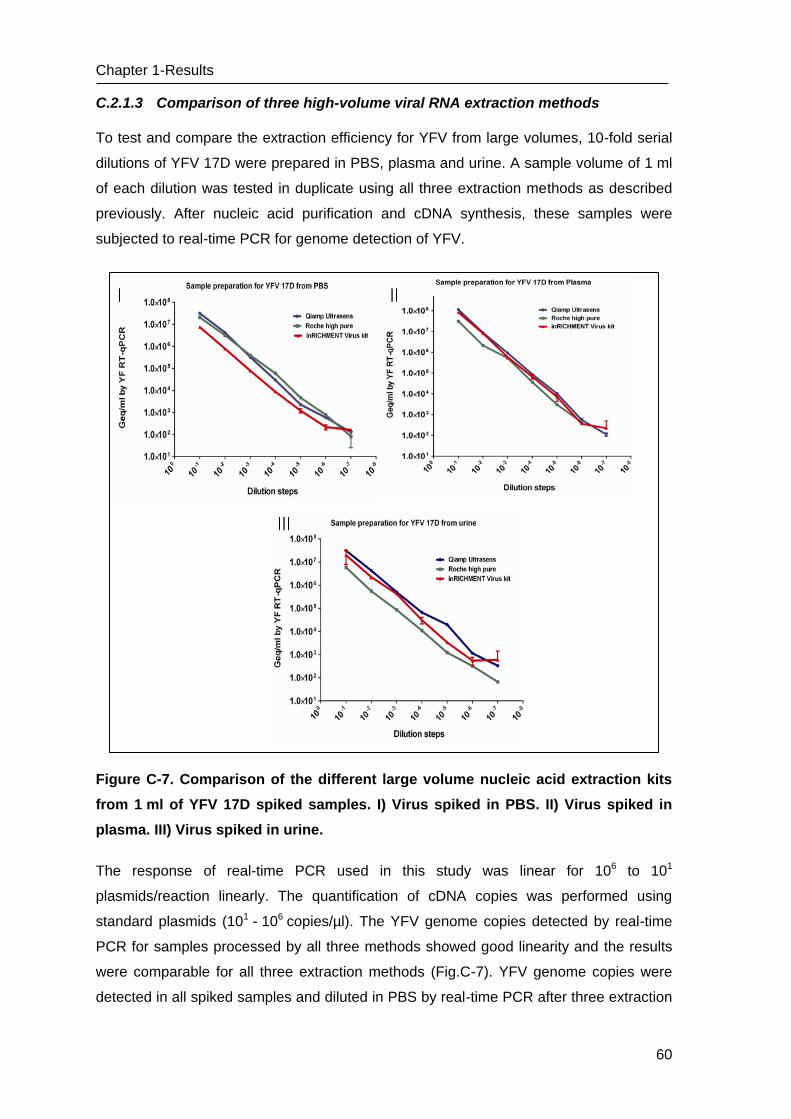
Chapter 1-Results
60
C.2.1.3 Comparison of three high-volume viral RNA extraction methods
To test and compare the extraction efficiency for YFV from large volumes, 10-fold serial
dilutions of YFV 17D were prepared in PBS, plasma and urine. A sample volume of 1 ml
of each dilution was tested in duplicate using all three extraction methods as described
previously. After nucleic acid purification and cDNA synthesis, these samples were
subjected to real-time PCR for genome detection of YFV.
Figure C-7. Comparison of the different large volume nucleic acid extraction kits
from 1 ml of YFV 17D spiked samples. I) Virus spiked in PBS. II) Virus spiked in
plasma. III) Virus spiked in urine.
The response of real-time PCR used in this study was linear for 106 to 101
plasmids/reaction linearly. The quantification of cDNA copies was performed using
standard plasmids (101 - 106 copies/µl). The YFV genome copies detected by real-time
PCR for samples processed by all three methods showed good linearity and the results
were comparable for all three extraction methods (Fig.C-7). YFV genome copies were
detected in all spiked samples and diluted in PBS by real-time PCR after three extraction
61
Chapter 1-Results
methods. The results showed that the number of YFV genome copies obtained by High
Pure Viral nucleic acid in the large volume system was higher than the two other
methods for samples diluted in PBS (Fig. C-7 I). In samples diluted in plasma and urine,
higher YFV genome copies were found by real-time PCR for extraction after QIamp
Ultrasens system, when compared to the other two systems. Thus, the higher dilutions
containing the lowest viral load were detected with greater sensitivity using the QIamp
Ultrasens system and InRICHMENT DNA/RNA system than with the High Pure Viral
nucleic acid large volume system (Fig. C-7 II-III). For instance, the InRichment RNA/DNA
system detected the highest amount of genome copies in the most dilute of all three
spiked samples. This was observed for all the experiments.
C.2.2 DEVELOPMENT OF A SAMPLE PREPARATION METHOD FOR VARIOUS BIOTHREAT
AGENTS
While many protocols and commercial kits exist for purification of DNA or RNA, most are
optimized for a single sample type or organism type. My goal was to develop a single kit
and protocol that can process a variety of samples and organism types, including
bacterial spores from biothreat agents such as Bacillus anthracis. In commercial kits,
samples are usually incubated with a silica-gel membrane to bind in order to extract the
nucleic acids. This procedure is labor-intensive and is not suitable for automation. In
contrast, magnetic particles based kits are easily adaptable to automated nucleic acid
purification. Therefore, the aim was to develop and optimize a nucleic acid extraction kit
based on magnetic particles. Development of this kit was done in collaboration with AJ
Innuscreen Company using reagents from the existing kits in combination with
paramagnetic beads.
C.2.2.1 Pre-testing of the Instant MP basic extraction method on different
matrices
The Instant MP basic extraction kit using paramagnetic particles (MAGs) was tested on 4
selected model pathogens: 1) YFV/ RVFV as a model for RNA viruses 2) Camelpox
virus/ Vaccinia virus as a model for DNA viruses 3) Yersinia pestis as a model for
gram negative bacteria 4) Bacillus anthracis as a model for gram positive bacteria.
Whole blood, plasma, and serum were chosen as matrices due to the importance of
these samples in molecular diagnostics. The same amount of these four model
organisms was spiked in PBS, plasma, serum and whole blood, and then RNA/DNA was
extracted using the Instant MP basic extraction method. These nucleic acid extracts were
analyzed by real-time PCR as described above in Materials and Methods.
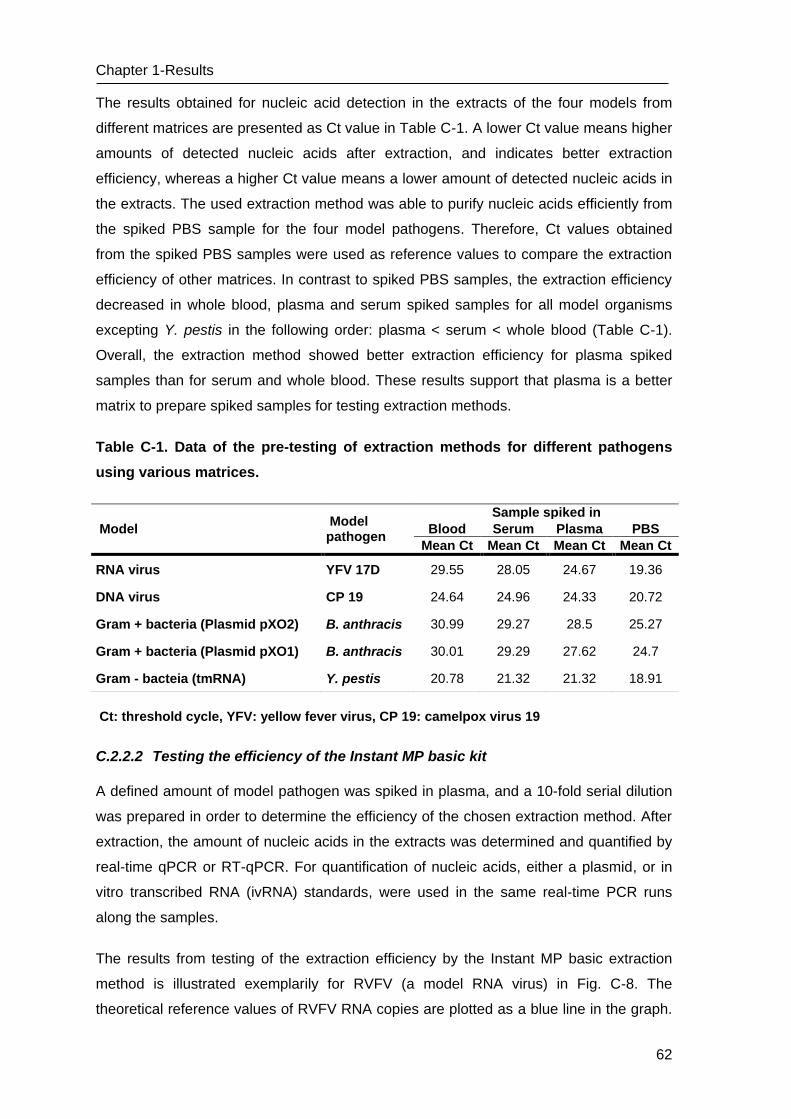
Chapter 1-Results
62
The results obtained for nucleic acid detection in the extracts of the four models from
different matrices are presented as Ct value in Table C-1. A lower Ct value means higher
amounts of detected nucleic acids after extraction, and indicates better extraction
efficiency, whereas a higher Ct value means a lower amount of detected nucleic acids in
the extracts. The used extraction method was able to purify nucleic acids efficiently from
the spiked PBS sample for the four model pathogens. Therefore, Ct values obtained
from the spiked PBS samples were used as reference values to compare the extraction
efficiency of other matrices. In contrast to spiked PBS samples, the extraction efficiency
decreased in whole blood, plasma and serum spiked samples for all model organisms
excepting Y. pestis in the following order: plasma < serum < whole blood (Table C-1).
Overall, the extraction method showed better extraction efficiency for plasma spiked
samples than for serum and whole blood. These results support that plasma is a better
matrix to prepare spiked samples for testing extraction methods.
Table C-1. Data of the pre-testing of extraction methods for different pathogens
using various matrices.
Ct: threshold cycle, YFV: yellow fever virus, CP 19: camelpox virus 19
C.2.2.2 Testing the efficiency of the Instant MP basic kit
A defined amount of model pathogen was spiked in plasma, and a 10-fold serial dilution
was prepared in order to determine the efficiency of the chosen extraction method. After
extraction, the amount of nucleic acids in the extracts was determined and quantified by
real-time qPCR or RT-qPCR. For quantification of nucleic acids, either a plasmid, or in
vitro transcribed RNA (ivRNA) standards, were used in the same real-time PCR runs
along the samples.
The results from testing of the extraction efficiency by the Instant MP basic extraction
method is illustrated exemplarily for RVFV (a model RNA virus) in Fig. C-8. The
theoretical reference values of RVFV RNA copies are plotted as a blue line in the graph.
Model Model pathogen
Sample spiked in
Blood Serum Plasma PBS
Mean Ct Mean Ct Mean Ct Mean Ct
RNA virus YFV 17D 29.55 28.05 24.67 19.36
DNA virus CP 19 24.64 24.96 24.33 20.72
Gram + bacteria (Plasmid pXO2) B. anthracis 30.99 29.27 28.5 25.27
Gram + bacteria (Plasmid pXO1) B. anthracis 30.01 29.29 27.62 24.7
Gram - bacteia (tmRNA) Y. pestis 20.78 21.32 21.32 18.91
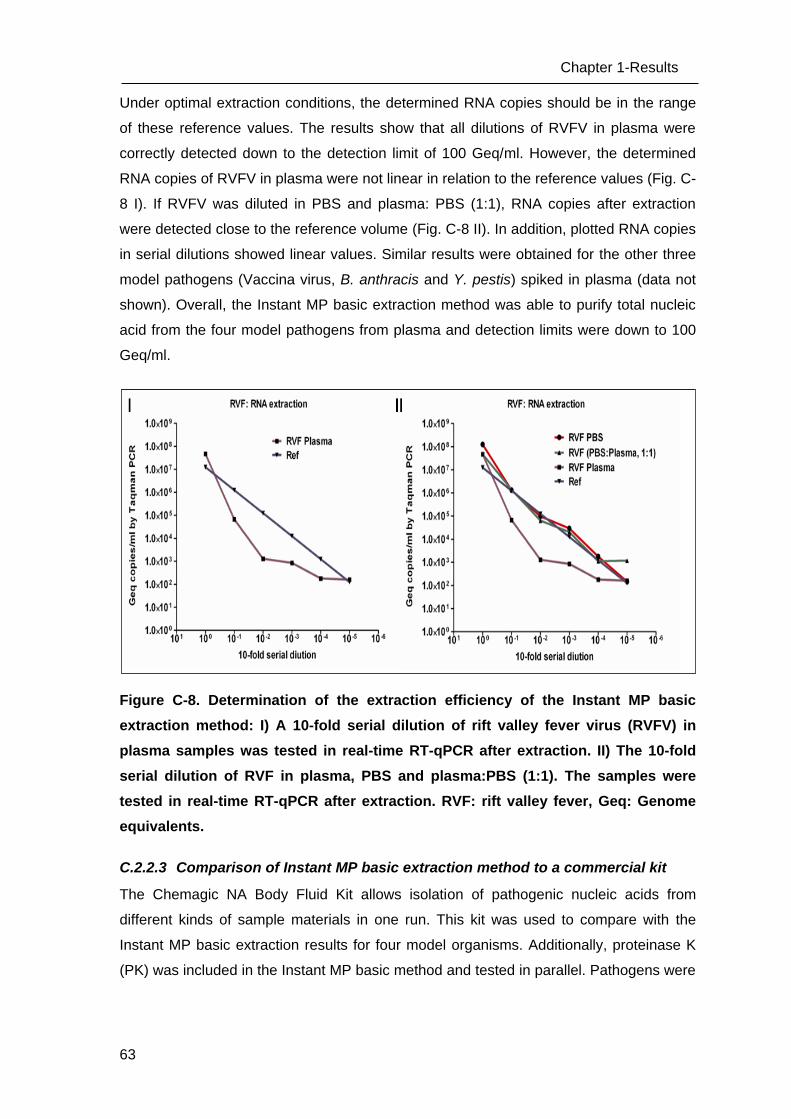
63
Chapter 1-Results
Under optimal extraction conditions, the determined RNA copies should be in the range
of these reference values. The results show that all dilutions of RVFV in plasma were
correctly detected down to the detection limit of 100 Geq/ml. However, the determined
RNA copies of RVFV in plasma were not linear in relation to the reference values (Fig. C-
8 I). If RVFV was diluted in PBS and plasma: PBS (1:1), RNA copies after extraction
were detected close to the reference volume (Fig. C-8 II). In addition, plotted RNA copies
in serial dilutions showed linear values. Similar results were obtained for the other three
model pathogens (Vaccina virus, B. anthracis and Y. pestis) spiked in plasma (data not
shown). Overall, the Instant MP basic extraction method was able to purify total nucleic
acid from the four model pathogens from plasma and detection limits were down to 100
Geq/ml.
Figure C-8. Determination of the extraction efficiency of the Instant MP basic
extraction method: I) A 10-fold serial dilution of rift valley fever virus (RVFV) in
plasma samples was tested in real-time RT-qPCR after extraction. II) The 10-fold
serial dilution of RVF in plasma, PBS and plasma:PBS (1:1). The samples were
tested in real-time RT-qPCR after extraction. RVF: rift valley fever, Geq: Genome
equivalents.
C.2.2.3 Comparison of Instant MP basic extraction method to a commercial kit
The Chemagic NA Body Fluid Kit allows isolation of pathogenic nucleic acids from
different kinds of sample materials in one run. This kit was used to compare with the
Instant MP basic extraction results for four model organisms. Additionally, proteinase K
(PK) was included in the Instant MP basic method and tested in parallel. Pathogens were
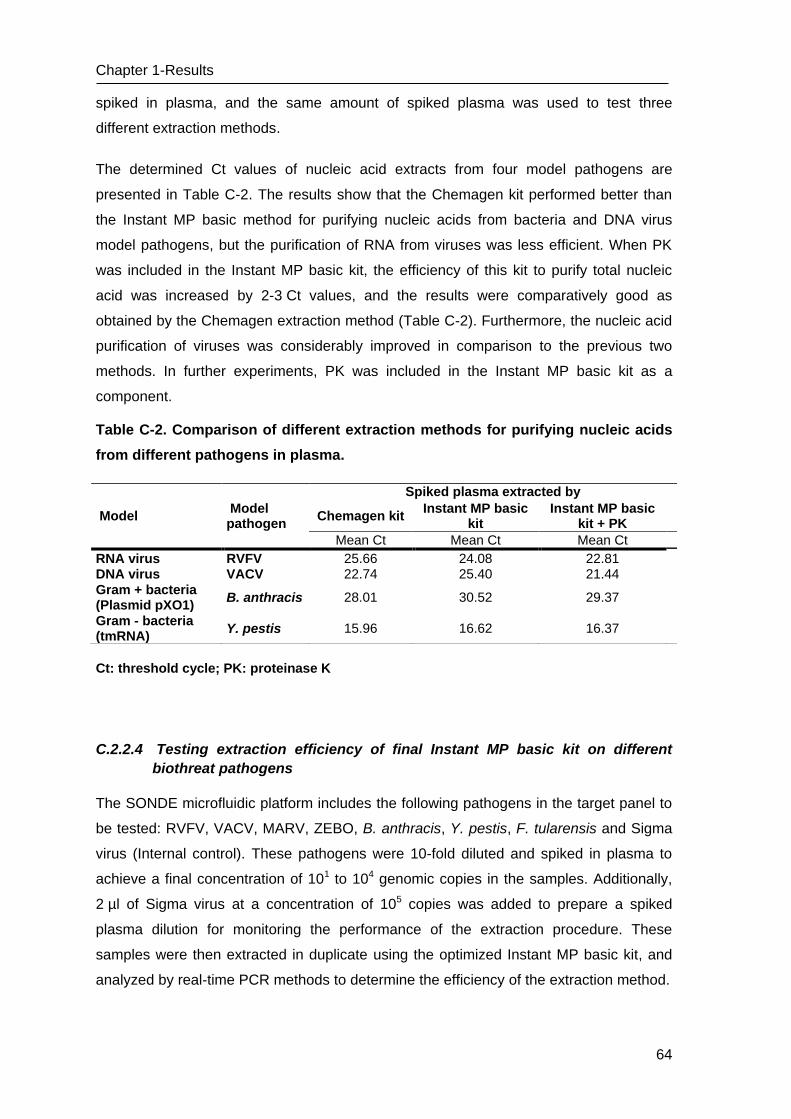
Chapter 1-Results
64
spiked in plasma, and the same amount of spiked plasma was used to test three
different extraction methods.
The determined Ct values of nucleic acid extracts from four model pathogens are
presented in Table C-2. The results show that the Chemagen kit performed better than
the Instant MP basic method for purifying nucleic acids from bacteria and DNA virus
model pathogens, but the purification of RNA from viruses was less efficient. When PK
was included in the Instant MP basic kit, the efficiency of this kit to purify total nucleic
acid was increased by 2-3 Ct values, and the results were comparatively good as
obtained by the Chemagen extraction method (Table C-2). Furthermore, the nucleic acid
purification of viruses was considerably improved in comparison to the previous two
methods. In further experiments, PK was included in the Instant MP basic kit as a
component.
Table C-2. Comparison of different extraction methods for purifying nucleic acids
from different pathogens in plasma.
Ct: threshold cycle; PK: proteinase K
C.2.2.4 Testing extraction efficiency of final Instant MP basic kit on different
biothreat pathogens
The SONDE microfluidic platform includes the following pathogens in the target panel to
be tested: RVFV, VACV, MARV, ZEBO, B. anthracis, Y. pestis, F. tularensis and Sigma
virus (Internal control). These pathogens were 10-fold diluted and spiked in plasma to
achieve a final concentration of 101 to 104 genomic copies in the samples. Additionally,
2 µl of Sigma virus at a concentration of 105 copies was added to prepare a spiked
plasma dilution for monitoring the performance of the extraction procedure. These
samples were then extracted in duplicate using the optimized Instant MP basic kit, and
analyzed by real-time PCR methods to determine the efficiency of the extraction method.
Model Model pathogen
Spiked plasma extracted by
Chemagen kit Instant MP basic
kit Instant MP basic
kit + PK
Mean Ct Mean Ct Mean Ct
RNA virus RVFV 25.66 24.08 22.81 DNA virus VACV 22.74 25.40 21.44
Gram + bacteria (Plasmid pXO1)
B. anthracis 28.01 30.52 29.37
Gram - bacteria (tmRNA)
Y. pestis 15.96 16.62 16.37
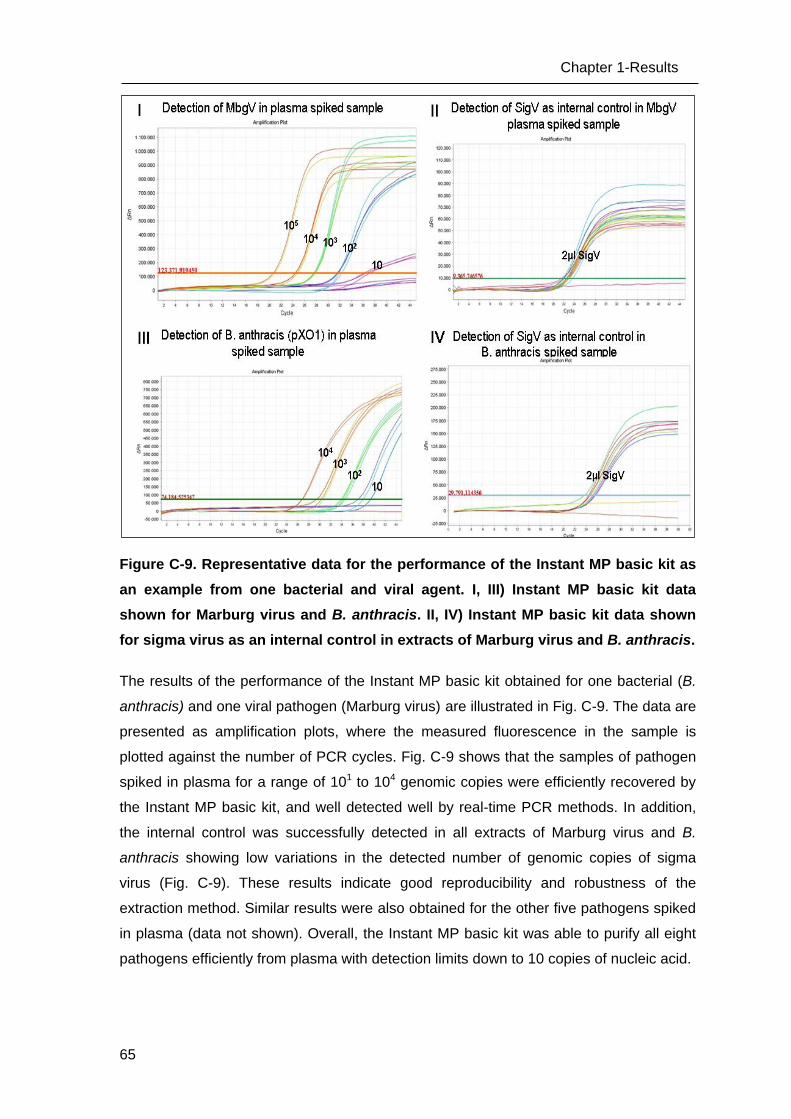
65
Chapter 1-Results
Figure C-9. Representative data for the performance of the Instant MP basic kit as
an example from one bacterial and viral agent. I, III) Instant MP basic kit data
shown for Marburg virus and B. anthracis. II, IV) Instant MP basic kit data shown
for sigma virus as an internal control in extracts of Marburg virus and B. anthracis.
The results of the performance of the Instant MP basic kit obtained for one bacterial (B.
anthracis) and one viral pathogen (Marburg virus) are illustrated in Fig. C-9. The data are
presented as amplification plots, where the measured fluorescence in the sample is
plotted against the number of PCR cycles. Fig. C-9 shows that the samples of pathogen
spiked in plasma for a range of 101 to 104 genomic copies were efficiently recovered by
the Instant MP basic kit, and well detected well by real-time PCR methods. In addition,
the internal control was successfully detected in all extracts of Marburg virus and B.
anthracis showing low variations in the detected number of genomic copies of sigma
virus (Fig. C-9). These results indicate good reproducibility and robustness of the
extraction method. Similar results were also obtained for the other five pathogens spiked
in plasma (data not shown). Overall, the Instant MP basic kit was able to purify all eight
pathogens efficiently from plasma with detection limits down to 10 copies of nucleic acid.
Chapter 1-Results
66
C.2.3 ESTABLISHMENT AND OPTIMIZATION OF NUCLEIC ACID DETECTION FOR THE
CENTRIFUGAL LABDISC PLATFORM
While PCR methods require several temperature cycles to amplify the target nucleic
acid, isothermal amplification is performed at a single temperature. This advantage of
isothermal techniques allows to simplify the process of the diagnostic platform.
Therefore, the SONDE partner from UMG developed a specific and sensitive isothermal
amplification method using the Recombinase Polymerase Amplification (RPA) for
detection of the biothreat agents. In this work, RPA assays were established as a
manual reference method and optimized for the centrifugal LabDisc platform.
C.2.3.1 Performance of recombinase polymerase amplification
To detect category A Biothreat pathogens included in the SONDE target panel, nine
specific and sensitive RPA assays were developed by our project partner (Euler, Wang
et al. 2012; Euler, Wang et al. 2012). To determine the performance of RPA, a 10-fold
serial dilution of the nucleic acids from target pathogens were prepared and tested with
RPA. The same samples were measured by real-time PCR and results were compared
to those from RPA.
The amplification plots of real-time PCR and RPA are illustrated in Fig. C-10 taking an
example of one DNA and one RNA target. In real-time PCR, the measured fluorescence
of the samples was plotted against the threshold cycles. For RPA amplification plots, the
measured fluorescence of the samples was plotted against time (min). A comparison of
the results from RPA and real-time PCR showed that both of these methods were able to
detect presented B. anthracis pXO1 plasmid as DNA target down to the detection limit of
10 copies, and Marburg virus genomic RNA as an RNA target down to the detection limit
of 100 copies. These results clearly show that the performance of RPA is as good as
real-time PCR. Additionally, an RPA run requires less than 15 min for amplification of
DNA and RNA target, whereas real-time PCR requires more than 90 min.
For more insight into RPA performance, it was tested with nucleic acid extracts of target
pathogens, previously used to determine the extraction efficiency. The results of RPA
performance are shown in table C-3 for each model pathogen. These data indicate
excellent sensitivity of RPA compared to the results from real-time PCR with a detection
limit of 10-100 Geq/rxn. Furthermore, RPA assays were also tested on nucleic acid
extracts of other pathogens and they performed similarly as real-time PCR assays (data
not shown).
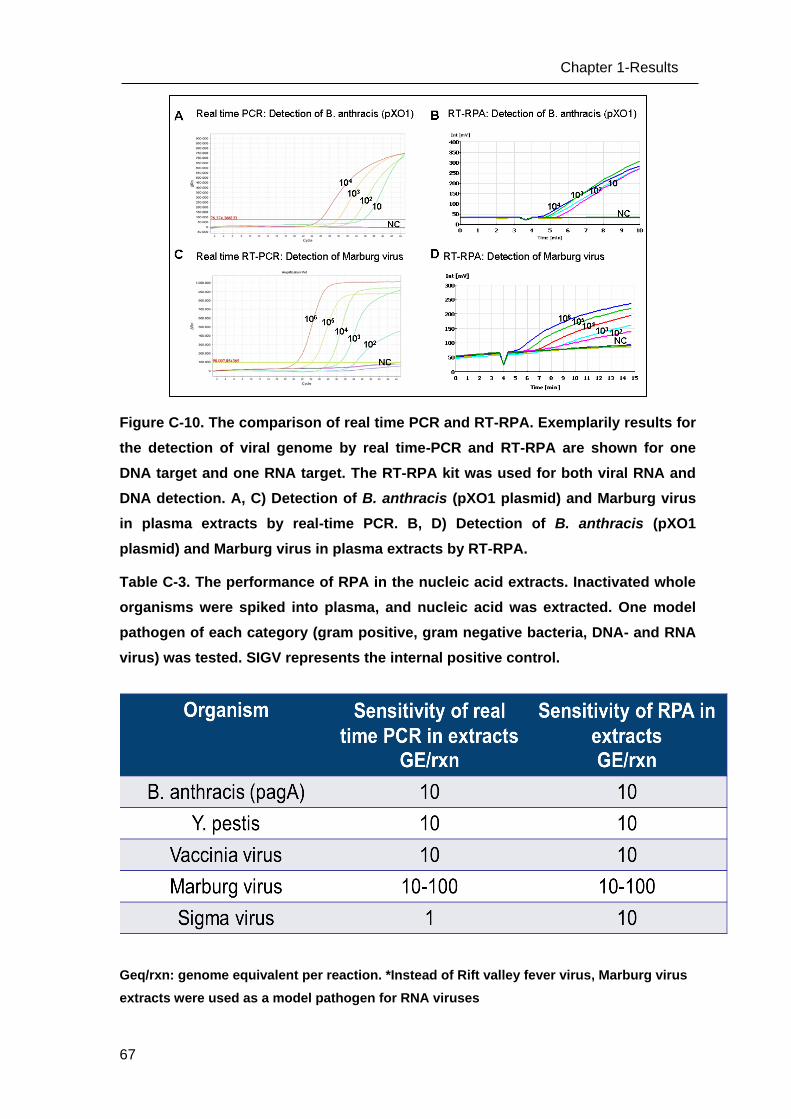
67
Chapter 1-Results
Figure C-10. The comparison of real time PCR and RT-RPA. Exemplarily results for
the detection of viral genome by real time-PCR and RT-RPA are shown for one
DNA target and one RNA target. The RT-RPA kit was used for both viral RNA and
DNA detection. A, C) Detection of B. anthracis (pXO1 plasmid) and Marburg virus
in plasma extracts by real-time PCR. B, D) Detection of B. anthracis (pXO1
plasmid) and Marburg virus in plasma extracts by RT-RPA.
Table C-3. The performance of RPA in the nucleic acid extracts. Inactivated whole
organisms were spiked into plasma, and nucleic acid was extracted. One model
pathogen of each category (gram positive, gram negative bacteria, DNA- and RNA
virus) was tested. SIGV represents the internal positive control.
Geq/rxn: genome equivalent per reaction. *Instead of Rift valley fever virus, Marburg virus
extracts were used as a model pathogen for RNA viruses
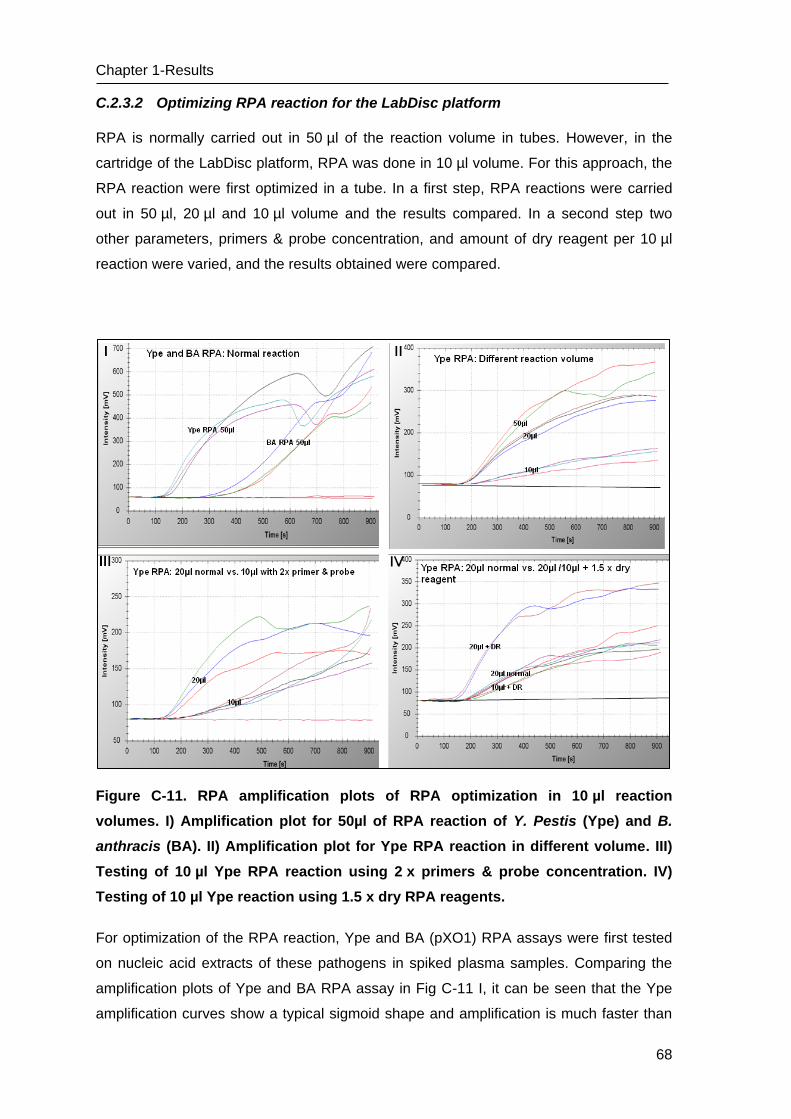
Chapter 1-Results
68
C.2.3.2 Optimizing RPA reaction for the LabDisc platform
RPA is normally carried out in 50 µl of the reaction volume in tubes. However, in the
cartridge of the LabDisc platform, RPA was done in 10 µl volume. For this approach, the
RPA reaction were first optimized in a tube. In a first step, RPA reactions were carried
out in 50 µl, 20 µl and 10 µl volume and the results compared. In a second step two
other parameters, primers & probe concentration, and amount of dry reagent per 10 µl
reaction were varied, and the results obtained were compared.
Figure C-11. RPA amplification plots of RPA optimization in 10 µl reaction
volumes. I) Amplification plot for 50µl of RPA reaction of Y. Pestis (Ype) and B.
anthracis (BA). II) Amplification plot for Ype RPA reaction in different volume. III)
Testing of 10 µl Ype RPA reaction using 2 x primers & probe concentration. IV)
Testing of 10 µl Ype reaction using 1.5 x dry RPA reagents.
For optimization of the RPA reaction, Ype and BA (pXO1) RPA assays were first tested
on nucleic acid extracts of these pathogens in spiked plasma samples. Comparing the
amplification plots of Ype and BA RPA assay in Fig C-11 I, it can be seen that the Ype
amplification curves show a typical sigmoid shape and amplification is much faster than
69
Chapter 1-Results
the BA assays. For this reason, Ype assay was chosen as a model assay and optimized
for 10 µl of reaction volume. For RPA assays performed in 50 µl, 20 µl and 10 µl of the
reaction volumes with the same amount of template DNA, comparisons of the
amplification plots showed the 20 µl RPA reaction gave a similar amplification curve as
the 50 µl of RPA reaction. In contrast to this, the amplification curves for 10 µl of RPA
reactions were flater than those of 20 µl and 50 µl, indicating a lower signal. (Fig C-11 II).
To optimize the RPA reaction in 10 µl, double amount of primers & probe concentration
compared to the normal RPA reactions were tested and the results were compared with
those of the 20 µl standard reaction. Fig C-11 III illustrates the results of these
experiments, and show that the primers & probe concentration has no effect on the
sensitivity of the 10 µl of RPA reaction. However, the use of 1.5 x RPA dry reagents
instead of 1 x RPA dry reagent increased the sensitivity of the 10 µl RPA reaction and
the amplification curves were identical to the normal 20 µl of RPA reaction (Fig. C-11 IV).
Additionally, it can be observed in Fig. C-11 IV that the 20 µl reaction with 1.5 x dry
reagents showed the highest sensitivity among all the normal and optimized reaction.
The results suggest that the RPA reaction can be carried out in a reaction volume of
10 µl and the sensitivity can clearly be increased by increasing the amount of RPA dry
reagents.
C.2.3.3 Testing of the optimized RPA reaction using the GeneSlice cartridges
After optimization of RPA reaction in a 10 µl volume, all the RPA assays were tested with
the optimized protocol using the GeneSlice cartridge, which is mainly used for validation
of the assay by HSG-IMIT.
An RPA assay for each pathogen was prepared in a 100 µl reaction volume as described
in the Material and Methods. The complete RPA reaction including target nucleic acids
were pipetted into the GeneSlice and aliquoted automatically to 10 µl volumes into the
amplification chamber on the GeneSlice by the SONDE player. The RPA reactions were
then monitored by fluorescence measurement. The amplification plots of these RPA
reactions are plotted over time as shown in Figure C-12, as exemples for one DNA and
one RNA target. For BA1 RPA assay, all eight chambers of the GeneSlice gave good
and reproducible fluorescence signals, which were detected after of 7-8 min (Fig. C-12 I).
For RVFV assay, 7 of the 8 chambers gave good and reproducible fluorescence signals
after 6-7 min. During aliquoting of the RVFV assay, the last chamber was empty, and
therefore no signal was obtained in this case. All other RPA assays (Ype, Ftu, ZEboV,
MARV) performed using the Geneslice cartridges provided good results and a

Chapter 1-Results
70
reproducible signal was obtained for each amplification chamber of the GeneSlice
cartridge (data not shown).
Figure C-12. Results from testing of 10 µl RPA reaction using the GeneSlice
cartridges in the LabDisc platform. I) An example of RPA assay in 10 µl for B.
anthracis as a DNA target. II) An example of RPA assay in 10 µl for the Rift Valley
fever virus (RVFV) as an RNA target. The amplification curves are plotted against
time and threshold time is used as a quantitative measurement of the RPA assay.
C.2.4 “SAMPLE TO ANSWER” TESTING OF BIOTHREAT PATHOGENS USING RPA
LABDISC
For the “sample to answer” testing of biothreat pathogens, three bacterial pathogens (B.
anthracis (BA), Y. pestis (Ype) and F. tularensis (Ftu)) were chosen as targets. Testing
samples were prepared by spiking 20 µl of bacterial suspension in 180 µl plasma,
whereas samples with three pathogens were prepared by spiking 20 µl of each bacterial
suspension in 140 µl plasma. 200 µl of these samples was applied to the RPA LabDisc
for “sample to answer” testing as described under B 7.2. The same 200 µl of samples
were manually extracted by Instant MP basic kit, and measured in triplicate by real-time
qPCR and real-time RPA as described above. Results obtained from manual testing
were compared to those obtained from the RPA LabDisc testing as a “sample to answer”
method.
Results for the testing of three bacterial biothreat pathogens by the RPA LabDisc and
manual methods are presented in Table C-4. Testing of the single and multiple
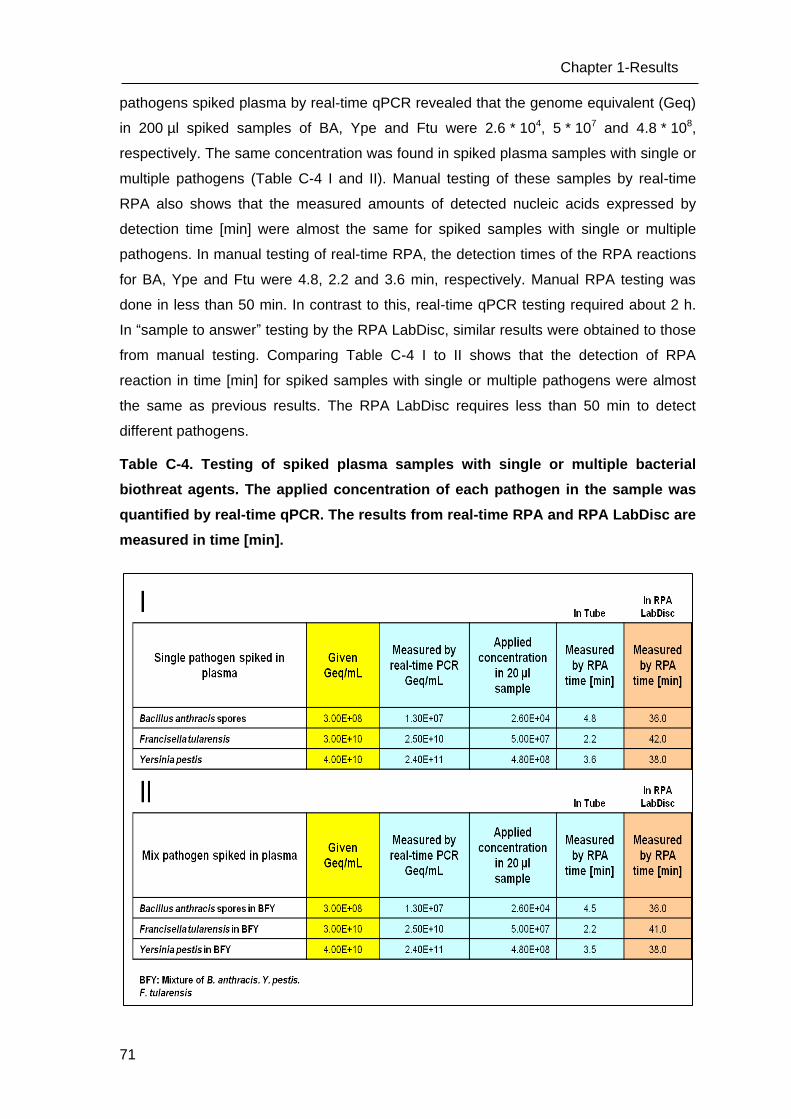
71
Chapter 1-Results
pathogens spiked plasma by real-time qPCR revealed that the genome equivalent (Geq)
in 200 µl spiked samples of BA, Ype and Ftu were 2.6 * 104, 5 * 107 and 4.8 * 108,
respectively. The same concentration was found in spiked plasma samples with single or
multiple pathogens (Table C-4 I and II). Manual testing of these samples by real-time
RPA also shows that the measured amounts of detected nucleic acids expressed by
detection time [min] were almost the same for spiked samples with single or multiple
pathogens. In manual testing of real-time RPA, the detection times of the RPA reactions
for BA, Ype and Ftu were 4.8, 2.2 and 3.6 min, respectively. Manual RPA testing was
done in less than 50 min. In contrast to this, real-time qPCR testing required about 2 h.
In “sample to answer” testing by the RPA LabDisc, similar results were obtained to those
from manual testing. Comparing Table C-4 I to II shows that the detection of RPA
reaction in time [min] for spiked samples with single or multiple pathogens were almost
the same as previous results. The RPA LabDisc requires less than 50 min to detect
different pathogens.
Table C-4. Testing of spiked plasma samples with single or multiple bacterial
biothreat agents. The applied concentration of each pathogen in the sample was
quantified by real-time qPCR. The results from real-time RPA and RPA LabDisc are
measured in time [min].
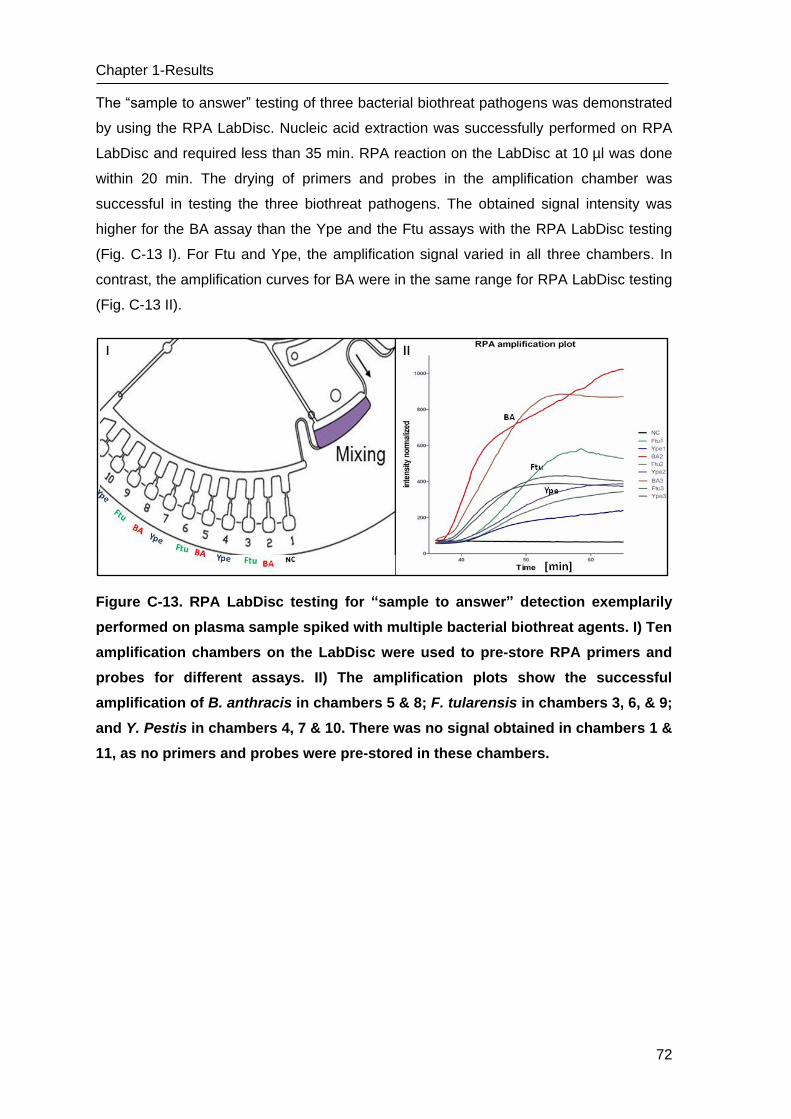
Chapter 1-Results
72
The “sample to answer” testing of three bacterial biothreat pathogens was demonstrated
by using the RPA LabDisc. Nucleic acid extraction was successfully performed on RPA
LabDisc and required less than 35 min. RPA reaction on the LabDisc at 10 µl was done
within 20 min. The drying of primers and probes in the amplification chamber was
successful in testing the three biothreat pathogens. The obtained signal intensity was
higher for the BA assay than the Ype and the Ftu assays with the RPA LabDisc testing
(Fig. C-13 I). For Ftu and Ype, the amplification signal varied in all three chambers. In
contrast, the amplification curves for BA were in the same range for RPA LabDisc testing
(Fig. C-13 II).
Figure C-13. RPA LabDisc testing for “sample to answer” detection exemplarily
performed on plasma sample spiked with multiple bacterial biothreat agents. I) Ten
amplification chambers on the LabDisc were used to pre-store RPA primers and
probes for different assays. II) The amplification plots show the successful
amplification of B. anthracis in chambers 5 & 8; F. tularensis in chambers 3, 6, & 9;
and Y. Pestis in chambers 4, 7 & 10. There was no signal obtained in chambers 1 &
11, as no primers and probes were pre-stored in these chambers.
73
Chapter 1-Discussion
D DISCUSSION
D.1 DEVELOPMENT OF METHODS FOR THE LAB-ON-CHIP PLATFORM
The LOC system by IMTEK for concentrating viruses in small volumes on a chip was
tested and could be later used for NAT by integrated LOC devices. The two following
model pathogens for testing of this approach were chosen: YFV 17D as a model for RNA
viruses and CP 19 virus as a model for DNA virus. As these pathogens can be handled
under Biosafety level-2 conditions easily, these pathogens were chosen for proof-of-
principle testing instead of biothreat pathogens. The LOC system was already tested for
the electrophoretic capture of bacteria on the chip previously (Puchberger-Enengl,
Podszun et al. 2011; Podszun, Vulto et al. 2012). Visual analysis of bacterial pathogen
on microfluidic devices are particularly done using a simple light microscope. In contrast
to these, viral pathogens cannot be analyzed by use of the light microscope, as the size
of viruses ranges from 10 to 300 nm. Electron microscopes (EM) are generally used to
visualize the viruses, but this method required complex sample preparation including
fixation and negative staining of the sample for visualization of viruses. Therefore, EM
was not used to analyze the interaction of viruses in microfluidic chips.
Labeling of external membrane components of a virus such as the capsid or envelope
can be easily done with fluorescent dyes; the labeled viruses can then be visualized
using fluorescence microscopy techniques. This approach was already described for the
analysis of Vaccinia virus in a microfluidic device previously (Demir Akin 2004). This
method labels virus membranes and structural proteins nonspecifically. Therefore, it is
important to use the purified virus suspension to exclude cell debris and other cell culture
contaminants. Using this described approach, the purified YFV 17D and CP 19 viruses
were successfully labeled by lipophilic carbocyanine dyes DiOC6(3). Additionally,
visualized aggregates of labeled viruses were visualized under a fluorescence
microscope. This method has opened new possibilities for our testing of viruses on LOC
devices.
LOC devices for NAT process small sample volume for the analysis. Therefore, the
concentration of pathogens in the applied sample is crucially important for such a test.
Many attempts have been made for concentrating viral pathogens on-chip using the
functionalized particles or electrokinetic methods (Lui, Cady et al. 2009).
Dielectrophoresis was also used for concentration of viral pathogens previously
(Bhattacharya, Salamat et al. 2008). None of the described methods uses
electrophoretic capturing for viruses for microfluidic devices. Surfaces of viruses are
Chapter 1-Discussion
74
made of membranes and proteins containing carboxylate and phosphoryl groups. Due to
these ionized groups, viruses exhibit negative surface charge. Therefore, viruses can be
deflected to the electrode by applying an electrical field. This phenomenon was observed
by on-chip electrophoresis using labeled virus particles. In these experiments, both YFV
17D and CP 19 viruses were attracted to anodes when an electrical field was applied to
the viruses on the chip. By pumping the sample containing viruses through chip over 30
min, viruses were captured by electrophoresis from the sample, and the viruses were
successfully resuspended in a 5 µl volume on the chip by changing the direction of the
electrical field. Using this approach, the sample volume was reduced from 100 µl to 5 µl,
concentrating viruses, which is important for subsequent NAT analysis of viruses on the
chip. However, the viruses were not completely recovered after the electrophoretic
capture. To avoid direct lysis of viruses on the electrode, a polyacrylamide gel barrier
was placed before the electrodes on the chip. Some amount of virus particles was
irreversibly captured in the pores of the polyacrylamide gel. Therefore, it was difficult to
quantify the amount of concentrated viruses by molecular methods. To solve this
problem, the complete concept of the chip needed to be designed without use of the
polyacrylamide gel on the chip.
By working with this LOC system at IMTEK, many disadvantages like small processing
volume, handling of devices, and limitations for integration of components in the chip
fabrication process were found. Furthermore, clinical samples like plasma, serum or
blood could not be used, as on-chip electrophoresis depends on the conductivity of
liquids. Because of this limitation, the use of LOC devices from IMTEK were only
restricted to analysis of swab samples. Considering this experiment, the complete LOC is
re-designed by our project partner and this chip for concentrating the viruses is directly
combined with nucleic acid isolation chip, as described previously (Vulto, Dame et al.
2010). This LOC system is now being tested for its functionality, and will be combined
with other chip modules in future for amplification and detection of nucleic acids to obtain
an integrated MDx device.
D.2 DEVELOPMENT OF MOLECULAR METHODS FOR THE CENTRIFUGAL
LABDISC PLATFORM
Sample preparation, amplification, and detection are the three basic methods in NAT,
which are important to develop the integrated MDx platforms. Many different methods
and protocols are available for all three steps of NAT, but these methods must be
adapted in order to implement them on integrated MDx platforms. In this study, basic
methods for NAT were developed and/or established to make them suitable for the

75
Chapter 1-Discussion
centrifugal LabDisc platform and allow a sensitive detection of the biothreat agents.
Finally, these methods were integrated onto the LAbDisc platform, and the LabDisc
tested as a “sample to answer” platform for rapid detection of biothreat agents.
D.2.1 ENRICHMENT OF VIRUSES BY A POLYMER BASED METHOD
Sample preparation and target enrichment are an often neglected, but critical area in
molecular diagnostics for infectious diseases (Dineva, MahiLum-Tapay et al. 2007).
Unfortunately, only a small volume of sample of around 200 µl can be processed for
nucleic acid extraction using conventional sample preparation methods or commercial
kits, which also limits the sensitivity of molecular biological assays. Therefore, sample
pre-treatment such as enrichment of infectious pathogens is crucially important in sample
preparation for the molecular testing of biological samples. In this study, a novel method
was described, which is applicable to various biological samples for capturing
nonspecifically different viruses from 1 ml sample volumes. These captured viruses can
be easily used for either the infectivity assay, or nucleic acid purification. Major
advantages of this method over traditional methods like PEG precipitation,
ultracentrifugation, or filtration are speed, simplicity and cost effectiveness.
In the field of molecular diagnostics, a number of methods have been reported recently
that describe enhancement of PCR sensitivity by virus concentration. These include: 1)
The use of polyethyleneimine conjugated magnetic beads; 2) the use of cationic
magnetic beads; 3) the use of poly tentacles containing magnetic particles; and 4) the
use of Apolipoprotein H (Iwata, Satoh et al. 2003; Satoh, Iwata et al. 2003; Arkhis,
Elaissari et al. 2010; Adlhoch, Kaiser et al. 2011). However, the capture of non-
enveloped virus was reported to be problematic (Satoh, Iwata et al. 2003; Arkhis,
Elaissari et al. 2010). It has been demonstrated here that the InRICHMENT kit using a
polymer was able to capture enveloped model viruses such as YFV 17D & CP 19, and
non-enveloped model virus such as Ljungan virus efficiently from various matrices. This
method allowed the use of large sample volume (1 ml to 10 ml) in comparison to
conventional commercial methods, and concentrated the samples in a 50 µl of volume
after enrichment. These concentrated samples were successfully used for quantitative
analysis of the virus titer by virus infectivity assays, and the genome copies by real-time
PCR (Fig. C-3, C-4 & C-5). The results obtained show clearly that the combination of the
enrichment method with the sample preparation method has enhanced the sensitivity for
detecting virus particles and viral genomes. Furthermore, the mechanism of the
enrichment process was revealed by electron microscopy using CP 19 as a model
organism. The results suggest that the viruses and cell membrane rests were captured
Chapter 1-Discussion
76
clearly by formation of a dense and complex network of polymer, which were then
collected mechanically through centrifugation (Fig. C-6). In addition, the polymer complex
was dissolved by the reagents after capturing the viruses as described by the
manufactures. In a similar mechanism, YFV and Ljungan virus seems to have been
captured and concentrated by InRICHMENT reagents. This supports the results from in
vitro infectivity assays that the polymers did not inhibit the binding of viruses to the cells.
Additionally, it was found that this enrichment method needs no elaborate equipment and
adapts well to scale up. Nearly physiological conditions can be maintained during the
enrichment process, and at the same time, this system has provided higher recovery
yields for viruses with fewer steps in the procedure.
Recently, some commercial kits have become available, which allow the nucleic acid
extraction from up to 1 or even 2 ml of a sample. These test kits were developed mainly
to examine blood, plasma, or serum samples for the detection of viral pathogens
tolerating the extraction of high sample volumes, concentrating viral nucleic acids in
samples, and allowing the downstream detection of very low viral titers. As a simple and
feasible method for virus concentration, the InRichment method was tested for extraction
of RNA from large volumes and compared with recent available two commercial kits.
These kits also allow manual viral nucleic extraction from 1 ml sample volumes. All three
methods use different technologies to enable large sample volume extraction. One
method scales up the standard extraction via silica gel membranes, whereas the other
two methods use an enrichment step before or after lysis to reduce the working volume
(Dovc-Drnovsek, Emersic et al. 2008; Domingo, Yactayo et al. 2011). These kits have
been tested with emphasis on practicability and sensitivity for sample preparation using
yellow fever virus 17D (YFV 17D) as an RNA model virus. The results suggest here that
the enrichment method using the InRichment kit efficiently concentrates viruses and
purifies RNA from various matrices like plasma, urine, or PBS. The results obtained were
as good as the other two commercial methods for purification of viral RNA (Fig. C-7). The
InRICHMENT method was more sensitive to the samples with the lower virus
concentrations. It could be that the inhibitory substances may be removed from the
sample during the enrichment procedure, as the InRichment method captures the
viruses mechanically through polymer complexes and excludes small inhibitors from the
samples.
In summary, a novel method for enrichment of viral pathogens from large volume
samples was established to enhance the sensitivity of NAT. This method is perfectly
suitable for the centrifugal LabDisc platform, as the viruses-polymer complexes are
77
Chapter 1-Discussion
captured by centrifugation. Furthermore, this method can be easily combined with the
sample preparation method to isolate nucleic acids from large volume samples to
improve the sensitivity of NAT.
D.2.2 DEVELOPMENT OF A SAMPLE PREPARATION METHOD FOR THE LABDISC
PLATFORM
The extraction of nucleic acids is the first and most important step in molecular
diagnostics. Nucleic acids such as a DNA and RNA can be isolated from cells, tissues,
microorganisms and viruses by sample preparation methods for downstream analytical
processes in NAT. A large number of commercial and in-house methods are available for
nucleic acid extraction. Most of the commercial extraction kits are based on solid-phase
nucleic acid extraction utilizing silica matrices, glass particles, or magnetic particles;
which allows simple, rapid, and efficient purification of nucleic acids. These methods
comprise four major steps: Lysis of pathogens, binding of nucleic acids to a solid phase,
washing, and elution.
Nucleic acid extraction methods based on magnetic beads has become a new trend in
manual and automated nucleic acid purification. These kits do not require buffers
containing organic solvents, the repeated use of centrifugation, or vacuum filtration and
separation of columns, thus reducing the time and complexity of the extraction method
(Tan and Yiap 2009). Therefore, the magnetic beads based nucleic acid extraction
methods are easy to implement in automated devices and are used widely in commercial
automated devices nowadays (e.g. Promega Maxwell 16 system, Anaytik Jena Innupure
system, Thermo Scientific KingFisher Flex system). After an extensive testing and
comparing the different commercial kits, it was found that the Instant MP basic kit
utilizing magnetic beads was as good as a silica column based commercial kits.
Therefore, this kit was chosen for the centrifugal LabDisc platform. Additionally, this kit
allows the extraction of the nucleic acids from the various clinical samples (whole blood,
plasma, serum, or urine).
For detection of biothreat agents, sample preparation methods are applied that are
commonly used for detection of infectious pathogens in samples such as blood or blood
components, powder and air (Lim, Simpson et al. 2005). Many of these bacterial and
viral biothreat pathogens are found in detectable amount in blood and blood components
such as serum and plasma of infected patients (Lim, Simpson et al. 2005; HEALTH
2011). Clinical diagnostic would in most of cases, be the early warning system for the
infection with biothreat pathogens; therefore, the sample preparation for biothreat agents
was adapted for testing clinical samples. One agent for each agent category (gram-
Chapter 1-Discussion
78
positive, gram-negative bacteria, DNA- and RNA virus) was tested in spiked human
blood, plasma, and serum to determine the extraction efficiency using the Instant MP
basic kit. The results from this testing suggest that all four pathogens can be detected in
plasma, as well as in whole blood and serum. Blood contains many substances like
heme, erythrocytes and other components that can inhibit the downstream process of
NAT (Al-Soud and Radstrom 2001). Therefore, the detected amount of pathogens was
lower in spiked blood samples with pathogens. According to this testing, plasma was
chosen as a sample for the NAT analysis with the Instant MP basic kit.
To evaluate the efficiency of the Instant MP basic kit, 10-fold serial dilution of each of
four model pathogens was prepared in human plasma and subjected to real-time PCR
after nucleic acid isolation. The efficiency analysis shows that this method was able to
purify the total nucleic acids from all four pathogens efficiently with detection limits down
to 100 Geq/ml. When samples were prepared by the 10-fold serial dilution in plasma, the
detected amount of genome copies was not linear to the reference value. This
phenomenon was seen in the dilution of all four pathogens (Fig. C-8). As the samples
were prepared by a 10-fold serial dilution in plasma : PBS (1:1) or PBS only, the
detected amounts of genome copies were linear to the reference values. These results
indicated that the direct serial dilution of pathogens in plasma lead to this failure, which
could be clearly avoided by diluting the plasma 1:1 with PBS. On the other hand, the
dilution of plasma samples could also beneficially avoid inhibition of the following
process like nucleic acid detection, as the plasma contains many PCR-inhibitory
substances (Drosten, Panning et al. 2002). Therefore, the extraction efficiency can be
clearly increased by diluting the plasma samples before sample preparation. Other
approaches to increase the extraction efficiency are to use of the proteinase K (PK). PK
cleaves glycoproteins and inactivates RNase and DNase in lysis solution with SDS. Use
of the PK in nucleic acid extraction has shown an increased sensitivity in the
downstream process such as nucleic acid detection by PCR (Gobbers, Oosterlaken et al.
2001). The use of PK in the Instant MP basic kit also increases extraction efficiency for
samples spiked with viral and bacterial pathogens. Due to the beneficial effect of the PK
in extraction, it was included as a standard reagent for the Instant MP basic kit.
After extensive testing and optimizing the extraction method, finally the Instant MP basic
kit was tested on eight biothreat agents (BA, Ype, Ftu, RVFV, MARV, ZEBO, SigV and
VACV) included in the SONDE project. A defined amount of these biothreat pathogens in
the range of 104 to 101 genome copies were spiked in plasma and detected by the real-
time PCR after isolating the total nucleic acids. The results show that the optimized
79
Chapter 1-Discussion
Instant MP basic kit efficiently isolates nucleic acids from spiked plasma samples with all
eight pathogens, and the detection limit was down to the 10 copies/assay. Furthermore,
all the components of this kit including PK can be stored at a room temperature. Lysis of
the samples can be performed at ambient conditions and handling of extraction
procedure is easy due to use of the MAGs. As this Instant MP basic kit fulfilled the all the
important criterion for point-of-care settings, this method was integrated into the
centrifugal LabDisc platform as an extraction method.
D.3 ESTABLISHMENT AND OPTIMIZATION OF NUCLEIC ACID DETECTION
PCR is the most widely used technique for DNA amplification and detection in molecular
biology. This method requires extensive thermal cycling for in vitro amplification of the
DNA. In contrast, isothermal amplification method offers many advantages over the
traditional PCR based methods. One of the main advantages is that a single constant
temperature is needed for amplification of DNA and the isothermal method can be
performed using a simple heating device. In addition, isothermal amplification is easy-to-
perform, cost effective as well as robust and provides good sensitivity and specificity for
molecular diagnostics (Vincent, Xu et al. 2004; Piepenburg, Williams et al. 2006;
Kaneko, Kawana et al. 2007; Chow, McCloskey et al. 2008; Mori and Notomi 2009).
Therefore, an isothermal amplification method so called Recombinase Polymerase
Amplification (RPA) was chosen as the nucleic acid detection method by the SONDE
consortium for the centrifugal LabDisc platform. The main advantages of the RPA are: 1)
the reaction can be performed at 37 °C to 42 °C; 2) the reaction requires only 15-20 min;
3) the reaction allows different detection format including real-time monitoring of
fluorescence; and 4) all the RPA reagents are provided as lyophilized reagents, which
are suitable for storage at ambient conditions. Using commercial RPA kits, sensitive and
specific RPA assays have been developed by our project partner from UMG, Göttingen
for the detection of biothreat pathogens, as described previously (Euler, Wang et al.
2012; Euler, Wang et al. 2012).
RPA assays for the detection of biothreat agents have been established and optimized
for the centrifugal LabDisc platform. The testing of this assay shows that the sensitivity of
RPA is as good as the sensitivity of real-time PCR, as described in literature
(Piepenburg, Williams et al. 2006). Furthermore, DNA amplification of RNA and DNA
templates was done using a single RPA kit (Twistamp exo RT kit) within 15-20 min. The
RPA assays for detection of biothreat agents were highly sensitive and 4-5 times faster
than real-time PCR (Fig. C-10). However, all these RPA assays needed to be optimized
in a 10 µl reaction in order to integrate them into the LabDisc platform. When the RPA
Chapter 1-Discussion
80
assay was performed in 50 µl, 20 µl and 10 µl reaction volumes, the observed signal
intensity in 10 µl was very low in comparison to the 50 µl and 20 µl reactions. This result
indicates that the RPA assay in 10 µl is less sensitive. A possible reason for this could be
the reduced amount of reagents in the smaller volumes. Miniaturization of RPA reaction
is at a certain amount of reaction volume is possible, as shown for 20 µl of reaction.
However, the reduced reaction volume in this case of 10 µl contains fewer reagents to
amplify target nucleic acid, which could lead to the reduced signal intensity.
There was no improvement in the signal intensity of the RPA reaction using double
amounts of primer and probes in 20 µl and 10 µl reactions. As the amount of RPA
reagents was increased 1.5 times in 20 µl and 10 µl reactions, the signal intensity of
these RPA assays was significantly increased (Fig. C-11). These results indicate that the
RPA reaction can be performed in smaller volumes, if the RPA reagent concentration is
increased 1.5 times. Additionally, the RPA reaction with increased reagent concentration
for 20 µl reactions was more sensitive than 10 µl reactions. However, the designed
LabDisc cartridge can process only 10 µl of reaction mixture. Furthermore, this approach
was successfully proven for all eight RPA assays performed in 10 µl reactions using the
GeneSlice. By optimizing the RPA reaction, the reaction volume was successfully
reduced to 10 µl for the final integration of the RPA assays onto the LabDisc platform.
This approach also offers advantages like low-cost, high-throughput, low reagent
consumption, easy liquid handling, and portability of the microfluidic cartridge.
D.4 “SAMPLE TO ANSWER” TESTING OF RPA LABDISC FOR THE
DETECTION OF BIOTHREAT AGENTS
This study demonstrates the utility of the centrifugal LabDisc platform using the RPA
LabDisc cartridge and protocols by HSG-IMIT and the SONDE player by QLC for the
“sample to answer” testing of biothreat pathogens. The developed extraction method and
the optimized RPA assays for biothreat agents from this work have been successfully
integrated on the RPA LabDisc cartridge according to need. The processing of the RPA
LabDisc was also done completely automatically using the SONDE player.
In a proof-of-principle testing, all three bacterial biothreat pathogens (BA, Ftu and Ype)
were tested on the centrifugal LabDisc platform. In this study, plasma spiked with one
bacterial pathogen, or all three bacterial pathogens were processed automatically using
the RPA LabDisc cartridge. The same samples were analyzed by two following manual
laboratory methods: Nucleic acid extraction followed by real-time PCR, and nucleic acid
extraction followed by real-time RPA assay. The results revealed that all these samples
81
Chapter 1-Discussion
were automatically extracted, and nucleic acids of the biothreat pathogens were correctly
detected by the centrifugal LabDisc platform utilizing the RPA LabDisc. The “sample to
answer” testing required the total time of less than 1 h. In the first 30 min, the samples
were extracted on the RPA LabDisc, and the nucleic acids were isolated. Subsequently,
the nucleic acids were mixed with dry RPA reagents and detected by fluorescence
measurement in real-time within 20-30 min. Samples with single and multiple pathogens
were detected in the same range as the “sample to answer” testing, which indicates that
there were no inhibitory effects or cross reactions of the detection methods for different
pathogens.
The result of manual testing by real-time PCR after nucleic acid isolation shows that all
three pathogens were also correctly identified and the amount of the nucleic acids were
quantified. Similarly, manual testing by real-time RPA after nucleic acid isolation detected
all the samples correctly within 1 h. In both cases, the manual extraction was done in 40
min. The real-time PCR has required more than 2 h, whereas the manual real-time RPA
was done in less than 10 min. Comparing these results, it is evident that the RPA assays
using the manual methods, or the automated LabDisc platform could be performed in
less than 1 h for NAT. Until now, there is only one commercially available method:
GeneXpert by Cepheid, which can perform the “sample to answer” testing in this
turnaround time. However, GeneXpert allows detection of a maximum of three targets
using the multiplex reaction on a single cartridge. Depending on the pathogens, different
cartridges are needed for testing by GeneXpert, which limits the simultaneous detection
of different pathogens. In contrast to this, the RPA LabDisc has 11 detection chambers,
which can be used for detection of 10 pathogens and 1 internal control simultaneously.
The RPA LabDisc offers geometric multiplex reactions, which means that 11 single
reactions can be performed simultaneously instead of the multiple reactions in one
chamber. This approach using the RPA LabDisc also simplifies fluorescence monitoring
devices. Only a single fluorescence labeled probe and detector are needed to perform
11 assays simultaneously using the RPA LabDisc.
In this study, manual laboratory methods were successfully integrated onto the
centrifugal LabDisc platform, and whole NAT was performed automatically under 1 h.
The utilization of MAGs based extraction method and RPA on the RPA LabDisc cartridge
simplified the whole NAT testing workflow and enabled detection of biothreat pathogens
simultaneously as a “sample to answer” testing. In future, all eight viral and bacterial
pathogens included in the SONDE project can be tested using a single RPA LabDisc
cartridge. Further development will focus also on the optimization of the RPA LabDisc

Chapter 1-Discussion
82
design, storage of reagents and reduction in time for sample preparation. This will allow
the robust and reproducible automated NAT testing of the biothreat pathogens. Due to
the portable design of the centrifugal LabDisc platform, it is perfectly suitable for point-of-
care testing, low-resource, and in-field settings.
83
Chapter 2. REAL-TIME PCR PLATFORM
DEVELOPMENT OF ONE-STEP REAL-TIME
REVERSE TRANSCRIPTION PCR FOR THE RAPID
DETECTION OF FLAVIVIRUSES

85
A INTRODUCTION
A.1 FLAVIVIRUSES
The genus Flavivirus of the family Flaviviridae consists of more than 70 virus species
including many arthropods-borne viruses. It contains highly pathogenic agents such as a
Yellow Fever virus (YFV), West Nile virus (WNV), Japanese Encephalitis virus (JEV),
Tick-borne Encephalitis virus (TBEV) and Dengue virus (DENV) which cause
encephalitis or hemorrhagic fever and induce some of the most important emerging
diseases in humans (Mackenzie, Gubler et al. 2004).
YFV is the prototype and name-giving member of the genus and family. Flaviviruses
comprise three epidemiologically distinct groups: the mosquito-borne group, the tick-
borne group and the unknown vector viruses (Porterfield 1980). They are enveloped
positive-stranded RNA viruses with a genome of approximately 11 kb. The viral genome
encodes a large single polyprotein from which three structural proteins, Capsid (C),
Envelope (E) and Membrane (M) and seven non-structural proteins, NS1, NS2A, NS2B,
NS3, NS4A, NS4B and NS5, are produced (Heinz and Allison 2000).
Flaviviruses pose a serious threat to public health around the world, especially in
developing countries. In recent years, there was a dramatic increase in cases of DENV
infection globally. This disease is endemic in more than 100 countries in Africa, the
Americas, the Eastern Mediterranean, Southeast Asia, and the Western Pacific. About
50–100 million cases of DENV infection are reported worldwide every year, resulting in
500,000 cases of Dengue hemorrhagic fever requiring hospitalization and about 25,000
fatalities (WHO Dengue fever factsheet, 2009). Yellow Fever is endemic in 45 countries
in Africa and Latin America, and annually YFV causes approximately 200,000 cases of
human infections worldwide, resulting in 30,000 deaths (WHO YFV factsheet 2011).
WNV is one of the most widespread flaviviruses and is distributed worldwide. WNV
lineage 1 is endemic in the Americas, India and Australia; lineages 1 and 2 are known in
Africa and Europe (Bakonyi, Hubalek et al. 2005; Bakonyi, Ivanics et al. 2006; Venter,
Human et al. 2009). The recent WNV outbreak reported in August 2010 in Greece has
been the first large outbreak in humans in Europe since the Romanian outbreak in 1996–
1997 (Papa, Danis et al. 2010). JEV is the leading cause of viral encephalitis in Asia with
30,000–50,000 clinical cases reported annually and 10,000 deaths (CDC JEV factsheet).
In addition, the increased spread of TBEV virus, which caused an infection of central
nervous system, has been recognized in endemic area of Europe. The reported human
cases of TEBV infections have dramatically increased by 400 % in these areas in last 30
Chapter 2-Introduction
86
years according to the ECDC (ECDC Factsheet for health professionals 2010) and pose
danger to public health in European countries.
A.2 DIAGNOSIS OF FLAVIVIRUSES
The species in the family Flaviviridae include many human pathogenic viral agents
causing a mild flu like to severe encephalitis or haemorrhagic illnesses. Therefore,
clinical syndrome based diagnosis is not reliable to distinguish flavivirus infection from
other infections and laboratory diagnosis needed to confirm the causative agent of
infections. Serological tests based on the detection of virus-specific antibodies are
generally performed for conventional flavivirus diagnosis. However, these tests have
several limitations: immunological cross reactivity among Family Flaviviridae as well as
differentiation of group- and serotype-specific flavivirus in endemic areas, where more
than one flavivirus are co-circulating.
At present, several diagnostic techniques including molecular techniques and serological
methods are used by most laboratories to detect a dengue infection. After the onset of
illness, the virus can be detected in serum, plasma, circulating blood cells and other
tissues for 2-7 days, and the duration of this viremic phase and viral load detected vary
depending on the infecting virus as presented in Table A-1 (Domingo, Patel et al. 2011).
Virus isolation, detection of viral nucleic acids and detection of viral antigens are
common techniques used to diagnose flavivirus infection during the early phase. Seven
days after onset of infection, the serological methods based on detection of virus-specific
antibodies can be used. The serological methods comprise the immunofluorescence
assay (IFA), the immunoglobulin M capture enzyme linked immunosorbent assay (IgM
capture ELISA), the IgG ELISA and the virus-specific antigen capture ELISA. One
limitation of serological methods is inability to differentiate flaviviruses due to the
serological cross-reactions among the different flaviviruses (Hunsperger, Yoksan et al.
2009).
In recent years, molecular approaches based on detection of genomic viral RNA by the
reverse transcription-Polymerase chain reaction (RT-PCR), modified RT-PCR methods,
real-time PCR and isothermal amplification methods are playing an important role in
diagnosis of flavivirus infections during the acute phase. In comparison to virus isolation
and serological methods, molecular techniques are rapid, highly specific and sensitive,
and allow the differentiation of flaviviruses. Since the early 1990s, several group-specific
and generic molecular approaches have been developed for the detection of flaviviruses
as reviewed previously (Lanciotti 2003; Sekaran and Artsob 2007; Domingo, Patel et al.
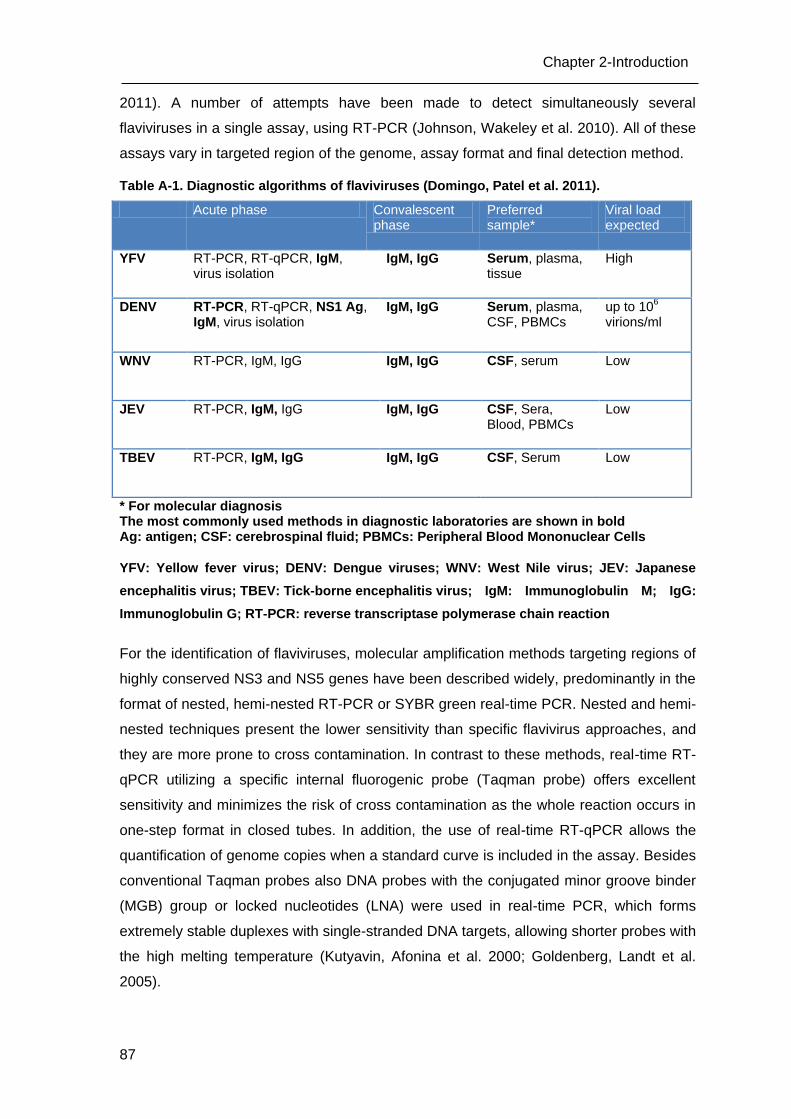
87
Chapter 2-Introduction
2011). A number of attempts have been made to detect simultaneously several
flaviviruses in a single assay, using RT-PCR (Johnson, Wakeley et al. 2010). All of these
assays vary in targeted region of the genome, assay format and final detection method.
Table A-1. Diagnostic algorithms of flaviviruses (Domingo, Patel et al. 2011).
Acute phase Convalescent phase
Preferred sample*
Viral load expected
YFV RT-PCR, RT-qPCR, IgM, virus isolation
IgM, IgG Serum, plasma, tissue
High
DENV RT-PCR, RT-qPCR, NS1 Ag, IgM, virus isolation
IgM, IgG Serum, plasma, CSF, PBMCs
up to 106
virions/ml
WNV RT-PCR, IgM, IgG IgM, IgG CSF, serum Low
JEV RT-PCR, IgM, IgG IgM, IgG CSF, Sera, Blood, PBMCs
Low
TBEV RT-PCR, IgM, IgG IgM, IgG CSF, Serum Low
* For molecular diagnosis The most commonly used methods in diagnostic laboratories are shown in bold Ag: antigen; CSF: cerebrospinal fluid; PBMCs: Peripheral Blood Mononuclear Cells
YFV: Yellow fever virus; DENV: Dengue viruses; WNV: West Nile virus; JEV: Japanese
encephalitis virus; TBEV: Tick-borne encephalitis virus; IgM: Immunoglobulin M; IgG:
Immunoglobulin G; RT-PCR: reverse transcriptase polymerase chain reaction
For the identification of flaviviruses, molecular amplification methods targeting regions of
highly conserved NS3 and NS5 genes have been described widely, predominantly in the
format of nested, hemi-nested RT-PCR or SYBR green real-time PCR. Nested and hemi-
nested techniques present the lower sensitivity than specific flavivirus approaches, and
they are more prone to cross contamination. In contrast to these methods, real-time RT-
qPCR utilizing a specific internal fluorogenic probe (Taqman probe) offers excellent
sensitivity and minimizes the risk of cross contamination as the whole reaction occurs in
one-step format in closed tubes. In addition, the use of real-time RT-qPCR allows the
quantification of genome copies when a standard curve is included in the assay. Besides
conventional Taqman probes also DNA probes with the conjugated minor groove binder
(MGB) group or locked nucleotides (LNA) were used in real-time PCR, which forms
extremely stable duplexes with single-stranded DNA targets, allowing shorter probes with
the high melting temperature (Kutyavin, Afonina et al. 2000; Goldenberg, Landt et al.
2005).
Chapter 2-Introduction
88
A.3 AIM OF THIS STUDY
The aim of this study was to develop a rapid, sensitive and reliable real-time RT-qPCR
assay for the simultaneous detection of several important flaviviruses. To realize such an
assay, conserved NS5 region of flavivirus genome was used as a target for designing
the LNA probe. The introduction of locked nucleic acids (LNA) probe in real-time RT-
qPCR increases the assay’s robustness, specificity and sensitivity. Furthermore, the
method can be standardized to quantify the viral load using this specific LNA probe
based real-time PCR assay.
89
Chapter 2-Materials and Methods
B MATERIALS AND METHODS
B.1 VIRUSES AND ISOLATION OF VIRAL RNA
All flavivirus and non-flavivirus strains used were derived from cell culture and provided
by the Robert Koch Institute, Berlin, Germany. The following inactivated and stable virus
preparations were used in this study: DENV-1 VR344 (Thai 1958); DENV-2 VR345 (TH-
36 strain); DENV-3 VR216 (H87 strain); DENV-4 VR217 (H241 strain); WNV Uganda
strain (AY532665); WNV Israel (H. Bin, Sheba Medical Centre, Israel), Usutu virus
(AY453411); JEV (ATCC SA14-14-2); Saint Louis Encephalitis virus (SLEV) (ATCC VR-
1265); TBEV strain K23 (AF091010); YFV strain 17D (X03700); YFV strain ASIBI
(AY640589); YFV strain Brazil; YFV strain Ivory Coast; Russian Spring Summer
Encephalitis virus (RSSEV); Chikungunya virus (LR 2006); Chikungunya virus African
isolate; Sindbis virus; Rift Valley Fever virus and Influenza A virus subtype H5N1
(A/dk/Germany R603/06 H5N1). Two different standard preparations of H1N1 Influenza
viruses (A/California/04/2009 and A/Hamburg/04/2009) used in this study were provided
by the European Network for Diagnostics of Imported Viral Diseases (ENIVD). Viral RNA
was isolated from 140 µl aliquots of cell culture supernatants, using the QIAamp Viral
Mini Kit (Qiagen, Hilden, Germany) according to the manufacturer's instructions. RNA
was eluted in 100 µl of elution buffer and stored at -80 °C until further use.
B.2 TAQMAN PRIMERS AND PROBE
Available full-length flavivirus sequences, partial sequences covering the NS5 region
from the database (NCBI) and previously published primers (Scaramozzino, Crance et
al. 2001; Chien, Liao et al. 2006) were aligned using MEGA5 software. Based on the
alignment, degenerate generic primers (Table 1) and corresponding primers
representing all known sequence variants were designed for generic amplification of
flaviviruses. In addition, 22 sequence variant-specific fluorescent-labelled flavivirus
probes and two degenerate probes containing LNA nucleotides were designed. LNA
nucleotide analogues contain a 2'–5' bridge, keeping the ribose moiety in an RNA-like
configuration. They bind tighter to the complement sequence and thus allow the use of
shorter probes. This is particularly important when only short conserved regions in the
target sequence are available or in order to link the binding power of the probe to a more
specific or conserved sequence motif.
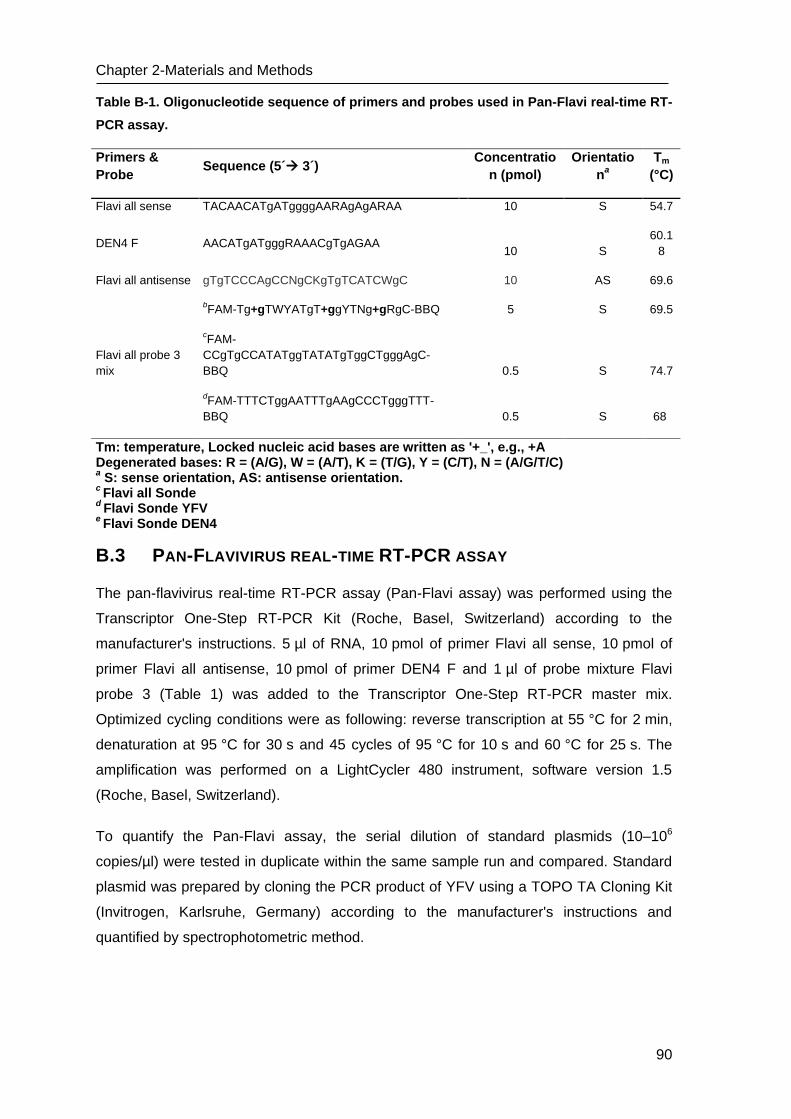
Chapter 2-Materials and Methods
90
Table B-1. Oligonucleotide sequence of primers and probes used in Pan-Flavi real-time RT-
PCR assay.
Tm: temperature, Locked nucleic acid bases are written as '+_', e.g., +A Degenerated bases: R = (A/G), W = (A/T), K = (T/G), Y = (C/T), N = (A/G/T/C) a S: sense orientation, AS: antisense orientation.
c Flavi all Sonde
d Flavi Sonde YFV
e Flavi Sonde DEN4
B.3 PAN-FLAVIVIRUS REAL-TIME RT-PCR ASSAY
The pan-flavivirus real-time RT-PCR assay (Pan-Flavi assay) was performed using the
Transcriptor One-Step RT-PCR Kit (Roche, Basel, Switzerland) according to the
manufacturer's instructions. 5 µl of RNA, 10 pmol of primer Flavi all sense, 10 pmol of
primer Flavi all antisense, 10 pmol of primer DEN4 F and 1 µl of probe mixture Flavi
probe 3 (Table 1) was added to the Transcriptor One-Step RT-PCR master mix.
Optimized cycling conditions were as following: reverse transcription at 55 °C for 2 min,
denaturation at 95 °C for 30 s and 45 cycles of 95 °C for 10 s and 60 °C for 25 s. The
amplification was performed on a LightCycler 480 instrument, software version 1.5
(Roche, Basel, Switzerland).
To quantify the Pan-Flavi assay, the serial dilution of standard plasmids (10–106
copies/µl) were tested in duplicate within the same sample run and compared. Standard
plasmid was prepared by cloning the PCR product of YFV using a TOPO TA Cloning Kit
(Invitrogen, Karlsruhe, Germany) according to the manufacturer's instructions and
quantified by spectrophotometric method.
Primers &
Probe Sequence (5´ 3´)
Concentratio
n (pmol)
Orientatio
na
Tm
(°C)
Flavi all sense TACAACATgATggggAARAgAgARAA 10 S 54.7
DEN4 F AACATgATgggRAAACgTgAGAA 10 S
60.1
8
Flavi all antisense gTgTCCCAgCCNgCKgTgTCATCWgC 10 AS 69.6
Flavi all probe 3
mix
bFAM-Tg+gTWYATgT+ggYTNg+gRgC-BBQ 5 S 69.5
cFAM-
CCgTgCCATATggTATATgTggCTgggAgC-
BBQ 0.5 S 74.7
dFAM-TTTCTggAATTTgAAgCCCTgggTTT-
BBQ 0.5 S 68
91
Chapter 2-Materials and Methods
B.4 SPECIFIC REAL-TIME RT-PCR FOR DIFFERENT FLAVIVIRUSES
For the specific detection, already published group-specific assays were used. Except for
DENV and JEV, where in-house assays were used.
TBEV-specific primers and probe directed to the NS1 gene were used to detect and
quantify genomic RNA of TBEV as described previously (Achazi, Nitsche et al. 2011).
Real-time PCR was carried out in one step on an ABI 7500 cycler (Applied Biosystems,
California, USA), using the Superscript III Platinum One-Step RT-qPCR Kit (Invitrogen,
Karlsruhe, Germany).
A WNV-specific diagnostic real-time PCR assay for the detection of lineages 1 and 2 was
used to detect and quantify genome equivalent copies (Geq) of WNV as described
previously (Linke, Ellerbrok et al. 2007). Real-time PCR was performed in a two-step
format on the Stratagene MX 3000 cycler (Agilent Technologies, Santa Clara, USA).
YFV-specific primer combination YFV FP/RP and probe YFV LNA2 were used to detect
and to quantify the genomic RNA of YFV as described previously (Weidmann, Faye et al.
2010). The assay was performed in an one-step format on the LightCycler 480
instrument using the QuantiTect Virus Kit (Qiagen, Hilden, Germany).
DENV-genomic RNA was tested and quantified by an in-house real-time quantitative RT-
PCR as described previously (Domingo, Niedrig et al. 2010). The assay is a DENV
group-specific assay and was carried out in one-step format on an ABI 7500 real-time
PCR system using the AgPath-ID One-Step RT-PCR Kit. Plasmid standards were used
for the quantification of the DENV Geq.
A JEV-specific in-house real-time PCR assay was used for detection and quantification
of JEV geq. Real-time PCR was performed in a two-step format on the Stratagene MX
3000 cycler. cDNA was synthesized by reverse transcription of 5 μl purified RNA in a 20
μl reaction volume with 4 μl of 5× First-Strand Buffer, 4 μl of 0.1 M DTT, 0.4 μl of 25 mM
dNTPs and 1 μl of SuperScript RT (200 U/μl) (Invitrogen, Karlsruhe, Germany). The
template RNA was heated to 65 °C for 5 min and rapidly cooled to 4 °C. After addition of
the master mix, samples were incubated for 60 min at 37 °C for reverse transcription.
The reaction was stopped by enzyme inactivation at 93 °C for 5 min, and then cooled to
4 °C. cDNA was stored at −20 °C until further use. After cDNA synthesis, RT-qPCR was
performed using the Platinum Taq polymerase (Invitrogen, Karlsruhe, Germany) in a total
volume of 25 µl containing 5 µl of cDNA, 2 µl of 10x Reaction Mix, 4 mM MgCl2, 300 nM
of each primer, 100 nM of probe and 2.5 µM of dNTPs. Thermal cycling was done on a

Chapter 2-Materials and Methods
92
Stratagene Mx3000 cycler instrument under the following conditions: 15 min at 95 °C; 45
cycles of 15 s at 95 °C and 30 s at 60 °C. To quantify JEV genomic copies, the ten-fold
serial dilution of the standard plasmids (10–106 copies/µl) were tested within the same
sample run.
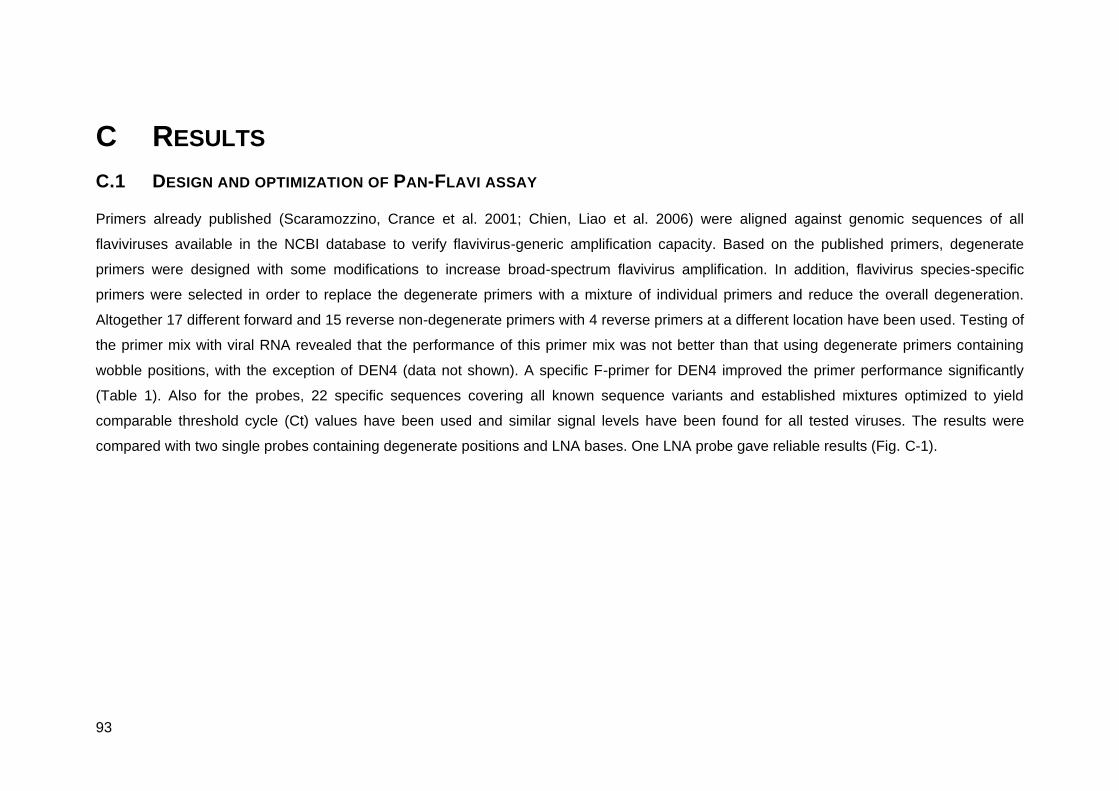
93
C RESULTS
C.1 DESIGN AND OPTIMIZATION OF PAN-FLAVI ASSAY
Primers already published (Scaramozzino, Crance et al. 2001; Chien, Liao et al. 2006) were aligned against genomic sequences of all
flaviviruses available in the NCBI database to verify flavivirus-generic amplification capacity. Based on the published primers, degenerate
primers were designed with some modifications to increase broad-spectrum flavivirus amplification. In addition, flavivirus species-specific
primers were selected in order to replace the degenerate primers with a mixture of individual primers and reduce the overall degeneration.
Altogether 17 different forward and 15 reverse non-degenerate primers with 4 reverse primers at a different location have been used. Testing of
the primer mix with viral RNA revealed that the performance of this primer mix was not better than that using degenerate primers containing
wobble positions, with the exception of DEN4 (data not shown). A specific F-primer for DEN4 improved the primer performance significantly
(Table 1). Also for the probes, 22 specific sequences covering all known sequence variants and established mixtures optimized to yield
comparable threshold cycle (Ct) values have been used and similar signal levels have been found for all tested viruses. The results were
compared with two single probes containing degenerate positions and LNA bases. One LNA probe gave reliable results (Fig. C-1).
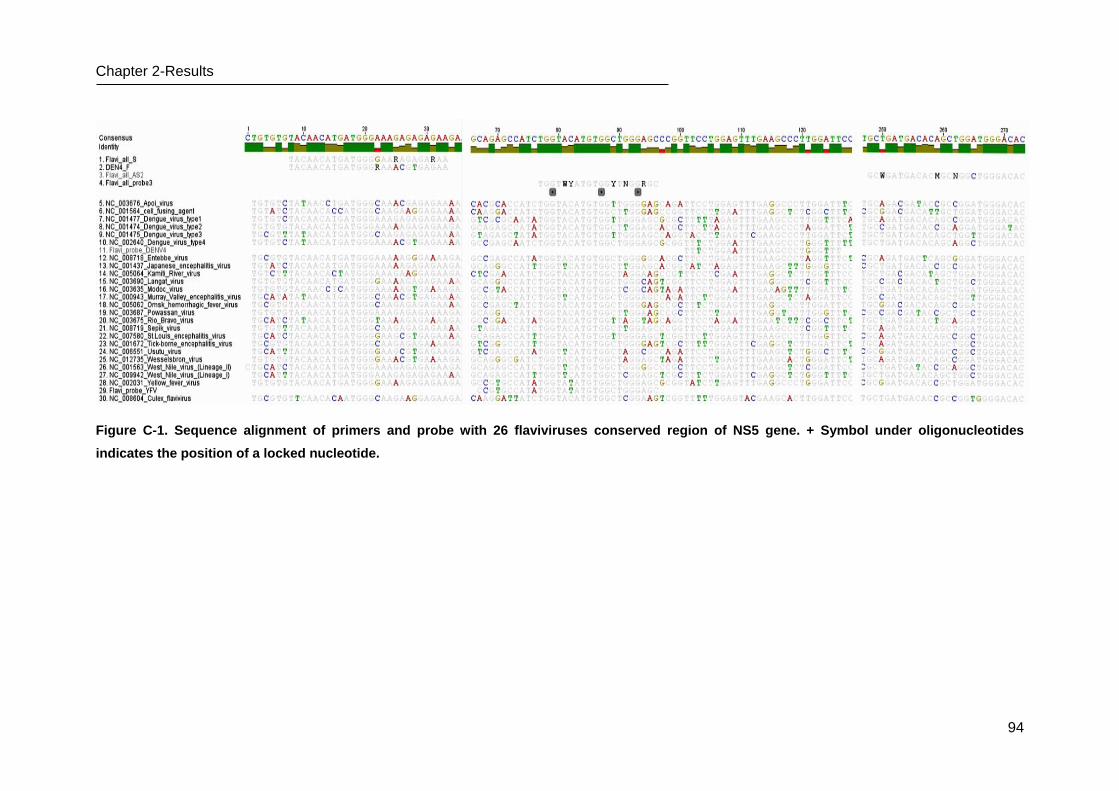
Chapter 2-Results
94
Figure C-1. Sequence alignment of primers and probe with 26 flaviviruses conserved region of NS5 gene. + Symbol under oligonucleotides
indicates the position of a locked nucleotide.
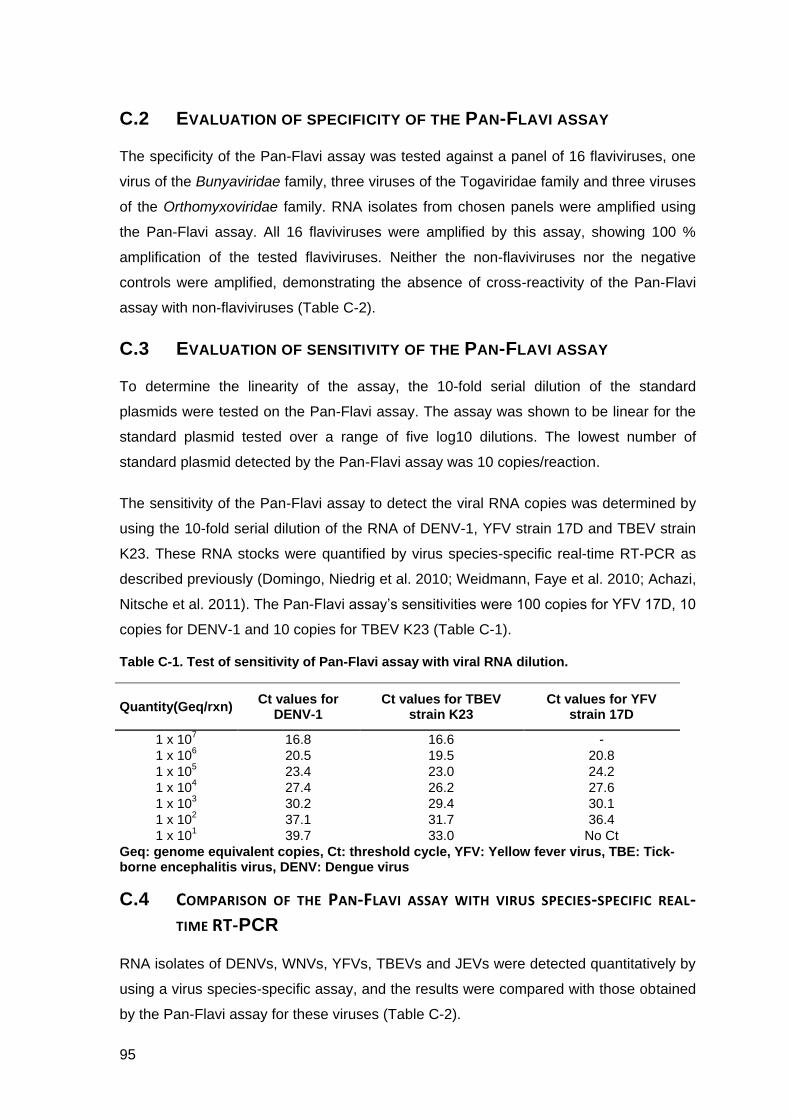
95
C.2 EVALUATION OF SPECIFICITY OF THE PAN-FLAVI ASSAY
The specificity of the Pan-Flavi assay was tested against a panel of 16 flaviviruses, one
virus of the Bunyaviridae family, three viruses of the Togaviridae family and three viruses
of the Orthomyxoviridae family. RNA isolates from chosen panels were amplified using
the Pan-Flavi assay. All 16 flaviviruses were amplified by this assay, showing 100 %
amplification of the tested flaviviruses. Neither the non-flaviviruses nor the negative
controls were amplified, demonstrating the absence of cross-reactivity of the Pan-Flavi
assay with non-flaviviruses (Table C-2).
C.3 EVALUATION OF SENSITIVITY OF THE PAN-FLAVI ASSAY
To determine the linearity of the assay, the 10-fold serial dilution of the standard
plasmids were tested on the Pan-Flavi assay. The assay was shown to be linear for the
standard plasmid tested over a range of five log10 dilutions. The lowest number of
standard plasmid detected by the Pan-Flavi assay was 10 copies/reaction.
The sensitivity of the Pan-Flavi assay to detect the viral RNA copies was determined by
using the 10-fold serial dilution of the RNA of DENV-1, YFV strain 17D and TBEV strain
K23. These RNA stocks were quantified by virus species-specific real-time RT-PCR as
described previously (Domingo, Niedrig et al. 2010; Weidmann, Faye et al. 2010; Achazi,
Nitsche et al. 2011). The Pan-Flavi assay’s sensitivities were 100 copies for YFV 17D, 10
copies for DENV-1 and 10 copies for TBEV K23 (Table C-1).
Table C-1. Test of sensitivity of Pan-Flavi assay with viral RNA dilution.
Geq: genome equivalent copies, Ct: threshold cycle, YFV: Yellow fever virus, TBE: Tick-borne encephalitis virus, DENV: Dengue virus
C.4 COMPARISON OF THE PAN-FLAVI ASSAY WITH VIRUS SPECIES-SPECIFIC REAL-
TIME RT-PCR
RNA isolates of DENVs, WNVs, YFVs, TBEVs and JEVs were detected quantitatively by
using a virus species-specific assay, and the results were compared with those obtained
by the Pan-Flavi assay for these viruses (Table C-2).
Quantity(Geq/rxn) Ct values for
DENV-1 Ct values for TBEV
strain K23 Ct values for YFV
strain 17D
1 x 10⁷
16.8 16.6 -
1 x 10⁶
20.5 19.5 20.8
1 x 10⁵
23.4 23.0 24.2
1 x 10⁴
27.4 26.2 27.6
1 x 10³
30.2 29.4 30.1
1 x 10²
37.1 31.7 36.4
1 x 101
39.7 33.0 No Ct
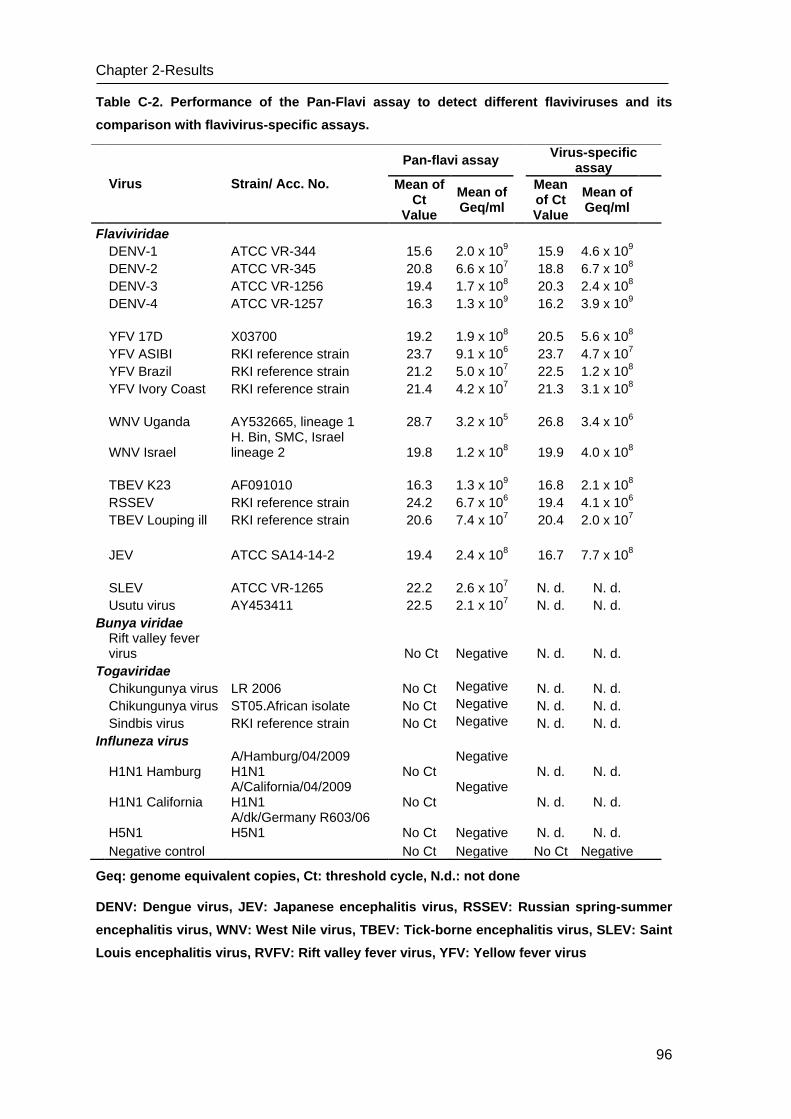
Chapter 2-Results
96
Table C-2. Performance of the Pan-Flavi assay to detect different flaviviruses and its
comparison with flavivirus-specific assays.
Geq: genome equivalent copies, Ct: threshold cycle, N.d.: not done
DENV: Dengue virus, JEV: Japanese encephalitis virus, RSSEV: Russian spring-summer
encephalitis virus, WNV: West Nile virus, TBEV: Tick-borne encephalitis virus, SLEV: Saint
Louis encephalitis virus, RVFV: Rift valley fever virus, YFV: Yellow fever virus
Virus Strain/ Acc. No.
Pan-flavi assay Virus-specific
assay
Mean of Ct
Value
Mean of Geq/ml
Mean of Ct Value
Mean of Geq/ml
Flaviviridae
DENV-1 ATCC VR-344 15.6 2.0 x 10⁹
15.9 4.6 x 10⁹
DENV-2 ATCC VR-345 20.8 6.6 x 10
7 18.8 6.7 x 10
8
DENV-3 ATCC VR-1256 19.4 1.7 x 10⁸
20.3 2.4 x 10⁸
DENV-4 ATCC VR-1257 16.3 1.3 x 10⁹
16.2 3.9 x 10⁹
YFV 17D X03700 19.2 1.9 x 10⁸
20.5 5.6 x 10⁸
YFV ASIBI RKI reference strain 23.7 9.1 x 10
6 23.7 4.7 x 10
7
YFV Brazil RKI reference strain 21.2 5.0 x 10⁷ 22.5 1.2 x 10
8
YFV Ivory Coast RKI reference strain 21.4 4.2 x 10⁷ 21.3 3.1 x 10
8
WNV Uganda AY532665, lineage 1 28.7 3.2 x 10⁵ 26.8 3.4 x 10
6
WNV Israel H. Bin, SMC, Israel lineage 2 19.8 1.2 x 10
8 19.9 4.0 x 10
8
TBEV K23 AF091010 16.3 1.3 x 10⁹ 16.8 2.1 x 10
8
RSSEV RKI reference strain 24.2 6.7 x 10⁶ 19.4 4.1 x 10
6
TBEV Louping ill RKI reference strain 20.6 7.4 x 10⁷ 20.4 2.0 x 10
7
JEV ATCC SA14-14-2 19.4 2.4 x 10⁸ 16.7 7.7 x 10
8
SLEV ATCC VR-1265 22.2 2.6 x 10⁷ N. d. N. d.
Usutu virus AY453411 22.5 2.1 x 10⁷ N. d. N. d.
Bunya viridae
Rift valley fever virus No Ct Negative N. d. N. d.
Togaviridae
Chikungunya virus LR 2006 No Ct Negative N. d. N. d.
Chikungunya virus ST05.African isolate No Ct Negative N. d. N. d.
Sindbis virus RKI reference strain No Ct Negative N. d. N. d.
Influneza virus
H1N1 Hamburg A/Hamburg/04/2009 H1N1 No Ct
Negative N. d. N. d.
H1N1 California A/California/04/2009 H1N1 No Ct
Negative N. d. N. d.
H5N1 A/dk/Germany R603/06 H5N1 No Ct Negative N. d. N. d.
Negative control No Ct Negative No Ct Negative
97
Chapter 2-Results
All four serotypes of DENVs were detected by the Pan-Flavi assay and a Dengue-
specific assay. The Ct values and geq/ml determined by both methods were almost
identical except for DENV-2. Lower values by one log for DENV-2 were detected by the
Pan-Flavi assay when compared with the Dengue-specific assay. For all YFVs, the
results obtained with the Pan-Flavi assay and YFV-specific assay were completely
comparable with each other. Both WNV lineages were detected well by the Pan-Flavi
and a WNV-specific assay. However, lower values by one log for WNV lineage 1 were
detected by the Pan-Flavi assay when compared with a WNV-specific assay. All three
subtypes of TBEV were also detected by the Pan-Flavi assay and a TBEV-specific assay
well. The Ct values and geq/ml determined by both methods were identical except for
RSSEV. For the detection of JEV, the Pan-Flavi assay had half a log lower sensitivity
than a JEV-specific assay. As WNV- and JEV-specific assays were performed in two-
step formats, this being the possible reason for their higher sensitivity when compared to
the Pan-Flavi assay. Overall, the performance of the Pan-Flavi assay was comparable to
virus species-specific assays except for minor differences for some strains of
flaviviruses.
Chapter 2-Discussion
98
D DISCUSSION
The continuous emergence of flaviviruses is a reality and poses major public health
concerns around the world. Techniques used for molecular diagnosis and surveillance of
flaviviruses should be able to detect rapidly and identify a wide range of flavivirus
species with a high level of specificity and sensitivity. For this purpose, a LNA probe-
based real-time RT-PCR (Pan-Flavi assay) for the detection of flavivirus RNA by one
single method was successfully developed. Demonstrating the ability of the Pan-Flavi
assay to detect the flavivirus genus, most of the important human-pathogenic flaviviruses
have been tested. The Pan-Flavi assay was also tested with other viruses like
phleboviruses, alphaviruses and influenza viruses to determine the specificity.
In recent years, generic approaches targeting highly conserved NS3 and NS5 genes
have been described for the diagnosis of flaviviruses (Domingo, Niedrig et al. 2010;
Johnson, Wakeley et al. 2010; Weidmann, Faye et al. 2010; Achazi, Nitsche et al. 2011;
Domingo, Patel et al. 2011). These methods were predominantly in the format of nested
RT-PCR or SYBR green real-time RT-PCR and in particular required post-amplification
methods such as sequencing or melting temperature analysis. These methods have
generally shown variable or lower sensitivity than the species-specific approaches when
evaluated during the EQA exercises for molecular diagnosis of different flaviviruses
(Domingo, Niedrig et al. 2010). However, in some cases their performance was
comparable to those from the species-specific methods (Scaramozzino, Crance et al.
2001; Domingo, Niedrig et al. 2010). Therefore, the use of generic methods for the
molecular diagnosis of flaviviruses is only advisable when post-amplification techniques
(sequencing, melting temperature) are performed afterwards to identify the specific
detection of flaviviruses.
The primer sequences with some degenerate nucleotides (Fig. C-1) were chosen so that
it would hybridize to a target sequence that is conserved among most flavivirus species.
These degenerate primers showed a better efficiency in detecting the broad range of
flaviviruses, when compared to the previously published primers. Designing a single
probe for the universal detection of flaviviruses is challenging because of the genetic
diversity of flaviviruses and the restricted length of a conserved region in the alignment of
flavivirus sequences. To overcome this problem, LNA probe was chosen for the Pan-
Flavi assay. Major advantages of LNA probes in comparison to other real-time PCR
formats are the shorter probe length, biological stability, increased sensitivity, specificity
and quenching efficiency which has been demonstrated by many studies (Frieden,
99
Chapter 2-Discussion
Hansen et al. 2003; Letertre, Perelle et al. 2003; Johnson, Haupt et al. 2004; Ugozzoli,
Latorra et al. 2004; Weidmann, Faye et al. 2010). Also in this study, a LNA-based probe
has enabled a real-time PCR assay to detect different flaviviruses in one reaction.
At present, RT-PCR in nested or hemi-nested format is used most frequently. It requires
sequencing for the identification of viruses and needs approximately one day for
experimentation. In addition, this format carries a high risk of contamination caused by
open handling of highly concentrated PCR products, increasing the risk of false
positives. In contrast, the Pan-Flavi assay presented here requires about 50 minutes for
specific and sensitive detection of several flaviviruses in one reaction. The detection
sensitivity of YFV, DENV, TBEV, JEV and WNV, using the Pan-Flavi assay described
here was close to or as good as that of flavivirus species-specific real-time RT-PCR
assays. Three possible explanations for these minor differences can be considered.
First, the variation in nucleotide sequences of the flaviviruses and the degenerate
oligonucleotides have led to variable results in the real-time PCR assay. Secondly,
different kits were used for the Pan-Flavi assay and flavivirus species-specific assays. In
addition, WNV and JEV-specific assays were performed in a two-step PCR compared to
the one-step Pan-Flavi assay. One-step PCR assays are also reportedly less sensitive
than two-step PCR assays (Wacker and Godard 2005).
The sensitivity of the Pan-Flavi assay to detect RNA was demonstrated by using a 10-
fold serial dilution of viral RNA from DENV-1, YFV and TBEV. This assay was able to
detect 10–100 viral RNA copies per reaction depending on the flavivirus. As a wide
range of human-pathogenic flaviviruses has been detected rapidly with a high level of
sensitivity by the Pan-Flavi assay, this method could be a very useful tool for the
detection of important flaviviruses in the livestock samples. Additionally, this method
allows quantification of flavivirus RNA by use of standard plasmids or standardized in-
vitro RNA, providing information regarding viral load and can be easily established to
other laboratories. Furthermore, the length of the amplicon in the Pan-Flavi assay is
about 260 bp and sufficient to distinguish different flaviviruses based on the sequence
variability. If sequencing or pyrosequencing is combined with this assay, it would be even
possible to differentiate flavivirus species rapidly. Therefore, the Pan-Flavi assay could
be an useful tool to confirm the presence of flaviviruses in sample without any post
amplification method, and it will complement the species-specific flavivirus assays. In
future, this Flavi-all assay is tested on other flaviviruses to check the broad range of this
assay moreover validated by screening livestock and clinical samples for detection of
flaviviruses.

Chapter 2-Discussion
100
In summary, a single-tube Pan-Flavi assay was successfully developed and evaluated
by comparing it with the flavivirus species-specific assays. The Pan-Flavi assay would be
an useful tool for the detection of flaviviruses in clinical and livestock samples, and would
aid in the molecular diagnosis and surveillance studies of various vectors and non-
human hosts.
101
Chapter 3. RAPIDSTRIPE DETECTION
SYSTEM
RAPIDSTRIPE H1N1 TEST FOR DIAGNOSIS OF
THE PANDEMIC SWINE-ORIGIN INFLUENZA A
(H1N1)

103
A INTRODUCTION
A.1 SWINE ORIGIN INFLUENZA A (H1N1) VIRUS
In April 2009, a novel swine-origin influenza A (H1N1) virus (S-OIV A) was detected in
specimens of several patients in the United States and Mexico. This virus spreads
person-to-person, probably in the same way that seasonal influenza viruses spread
(WHO 2009). On June 11 2009, the World Health Organization declared influenza
pandemic, caused by novel S-OIV A (H1N1) and raised the pandemic alert level to
phase 6. Through rapid and frequent international travel, this virus spread worldwide to
more than 214 countries and overseas territories or communities reporting laboratory
confirmed cases of pandemic influenza A H1N1, including at least 18,337 deaths by 16
July 2010 (WHO H1N1 2009 update 2010).
In the 20th century, there have been three pandemics of influenza origin, A/H1N1 from
1918 to 1919 (“Spanish influenza”), A/H2N2 from 1957 to 1963 (“Asian influenza”) and
A/H3N2 from 1968 to 1970 (“Hong Kong influenza”). In 1918, an H1N1 virus, the
Spanish flu closely related to avian viruses adapted to replicate efficiently in humans and
was the most devastating, causing about 20 million human deaths. The pandemic that
began in April 2009 was caused by a novel S-OIV A (H1N1) that represents a quadruple
re-assortment of two swine strains, one human strain, and one avian strain of influenza;
the largest proportions of genes coming from swine influenza viruses. The sequence
analysis of the new S-OIV (H1N1) (A/California/04/2009) showed that the virus has an
unique genome composition of human, swine and avian influenza A viruses that has not
been previously identified (Dawood, Jain et al. 2009).
A.2 DIAGNOSIS OF S-OIV A (H1N1)
The signs and symptoms caused by novel S-OIV A (H1N1) have been characterized by
self-limited, uncomplicated febrile respiratory illness and similar to those of seasonal
influenza like fever, sore throat, cough, headache, rhinorrhea and myalgia. Vomiting and
diarrhea have been also common, neither of which is typical for seasonal influenza (Cao,
Li et al. 2009; Dawood, Jain et al. 2009; Louie, Acosta et al. 2009). Compared to the
previous influenza pandemic (H1N1) of 1918 and 1919, a significant minority of cases
has been severe (Fraser, Donnelly et al. 2009).
Rapid diagnosis of influenza is important to the introduction of antiviral therapy and
quarantine measures, since antiviral therapy should preferably be initiated within 24 h
Chapter 3-Introduction
104
after the appearance of the patient’s first clinical symptoms (van der Vries and Schutten
2010). According to the guideline for diagnosis of pandemic S-OIV A (H1N1) by the
Centers for Disease Control and Prevention (CDC, USA), the probable clinical case must
be confirmed by either positive RT-PCR or virus culture (CDC). Real time RT-PCR is the
recommended test for the diagnosis of pandemic S-OIV A (H1N1) (Ellis, Iturriza et al.
2009). Isolation of S-OIV A (H1N1) by virus culture is also a diagnostic conformation of
infection, but may not yield timely results for clinical management. Several rapid antigen
tests and immunofluorescence tests are available for the diagnosis of pandemic S-OIV A
(H1N1). However, the sensitivity of these tests varies widely (Vasoo, Stevens et al. 2009;
Ganzenmueller, Kluba et al. 2010; Karre, Maguire et al. 2010) and they are not able to
distinguish between the seasonal and new pandemic S-OIV A (H1N1) strains (CDC).
Thus, the differentiation needs to be achieved by RT-PCR or by virus culture, followed by
hemagglutinin inhibition tests. In RT-PCR based methods, a detection of amplified PCR
products requires either time-consuming gel electrophoresis separation or expensive real
time PCR instruments. The rapid detection of PCR products on lateral flow strip (LFS) as
endpoint analysis would be a simple and cost-effective alternative to these laborious,
expensive, and instrument-dependent methods.
A.3 AIM OF THIS STUDY
Lateral flow tests based on the principle of immunochromatography are currently used
for qualitative analysis of several types of analytes (Posthuma-Trumpie, Korf et al. 2009).
A new advanced method of lateral flow test, so called nucleic acid lateral flow (NALF)
assay allows the detection of genetic material such as nucleic acids. This article
describes a NALF assay called rapidSTRIPE assay used as a molecular-genetic rapid
test for the diagnosis of the pandemic S-OIV A (H1N1). This assay is based on rapid
amplification/hybridization (RAH) technology (Analytik Jena AG, Jena, Germany). The
aim of this study was to evaluate the rapidSTRIPE assay based on rapid
amplification/hybridization reaction coupled to instrument independent detection of the
amplification products by user friendly dipsticks. Furthermore, the diagnostic sensitivity
and specificity for rapidSTRIPE assay were determined and compared to the real-time
RT-PCR method (Schulze, Nitsche et al. 2010), which is considered widely as the gold
standard (Ellis, Iturriza et al. 2009).
105
Chapter 3-Materials and Methods
B MATERIALS AND METHODS
B.1 VIRUS STRAINS AND CLINICAL SPECIMENS
Two different standard preparations of H1N1 Influenza viruses (A/California/04/2009 and
A/Hamburg/04/2009) were provided by the European Network for Diagnostics of
imported Viral Diseases Collaborative Laboratory Response Network (ENVID-CLRN).
Different representative influenza A subtype virus strains (A/Brisbane/59/07 H1N1,
A/Caledonia/20/99 H1N1, A/Brisbane/10/07 H3N2, A/Wellington/1/04 H3N2,
A/dk/Germany R603/06 H5N1, A/dk/Vietnam TG24-01/05/H5N1, A/Italy/472/99/ H7N1,
A/Germany/R11/01/H7N1); influenza virus B (B/Malasiya/250604 (Victoria lineage),
B/Iangsu/10/03 (Yamagata lineage)) for specificity test were provided for the specificity
test by the National Reference Center for Influenza, Robert Koch Institute (RKI), Berlin,
Germany.
B.2 RNA EXTRACTION AND CDNA SYNTHESIS
The specimens were collected in different patient centers in Saxony, Germany as
pharyngeal or nasal swabs and stored at 4 °C up to further use. Total RNA from swabs
and the reference virus material was extracted by module 1 of rapidSTRIPE H1N1 Assay
KingFischer system (KF) (Analytik Jena AG, Jena, Germany) according to the
manufacturer’s instructions, whereas viral RNA were extracted from collected swabs as
well as swabs spiked with virus standards using Innuprep RNA virus KFFLX kit (Analytik
Jena AG, Jena, Germany) and Kingfisher FLX automated purification system (Thermo
Scientific, Finnalnd). Samples were eluted in 120 µl of elution buffer. Nucleic acid
extraction can be performed either manually or automatically using rapidSTRIPE H1N1
assay KF system. In addition, RNA samples from clinical specimens included in this
study were tested with in-house glyceraldehyde-3-phosphate dehydrogenase (GAPDH)
RT-PCR to check the quality of the extracted RNA samples using AffinityScript One-Step
RT-PCR Kit (Agilent Technologies, Santa Clara, USA) according to manufacturer’s
instruction. The primer set was designed to span introns and restricted only to PCR
amplification of cDNA templates. RNA was subjected to PCR with Primer GAPDHF: 5´-
CCATGGAGAAGGCTGGGGCT-3´ and Primer GAPDHR: 5´-GGTGGTGCAGGAGGCA-
TTGCT-3´. Subsequently, the amplification products were analysed by 2% ethidium
bromide-stained agarose gel and visualized under UV light. Subsequently, the
amplification products were analysed by 2% ethidium bromide-stained agarose gel and
visualized under UV light.
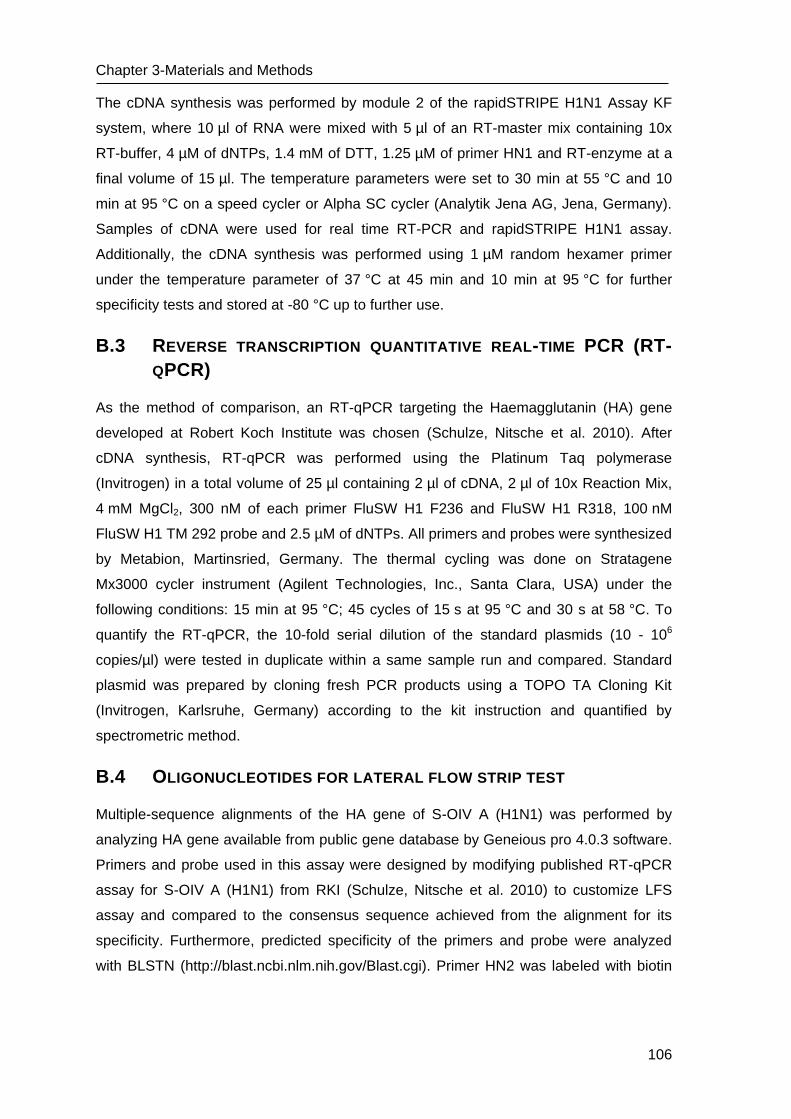
Chapter 3-Materials and Methods
106
The cDNA synthesis was performed by module 2 of the rapidSTRIPE H1N1 Assay KF
system, where 10 µl of RNA were mixed with 5 µl of an RT-master mix containing 10x
RT-buffer, 4 µM of dNTPs, 1.4 mM of DTT, 1.25 µM of primer HN1 and RT-enzyme at a
final volume of 15 µl. The temperature parameters were set to 30 min at 55 °C and 10
min at 95 °C on a speed cycler or Alpha SC cycler (Analytik Jena AG, Jena, Germany).
Samples of cDNA were used for real time RT-PCR and rapidSTRIPE H1N1 assay.
Additionally, the cDNA synthesis was performed using 1 µM random hexamer primer
under the temperature parameter of 37 °C at 45 min and 10 min at 95 °C for further
specificity tests and stored at -80 °C up to further use.
B.3 REVERSE TRANSCRIPTION QUANTITATIVE REAL-TIME PCR (RT-
QPCR)
As the method of comparison, an RT-qPCR targeting the Haemagglutanin (HA) gene
developed at Robert Koch Institute was chosen (Schulze, Nitsche et al. 2010). After
cDNA synthesis, RT-qPCR was performed using the Platinum Taq polymerase
(Invitrogen) in a total volume of 25 µl containing 2 µl of cDNA, 2 µl of 10x Reaction Mix,
4 mM MgCl2, 300 nM of each primer FluSW H1 F236 and FluSW H1 R318, 100 nM
FluSW H1 TM 292 probe and 2.5 µM of dNTPs. All primers and probes were synthesized
by Metabion, Martinsried, Germany. The thermal cycling was done on Stratagene
Mx3000 cycler instrument (Agilent Technologies, Inc., Santa Clara, USA) under the
following conditions: 15 min at 95 °C; 45 cycles of 15 s at 95 °C and 30 s at 58 °C. To
quantify the RT-qPCR, the 10-fold serial dilution of the standard plasmids (10 - 106
copies/µl) were tested in duplicate within a same sample run and compared. Standard
plasmid was prepared by cloning fresh PCR products using a TOPO TA Cloning Kit
(Invitrogen, Karlsruhe, Germany) according to the kit instruction and quantified by
spectrometric method.
B.4 OLIGONUCLEOTIDES FOR LATERAL FLOW STRIP TEST
Multiple-sequence alignments of the HA gene of S-OIV A (H1N1) was performed by
analyzing HA gene available from public gene database by Geneious pro 4.0.3 software.
Primers and probe used in this assay were designed by modifying published RT-qPCR
assay for S-OIV A (H1N1) from RKI (Schulze, Nitsche et al. 2010) to customize LFS
assay and compared to the consensus sequence achieved from the alignment for its
specificity. Furthermore, predicted specificity of the primers and probe were analyzed
with BLSTN (http://blast.ncbi.nlm.nih.gov/Blast.cgi). Primer HN2 was labeled with biotin
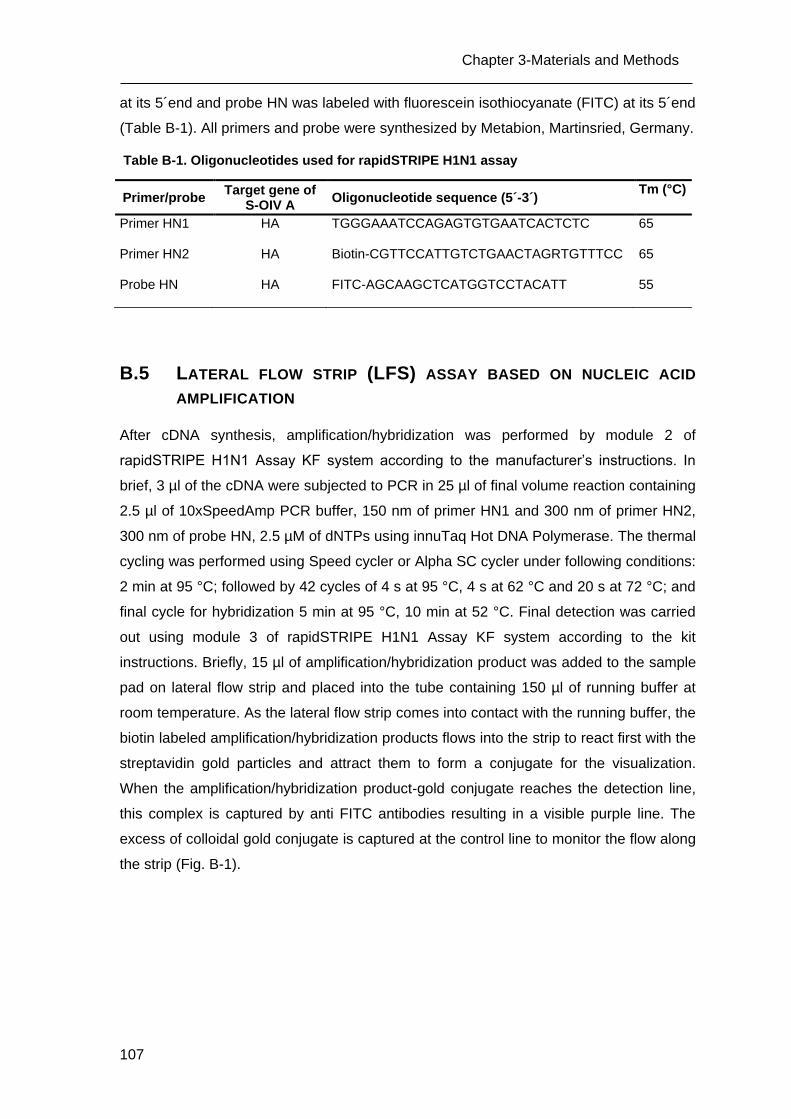
107
Chapter 3-Materials and Methods
at its 5´end and probe HN was labeled with fluorescein isothiocyanate (FITC) at its 5´end
(Table B-1). All primers and probe were synthesized by Metabion, Martinsried, Germany.
Table B-1. Oligonucleotides used for rapidSTRIPE H1N1 assay
B.5 LATERAL FLOW STRIP (LFS) ASSAY BASED ON NUCLEIC ACID
AMPLIFICATION
After cDNA synthesis, amplification/hybridization was performed by module 2 of
rapidSTRIPE H1N1 Assay KF system according to the manufacturer’s instructions. In
brief, 3 µl of the cDNA were subjected to PCR in 25 µl of final volume reaction containing
2.5 µl of 10xSpeedAmp PCR buffer, 150 nm of primer HN1 and 300 nm of primer HN2,
300 nm of probe HN, 2.5 µM of dNTPs using innuTaq Hot DNA Polymerase. The thermal
cycling was performed using Speed cycler or Alpha SC cycler under following conditions:
2 min at 95 °C; followed by 42 cycles of 4 s at 95 °C, 4 s at 62 °C and 20 s at 72 °C; and
final cycle for hybridization 5 min at 95 °C, 10 min at 52 °C. Final detection was carried
out using module 3 of rapidSTRIPE H1N1 Assay KF system according to the kit
instructions. Briefly, 15 µl of amplification/hybridization product was added to the sample
pad on lateral flow strip and placed into the tube containing 150 µl of running buffer at
room temperature. As the lateral flow strip comes into contact with the running buffer, the
biotin labeled amplification/hybridization products flows into the strip to react first with the
streptavidin gold particles and attract them to form a conjugate for the visualization.
When the amplification/hybridization product-gold conjugate reaches the detection line,
this complex is captured by anti FITC antibodies resulting in a visible purple line. The
excess of colloidal gold conjugate is captured at the control line to monitor the flow along
the strip (Fig. B-1).
Primer/probe Target gene of
S-OIV A Oligonucleotide sequence (5´-3´)
Tm (°C)
Primer HN1 HA TGGGAAATCCAGAGTGTGAATCACTCTC 65
Primer HN2 HA Biotin-CGTTCCATTGTCTGAACTAGRTGTTTCC 65
Probe HN HA FITC-AGCAAGCTCATGGTCCTACATT 55
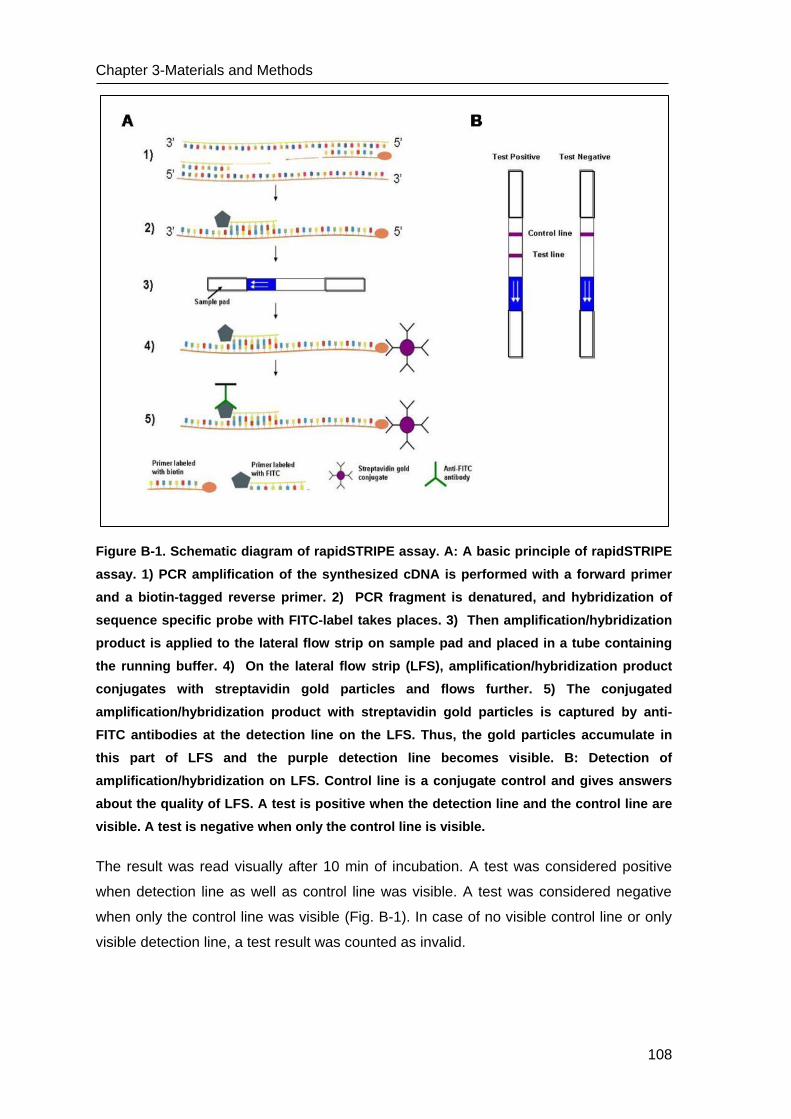
Chapter 3-Materials and Methods
108
Figure B-1. Schematic diagram of rapidSTRIPE assay. A: A basic principle of rapidSTRIPE
assay. 1) PCR amplification of the synthesized cDNA is performed with a forward primer
and a biotin-tagged reverse primer. 2) PCR fragment is denatured, and hybridization of
sequence specific probe with FITC-label takes places. 3) Then amplification/hybridization
product is applied to the lateral flow strip on sample pad and placed in a tube containing
the running buffer. 4) On the lateral flow strip (LFS), amplification/hybridization product
conjugates with streptavidin gold particles and flows further. 5) The conjugated
amplification/hybridization product with streptavidin gold particles is captured by anti-
FITC antibodies at the detection line on the LFS. Thus, the gold particles accumulate in
this part of LFS and the purple detection line becomes visible. B: Detection of
amplification/hybridization on LFS. Control line is a conjugate control and gives answers
about the quality of LFS. A test is positive when the detection line and the control line are
visible. A test is negative when only the control line is visible.
The result was read visually after 10 min of incubation. A test was considered positive
when detection line as well as control line was visible. A test was considered negative
when only the control line was visible (Fig. B-1). In case of no visible control line or only
visible detection line, a test result was counted as invalid.
109
Chapter 3-Results
C RESULTS
C.1 SENSITIVITY OF THE LFS ASSAY AND COMPARISON WITH RT-
QPCR
In order to determine the sensitivity of the rapidSTRIPE H1N1 Assay KF system, serial
diluted concentrations of the viral strain A/Hamburg/04/2009 were applied on LFS assay
as well as on reference RT-qPCR after cDNA synthesis. Tenfold serial dilution of S-OIV
A (H1N1) RT-qPCR specific standard plasmids were used to determine the genome
equivalent copies (Geq). Down to 8 Geq copies/assay of S-OIV A (H1N1) were detected
per assay by the reference method RT-qPCR (Fig C-1 & C-2), where down to 84 Geq
copies/assay of S-OIV A (H1N1) were detected clearly per LFS assay (Fig. C-2). In this
case, LFS assay showed 10-fold lower sensitivity than the reference method RT-qPCR.
RT-qPCR was performed in duplicate while LFS assay was performed as a single
sample (Fig. 2).
Figure C-1. Sensitivity of RT-qPCR. Serial dilution of the viral strain A/Hamburg/04/2009
were used to determine the Geq copies of S-OIV as a reference method.
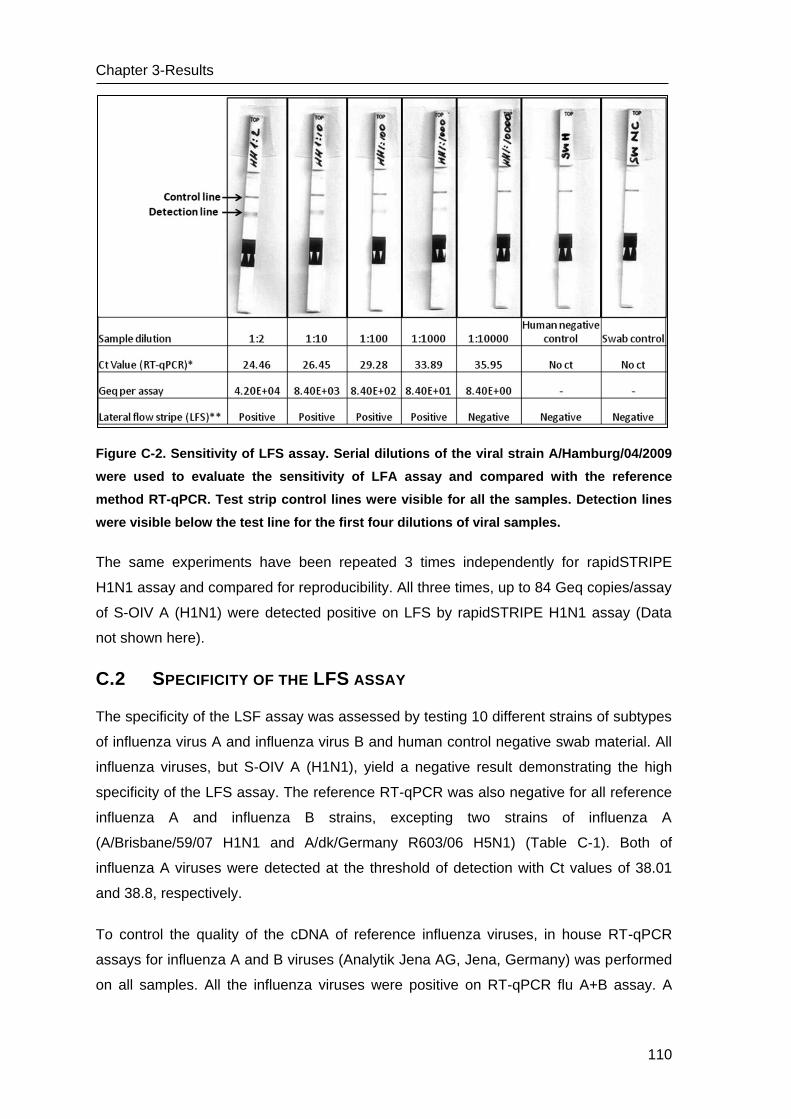
Chapter 3-Results
110
Figure C-2. Sensitivity of LFS assay. Serial dilutions of the viral strain A/Hamburg/04/2009
were used to evaluate the sensitivity of LFA assay and compared with the reference
method RT-qPCR. Test strip control lines were visible for all the samples. Detection lines
were visible below the test line for the first four dilutions of viral samples.
The same experiments have been repeated 3 times independently for rapidSTRIPE
H1N1 assay and compared for reproducibility. All three times, up to 84 Geq copies/assay
of S-OIV A (H1N1) were detected positive on LFS by rapidSTRIPE H1N1 assay (Data
not shown here).
C.2 SPECIFICITY OF THE LFS ASSAY
The specificity of the LSF assay was assessed by testing 10 different strains of subtypes
of influenza virus A and influenza virus B and human control negative swab material. All
influenza viruses, but S-OIV A (H1N1), yield a negative result demonstrating the high
specificity of the LFS assay. The reference RT-qPCR was also negative for all reference
influenza A and influenza B strains, excepting two strains of influenza A
(A/Brisbane/59/07 H1N1 and A/dk/Germany R603/06 H5N1) (Table C-1). Both of
influenza A viruses were detected at the threshold of detection with Ct values of 38.01
and 38.8, respectively.
To control the quality of the cDNA of reference influenza viruses, in house RT-qPCR
assays for influenza A and B viruses (Analytik Jena AG, Jena, Germany) was performed
on all samples. All the influenza viruses were positive on RT-qPCR flu A+B assay. A
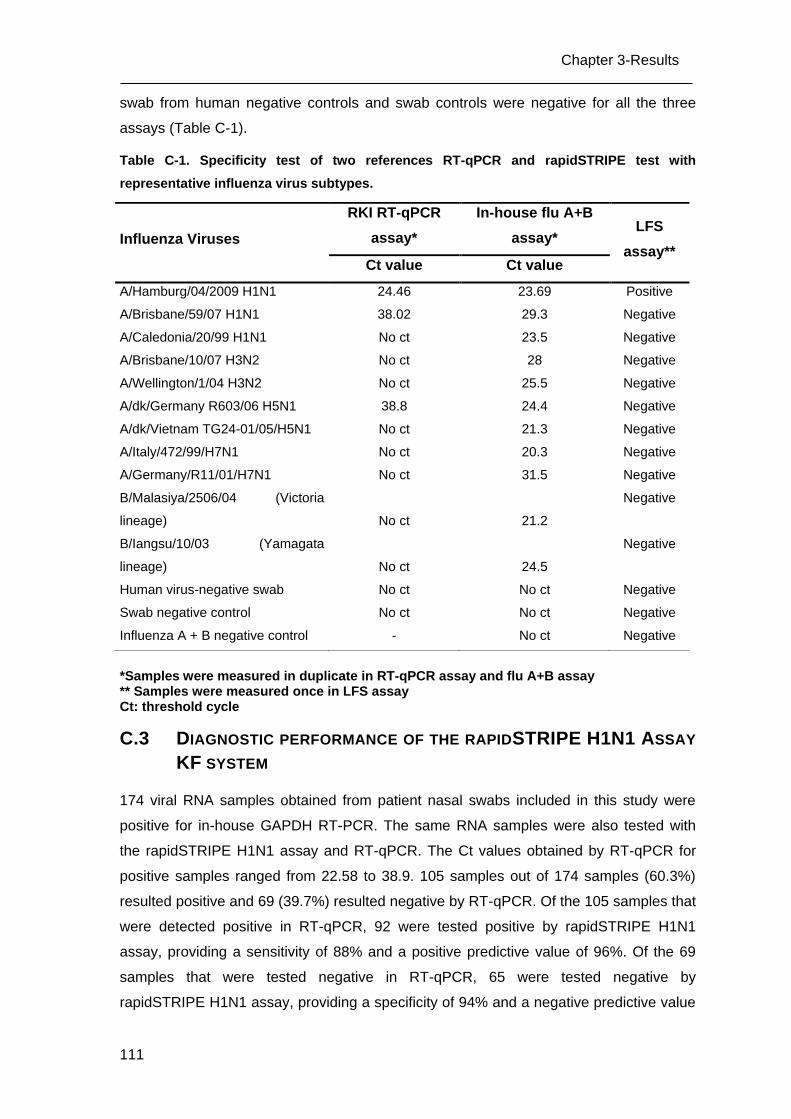
111
Chapter 3-Results
swab from human negative controls and swab controls were negative for all the three
assays (Table C-1).
Table C-1. Specificity test of two references RT-qPCR and rapidSTRIPE test with
representative influenza virus subtypes.
*Samples were measured in duplicate in RT-qPCR assay and flu A+B assay ** Samples were measured once in LFS assay Ct: threshold cycle
C.3 DIAGNOSTIC PERFORMANCE OF THE RAPIDSTRIPE H1N1 ASSAY
KF SYSTEM
174 viral RNA samples obtained from patient nasal swabs included in this study were
positive for in-house GAPDH RT-PCR. The same RNA samples were also tested with
the rapidSTRIPE H1N1 assay and RT-qPCR. The Ct values obtained by RT-qPCR for
positive samples ranged from 22.58 to 38.9. 105 samples out of 174 samples (60.3%)
resulted positive and 69 (39.7%) resulted negative by RT-qPCR. Of the 105 samples that
were detected positive in RT-qPCR, 92 were tested positive by rapidSTRIPE H1N1
assay, providing a sensitivity of 88% and a positive predictive value of 96%. Of the 69
samples that were tested negative in RT-qPCR, 65 were tested negative by
rapidSTRIPE H1N1 assay, providing a specificity of 94% and a negative predictive value
Influenza Viruses
RKI RT-qPCR
assay*
In-house flu A+B
assay* LFS
assay** Ct value Ct value
A/Hamburg/04/2009 H1N1 24.46 23.69 Positive
A/Brisbane/59/07 H1N1 38.02 29.3 Negative
A/Caledonia/20/99 H1N1 No ct 23.5 Negative
A/Brisbane/10/07 H3N2 No ct 28 Negative
A/Wellington/1/04 H3N2 No ct 25.5 Negative
A/dk/Germany R603/06 H5N1 38.8 24.4 Negative
A/dk/Vietnam TG24-01/05/H5N1 No ct 21.3 Negative
A/Italy/472/99/H7N1 No ct 20.3 Negative
A/Germany/R11/01/H7N1 No ct 31.5 Negative
B/Malasiya/2506/04 (Victoria
lineage) No ct 21.2
Negative
B/Iangsu/10/03 (Yamagata
lineage) No ct 24.5
Negative
Human virus-negative swab No ct No ct Negative
Swab negative control No ct No ct Negative
Influenza A + B negative control - No ct Negative
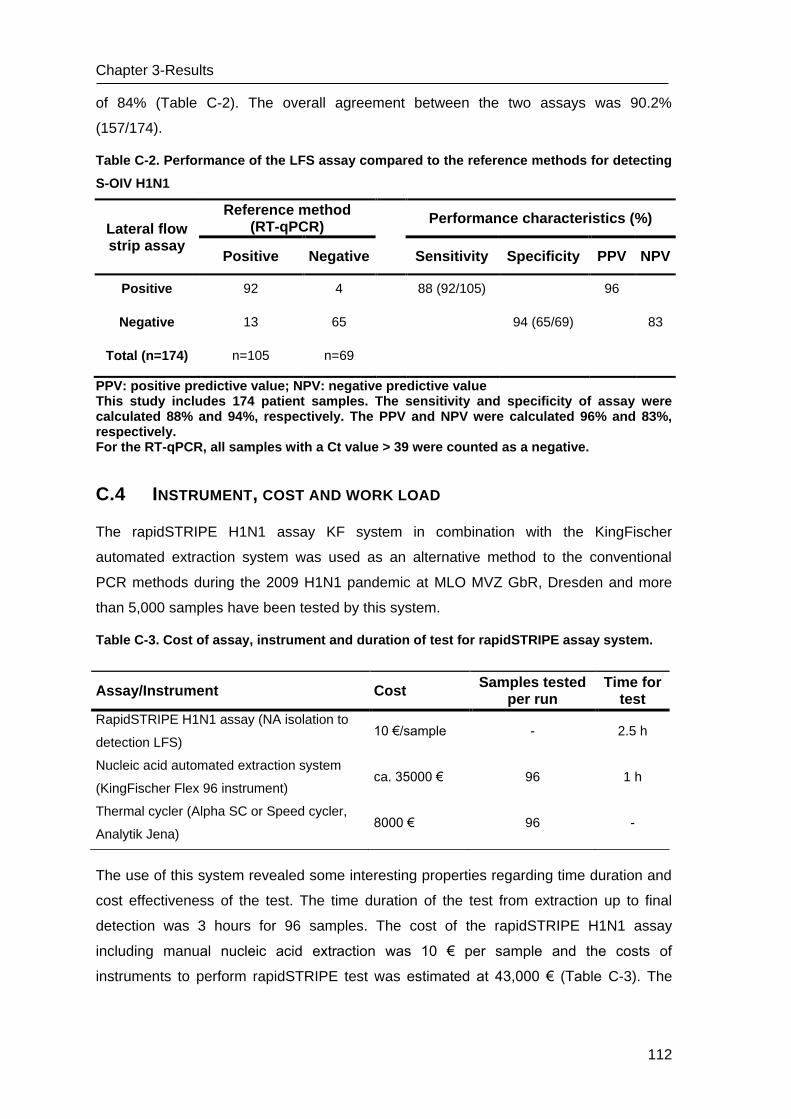
Chapter 3-Results
112
of 84% (Table C-2). The overall agreement between the two assays was 90.2%
(157/174).
Table C-2. Performance of the LFS assay compared to the reference methods for detecting
S-OIV H1N1
Lateral flow strip assay
Reference method (RT-qPCR)
Performance characteristics (%)
Positive Negative Sensitivity Specificity PPV NPV
Positive 92 4 88 (92/105) 96
Negative 13 65 94 (65/69) 83
Total (n=174) n=105 n=69
PPV: positive predictive value; NPV: negative predictive value This study includes 174 patient samples. The sensitivity and specificity of assay were calculated 88% and 94%, respectively. The PPV and NPV were calculated 96% and 83%, respectively. For the RT-qPCR, all samples with a Ct value > 39 were counted as a negative.
C.4 INSTRUMENT, COST AND WORK LOAD
The rapidSTRIPE H1N1 assay KF system in combination with the KingFischer
automated extraction system was used as an alternative method to the conventional
PCR methods during the 2009 H1N1 pandemic at MLO MVZ GbR, Dresden and more
than 5,000 samples have been tested by this system.
Table C-3. Cost of assay, instrument and duration of test for rapidSTRIPE assay system.
The use of this system revealed some interesting properties regarding time duration and
cost effectiveness of the test. The time duration of the test from extraction up to final
detection was 3 hours for 96 samples. The cost of the rapidSTRIPE H1N1 assay
including manual nucleic acid extraction was 10 € per sample and the costs of
instruments to perform rapidSTRIPE test was estimated at 43,000 € (Table C-3). The
Assay/Instrument Cost Samples tested
per run Time for
test
RapidSTRIPE H1N1 assay (NA isolation to
detection LFS) 10 €/sample - 2.5 h
Nucleic acid automated extraction system
(KingFischer Flex 96 instrument) ca. 35000 € 96 1 h
Thermal cycler (Alpha SC or Speed cycler,
Analytik Jena) 8000 € 96 -
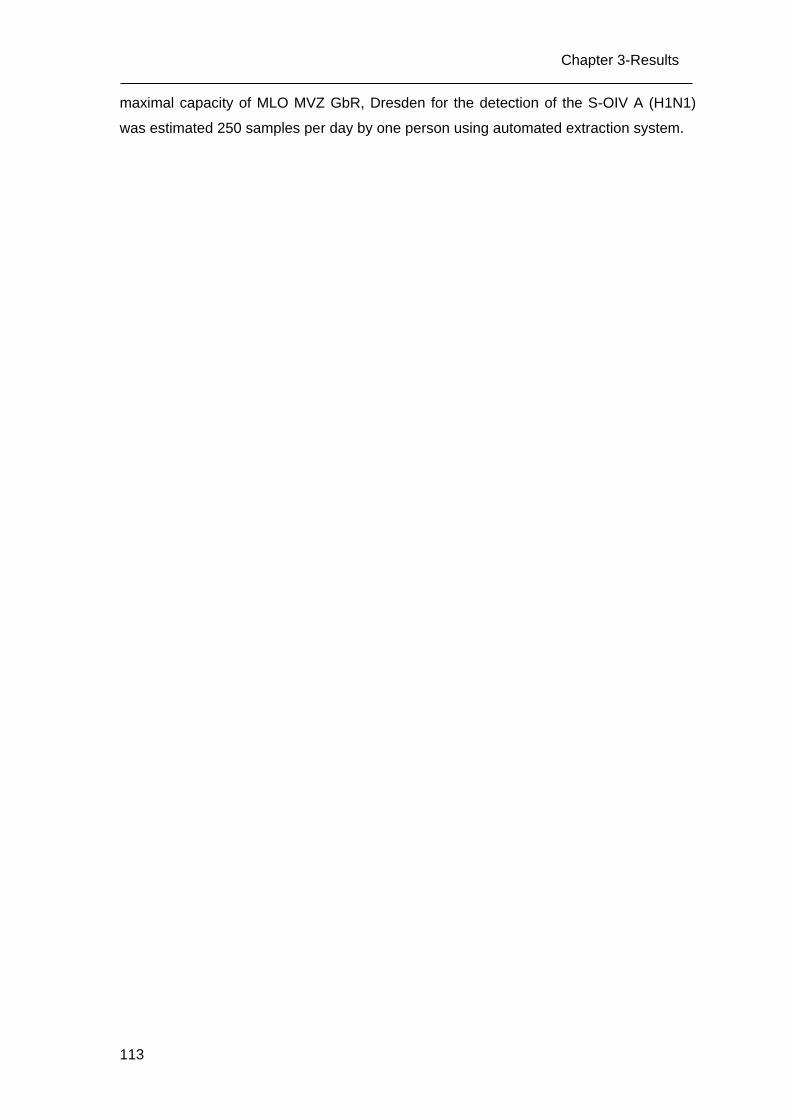
113
Chapter 3-Results
maximal capacity of MLO MVZ GbR, Dresden for the detection of the S-OIV A (H1N1)
was estimated 250 samples per day by one person using automated extraction system.
Chapter 3-Discussion
114
D DISCUSSION
This study demonstrates the usefulness of the rapidSTRIPE H1N1 assay for the rapid
detection of novel S-OIV H1N1 as point-of-care diagnostic setting. This assay showed
cross-reactivity neither with other influenza A and B viruses nor with human negative
control material providing a good specificity profile required for diagnostic accuracy. At
least 84 geq copies/assay could be detected by the rapidSTRIPE H1N1 assay,
corresponding to 8,400 viral RNA copies in 100 µl RNA or 8400 virus particles in the
initial sample (exp. swab sample). The rapidSTRIPE test showed an overall sensitivity of
88% and specificity of 94% in comparison to RT-qPCR, the widely preferred method for
diagnosis of S-OIV A (H1N1) (Ellis, Iturriza et al. 2009). The total cost of the
rapidSTRIPE H1N1 test including a manual nucleic acid extraction is about 10 € per
sample.
Several PCR-based assays for the detection of the S-OIV A (H1N1) have been
developed and published soon after the emergence of the pandemic 2009 H1N1 virus
(Carr, Gunson et al. 2009; Panning, Eickmann et al. 2009; Poon, Chan et al. 2009;
Wang, Gao et al. 2009; Whiley, Bialasiewicz et al. 2009). Also new rapid assays like
real-time nucleic acid sequenced based amplification and multi-fluorescent real-time RT-
PCR have been developed to detect novel S-OIV A (H1N1) (Dong, Zhang et al. 2009;
Ge, Cui et al. 2009). All these molecular detection methods as real-time RT-qPCR have
been broadly used in medical diagnostic laboratories, because of their high sensitivity
and specificity. RT-qPCR is regarded widely as a gold standard for diagnosis of influenza
viruses (Ellis, Iturriza et al. 2009). However, RT-qPCR is relatively expensive and
requires trained laboratory expertise and extensive evaluation, which limit the broad use
of in house assays (Vasoo, Stevens et al. 2009).
Rapid antigen-antibody based influenza tests as point-of-care tests have been used
since they require only 10-15 min and minimal expertise for testing. They also provide a
source of data for clinical management of the patients. However, high virus concentration
is required to yield a positive rapid test (Drexler, Helmer et al. 2009). Depending on the
virus load of the respiratory sample, an overall sensitivity of 40% to 69% has been
reported for rapid antigen-antibody based influenza tests, among different commercial
tests (Ganzenmueller, Kluba et al. 2010; Herzum, Lutz et al. 2010; Karre, Maguire et al.
2010). A negative test obtained with rapid antigen-antibody based tests still requires a
need of confirmation by the PCR based methods or virus culture, followed by
hemagglutination inhibition test.
115
Chapter 3-Discussion
Nucleic acid based lateral flow assay is a similar method as a rapid antigen-based test,
but a dual labeled amplicon is detected here after amplification instead of antigen. Such
a NALF test using primers with two different tags has been described for the detection of
pathogenic bacteria from food (Blazkova M, Koets M et al. 2009) and for rapid detection
of malaria (Mens, van Amerongen et al. 2008) previously. There is a high risk of false
positive results caused by primer dimers for this NALF test using tagged primers. The
rapidSTRIPE H1N1 assay is a NALF test using RAH technology, which generates
amplification/hybridization products in a single reaction without any post amplification
modification. Higher specificity in comparison to rapid antigen-antibody based systems is
achieved here by use of the target specific probe and rapid PCR. The use of a target
sequence specific tagged probe for subsequent hybridization to single stranded
amplification product helps here to eliminate nonspecific reaction due to the primer
dimers.
Recently, rapid oligochromatographic assay (Perez-Ruiz, Navarro-Mari et al. 2010) and
NALF test combining the isothermal PCR (Wu, Curran et al. 2010) methods have been
developed for detection of the pandemic 2009 H1N1 virus. In the rapid
oligochromatographic assay, amplification products were first denatured; then carried out
on LFS, where hybridization took place under thermal conditions. This whole procedure
needs extra manual steps in comparison to the rapidSTRIPE assay. In the rapidSTRIPE
assay, amplification/hybridization products were generated in a single reaction and
carried out directly on LFS at room temperatures without any modification. The major
advantage of isothermal methods in comparison to rapidSTRIPE assay is that, there is
no need of thermal cycling hardware. However, a complex assay design, an extensive
optimization, and other reagents are required for such an isothermal PCR, where the
rapidSTRIPE assay can be easily adapted from any conventional real time PCR assay
and all reagents are commercially available. Furthermore, the rapidSTRIPE H1N1 assay
KF system provides all reagents needed from the nucleic acid isolation to the final
detection on LFS in one single system.
The rapidSTRIPE H1N1 assay described here is commercially available under the CE
mark of in vitro diagnostic products and fulfills the CE requirement of European
Guidelines for quality management ISO 9001:2000 and in-vitro diagnostic EN ISO
13485:2003. Furthermore, over 500 repetitions of the same samples with different
batches of the kits demonstrated a 100% reproducibility of the results by the
manufacturer.
Chapter 3-Discussion
116
In summary, the rapidSTRIPE H1N1 assay offers a powerful tool for specific detection of
S-OIV A (H1N1) in about 3 hours starting from swab sampling to nucleic acid isolation,
RT-PCR and rapid amplification/hybridization until final detection of the PCR products on
a LFS. This rapid assay allows the semi-quantitative detection of S-OIV A (H1N1) with
several advantages as quickness, cost effectiveness and long-term stability. The readout
of the test is performed optically, which makes independent of an instrument specific
analysis system. The results clearly demonstrate that the rapidSTRIPE assay in
combination with the KingFischer automated nucleic acid extraction system allows the
investigation of 250 patient samples per day by one person. This system can easily be
used as a high throughput screening system for laboratories not equipped with real time
PCR instruments and resource-poor diagnostic settings during the epidemical situation.
117
Chapter 4. RECOMBINASE POLYMERASE
AMPLIFICATION ASSAY FOR LOW-
RESOURCE SETTINGS
RECOMBINASE POLYMERASE AMPLIFICATION
ASSAY FOR THE DETECTION OF YELLOW FEVER
VIRUS IN LOW-RESOURCE SETTINGS

119
A INTRODUCTION
A.1 YELLOW FEVER VIRUS
Yellow fever (YF) is one of the most lethal and acute viral hemorrhagic disease
transmitted by infected mosquitoes. YF is naturally distributed throughout the tropical
South-Americas and sub-Saharan Africa, but not reported in Asian countries; and
remains one of the major public health problems in these areas of the world. According
to World Health Organization, there are globally 200,000 estimated cases of Yellow fever
annually, causing 30,000 deaths with case fatality rates of 20 to 50 %. YF is endemic in
tropical areas of Africa and South-America and poses risk to a total combined population
of over 900 million people (WHO YFV fact sheet 2011). In the last two decades, a
reemergence of YF was recognized in these endemic regions and cases of YF infections
have increased due to the following main reasons: declining population immunity,
deforestation, urbanization, climate change and frequent travels from endemic countries
(Staples, Gershman et al. 2010).
YF is caused by Yellow fever virus (YFV), a prototype member of the genus Flavivirus, a
family Flaviviridae. YFV contains a positive-sense, single-stranded RNA genome of
approximately 11 kb. The viral genome has only a single open reading frame encoding
single large polypeptide. This polypeptide is co- and post-translationally proceeded by
host and virus-encoded proteases into at least ten proteins: three structural proteins
(capsid, pre-membrane and envelope) and seven nonstructural (NS) proteins (NS1,
NS2A, NS2B, NS3, NS4A, NS4B and NS5) (Chambers, Hahn et al. 1990).
Several different species of Aedes and Haemogogus mosquitos are known to transmit
the YFV. The Transmission of YFV occurs between mosquito and human in urban cycle
or between mosquito and other primates in sylvatic cycle. YFV can be also transmitted
transovarially between the mosquitos. An intermediate cycle occurs in humid and semi-
humid parts of Africa, where YFV is transmitted between human and non-human
primates through Aedes mosquitos (Monath, Guirakhoo et al. 2003; WHO YFV fact sheet
2011).
The disease symptoms caused by YFV infection ranges from nonspecific flu-like illness
to classic YF, which is characterized by severe liver and renal dysfunction, circulatory
shock, and hemorrhage. Most of the patients recover 3-4 days after onset of infection.
However, about 15 %-25 % patients develop the severe disease, with a case fatality rate
Chapter 4-Introduction
120
of up to 50 %. There is no specific therapy treating the YF; patients can be only treated
symptomatically. Vaccination is the only and most effective measure for preventing YF.
A.2 VACCINATION AND ADVERSE EVENTS AFTER VACCINATION
In 1927, YFV (Asibi strain) was first isolated from a human patient in West Africa and the
YF-17D live-attenuated vaccine was developed in 1936 by the empirical method of
sequential passage of the YFV Asibi in a mouse and chicken embryo tissue. Two sub-
strains of YFV (17D - 204 and 17DD) derived from a common ancestor (wild type Asibi
strain) are used for manufacturing of live attenuated YF vaccines (Domingo and Niedrig
2009).
The YF vaccine is delivered as a single subcutaneous dose. It is safe and provides an
effective immunity against YFV within 10 days for 90 % of the recipients. The YF vaccine
is not allowed for children under 6 years and immunocompromised people. The YF
vaccine is well tolerated, with a low rate of severe adverse events (SAEs). Although
SAEs to YFV are rare, an increased number of SAEs after the YF vaccination was
recently reported (Barrett and Teuwen 2009; Domingo and Niedrig 2009). The reasons
for SAEs are still poorly understood and it needs more investigation of YFV vaccine
strains (Stock, Boschetti et al. 2012). However, the risk of death from YF is far greater
than the risk of SAEs related to the vaccine. Therefore, vaccination remains an important
measure for preventing YF in endemic areas. At least 60 %- 80 % population in affected
areas must be vaccinated to prevent outbreaks. WHO had initiated preventive
vaccination campaigns in the 12 West African countries at risk of the YF disease.
Between 2007 and 2010, ten African countries have completed mass vaccination
campaigns. Despite these efforts, vaccination coverage in African countries is very low in
comparison to South-American countries (Domingo and Niedrig 2009; WHO YFV fact
sheet 2011). Therefore diagnostic tools to detect YFV and rapid response through
emergency vaccination campaigns are essential to control outbreaks.
A.3 DIAGNOSIS OF YFV
The diagnosis of YFV infection is particularly difficult because the symptoms are similar
to severe malaria, dengue hemorrhagic fever, leptospirosis, viral hepatitis and other
hemorrhagic fevers. Many laboratory techniques like virus isolation, immunoassay and
RT-PCR assays, have been applied routinely for diagnosis of YFV. Virus isolation can be
performed during the febrile period of the YF disease by inoculation of patient´s blood
sample on cell culture. Immunofluorescence assays and RT-PCR can be used to
determine the successive virus isolation. Other alternatives besides virus isolation for
121
Chapter 4-Introduction
diagnosis during the febrile period of YF disease are molecular techniques like
conventional RT-PCR, Taqman real-time RT-PCR and YF antigen detection. Seven days
after onset of symptoms, several blood tests can detect yellow fever specific antibodies
produced in response to the infection. Different serological tests like IgM capture and IgG
ELISA, plaque reduction neutralization tests (PRNT) and rapid tests can be performed to
detect these YF-specific antibodies after viremic phase. PRNT is a standard serological
method in virology to detect virus neutralizing antibodies. Virus and antibody mixture is
inoculated on virus susceptible cells, and the effect of antibodies on virus infectivity is
measured to determine the titer. Different read out systems are developed for PRNT.
The PRNT is a very reliable, mainly serological test, but in contrast to other serological
tests, it is a lab and time intensive assay.
Molecular methods based on the detection of viral genomes have replaced the gold
standard method “virus isolation” and play an important role for diagnosis in the acute
phase of YFV infection. Molecular assays are rapid, sensitive, and highly specific in
comparison to other methods. Many of quantitative RT-PCR assays have been
described for the detection and quantification of YFV. Most of these methods are based
on Taqman probe chemistry and provide good sensitivity and specificity. Although RT-
qPCR provides many advantages, it is restricted to well establish laboratories and
cannot be used for in-field diagnosis. In contrast to this, new molecular methods based
on isothermal amplification like Loop mediated amplification (LAMP), Helicase
dependent amplification (HAD), Recombinase polymerase amplification (RPA) and
Transcription-mediated amplification (TMA) offer simple, rapid, specific and cost-effective
alternatives to RT-qPCR and can be easily used for the in-field applications using simple
laboratory settings.
A.4 AIM OF THIS STUDY
The aim of this study was to develop an YFV nucleic acid testing system for resource-
poor and field settings, which can be used to monitor YFV infection and SAEs caused by
the YF vaccine during mass vaccination campaigns in endemic African countries. Using
Recombinase polymerase amplification (RPA), an isothermal approach, a molecular
diagnostic assay was developed for rapid detection of YFV, which could be performed
either instrument-free or with a small portable instrument for in-field or resource-poor
settings. Additionally, all the reagents needed for testing can be stored at ambient
conditions.
Chapter 4-Materials and Methods
122
B MATERIALS AND METHODS
B.1 VIRUSES AND ISOLATION OF VIRAL RNA
All flavivirus and non-flavivirus strains used were derived from cell culture and provided
by the Robert Koch Institute, Berlin, Germany. The following inactivated and stable virus
preparations were used in this study: DENV-1 VR344 (Thai 1958); DENV-2 VR345 (TH-
36 strain); DENV-3 VR216 (H87 strain); DENV-4 VR217 (H241 strain); WNV Uganda
strain (AY532665); WNV Israel (H. Bin, Sheba Medical Centre, Israel), Usutu virus
(AY453411); JEV (ATCC SA14-14-2); Saint Louis Encephalitis virus (SLEV) (ATCC VR-
1265); TBEV strain K23 (AF091010); YFV strain 17D (X03700); YFV strain ASIBI
(AY640589); YFV strain Brazil; YFV strain Ivory Coast and Russian Spring Summer
Encephalitis virus (RSSEV). The external quality assurance (EQA) panel of YFV used in
this study was provided by the European Network for Diagnostics of Imported Viral
Diseases (ENIVD).
Viral RNA was isolated from 140 µl aliquots of cell culture supernatants, using the
QIAamp Viral Mini Kit (Qiagen, Hilden, Germany) according to the manufacturer's
instructions. RNA was eluted in 100 µl of elution buffer and stored at -80 °C until further
use. For in-field application, Instant MP basic kit can be used for RNA extraction from
clinical samples according to the manufacturer´s instructions.
B.2 PRIMER AND PROBE FOR RPA
Available full-length YFV sequences and partial sequences covering the 5´-UTR region
from the database (NCBI) were aligned using Geneious 5.0 software. Based on the
alignment, degenerate generic primers and corresponding primers representing all
known sequence variants were designed for generic amplification of different YFV
strains. In contrast to PCR, RPA requires primer consisting of up to 30 nt. According to
Piepenburg and colleagues, primers in length of 30 to 35 nt are recommended for RPA
(Piepenburg, Williams et al. 2006). Although, primers in length of 27 to 29 nt have used
for YFV RPA nfo assay. Whereas, primers in length of 30 nt were used for YFV RPA exo
assay. RPA nfo probe and RPA exo probes, two restriction probes were designed
according to the guidelines provided by TwistDx manual.
B.3 REAL-TIME PCR AND PLASMID STANDARD
The YFV-specific primers combination YFV all F/R and probe YFV all TM were used to
detect and quantify genomic RNA of YFV as described previously (Domingo, Patel, 2012
123
Chapter 4-Materials and Methods
in progress). The assay was performed in one-step format on the ABI 7500 instrument
using the QuantiTect Virus Kit (Qiagen, Hilden, Germany).
To quantify the RT-qPCR, the 10-fold serial dilution of the standard plasmids (10 - 106
copies/µl) were tested in duplicate within the same sample run and compared. Standard
plasmid was prepared by cloning fresh PCR products of YFV all assay using a TOPO TA
Cloning Kit (Invitrogen, Karlsruhe, Germany) according to the kit instruction and
quantified by spectrometric method. The YFV all assay and plasmids were kindly
provided by Dr. C. Domingo.
The YFV LNA probe based real-time RT-qPCR assay was used as described previously
(Weidmann, Faye et al. 2010).
B.4 LATERAL-FLOW STRIPE RPA ASSAY
Lateral-flow stripe RPA (LFS-RPA) assay was performed using either TwistAmp nfo kit
or Twist nfo RT kit according to manufacturer’s instruction. For detection of RNA target
using TwistAmpnfo kit, 1 µl of RT-Enzyme was additionally added to the RPA reaction.
As the TwistAmpnfo RT kit was commercially available, only this kit was used for LFS-
RPA assay. Briefly, 29.5 μl of rehydration solution were mixed with 2.1 μl of each primer
(10 µM), 0.6 µl of target specific RPA nfo probe (10 µM) and 8.2 µl of PCR grade water.
Master mix of 42.5 µl was then added to the dry reagent pellet and mixed by pipetting up
and down the reaction mixture. 5 µl of template (genomic DNA or RNA from the
pathogens) was added to this mixture. Finally, 2.5 µl of Mg(OAC)2 (280 mM) was added
to the 47.5 µl of the solution and the reaction was started through this step. The tubes
containing reactions were vortexed and centrifuged shortly, and then placed into a
thermo block or a PCR cycler at 39 °C for 20 min. After the amplification step, one µl of
amplification product was diluted in 9 µl of PBST buffer and carried onto the sample pad
of lateral flow strip (LFS). The strips were then placed in tubes containing 100 µl of PBST
buffer. The result was read visually after 10 min of incubation. A test was considered
positive when the detection line as well as the control line was visible. A test was
considered negative when only the control line was visible.
Amplification products of the LFS-RPA assay were also analyzed by gel electrophoresis
as endpoint detection. 25 µl of amplification product was loaded on a 1.5 % agarose gel
and run for 40 min at 110 V. Gel was stained with ethidium bromide and visualized under
UV light.
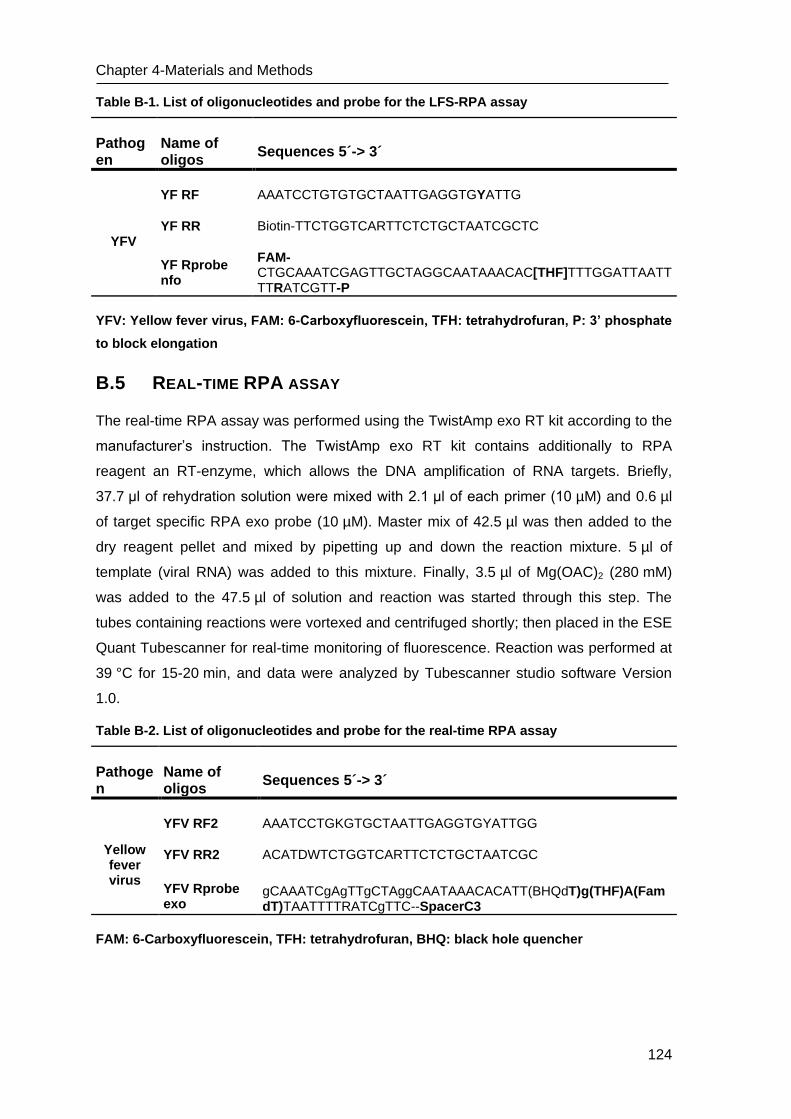
Chapter 4-Materials and Methods
124
Table B-1. List of oligonucleotides and probe for the LFS-RPA assay
Pathogen
Name of oligos
Sequences 5´-> 3´
YFV
YF RF AAATCCTGTGTGCTAATTGAGGTGYATTG
YF RR Biotin-TTCTGGTCARTTCTCTGCTAATCGCTC
YF Rprobe nfo
FAM-CTGCAAATCGAGTTGCTAGGCAATAAACAC[THF]TTTGGATTAATTTTRATCGTT-P
YFV: Yellow fever virus, FAM: 6-Carboxyfluorescein, TFH: tetrahydrofuran, P: 3’ phosphate
to block elongation
B.5 REAL-TIME RPA ASSAY
The real-time RPA assay was performed using the TwistAmp exo RT kit according to the
manufacturer’s instruction. The TwistAmp exo RT kit contains additionally to RPA
reagent an RT-enzyme, which allows the DNA amplification of RNA targets. Briefly,
37.7 μl of rehydration solution were mixed with 2.1 μl of each primer (10 µM) and 0.6 µl
of target specific RPA exo probe (10 µM). Master mix of 42.5 µl was then added to the
dry reagent pellet and mixed by pipetting up and down the reaction mixture. 5 µl of
template (viral RNA) was added to this mixture. Finally, 3.5 µl of Mg(OAC)2 (280 mM)
was added to the 47.5 µl of solution and reaction was started through this step. The
tubes containing reactions were vortexed and centrifuged shortly; then placed in the ESE
Quant Tubescanner for real-time monitoring of fluorescence. Reaction was performed at
39 °C for 15-20 min, and data were analyzed by Tubescanner studio software Version
1.0.
Table B-2. List of oligonucleotides and probe for the real-time RPA assay
Pathogen
Name of oligos
Sequences 5´-> 3´
Yellow fever virus
YFV RF2 AAATCCTGKGTGCTAATTGAGGTGYATTGG
YFV RR2 ACATDWTCTGGTCARTTCTCTGCTAATCGC
YFV Rprobe exo
gCAAATCgAgTTgCTAggCAATAAACACATT(BHQdT)g(THF)A(FamdT)TAATTTTRATCgTTC--SpacerC3
FAM: 6-Carboxyfluorescein, TFH: tetrahydrofuran, BHQ: black hole quencher
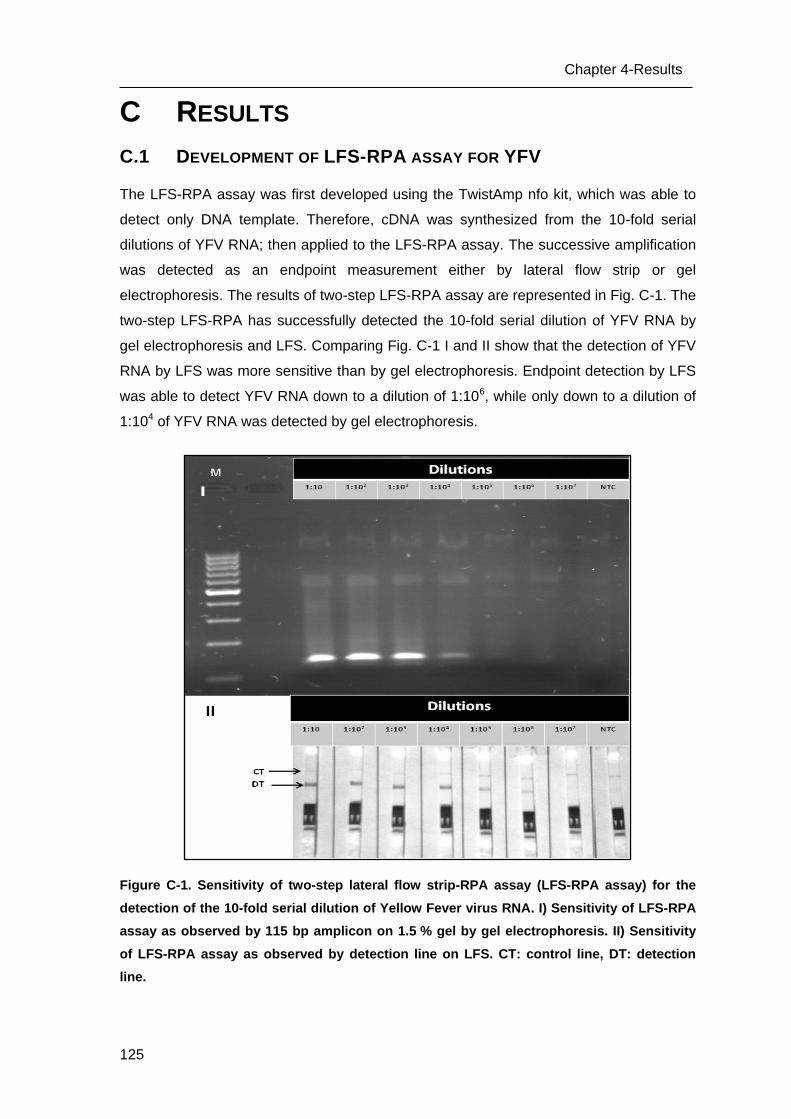
125
Chapter 4-Results
C RESULTS
C.1 DEVELOPMENT OF LFS-RPA ASSAY FOR YFV
The LFS-RPA assay was first developed using the TwistAmp nfo kit, which was able to
detect only DNA template. Therefore, cDNA was synthesized from the 10-fold serial
dilutions of YFV RNA; then applied to the LFS-RPA assay. The successive amplification
was detected as an endpoint measurement either by lateral flow strip or gel
electrophoresis. The results of two-step LFS-RPA assay are represented in Fig. C-1. The
two-step LFS-RPA has successfully detected the 10-fold serial dilution of YFV RNA by
gel electrophoresis and LFS. Comparing Fig. C-1 I and II show that the detection of YFV
RNA by LFS was more sensitive than by gel electrophoresis. Endpoint detection by LFS
was able to detect YFV RNA down to a dilution of 1:106, while only down to a dilution of
1:104 of YFV RNA was detected by gel electrophoresis.
Figure C-1. Sensitivity of two-step lateral flow strip-RPA assay (LFS-RPA assay) for the
detection of the 10-fold serial dilution of Yellow Fever virus RNA. I) Sensitivity of LFS-RPA
assay as observed by 115 bp amplicon on 1.5 % gel by gel electrophoresis. II) Sensitivity
of LFS-RPA assay as observed by detection line on LFS. CT: control line, DT: detection
line.
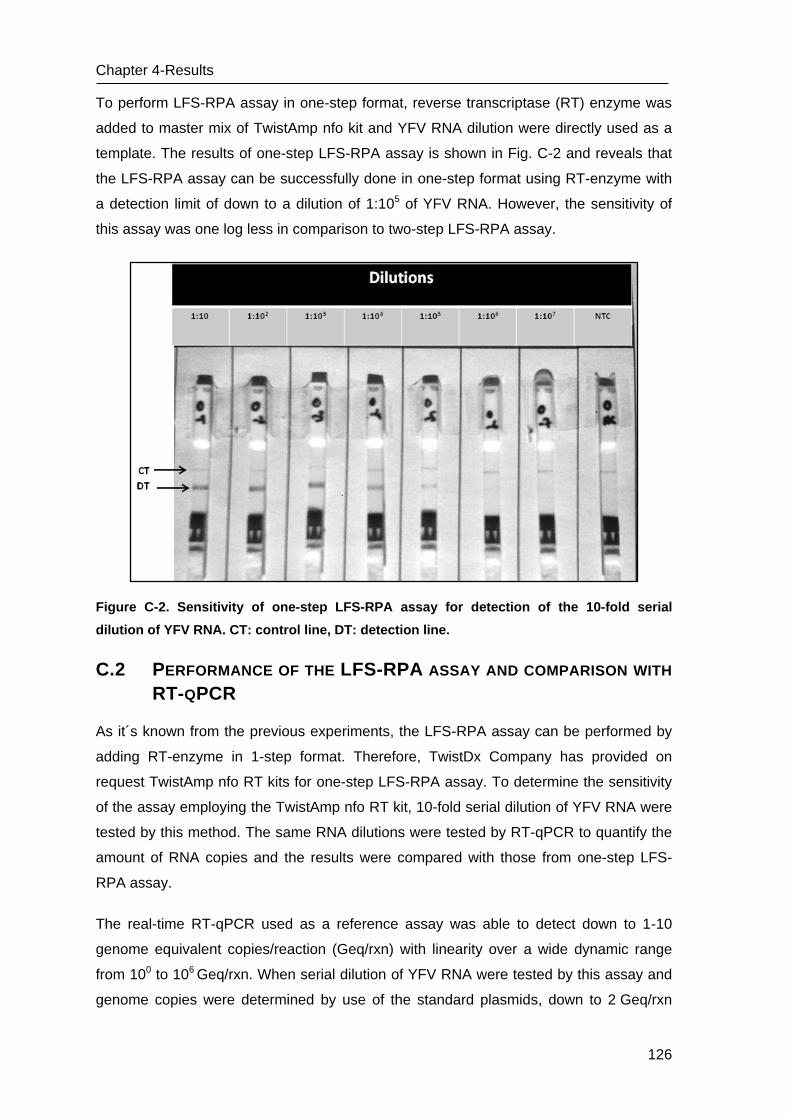
Chapter 4-Results
126
To perform LFS-RPA assay in one-step format, reverse transcriptase (RT) enzyme was
added to master mix of TwistAmp nfo kit and YFV RNA dilution were directly used as a
template. The results of one-step LFS-RPA assay is shown in Fig. C-2 and reveals that
the LFS-RPA assay can be successfully done in one-step format using RT-enzyme with
a detection limit of down to a dilution of 1:105 of YFV RNA. However, the sensitivity of
this assay was one log less in comparison to two-step LFS-RPA assay.
Figure C-2. Sensitivity of one-step LFS-RPA assay for detection of the 10-fold serial
dilution of YFV RNA. CT: control line, DT: detection line.
C.2 PERFORMANCE OF THE LFS-RPA ASSAY AND COMPARISON WITH
RT-QPCR
As it´s known from the previous experiments, the LFS-RPA assay can be performed by
adding RT-enzyme in 1-step format. Therefore, TwistDx Company has provided on
request TwistAmp nfo RT kits for one-step LFS-RPA assay. To determine the sensitivity
of the assay employing the TwistAmp nfo RT kit, 10-fold serial dilution of YFV RNA were
tested by this method. The same RNA dilutions were tested by RT-qPCR to quantify the
amount of RNA copies and the results were compared with those from one-step LFS-
RPA assay.
The real-time RT-qPCR used as a reference assay was able to detect down to 1-10
genome equivalent copies/reaction (Geq/rxn) with linearity over a wide dynamic range
from 100 to 106 Geq/rxn. When serial dilution of YFV RNA were tested by this assay and
genome copies were determined by use of the standard plasmids, down to 2 Geq/rxn
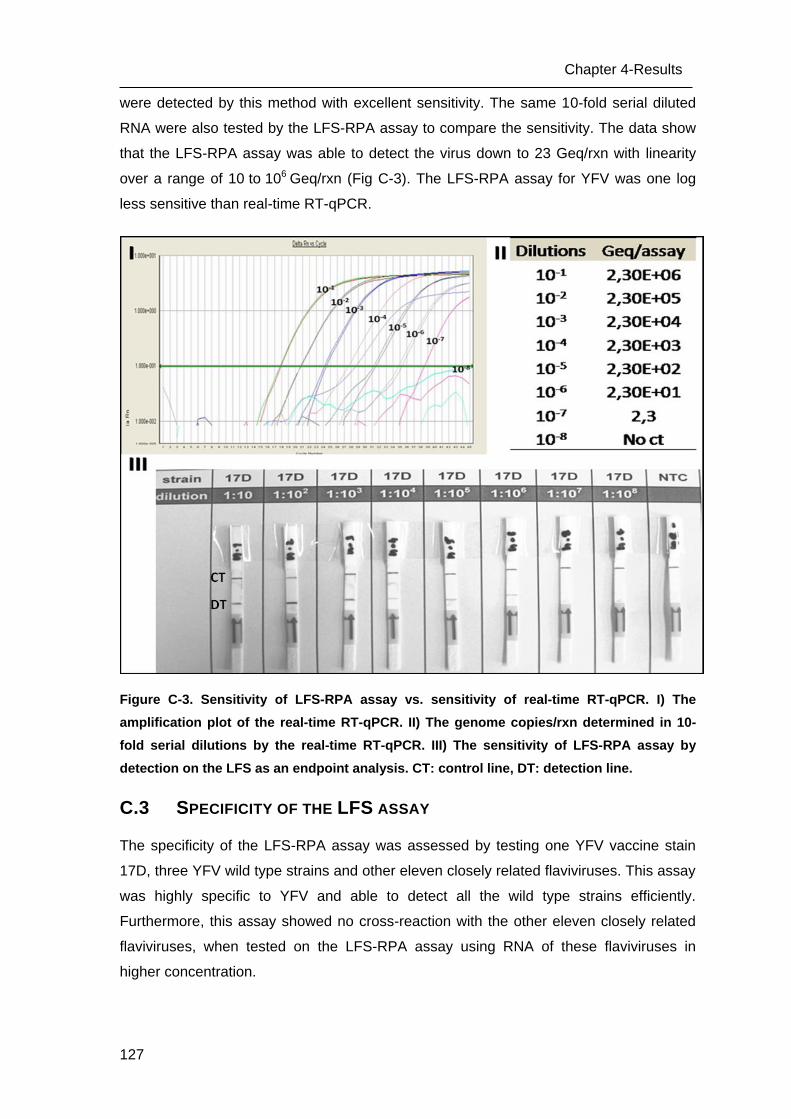
127
Chapter 4-Results
were detected by this method with excellent sensitivity. The same 10-fold serial diluted
RNA were also tested by the LFS-RPA assay to compare the sensitivity. The data show
that the LFS-RPA assay was able to detect the virus down to 23 Geq/rxn with linearity
over a range of 10 to 106 Geq/rxn (Fig C-3). The LFS-RPA assay for YFV was one log
less sensitive than real-time RT-qPCR.
Figure C-3. Sensitivity of LFS-RPA assay vs. sensitivity of real-time RT-qPCR. I) The
amplification plot of the real-time RT-qPCR. II) The genome copies/rxn determined in 10-
fold serial dilutions by the real-time RT-qPCR. III) The sensitivity of LFS-RPA assay by
detection on the LFS as an endpoint analysis. CT: control line, DT: detection line.
C.3 SPECIFICITY OF THE LFS ASSAY
The specificity of the LFS-RPA assay was assessed by testing one YFV vaccine stain
17D, three YFV wild type strains and other eleven closely related flaviviruses. This assay
was highly specific to YFV and able to detect all the wild type strains efficiently.
Furthermore, this assay showed no cross-reaction with the other eleven closely related
flaviviruses, when tested on the LFS-RPA assay using RNA of these flaviviruses in
higher concentration.
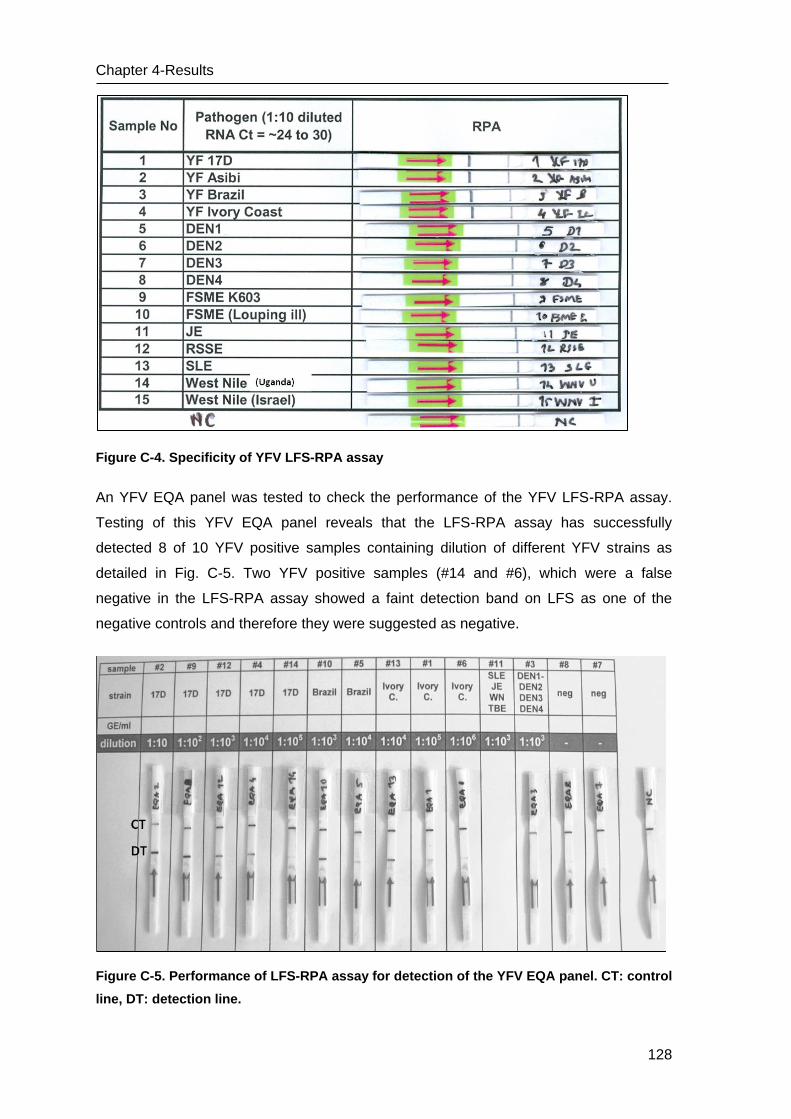
Chapter 4-Results
128
Figure C-4. Specificity of YFV LFS-RPA assay
An YFV EQA panel was tested to check the performance of the YFV LFS-RPA assay.
Testing of this YFV EQA panel reveals that the LFS-RPA assay has successfully
detected 8 of 10 YFV positive samples containing dilution of different YFV strains as
detailed in Fig. C-5. Two YFV positive samples (#14 and #6), which were a false
negative in the LFS-RPA assay showed a faint detection band on LFS as one of the
negative controls and therefore they were suggested as negative.
Figure C-5. Performance of LFS-RPA assay for detection of the YFV EQA panel. CT: control
line, DT: detection line.
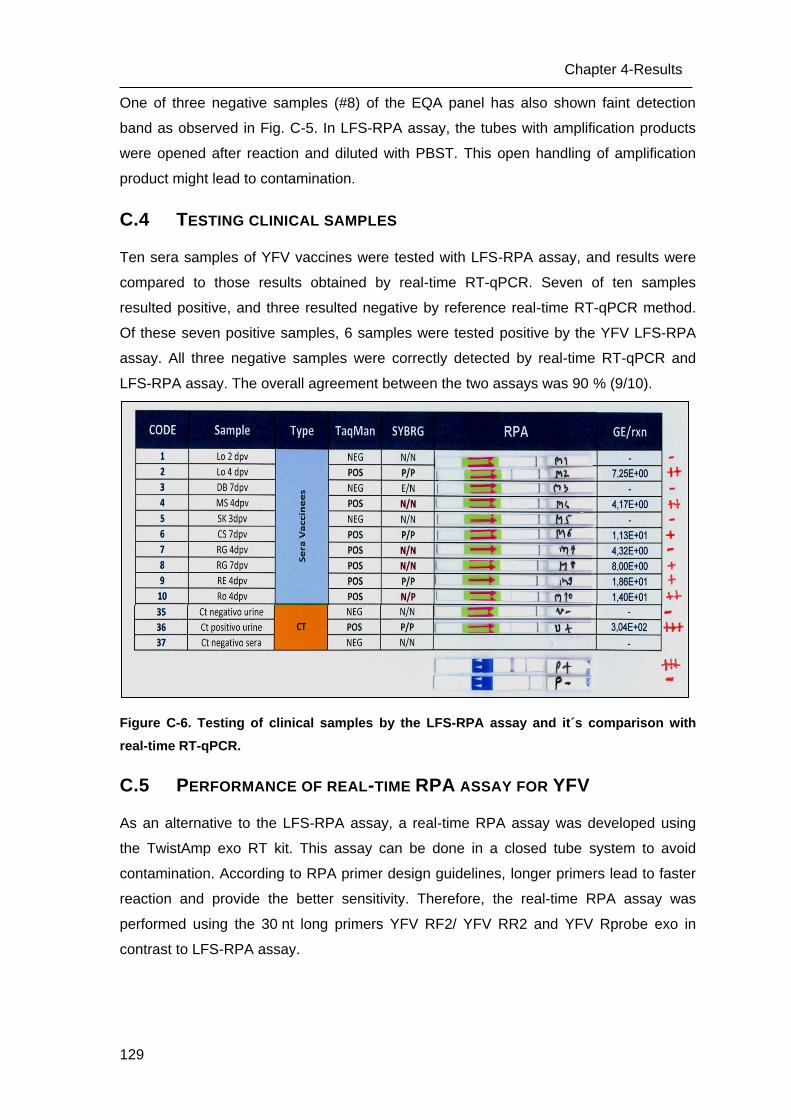
129
Chapter 4-Results
One of three negative samples (#8) of the EQA panel has also shown faint detection
band as observed in Fig. C-5. In LFS-RPA assay, the tubes with amplification products
were opened after reaction and diluted with PBST. This open handling of amplification
product might lead to contamination.
C.4 TESTING CLINICAL SAMPLES
Ten sera samples of YFV vaccines were tested with LFS-RPA assay, and results were
compared to those results obtained by real-time RT-qPCR. Seven of ten samples
resulted positive, and three resulted negative by reference real-time RT-qPCR method.
Of these seven positive samples, 6 samples were tested positive by the YFV LFS-RPA
assay. All three negative samples were correctly detected by real-time RT-qPCR and
LFS-RPA assay. The overall agreement between the two assays was 90 % (9/10).
Figure C-6. Testing of clinical samples by the LFS-RPA assay and it´s comparison with
real-time RT-qPCR.
C.5 PERFORMANCE OF REAL-TIME RPA ASSAY FOR YFV
As an alternative to the LFS-RPA assay, a real-time RPA assay was developed using
the TwistAmp exo RT kit. This assay can be done in a closed tube system to avoid
contamination. According to RPA primer design guidelines, longer primers lead to faster
reaction and provide the better sensitivity. Therefore, the real-time RPA assay was
performed using the 30 nt long primers YFV RF2/ YFV RR2 and YFV Rprobe exo in
contrast to LFS-RPA assay.
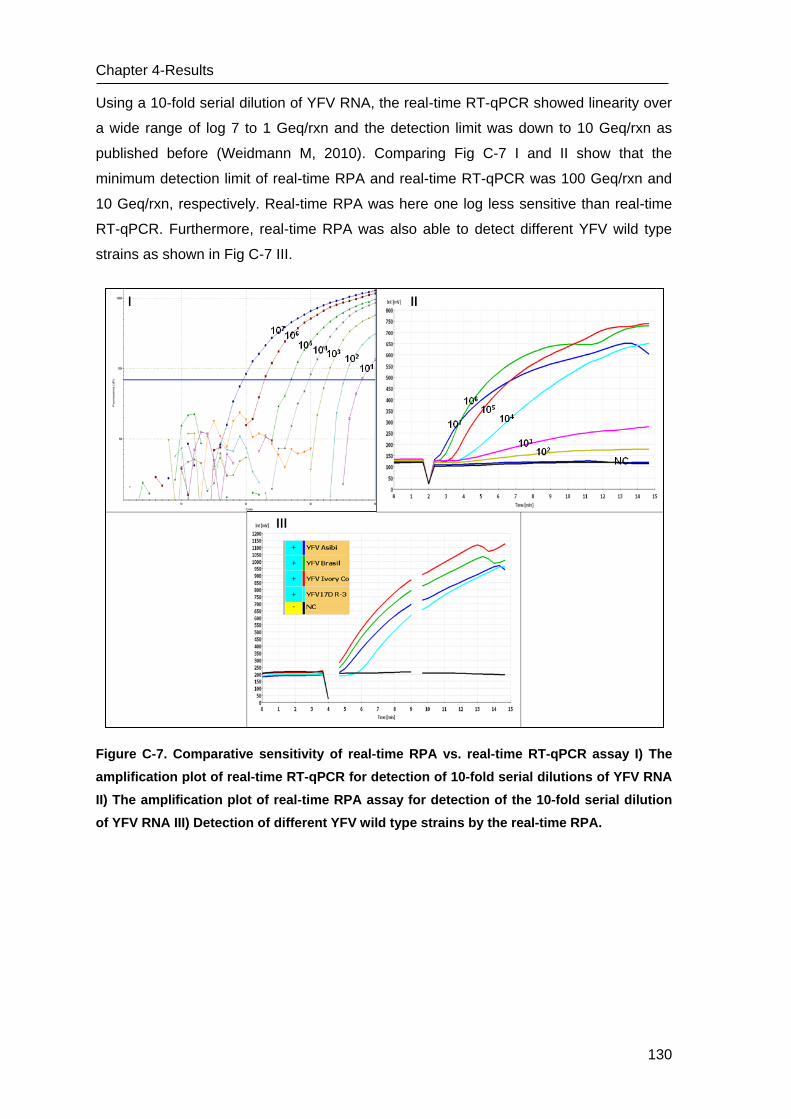
Chapter 4-Results
130
Using a 10-fold serial dilution of YFV RNA, the real-time RT-qPCR showed linearity over
a wide range of log 7 to 1 Geq/rxn and the detection limit was down to 10 Geq/rxn as
published before (Weidmann M, 2010). Comparing Fig C-7 I and II show that the
minimum detection limit of real-time RPA and real-time RT-qPCR was 100 Geq/rxn and
10 Geq/rxn, respectively. Real-time RPA was here one log less sensitive than real-time
RT-qPCR. Furthermore, real-time RPA was also able to detect different YFV wild type
strains as shown in Fig C-7 III.
Figure C-7. Comparative sensitivity of real-time RPA vs. real-time RT-qPCR assay I) The
amplification plot of real-time RT-qPCR for detection of 10-fold serial dilutions of YFV RNA
II) The amplification plot of real-time RPA assay for detection of the 10-fold serial dilution
of YFV RNA III) Detection of different YFV wild type strains by the real-time RPA.
131
Chapter 4-Discussion
D DISCUSSION
Yellow fever remains a medically neglected disease and spreads continuously around
Africa and South America (Monath 1997, Barnett 2006). Despite preventive WHO
vaccination campaigns in African countries, there is still a high risk of YF in endemic
areas. The main reason for this is low vaccination coverage. Therefore, reporting of YFV
cases in endemic areas is very important to take appropriate emergency vaccination
measures. On the other hand, it is also important to monitor SAEs during mass
vaccination campaigns to differentiate them from real infections. If SAEs caused by the
YF vaccine is false-positive diagnosed, it may lead to wrong concerns about safety of YF
vaccine. For all these reasons, there is a need for specific and sensitive detection
methods of Yellow fever virus, which can be applied in low-resource settings or in field
conditions.
In the last decade, many molecular assays based on RT-PCR have been developed for
the detection of YFV in the acute phase of infection as summarized previously (Sekaran
and Artsob 2007; Domingo and Niedrig 2009). Now these molecular assays are widely
considered as a diagnostic tool due to high specificity and sensitivity in contrast to other
methods. While PCR based methods require extensive thermal cycling and expensive
equipment, other nucleic acid amplification methods like isothermal amplification need
single constant temperature and therefore it can be performed using the simple
equipment like a water bath or a heating block. Several isothermal techniques like SDA,
NASBA, LAMP, RCA, HDA, RPA and many others have been developed as an
alternative to PCR as summarized previously (Gill and Ghaemi 2008; Kim and Easley
2011; Niemz, Ferguson et al. 2011).
Isothermal amplification methods like SDA, LAMP, RCA, TMA and NASBA are based on
strand displacement and utilize DNA or RNA polymerase lacking of 5′-3′ exonuclease
activity. Furthermore, the reaction schemes are more complicated in isothermal
techniques than in PCR. All these factors limit the use of the exonuclease Taqman probe
in the isothermal amplification techniques excepting HDA. In HDA reaction, the
exonuclease Taqman probe was successfully utilized as in PCR based methods (Tong,
Tang et al. 2008). Nevertheless, some isothermal amplification methods have used a
variety of alternative probe-based detection methods such as molecular beacons with
NASBA (Leone, van Schijndel et al. 1998), fluorescence transfer probes with SDA (Little,
Andrews et al. 1999) and restriction probe with RPA (Piepenburg, Williams et al. 2006).
However, these formats of isothermal amplification require the same fluorescence
Chapter 4-Discussion
132
detector as real-time PCR. In contrast to fluorescence detection, lateral flow strip (LFS)
as an endpoint analysis offers an economical alternative for isothermal amplification
methods.
RPA amplifies DNA from DNA/RNA template at a constant temperature in the range of
25°C to 42°C and offers the different detection formats by use of the restriction probes
like endpoint analysis by gel electrophoresis or LFS and real-time monitoring. All RPA
reagents are commercially available as dried reagents, which can be stored at ambient
conditions. Furthermore, RPA allows sensitive and specific detection within 15 min. Due
to all these advantages; RPA was chosen for developing a diagnostic platform for low-
resource settings.
In this study, LFS-RPA assay for rapid detection of YFV was developed. This assay can
be easily adapted to different laboratories. Two different real-time RT-qPCR assays have
been established targeting a conserved 5´-non coding region (NCR) of the YFV genome.
Both of real-time RT-qPCR assays were able to detect down to 10 Geq/rxn of YFV. In
this study, primers and probe for the LFS-RPA assay were designed in the same
conserved 5´-NCR of the YFV genome. The developed LFS-RPA assay using these
primers and probe has detected all the different YFV strains and showed no cross-
reactivity to other closely related flaviviruses (Fig. C-4 and C-5). This LFS-RPA assay
showed a detection limit down to 23 copies of YFV genome comparisons with real-time
RT-qPCR (Fig. C-3). In wild type yellow fever infection and SAEs, higher viremia level up
to 8 log 10 PFU/ml is reported. Whereas low viremia was reported in YFV vaccinees and
does not exceed 2.3 log 10 PFU/ml or 2.23 log 10 Geq/ml (Barrett and Teuwen 2009;
Domingo and Niedrig 2009; Domingo, Yactayo et al. 2011). As 10 serum samples of
vaccinees have been tested by established real-time RT-qPCR, seven YFV samples
were detected positive and viral load was at the same level as described in literature.
The LFS-RPA assay for YFV has detected six out of seven YFV positive samples. All
these results support that the sensitivity of developed LFS-RPA assay is in the
acceptable range for diagnostic of YFV not only in wild type infection, but also in the sera
of vaccines.
Besides the analytical performance, the RPA amplifies target RNA/DNA within 15-
20 min. Therefore, the speed of RPA reaction is five times higher than real-time RT-
qPCR. As the LFS-RPA assay only needs a heating block or water bath, it can be easily
performed in low-resource setting laboratories without the need of expensive
instruments. Furthermore, the use of the lateral flow strip as a final readout for results
eliminates need of complex analytical systems including computer. Because of all these
133
Chapter 4-Discussion
advantages, RPA is perfectly suitable for low-resource settings, in field conditions and
point-of-need diagnostic settings.
LFS-RPA assay allows simple, rapid, sensitive, and qualitative detection of YFV, but
open handling of RPA amplification products has led to the contamination. Therfore, the
rules for the diagnostic settings have to be followed strictly for working with the LFS-RPA
assay. As an alternative to LFS-RPA, a real-time RPA assay was developed by
modifying the primer and probe from LFS-RPA assay for the RPA exo system. The major
benefit of real-time RPA assay is that the whole reaction can be performed by using the
TwistAmp exo system in a closed system to avoid contamination problems. According to
TwistDx manual guidelines, the amplification product of real-time RPA is also completely
digested, once the reaction is accomplished. This could also help to eliminate
contamination problems, while working with molecular diagnostic methods.
Nevertheless, a portable tubescanner device is needed in order to perform real-time
RPA reaction. The testing of real-time RPA assay for YFV showed that this assay
detected all different strains of YFV. The detection limit of the real-time RPA assay was
100 Geq/rxn, when compared to the real-time RT-qPCR. The real-time RPA was one log
less sensitive than real-time RT-qPCR, but the sensitivity of real-time RPA can be
optimized further by changing reaction parameters. The results suggest that the real-time
RPA assay can be also used for low-resource; in-field and point-of-care settings as LFS-
RPA assay and eliminates on the other hand need of lateral flow strips. However, the
need portable power supply and computer for the tubescanner device makes it a little
instrument dependent.
In summary, isothermal nucleic acid detection methods were successfully developed
employing the LFS-RPA assay or real-time RPA assay. Both of these assays can be
easily applied in low-resource settings as an alternative to traditional laboratory based
molecular diagnostic assays. According to need and scenario, one of these RPA assays
can be used for rapid detection of YFV. The results suggest that the RPA has a great
potential to develop a simple point-of-care diagnostic platform. In future, these methods
and their functionality have to be tested under real conditions in Africa during mass
vaccination campaigns.

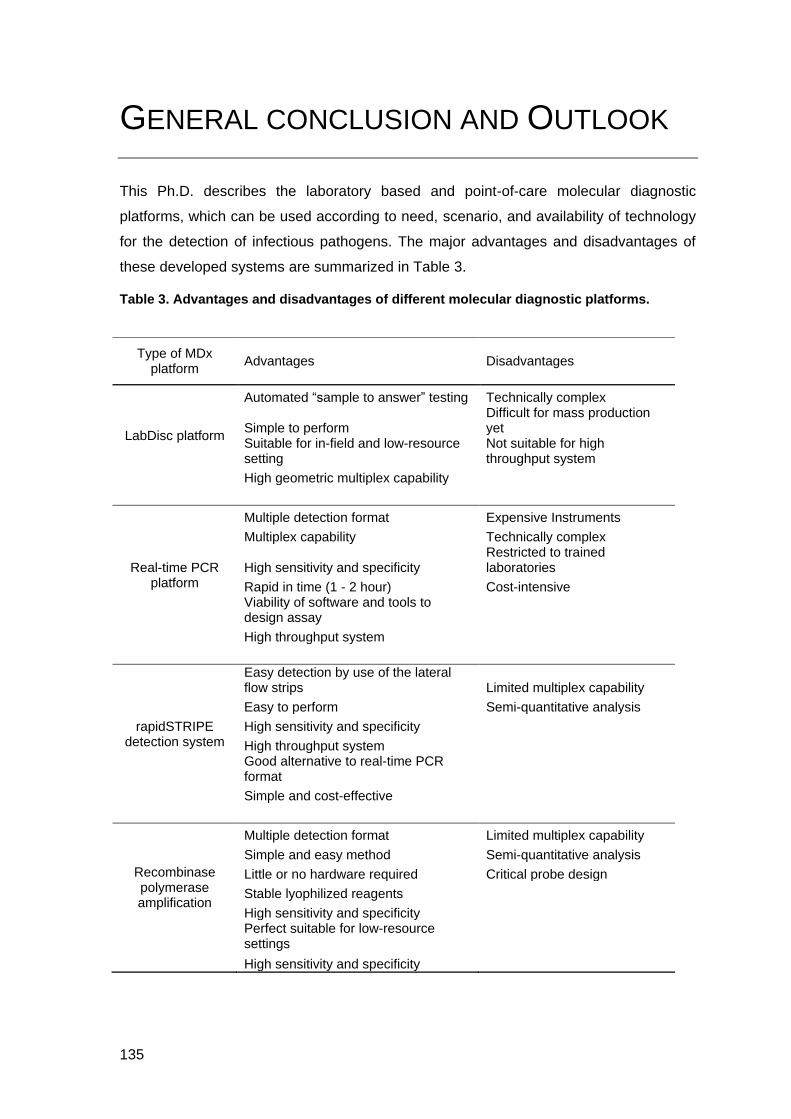
135
GENERAL CONCLUSION AND OUTLOOK
This Ph.D. describes the laboratory based and point-of-care molecular diagnostic
platforms, which can be used according to need, scenario, and availability of technology
for the detection of infectious pathogens. The major advantages and disadvantages of
these developed systems are summarized in Table 3.
Table 3. Advantages and disadvantages of different molecular diagnostic platforms.
Type of MDx platform
Advantages Disadvantages
LabDisc platform
Automated “sample to answer” testing Technically complex
Simple to perform Difficult for mass production yet
Suitable for in-field and low-resource setting
Not suitable for high throughput system
High geometric multiplex capability
Real-time PCR platform
Multiple detection format Expensive Instruments
Multiplex capability Technically complex
High sensitivity and specificity Restricted to trained laboratories
Rapid in time (1 - 2 hour) Cost-intensive Viability of software and tools to design assay
High throughput system
rapidSTRIPE detection system
Easy detection by use of the lateral flow strips Limited multiplex capability
Easy to perform Semi-quantitative analysis
High sensitivity and specificity High throughput system Good alternative to real-time PCR
format Simple and cost-effective
Recombinase polymerase amplification
Multiple detection format Limited multiplex capability
Simple and easy method Semi-quantitative analysis
Little or no hardware required Critical probe design
Stable lyophilized reagents High sensitivity and specificity Perfect suitable for low-resource
settings High sensitivity and specificity
General conclusion and Outlook
136
In the first chapter, the developed/established methods and the microfluidic platform
provide a valuable insight about an integrated MDx platform and offer great solutions to
overcome problems of NAT platforms regarding automation, reagent storage, sample
preparation, multiplex detection, sensitivity, cost, and portability. The described LabDisc
platform is one of few successful “sample to answer” platforms for the rapid detection of
infectious pathogens. Many advantages such as fully automated testing, rapid in timely,
low reagent consumption, minimal handling and need of disposables makes the LabDisc
platform a potential “sample to answer” platform for rapid nucleic acid testing in the field
of medical, biodefense and research. In future, further developments in reagent storage,
mass production, and cost-effective manufacturing of such a LabDisc system will fulfill
the demand of existing and emerging health care needs.
The second chapter describes a novel real-time PCR method utilizing LNA-probes for
the detection of important re-emerging flaviviruses to complement reference methods.
This method would be an useful tool for the detection of many flaviviruses
simultaneously in livestock samples, and would aid in the molecular diagnosis and
surveillance studies of various vectors and non-human hosts. In future, this method can
be used to monitor the activity of flaviviruses in endemic regions providing important data
for the surveillance studies.
In the third chapter, the RapidSTRIPE H1N1 test based on nucleic acid lateral flow assay
was developed for diagnosis of a swine-origin influenza A (H1N1) virus during the H1N1
2009 pandemic. This test is simple and cost-effective and allows the specific detection of
the S-OIV A (H1N1) from a swab sampling to the final detection within 2-3 hours. This
method was successfully used as an alternative to classical real-time PCR methods, and
has proven its functionality as a cost-effective, simple, and high-throughput system.
The final chapter describes reliable, sensitive, and specific diagnostic methods
utilizing an isothermal amplification and a minimal instrument setup. These methods
will provide a useful alternative to current MDx technologies at an affordable level
and allow molecular diagnostics in low-resource and field settings. This type of
decentralized routine diagnostics would also improve monitoring of YFV outbreaks,
local disease surveillance, and response to epidemics in YFV endemic region of the
world.
137
REFERENCES
Achazi, K., A. Nitsche, et al. (2011). "Detection and differentiation of tick-borne encephalitis virus subtypes by a reverse transcription quantitative real-time PCR and pyrosequencing." J Virol Methods 171(1): 34-39.
Adlhoch, C., M. Kaiser, et al. (2011). "Highly sensitive detection of the group A Rotavirus using Apolipoprotein H-coated ELISA plates compared to quantitative real-time PCR." Virol J 8: 63.
Al-Soud, W. A. and P. Radstrom (2001). "Purification and characterization of PCR-inhibitory components in blood cells." J Clin Microbiol 39(2): 485-493.
Arkhis, A., A. Elaissari, et al. (2010). "Capture of enveloped viruses using polymer tentacles containing magnetic latex particles." J Biomed Nanotechnol 6(1): 28-36.
Bakonyi, T., Z. Hubalek, et al. (2005). "Novel flavivirus or new lineage of West Nile virus, central Europe." Emerg Infect Dis 11(2): 225-231.
Bakonyi, T., E. Ivanics, et al. (2006). "Lineage 1 and 2 strains of encephalitic West Nile virus, central Europe." Emerg Infect Dis 12(4): 618-623.
Barrett, A. D. and D. E. Teuwen (2009). "Yellow fever vaccine - how does it work and why do rare cases of serious adverse events take place?" Curr Opin Immunol 21(3): 308-313.
Bhattacharya, S., S. Salamat, et al. (2008). "PCR-based detection in a micro-fabricated platform." Lab Chip 8(7): 1130-1136.
Blazkova M, Koets M, et al. (2009). "Development of a nucleic acid lateral flow immunoassay for simultaneous detection of Listeria spp. and Listeria monocytogenes in food." European Food Research and Technology 229(2009): 867-874.
Cao, B., X. W. Li, et al. (2009). "Clinical features of the initial cases of 2009 pandemic influenza A (H1N1) virus infection in China." N Engl J Med 361(26): 2507-2517.
Carr, M. J., R. Gunson, et al. (2009). "Development of a real-time RT-PCR for the detection of swine-lineage influenza A (H1N1) virus infections." J Clin Virol 45(3): 196-199.
CDC. (Factsheet Bioterrorism Agents). "Bioterrorism Agents/Diseases by category." from http://www.bt.cdc.gov/agent/agentlist-category.asp.
CDC (JEV factsheet). Centers for Disease Control and Prevention: Japanese Encephalitis Fact Sheet.
References
138
Chambers, T. J., C. S. Hahn, et al. (1990). "Flavivirus genome organization, expression, and replication." Annu Rev Microbiol 44: 649-688.
Chien, L. J., T. L. Liao, et al. (2006). "Development of real-time reverse transcriptase PCR assays to detect and serotype dengue viruses." J Clin Microbiol 44(4): 1295-1304.
Chow, W. H., C. McCloskey, et al. (2008). "Application of isothermal helicase-dependent amplification with a disposable detection device in a simple sensitive stool test for toxigenic Clostridium difficile." J Mol Diagn 10(5): 452-458.
Cirino, N. M., K. A. Musser, et al. (2004). "Multiplex diagnostic platforms for detection of biothreat agents." Expert Rev Mol Diagn 4(6): 841-857.
Dawood, F. S., S. Jain, et al. (2009). "Emergence of a novel swine-origin influenza A (H1N1) virus in humans." N Engl J Med 360(25): 2605-2615.
Demir Akin, H. L., and Rashid Bashir (2004). "Real-Time Virus Trapping and Fluorescent Imaging in Microfluidic Devices." Nano Letters, American Chemical Society(4 (2), pp 257–259).
Dineva, M. A., L. MahiLum-Tapay, et al. (2007). "Sample preparation: a challenge in the development of point-of-care nucleic acid-based assays for resource-limited settings." Analyst 132(12): 1193-1199.
Domingo, C. and M. Niedrig (2009). "Safety of 17D derived yellow fever vaccines." Expert Opin Drug Saf 8(2): 211-221.
Domingo, C., M. Niedrig, et al. (2010). "2nd International external quality control assessment for the molecular diagnosis of dengue infections." PLoS Negl Trop Dis 4(10).
Domingo, C., P. Patel, et al. (2011). "Molecular diagnosis of flaviviruses." Future Virology 6(9): 1059-1074.
Domingo, C., S. Yactayo, et al. (2011). "Detection of yellow fever 17D genome in urine." J Clin Microbiol 49(2): 760-762.
Dong, H., Y. Zhang, et al. (2009). "Detection of human novel influenza A (H1N1) viruses using multi-fluorescent real-time RT-PCR." Virus Res 147(1): 85-90.
Dovc-Drnovsek, T., B. Emersic, et al. (2008). "Optimization of purification of human cell-free mRNA from plasma." Ann N Y Acad Sci 1137: 125-129.
Drosten, C., M. Panning, et al. (2002). "False-negative results of PCR assay with plasma of patients with severe viral hemorrhagic fever." J Clin Microbiol 40(11): 4394-4395.
ECDC. (Factsheet for health professionals 2010). "Factsheet for health professionals." from
139
0-Discussion
http://ecdc.europa.eu/en/healthtopics/tick_borne_diseases/tick_borne_encephalitis/basic_facts/Pages/factsheet_health_professionals.aspx.
Ellerbrok, H., H. Nattermann, et al. (2002). "Rapid and sensitive identification of pathogenic and apathogenic Bacillus anthracis by real-time PCR." FEMS Microbiol Lett 214(1): 51-59.
Ellis, J., M. Iturriza, et al. (2009). "Evaluation of four real-time PCR assays for detection of influenza A(H1N1)v viruses." Euro Surveill 14(22).
Euler, M., Y. Wang, et al. (2012). "Recombinase polymerase amplification assay for rapid detection of Rift Valley fever virus." J Clin Virol.
Euler, M., Y. Wang, et al. (2012). "Recombinase Polymerase Amplification Assay for Rapid Detection of Francisella tularensis." J Clin Microbiol 50(7): 2234-2238.
Fauci, A. S. (2001). "Infectious diseases: considerations for the 21st century." Clin Infect Dis 32(5): 675-685.
Fauci, A. S. (2006). "Emerging and re-emerging infectious diseases: influenza as a prototype of the host-pathogen balancing act." Cell 124(4): 665-670.
Feldmann, H., M. Czub, et al. (2002). "Emerging and re-emerging infectious diseases." Med Microbiol Immunol 191(2): 63-74.
Focke, M., F. Stumpf, et al. (2010). "Microstructuring of polymer films for sensitive genotyping by real-time PCR on a centrifugal microfluidic platform." Lab Chip 10(19): 2519-2526.
Focke, M., F. Stumpf, et al. (2010). "Centrifugal microfluidic system for primary amplification and secondary real-time PCR." Lab Chip 10(23): 3210-3212.
Fraser, C., C. A. Donnelly, et al. (2009). "Pandemic potential of a strain of influenza A (H1N1): early findings." Science 324(5934): 1557-1561.
Frieden, M., H. F. Hansen, et al. (2003). "Nuclease stability of LNA oligonucleotides and LNA-DNA chimeras." Nucleosides Nucleotides Nucleic Acids 22(5-8): 1041-1043.
Ganzenmueller, T., J. Kluba, et al. (2010). "Comparison of the performance of direct fluorescent antibody staining, a point-of-care rapid antigen test and virus isolation with that of RT-PCR for the detection of novel 2009 influenza A (H1N1) virus in respiratory specimens." J Med Microbiol 59(Pt 6): 713-717.
Ge, Y., L. Cui, et al. (2009). "Detection of novel swine origin influenza A virus (H1N1) by real-time nucleic acid sequence-based amplification." J Virol Methods 163(2): 495-497.
Gill, P. and A. Ghaemi (2008). "Nucleic acid isothermal amplification technologies: a review." Nucleosides Nucleotides Nucleic Acids 27(3): 224-243.
References
140
Gobbers, E., T. A. Oosterlaken, et al. (2001). "Efficient extraction of virus DNA by NucliSens Extractor allows sensitive detection of hepatitis B virus by PCR." J Clin Microbiol 39(12): 4339-4343.
Goldenberg, O., O. Landt, et al. (2005). "Use of locked nucleic acid oligonucleotides as hybridization/FRET probes for quantification of 16S rDNA by real-time PCR." Biotechniques 38(1): 29-30, 32.
Gorkin, R., J. Park, et al. (2010). "Centrifugal microfluidics for biomedical applications." Lab Chip 10(14): 1758-1773.
Gulliksen, A., H. Keegan, et al. (2012). "Towards a "Sample-In, Answer-Out" Point-of-Care Platform for Nucleic Acid Extraction and Amplification: Using an HPV E6/E7 mRNA Model System." J Oncol 2012: 905024.
HEALTH, N. Y. S. D. O. (2011). "CLINICAL SPECIMENS COLLECTION AND PACKAGING FOR SELECT AGENT TESTING."
Heinz, F. X. and S. L. Allison (2000). "Structures and mechanisms in flavivirus fusion." Adv Virus Res 55: 231-269.
Herzum, I., T. Lutz, et al. (2010). "Diagnostic performance of rapid influenza antigen assays in patients infected with the new influenza A (H1N1) virus." Clin Chem Lab Med 48(1): 53-56.
Holland, P. M., R. D. Abramson, et al. (1991). "Detection of specific polymerase chain reaction product by utilizing the 5'----3' exonuclease activity of Thermus aquaticus DNA polymerase." Proc Natl Acad Sci U S A 88(16): 7276-7280.
Hunsperger, E. A., S. Yoksan, et al. (2009). "Evaluation of commercially available anti-dengue virus immunoglobulin M tests." Emerg Infect Dis 15(3): 436-440.
Iwata, A., K. Satoh, et al. (2003). "Virus concentration using sulfonated magnetic beads to improve sensitivity in nucleic acid amplification tests." Biol Pharm Bull 26(8): 1065-1069.
Jernigan, J. A., D. S. Stephens, et al. (2003). "Industry-related outbreak of human anthrax." Emerg Infect Dis 9(12): 1657; author reply 1657-1658; discussion 1658-1659.
Johnson, M. P., L. M. Haupt, et al. (2004). "Locked nucleic acid (LNA) single nucleotide polymorphism (SNP) genotype analysis and validation using real-time PCR." Nucleic Acids Res 32(6): e55.
Johnson, N., P. R. Wakeley, et al. (2010). "Assessment of a novel real-time pan-flavivirus RT-polymerase chain reaction." Vector Borne Zoonotic Dis 10(7): 665-671.
141
0-Discussion
Kaneko, H., T. Kawana, et al. (2007). "Tolerance of loop-mediated isothermal amplification to a culture medium and biological substances." J Biochem Biophys Methods 70(3): 499-501.
Karre, T., H. F. Maguire, et al. (2010). "Comparison of Becton Dickinson Directigen EZ Flu A+B test against the CDC real-time PCR assay for detection of 2009 pandemic influenza A/H1N1 virus." J Clin Microbiol 48(1): 343-344.
Kim, J. and C. J. Easley (2011). "Isothermal DNA amplification in bioanalysis: strategies and applications." Bioanalysis 3(2): 227-239.
Kramski, M., A. Drozd, et al. (2011). "Rapid detection of anti-Vaccinia virus neutralizing antibodies." Virol J 8: 139.
Kutyavin, I. V., I. A. Afonina, et al. (2000). "3'-minor groove binder-DNA probes increase sequence specificity at PCR extension temperatures." Nucleic Acids Res 28(2): 655-661.
Lanciotti, R. S. (2003). "Molecular amplification assays for the detection of flaviviruses." Adv Virus Res 61: 67-99.
Leone, G., H. van Schijndel, et al. (1998). "Molecular beacon probes combined with amplification by NASBA enable homogeneous, real-time detection of RNA." Nucleic Acids Res 26(9): 2150-2155.
Letertre, C., S. Perelle, et al. (2003). "Evaluation of the performance of LNA and MGB probes in 5'-nuclease PCR assays." Mol Cell Probes 17(6): 307-311.
Lim, D. V., J. M. Simpson, et al. (2005). "Current and developing technologies for monitoring agents of bioterrorism and biowarfare." Clin Microbiol Rev 18(4): 583-607.
Linke, S., H. Ellerbrok, et al. (2007). "Detection of West Nile virus lineages 1 and 2 by real-time PCR." J Virol Methods 146(1-2): 355-358.
Little, M. C., J. Andrews, et al. (1999). "Strand displacement amplification and homogeneous real-time detection incorporated in a second-generation DNA probe system, BDProbeTecET." Clin Chem 45(6 Pt 1): 777-784.
Louie, J. K., M. Acosta, et al. (2009). "Factors associated with death or hospitalization due to pandemic 2009 influenza A(H1N1) infection in California." JAMA 302(17): 1896-1902.
Lui, C., N. C. Cady, et al. (2009). "Nucleic Acid-based Detection of Bacterial Pathogens Using Integrated Microfluidic Platform Systems." Sensors (Basel) 9(5): 3713-3744.
Lutz, S., P. Weber, et al. (2010). "Microfluidic lab-on-a-foil for nucleic acid analysis based on isothermal recombinase polymerase amplification (RPA)." Lab Chip 10(7): 887-893.
References
142
Mackenzie, J. S., D. J. Gubler, et al. (2004). "Emerging flaviviruses: the spread and resurgence of Japanese encephalitis, West Nile and dengue viruses." Nat Med 10(12 Suppl): S98-109.
Mangasser-Stephan, K., C. Tag, et al. (1999). "Rapid genotyping of hemochromatosis gene mutations on the LightCycler with fluorescent hybridization probes." Clin Chem 45(10): 1875-1878.
Mark, D., S. Haeberle, et al. (2010). "Microfluidic lab-on-a-chip platforms: requirements, characteristics and applications." Chem Soc Rev 39(3): 1153-1182.
Mens, P. F., A. van Amerongen, et al. (2008). "Molecular diagnosis of malaria in the field: development of a novel 1-step nucleic acid lateral flow immunoassay for the detection of all 4 human Plasmodium spp. and its evaluation in Mbita, Kenya." Diagn Microbiol Infect Dis 61(4): 421-427.
Monath, T. P., F. Guirakhoo, et al. (2003). "Chimeric live, attenuated vaccine against Japanese encephalitis (ChimeriVax-JE): phase 2 clinical trials for safety and immunogenicity, effect of vaccine dose and schedule, and memory response to challenge with inactivated Japanese encephalitis antigen." J Infect Dis 188(8): 1213-1230.
Morens, D. M., G. K. Folkers, et al. (2004). "The challenge of emerging and re-emerging infectious diseases." Nature 430(6996): 242-249.
Mori, Y. and T. Notomi (2009). "Loop-mediated isothermal amplification (LAMP): a rapid, accurate, and cost-effective diagnostic method for infectious diseases." J Infect Chemother 15(2): 62-69.
Niemz, A., T. M. Ferguson, et al. (2011). "Point-of-care nucleic acid testing for infectious diseases." Trends Biotechnol 29(5): 240-250.
Olano, J. P. and D. H. Walker (2011). "Diagnosing emerging and reemerging infectious diseases: the pivotal role of the pathologist." Arch Pathol Lab Med 135(1): 83-91.
Panning, M., M. Eickmann, et al. (2009). "Detection of influenza A(H1N1)v virus by real-time RT-PCR." Euro Surveill 14(36).
Papa, A., K. Danis, et al. (2010). "Ongoing outbreak of West Nile virus infections in humans in Greece, July-August 2010." Euro Surveill 15(34).
Perez-Ruiz, M., J. M. Navarro-Mari, et al. (2010). "Development and preliminary evaluation of a rapid oligochromatographic assay for specific detection of new human influenza A H1N1 virus." J Clin Microbiol 48(5): 1801-1805.
Piepenburg, O., C. H. Williams, et al. (2006). "DNA detection using recombination proteins." PLoS Biol 4(7): e204.
143
0-Discussion
Podszun, S., P. Vulto, et al. (2012). "Enrichment of viable bacteria in a micro-volume by free-flow electrophoresis." Lab Chip 12(3): 451-457.
Ponchel, F., C. Toomes, et al. (2003). "Real-time PCR based on SYBR-Green I fluorescence: an alternative to the TaqMan assay for a relative quantification of gene rearrangements, gene amplifications and micro gene deletions." BMC Biotechnol 3: 18.
Poon, L. L., K. H. Chan, et al. (2009). "Molecular detection of a novel human influenza (H1N1) of pandemic potential by conventional and real-time quantitative RT-PCR assays." Clin Chem 55(8): 1555-1558.
Porterfield, J. S. (1980). "[Arboviruses - structure and classification (author's transl)]." Med Trop (Mars) 40(5): 493-498.
Posthuma-Trumpie, G. A., J. Korf, et al. (2009). "Lateral flow (immuno)assay: its strengths, weaknesses, opportunities and threats. A literature survey." Anal Bioanal Chem 393(2): 569-582.
Puchberger-Enengl, D., S. Podszun, et al. (2011). "Microfluidic concentration of bacteria by on-chip electrophoresis." Biomicrofluidics 5(4): 44111-4411110.
Ratcliff, R. M., G. Chang, et al. (2007). "Molecular diagnosis of medical viruses." Curr Issues Mol Biol 9(2): 87-102.
Satoh, K., A. Iwata, et al. (2003). "Virus concentration using polyethyleneimine-conjugated magnetic beads for improving the sensitivity of nucleic acid amplification tests." J Virol Methods 114(1): 11-19.
Scaramozzino, N., J. M. Crance, et al. (2001). "Comparison of flavivirus universal primer pairs and development of a rapid, highly sensitive heminested reverse transcription-PCR assay for detection of flaviviruses targeted to a conserved region of the NS5 gene sequences." J Clin Microbiol 39(5): 1922-1927.
Schulze, M., A. Nitsche, et al. (2010). "Diagnostic approach for the differentiation of the pandemic influenza A(H1N1)v virus from recent human influenza viruses by real-time PCR." PLoS One 5(4): e9966.
Sekaran, S. D. and H. Artsob (2007). "Molecular diagnostics for the detection of human flavivirus infections." Expert Opinion on Medical Diagnostics 1(4): 521-530.
Siegrist, J., M. Amasia, et al. (2010). "Numerical modeling and experimental validation of uniform microchamber filling in centrifugal microfluidics." Lab Chip 10(7): 876-886.
Staples, J. E., M. Gershman, et al. (2010). "Yellow fever vaccine: recommendations of the Advisory Committee on Immunization Practices (ACIP)." MMWR Recomm Rep 59(RR-7): 1-27.
References
144
Stock, N. K., N. Boschetti, et al. (2012). "The phylogeny of yellow fever virus 17D vaccines." Vaccine 30(6): 989-994.
Tan, S. C. and B. C. Yiap (2009). "DNA, RNA, and protein extraction: the past and the present." J Biomed Biotechnol 2009: 574398.
Tong, Y., W. Tang, et al. (2008). "Development of isothermal TaqMan assays for detection of biothreat organisms." Biotechniques 45(5): 543-557.
Tyagi, S. and F. R. Kramer (1996). "Molecular beacons: probes that fluoresce upon hybridization." Nat Biotechnol 14(3): 303-308.
Ugozzoli, L. A., D. Latorra, et al. (2004). "Real-time genotyping with oligonucleotide probes containing locked nucleic acids." Anal Biochem 324(1): 143-152.
Vasoo, S., J. Stevens, et al. (2009). "Rapid antigen tests for diagnosis of pandemic (Swine) influenza A/H1N1." Clin Infect Dis 49(7): 1090-1093.
Venter, M., S. Human, et al. (2009). "Lineage 2 west nile virus as cause of fatal neurologic disease in horses, South Africa." Emerg Infect Dis 15(6): 877-884.
Vincent, M., Y. Xu, et al. (2004). "Helicase-dependent isothermal DNA amplification." EMBO Rep 5(8): 795-800.
Vulto, P., G. Dame, et al. (2010). "A microfluidic approach for high efficiency extraction of low molecular weight RNA." Lab Chip 10(5): 610-616.
Vulto, P., S. Podszun, et al. (2011). "Phaseguides: a paradigm shift in microfluidic priming and emptying." Lab Chip 11(9): 1596-1602.
Wacker, M. J. and M. P. Godard (2005). "Analysis of one-step and two-step real-time RT-PCR using SuperScript III." J Biomol Tech 16(3): 266-271.
Wang, D. Y., R. B. Gao, et al. (2009). "[Establishment of a method for rapid detection of the nucleic acid of the novel A (H1N1) influenza virus]." Bing Du Xue Bao 25 Suppl: 1-3.
Weidmann, M., O. Faye, et al. (2010). "Improved LNA probe-based assay for the detection of African and South American yellow fever virus strains." J Clin Virol.
Weidmann, M., O. Faye, et al. (2010). "Improved LNA probe-based assay for the detection of African and South American yellow fever virus strains." J Clin Virol 48(3): 187-192.
Weidmann, M., E. Muhlberger, et al. (2004). "Rapid detection protocol for filoviruses." J Clin Virol 30(1): 94-99.
Weidmann, M., M. P. Sanchez-Seco, et al. (2008). "Rapid detection of important human pathogenic Phleboviruses." J Clin Virol 41(2): 138-142.

145
0-Discussion
Whiley, D. M., S. Bialasiewicz, et al. (2009). "Detection of novel influenza A(H1N1) virus by real-time RT-PCR." J Clin Virol 45(3): 203-204.
WHO. (2011). "The top 10 causes of death." Retrieved 8 July, 2012, from http://www.who.int/mediacentre/factsheets/fs310/en/index.html.
WHO (Dengue fever factsheet, 2009). World Health organization: Dengue and dengue haemorrhagic fever Fact sheet 2009.
WHO (H1N1 2009 update 2010). World Health Organisation, Pandemic H1N1 2009 update 109. Accessed by 16 July 2010.
WHO. (YFV fact sheet 2011). "Yellow fever Fact sheet N°100." from http://www.who.int/mediacentre/factsheets/fs100/en/.
WHO (YFV factsheet 2011). World Health Organisation: Yellow fever Fact sheet N°100 Jan 2011.
Wu, L. T., M. D. Curran, et al. (2010). "Nucleic Acid Dipstick Test: Molecular Diagnosis of Pandemic H1N1." J Clin Microbiol.
Yager, P., T. Edwards, et al. (2006). "Microfluidic diagnostic technologies for global public health." Nature 442(7101): 412-418.

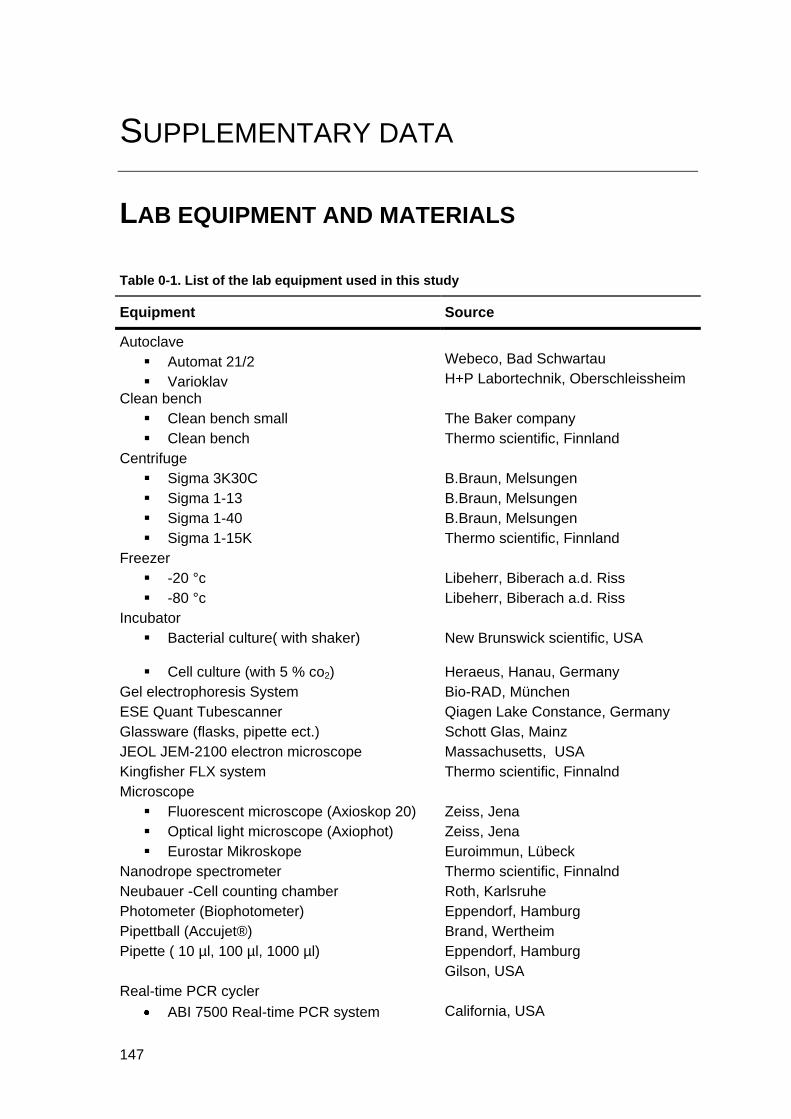
147
SUPPLEMENTARY DATA
LAB EQUIPMENT AND MATERIALS
Table 0-1. List of the lab equipment used in this study
Equipment Source
Autoclave
Automat 21/2 Webeco, Bad Schwartau
Varioklav H+P Labortechnik, Oberschleissheim
Clean bench
Clean bench small The Baker company
Clean bench Thermo scientific, Finnland
Centrifuge
Sigma 3K30C B.Braun, Melsungen
Sigma 1-13 B.Braun, Melsungen
Sigma 1-40 B.Braun, Melsungen
Sigma 1-15K Thermo scientific, Finnland
Freezer
-20 °c Libeherr, Biberach a.d. Riss
-80 °c Libeherr, Biberach a.d. Riss
Incubator
Bacterial culture( with shaker) New Brunswick scientific, USA
Cell culture (with 5 % co2) Heraeus, Hanau, Germany
Gel electrophoresis System Bio-RAD, München
ESE Quant Tubescanner Qiagen Lake Constance, Germany
Glassware (flasks, pipette ect.) Schott Glas, Mainz
JEOL JEM-2100 electron microscope Massachusetts, USA
Kingfisher FLX system Thermo scientific, Finnalnd
Microscope
Fluorescent microscope (Axioskop 20) Zeiss, Jena
Optical light microscope (Axiophot) Zeiss, Jena
Eurostar Mikroskope Euroimmun, Lübeck
Nanodrope spectrometer Thermo scientific, Finnalnd
Neubauer -Cell counting chamber Roth, Karlsruhe
Photometer (Biophotometer) Eppendorf, Hamburg
Pipettball (Accujet®) Brand, Wertheim
Pipette ( 10 µl, 100 µl, 1000 µl) Eppendorf, Hamburg
Gilson, USA
Real-time PCR cycler
ABI 7500 Real-time PCR system California, USA
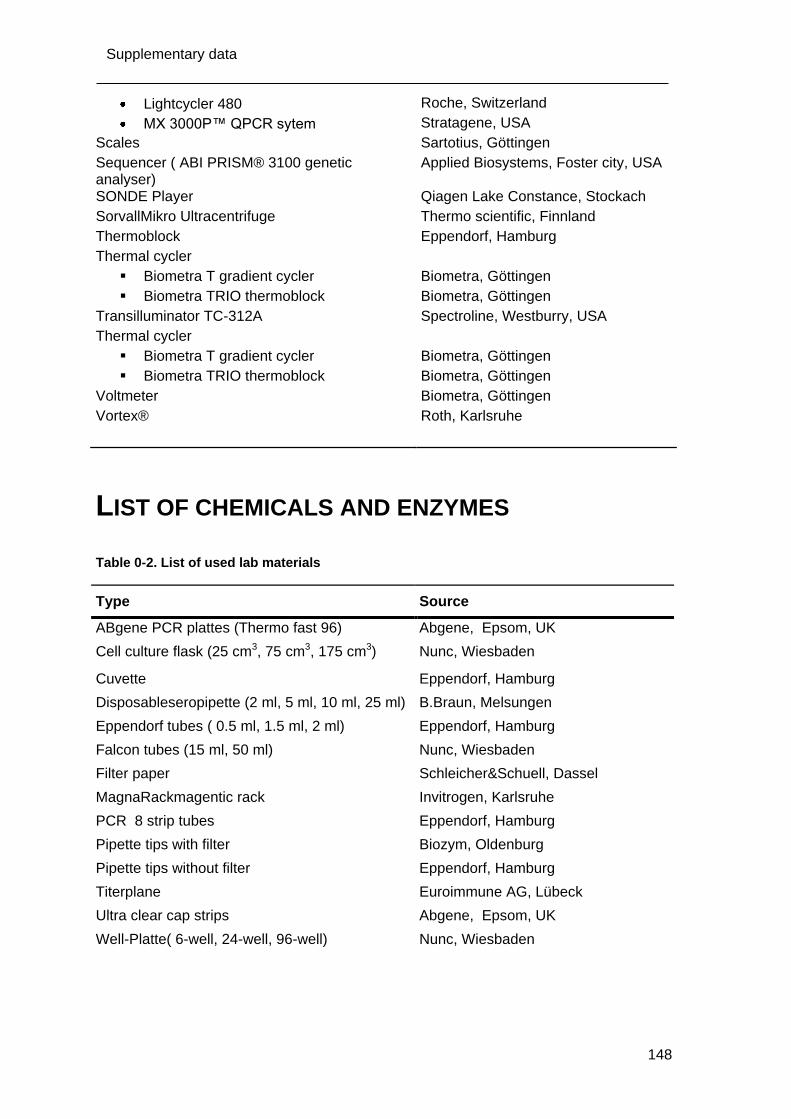
148
Supplementary data
Lightcycler 480 Roche, Switzerland
MX 3000P™ QPCR sytem Stratagene, USA
Scales Sartotius, Göttingen
Sequencer ( ABI PRISM® 3100 genetic analyser)
Applied Biosystems, Foster city, USA
SONDE Player Qiagen Lake Constance, Stockach
SorvallMikro Ultracentrifuge Thermo scientific, Finnland
Thermoblock Eppendorf, Hamburg
Thermal cycler
Biometra T gradient cycler Biometra, Göttingen
Biometra TRIO thermoblock Biometra, Göttingen
Transilluminator TC-312A Spectroline, Westburry, USA
Thermal cycler
Biometra T gradient cycler Biometra, Göttingen
Biometra TRIO thermoblock Biometra, Göttingen
Voltmeter Biometra, Göttingen
Vortex® Roth, Karlsruhe
LIST OF CHEMICALS AND ENZYMES
Table 0-2. List of used lab materials
Type Source
ABgene PCR plattes (Thermo fast 96) Abgene, Epsom, UK
Cell culture flask (25 cm3, 75 cm3, 175 cm3) Nunc, Wiesbaden
Cuvette Eppendorf, Hamburg
Disposableseropipette (2 ml, 5 ml, 10 ml, 25 ml) B.Braun, Melsungen
Eppendorf tubes ( 0.5 ml, 1.5 ml, 2 ml) Eppendorf, Hamburg
Falcon tubes (15 ml, 50 ml) Nunc, Wiesbaden
Filter paper Schleicher&Schuell, Dassel
MagnaRackmagentic rack Invitrogen, Karlsruhe
PCR 8 strip tubes Eppendorf, Hamburg
Pipette tips with filter Biozym, Oldenburg
Pipette tips without filter Eppendorf, Hamburg
Titerplane Euroimmune AG, Lübeck
Ultra clear cap strips Abgene, Epsom, UK
Well-Platte( 6-well, 24-well, 96-well) Nunc, Wiesbaden
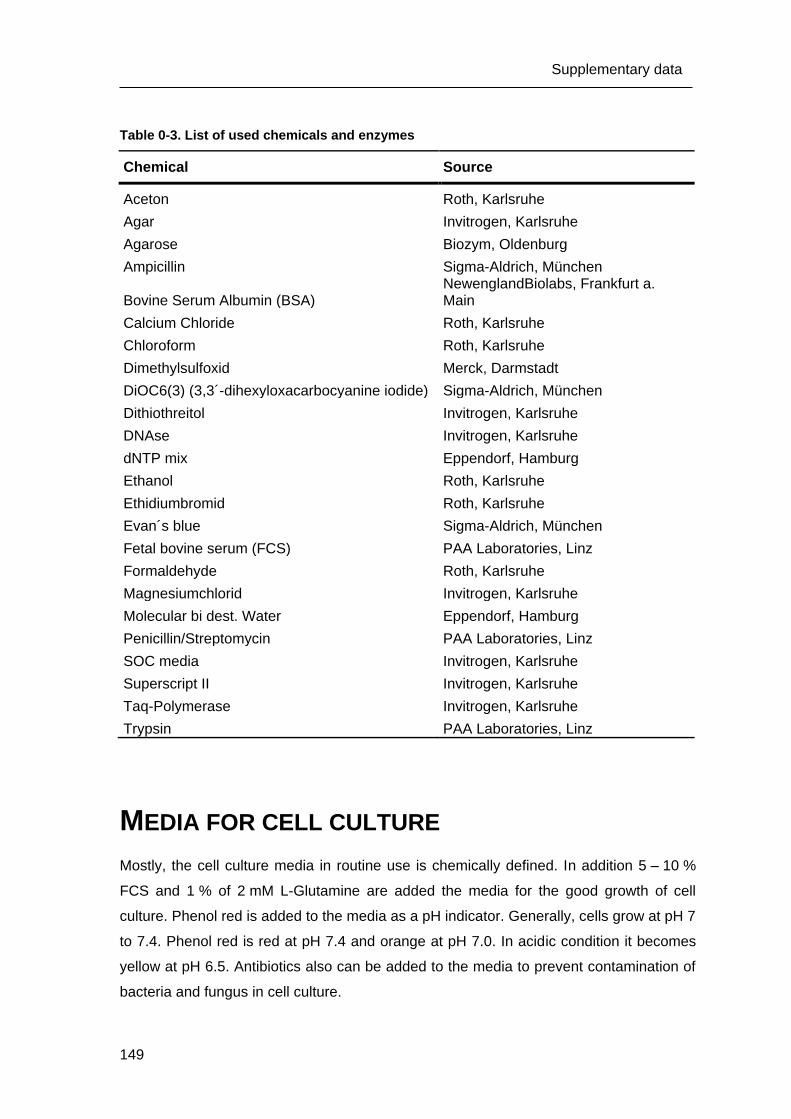
149
Supplementary data
Table 0-3. List of used chemicals and enzymes
Chemical Source
Aceton Roth, Karlsruhe
Agar Invitrogen, Karlsruhe
Agarose Biozym, Oldenburg
Ampicillin Sigma-Aldrich, München
Bovine Serum Albumin (BSA) NewenglandBiolabs, Frankfurt a. Main
Calcium Chloride Roth, Karlsruhe
Chloroform Roth, Karlsruhe
Dimethylsulfoxid Merck, Darmstadt
DiOC6(3) (3,3´-dihexyloxacarbocyanine iodide) Sigma-Aldrich, München
Dithiothreitol Invitrogen, Karlsruhe
DNAse Invitrogen, Karlsruhe
dNTP mix Eppendorf, Hamburg
Ethanol Roth, Karlsruhe
Ethidiumbromid Roth, Karlsruhe
Evan´s blue Sigma-Aldrich, München
Fetal bovine serum (FCS) PAA Laboratories, Linz
Formaldehyde Roth, Karlsruhe
Magnesiumchlorid Invitrogen, Karlsruhe
Molecular bi dest. Water Eppendorf, Hamburg
Penicillin/Streptomycin PAA Laboratories, Linz
SOC media Invitrogen, Karlsruhe
Superscript II Invitrogen, Karlsruhe
Taq-Polymerase Invitrogen, Karlsruhe
Trypsin PAA Laboratories, Linz
MEDIA FOR CELL CULTURE
Mostly, the cell culture media in routine use is chemically defined. In addition 5 – 10 %
FCS and 1 % of 2 mM L-Glutamine are added the media for the good growth of cell
culture. Phenol red is added to the media as a pH indicator. Generally, cells grow at pH 7
to 7.4. Phenol red is red at pH 7.4 and orange at pH 7.0. In acidic condition it becomes
yellow at pH 6.5. Antibiotics also can be added to the media to prevent contamination of
bacteria and fungus in cell culture.
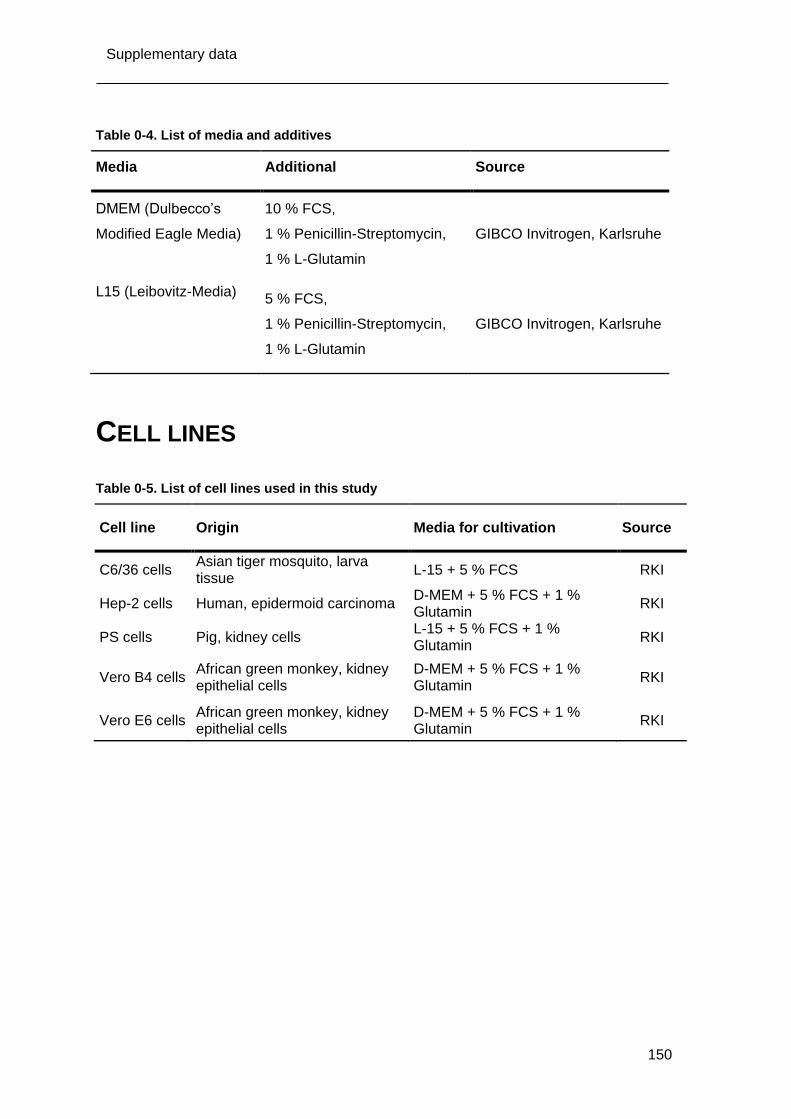
150
Supplementary data
Table 0-4. List of media and additives
Media Additional Source
DMEM (Dulbecco’s
Modified Eagle Media)
10 % FCS,
1 % Penicillin-Streptomycin,
1 % L-Glutamin
GIBCO Invitrogen, Karlsruhe
L15 (Leibovitz-Media) 5 % FCS,
1 % Penicillin-Streptomycin,
1 % L-Glutamin
GIBCO Invitrogen, Karlsruhe
CELL LINES
Table 0-5. List of cell lines used in this study
Cell line Origin Media for cultivation Source
C6/36 cells Asian tiger mosquito, larva tissue
L-15 + 5 % FCS RKI
Hep-2 cells Human, epidermoid carcinoma D-MEM + 5 % FCS + 1 % Glutamin
RKI
PS cells Pig, kidney cells L-15 + 5 % FCS + 1 % Glutamin
RKI
Vero B4 cells African green monkey, kidney epithelial cells
D-MEM + 5 % FCS + 1 % Glutamin
RKI
Vero E6 cells African green monkey, kidney epithelial cells
D-MEM + 5 % FCS + 1 % Glutamin
RKI