developing behavioral fluency with movement cycles using ... · original paper developing...
TRANSCRIPT
ORI GIN AL PA PER
Developing Behavioral Fluency with Movement CyclesUsing SAFMEDS
Richard M. Kubina Jr.1 • Kirsten K. L. Yurich2 •
Krina C. Durica3 • Nora M. Healy2
� Springer Science+Business Media New York 2015
Abstract The Precision Teaching term ‘‘movement cycle’’ refers to a behavior with a
clearly observable movement and a distinct beginning and end. The present experiment
examined whether behavior analysts and special education teachers could become
fluent identifying movement cycles. A frequency-building intervention called SAF-
MEDS, an acronym for Say All Fast Minute Every Day Shuffled, required participants
to see a picture of behavior on a laminated card and say the movement cycle. A multiple
baseline multiple probe design with two groups of four participants revealed the effects
of the intervention. Results showed a replication of effects with each group using
equivalent SAFMEDS decks. The SAFMEDS intervention produced behavioral flu-
ency and also fostered strong maintenance effects for a majority of the participants.
Keywords SAFMEDS � Behavioral fluency � Movement cycles � Behavioral
definitions
Introduction
The principal character trait setting behavior analysis apart from all other
subdisciplines of psychology rests on the conceptualization of behavior. Launching
contemporary behavior analysis with his masterpiece The Behavior of Organisms,
& Richard M. Kubina Jr.
Kirsten K. L. Yurich
1 Special Education Program, The Pennsylvania State University, 209 CEDAR Building,
University Park, PA 16802-3109, USA
2 The Vista School, Hershey, PA, USA
3 The Pennsylvania State University, Hershey, PA, USA
123
J Behav Educ
DOI 10.1007/s10864-015-9232-1

Skinner wrote, ‘‘Behavior is what an organism is doing; or more accurately what it
is observed by another organism to be doing’’ (Skinner 1938, p. 6). Skinner went on
to elaborate stating behavior also could refer to the movement of an organism or of
its parts.
Contemporary definitions of behavior follow Skinner’s original definition:
‘‘Behavior is anything an animal (including the human animal) does’’ (Malott and
Shane 2014, p. 6); ‘‘Behavior is that portion of an organism’s interaction with its
environment that involves movement of some part of the organism’’ (Johnston and
Pennypacker 2009, p. 31). The key to all definitions of behavior center on
movement. Indeed, movement-based definitions of behavior led to the discovery and
classification of different types or classes of behavior: operant, respondent, and
adjunctive (Cooper et al. 2007).
Practicing behavior analysts rely on a behavior analytic framework when
formulating intervention targets. For example, an applied study defined ‘‘requests
for attention’’ as ‘‘raising one’s hand, calling out to the teacher, or leaving one’s seat
and going to the teacher to make a request for assistance or approval after the
student had been instructed to work independently’’ (Austin and Bevan 2011,
p. 453). Thrusting a hand upward, saying answers or comments, rising from a sitting
position, walking to the teacher, and asking questions all constitute movement or
action. Target behaviors take center stage for descriptive analyses, functional
analyses, and all behavior plans and interventions. The major pillar of the science of
behavior lies in formation and execution of selecting and labeling behavior for
analysis and intervention.
Ogden Lindsley, the founder of Precision Teaching and one of B. F. Skinner’s
students, understood the critical need to properly label or pinpoint authentic
behavior. In Precision Teaching, recognizing and detecting behavior meant parents
and teachers needed to learn how to discriminate action and non-action. One of the
first Precision Teaching texts explained the difference between behaviors that do
and do not contain movement (Kunzelmann et al. 1970). ‘‘Waiting in line’’ does not
contain movement, but ‘‘slowly walking forward’’ does. ‘‘Being depressed’’ lacks
movement while ‘‘says unhappy comments’’ has clear movement. The identification
of movement-based versus non-movement-based behavior led to practical
information.
Early Precision Teachers also acknowledged that action-based verbs required a
cycle to complete the movement of behavior. As an example, ‘‘to empty’’ and ‘‘to
suck’’ both represent detectable movements, but without a cycle one may ask ‘‘to
empty what?’’ and ‘‘to suck what?’’ (Kunzelmann et al. 1970). A cycle must contain
the action and the associated object for a person to determine when the movement
(i.e., behavior) has ended (Kubina and Yurich 2012). ‘‘To empty a dishwasher’’ or
‘‘to suck a lollipop’’ forms a complete description of behavior.
Verb tenses formed another feature of the pinpointing process by adding
precision to the selected verb. Many parents and teachers would choose verbs such
as hitting, spitting, or yelling. All of the previous mentioned -ing verbs fall under the
present progressive tense. The present progressive tense illustrates action with
ongoing progress (Berry et al. 2010). Precision Teaching suggests using simple
present tense requiring the addition of an ‘‘s’’ to the action verb. Hitting, spitting,
J Behav Educ
123
and yelling become hits, spits, and yells. Use of the simple present tense expresses
actions that repeat (Language Dynamics 2013). A verb communicated in the present
progressive tense directs the person counting the behavior to look for ongoing
instances of the behavior. Alternatively, Precision Teachers found parents and
teachers had an easier time counting behavior that repeated itself (e.g., ‘‘hitting’’
refers to ongoing behavior whereas ‘‘hits’’ conveys a discrete instance that begins
and ends).
Through the years, Precision Teachers have refined how to create movement
cycles. The four steps involve: (1) selecting a precise, observable action verb
(present tense); (2) choosing an object (noun) that ends the cycle of movement; (3)
adding an ‘‘s’’ to the action verb; and (4) checking the movement cycle for
observability and repeatability (Kubina and Yurich 2012). Swings hammer, kicks
wall, scratches arm, licks popsicle, shakes hand, and turns page all showcase
movement cycles using the previously described four steps.
Pinpointing behavior using movement cycles has helped teachers and parents
identify and solve behavioral problems. Using movement cycles may also aid
behavior analysts in practice and research. The advantages of movement cycles
include having an explicit behavioral target easily detected. The ease of detection
then leads to an enhanced capacity to count the behavior. The precision of detecting
and counting movement cycles facilitates the identification of quantitative relations
between an operant and features in the environment, in other words, distinguishing a
contingency (Vargas 2009). The sharpened focus on movement cycles also may
improve the identification of response classes. A ‘‘tantrum’’ may include bites hand,
pinches arm, slaps face, and kicks floor. And the culmination of the behavioral
measurement of movement cycles lies with the application of behavior plans and
subsequent evaluation of the intervention. Decisive, reliably observed behaviors,
and recorded data play a critical role in behavior analysis.
Overall, the research examining movement cycles appears limited. One study
supporting movement cycles appeared in an experiment examining the differences
in target behavior descriptions (Smith et al. 2013). A groups of participants watched
a videotape under two different conditions. When identifying the target behavior
with present tense, active voice verb, and an object that named the reception of
action, target behavior detection was higher than when using an operational
definition. Namely, detecting the target behavior in the videotape with a movement
cycle occurred at a higher rate and the amount of false positives (i.e., detecting
behavior that did not meet the target definition) were at a much lower rate.
Using movement cycles for behavior description could positively enhance the
verbal repertoires of those conducting behavioral analyses and interventions. Future
measurement (data collection) and intervention efforts could improve by describing
target behaviors in ways that fall within the original account of behavior (i.e.,
containing movement). Therefore, at a school serving students with autism spectrum
disorders, the present experiment examined whether behavior analysts and special
education teachers could become fluent identifying movement cycles with an
intervention called SAFMEDS. SAFMEDS stands for ‘‘Say All Fast Minute Every
Day Shuffled’’ (Graf and Auman 2005) and has experimental evidence demon-
strating its effectiveness increasing different verbal behavior pinpoints to fluency
J Behav Educ
123

(e.g., Beverley et al. 2009; Chapman et al. 2005; Cihon et al. 2012; Hughes et al.
2007).
Because few studies have shown how SAFMEDS could impact in-service
professionals, the potential participants (i.e., behavior analysts and special education
teachers) received an invitation to take part in the experiment. The specific
experimental questions asked whether SAFMEDS would lead to fluency for
identifying movement cycles among practicing behavior analysts and special
education teachers. A second question examined whether the SAFMEDS fluency
intervention would foster positive outcomes with maintenance after the intervention
ended.
Method
Participants
Participants consisted of eight educational or behavioral health professionals. All
participants had a master’s degree in Applied Behavior Analysis, education, or
psychology, and five of the eight participants were or became Board Certified
Behavior Analysts during the intervention. The participants each held professional
positions in which they frequently had to pinpoint behavior for various tasks (e.g.,
assessment, intervention, goals, individualized education programs, communication
with the education team or communication with parents). Table 1 provides a
summarization of participant characteristics.
The participants did not receive compensation for their participation in the study.
Participants involved in the agreed to take part in an experiment aimed at
determining whether the SAFMEDS intervention would help them learn movement
cycles better and thus apply it in their respective jobs. Because participants worked
at the same campus, they all received instructions not to discuss experimental
procedures or results with one another until the study ended. Participants were
assigned to either Group 1 or Group 2 through random selection.
Table 1 Participant characteristics
Participants Age Degrees conferred BCBA Years as a BCBA
Hanna 32 Master’s in education Yes \1
Penny 32 Master’s in education No N/A
Mack 26 Master’s in ABA Yes 3
Darla 30 Master’s in special education No N/A
Rachael 34 Master’s in ABA Yes 3
George 26 Master’s in psychology Yes \1
Thomas 33 Master’s in psychology Yes 5
Natalie 29 Master’s in educational psychology No N/A
J Behav Educ
123
Setting
The experimenters conducted the study at a private school in the eastern part of the
USA. The school served children between the ages of three and 21 with a primary
diagnosis of autism. All experimental sessions took place in general office locations
that contained a table or desk, chairs, and other basic office equipment. Practice
sessions occurred during the course of participants’ normal workdays, and therefore,
sessions occurred at various times of day.
Materials
Materials consisted of two counterbalanced decks of SAFMEDS cards depicting
behavior. Experimenters photographed individuals performing actions typically
observed in both school and home environments. Adults and their related children
as well as school students served as models. The photographs included individuals
ranging in age from 1 to 20 years. The final set of 100 images was separated into
Deck A and Deck B; each image illustrated a clear behavior and came from a
selection of approximately 200 images.
To determine the movement cycle label, experimenters assigned the most precise
and directly observable action verb and object label using both a commercially
available dictionary and thesaurus. Each SAFMEDS card contained the movement
cycle label on one side of the card opposite the image. An expert panel comprised
mainly of senior-level behavior analysts (seven panelists in total, two Ph.D.s, four
Masters, and one Bachelor’s level) independently reviewed the prospective images.
The expert panel also described the movement cycles using action oriented verbs to
describe the movement shown and plain English nouns to depict the object of the
movement (Lindsley 1991). Panelists had to reach 100 % agreement for each
SAFMEDS label. When the expert panel did not come to a 100 % consensus, they
excluded the image.
The experimenters organized the selected images into two decks (e.g., Deck A and
Deck B) containing fifty pictures each. Each deck was then counterbalanced across
photographs of daily care routines (e.g., brushes teeth, brushes hair), academic
behaviors (e.g., touches shape, colors paper), leisure activities (e.g., catches ball,
places puzzle piece), and functional routines (e.g., washes dish, empties trashcan).
Each counterbalanced deck contained no more than two depictions of the same action.
Images were printed on 3� 9 5 inch cardstock paper. Each full color image
further included three or four consistent markings superimposed using Microsoft�
drawing tools in Word. Two-dimensional still frame images have limitations for
illustrating directionality or movement. Therefore, the experimenters used super-
imposed arrows to depict movement and circles to link the movement with the
object to complete one movement cycle per card. Every image included one or two
circles and one or two arrows in order to assist in communicating the correct
movement cycle. Circles marked the focal point of the movement. Arrows
connected movement and object or provided information of directionality of the
movement.
J Behav Educ
123
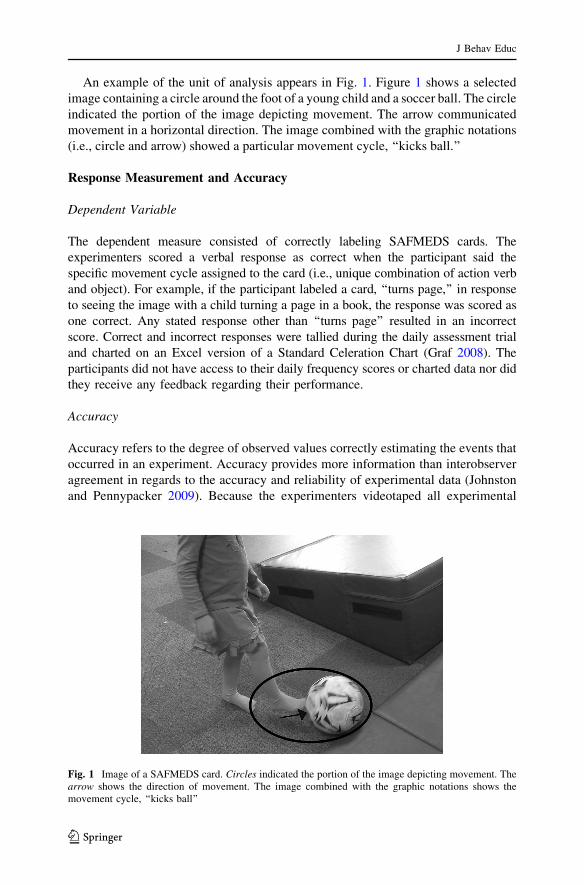
An example of the unit of analysis appears in Fig. 1. Figure 1 shows a selected
image containing a circle around the foot of a young child and a soccer ball. The circle
indicated the portion of the image depicting movement. The arrow communicated
movement in a horizontal direction. The image combined with the graphic notations
(i.e., circle and arrow) showed a particular movement cycle, ‘‘kicks ball.’’
Response Measurement and Accuracy
Dependent Variable
The dependent measure consisted of correctly labeling SAFMEDS cards. The
experimenters scored a verbal response as correct when the participant said the
specific movement cycle assigned to the card (i.e., unique combination of action verb
and object). For example, if the participant labeled a card, ‘‘turns page,’’ in response
to seeing the image with a child turning a page in a book, the response was scored as
one correct. Any stated response other than ‘‘turns page’’ resulted in an incorrect
score. Correct and incorrect responses were tallied during the daily assessment trial
and charted on an Excel version of a Standard Celeration Chart (Graf 2008). The
participants did not have access to their daily frequency scores or charted data nor did
they receive any feedback regarding their performance.
Accuracy
Accuracy refers to the degree of observed values correctly estimating the events that
occurred in an experiment. Accuracy provides more information than interobserver
agreement in regards to the accuracy and reliability of experimental data (Johnston
and Pennypacker 2009). Because the experimenters videotaped all experimental
Fig. 1 Image of a SAFMEDS card. Circles indicated the portion of the image depicting movement. Thearrow shows the direction of movement. The image combined with the graphic notations shows themovement cycle, ‘‘kicks ball’’
J Behav Educ
123
sessions, every dependent variable measurement was checked for accuracy. The
videotaped session became the true value. The true value represents a value or score
that involves the highest degree possible for minimizing measurement error
(Johnston and Pennypacker 2009). The experimenters checked all scores for
measurement of the dependent variable against the videotaped sessions. Two
experimenters scored each video independent of one another. As an additional
measure, the two independent scores were compared against each other. Accuracy
for the dependent variable was 100 %.
Independent Variable and Procedural Integrity
Independent Variable
The independent variable consisted of frequency building to a performance criterion
(FBPC; Kubina and Yurich 2012). FBPC entailed daily, timed skill practice with
performance feedback (Graf and Lindsley 2002). Frequency building to a
performance criterion, a more precise and technical term than practice, results in
systematically increasing the frequency or rate and accuracy of the target skill.
Within the experiment, participants built frequency of saying movement cycles in
response to individual picture cards arranged into a deck of 50. The independent
variable, FBPC, increases accuracy and speed of behavior with timed repetition and
performance feedback (Datchuk and Kubina 2015; Datchuk et al. 2015; Kubina and
Yurich 2012). The cumulative implementations of FBPC is also purported to foster
growth across time (Kubina 2005). The performance criterion (the PC of the
acronym FBPC) indicates the frequency aim signaling the end or goal of frequency
building. For the present study, a performance criterion of 17 correct responses in
20 s was set, or a frequency of approximately 50 corrects per minute (Graf and
Auman 2005).
Each group of participants used one of two equivalent SAFMEDS decks (Deck A
or Deck B). The two decks were counterbalanced and contained corresponding
stimuli for each group. Both decks included no more than two pictures depicting the
same movement or action and included an equal number of child or adult models.
The two decks controlled for idiosyncratic pictures or some unforeseen graphic
feature of a SAFMEDS card exhibiting control of responding.
Procedural Integrity
The procedural integrity measure documented the correct and consistent use of the
intervention. Integrity data were collected on the following measures: (a) correct
materials used, (b) proper positioning of participants, (c) distraction-free environ-
ment, (d) correct number of SAFMEDS trials implemented, (e) minimum level of
daily sessions per week of the SAFMEDS intervention, and (f) videotaping the
assessment trial. Procedural integrity was calculated by dividing the number of steps
correctly competed by the total number of possible steps and multiplying by 100
(Gast 2010). The mean procedural integrity was 98.2 %. Errors mainly consisted of
videotaping from an incorrect position.
J Behav Educ
123

Experimental Design
Experimenters used a multiprobe multiple baseline across participants design
(Kennedy 2005) for two groups of four participants each. The first participant from
each group whose data had the most stability during baseline observation started the
intervention phase first. Stability was defined as low variability, flat or decelerating
corrects, and/or flat or accelerating incorrects. All other participants continued
within a multiple probe design consisting of one trial (a 20-s time interval), once per
week, until he or she began the intervention phase. When the first participant in the
intervention phase reached ten correct responses within 20 s (with a minimum of
4 days in the intervention phase), the next participant with a stable baseline began
the intervention. The process continued with each participant beginning the
intervention phase once the previous participant achieved 10 correct responses.
Procedure
Pre-test
During pre-test, all eight participants were tested on both Deck A and Deck B. The
pre-test helped assure no participants were familiar with the information. The
participants sat to the left of the experimenter. The experimenter shuffled the deck
of cards and set a timer for 20 s. The participant then went through each deck of
cards as fast as they could naming the movement cycle, with the timer starting upon
initiation of the participant’s first response. The participant could not see the correct
movement cycle written on the back of the card during the assessment trial.
Participants received no feedback during assessment as to the accuracy of their
responses. Videotaped assessment trials captured the cards in the participant’s
hands. Later, the experimenters counted correct and incorrect responses from the
recorded video clip for both decks. After participants were assigned to a group, the
results of the pre-test became the first data point in baseline.
Baseline
During baseline, all participants completed one trial (a 20-s timing) each day on the
deck assigned to them for four consecutive days. The scoring procedures from pre-
test were replicated in baseline (i.e., the participants could not look at the movement
cycles on the back of the cards, could not practice incorrect responses, did not
receive any feedback, and had all trials videotaped). The first participant from each
group with a stable baseline, defined as having a celeration of corrects below 91.1
and incorrects accelerating or remaining at 91.0, started the intervention phase. All
other participants continued with a weekly baseline probe until they started
intervention. As each participant met the criteria (ten correct responses in 20 s with
less than one error across four consecutive data points), the participant with the most
stable baseline started intervention next.
J Behav Educ
123
SAFMEDS Intervention
Intervention included daily (i.e., each day at work) frequency building or practice with
the assigned SAFMEDS deck. During the intervention phase, each session consisted of
several steps. First, the participants conducted 20 s timings similar to baseline. During
the trial, however, they were able to turn the card over to view the back and see the
correct label. While going through the cards and naming the movement cycle, the
participants made their own piles for cards they labeled correctly and incorrectly.
When the 20 s trial ended, the experimenter gave the incorrect pile to the
participants and instructed them to examine their incorrects and practice the correct
movement cycle names for 1 min. After the 1 min of self-correction/self-feedback
time came to an end, the experimenter shuffled all the cards back into the deck and
repeated the 20 s trial. Shuffling occurred so each trial offered an opportunity to
respond on any card in the deck. A shuffled deck appears to produce greater
behavioral stability due to decreasing order effects (Graf and Auman 2005). The
procedure of self-correction/self-feedback repeated itself for the second and third trial.
After the third SAFMEDS trial, the experimenters implemented the dependent
variable in which the participants did not flip the cards over or make correct and
incorrect piles; they instead made one pile without seeing the answer. The
experimenters scored the videotaped dependent variable sessions later to obtain the
score for correct and incorrect responses for that day. Participants continued in the
intervention phase reaching fluency criteria of 17 or more correct responses and 0–1
incorrect responses per 20 s for two out of three consecutive days. The results (Figs. 2,
3) showed the number of daily sessions completed for each participant. While the
experimenters encouraged daily application of the dependent and independent
variable, occasional absences occurred (e.g., sick days, weekends, holidays).
Post-test Extension Measure
The participants completed an extension measure on the same day they reached the
intervention criteria. Participants completed the extension measure on the non-
intervention deck (e.g., a participant who practiced Deck A during intervention
completed the extension measure with Deck B). The extension measure mirrored pre-
test in that participants did not flip over the cards and did not receive any feedback on
the accuracy of their responses. The experimenters used the videotaped sessions to
score the extension measure and report pre- and post-test accuracy results.
Maintenance
During maintenance, the participants completed one 20 s timing on their assigned
deck once a week for the 4 weeks following their last intervention data point.
Participants completed one trial (a 20 s timing) without the self-correction/self-
feedback time as they did in the intervention phase. The experimenters scored the
videotaped sessions later. Participants also completed a follow-up trial with a single
20 s timing conducted 6–7 months after post-test without self-correction/self-
feedback.
J Behav Educ
123
Data Display
The experimenters displayed data (Figs. 2, 3) on sections taken from Standard
Celeration Charts (SCC; Graf and Lindsley 2002; Lindsley 2005; Pennypacker et al.
2003). The figures have an exact portion of the SCC that places behavior within
calendar time, shows proportional changes of behavior, and permits the quantifi-
cation of important change measures (Pennypacker et al. 2003). Displaying
participant data within the context of time demonstrates how the intervention
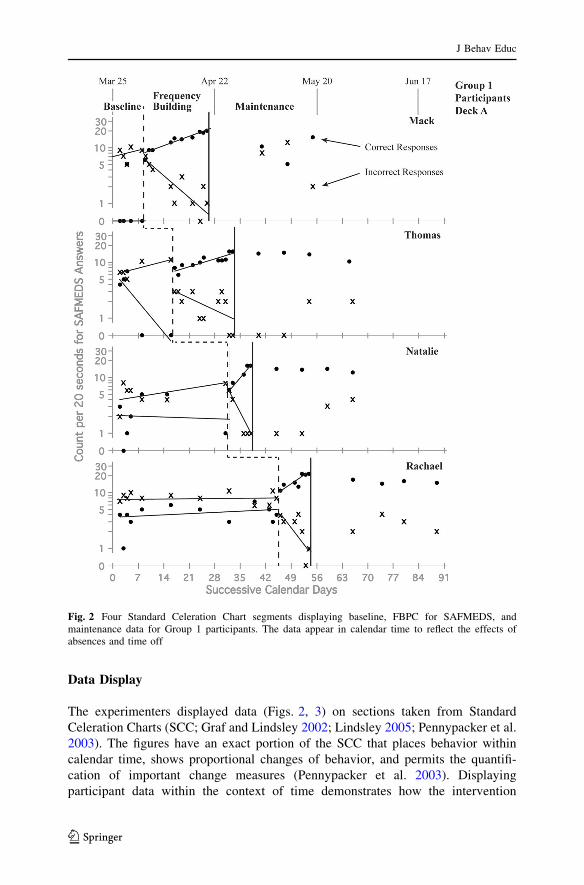
Fig. 2 Four Standard Celeration Chart segments displaying baseline, FBPC for SAFMEDS, andmaintenance data for Group 1 participants. The data appear in calendar time to reflect the effects ofabsences and time off
J Behav Educ
123
affected each participant as it occurred temporally with breaks shown for weekends
and sick days. Additionally, the SCCs quantify the following important features of
visual analysis: trend, trend stability, variability, immediacy of an effect, and the
consistency of data patterns across phases (Barlow et al. 2009; Fisher et al. 2003;
Kazdin 2011; Kennedy 2005; Kratochwill et al. 2013; Parsonson and Baer 1978). In
the present study, the following measures enhance visual analysis: for trend,
celeration; for immediacy of an effect, frequency multipliers (or frequency jumps);
for quantification of change in trend from baseline to intervention, celeration
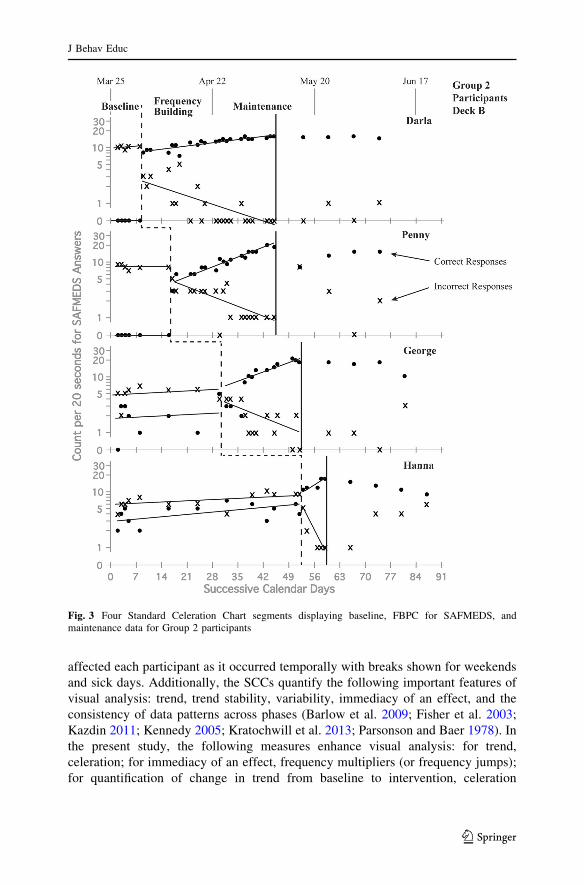
Fig. 3 Four Standard Celeration Chart segments displaying baseline, FBPC for SAFMEDS, andmaintenance data for Group 2 participants
J Behav Educ
123
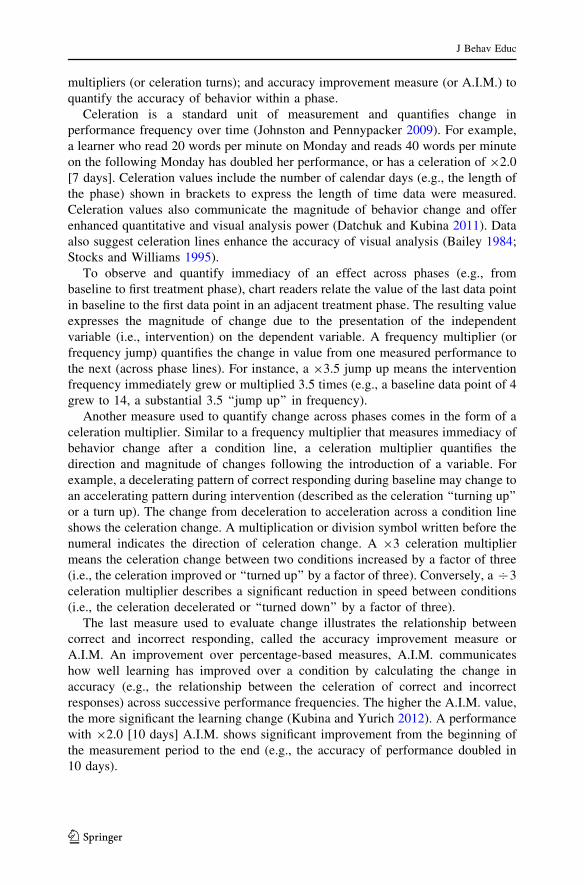
multipliers (or celeration turns); and accuracy improvement measure (or A.I.M.) to
quantify the accuracy of behavior within a phase.
Celeration is a standard unit of measurement and quantifies change in
performance frequency over time (Johnston and Pennypacker 2009). For example,
a learner who read 20 words per minute on Monday and reads 40 words per minute
on the following Monday has doubled her performance, or has a celeration of 92.0
[7 days]. Celeration values include the number of calendar days (e.g., the length of
the phase) shown in brackets to express the length of time data were measured.
Celeration values also communicate the magnitude of behavior change and offer
enhanced quantitative and visual analysis power (Datchuk and Kubina 2011). Data
also suggest celeration lines enhance the accuracy of visual analysis (Bailey 1984;
Stocks and Williams 1995).
To observe and quantify immediacy of an effect across phases (e.g., from
baseline to first treatment phase), chart readers relate the value of the last data point
in baseline to the first data point in an adjacent treatment phase. The resulting value
expresses the magnitude of change due to the presentation of the independent
variable (i.e., intervention) on the dependent variable. A frequency multiplier (or
frequency jump) quantifies the change in value from one measured performance to
the next (across phase lines). For instance, a 93.5 jump up means the intervention
frequency immediately grew or multiplied 3.5 times (e.g., a baseline data point of 4
grew to 14, a substantial 3.5 ‘‘jump up’’ in frequency).
Another measure used to quantify change across phases comes in the form of a
celeration multiplier. Similar to a frequency multiplier that measures immediacy of
behavior change after a condition line, a celeration multiplier quantifies the
direction and magnitude of changes following the introduction of a variable. For
example, a decelerating pattern of correct responding during baseline may change to
an accelerating pattern during intervention (described as the celeration ‘‘turning up’’
or a turn up). The change from deceleration to acceleration across a condition line
shows the celeration change. A multiplication or division symbol written before the
numeral indicates the direction of celeration change. A 93 celeration multiplier
means the celeration change between two conditions increased by a factor of three
(i.e., the celeration improved or ‘‘turned up’’ by a factor of three). Conversely, a 73
celeration multiplier describes a significant reduction in speed between conditions
(i.e., the celeration decelerated or ‘‘turned down’’ by a factor of three).
The last measure used to evaluate change illustrates the relationship between
correct and incorrect responding, called the accuracy improvement measure or
A.I.M. An improvement over percentage-based measures, A.I.M. communicates
how well learning has improved over a condition by calculating the change in
accuracy (e.g., the relationship between the celeration of correct and incorrect
responses) across successive performance frequencies. The higher the A.I.M. value,
the more significant the learning change (Kubina and Yurich 2012). A performance
with 92.0 [10 days] A.I.M. shows significant improvement from the beginning of
the measurement period to the end (e.g., the accuracy of performance doubled in
10 days).
J Behav Educ
123
Results
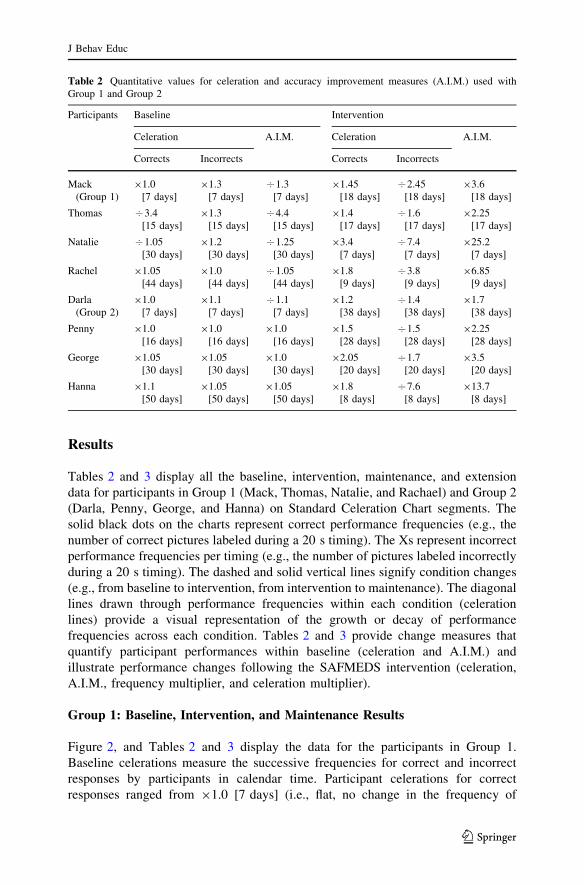
Tables 2 and 3 display all the baseline, intervention, maintenance, and extension
data for participants in Group 1 (Mack, Thomas, Natalie, and Rachael) and Group 2
(Darla, Penny, George, and Hanna) on Standard Celeration Chart segments. The
solid black dots on the charts represent correct performance frequencies (e.g., the
number of correct pictures labeled during a 20 s timing). The Xs represent incorrect
performance frequencies per timing (e.g., the number of pictures labeled incorrectly
during a 20 s timing). The dashed and solid vertical lines signify condition changes
(e.g., from baseline to intervention, from intervention to maintenance). The diagonal
lines drawn through performance frequencies within each condition (celeration
lines) provide a visual representation of the growth or decay of performance
frequencies across each condition. Tables 2 and 3 provide change measures that
quantify participant performances within baseline (celeration and A.I.M.) and
illustrate performance changes following the SAFMEDS intervention (celeration,
A.I.M., frequency multiplier, and celeration multiplier).
Group 1: Baseline, Intervention, and Maintenance Results
Figure 2, and Tables 2 and 3 display the data for the participants in Group 1.
Baseline celerations measure the successive frequencies for correct and incorrect
responses by participants in calendar time. Participant celerations for correct
responses ranged from 91.0 [7 days] (i.e., flat, no change in the frequency of
Table 2 Quantitative values for celeration and accuracy improvement measures (A.I.M.) used with
Group 1 and Group 2
Participants Baseline Intervention
Celeration A.I.M. Celeration A.I.M.
Corrects Incorrects Corrects Incorrects
Mack
(Group 1)
91.0
[7 days]
91.3
[7 days]
71.3
[7 days]
91.45
[18 days]
72.45
[18 days]
93.6
[18 days]
Thomas 73.4
[15 days]
91.3
[15 days]
74.4
[15 days]
91.4
[17 days]
71.6
[17 days]
92.25
[17 days]
Natalie 71.05
[30 days]
91.2
[30 days]
71.25
[30 days]
93.4
[7 days]
77.4
[7 days]
925.2
[7 days]
Rachel 91.05
[44 days]
91.0
[44 days]
71.05
[44 days]
91.8
[9 days]
73.8
[9 days]
96.85
[9 days]
Darla
(Group 2)
91.0
[7 days]
91.1
[7 days]
71.1
[7 days]
91.2
[38 days]
71.4
[38 days]
91.7
[38 days]
Penny 91.0
[16 days]
91.0
[16 days]
91.0
[16 days]
91.5
[28 days]
71.5
[28 days]
92.25
[28 days]
George 91.05
[30 days]
91.05
[30 days]
91.0
[30 days]
92.05
[20 days]
71.7
[20 days]
93.5
[20 days]
Hanna 91.1
[50 days]
91.05
[50 days]
91.05
[50 days]
91.8
[8 days]
77.6
[8 days]
913.7
[8 days]
J Behav Educ
123
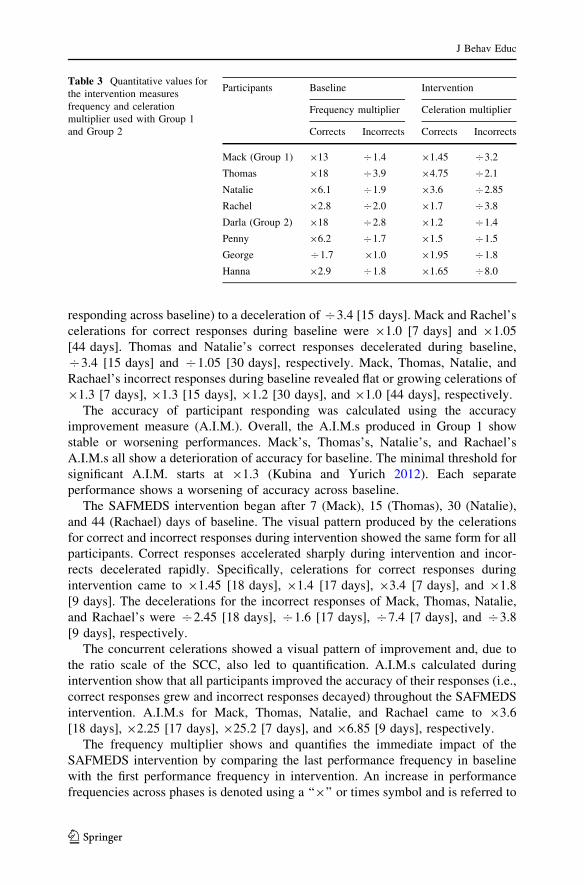
responding across baseline) to a deceleration of 73.4 [15 days]. Mack and Rachel’s
celerations for correct responses during baseline were 91.0 [7 days] and 91.05
[44 days]. Thomas and Natalie’s correct responses decelerated during baseline,
73.4 [15 days] and 71.05 [30 days], respectively. Mack, Thomas, Natalie, and
Rachael’s incorrect responses during baseline revealed flat or growing celerations of
91.3 [7 days], 91.3 [15 days], 91.2 [30 days], and 91.0 [44 days], respectively.
The accuracy of participant responding was calculated using the accuracy
improvement measure (A.I.M.). Overall, the A.I.M.s produced in Group 1 show
stable or worsening performances. Mack’s, Thomas’s, Natalie’s, and Rachael’s
A.I.M.s all show a deterioration of accuracy for baseline. The minimal threshold for
significant A.I.M. starts at 91.3 (Kubina and Yurich 2012). Each separate
performance shows a worsening of accuracy across baseline.
The SAFMEDS intervention began after 7 (Mack), 15 (Thomas), 30 (Natalie),
and 44 (Rachael) days of baseline. The visual pattern produced by the celerations
for correct and incorrect responses during intervention showed the same form for all
participants. Correct responses accelerated sharply during intervention and incor-
rects decelerated rapidly. Specifically, celerations for correct responses during
intervention came to 91.45 [18 days], 91.4 [17 days], 93.4 [7 days], and 91.8
[9 days]. The decelerations for the incorrect responses of Mack, Thomas, Natalie,
and Rachael’s were 72.45 [18 days], 71.6 [17 days], 77.4 [7 days], and 73.8
[9 days], respectively.
The concurrent celerations showed a visual pattern of improvement and, due to
the ratio scale of the SCC, also led to quantification. A.I.M.s calculated during
intervention show that all participants improved the accuracy of their responses (i.e.,
correct responses grew and incorrect responses decayed) throughout the SAFMEDS
intervention. A.I.M.s for Mack, Thomas, Natalie, and Rachael came to 93.6
[18 days], 92.25 [17 days], 925.2 [7 days], and 96.85 [9 days], respectively.
The frequency multiplier shows and quantifies the immediate impact of the
SAFMEDS intervention by comparing the last performance frequency in baseline
with the first performance frequency in intervention. An increase in performance
frequencies across phases is denoted using a ‘‘9’’ or times symbol and is referred to
Table 3 Quantitative values for
the intervention measures
frequency and celeration
multiplier used with Group 1
and Group 2
Participants Baseline Intervention
Frequency multiplier Celeration multiplier
Corrects Incorrects Corrects Incorrects
Mack (Group 1) 913 71.4 91.45 73.2
Thomas 918 73.9 94.75 72.1
Natalie 96.1 71.9 93.6 72.85
Rachel 92.8 72.0 91.7 73.8
Darla (Group 2) 918 72.8 91.2 71.4
Penny 96.2 71.7 91.5 71.5
George 71.7 91.0 91.95 71.8
Hanna 92.9 71.8 91.65 78.0
J Behav Educ
123
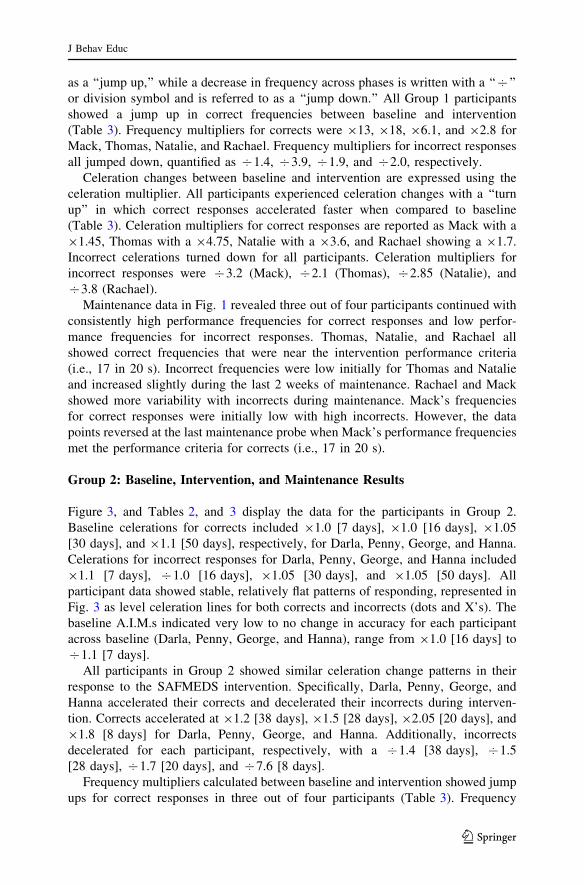
as a ‘‘jump up,’’ while a decrease in frequency across phases is written with a ‘‘7’’
or division symbol and is referred to as a ‘‘jump down.’’ All Group 1 participants
showed a jump up in correct frequencies between baseline and intervention
(Table 3). Frequency multipliers for corrects were 913, 918, 96.1, and 92.8 for
Mack, Thomas, Natalie, and Rachael. Frequency multipliers for incorrect responses
all jumped down, quantified as 71.4, 73.9, 71.9, and 72.0, respectively.
Celeration changes between baseline and intervention are expressed using the
celeration multiplier. All participants experienced celeration changes with a ‘‘turn
up’’ in which correct responses accelerated faster when compared to baseline
(Table 3). Celeration multipliers for correct responses are reported as Mack with a
91.45, Thomas with a 94.75, Natalie with a 93.6, and Rachael showing a 91.7.
Incorrect celerations turned down for all participants. Celeration multipliers for
incorrect responses were 73.2 (Mack), 72.1 (Thomas), 72.85 (Natalie), and
73.8 (Rachael).
Maintenance data in Fig. 1 revealed three out of four participants continued with
consistently high performance frequencies for correct responses and low perfor-
mance frequencies for incorrect responses. Thomas, Natalie, and Rachael all
showed correct frequencies that were near the intervention performance criteria
(i.e., 17 in 20 s). Incorrect frequencies were low initially for Thomas and Natalie
and increased slightly during the last 2 weeks of maintenance. Rachael and Mack
showed more variability with incorrects during maintenance. Mack’s frequencies
for correct responses were initially low with high incorrects. However, the data
points reversed at the last maintenance probe when Mack’s performance frequencies
met the performance criteria for corrects (i.e., 17 in 20 s).
Group 2: Baseline, Intervention, and Maintenance Results
Figure 3, and Tables 2, and 3 display the data for the participants in Group 2.
Baseline celerations for corrects included 91.0 [7 days], 91.0 [16 days], 91.05
[30 days], and 91.1 [50 days], respectively, for Darla, Penny, George, and Hanna.
Celerations for incorrect responses for Darla, Penny, George, and Hanna included
91.1 [7 days], 71.0 [16 days], 91.05 [30 days], and 91.05 [50 days]. All
participant data showed stable, relatively flat patterns of responding, represented in
Fig. 3 as level celeration lines for both corrects and incorrects (dots and X’s). The
baseline A.I.M.s indicated very low to no change in accuracy for each participant
across baseline (Darla, Penny, George, and Hanna), range from 91.0 [16 days] to
71.1 [7 days].
All participants in Group 2 showed similar celeration change patterns in their
response to the SAFMEDS intervention. Specifically, Darla, Penny, George, and
Hanna accelerated their corrects and decelerated their incorrects during interven-
tion. Corrects accelerated at 91.2 [38 days], 91.5 [28 days], 92.05 [20 days], and
91.8 [8 days] for Darla, Penny, George, and Hanna. Additionally, incorrects
decelerated for each participant, respectively, with a 71.4 [38 days], 71.5
[28 days], 71.7 [20 days], and 77.6 [8 days].
Frequency multipliers calculated between baseline and intervention showed jump
ups for correct responses in three out of four participants (Table 3). Frequency
J Behav Educ
123
multipliers for Group 2 were 918, 96.2, 71.7, and 92.9. George’s first three data
points in intervention revealed lower performance frequencies (for correct
responses) than during baseline, though George’s performance data quickly
accelerated across the fifth to final data point during intervention. Three out of
four participants exhibited a jump down for incorrects as soon as the SAFMEDS
intervention began. The frequency multipliers for incorrects for Darla, Penny, and
Hanna came to 72.8, 71.7, and 71.8. George’s incorrects did not jump up or
down between baseline and intervention showing a frequency multiplier of 91.0.
Celeration multipliers for Group 2 revealed the celeration changes between
baseline and intervention for Darla and Penny as modest changes for correct
responses, 91.2 and 91.5, and incorrect responses, 71.4 and 71.5. Hanna showed
modest changes for correct responses, 91.65, and a large change in the celerations
of incorrects from baseline to intervention, at a 78.0. George’s performance
illustrated a more pronounced effect with a celeration multiplier for corrects at
91.95 and a 71.8 celeration multiplier for incorrects.
All Group 2 participants had intervention A.I.M.s superior to baseline A.I.M.s
(Table 2). Darla’s A.I.M. changed from a baseline 71.1 [7 days] to 91.7 [38 days]
during intervention. Penny improved from a baseline A.I.M. of 91.0 [16 days] to
92.25 [28 days] in intervention. George changed from 91.0 [30 days] to 93.5
[20 days], and Hanna, who showed the most improvement in accuracy, increased
from 91.05 [50 days] in baseline to 913.7 [8 days] in intervention.
Figure 2 shows Darla to have had the most stable maintenance within Group 2.
Darla’s corrects and incorrects remained at or above the intervention performance
criteria (i.e., 17 correct and one or less incorrect in 20 s) across 4 weeks post-
intervention. The remaining Group 2 participants showed moderate-to-strong
maintenance. Penny and George maintained intervention level performance
frequencies across both corrects and incorrects in three out of four data points.
However, Hanna showed a moderate decline in performance across 4 weeks post-
intervention.
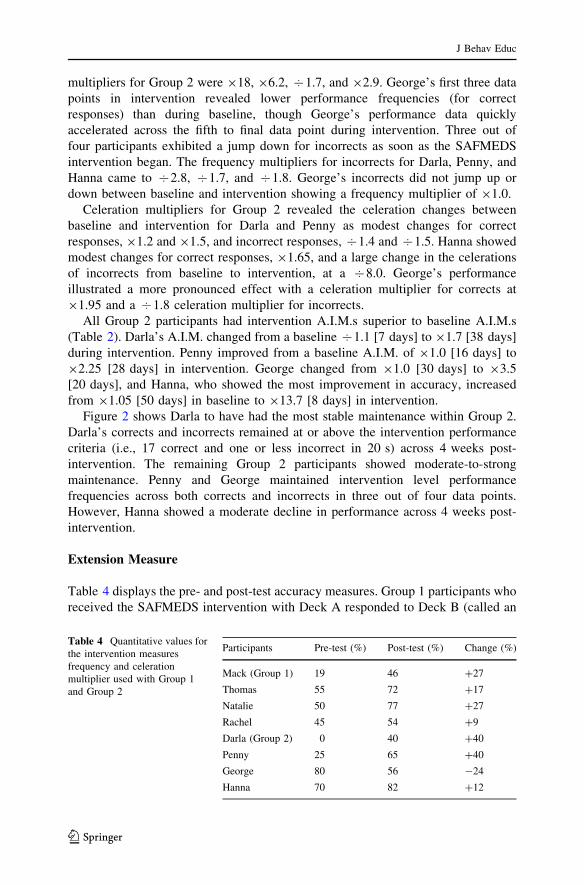
Extension Measure
Table 4 displays the pre- and post-test accuracy measures. Group 1 participants who
received the SAFMEDS intervention with Deck A responded to Deck B (called an
Table 4 Quantitative values for
the intervention measures
frequency and celeration
multiplier used with Group 1
and Group 2
Participants Pre-test (%) Post-test (%) Change (%)
Mack (Group 1) 19 46 ?27
Thomas 55 72 ?17
Natalie 50 77 ?27
Rachel 45 54 ?9
Darla (Group 2) 0 40 ?40
Penny 25 65 ?40
George 80 56 -24
Hanna 70 82 ?12
J Behav Educ
123
extension deck). Similarly, Group 2 participants who built frequency with Deck B
responded to Deck A. All of the participants in Group 1 showed gains in accuracy
from pre- to post-test (range of change = ?17 to ?27 %). Three out of four
participants in Group 2 also had gains in accuracy on the extensions deck (range of
change = -24 to ?40 %). Overall, seven out of eight participants had accuracy
gains with an extension deck of SAFMEDS.
Discussion
The clinical efficacy of intervention relies on the accurate and consistent detection
of behavior (Smith et al. 2013). All topographies and functions of behavior involve
movement. Therefore, the ability to reliably identify targets that fulfill the definition
of behavior forms an important goal for behavior analysts and special education
teachers. The present experiment directly examined whether practicing behavior
analysts and special education teachers could become fluent through the use of
SAFMEDS in identifying movement cycles, a Precision Teaching term for a
behavior (i.e., an active verb and object such as ‘‘shakes hand’’). The experiment
also investigated whether experimental effects would persist through time after the
intervention ended.
A multiprobe multiple baseline across participants design answered the
experimental questions for two groups of four participants each. A clear, evident
experimental effect occurs when performance changes only during the implemen-
tation of the intervention (Kazdin 2011). Both visual analysis and the quantitative
analysis of the Standard Celeration Chart segments provided the basis evaluation of
the present experiment.
The charted data reveal that for all participants, the incorrects were at a higher
level than the corrects during baseline. Additionally, five out of eight participants
had worsening conditions demonstrated by A.I.M. Two other participants had
A.I.M.s of 91.0 which meant their performance did not change. Only one
participant exhibited a gain of 91.05 for 50 days of baseline. A 5 % improvement
in accuracy over an almost 3-month period of baseline, however, does not indicate a
meaningful improvement. Furthermore, no one made a significant improvement
using movement cycle labels during baseline and the majority worsened consid-
erably across time.
Upon implementation of the intervention, all four participants in Group 1 had
substantial jump ups in frequency (range 92.8 to 918). Furthermore, the incorrects
indicated very abrupt jump downs in the amount of incorrects upon initiation of the
intervention (range 71.4 to 73.9). In Group 2, three out of the four participants
also showed very large, immediate performance jump ups for corrects (range 92.9
to 918) and jump downs for incorrects (range 71.7 to 72.8). Only George had a
jump down in corrects during the first day of the intervention with incorrects staying
the same. The evidence suggested SAFMEDS had an immediate, robust effect.
Participants said more correct and fewer incorrect movement cycles when seeing
picture cards representing active behavior.
J Behav Educ
123
While immediacy of effects speaks to the initial impact of the SAFMEDS
intervention, the subsequent celerations indicate whether the effect was sustained.
All eight participants had accelerating corrects (range from 91.2 to 93.4 or
20–240 % gain) and decelerating incorrects (from 71.4 to 77.6 or 29–87 %
reduction). The celerations, along with the notable A.I.M.s, provide visual and
quantitative evidence that very strong gains occurred in Group 1 and Group 2. Each
multiple baseline contains three replications of the SAFMEDS intervention. All
participants sustained their learning of identifying movement cycles. The data
suggest the frequency building combined with self-feedback as part of the
SAFMEDS intervention lead to a replicable, positive outcome.
Each group used a different but equivalent group of pictures of behavior and said
the movement cycle depicted on the SAFMEDS card. Because each group had
different decks with different pictures, the experiment showed SAFMEDS
producing the same effect twice in a counterbalanced fashion. Taken in whole,
the visual analysis and subsequent quantitative values support the use of SAFMEDS
for fostering behavioral fluency with the behavior analysts and special education
teachers in the experiment.
When people achieve behavioral fluency, an effect called retention occurs
(Kubina and Yurich 2012). Retention refers to the relation between two behavior
frequencies taken at two different points in time after an individual has not had
opportunity to emit the behavior (Binder 1996, 2005; Johnson and Layng 1996). A
number of experimental studies have demonstrated that fluent behavior persists at
high levels even after an intervention has been terminated (e.g., Bucklin et al. 2000;
Dermer et al. 2009; Hughes et al. 2007; Kubina et al. 2008). In the present
experiment, seven out of the eight participants had corrects which maintained a high
level after the intervention ended, supporting the finding that behavioral fluency
leads to a maintenance of stimulus control.
During maintenance, Mack showed the most variability with corrects and
incorrects. Because Mack had an illness precluding measurement of his first
maintenance point, he did not receive another measure until 2 weeks after the
intervention ended. His first and second maintenance points show the incorrects
rising with corrects falling. During the last measure of maintenance, Mack claimed
he remembered how to form movement cycles. It appeared that the main source of
variability was Mack not adding an ‘‘s’’ to the end of the action verb.
Examining the incorrects for maintenance, four participants had accelerating
trends (i.e., Thomas, Natalie, Darla, and Hanna). Mack, Rachel, Penny, and George
had a low level, or deceleration, of incorrects. After closely inspecting the incorrect
performance, the experimenters discovered a pattern among all the participants;
most incorrects the participants exhibited focused on the object part of the
movement cycle. For example, the picture depicting ‘‘places slinky’’ was identified
as ‘‘places toy.’’ Even though the participants used the proper action verb with an
‘‘s’’ and did say an object, the experimenters recorded an incorrect. The specificity
with the object label in a number of pictures was not retained even though the
participants did say an object in the generic form. Occasionally, the participants did
say the verb incorrectly. Nevertheless, all participants demonstrated the correct
movement cycle form in maintenance, defined as saying an observable action verb
J Behav Educ
123

in the present tense, choosing an object that ends the cycle of movement, and adding
an ‘‘s’’ to the action verb.
The extension measure for all participants reflected the previously discussed
finding. At the end of the experiment, participants from each group responded to a
novel deck of movement cycles. Seven out of eight participants demonstrated gains
in accurately responding to a new deck. Upon closer inspection, the incorrect
responses occurred on the side of the object. All participants had responses where
they used an active verb, present tense, and an object receiving the action. Meindl
et al. (2013) conducted an experiment and also found responses to novel decks not
positively affected by the SAFMEDS frequency-building intervention. Meindl et al.
incorporated multiple exemplar training and noted an improvement in regards to
accuracy. While Meindl et al. used definitions in their intervention different from
the pictures used in the present study, the discovery of multiple exemplar training
suggests another reason why participants did not do even better on the extension
decks; Deck A and Deck B did not have sufficient multiple exemplars which may
have led to better transfer.
Frequency building to a performance criterion (FBPC) has two parts, the process
of frequency building (i.e., timed repetition of performance and performance
feedback) and a frequency aim associated with the critical learning outcomes of
retention, endurance, and application (Kubina and Yurich 2012). In the present
experiment, all participants worked until they reached the performance criterion
suggested by Graf and Auman (2005) for SAFMEDS, 17 correct per 20 s. It took
one participant, Natalie, as little as 7 days to reach aim while Darla took the longest,
38 days. With all the participants attaining the performance criterion and in an
efficient manner and demonstrating strong maintenance, it appears the 17 correct
per 20 s represents a justifiable frequency aim.
The experimental literature shows SAFMEDS research has a very wide range of
applicability. As an example, in a sixth-grade class, SAFMEDS lessened the time
spent learning unit taxonomy and increased time working with specimens (e.g.,
kingdom, phyla, class; Clorfene et al. 1998). A SAFMEDS intervention also helped
students with mild disabilities pass minimal competency requirements for earning a
high school diploma (Byrnes et al. 1990). Using SAFMEDS also resulted in
university students becoming fluent with complex statistical information (Beverley
et al. 2009). The present study systematically extends the SAFMEDS database by
promoting fluency identifying movement cycles for behavior analysts and special
education teachers. The present study also replicated many of the critical learning
outcomes obtained in the previous studies: attainment of fluent responding with the
targeted subject matter, long-term retention, and extension to novel content.
Limitations
During the self-correction interval for participants, it became obvious that each
person started to improve, they required less time to go over incorrects. Participants
did not enjoy having to sit for 1 min when they only had one or no errors. The
imposed 1 min of feedback for all applications of frequency building may have
affected the social validity in terms of participant satisfaction with the methods. The
J Behav Educ
123
present study also assessed the dependent variable after the participants engaged in
the FBPC intervention. It is possible a priming effect occurred which led higher
performance frequencies compared to assessing the dependent variable before the
intervention.
Future Research
The present experiment demonstrated practicing behavior analysts and special
education teachers could become fluent identifying movement cycles when seeing
behavior portrayed on SAFMEDS cards. Future research could focus on the how
well behavior analysts use movement cycles to conduct functional assessments or
craft behavior plans. Additionally, continuing the search for the best active verbs
and using generic objects instead of specific targets (e.g., toy vs. transformer) may
produce more efficient outcomes. Determining how multiple exemplars further
support application to novel content could further advance the use of FBPC and
SAFMEDS to behaviors important to the science of behavior. And further
modifications to the frequency-building procedure may result in more substantial
maintenance. Finally, examining whether movement cycles represent superior
alternatives to operations definitions could impact detection and measurement of
behavior in both applied and experimental settings. Changing the static SAFMEDS
cards to dynamic videos depicting active movement may also lead to greater
outcomes.
References
Austin, J. L., & Bevan, D. (2011). Using differential reinforcement of low rates to reduce children’s
requests for teacher attention. Journal of Applied Behavior Analysis, 44, 451–461. doi:10.1901/jaba.
2011.44-451.
Bailey, D. B. (1984). Effects of lines of progress and semilogarithmic charts on ratings of charted data.
Journal of Applied Behavior Analysis, 17, 359–365.
Barlow, D. H., Nock, M. K., & Hersen, M. (2009). Single case experimental designs: Strategies for
studying behavior change (3rd ed.). Upper Saddle River, NJ: Pearson.
Berry, C., Brizee, A., & Angeli, E. (2010). Verbs with helpers: Present continuous action (Present
progressive). Retrieved from http://owl.english.purdue.edu/owl/resource/601/05/.
Beverley, M., Hughes, J. C., & Hastings, R. P. (2009). What’s the probability of that? Using SAFMEDS
to increase undergraduate success with statistical concepts. European Journal of Behavior Analysis,
10, 183–195.
Binder, C. (1996). Behavioral fluency: Evolution of a new paradigm. The Behavior Analyst, 19, 163–197.
Binder, C. (2005). Behavioral fluency. In M. Hersen, G. Sugai, & R. Horner (Eds.), Encyclopedia of
behavior modification and cognitive behavior therapy: Education applications (Vol. 3,
pp. 1185–1188). Thousand Oaks, CA: Sage.
Bucklin, B. R., Dickinson, A. M., & Brethower, D. M. (2000). A comparison of the effects of fluency
training and accuracy training on application and retention. Performance Improvement Quarterly,
13, 140–163.
Byrnes, M. E., Macfarlane, C. A., Young, K. R., & West, R. P. (1990). Using precision teaching to teach
minimum competency test skills. Teaching Exceptional Children, 22(4), 61.
Chapman, S. S., Ewing, C. B., & Mozzoni, M. P. (2005). Precision teaching and fluency training across
cognitive, physical, and academic tasks in children with traumatic brain injury: A multiple baseline
study. Behavioral Intervention, 20, 37–49.
J Behav Educ
123

Cihon, T. M., Sturtz, A. M., & Eshleman, J. (2012). The effects of instructor-provided or student-created
flashcards with weekly, one-minute timings on unit quiz scores in introduction to applied behavior
analysis courses. European Journal of Behavior Analysis, 13, 47–57.
Clorfene, J. B., Matsumoto, J., Bergman, M., Zhang, M., & Merbitz, C. (1998). Unexpected effects of
using SAFMEDS to teach taxonomy. Journal of Precision Teaching and Celeration, 15, 28–33.
Cooper, J. O., Heron, T. E., & Heward, W. L. (2007). Applied behavior analysis (2nd ed.). Upper Saddle
River, NJ: Pearson Prentice Hall.
Datchuk, S. M., & Kubina, R. M. (2011). Communicating experimental findings in single case design
research: How to use celeration values and celeration multipliers to measure direction, magnitude,
and change of slope. Journal of Precision Teaching and Celeration, 27, 3–17.
Datchuk, S. M., & Kubina, R. M. (2015). Effects of sentence combining intervention and frequency
building to a performance criterion on adolescents with difficulty constructing sentences. Journal of
Evidence Based Practices for Schools, 14, 160–185.
Datchuk, S. M., Kubina, R. M., & Mason, L. H. (2015). Effects of sentence instruction and frequency
building to a performance criterion on elementary-aged students with behavioral concerns and EBD.
Exceptionality: A Special Education Journal, 23, 34–53. doi:10.1080/09362835.2014.986604.
Dermer, M. L., Lopez, S. L., & Messling, P. A. (2009). Fluency training for a writing skill: Editing for
concision. The Psychological Record, 59, 3–20.
Fisher, W., Kelley, M., & Lomas, J. (2003). Visual aids and structured criteria for improving visual
inspection and interpretation of single-case designs. Journal of Applied Behavior Analysis, 36,
387–406.
Gast, D. L. (2010). Single subject research methodology in behavioral sciences. New York: Routledge.
Graf, S. A. (2008). Microsoft Excel template for the daily standard celeration chart (Computer software).
Youngstown, OH: Graf Implements.
Graf, S. A., & Auman, J. (2005). SAFMEDS: A tool to build fluency. Youngstown, OH: Graf Implements.
Graf, S., & Lindsley, O. (2002). Standard celeration charting 2002. Youngstown, OH: Graf Implements.
Hughes, J. C., Beverley, M., & Whitehead, J. (2007). Using precision teaching to increase the fluency of
word reading with problem readers. European Journal of Behavior Analysis, 8, 221–238.
Johnson, K. R., & Layng, T. V. J. (1996). On terms and procedures: Fluency. The Behavior Analyst, 19,
281–288.
Johnston, J. M., & Pennypacker, H. S. (2009). Strategies and tactics of behavioral research (3rd ed.).
New York: Routledge.
Kazdin, A. E. (2011). Single-case research designs: Methods for clinical and applied settings (2nd ed.).
New York: Oxford University Press.
Kennedy, C. H. (2005). Single-case designs for educational research. Boston, MA: Allyn & Bacon.
Kratochwill, T. R., Hitchcock, J. H., Horner, R. H., Levin, J. R., Odom, S. L., Rindskopf, D. M., et al.
(2013). Single-case intervention research design standards. Remedial and Special Education, 34,
26–34.
Kubina, R. M. (2005). The relationship between fluency, rate building and practice: A response to
Doughty, Chase, and O’Shields. The Behavior Analyst, 28, 73–76.
Kubina, R. M., Amato, J., Schwilk, C. L., & Therrien, W. J. (2008). Comparing performance standards on
the retention of words read correctly per minute. Journal of Behavioral Education, 17, 328–338.
Kubina, R. M., & Yurich, K. K. L. (2012). The precision teaching book. Lemont, PA: Greatness
Achieved.
Kunzelmann, H. P., Cohen, M. A., Hulten, W. J., Martin, G. L., & Mingo, A. R. (1970). Precision
teaching: An initial training sequence. Seattle, WA: Special Child Publications.
Language Dynamics. (2013). Simple present. Retrieved from http://www.englishpage.com/verbpage/
simplepresent.html.
Lindsley, O. R. (1991). From technical jargon to plain English for application. Journal of Applied
Behavior Analysis, 24, 449–458. doi:10.1901/jaba.1991.24-449.
Lindsley, O. R. (2005). Standard celeration chart system. In M. Hersen, G. Sugai, & R. Horner (Eds.),
Encyclopedia of behavior modification and cognitive behavior therapy. Volume III: Education
applications (pp. 1545–1548). Thousand Oaks, CA: Sage.
Malott, R. W., & Shane, J. T. (2014). Principles of behavior (7th ed.). Upper Saddle, NJ: Pearson.
Meindl, J. N., Ivy, J. W., Miller, N., Neef, N. A., & Williamson, R. L. (2013). An examination of stimulus
control in fluency-based strategies: SAFMEDS and generalization. Journal of Behavioral
Education, 22, 229–252.
J Behav Educ
123

Parsonson, B., & Baer, D. (1978). The analysis and presentation of graphic data. In T. Kratochwill (Ed.),
Single subject research (pp. 101–166). New York, NY: Academic Press.
Pennypacker, H. S., Gutierrez, A., & Lindsley, O. R. (2003). Handbook of the standard celeration chart.
Cambridge, MA: Cambridge Center for Behavioral Studies.
Skinner, B. F. (1938). The behavior of organisms: An experimental analysis. Cambridge, MA: B.F.
Skinner Foundation.
Smith, G. D., Lambert, J. V., & Moore, Z. (2013). Behavior description effect on accuracy and reliability.
The Journal of General Psychology, 140, 269–281. doi:10.1080/00221309.2013.818525.
Stocks, J. T., & Williams, M. (1995). Evaluation of single subject data using statistical hypothesis tests
versus visual inspection of charts with and without celeration lines. Journal of Social Services
Research, 20, 105–126.
Vargas, J. S. (2009). Behavior analysis for effective teaching. New York: Routledge.
J Behav Educ
123