developing banking system stability index for nigeria banking system... · developing banking...
TRANSCRIPT
CBN Journal of Applied Statistics Vol. 5 No.1 (June, 2014) 49
Developing Banking System Stability Index for Nigeria1
2Angela Sere-Ejembi, Ini S. Udom, Audu Salihu, Ngozi V. Atoi and Baba
N. Yaaba
This study constructed a banking system stability index (BSSI) for Nigeria, using a
combination of financial soundness indicators and macro-fundamentals. It applied
statistical and Conference Board Methodology normalisation processes on Nigeria’s
banking and macroeconomic data from 2007Q1 to 2012Q2. The resultant index
traced fairly well the episodes of crisis in the system over the study period. Hence,
the BSSI is capable of acting as an early warning mechanism of signaling fragility. It
could, therefore, be used as a complimentary regulatory policy tool to detect
potential threat to enable monetary authorities take timely pre-emptive policy
measures to avert crisis.
Key words: Banking system, stability index, macro-prudential analysis,
financial soundness indicators.
JEL Classification: E580, G01, G17, E65
1.0 Introduction
The Asian financial crisis of 1997- 98, and the 2008 global financial crisis that
originated from the United States of America have renewed efforts of
monetary authorities to search for more effective frameworks for monitoring
financial sector stability/fragility. Hence, more attention is being paid to
policy discussions in this direction. Most of these attributed the crisis largely
to excessive risk-taking by financial institutions and failure of regulation by
the regulatory authorities.
Observers ascribed this failure to the authorities‘ preference for micro-
prudential approaches, which only aim at preventing the costly failure of
individual financial institutions. The strategy lies in the common belief that
financial crisis occur randomly as a result of bad institutions failing, and
eventually the failure becoming systemic. However, experience has revealed a
different picture. Most recent crisis starts with a boom. During this period,
majority of the financial institutions appear healthy, but during burst almost
all appear sick.
1The views expressed herein are those of the authors and do not necessarily reflect the
position of the CBN. 2 The authors are from Statistics Department, Central Bank of Nigeria, Abuja, Nigeria
50 Developing Banking System Stability Index
for Nigeria Sere-Ejembi et al.
The notion that some financial institutions are safe, while others are not is not
consistent with a boom-burst cycle. Thus, a call for a gradual shift towards
macro-prudential approach in financial stability analysis arose. In contrast to
the micro-prudential approach, the macro-prudential emphasizes an all-
inclusive slant to monitoring stability of financial systems by observing
macroeconomic and market-based data, as well as qualitative and structural
information. Financial soundness indicators (FSIs) play a vital role in this
regard.
The International Monetary Fund (IMF) developed over forty FSIs as a new
concept in macro-prudential analysis and regulation. Nigeria‘s FSIs, which
release date from first quarter 2007, aim to serve as early warning signals of
vulnerabilities in the banking system, in order to prompt policymakers‘ pre-
emptive measures. However, for manageability, there is need to aggregate the
most salient FSIs and selected macroeconomic variables into a composite
index that would serve as a ―one-stop-shop‖ in detecting fragilities that may
have significant implications for financial system stability. Experts have
proposed various analytical tools and early warning indicators. There is,
however, no consensus on how to measure systemic fragility and which
explanatory variables to include in the model.
This study aims primarily, to construct a banking system stability index
(BSSI) for Nigeria using a set of selected statistically normalised FSIs and
macro-fundamentals. The index, though backward looking, will serve to
signal potential vulnerabilities in the system. In addition, there will be a
validation of the statistically normalised BSSI with the Conference Board
Methodology normalised BSSI to determine the authenticity of the derived
series. To achieve its objectives, this paper is structured into six sections.
Following the introduction is section two, which reviews relevant literature.
Section three presents the theoretical framework, while section four contains
the methodology for constructing the index and the validation procedure.
Section five reports the results, while the last section concludes the paper.
2.0 Theoretical Framework and Literature Review
2.1 Theoretical Framework
Micro and macro-prudential supervisions are interlinked. Macro-prudential
supervision cannot achieve its objective except it has some level of impact on
supervision at the micro-level. Similarly, micro-prudential supervision cannot
CBN Journal of Applied Statistics Vol. 5 No.1 (June, 2014) 51
effectively safeguard financial stability without adequately taking into account
the developments at the macro level. However, it is pertinent to look at the
theoretical literature on each level on its merit, in connection with
safeguarding and ensuring system stability.
The paradigm of micro-prudential supervision views that risks arise from
individual malfeasance. Therefore, micro-prudential regulation focuses on the
stability of the components of a financial system. The regulation seeks to
enhance the safety and soundness of individual financial institutions by
supervising and limiting the risk of distress. The principal focus is to protect
the clients of the institutions and mitigate the risk of contagion and the
subsequent negative externalities in terms of confidence in the overall
financial system. However, the fact that the financial system as a whole may
be exposed to common risks is not always fully taken into account.
The theory of micro-prudential regulation is, oftentimes, based on some
reasoning. Banks finance themselves with government-insured deposits. It has
been argued that deposit insurance could effectively prevent runs (Bryant
(1980) and Diamond and Dybvig (1983)). However, it could induce or create
opportunities for bank managers to take excessive risks, knowing fully well
that losses will be borne by the taxpayer. Interestingly, if the probability of the
deposit insurer to bear losses is minimized to a considerable low level, micro-
prudential regulation tends to have achieved its objective. The major objective
of capital regulation is to ensure that banks absorb losses internally, thus
protecting the deposit insurance fund and moderating any moral hazard. The
key to capital regulation is the presumption that a bank will take some
strategic actions to restore its capital ratio in the wake of losses.
Micro-prudential regulation has faced some other criticisms. For instance,
when a regulating institution revives a troubled bank to restore its capital
ratio, the regulator feels less concerned whether the bank adjusts via the
numerator or via the denominator—that is, by raising new capital or by
shrinking assets. Whichever method that is adopted, the bank‘s probability of
failure is restored to a tolerable level, which is the interest of the micro-
prudential regulator. Such indifference to the method of adjustment makes
sense if the focus is on a single troubled bank. If that bank chooses to shrink
its assets— perhaps by cutting down on lending or dispensing of its securities
or other assets —others could pick up the slack. This re-sounds the healthy
52 Developing Banking System Stability Index
for Nigeria Sere-Ejembi et al.
Darwinian process, whereby market share is transferred from weaker troubled
banks to their stronger peers.
However, if a large fraction of the financial system is in difficulty, a
simultaneous attempt by many to shrink assets is likely to have damaging
consequences on the economy. This introduces the down side effect of this
action with attendant weak economic growth. Basically, generalized asset
shrinkage has majorly two effects: credit-crunch and fire-sale. If banking
institutions shrink their assets by cutting down, on fresh loans, this reduces
investment and employment, with contractionary effect on the general
economy. Where the banks shrink their assets by dumping the same illiquid
securities (as in the case of toxic mortgage-backed securities in the US) the
prices of these securities will fall sharply.
The ―fire sale‖ situation was described by Shleifer and Robert (2010).
However, the fire-sale and credit-crunch effects are interrelated (Diamond and
Raghuram (2009), Shleifer and Robert (2010) and Stein (2010)). For instance,
if the price of a toxic mortgage security drops to the point where it offers a
(risk adjusted) 20 per cent rate of return to a prospective buyer, this will tend
to increase the rate on new loans by 20 per cent as well—since from the
perspective of an intermediary that can choose to either make new loans or
buy distressed securities, the expected rate of return on the two must be
equalized. In other words, in market equilibrium, the real costs of fire sales
manifest themselves in the further deepening of credit crunches. Naturally,
raising new capital is the generally preferred option. However, it is rather
difficult for a troubled bank to convince its investors that the drive to shore-up
is led by prospects for the future, rather than problems of the past.
The characteristic of macro-prudential regulation is its emphasis on the system
as an entity. Macro-prudential regulation aims to identify macroeconomic
risks in the economy (including macro-economic imbalances) and in the
financial system, which may have implications for the stability of the system
as a whole, and where necessary, advise on measures, which could be taken to
address these risks. Undoubtedly, risks to the financial system could arise in
principle, from the failure of one financial institution alone if, as in oligopoly,
it is large enough in the country and/or with multiple branches/subsidiaries in
other countries. However, the much more important systemic risk arises from
a common exposure of many financial institutions to the same risk factors.
CBN Journal of Applied Statistics Vol. 5 No.1 (June, 2014) 53
On theoretical grounds, it has been argued that macro-prudential regulation
combines both ―externalities paradigm‖ and ―mood swings paradigm‖. The
externalities paradigm dwells on the ―pecuniary externality‖. This occurs
when the action or otherwise of an economic agent affects another through the
effects on the price channel. According to Greenwald and Stiglitz (1986), if
imbalances like incomplete markets or information asymmetry exist in an
economy, policy intervention would make everyone better off in a Pareto
efficiency sense.
In Keynes (1936) mood swings paradigm, animal spirits, which cause excess
optimism in good times and sudden risk retrenchment on the down side,
influence the behaviour of financial institutions' managers. As a result, pricing
signals in financial markets may be inefficient, increasing the likelihood of
systemic distress. In this instance, the call for a macro-prudential regulator is
certainly justified.
Drawing from above paradigms, it is appropriate to characterize the macro-
prudential approach as an effort to control the social costs associated with
excessive balance-sheet shrinkage on the part of multiple financial institutions
if hit with a common shock. It is in this light, especially in the aftermath of the
series of financial crisis that rocked the past two decades, that there is a
growth in consensus towards macro-prudential perspectives. These
perspectives rightly build macro financial models that link financial stability
and performance of the economy that underscore systemic risk analysis, while
assessing the exposure and risks to contagion.
2.2 Literature Review
There have been remarkable efforts since the Asian financial crisis to build
models of early warning signals of distress by examining the causes of the
crisis as well as measures of financial stability. These efforts were further
heightened by the recent US-triggered financial tsunami. Kaminsky and
Reinhart (1998) developed a model to detect currency and banking crises.
They used the ―signal extraction approach‖, which involves mainly the
construction of a zero-one binary variable, where zero signifies no-crisis and
one implies crisis. They identified 105 possible indicators that might indicate
the possibility of crisis, but recognized 43 critical. Prominent among these are
credit growth, international reserves, inflation and real gross domestic
product. However, according to Nicholas and Isabel (2010) the disadvantages
of binary variables are that they are less informative and are useful only in
54 Developing Banking System Stability Index
for Nigeria Sere-Ejembi et al.
assessing the condition of the domestic banking sector. The absence of full-
blown crisis locally does not always imply that the sector is completely crisis-
free.
Prior to the emergence of the Asian financial crisis, Doguwa (1996) proposed
alternative early warning models for identifying problem banks in Nigeria
using logit-analytic technique and financial ratios. The two separate models
developed for commercial and merchant banks were found to be more
efficient than earlier failure prediction models. The results revealed those
banks that were known to be distressed and further identified the banks that
were at the verge. However, during the period of the study the exposure of
Nigerian banks to the external financial system was largely limited.
Demirguc-Kunt and Detragiache (1998) used a multivariate logit model of
banking crisis to monitor banking sector fragility. The study identified that a
group of variables, including macroeconomic, characteristics of the banking
sector and structural characteristics of the country were robustly correlated
with the emergence of banking sector crisis. The multivariate logit framework
used historical incidents of previous crises over a cross-section of countries
and time to identify a set of indicators, which would signal the likelihood of
future problems. By and large, these models have been found to have real, but
limited out-of-sample predictive power.
However, Jide (2003) designed an early-warning bank failure model to
capture the dynamic process underlying the transition of the banks from
soundness to closure, utilizing a transition probability matrix. He used
―Instrumental Variables-Generalized Maximum Entropy formalism‖ to assess
the likelihood of the banking sector experiencing distress via the evaluation of
banking crisis probabilities. The framework is also used to assess the impact
of hypothetical, but plausible macroeconomic and bank-specific shocks on the
stability of the commercial banking sector over the medium-term. The
informational approach performed well even when data was limited, ill-
conditioned or when explanatory variables were highly correlated, making it
an acceptable framework for the evaluation of bank failure dynamics.
In macro-prudential regulatory frameworks, rather than depend on individual
and possibly fragmented indicators of financial crisis, a number of authors
have succeeded in developing one-stop indices that serve as signals. The
indices combine both domestic and external macroeconomic variables. Illing
CBN Journal of Applied Statistics Vol. 5 No.1 (June, 2014) 55
and Liu (2003) developed a Financial Stress Index for the Canadian financial
system. The index provided a single measure of macroeconomic financial
stress, which they allowed to vary over a continuum of values, where extreme
values reflect crises. The study conducted a survey on Canadian policy-
makers and economists, whose responses fed into the model to determine the
events that were most stressful for Canada.
Van den End (2006) advanced a financial stability condition index for the
Netherlands. This index incorporated interest rates, effective exchange rate,
real estate and stock prices, solvency of the financial institutions, as well as
volatility of the stock index of financial institutions. Gersl and Hermanek
(2006) also constructed an aggregate financial stability indicator based on the
values of the IMF‘s core FSIs for the Czech National Bank. Similarly, the
Central Bank of the Republic of Turkey (2006) constructed a financial
strength index. The bank used six sub-indices covering capital adequacy, asset
quality, liquidity, profitability, foreign exchange and interest rate risks.
On their own part, Wong et al (2007) used quarterly data spanning from the
second quarter of 1990 to the first quarter of 2007 for eleven Asia-Pacific
economies to identify and validate the key indicators of banking distress in the
countries. They found that asset-price misalignment, default risk of
commercial banks and the non-financial corporate sector as well as growth of
real credit to the private sector were significant leading indicators. Economic
growth, inflation and the ratio of short-term external debt to international
reserves were found to be important determinants.
During the global financial tsunami, Cardarelli, Elekdag and Lall (2008)
presented a financial stress index to signal the episodes of financial stress.
They adopted an equal-variance weighted average of seven variables
associated with stock market returns, foreign exchange, sovereign debt,
international reserves and the risk, liquidity and profitability of the banking
system. They applied statistical standardization to the variables and then
summed up the individual components using weighted averages to arrive at
the aggregate financial stress index.
Albulescu (2010) constructed an aggregate stability index for the Romanian
financial system. The index composed of developments in the financial
system, vulnerability, soundness and international economic climate
indicators. The approach followed first, the normalization of the values of the
indicators and thereafter aggregation of the normalized variables, which then
56 Developing Banking System Stability Index
for Nigeria Sere-Ejembi et al.
summed up into a chain index. Meanwhile, Verlis (2010) developed an
aggregate financial stability index for Jamaica using banking system quarterly
data over the period 1997 to March 2010. This index aggregated
microeconomic, macroeconomic and international factors indicative of
banking sector performance into a single measure of financial stability. The
index was successful in capturing key periods of financial instability during
the sample period. The Swiss National Bank (2012) developed a composite
stress index that combined several variables that could represent symptoms of
stress in the banking sector. These include banks‘ profitability and capital
base, amongst others, which Hanschel and Monnin (2005) had included also
in their study to determine the level of stress experienced by the banking
sector at a given period.
This paper adapts the Nicholas and Isabel (2010) approach to constructing the
BSSI for Nigeria. The approach combines banking soundness, vulnerabilities
in the macro-economy and the influence of the external financial environment.
In furtherance, this paper validated the derived index using the Conference
Board Methodology (CBM), in addition to statistical normalization. Secondly,
the weights of the index components were derived empirically, as opposed to
the calibration method of Nicholas and Isabel (2010).
The concept of FSIs grew out of the need for better data and apparatus to
gauge financial risks and vulnerabilities in national financial systems.
Monetary statistics that has always been the interest of the IMF do not provide
soundness and risk information. This information, however, is primarily
available to national supervisors and focuses on the strength of individual
banks. Besides, relating individual bank information to information for the
sector was cumbersome. However, supervision needed to grow in parallel
with the increasing interconnectedness of the global system. The contagion
effect of the Asian crisis further underlined the imperativeness to think out of
the box and shift from micro to macro-prudential approaches.
In line with this obvious challenge, the IMF met with relevant bodies in 1999
to brainstorm on the types of information needed to assess aggregate
soundness, risk and vulnerability, as well as data availability. The meeting
identified a number of important indicators that should be compiled. In the
mid-2000s, the IMF conducted a survey on the use, compilation, and
dissemination of macro-prudential indicators to address the dichotomies in the
models for compiling the identified indicators. The responses from over 100
CBN Journal of Applied Statistics Vol. 5 No.1 (June, 2014) 57
countries helped to identify a set of core FSIs that all countries should compile
and an encouraged set that countries may wish to compile, depending on
national circumstances.
Against this backdrop, the Fund published the 2006 IMF-FSIs Compilation
Guide. The Guide provides the concepts, definitions, sources and techniques
for the compilation and dissemination of internally consistent, cross-country
comparable sets of indicators that could provide information about the current
status of the financial system as an aggregate entity. The Guide combines
elements of macroeconomic frameworks, incorporating monetary statistics,
banks‘ supervisory framework and international financial accounting
standards. The IMF then launched a voluntary Coordinated Compilation
Exercise (CCE) in which sixty-two systematically selected countries
participated. The CCE developed the capacity of member countries to compile
the FSIs. The ultimate aim is to enhance transparency and strengthen the
discipline of financial institutions of the member countries.
Contributing to empirical literature on warning signals, Bell and Pain (2000)
contended that outcomes from signaling and multinomial regression
approaches of measuring financial stability put forward that macroeconomic
issues tend to be connected with an increased probability of a banking crisis.
These include high real interest rates, low output growth, rapid domestic
credit growth, falls in the terms of trade and high inflation. Kaminsky (2003)
while examining crisis episodes for twenty industrial and developing countries
using a variety of macroeconomic and financial indicators concluded that
crises have not been created equal. Crises were found to be of six varieties,
with all of them indicating the efficacy of macro approaches in their
identification. Four of these varieties were associated with domestic economic
fragility, with vulnerabilities related to current account deterioration, financial
excesses, or foreign debt unsustainability. However, crisis could also be
triggered by adverse world market conditions, such as the reversal of
international capital flows. He identified sudden-stop phenomenon as the fifth
cause. Finally, crises also happen in economies with ideal fundamentals.
Accordingly, the last variety of crisis was labeled self-fulfilling.
Nonetheless, Nelson and Perli (2005) expounded that despite the different
causes of financial crises, key financial variables behave in very similar ways
during such periods. In particular, risk, liquidity, term spreads and implied
volatilities all move significantly higher at those times. They argued that ―as
58 Developing Banking System Stability Index
for Nigeria Sere-Ejembi et al.
suggested by economic theory, expected yields on risky debt instruments and
equities relative to those on riskless assets vary with investors‘ assessments of
risk and willingness to bear risk‖. Thus, spreads between the yields on
securities widen when investors judge their relative risks to have increased. A
sharp widening of these spreads has often been a component of financial
turmoil.
As a result of the acknowledged drawbacks in the use of individual variables
and bank ratios, Gadanecz and Jayaram (2009) identified some central banks
that now make use of composite measures to reflect banking stability or
fragility. These include the Czech National Bank, the Swiss National Bank,
the Hong Kong Monetary Authority and the Central Bank of Turkey.
3.0 Methodology and Data
3.1 Derivation of Banking System Stability Index
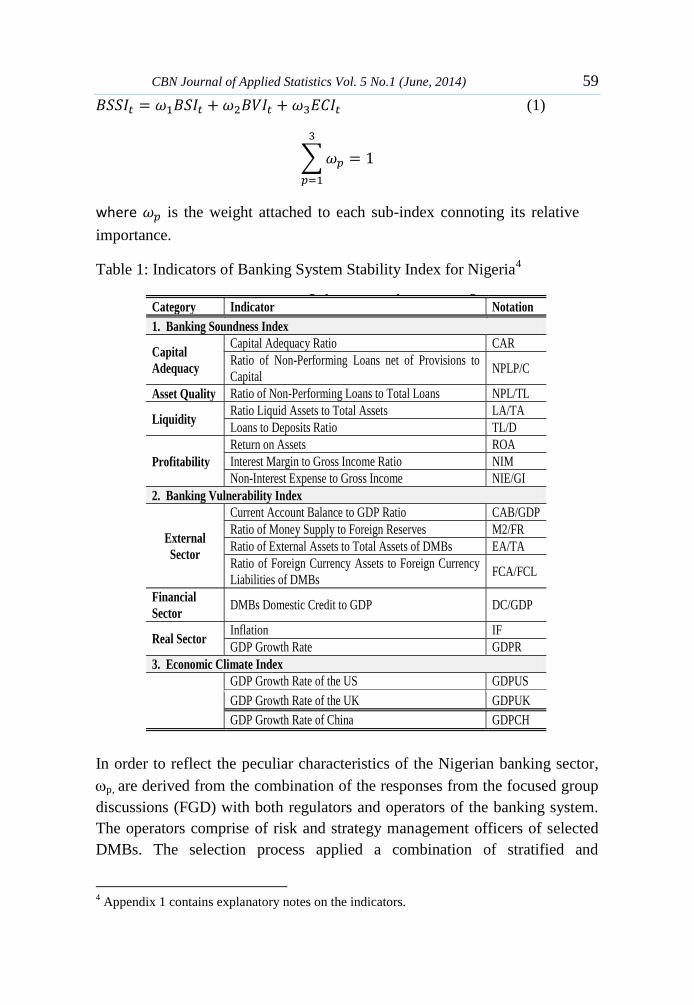
The compilation of FSIs follows strictly the IMF-FSIs Compilation Guide
2006. Based on Nicholas and Isabel (2010) and the framework for IMF-FSIs3,
the following indicators are identified for the construction of the BSSI for
Nigeria (Table 1). The indicators are grouped into three, Banking Soundness
Index (BSI), Banking Vulnerability Index (BVI) and Economic Climate Index
(ECI).
Banking Vulnerability Index focuses mainly on critical areas that mirror
macro-fundamentals, vis-à-vis the external sector (the balance of payments,
with emphasis on the current account), financial as well as real sectors.
Economic Climate Index largely reflects the performance of the country‘s
major trading partners, vis-à-vis USA, UK and China, which account for
approximately 40 per cent of external trade. It seeks to evaluate the perception
of exposure of the banking system to the vagaries of these economies.
Following Nicholas and Isabel (2010), the indicators of banking system
stability require normalization so as to put them on a common scale. The
study used both statistical and CBM normalization.
Using the statistical method, the BSSI is obtained by computing the weighted
averages of the three sub-indices that emerged from the normalization
process; namely:
3IMF framework is commonly used in the literature for early warning signals (EWS)
CBN Journal of Applied Statistics Vol. 5 No.1 (June, 2014) 59
(1)
∑
where is the weight attached to each sub-index connoting its relative
importance.
Table 1: Indicators of Banking System Stability Index for Nigeria4
In order to reflect the peculiar characteristics of the Nigerian banking sector,
p, are derived from the combination of the responses from the focused group
discussions (FGD) with both regulators and operators of the banking system.
The operators comprise of risk and strategy management officers of selected
DMBs. The selection process applied a combination of stratified and
4 Appendix 1 contains explanatory notes on the indicators.
Table 1: Indicators of Banking System Stability Index for Nigeria1
Category Indicator Notation
1. Banking Soundness Index
Capital
Adequacy
Capital Adequacy Ratio CAR
Ratio of Non-Performing Loans net of Provisions to
Capital NPLP/C
Asset Quality Ratio of Non-Performing Loans to Total Loans NPL/TL
Liquidity Ratio Liquid Assets to Total Assets LA/TA
Loans to Deposits Ratio TL/D
Profitability
Return on Assets ROA
Interest Margin to Gross Income Ratio NIM
Non-Interest Expense to Gross Income NIE/GI
2. Banking Vulnerability Index
External
Sector
Current Account Balance to GDP Ratio CAB/GDP
Ratio of Money Supply to Foreign Reserves M2/FR
Ratio of External Assets to Total Assets of DMBs EA/TA
Ratio of Foreign Currency Assets to Foreign Currency
Liabilities of DMBs FCA/FCL
Financial
Sector DMBs Domestic Credit to GDP DC/GDP
Real Sector Inflation IF
GDP Growth Rate GDPR
3. Economic Climate Index
GDP Growth Rate of the US GDPUS
GDP Growth Rate of the UK GDPUK
GDP Growth Rate of China GDPCH
1 Appendix 1 contains explanatory notes on the indicators.
60 Developing Banking System Stability Index
for Nigeria Sere-Ejembi et al.
purposive sampling methodology, whereby the DMBs were stratified by:
randomised big, randomised small, foreign, bridge and non-interest.
Representatives were selected from each stratum, while the biggest (by total
assets) three were purposively included. Thus, 16 DMBs participated. The
regulators included the Deputy Governors and Directors of the relevant
departments of the CBN.
Statistical normalization converts indicators to a common scale with a mean
of zero and standard deviation of one. The zero average avoids introducing
aggregation distortions arising from differences in the means of the indicators.
The scaling factor is the standard deviation. The formula is given as:
(
) (2)
where Xt represents the value of indicators X during period t; µ is the mean
and σ is the standard deviation.
The BSSI is derived through double weighting:
∑
∑
∑
∑
Ztr are the statistically normalized values of the indicators of banking system
stability, ‗s‘ relates to the BSI, ‗v‘ to BVI and ‗c‘ to ECI. The weight of the
individual statistically normalized indicator in each sub-index:
∑
[ ] (4)
Where ui are responses that returned ―high‖ in the consolidated responses
from the FGD and U is the number of indicators in each sub-index. Therefore:
CBN Journal of Applied Statistics Vol. 5 No.1 (June, 2014) 61
∑
∑
∑
Using the Conference Board Methodology normalization process, the BSSI is
derived as:
The weights ωr are as defined under statistical normalisation.
( ) are the CBM normalized values of the indicators of the
banking system stability. To derive , the CBM normalisation uses quarter-
on-quarter symmetric change which is computed as follows:
( )
5
t - time (quarter in the review period,
q – specific indicator of interest
Now, let us consider σq as the standard deviation. These statistical measures
are inverted: (
).
The sums are then calculated to derive: ∑
.
The statistical measures are further restated as adjusted volatility measures Rq,
where
5
( )
62 Developing Banking System Stability Index
for Nigeria Sere-Ejembi et al.
(∑
)
⁄
Such that ∑
Thus, the adjusted quarter-to-quarter symmetric change for quarter t and
indicator X1 represented as Ptq is given as:
(11)
The total of the indicators of the adjusted quarter-to-quarter symmetric change
St in quarter t can then be presented as:
∑
n – number of indicators in the sub-index
The initial indicator in the series (t = 1) denoted as L1 is given by CBM as:
[ ]
The sequential level of the series then obtained through iteration for the period
t = 2, 3,...,T, denoted by Ltr in the following format:
{
Therefore, the BSSI using statistical normalisation has 0 as threshold, while
the CBM has 1. The CBN, the United States Bureau of Economic Analysis
and the National Bureau of Statistics of China serve as sources of data.
CBN Journal of Applied Statistics Vol. 5 No.1 (June, 2014) 63
Therefore, the BSSI using statistical normalisation has 0 as threshold, while
the CBM has 1. The CBN, the United States Bureau of Economic Analysis
and the National Bureau of Statistics of China serve as sources of data.
4.0 Interpretation of Results and Applicability of the BSSI
4.1 Interpretation of the BSSI
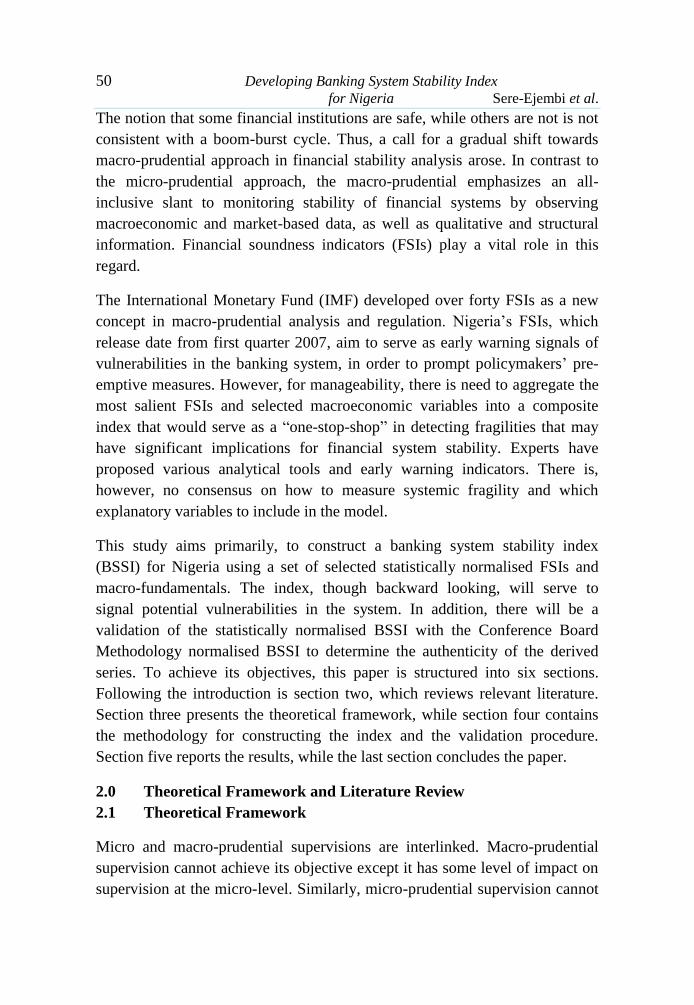
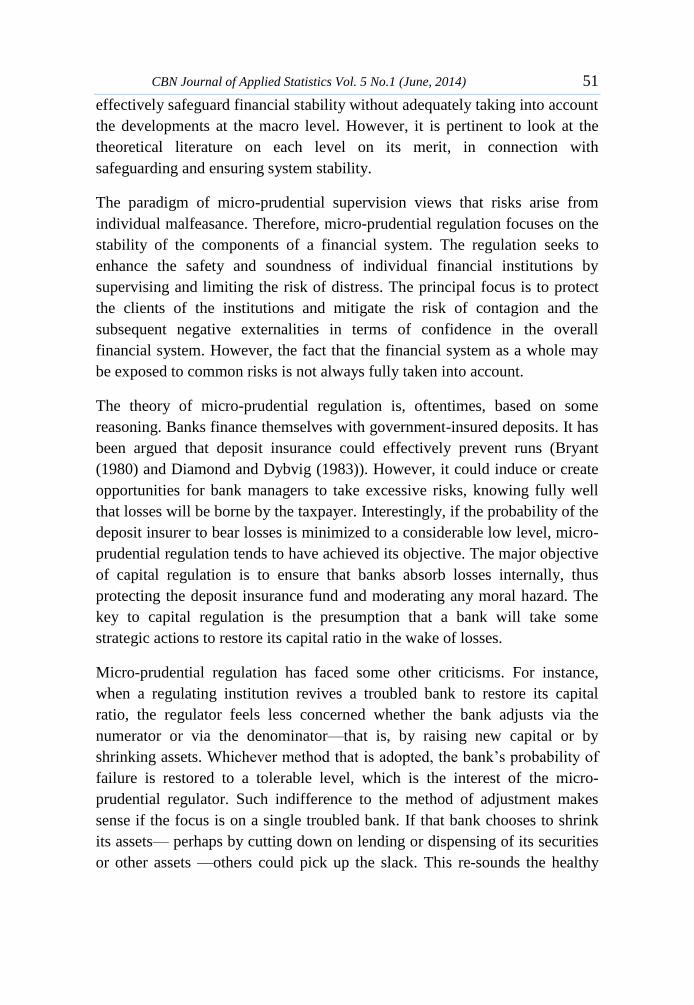
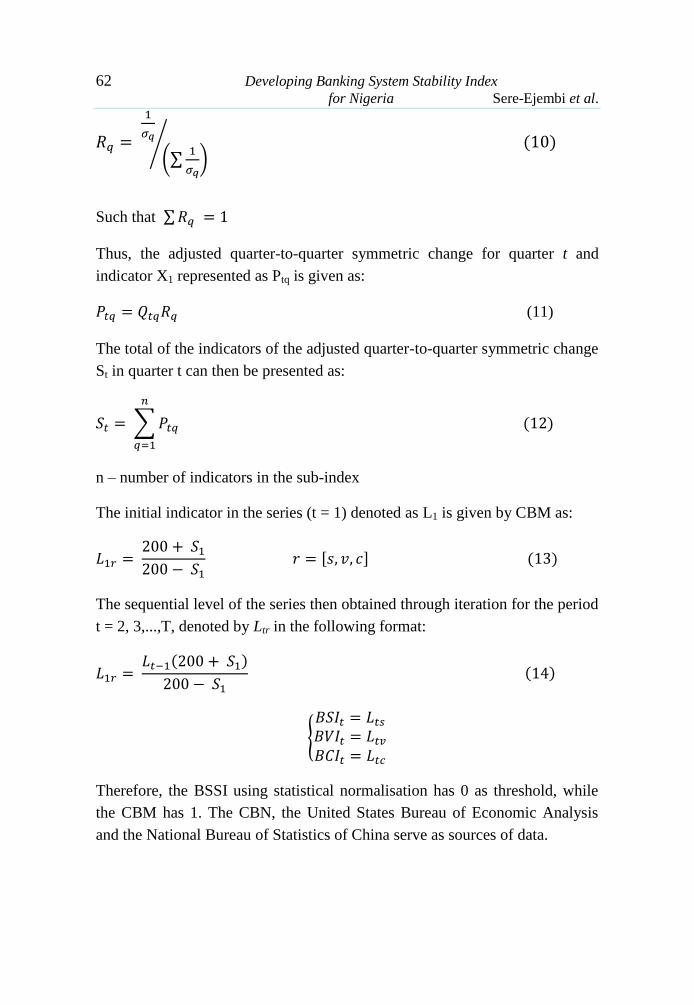
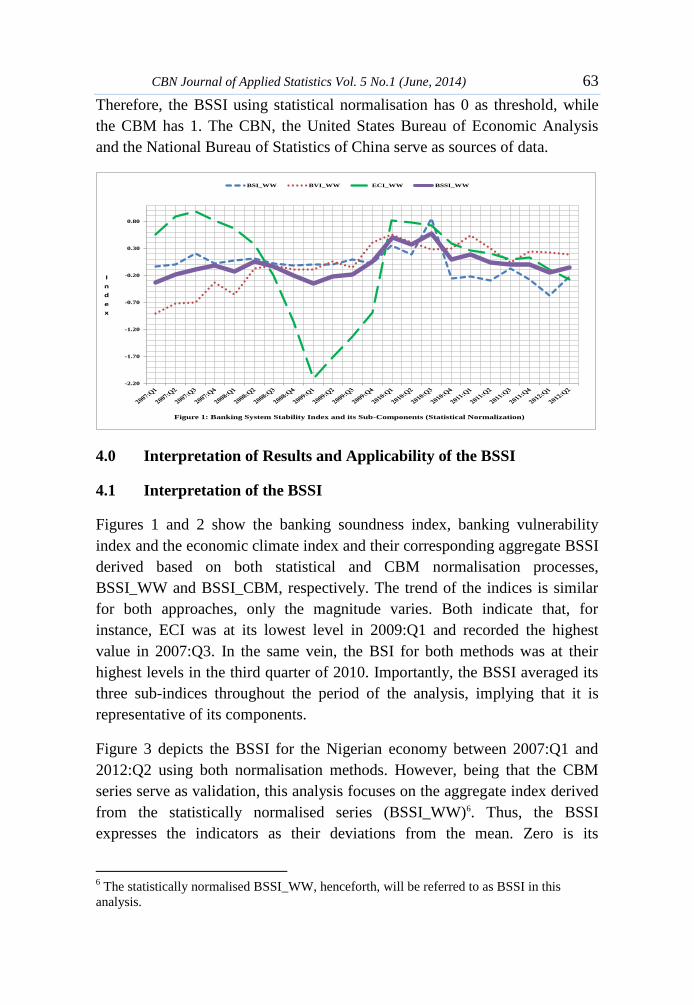
Figures 1 and 2 show the banking soundness index, banking vulnerability
index and the economic climate index and their corresponding aggregate BSSI
derived based on both statistical and CBM normalisation processes,
BSSI_WW and BSSI_CBM, respectively. The trend of the indices is similar
for both approaches, only the magnitude varies. Both indicate that, for
instance, ECI was at its lowest level in 2009:Q1 and recorded the highest
value in 2007:Q3. In the same vein, the BSI for both methods was at their
highest levels in the third quarter of 2010. Importantly, the BSSI averaged its
three sub-indices throughout the period of the analysis, implying that it is
representative of its components.
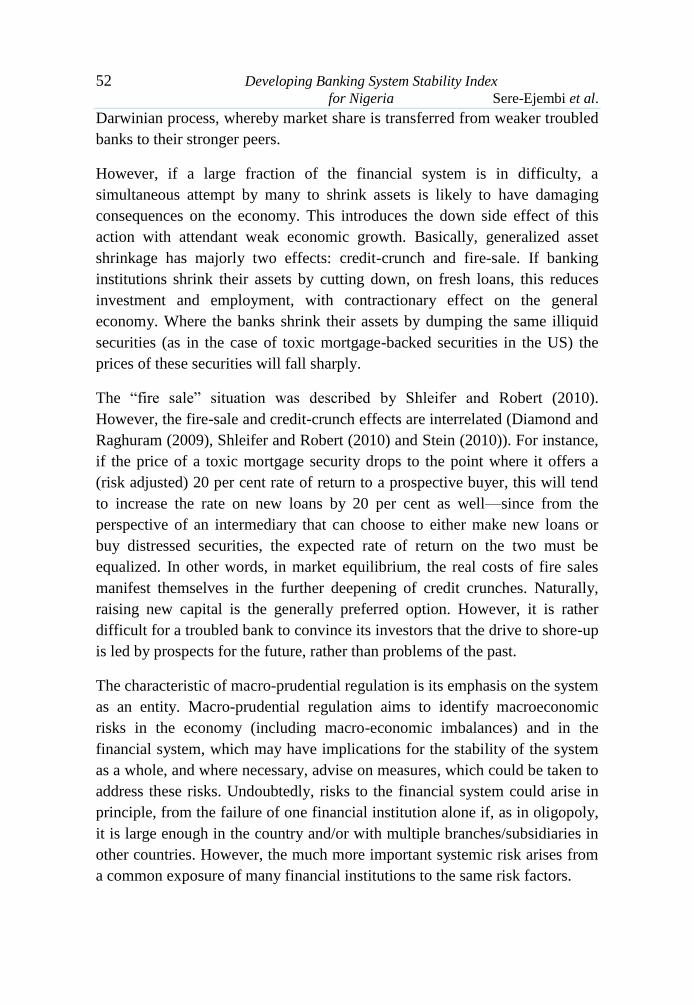
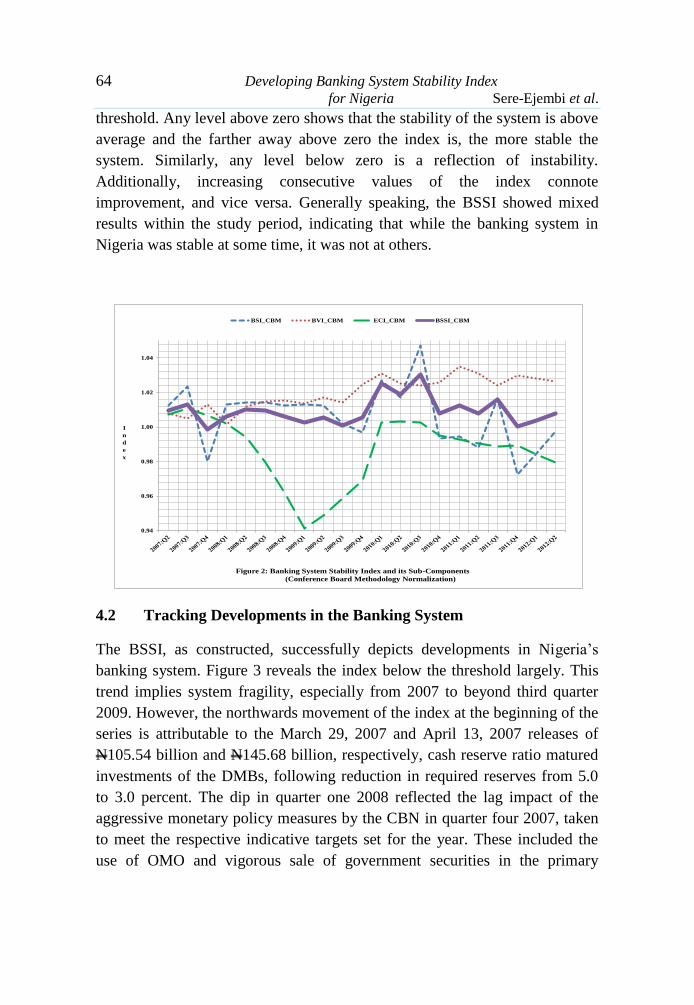
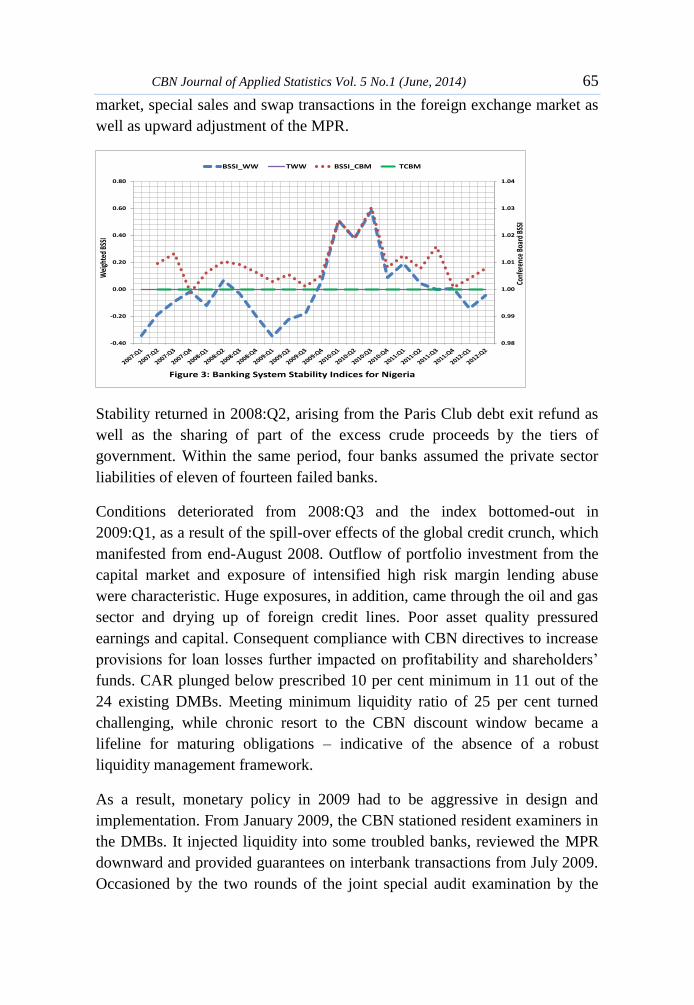
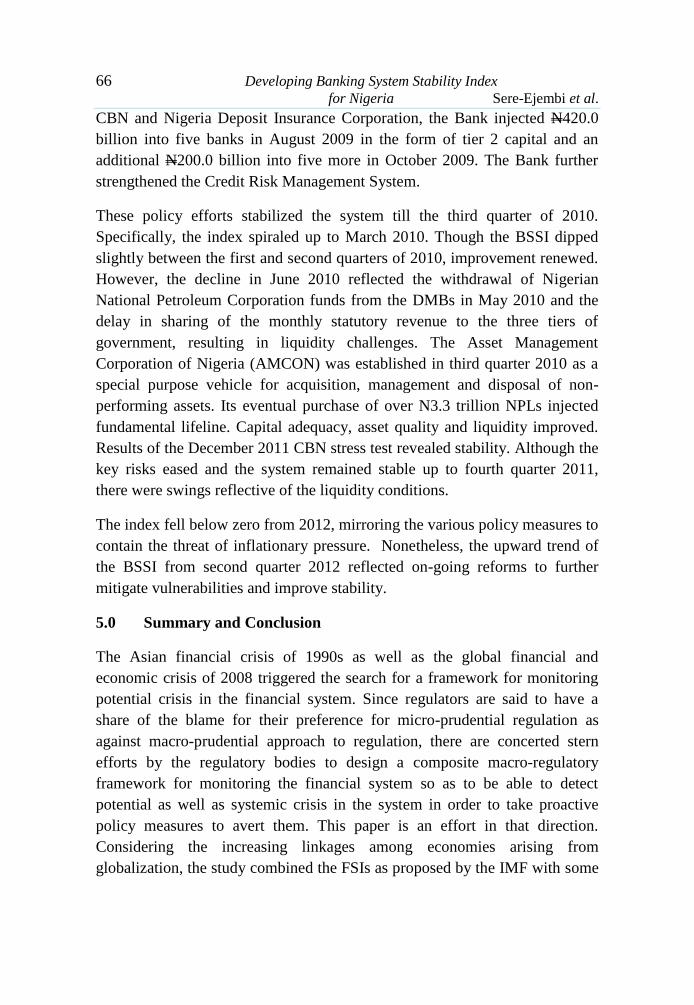
Figure 3 depicts the BSSI for the Nigerian economy between 2007:Q1 and
2012:Q2 using both normalisation methods. However, being that the CBM
series serve as validation, this analysis focuses on the aggregate index derived
from the statistically normalised series (BSSI_WW)6. Thus, the BSSI
expresses the indicators as their deviations from the mean. Zero is its
6 The statistically normalised BSSI_WW, henceforth, will be referred to as BSSI in this
analysis.
-2.20
-1.70
-1.20
-0.70
-0.20
0.30
0.80
I
n
d
e
x
Figure 1: Banking System Stability Index and its Sub-Components (Statistical Normalization)
BSI_WW BVI_WW ECI_WW BSSI_WW
64 Developing Banking System Stability Index
for Nigeria Sere-Ejembi et al.
threshold. Any level above zero shows that the stability of the system is above
average and the farther away above zero the index is, the more stable the
system. Similarly, any level below zero is a reflection of instability.
Additionally, increasing consecutive values of the index connote
improvement, and vice versa. Generally speaking, the BSSI showed mixed
results within the study period, indicating that while the banking system in
Nigeria was stable at some time, it was not at others.
4.2 Tracking Developments in the Banking System
The BSSI, as constructed, successfully depicts developments in Nigeria‘s
banking system. Figure 3 reveals the index below the threshold largely. This
trend implies system fragility, especially from 2007 to beyond third quarter
2009. However, the northwards movement of the index at the beginning of the
series is attributable to the March 29, 2007 and April 13, 2007 releases of
N105.54 billion and N145.68 billion, respectively, cash reserve ratio matured
investments of the DMBs, following reduction in required reserves from 5.0
to 3.0 percent. The dip in quarter one 2008 reflected the lag impact of the
aggressive monetary policy measures by the CBN in quarter four 2007, taken
to meet the respective indicative targets set for the year. These included the
use of OMO and vigorous sale of government securities in the primary
0.94
0.96
0.98
1.00
1.02
1.04
I
n
d
e
x
Figure 2: Banking System Stability Index and its Sub-Components
(Conference Board Methodology Normalization)
BSI_CBM BVI_CBM ECI_CBM BSSI_CBM
CBN Journal of Applied Statistics Vol. 5 No.1 (June, 2014) 65
market, special sales and swap transactions in the foreign exchange market as
well as upward adjustment of the MPR.
Stability returned in 2008:Q2, arising from the Paris Club debt exit refund as
well as the sharing of part of the excess crude proceeds by the tiers of
government. Within the same period, four banks assumed the private sector
liabilities of eleven of fourteen failed banks.
Conditions deteriorated from 2008:Q3 and the index bottomed-out in
2009:Q1, as a result of the spill-over effects of the global credit crunch, which
manifested from end-August 2008. Outflow of portfolio investment from the
capital market and exposure of intensified high risk margin lending abuse
were characteristic. Huge exposures, in addition, came through the oil and gas
sector and drying up of foreign credit lines. Poor asset quality pressured
earnings and capital. Consequent compliance with CBN directives to increase
provisions for loan losses further impacted on profitability and shareholders‘
funds. CAR plunged below prescribed 10 per cent minimum in 11 out of the
24 existing DMBs. Meeting minimum liquidity ratio of 25 per cent turned
challenging, while chronic resort to the CBN discount window became a
lifeline for maturing obligations – indicative of the absence of a robust
liquidity management framework.
As a result, monetary policy in 2009 had to be aggressive in design and
implementation. From January 2009, the CBN stationed resident examiners in
the DMBs. It injected liquidity into some troubled banks, reviewed the MPR
downward and provided guarantees on interbank transactions from July 2009.
Occasioned by the two rounds of the joint special audit examination by the
0.98
0.99
1.00
1.01
1.02
1.03
1.04
-0.40
-0.20
0.00
0.20
0.40
0.60
0.80
Conf
eren
ce B
oard
BSS
I
Wei
ghte
d BS
SI
Figure 3: Banking System Stability Indices for Nigeria
BSSI_WW TWW BSSI_CBM TCBM
66 Developing Banking System Stability Index
for Nigeria Sere-Ejembi et al.
CBN and Nigeria Deposit Insurance Corporation, the Bank injected N420.0
billion into five banks in August 2009 in the form of tier 2 capital and an
additional N200.0 billion into five more in October 2009. The Bank further
strengthened the Credit Risk Management System.
These policy efforts stabilized the system till the third quarter of 2010.
Specifically, the index spiraled up to March 2010. Though the BSSI dipped
slightly between the first and second quarters of 2010, improvement renewed.
However, the decline in June 2010 reflected the withdrawal of Nigerian
National Petroleum Corporation funds from the DMBs in May 2010 and the
delay in sharing of the monthly statutory revenue to the three tiers of
government, resulting in liquidity challenges. The Asset Management
Corporation of Nigeria (AMCON) was established in third quarter 2010 as a
special purpose vehicle for acquisition, management and disposal of non-
performing assets. Its eventual purchase of over N3.3 trillion NPLs injected
fundamental lifeline. Capital adequacy, asset quality and liquidity improved.
Results of the December 2011 CBN stress test revealed stability. Although the
key risks eased and the system remained stable up to fourth quarter 2011,
there were swings reflective of the liquidity conditions.
The index fell below zero from 2012, mirroring the various policy measures to
contain the threat of inflationary pressure. Nonetheless, the upward trend of
the BSSI from second quarter 2012 reflected on-going reforms to further
mitigate vulnerabilities and improve stability.
5.0 Summary and Conclusion
The Asian financial crisis of 1990s as well as the global financial and
economic crisis of 2008 triggered the search for a framework for monitoring
potential crisis in the financial system. Since regulators are said to have a
share of the blame for their preference for micro-prudential regulation as
against macro-prudential approach to regulation, there are concerted stern
efforts by the regulatory bodies to design a composite macro-regulatory
framework for monitoring the financial system so as to be able to detect
potential as well as systemic crisis in the system in order to take proactive
policy measures to avert them. This paper is an effort in that direction.
Considering the increasing linkages among economies arising from
globalization, the study combined the FSIs as proposed by the IMF with some
CBN Journal of Applied Statistics Vol. 5 No.1 (June, 2014) 67
macro-fundamentals, including external variables to construct a BSSI for
Nigeria.
The study applied Nicholas and Isabel (2010) approach on the normalized
series, derived through statistical normalization to obtain the sub-indices used
in the construction of the BSSI. However, the methodology of this study is an
improvement on Nicholas and Isabel (2010). Unlike the authors who applied
calibration, this study determined the weights of the sub-indices empirically,
through FGDs with both regulators and operators in the Nigerian banking
system. Furthermore, the study utilized the CBM normalised series to validate
the statistically normalized BSSI.
The trend of the resultant BSSI obtained through both normalization processes
followed almost the same pattern, only the magnitude varied. The index
revealed mixed results within the studied period, indicating that while the
banking system in Nigeria was stable sometimes, it was not at some others.
The study results mirrored fairly well the episodes of crisis in the Nigerian
banking sector over the period covered, including the crisis that led to CBN
interventions from 2009. It reveals the resiliency of the banking system in the
face of adverse shock. Hence, the derived BSSI is capable of acting as an
early warning mechanism for signaling fragility. Thus, the recommendation is
that, it should be used as a complimentary regulatory policy tool to detect
potential threat so that timely pre-emptive policy measures could be taken to
avert crisis.
Despite the robustness of our results, it should be noted that the study faced
some limitations, such as, the use of retrospective indicators, small sample
size and non-inclusion of qualitative factors. It is the hope that future
statistical research efforts would overcome these. This brings to fore the need
to strategically position Nigerian banks to withstand potential negative
external influences that may destabilize financial system.
Bibliography
Albulescu, C. (2010). ―Forecasting the Romanian Financial Sector Stability
using a Stochastic Simulation Model‖. Romanian Journal of Economic
Forecasting, 1/2010:81-98.
68 Developing Banking System Stability Index
for Nigeria Sere-Ejembi et al.
Armida, S. J, K. Russell and K. Phousnith (2006). ―The IMF Work on
Financial Soundness Indicators‖. International Financial
Corporation.
Armida, S. J. & G. Andreas (2006). ―Financial Soundness Indicators (FSIs).
Framework and Implementation‖. International Financial
Corporation.
Arvinash, P. (2009). ―Crisis Response: Public Policy for the Private Sector‖.
Note Number 6.
Bell, J. and D. Pain (2000). "Leading Indicator Models of Banking Crises-A
Critical Review". Financial Stability Review, Bank of England,
9(3):113-29.
Beverly, H., S. Til, & S. Kevin (2009). ―Macro-Prudential Supervision of
Financial Institutions: Lessons from the SCAP”. Federal Reserve
Bank of New York Staff Reports.
Bryant, J. (1980). ―A Model of Reserves, Bank Runs and Deposit Insurance‖.
Journal of Banking and Finance 4:335-344.
Cardarelli, R., S. Elekdag and S. Lall (2008). ―Financial Stress, Downturns,
and Recoveries‖. IMF Working Paper, WP/09/100.
Central Bank of Nigeria. Annual reports and statement of accounts, several
issues.
Central Bank of Nigeria. Financial stability reports, several issues.
Central Bank of Nigeria (2011). Statistical Bulletin.
Central Bank of the Republic of Turkey (2006). ―Financial Stability Report,
June 2006‖. Volume 2.
Claudio, B. (2009). ―The Macro-prudential Approach to Regulation and
Supervision‖. Bank for International Settlement.
Claudio, B. (2010). ―Implementing a Macro-prudential Framework: Blending
Boldness and Realism‖. Bank for International Settlement.
CBN Journal of Applied Statistics Vol. 5 No.1 (June, 2014) 69
Claudiu, T. A. and G. Daniel (2010). ―Assessing and Forecasting Romanian
Financial System‘s Stability using an Aggregate Index‖. Ecological
University of Traian of Dova.
Demirguc-Kent, A. and E. Detragiache (1998). "Financial liberalization and
financial fragility". Policy Research Working Paper Series 1917. The
World Bank.
Diamond, D. W. and P. Dybvig (1983). ―Bank Runs, Deposit Insurance and
Liquidity‖. Journal of Political Economy 91:401-419.
Diamond, D. W. and G. R. Raghuram (2009). ―Fear of Fire Sales and the
Credit Freeze‖. University of Chicago Working Paper.
Diaz Alenjandro, C. (1985). ―Goodbye financial repression, hello financial
crash”. Journal of Development Economics, Vol 19.
Doguwa, S. I. (1996). ―On Early Warning Models for the Identification of
Problem Banks in Nigeria‖. CBN Economic and Financial Review
34:462-487.
Donsyah, Y. (2003). ―The Impact of Bank Capital Requirements in
Indonesia‖. Loughborough University, Leicestershire.
European Central Bank (2006). ―Financial Stability Report‖. European
Central Bank. June, 2006.
Francis, S., M. Thabo & M. Kogomotso (2010). ―Macro-prudential Analysis
of the Financial System: The Case of South Africa‖. South African
Reserve Bank.
Gadanecz, B. and K. Jayaram (2009). ―Measures of Financial Stability – A
Review‖. IFC Bulletin No 31.
Gersl, A. & J. Hermanek (2006). ―Financial Stability Indicators: Advantages
and Disadvantages of their use in the Assessment of Financial System
Stability‖, in Financial Stability Report, 2006, Czech National Bank.
Gersl, A. & J. Hermanek (2006). ―Financial Stability Indicators: Advantages
and Disadvantages of their use in the Assessment of Financial System
Stability‖, in Financial Stability Report, 2007, Czech National Bank.
70 Developing Banking System Stability Index
for Nigeria Sere-Ejembi et al.
Greenwald, B. and J. Stiglitz (1986). ―Externalities in economies with
imperfect information and incomplete markets‖. Quarterly Journal of
Economics, 101:229-264.
Hanschel, E. and P. Monnin (2005). ―Measuring and Forecasting Stress in the
Banking Sector: Evidence from Switzerland, Bank for International
Settlements Working Paper, No 22.
Harris, R. and R. Sollis (2003) ―Applied Time Series Modelling and
Forecasting‖, Wiley Applications.
Illing, M. and Y. Liu (2003). ―Measuring Financial Stress‖. Financial System
Review. Availableathttp.//wwwbankofcanadaca/wp-content/uploads/
2012/02/fsr-1203-illingpdf.
IMF (2006). ―Financial Soundness Indicators‖. Compilation Guide,
International Monetary Fund.
Jide, L. (2003). ―An Early Warning Model of Bank Failure in Jamaica: An
Information Theoretic Approach‖. Financial Stability Department,
Bank of Jamaica.
Kaminsky, G. (2003). "Varieties of Currency Crisis". NBER Working Paper
10193.
Kaminsky, G. L. and C. M. Reinhart (1998). ―Bank Lending and Contagion:
Evidence from the Asian Crisis‖. Paper presented at the 10th Annual
East Asia Seminar on Economics, Hawaii, June 10-12.
Kevin, D. and A. Selim (2009). ―Indicators of Financial Soundness: Can they
forewarn us of Impending Crises‖. International Review of Business
Research.
Keynes, J. M. (1936). ―The General Theory of Employment, Interest and
Money”.
Lotte, S. Z., R. A. Jose and S. Lei Lei (2010). ―A Macro-prudential
Framework for Monitoring and Examining Financial Soundness‖.
Asian Development Bank.
CBN Journal of Applied Statistics Vol. 5 No.1 (June, 2014) 71
Nelson, W. R. and R. Perli (2005). ―Selected indicators of financial stability‖.
4th Joint Central Bank Research Conference on ―Risk Measurement
and Systemic Risk‖, ECB Frankfurt am Main.
Nicholas, C. and C. Isabel (2010). ―Aggregate Financial Stability Index for an
Early Warning System‖. Research and Statistics Department,
Monetary Authority of Macao.
Nout, W. (2008). ―Capital Adequacy Directive‖. Basel Committee on Banking
Supervision.
Reinhart, C. M. and K. S. Rogoff (2008). ―This Time is Different: A
Panoramic View of Eight Centuries of Financial Crises‖. Available
at wwwnberorg/, April 2008.
Cardarelli, R., S. Elekdag and S. Lall (2008). ―Financial Stress, Downturns,
and Recoveries‖. IMF working paper, No. WP/09/100.
Robert, S. C. (2004). ―Macro-economic Determinant of Banking Financial
Performance and Resilience in Singapore‖. The Monetary Authority of
Singapore.
Samuel, G. H., H. K. Anil and C. S. Jeremy (2010). ―A Macro-prudential
Approach to Financial Regulation‖, 2010
Schwaab B., S. J. Koopman and A. Lucas (2011). ―Systemic Risk Diagnostics
Coincident Indicators and Early Warning Signals‖. Working paper
series No. B27 Macroprudential Research Network, European Central
Bank.
Shleifer, A. and W. V. Robert (2010). ―Unstable Banking,‖ Journal of
Financial Economics.
Stein, J. C. (2010). ―Monetary Policy as Financial-Stability Regulation‖. IMF
Working Paper.
Swiss National Bank (2012). ―Financial Stability Report‖. Available at
http.//wwwsnbch/n/mmr/reference/stabrep_2012/source/stabrep_2012
npdf
Thomas, L. K. V. (2003). ―The Financial Soundness Indicators. The Case of
Macao‖. Monetary Authority of Macao.
72 Developing Banking System Stability Index
for Nigeria Sere-Ejembi et al.
Van den End, J. W. (2006). ―Indicator and boundaries of financial stability‖.
DNB Working Paper No. 97.
Velasco, A. (1987). ―Financial Crises and Balance of Payments Crises: A
Simple Model of the Southern Cone Experience‖, Journal of
Development Economics 27(1–2):263–83
Verlis, C. M. (2010). ―Measuring and Forecasting Financial Stability: The
Composition of an Aggregate Financial Stability Index for Jamaica‖.
Available at http.//wwwbojorgjm/uploads/pdf.
Verlis, C. M. (2011). ―Measuring and Forecasting Financial Stability: The
Composition of an Aggregate Financial Stability Index for Jamaica‖.
Available at www.boj.org.jm/publications/publications_show.php?
publication.
Wong, J., T. C. Wong and P. Leung (2007). ―A Leading Indicator Model of
Banking Distress Developing an Early Warning System for Hong
Kong and other EMEAP Economies‖. Hong Kong Monetary Authority
Working Paper No. 22.
CBN Journal of Applied Statistics Vol. 5 No.1 (June, 2014) 73
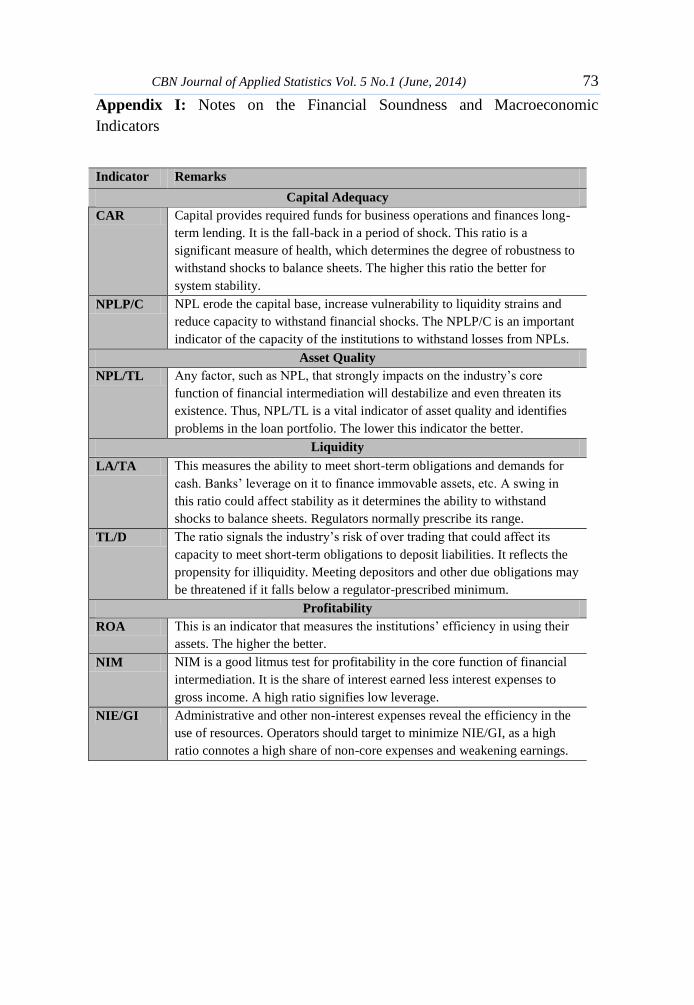
Appendix I: Notes on the Financial Soundness and Macroeconomic
Indicators
Indicator Remarks
Capital Adequacy
CAR Capital provides required funds for business operations and finances long-
term lending. It is the fall-back in a period of shock. This ratio is a
significant measure of health, which determines the degree of robustness to
withstand shocks to balance sheets. The higher this ratio the better for
system stability.
NPLP/C NPL erode the capital base, increase vulnerability to liquidity strains and
reduce capacity to withstand financial shocks. The NPLP/C is an important
indicator of the capacity of the institutions to withstand losses from NPLs.
Asset Quality
NPL/TL Any factor, such as NPL, that strongly impacts on the industry‘s core
function of financial intermediation will destabilize and even threaten its
existence. Thus, NPL/TL is a vital indicator of asset quality and identifies
problems in the loan portfolio. The lower this indicator the better.
Liquidity
LA/TA This measures the ability to meet short-term obligations and demands for
cash. Banks‘ leverage on it to finance immovable assets, etc. A swing in
this ratio could affect stability as it determines the ability to withstand
shocks to balance sheets. Regulators normally prescribe its range.
TL/D The ratio signals the industry‘s risk of over trading that could affect its
capacity to meet short-term obligations to deposit liabilities. It reflects the
propensity for illiquidity. Meeting depositors and other due obligations may
be threatened if it falls below a regulator-prescribed minimum.
Profitability
ROA This is an indicator that measures the institutions‘ efficiency in using their
assets. The higher the better.
NIM NIM is a good litmus test for profitability in the core function of financial
intermediation. It is the share of interest earned less interest expenses to
gross income. A high ratio signifies low leverage.
NIE/GI Administrative and other non-interest expenses reveal the efficiency in the
use of resources. Operators should target to minimize NIE/GI, as a high
ratio connotes a high share of non-core expenses and weakening earnings.
74 Developing Banking System Stability Index
for Nigeria Sere-Ejembi et al.
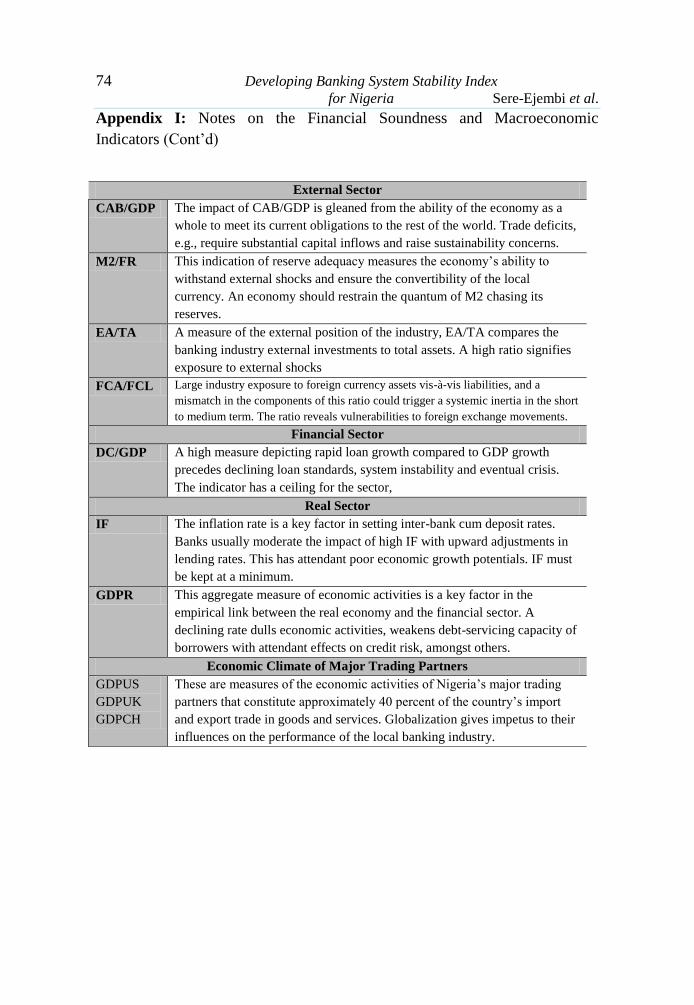
Appendix I: Notes on the Financial Soundness and Macroeconomic
Indicators (Cont‘d)
External Sector
CAB/GDP The impact of CAB/GDP is gleaned from the ability of the economy as a
whole to meet its current obligations to the rest of the world. Trade deficits,
e.g., require substantial capital inflows and raise sustainability concerns.
M2/FR This indication of reserve adequacy measures the economy‘s ability to
withstand external shocks and ensure the convertibility of the local
currency. An economy should restrain the quantum of M2 chasing its
reserves.
EA/TA A measure of the external position of the industry, EA/TA compares the
banking industry external investments to total assets. A high ratio signifies
exposure to external shocks
FCA/FCL Large industry exposure to foreign currency assets vis-à-vis liabilities, and a
mismatch in the components of this ratio could trigger a systemic inertia in the short
to medium term. The ratio reveals vulnerabilities to foreign exchange movements.
Financial Sector
DC/GDP A high measure depicting rapid loan growth compared to GDP growth
precedes declining loan standards, system instability and eventual crisis.
The indicator has a ceiling for the sector,
Real Sector
IF The inflation rate is a key factor in setting inter-bank cum deposit rates.
Banks usually moderate the impact of high IF with upward adjustments in
lending rates. This has attendant poor economic growth potentials. IF must
be kept at a minimum.
GDPR This aggregate measure of economic activities is a key factor in the
empirical link between the real economy and the financial sector. A
declining rate dulls economic activities, weakens debt-servicing capacity of
borrowers with attendant effects on credit risk, amongst others.
Economic Climate of Major Trading Partners
GDPUS
GDPUK
GDPCH
These are measures of the economic activities of Nigeria‘s major trading
partners that constitute approximately 40 percent of the country‘s import
and export trade in goods and services. Globalization gives impetus to their
influences on the performance of the local banking industry.
CBN Journal of Applied Statistics Vol. 5 No.1 (June, 2014) 75
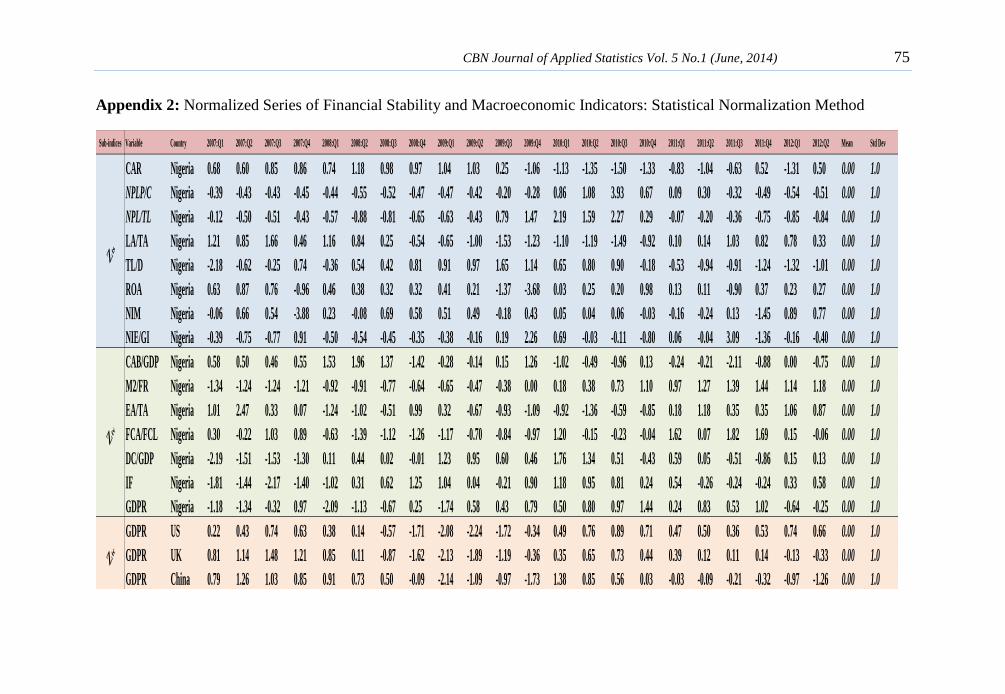
Appendix 2: Normalized Series of Financial Stability and Macroeconomic Indicators: Statistical Normalization Method
Sub-indices Variable Country 2007:Q1 2007:Q2 2007:Q3 2007:Q4 2008:Q1 2008:Q2 2008:Q3 2008:Q4 2009:Q1 2009:Q2 2009:Q3 2009:Q4 2010:Q1 2010:Q2 2010:Q3 2010:Q4 2011:Q1 2011:Q2 2011:Q3 2011:Q4 2012:Q1 2012:Q2 Mean Std Dev
CAR Nigeria 0.68 0.60 0.85 0.86 0.74 1.18 0.98 0.97 1.04 1.03 0.25 -1.06 -1.13 -1.35 -1.50 -1.33 -0.83 -1.04 -0.63 0.52 -1.31 0.50 0.00 1.0
NPLP/C Nigeria -0.39 -0.43 -0.43 -0.45 -0.44 -0.55 -0.52 -0.47 -0.47 -0.42 -0.20 -0.28 0.86 1.08 3.93 0.67 0.09 0.30 -0.32 -0.49 -0.54 -0.51 0.00 1.0
NPL/TL Nigeria -0.12 -0.50 -0.51 -0.43 -0.57 -0.88 -0.81 -0.65 -0.63 -0.43 0.79 1.47 2.19 1.59 2.27 0.29 -0.07 -0.20 -0.36 -0.75 -0.85 -0.84 0.00 1.0
LA/TA Nigeria 1.21 0.85 1.66 0.46 1.16 0.84 0.25 -0.54 -0.65 -1.00 -1.53 -1.23 -1.10 -1.19 -1.49 -0.92 0.10 0.14 1.03 0.82 0.78 0.33 0.00 1.0
TL/D Nigeria -2.18 -0.62 -0.25 0.74 -0.36 0.54 0.42 0.81 0.91 0.97 1.65 1.14 0.65 0.80 0.90 -0.18 -0.53 -0.94 -0.91 -1.24 -1.32 -1.01 0.00 1.0
ROA Nigeria 0.63 0.87 0.76 -0.96 0.46 0.38 0.32 0.32 0.41 0.21 -1.37 -3.68 0.03 0.25 0.20 0.98 0.13 0.11 -0.90 0.37 0.23 0.27 0.00 1.0
NIM Nigeria -0.06 0.66 0.54 -3.88 0.23 -0.08 0.69 0.58 0.51 0.49 -0.18 0.43 0.05 0.04 0.06 -0.03 -0.16 -0.24 0.13 -1.45 0.89 0.77 0.00 1.0
NIE/GI Nigeria -0.39 -0.75 -0.77 0.91 -0.50 -0.54 -0.45 -0.35 -0.38 -0.16 0.19 2.26 0.69 -0.03 -0.11 -0.80 0.06 -0.04 3.09 -1.36 -0.16 -0.40 0.00 1.0
Zts
Ztv
CAB/GDP Nigeria 0.58 0.50 0.46 0.55 1.53 1.96 1.37 -1.42 -0.28 -0.14 0.15 1.26 -1.02 -0.49 -0.96 0.13 -0.24 -0.21 -2.11 -0.88 0.00 -0.75 0.00 1.0
M2/FR Nigeria -1.34 -1.24 -1.24 -1.21 -0.92 -0.91 -0.77 -0.64 -0.65 -0.47 -0.38 0.00 0.18 0.38 0.73 1.10 0.97 1.27 1.39 1.44 1.14 1.18 0.00 1.0
EA/TA Nigeria 1.01 2.47 0.33 0.07 -1.24 -1.02 -0.51 0.99 0.32 -0.67 -0.93 -1.09 -0.92 -1.36 -0.59 -0.85 0.18 1.18 0.35 0.35 1.06 0.87 0.00 1.0
FCA/FCL Nigeria 0.30 -0.22 1.03 0.89 -0.63 -1.39 -1.12 -1.26 -1.17 -0.70 -0.84 -0.97 1.20 -0.15 -0.23 -0.04 1.62 0.07 1.82 1.69 0.15 -0.06 0.00 1.0
DC/GDP Nigeria -2.19 -1.51 -1.53 -1.30 0.11 0.44 0.02 -0.01 1.23 0.95 0.60 0.46 1.76 1.34 0.51 -0.43 0.59 0.05 -0.51 -0.86 0.15 0.13 0.00 1.0
IF Nigeria -1.81 -1.44 -2.17 -1.40 -1.02 0.31 0.62 1.25 1.04 0.04 -0.21 0.90 1.18 0.95 0.81 0.24 0.54 -0.26 -0.24 -0.24 0.33 0.58 0.00 1.0
GDPR Nigeria -1.18 -1.34 -0.32 0.97 -2.09 -1.13 -0.67 0.25 -1.74 0.58 0.43 0.79 0.50 0.80 0.97 1.44 0.24 0.83 0.53 1.02 -0.64 -0.25 0.00 1.0
GDPR US 0.22 0.43 0.74 0.63 0.38 0.14 -0.57 -1.71 -2.08 -2.24 -1.72 -0.34 0.49 0.76 0.89 0.71 0.47 0.50 0.36 0.53 0.74 0.66 0.00 1.0
GDPR UK 0.81 1.14 1.48 1.21 0.85 0.11 -0.87 -1.62 -2.13 -1.89 -1.19 -0.36 0.35 0.65 0.73 0.44 0.39 0.12 0.11 0.14 -0.13 -0.33 0.00 1.0
GDPR China 0.79 1.26 1.03 0.85 0.91 0.73 0.50 -0.09 -2.14 -1.09 -0.97 -1.73 1.38 0.85 0.56 0.03 -0.03 -0.09 -0.21 -0.32 -0.97 -1.26 0.00 1.0
Ztv
Ztc
76 Developing Banking System Stability Index
for Nigeria Sere-Ejembi et al.
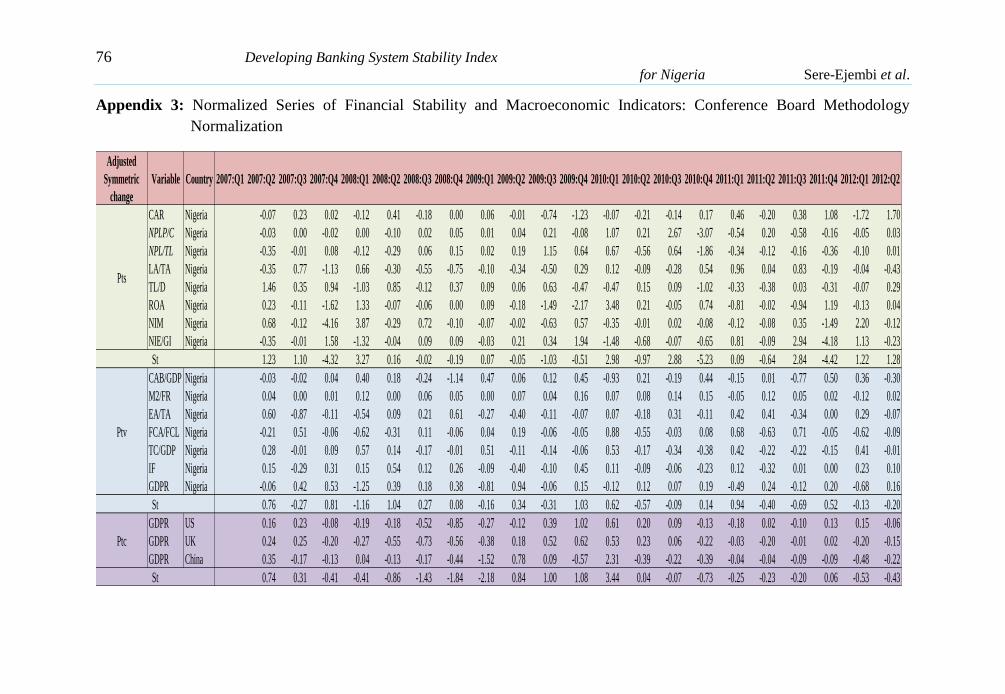
Appendix 3: Normalized Series of Financial Stability and Macroeconomic Indicators: Conference Board Methodology
Normalization
Adjusted
Symmetric
change
Variable Country 2007:Q1 2007:Q2 2007:Q3 2007:Q4 2008:Q1 2008:Q2 2008:Q3 2008:Q4 2009:Q1 2009:Q2 2009:Q3 2009:Q4 2010:Q1 2010:Q2 2010:Q3 2010:Q4 2011:Q1 2011:Q2 2011:Q3 2011:Q4 2012:Q1 2012:Q2
CAR Nigeria -0.07 0.23 0.02 -0.12 0.41 -0.18 0.00 0.06 -0.01 -0.74 -1.23 -0.07 -0.21 -0.14 0.17 0.46 -0.20 0.38 1.08 -1.72 1.70
NPLP/C Nigeria -0.03 0.00 -0.02 0.00 -0.10 0.02 0.05 0.01 0.04 0.21 -0.08 1.07 0.21 2.67 -3.07 -0.54 0.20 -0.58 -0.16 -0.05 0.03
NPL/TL Nigeria -0.35 -0.01 0.08 -0.12 -0.29 0.06 0.15 0.02 0.19 1.15 0.64 0.67 -0.56 0.64 -1.86 -0.34 -0.12 -0.16 -0.36 -0.10 0.01
LA/TA Nigeria -0.35 0.77 -1.13 0.66 -0.30 -0.55 -0.75 -0.10 -0.34 -0.50 0.29 0.12 -0.09 -0.28 0.54 0.96 0.04 0.83 -0.19 -0.04 -0.43
TL/D Nigeria 1.46 0.35 0.94 -1.03 0.85 -0.12 0.37 0.09 0.06 0.63 -0.47 -0.47 0.15 0.09 -1.02 -0.33 -0.38 0.03 -0.31 -0.07 0.29
ROA Nigeria 0.23 -0.11 -1.62 1.33 -0.07 -0.06 0.00 0.09 -0.18 -1.49 -2.17 3.48 0.21 -0.05 0.74 -0.81 -0.02 -0.94 1.19 -0.13 0.04
NIM Nigeria 0.68 -0.12 -4.16 3.87 -0.29 0.72 -0.10 -0.07 -0.02 -0.63 0.57 -0.35 -0.01 0.02 -0.08 -0.12 -0.08 0.35 -1.49 2.20 -0.12
NIE/GI Nigeria -0.35 -0.01 1.58 -1.32 -0.04 0.09 0.09 -0.03 0.21 0.34 1.94 -1.48 -0.68 -0.07 -0.65 0.81 -0.09 2.94 -4.18 1.13 -0.23
1.23 1.10 -4.32 3.27 0.16 -0.02 -0.19 0.07 -0.05 -1.03 -0.51 2.98 -0.97 2.88 -5.23 0.09 -0.64 2.84 -4.42 1.22 1.28
CAB/GDP Nigeria -0.03 -0.02 0.04 0.40 0.18 -0.24 -1.14 0.47 0.06 0.12 0.45 -0.93 0.21 -0.19 0.44 -0.15 0.01 -0.77 0.50 0.36 -0.30
M2/FR Nigeria 0.04 0.00 0.01 0.12 0.00 0.06 0.05 0.00 0.07 0.04 0.16 0.07 0.08 0.14 0.15 -0.05 0.12 0.05 0.02 -0.12 0.02
EA/TA Nigeria 0.60 -0.87 -0.11 -0.54 0.09 0.21 0.61 -0.27 -0.40 -0.11 -0.07 0.07 -0.18 0.31 -0.11 0.42 0.41 -0.34 0.00 0.29 -0.07
FCA/FCL Nigeria -0.21 0.51 -0.06 -0.62 -0.31 0.11 -0.06 0.04 0.19 -0.06 -0.05 0.88 -0.55 -0.03 0.08 0.68 -0.63 0.71 -0.05 -0.62 -0.09
TC/GDP Nigeria 0.28 -0.01 0.09 0.57 0.14 -0.17 -0.01 0.51 -0.11 -0.14 -0.06 0.53 -0.17 -0.34 -0.38 0.42 -0.22 -0.22 -0.15 0.41 -0.01
IF Nigeria 0.15 -0.29 0.31 0.15 0.54 0.12 0.26 -0.09 -0.40 -0.10 0.45 0.11 -0.09 -0.06 -0.23 0.12 -0.32 0.01 0.00 0.23 0.10
GDPR Nigeria -0.06 0.42 0.53 -1.25 0.39 0.18 0.38 -0.81 0.94 -0.06 0.15 -0.12 0.12 0.07 0.19 -0.49 0.24 -0.12 0.20 -0.68 0.16
0.76 -0.27 0.81 -1.16 1.04 0.27 0.08 -0.16 0.34 -0.31 1.03 0.62 -0.57 -0.09 0.14 0.94 -0.40 -0.69 0.52 -0.13 -0.20
GDPR US 0.16 0.23 -0.08 -0.19 -0.18 -0.52 -0.85 -0.27 -0.12 0.39 1.02 0.61 0.20 0.09 -0.13 -0.18 0.02 -0.10 0.13 0.15 -0.06
GDPR UK 0.24 0.25 -0.20 -0.27 -0.55 -0.73 -0.56 -0.38 0.18 0.52 0.62 0.53 0.23 0.06 -0.22 -0.03 -0.20 -0.01 0.02 -0.20 -0.15
GDPR China 0.35 -0.17 -0.13 0.04 -0.13 -0.17 -0.44 -1.52 0.78 0.09 -0.57 2.31 -0.39 -0.22 -0.39 -0.04 -0.04 -0.09 -0.09 -0.48 -0.22
0.74 0.31 -0.41 -0.41 -0.86 -1.43 -1.84 -2.18 0.84 1.00 1.08 3.44 0.04 -0.07 -0.73 -0.25 -0.23 -0.20 0.06 -0.53 -0.43
Ptc
St
St
St
Pts
Ptv
CBN Journal of Applied Statistics Vol. 5 No.1 (June, 2014) 77
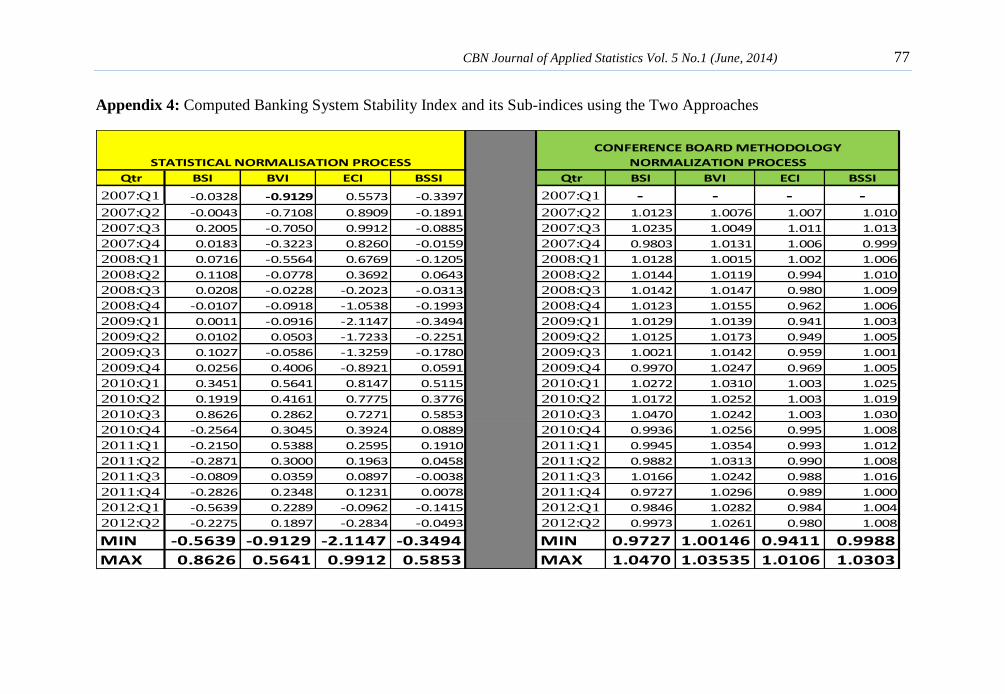
Appendix 4: Computed Banking System Stability Index and its Sub-indices using the Two Approaches
Qtr BSI BVI ECI BSSI Qtr BSI BVI ECI BSSI
2007:Q1 -0.0328 -0.9129 0.5573 -0.3397 2007:Q1 - - - -2007:Q2 -0.0043 -0.7108 0.8909 -0.1891 2007:Q2 1.0123 1.0076 1.007 1.010
2007:Q3 0.2005 -0.7050 0.9912 -0.0885 2007:Q3 1.0235 1.0049 1.011 1.013
2007:Q4 0.0183 -0.3223 0.8260 -0.0159 2007:Q4 0.9803 1.0131 1.006 0.999
2008:Q1 0.0716 -0.5564 0.6769 -0.1205 2008:Q1 1.0128 1.0015 1.002 1.006
2008:Q2 0.1108 -0.0778 0.3692 0.0643 2008:Q2 1.0144 1.0119 0.994 1.010
2008:Q3 0.0208 -0.0228 -0.2023 -0.0313 2008:Q3 1.0142 1.0147 0.980 1.009
2008:Q4 -0.0107 -0.0918 -1.0538 -0.1993 2008:Q4 1.0123 1.0155 0.962 1.006
2009:Q1 0.0011 -0.0916 -2.1147 -0.3494 2009:Q1 1.0129 1.0139 0.941 1.003
2009:Q2 0.0102 0.0503 -1.7233 -0.2251 2009:Q2 1.0125 1.0173 0.949 1.005
2009:Q3 0.1027 -0.0586 -1.3259 -0.1780 2009:Q3 1.0021 1.0142 0.959 1.001
2009:Q4 0.0256 0.4006 -0.8921 0.0591 2009:Q4 0.9970 1.0247 0.969 1.005
2010:Q1 0.3451 0.5641 0.8147 0.5115 2010:Q1 1.0272 1.0310 1.003 1.025
2010:Q2 0.1919 0.4161 0.7775 0.3776 2010:Q2 1.0172 1.0252 1.003 1.019
2010:Q3 0.8626 0.2862 0.7271 0.5853 2010:Q3 1.0470 1.0242 1.003 1.030
2010:Q4 -0.2564 0.3045 0.3924 0.0889 2010:Q4 0.9936 1.0256 0.995 1.008
2011:Q1 -0.2150 0.5388 0.2595 0.1910 2011:Q1 0.9945 1.0354 0.993 1.012
2011:Q2 -0.2871 0.3000 0.1963 0.0458 2011:Q2 0.9882 1.0313 0.990 1.008
2011:Q3 -0.0809 0.0359 0.0897 -0.0038 2011:Q3 1.0166 1.0242 0.988 1.016
2011:Q4 -0.2826 0.2348 0.1231 0.0078 2011:Q4 0.9727 1.0296 0.989 1.000
2012:Q1 -0.5639 0.2289 -0.0962 -0.1415 2012:Q1 0.9846 1.0282 0.984 1.004
2012:Q2 -0.2275 0.1897 -0.2834 -0.0493 2012:Q2 0.9973 1.0261 0.980 1.008
MIN -0.5639 -0.9129 -2.1147 -0.3494 MIN 0.9727 1.00146 0.9411 0.9988
MAX 0.8626 0.5641 0.9912 0.5853 MAX 1.0470 1.03535 1.0106 1.0303
STATISTICAL NORMALISATION PROCESS
CONFERENCE BOARD METHODOLOGY
NORMALIZATION PROCESS