developing an aggregator mechanism for late-stage clinical
TRANSCRIPT

Developing an aggregator mechanism for late-stage clinical trials WORKING PAPER • 1
Developing an aggregator mechanism
for late-stage clinical trials
of neglected disease product candidates
AUTHORS
Gavin Yamey*, Marco Schäferhoff*, Mary Moran, Mohamed Mustafa Diab, Kaci Kennedy
McDade, Wenhui Mao, Parth Chodavadia, Armand Zimmerman, Yangmu Huang, Vipul
Chowdhary, Robert Karanja, Mziwandile Madikizela, Osondu Ogbuoji
*Joint first author
Working Paper • October 2020
Developing an aggregator mechanism for late-stage clinical trials WORKING PAPER • 2
SUGGESTED CITATION
Yamey G, Schäferhoff M, Moran M, Diab MM, McDade KK, Mao W, Chodavadia P, Zimmerman A, Huang Y,
Chowdhary C, Karanja R, Madikizela M, Ogbuoji O. Developing an aggregator mechanism for late-stage
clinical trials of neglected disease product candidates. The Center for Policy Impact in Global Health. Duke
Global Working Paper Series: number 23, October 2020. Available at: http://centerforpolicyimpact.org/our-
work/our-publications/developing-an-aggregator-mechanism-for-late-stage-clinical-trials/.
FUNDING
This study was funded by a grant from the Bill & Melinda Gates Foundation.

Developing an aggregator mechanism for late-stage clinical trials WORKING PAPER • 3
TABLE OF CONTENTS
Acronyms .................................................................................................................................................... 5 Executive summary .................................................................................................................................... 6
Introduction .............................................................................................................................................. 16
Methods ................................................................................................................................................... 18
The valley of death in funding late-stage development for PRNDs......................................................... 25
3.1. Quantifying the valley of death ......................................................................................................... 25 3.2. A mismatch between funding and needs ......................................................................................... 27 3.3. The valley of death for vaccine trials................................................................................................. 27 3.4. The current R&D landscape for PRNDs ............................................................................................. 28
Developing an aggregator for late-stage clinical trials............................................................................. 35
4.1. Overall levels of support, main advantages, and risks ...................................................................... 35 4.2. Support for an aggregator across geographies and stakeholder types ........................................... 37 4.3. Contributions to the aggregator ....................................................................................................... 41 4.4. Scope of an aggregator mechanism for late-stage clinical trials ...................................................... 42 4.5. Governance ....................................................................................................................................... 44
Developing options for the design of an aggregator mechanism for late-stage clinical trials ................ 49
Key features of an aggregator mechanism for late-stage clinical trials .................................................. 57
Conclusions and recommendations ......................................................................................................... 57
References ................................................................................................................................................ 63 Annexes .................................................................................................................................................... 65
⚫ FIGURES
Figure ES1. Options staircase............................................................................................................................ 8
Figure ES2. Trade-offs in feasibility, scope, benefit-cost ratio, and deaths averted between options ...... 12
Figure 1. Stages of vaccine development and delivery ............................................................................. 28
Figure 2. Do consulted stakeholders support the creation of a new aggregator mechanism? .............. 35
Figure 3. What late-stage bottlenecks could an aggregator mechanism help address? ........................ 36
Figure 4. What are the key risks and disadvantages of an aggregator? ................................................... 36
Figure 5. What supportive stakeholders need to fully buy into an aggregator ....................................... 37
Figure 6. Levels of support by broad geography ....................................................................................... 38
Figure 7. Levels of support by stakeholder type ........................................................................................ 38
Figure 8. Levels of support for an aggregator across four MICs ............................................................... 39
Figure 9. Which product development phases should an aggregator fund? ........................................... 42
Figure 10. Scope of aggregator in terms of product types supported ....................................................... 43
Figure 11. Scope of aggregator in terms of diseases supported ................................................................ 43
Figure 12. Which prioritization criteria should an aggregator use? ........................................................... 46
Figure 13. Options staircase.......................................................................................................................... 50
Figure 14. Trade-offs in feasibility, scope, benefit-cost ratio, and deaths averted between options ...... 55

Developing an aggregator mechanism for late-stage clinical trials WORKING PAPER • 4
⚫ BOXES
Box 1. Three critical factors for driving pharmaceutical engagement in global health product development ................................................................................................................................ 59
⚫ TABLES
Table ES1. Criteria for analyzing design options for an aggregator .............................................................. 9
Table ES2. Assessment of Option 1 based on key criteria ............................................................................. 9
Table ES3. Assessment of Option 2 based on key criteria ........................................................................... 10
Table ES4. Assessment of Option 3 based on key criteria ........................................................................... 11
Table 1. Public funding for product development for PRNDs from the eight countries included in the study ................................................................................................... 19
Table 2. Impacts included in the investment cases for the two types of aggregator options ............... 22
Table 3. Candidates under development for PRNDs in phase III (total, and as a % of all candidates), as of August 31, 2019 ...................................................... 25
Table 4. Annual funding gap for phase III trials over next 5 years .......................................................... 27
Table 5. Number of candidates in the pipeline for top 4 PDPs by funding ............................................. 31
Table 6. Number of candidates in the pipeline for selected funding mechanisms ................................ 31
Table 7. Levels of support in HICs and from global/regional/other stakeholders .................................. 40
Table 8. Advantages and disadvantages of a global or regional mechanism ......................................... 46
Table 9. Criteria for analyzing design options for an aggregator ........................................................... 50
Table 10. Key features of Option 1: an aggregator for late-stage vaccine trials against a narrow set of diseases ................................................................................................. 51
Table 11. Key features of Option 2: an aggregator for all product types to control a wider range of diseases ............................................................................................................ 53
Table 12. Key features of Option 3: an aggregator for all product types for all PRNDs .......................... 54
⚫ ANNEXES
Annex 1. Semi-structured interview questionnaire................................................................................... 65
Annex 2. Detailed methods and assumptions used to estimate costs and benefits of an aggregator ........................................................................................................................... 68
Annex 3. Number of candidates in phase II ............................................................................................... 78
Annex 4. Product candidates in the 2017 and the complete 2019 pipelines categorized by disease ................................................................................................................ 79
Annex 5. Expected launches by disease based on the 2017 and the complete 2019 pipelines ............. 80
Annex 6. Cost by phase to move product candidates through the pipeline to launch for the 2019 direct comparison pipeline and the complete 2019 pipeline ............. 81
Annex 7. Summary table of major PDPs and intermediaries in PRNDs R&D ........................................... 82
Annex 8. Detailed results of the modeling on costs and benefits ............................................................ 85

Developing an aggregator mechanism for late-stage clinical trials WORKING PAPER • 5
⚫ ACRONYMS
AMR ........... Antimicrobial resistance
APC ............. Advanced purchase commitment
BCA ............. Benefit-cost analysis
BMGF ......... Bill & Melinda Gates Foundation
CARB-X ....... Combating Antibiotic Resistant Bacteria Biopharmaceutical Accelerator
CEPI ............ Coalition for Epidemic Preparedness Innovations
CEWG ......... Consultative Expert Working Group on Research and Development
CRO ............ Contract research organization
CSO ............. Civil society organization
DALY ........... Disability-adjusted life year
DNDi ........... Drugs for Neglected Diseases initiative
EC ............... European Commission
EDCTP......... European and Developing Countries Clinical Trials Partnership
EID .............. Emerging infectious disease
Gavi ............ Gavi, the Vaccine Alliance
GARDP ....... Global Antibiotic Research and Development Partnership
G-FINDER ... Global Funding of Innovation for Neglected Diseases study
GHIF ........... Global Health Investment Fund
GHIT ........... Global Health Technology Fund
GBD ............ Global burden of disease
GDP ............ Gross domestic product
GSK ............. GlaxoSmithKline
HECT ........... Highly efficient clinical trials
HIC .............. High-income country
IAVI............. International AIDS Vaccine Initiative
IHME .......... Institute for Health Metrics and Evaluation
IFFIm .......... International Finance Facility for Immunisation
IRB .............. Institutional review board
IVI ............... International Vaccine Institute
LMICs.......... Low- and middle-income countries
KII ............... Key informant interview
MDR-TB ...... Multidrug-resistant tuberculosis
MMV .......... Medicines for Malaria Venture
MNC ........... Multinational pharmaceutical company
MRI ............. Medical Research Institute
MIC ............. Middle-income country
NCD ............ Non-communicable disease
NCE ............. New chemical entity
PATH .......... Program for Appropriate Technology in Health
PRNDs ........ Poverty-related and neglected diseases
PDP ............. Product development partnership
R&D ............ Research and development
SDGs ........... Sustainable Development Goals
TB................ Tuberculosis
TDR ............. Special Programme for Research and Training in Tropical Diseases
UNICEF ....... United Nations Children's Fund
USA ............. United States of America
UK ............... United Kingdom
US NIH ........ US National Institutes of Health
WHO ........... World Health Organization
XDR-TB ....... Extensively drug-resistant tuberculosis

Developing an aggregator mechanism for late-stage clinical trials WORKING PAPER • 6
⚫ EXECUTIVE SUMMARY
There have been significant improvements in recent years in the early stage development of products for
poverty-related and neglected diseases (PRNDs). However, there are still major challenges in the funding
of late-stage clinical trials of candidate products for these diseases. For vaccine development specifically,
Rappuoli and colleagues recently concluded that “these improvements in the early development process
have revealed a new, and possibly more perilous, Valley of Death in the late vaccine development phase.”1
There are three major challenges in conducting phase III trials for PRND product development. First, such
trials are expensive and companies often shy away from investing in them because there is no commercial
market for most PRNDs. Second, there is poor coordination on late-stage trials across R&D initiatives. At
present, there is no overarching global mechanism that is “steering the ship”—there is no universally agreed
upon process for prioritizing R&D investments for PRNDs, for selecting the most promising candidates, or for
coordinating the multiple, overlapping research programs worldwide. The result is duplication, waste, and
ultimately delays in the development of products. Third, current R&D efforts for PRNDs are “top-down”—
they are controlled by high-income countries (HICs) and have generally done poorly at including decision-
makers from high-burden countries. It is policymakers in low- and middle-income countries (LMICs) who are
in the trenches when it comes to controlling PRNDs—yet they are often not at the table when it comes to
deciding on what gets funded, where research is conducted, who gets access to intellectual property, and
where and how the technologies end up being manufactured. All these steps need to be “globalized” if we
are to develop and deploy new control tools.
This study examines whether and how these challenges could potentially be addressed through a new kind
of global funding platform for late-stage clinical trials (an “R&D aggregator”). Two key aims of this study were:
• To assess the demand for and design of an R&D aggregator
• To assess the health and economic benefits of a global aggregator (i.e., to assess the investment case).
This working paper presents results on the demand for/design of an aggregator and on the investment case
for a global aggregator. It examines how the launch of a new funding platform could potentially (i) mobilize
additional funding, (ii) establish consensus on R&D priorities, (iii) bring LMIC partners to the table (including
in conducting trials and manufacturing products), (iv) facilitate information sharing across investors and
research institutions, and (v) curate a portfolio of prioritized R&D investment opportunities.
Methods
We conducted a mixed methods study based on three approaches.
First, we performed a literature review, including an assessment of existing aggregator-type mechanisms (e.g.,
product development partnerships [PDPs], the Coalition for Epidemic Preparedness Innovations [CEPI], and
the European and Developing Country Trials Partnership [EDCTP]).
Second, we conducted two rounds of key informant (KI) interviews. In the first round, between September
2019 and May 2020, we conducted KI interviews with 165 individuals from all major sectors across four high-
income countries (Germany, the Netherlands, the United Kingdom, and the United States), four middle-
income countries (China, India, Kenya, and South Africa), and other geographies (e.g., we interviewed

Developing an aggregator mechanism for late-stage clinical trials WORKING PAPER • 7
multinational pharmaceutical companies, PDPs, and university researchers across other countries). These KI
interviews were used to assess the demand for an aggregator mechanism for late-stage clinical trials and to
develop initial design options. In the second round, between June and August 2020, we interviewed an
additional 27 KIs—including a range of potential funders from LMICs and HICs. This feedback loop helped us
to “road test” our initial design options and to assess whether our recommended aggregator mechanism
reflected the perspectives of the global and national “communities” to the extent possible.
Third, we conducted quantitative modelling to estimate the health and economic returns to investing in late-
stage clinical trials through an aggregator—that is, to develop an investment case for the launch of an
aggregator.
Global support for an aggregator
We found widespread buy-in for the notion of a new aggregator mechanism in our first round of KI interviews.
Most KIs were supportive of launching such a mechanism for late-stage clinical trials: 48% of all stakeholders
strongly supported the creation of an aggregator mechanism and 38% gave moderate support. The availability
of funding for late-stage trials is seen as the number one benefit of an aggregator. Other benefits would
include improved global coordination of R&D for PRNDs and helping to expand qualified human resources
(e.g., trialists, scientists, and data experts) in high-burden settings. Stakeholders that opposed the notion of
an aggregator (14%) worried that it would divert funding from existing initiatives, such as PDPs.
KIs would be more likely to participate in an aggregator if it provided five key incentives:
• Support for clinical trial capacity in LMICs.
• Domestic commercial benefits to LMICs through local manufacturing, ownership of intellectual property, and free licensing. Boosting local manufacturing is an incentive not just for LMICs but also for donors from HICs—greater use of LMIC manufacturing capacity could lower manufacturing costs (a “win-win” situation).
• The wide availability of low-cost products in LMICs.
• Facilitating global knowledge sharing.
• Promoting an equal partnership between Northern and Southern countries across all dimensions, e.g., participation in global governance structures, data ownership, and trial leadership (making sure, for example, that trials have principal investigators from the Global South).
KIs also argued that a new aggregator would need a robust, independent scientific process for prioritization
of research funding.
Options for the design of an aggregator mechanism for late-clinical trials
Our analysis of the results of the rapid literature review, the benchmarking of aggregator-type mechanisms,
and the KI interviews suggests that there are three major options for an aggregator mechanism for late-stage
clinical trials, as shown in Figure ES1 (the options staircase). The three options differ in scope (i.e., the range
of diseases and product types that an aggregator would include) and in the levels of funding required.

Developing an aggregator mechanism for late-stage clinical trials WORKING PAPER • 8
Figure ES1. Options staircase
Option 1 reflects the large gap in the global health R&D architecture for late phases of vaccine development,
which was acknowledged in our consultation process. The key benefit of this option would be the availability
of funding for late-stage vaccine trials and the de-risking of investments. In addition, the aggregator would
make targeted strategic investments into local manufacturing capacity.
Option 2 would fund all product types (medicines, vaccines, diagnostics, etc.) for the control of a wider set of
diseases. In addition to clinical trial costs, the aggregator would set aside funding for building clinical trial
systems and manufacturing capacity in LMICs.
Option 3 would fund all product types for the control of all PRNDs. In addition to covering the trial costs, this
third type of aggregator would invest substantially in the health research systems of LMICs and in their
manufacturing capacity. The overall goal is to build sustainable trial networks and to better embed the clinical
trial system into the overall health system.
Assessment of the three options
We analyzed the business case for each of these options along three dimensions: scope; costs and benefits;
and feasibility (Table ES1). For each option, we estimated the health benefits in terms of deaths and disability-
adjusted life years (DALYs) averted. In addition, we conducted an economic analysis, including a cost-benefit
analysis (CBA) and a cost-effectiveness analysis (CEA), for the three options. Finally, we modeled the efficiency
gains that would result from requiring that the aggregator funds more efficient (“adaptive”) trial designs—
especially faster cycle times and lower trial costs. In addition to a baseline scenario, which assumes that no
efficiency gains would arise from the aggregator, we modeled two additional scenarios – a “feasible” scenario
in which 50% of the trials supported by the aggregator adopted adaptive designs and an “ambitious” scenario
in which all trials (100%) supported by the aggregator use such designs. The results presented below refer to
the feasible scenario.

Developing an aggregator mechanism for late-stage clinical trials WORKING PAPER • 9
Table ES1. Criteria for analyzing design options for an aggregator
Option 1 offers substantial impact at moderate costs (Table ES2). If this option is implemented, we estimate
that it would cost US$2.6 billion over 11 years and it would avert 19.8 million deaths and 566 million DALYs.
The benefit-cost ratio (BCR) would be 5.65 (i.e., each US$1 invested would return US$5.65). Since a number
of key stakeholders were interested in launching a funding mechanism for late-stage trials of vaccine
candidates to tackle high burden diseases (e.g., HIV, TB, malaria, pneumonia), rapid implementation of this
option seems feasible.
If this option proves to be successful by showing that a dedicated funding mechanism for late-stage vaccine
development can effectively accelerate the R&D process, the mechanism could be broadened to include
additional product types (e.g., medicines, diagnostics) and a broader range of diseases (i.e., Option 2).
Table ES2. Assessment of Option 1 based on key criteria
Dimension Criteria
Scope
• Product types supported
• Diseases supported
• Functions performed by the aggregator (e.g., mobilizing funding, building trial capacity,
sharing best practices)
• Development phases supported
Costs and benefits
• Pipeline/development costs
• Set up and running costs
• Capacity building costs
• Efficiency gains
• Benefits (e.g., DALYs/deaths averted)
Feasibility
• Likelihood of mobilizing political support from key decision-makers to implement the option
• Potential for rapid implementation, considering the complexity of the option (e.g., expertise
needed, complexity of governance and number of actors involved, resource needs)
• Risks
Scope
Product type Vaccines
Disease focus Small subset of prioritized diseases. Modelling for the investment case assumes the diseases are HIV, TB, malaria, and pneumonia (based on high global burden of disease)
Functions performed
• Mobilization and allocation of funding for late-stage vaccine trials
• Targeted investments in building manufacturing capacity in LMICs (US$50 million per year over 5 years)
• Vaccine-related coordination and knowledge sharing
• Accountability for trials funded by the aggregator
Costs and benefits
Total costs (from 2021-2031) US$2.6 billion
Deaths and DALYs averted (from 2021-2035)
Deaths averted: 19.8 million DALYs averted: 566 million
Benefit-cost ratio 5.65
Cost-effectiveness Cost per death averted: US$2,282 Cost per DALY averted: US$80
Feasibility
Political support
Rapid launch possible as key funders expressed great interest in a vaccine-focused aggregator
Ease of implementation • Low start-up costs
• Fewer resource needs compared to other options due to narrow vaccine focus
• Likely requires launch of a new organization (but some potential to add a funding window to CEPI, an existing organization)
Developing an aggregator mechanism for late-stage clinical trials WORKING PAPER • 10
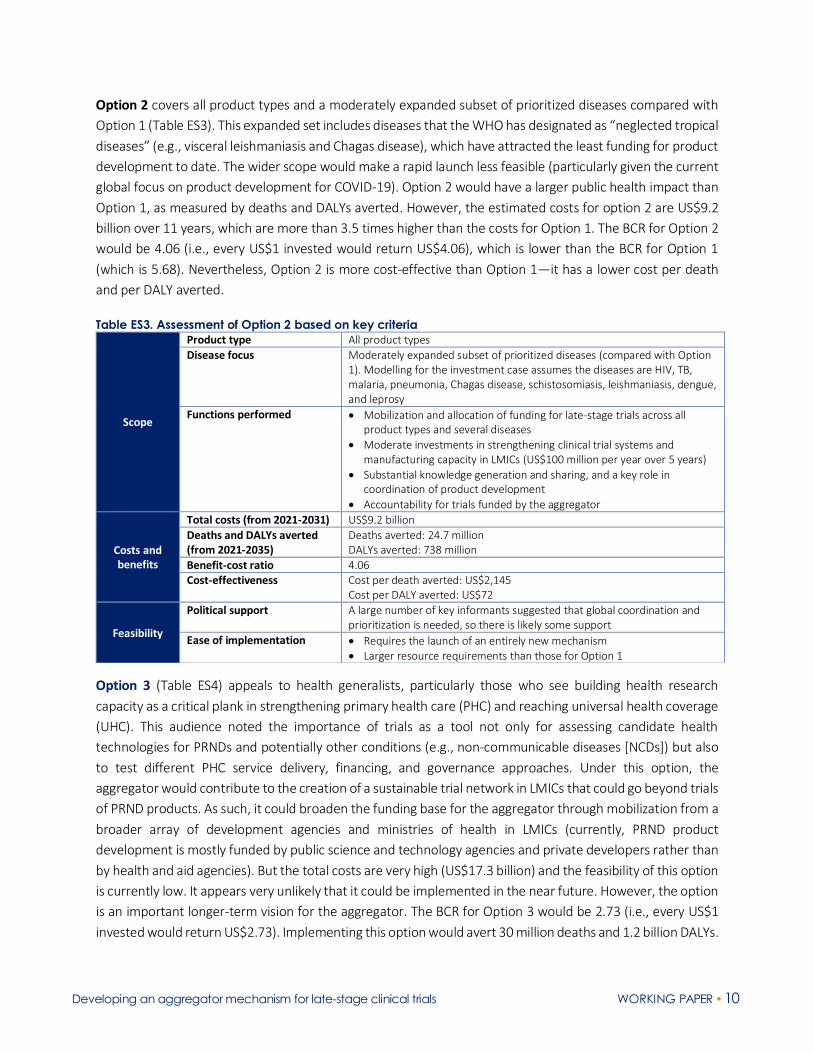
Option 2 covers all product types and a moderately expanded subset of prioritized diseases compared with
Option 1 (Table ES3). This expanded set includes diseases that the WHO has designated as “neglected tropical
diseases” (e.g., visceral leishmaniasis and Chagas disease), which have attracted the least funding for product
development to date. The wider scope would make a rapid launch less feasible (particularly given the current
global focus on product development for COVID-19). Option 2 would have a larger public health impact than
Option 1, as measured by deaths and DALYs averted. However, the estimated costs for option 2 are US$9.2
billion over 11 years, which are more than 3.5 times higher than the costs for Option 1. The BCR for Option 2
would be 4.06 (i.e., every US$1 invested would return US$4.06), which is lower than the BCR for Option 1
(which is 5.68). Nevertheless, Option 2 is more cost-effective than Option 1—it has a lower cost per death
and per DALY averted.
Table ES3. Assessment of Option 2 based on key criteria
Option 3 (Table ES4) appeals to health generalists, particularly those who see building health research
capacity as a critical plank in strengthening primary health care (PHC) and reaching universal health coverage
(UHC). This audience noted the importance of trials as a tool not only for assessing candidate health
technologies for PRNDs and potentially other conditions (e.g., non-communicable diseases [NCDs]) but also
to test different PHC service delivery, financing, and governance approaches. Under this option, the
aggregator would contribute to the creation of a sustainable trial network in LMICs that could go beyond trials
of PRND products. As such, it could broaden the funding base for the aggregator through mobilization from a
broader array of development agencies and ministries of health in LMICs (currently, PRND product
development is mostly funded by public science and technology agencies and private developers rather than
by health and aid agencies). But the total costs are very high (US$17.3 billion) and the feasibility of this option
is currently low. It appears very unlikely that it could be implemented in the near future. However, the option
is an important longer-term vision for the aggregator. The BCR for Option 3 would be 2.73 (i.e., every US$1
invested would return US$2.73). Implementing this option would avert 30 million deaths and 1.2 billion DALYs.
Scope
Product type All product types
Disease focus Moderately expanded subset of prioritized diseases (compared with Option 1). Modelling for the investment case assumes the diseases are HIV, TB, malaria, pneumonia, Chagas disease, schistosomiasis, leishmaniasis, dengue, and leprosy
Functions performed
• Mobilization and allocation of funding for late-stage trials across all product types and several diseases
• Moderate investments in strengthening clinical trial systems and manufacturing capacity in LMICs (US$100 million per year over 5 years)
• Substantial knowledge generation and sharing, and a key role in coordination of product development
• Accountability for trials funded by the aggregator
Costs and benefits
Total costs (from 2021-2031) US$9.2 billion
Deaths and DALYs averted (from 2021-2035)
Deaths averted: 24.7 million DALYs averted: 738 million
Benefit-cost ratio 4.06 Cost-effectiveness Cost per death averted: US$2,145
Cost per DALY averted: US$72
Feasibility
Political support
A large number of key informants suggested that global coordination and prioritization is needed, so there is likely some support
Ease of implementation • Requires the launch of an entirely new mechanism • Larger resource requirements than those for Option 1

Developing an aggregator mechanism for late-stage clinical trials WORKING PAPER • 11
Table ES4. Assessment of Option 3 based on key criteria
Trade-offs between the three options
Each option has specific advantages and disadvantages and prioritizing between them inevitably involves
trade-offs. Option 1 could potentially be rapidly implemented and have a substantial impact at a moderate
annual cost. It would also generate efficiencies, streamlining, and accountability in the vaccine development
space, while testing a new approach of funding late-stage clinical trials in a targeted manner. Overall, this
option promises a pragmatic yet ambitious approach to strategically address the weaknesses in the global
R&D ecosystem through coordinated funding for late-stage clinical trials.
If we benchmark Option 1 against Option 2, Option 1 appears to be more attractive for three reasons. First,
its costs (US$2.6 billion) are much lower compared to the costs of Option 2 (US$9.2 billion). Second, it also
has a higher BCR than Option 2 (5.65 vs. 4.06; see Figure ES2). Third, rapid implementation seems to be
feasible given the focused nature of the design and that key stakeholders were interested in an aggregator
that focuses initially on vaccines. Option 2 would have a larger public health impact, as measured by deaths
and DALYs averted (Figure ES2, right-hand panel), and is also more cost-effective (the costs per death and per
DALY averted are lower in Option 2 than in Option 1). Option 3 would avert the largest number of deaths and
DALYs, but it is arguably a much larger and much more costly enterprise, and thus seems to be the least
feasible at present.
Scope
Product type All product types
Disease focus All PRNDs (plus potentially NCDs)
Functions performed
• Mobilization and allocation of funding for late-stage trials for all product types and diseases
• Substantial capacity building investments to integrate the clinical trial system into the larger health system and to bolster manufacturing capacity
• Strong coordination and knowledge sharing function
Costs and benefits
Total costs (from 2021-2031)
US$17.3 billion
Deaths and DALYs averted (from 2021-2035)
Deaths averted: 30.0 million DALYs averted: 1,156 million
Benefit-cost ratio 2.73
Cost-effectiveness Cost per death averted: US$4,209 Cost per DALY averted: US$105
Feasibility
Political support
Some donors will like the focus on R&D as a tool for strengthening PHC and achieving UHC. However, resource needs are high and it is unclear if these supportive donors would provide the funding
Ease of implementation • Substantial start-up costs • Large resource requirements
Developing an aggregator mechanism for late-stage clinical trials WORKING PAPER • 12
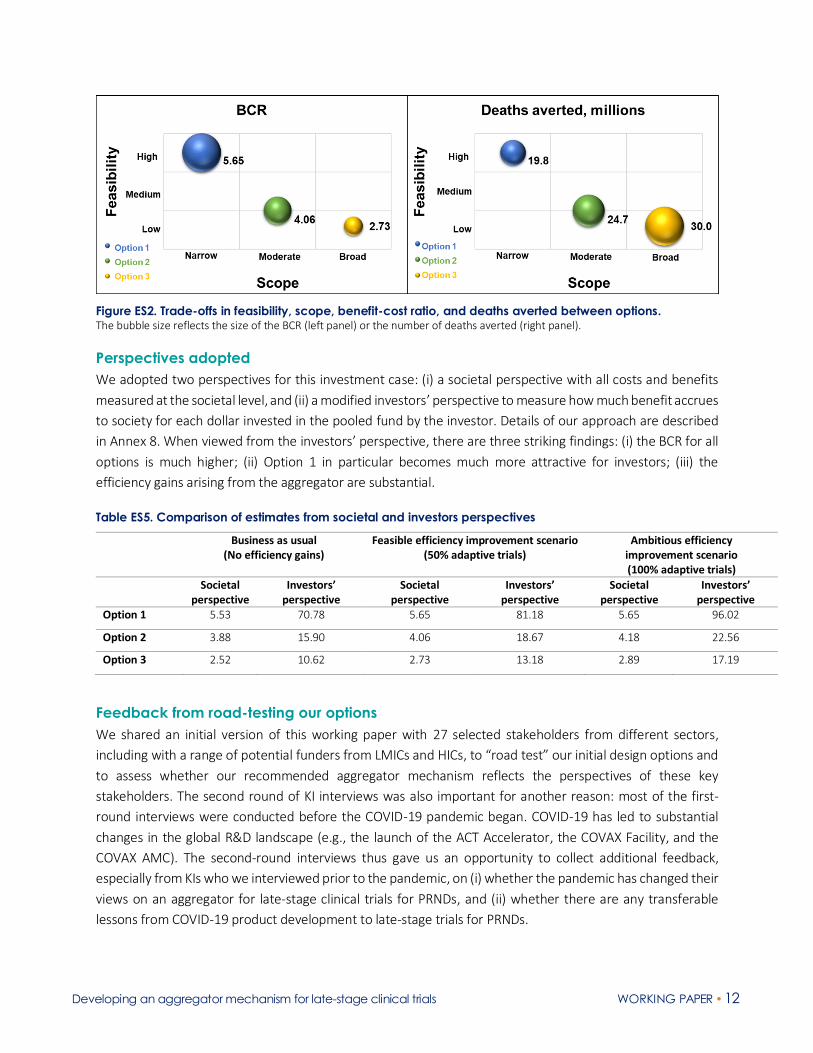
Figure ES2. Trade-offs in feasibility, scope, benefit-cost ratio, and deaths averted between options. The bubble size reflects the size of the BCR (left panel) or the number of deaths averted (right panel).
Perspectives adopted
We adopted two perspectives for this investment case: (i) a societal perspective with all costs and benefits
measured at the societal level, and (ii) a modified investors’ perspective to measure how much benefit accrues
to society for each dollar invested in the pooled fund by the investor. Details of our approach are described
in Annex 8. When viewed from the investors’ perspective, there are three striking findings: (i) the BCR for all
options is much higher; (ii) Option 1 in particular becomes much more attractive for investors; (iii) the
efficiency gains arising from the aggregator are substantial.
Table ES5. Comparison of estimates from societal and investors perspectives
Business as usual (No efficiency gains)
Feasible efficiency improvement scenario (50% adaptive trials)
Ambitious efficiency improvement scenario (100% adaptive trials)
Societal perspective
Investors’ perspective
Societal perspective
Investors’ perspective
Societal perspective
Investors’ perspective
Option 1 5.53 70.78 5.65 81.18 5.65 96.02
Option 2 3.88 15.90 4.06 18.67 4.18 22.56
Option 3 2.52 10.62 2.73 13.18 2.89 17.19
Feedback from road-testing our options
We shared an initial version of this working paper with 27 selected stakeholders from different sectors,
including with a range of potential funders from LMICs and HICs, to “road test” our initial design options and
to assess whether our recommended aggregator mechanism reflects the perspectives of these key
stakeholders. The second round of KI interviews was also important for another reason: most of the first-
round interviews were conducted before the COVID-19 pandemic began. COVID-19 has led to substantial
changes in the global R&D landscape (e.g., the launch of the ACT Accelerator, the COVAX Facility, and the
COVAX AMC). The second-round interviews thus gave us an opportunity to collect additional feedback,
especially from KIs who we interviewed prior to the pandemic, on (i) whether the pandemic has changed their
views on an aggregator for late-stage clinical trials for PRNDs, and (ii) whether there are any transferable
lessons from COVID-19 product development to late-stage trials for PRNDs.

Developing an aggregator mechanism for late-stage clinical trials WORKING PAPER • 13
In the initial version of our working paper, based on the first round of interviews, we recommended pursuing
Option 1 for the reasons outlined above (large number of deaths/DALYs averted; highest BCR; lowest costs;
highest feasibility). We also suggested that Option 1 could serve as a proof of concept and become a stepping-
stone for Option 2, and potentially also for Option 3 in the long run.
Overall, most KIs in the second-round interviews agreed with our recommendation to pursue Option 1 and
to potentially expand the vaccine aggregator to include additional product types and diseases if it proves to
be successful. KIs argued that an aggregator should have a narrow focus, at least initially – making the
mechanism too broad will make it more difficult to mobilize funding and to get it off the ground.
A few KIs preferred Option 2 and recommended immediate implementation of this option. Chinese officials
in particular were in favor of Option 2, while Kenyan representatives were split evenly between Option 1 and
Option 2. Those in favor of Option 2 emphasized the need for new treatments against diseases such as TB,
and the need to develop new technologies for the most neglected diseases, such as leishmaniasis.
Two KIs from one HIC government agreed that Option 1 would make the most sense, but argued that the
aggregator should either be broadened so that it includes a larger number of emerging infectious diseases
(EIDs) or that it should even be focused entirely on EIDs. However, CEPI focuses on the Blueprint Diseases and
is already expanding towards later development stages in response to the COVID-19 crisis and so there is no
need for a second mechanism to fund late-stage trials for Blueprint Diseases. We thus recommend that the
aggregator’s focus should be on PRNDs (not EIDs), because this is where there is a huge need and gap. This
view was also widely shared by KIs from our second round of interviews.
A critical transferable lesson from the COVID-19 pandemic is the linkage between late-stage development
and manufacturing. Unless the aggregator covers tech transfer, local manufacturing, and post-licensure
studies (Phase IV), it will leave major gaps and fall short of facilitating access to affordable products in LMICs.
Only a few LMICs currently have their own production capacity, especially for vaccines, and due to the COVID-
19 crisis, there is a new impetus for building such capacity. A main added value of the aggregator would thus
be that it not only addresses tech transfer to countries with existing manufacturing capacity, such as India,
but also contributes to building regional production capacity in Africa. Building this capacity is expensive and
HIC donors alone are unlikely to provide sufficient resources to build this capacity. In addition to smaller
strategic investments into local manufacturing capacity, the aggregator will have to be a platform for forging
partnerships with governments and companies to strengthen this capacity. At the same time, it is important
that LMICs step up and invest in their own national production capacity.
We believe that the aggregator should include the matching of resources—contributions by HIC donors
should be matched with contributions by LMICs governments in local manufacturing capacity (including
through tax benefits for companies). Such investments by LMICs into manufacturing capacity, which will be
used to manufacture products funded by the aggregator, should be counted as contributions to the
aggregator. The aggregator would enable LMICs to become a true part of the innovation spectrum. Rather
than purchasing new technologies from Northern companies, LMICs could do the local manufacturing
themselves. In this sense, the aggregator would also promote access and affordability.
Clearly, if the aggregator ignores the importance of manufacturing right from the start, this will reduce the
chances of developing and scaling up a product and making it widely available. COVID-19 has shown the

Developing an aggregator mechanism for late-stage clinical trials WORKING PAPER • 14
crucial role of manufacturing “at risk.” Just as it would not be acceptable to first develop a COVID-19 vaccine
and then have a delay of many years to scale up manufacturing capacity, it would also not be acceptable to
develop new products for PRNDs and then have a 5-year delay before they can be manufactured at scale
(arguably a failed outcome). Thus, the aggregator would also support the at-risk manufacture of the most
promising products.
How the aggregator would be governed
There are existing governance models that could be replicated by the aggregator—there is no need to
“reinvent the wheel.” Similar to CEPI’s governance arrangements, the aggregator’s governance mechanism
would have three key structures: (i) a board, comprising a smaller investors group, (ii) a scientific committee
that advises on the selection of candidates to fund, and (iii) a secretariat for the day-to-day management of
the aggregator. Strong representation of participating LMICs in these governance bodies would be essential.
Overall, we envision a two-stage prioritization process. The first step would be a WHO process to prioritize a
list of needed products. The second step would be for the aggregator’s scientific committee to take this list
and further select candidate products that should enter late-stage trials. This is similar to CEPI’s process: CEPI’s
Scientific Advisory Committee used the WHO’s list of Blueprint diseases as a starting point and then prioritized
the list further. The details of the aggregator’s prioritization process would have to be developed as part of a
business plan for the aggregator, which would have to be established based on an inclusive process.
The final decisions on funding specific candidates for late-stage trials would rest with the investors group,
though these decisions should be (a) based on guidance from the aggregator’s scientific committee (which
itself has incorporated WHO guidance), and (b) linked with or even embedded into WHO processes. Such
scientific legitimacy and buy-in from the WHO will be crucial. There has been renewed interest at the WHO
in the need for more joined-up thinking on R&D. Under the envisioned restructure, WHO wants to take more
of a streamlined end-to-end approach to supporting product development, which would connect a number
of activities at WHO in a strategic, sequenced manner. These activities include the development of target
product profiles, R&D prioritization processes, pre-qualification, the essential medicines list, and WHO’s work
on access to medicines. The R&D accelerator in the Global Action Plan for SDG3 also aims to improve the
coordination of late-stage trials. WHO’s Product Development for Vaccines Advisory Committee (PDVAC)
would also have a key role to play in the selection of vaccines.
Conclusion and recommendations
Our working paper has presented a compelling case for launching a new aggregator that would pool funds
for late-stage clinical trials of products to control PRNDs. Such an aggregator would have a substantial public
health impact. We estimate that one dollar invested in late-stage clinical trials of products for PRNDs through
such an aggregator could generate returns of about US$2.73 to US$5.65 depending on the design of the
mechanism. There also appears to be substantial support for a new mechanism, with almost 9 out of 10
respondents (86%) expressing strong or moderate support for an aggregator.
Based on a combination of likely impact, feasibility, and an in-depth global consultative process that
encompassed two rounds of interviews, we recommend that the international community pursues Option
1—an aggregator that funds late-stage trials of vaccines for a narrow range of high-burden PRNDs. This type
of aggregator has currently the greatest potential to be implemented and would have substantial impact at a

Developing an aggregator mechanism for late-stage clinical trials WORKING PAPER • 15
moderate annual cost. It would also drive efficiencies, streamlining, and accountability in the vaccine
development space, while testing a new approach of funding late-stage clinical trials in a targeted manner.
When viewed from the investors’ perspective, the attractiveness of Option 1 becomes even more apparent
(see Table ES5 above).
If this vaccine-focused aggregator proves to be successful in the development of new vaccines for PRNDs and
contributes to local manufacturing and access, it could be a stepping-stone for Option 2. CEPI is currently
being discussed as a vehicle for funding trials of COVID-19 therapeutics (which could potentially reduce viral
transmission) and so it appears to be evolving along a similar path (i.e., starting very narrow and then
broadening to include later trial phases and new product types). Option 3 is much less feasible but it will be
important to keep this option in sight given the value of strengthening health research capacity.
We believe that the COVID-19 pandemic, and the current urgency to fund COVID-19 control tools, is not a
threat to launching an aggregator for PRNDs but rather the opposite: it opens a window of opportunity. It is
true that the funding needed for the development, manufacturing, deployment, and delivery of COVID-19
technologies could end up being diverted from current funds for PRND product development. Nevertheless,
the conversations that are now happening at the highest political levels—for example, on mobilizing funds
for R&D, scaling up and globalizing manufacturing capacity, funding manufacturing at risk, creating trial
networks in the Global South, and establishing fair pricing and allocation—are setting the terms for new forms
of governance in global health R&D. There is also more attention being paid towards the development and
production of vaccines, especially in LMICs—many of these countries have been vocal in saying that they
urgently need to set up their own manufacturing capacity. There are already examples of companies in HICs
entering into licensing agreements with companies in LMICs to manufacture COVID-19 control tools. For
example, Gilead has signed non-exclusive voluntary licensing agreements with companies in Egypt, India, and
Pakistan to manufacture remdesivir for distribution in 127 countries (almost all LMICs, plus some HICs that
face obstacles to access). These developments are creating a window of opportunity to establish a new system
for funding a broader range of technologies for neglected diseases, not just for EIDs.
Although we have argued that the launch of an aggregator focusing on vaccines for an initially narrow set of
diseases is feasible, we recognize that getting any new initiative off the ground is challenging—both financially
and in its governance. We estimate that Option 1 would cost around US$2.6 billion over 11 years, a price tag
that in theory at least should not cause “sticker shock” among funders. However, the fact that the ACT
Accelerator faces a massive funding gap (it has raised only about 10% of what it needs) suggests that resource
mobilization for a PRNDs aggregator will not necessarily be straightforward. Despite this caveat, our study
suggests that the timing is right for launching an aggregator that funds late-stage trials of candidate products
to control PRNDs.

Developing an aggregator mechanism for late-stage clinical trials WORKING PAPER • 16
INTRODUCTION
Achieving many of the health targets in the Sustainable Development Goals (SDGs) will not be possible
without increased financing for global health research and development (R&D).2 Similarly, achieving “grand
convergence”—a universal reduction in deaths from infections and maternal and child health conditions—
will not be possible using today’s tools alone. Increased funding is needed to develop tomorrow’s tools.3 To
give just one example, if the global trends in mortality reduction for tuberculosis (TB) from 2010-2016 were
to continue, the convergence target (4 deaths per 100,000 population) would not be reached until 2074.3
New TB control tools—diagnostics, new chemical entities (NCEs), and highly effective vaccines—are
desperately needed to accelerate the mortality decline.
The funding trends for product development for poverty-related and neglected diseases (PRNDs) paint a
picture of a “glass half full.” As measured in the annual G-FINDER survey published by Policy Cures Research,
annual funding for such product development increased from US$3.7 billion in 2017 to US$4.1 billion 2018.4
In addition, the total number of candidates in the PRNDs product development pipeline grew by just over a
quarter between 2017 and 2019, from 538 candidates for 35 PRNDs in 2017 to 690 candidates against the
same 35 PRNDs in 2019.5 However, there is still a significant gap between current levels of investment and
the level that will be required to (a) move these existing candidates all the way through the pipeline to launch,
and (b) fill the many gaps in the current pipeline.
The funding gap is particularly large for late-stage (phase III) clinical trials. As shown by the 2019 G-FINDER
report, basic and early-stage research continues to account for the largest share of global funding for
neglected disease product development (43% in 2018). In 2018, funding for all clinical development and post-
registration studies only received about a third of the share (34% or US$1.4 billion); the remaining 26% of
funding was unspecified by R&D stage.4
Phase III trials are expensive and companies often shy away from investing in them because there is no market
for most PRNDs. For example, GlaxoSmithKline (GSK) estimated the costs for the phase III trial of its TB vaccine
candidate (M72/AS01E) to be around US$300-500 million (and the additional post licensure costs to be
US$100-$300 million).6 As the company was reluctant to put money into the phase III trials, the vaccine was
licensed to the Bill & Melinda Gates Medical Research Institute (MRI), which will lead the development of the
vaccine candidate and fund the trials.
In addition to insufficient funding, there are two other major barriers to the development of new technologies
for PRNDs. The first is the lack of coordination across R&D initiatives. At present, there is no overarching global
mechanism that is “steering the ship”—there is no universally agreed upon process for prioritizing R&D
investments for PRNDs, for selecting the most promising candidates, or for coordinating the multiple,
overlapping research programs worldwide. The result is duplication, waste, and ultimately delays in the
development of products.7
The second major barrier is the often “top down” nature of current R&D efforts for PRNDs, which have
generally done poorly at including decision-makers from high-burden countries. It is policymakers in low- and
middle-income countries (LMICs) who are in the trenches when it comes to controlling PRNDs—yet they are
often not at the table when it comes to deciding on what gets funded, where research is conducted, who gets
Developing an aggregator mechanism for late-stage clinical trials WORKING PAPER • 17
access to intellectual property, and where and how the technologies end up being manufactured. All these
steps need to be “globalized” if we are to develop and deploy new control tools.
In August 2019, we began a study to examine whether and how these challenges could potentially be
addressed through a new kind of global funding platform for late-stage clinical trials (the “R&D aggregator”).
Two key aims of this study were:
• To assess the demand for and design of an R&D aggregator
• To assess the health and economic returns of a global aggregator (i.e., to assess the investment case).
This working paper presents results on the demand for/design of an aggregator and on the investment case
for a global aggregator. It examines how the launch of a new funding platform could potentially (i) mobilize
additional funding, (ii) establish consensus on R&D priorities, (iii) bring LMIC partners to the table (including
in conducting trials and manufacturing products), (iv) facilitate information sharing across investors and
research institutions, and (v) curate a portfolio of prioritized R&D investment opportunities.
Based on interviews with 192 stakeholders across all key sectors, a literature review, and quantitative
modeling, this report presents three different options for a global aggregator. We assessed these options
along a common set of dimensions, including the scope, feasibility of launch, and the estimated costs and
benefits of the different options. Based on these options, we developed a global investment case that
estimates the costs of creating a global aggregator funding mechanism for late-stage clinical trials and the
likely economic and health benefits of such an aggregator.
Our study began prior to the start of the COVID-19 pandemic, and our focus was on PRNDs, rather than on
product development for emerging infections with epidemic or pandemic potential. Nevertheless, the flurry
of R&D activity for COVID-19, such as the launch of the Access to COVID-19 Tools (ACT) Accelerator, has
opened a window of opportunity to put global health R&D higher on the policy agenda, which we reflect on
in this paper. For example, in a recent working paper that we developed for the World Bank/Coalition for
Epidemic Preparedness Innovations (CEPI) consultation on financing COVID-19 vaccine development, we
stated:
“While the urgent need is to develop COVID-19 vaccines, this crisis could potentially also be an opportunity
to begin developing a sustained mechanism to mobilize new financing for development and product
manufacturing for a broad range of emerging infectious diseases (EIDs) and neglected diseases.”8
Structure of this paper
This paper is organized as follows. Section 2 provides an overview of the methodology of this study. Section
3 assesses the current funding for neglected disease R&D, including for late-stage clinical trials, and the
financial resources needed for such late-stage trials. Based on this assessment, the section includes our
estimate of the annual funding gap for late-stage clinical trials. The section also summarizes the main findings
from our literature review and the rapid analysis of the global ecosystem for PRND product development.
Section 4 presents the results from our key informant interviews. Section 5 outlines options for an aggregator
mechanism and assesses the investment case for each of these options. Section 6 lays out our conclusions
and recommendations.

Developing an aggregator mechanism for late-stage clinical trials WORKING PAPER • 18
METHODS
The analysis conducted for this report used a mixed methods approach, with three key components:
1. An assessment of the literature and relevant databases on product development for PRNDs, including a rapid analysis of the current global ecosystem for R&D on PRNDs.
2. Key informant interviews conducted with 192 key stakeholders. A large number of these interviews were conducted in person. Members of the research team traveled to China, India, Kenya, and South Africa. In addition, several interviews in Europe and the US were also conducted in person.
3. Quantitative modeling to estimate the costs and benefits of an aggregator mechanism.
Literature review
We conducted a review of the relevant literature on product development for PRNDs, including on global
funding for neglected disease R&D, the costs of developing new products, approaches to mobilizing new
financial resources, and barriers to late-stage clinical trials for PRNDs. The review included both the peer-
reviewed literature as well as documents and reports published by global health foundations, think tanks,
research institutes, and others.
In addition, we conducted a rapid assessment of the governance systems and R&D portfolios of PDPs and
other existing aggregator mechanisms to understand their financing focus and business models. To quantify
some of our findings, we used (1) annual revenues as a proxy for calculating the amount of funds mobilized,
and (2) publicly available pipeline data to evaluate distribution of products across clinical trial phases. The
assessment of the R&D ecosystem informed our development of options for an aggregator mechanism.
Key informant interviews
We conducted a first round of KI interviews between September 2019 and May 2020. During this first round,
we conducted 132 high-level key informant interviews (KIIs) with a broad array of stakeholders in person or
by telephone. In total, we spoke to 165 individuals (i.e., some of the interviews were conducted as small focus
groups) during this first round. These stakeholders included representatives of governments (particularly the
ministries of science and technology, health, and development), major multilateral health and development
agencies, multinational pharmaceutical companies (MNCs), contract research organizations (CROs),
philanthropies, medical research councils, PDPs, and university researchers. The aim of this “pulse-taking”
consultative process was to (a) understand whether or not there was widespread appetite for launching a
new financing aggregator for late-stage clinical trials, and (b) define the need for and ideal characteristics of
such an aggregator (e.g., whether it should focus on a narrow or broad set of PRNDs, and whether it should
focus on phase III trials alone or a broader range of activities).
Between June and August 2020, we interviewed an additional 27 KIs – including a range of potential funders
from LMICs and HICs – to road-test our initial design options. This feedback loop helped us to assess whether
our recommended aggregator mechanism reflected the perspectives of the global and local “communities”
to the extent possible.
Our study focused on four priority high-income countries (HICs): Germany, the Netherlands, the United
Kingdom, and the USA. It focused on four middle-income countries (MICs): China (upper-middle income),

Developing an aggregator mechanism for late-stage clinical trials WORKING PAPER • 19
India (lower-middle income), Kenya (lower-middle income), and South Africa (upper-middle income). There
were several factors that shaped our choice of countries:
• Selection of HICs. The key factor in selection of HICs was their significant role in providing public funding for R&D for PRNDs, as reported by the G-FINDER 2019 report. The four selected high-income countries collectively made up 78% of total funding in 2018: 68% of funding was from the USA, 8.8% from the United Kingdom, 2.8% from Germany, and 0.8% from the Netherlands.4 In selecting HICs, we also wanted to reflect a diversity in funding priorities and approaches in their support for R&D for PRNDs. The four HICs included in this study differ to some extent in their global health R&D priorities and in how they fund such R&D (e.g., in their support for pooled approaches, PDPs, etc.).
• Selection of MICs. LMICs contribute a substantially smaller share of total funding than HICs (3.7% versus 93% in 20184), yet they are becoming increasingly important funders. Out of all funding from LMICs, the largest share comes from India (70%) followed by South Africa (14%).4 China has only been included in the most recent year's G-FINDER report, and available data in G-FINDER likely underestimated China’s contribution since the data only come from one agency (the National Natural Science Foundation of China). However, even limited to this agency, in 2018 China provided the same level of funding for R&D for PRNDs as South Africa provided (US$13 million) (Table 1). In selecting MICs, we aimed to include countries that have a range of capacities in conducting clinical trials for PRNDs and that are of different income levels within the MIC category (two lower-MICs and two upper-MICs).
Table 1. Public funding for product development for PRNDs from the eight countries included in the study
Country 2018 public funding for R&D (US$ millions)
% of total public funding for R&D
High-income countries
USA 1,779 68%
UK 230 8.8%
Germany 73 2.8%
Netherlands 21 0.8%
Middle-income countries
India 66 2.6%
South Africa 13 0.5%
China* 13* 0.5%*
Kenya** n/a n/a
Adapted from G-FINDER 2019 report4 (Table 38: Top public R&D funders 2018) *Only includes data from the National Natural Science Foundation of China. G-FINDER notes that these data are not representative of total Chinese investment since they are data from a single agency. This figure excludes any contributions from the central government or local governments. **Data for Kenya were not available in the report.
Developing an aggregator mechanism for late-stage clinical trials WORKING PAPER • 20
For the KIIs, we used a semi-structured interview questionnaire (Annex 1), which was tailored to different
groupings of interviewees (e.g., there were differences in the guide for HIC versus MIC interviews, and there
were specific questions for ministry versus industry interviewees). The questions aimed to broadly assess:
• Key informants’ perspectives on the main barriers impeding product development for PRNDs
• The possible role of an aggregator in overcoming these barriers, including benefits and risks
• The value of a global mechanism versus regional mechanisms
• The overall political appetite for launching an aggregator and potential funders and supporters
• The value to LMICs of investing in an aggregator
• The ideal design of an aggregator, including governance, priority setting, and allocation of resources
• Whether an aggregator should pursue capacity building goals, and, if it should, the specific goals it should pursue
• How an aggregator would deal with ownership of intellectual property, pricing, licensing, trial data, tech transfer, and local manufacturing.
This study was approved by Duke University’s institutional review board (IRB) and by the relevant national
research agency or IRB in each of the MICs. All KIs received an information sheet and gave informed consent.
To protect the confidentiality of the interviewees, we have given no identifying information about them in
this paper. Similarly, when we describe results broken down by country, we only give aggregate data (e.g.,
we give the overall proportion of respondents in each HIC that supported the idea of an aggregator). We do
not give any disaggregated data that could identify key informants—for example, we do not present the views
of any specific bilateral or multilateral development agency.
Modeling the health and economic returns from an aggregator: how we estimated the
health benefits, cost-effectiveness, and benefit-cost ratios
Types of aggregator options modeled. As described later in this paper, we developed three key aggregator
options based on findings from the surveys and review of important literature. For this working paper, we
developed an investment case for all three options. For each option, we modeled three efficiency scenarios:
(i) a business-as-usual scenario with no efficiency gains, (ii) a “feasible” scenario with efficiency gains from
funding a portfolio with 50% adaptive trials, and (iii) an “ambitious” scenario with efficiency gains from
funding a portfolio of 100% adaptive trials.
The three aggregator options modeled are:
• Option 1: An aggregator for late-stage trials of vaccines to control a narrow set of diseases: HIV, TB, malaria, and pneumonia.
• Option 2: An aggregator for late-stage trials of a broader set of products (vaccines and therapeutics) for a wider range of diseases: HIV, TB, malaria, pneumonia and five diseases that the WHO has designated as “neglected tropical diseases” (Chagas disease, schistosomiasis, visceral leishmaniasis, dengue, and leprosy). Such neglected tropical diseases have been the “most neglected” of the PRNDs in terms of funding for product development.

Developing an aggregator mechanism for late-stage clinical trials WORKING PAPER • 21
• Option 3: An aggregator for all PRNDs and products, which would also make substantial investments into the health research capacity of LMICs to build a sustainable clinical trial network in these countries.
Estimating the costs of an aggregator for phase III trials. As a starting point for estimating the benefit-cost
ratio of these three aggregator options, we built a discrete-events simulation model in SimEvents (Matlab
R2020a). We designed the SimEvents model to mirror the architecture of an Excel-based financial modeling
tool called the Portfolio-to-Impact (P2I) tool, which we have described in detail in three published studies that
we co-authored.5,9,10 The advantage of our new model over P2I for this analysis is that it allowed us to: (i) treat
each candidate product as a separate entity rather than as a homogenous group, and (ii) introduce
stochasticity which is a better representation of the product pipeline development process. In brief, our
model estimates the costs to move a portfolio of candidate health products through the pipeline from
advanced preclinical to launch (launch is defined as a candidate making it through phase III), as well as the
product launches that would result. The tool is based on assumptions for costs, attrition rates, and cycle times
per phase for different product types (e.g., repurposed drugs, NCEs, simple vaccines, complex vaccines). In a
new study funded by TDR, we conducted a pipeline portfolio review as of August 31, 2019 to identify existing
candidates for 45 PRNDs (as defined by Policy Cures Research).5 For the aggregator study, we modeled the
investments needed and the potential successful candidate products over an 11-year period between 2021
and 2031. We identified those candidates that were in advanced preclinical development, phase I, or phase
II. We then assumed that the early-stage pipeline of candidate health products will be replenished every year,
at a rate similar to the current rates at which candidates enter the advanced preclinical phase. We then used
our model to estimate (i) the number of these candidates that would make it into phase III trials and would
thus be funded by an aggregator, (ii) the eventual number of successful candidates that make it to the launch
stage for each disease and product type, and (iii) the expected year for each successful product launch.
Estimating the benefits of the aggregator. For each successful product launch, we estimated the health and
financial benefits that will accrue between the launch year and 2035. We assumed that a product will enter
the market one year after launch because of the various market entry requirements that might be imposed
by different governments. We make the simplifying assumption that the primary benefits of vaccines arise
through reduction in incidence while therapeutics provide benefits through expansion in coverage and/or
increase in therapeutic effectiveness. For this working paper, we model the effect of therapeutics as primarily
occurring through coverage expansion alone, while the effect of diagnostics will occur through improved
diagnostic accuracy which would lead to increases in treatment coverage. Consequently, upon market entry,
we assume that vaccines will provide a 10 percentage-point reduction in annual incidence of the disease in
the first year, and an additional 10 percentage points for each subsequent year afterwards for a maximum of
a 90-percentage point decrease. For therapeutics, we assumed that baseline coverage will increase by 10%
in the first year and by an additional 10% for each year up to 2035 or to a 95% treatment coverage rate,
whichever comes first. We reviewed the literature to identify baseline disease burden by age group in terms
of incidence, prevalence, annual number of deaths, disability weights for different disease states, and
treatment costs. We used these inputs along with other key assumptions to estimate the following for each
of four scenarios—a baseline scenario, Option 1, Option 2, and Option 3:
• The annual number of cases, deaths, and disability adjusted life years (DALYs)

Developing an aggregator mechanism for late-stage clinical trials WORKING PAPER • 22
• The treatment costs of the product
• The annual number of needed product doses
• The procurement costs for vaccines and drugs.
We compared Option 1, Option 2, and Option 3 against the baseline scenario to estimate number of cases
averted, deaths averted, DALYs averted, treatment costs averted, and incremental costs for vaccines and
therapeutics. Using these estimates, we calculated the cost-effectiveness of the different design options i.e.,
the cost per DALY averted and the cost per death averted. We also estimated the benefit-cost ratios for each
of the three aggregator options. Both a societal perspective and the perspective of the funders who invest in
the aggregator were considered in this analysis (Table 2).
Table 2. Impacts included in the investment cases for the two types of aggregator options
Type of impact Included in this analysis from which perspective? Societal1 Fund investors1
Costs
Program costs (start-up + operational) ✓ ✓
Phase III investments ✓ ✓
Costs to procure new products2 ✓
Benefits
Deaths averted ✓ ✓
DALYs averted ✓ ✓
Treatment costs averted ✓ ✓3
Profit accrued from new products4
Notes: 1. The societal perspective answers the question: “how much does society benefit for each dollar society invests in the
aggregator.” The investors’ perspective answers the question: “how much does society benefit for every dollar added to the fund by the investor?”
2. We assumed that all costs incurred beyond launch are implicitly reflected in the product’s unit price. This includes cost of the product and cost of distribution.
3. For the investors’ perspective, societal benefits were estimated as the net sum of treatment costs averted and costs of new treatments procured.
4. We assumed a profit of 0% i.e., we assumed aggregator funders do not receive any profits from any successful launches. Note: A detailed description of the methods that we used to conduct the BCA are in Annex 2.
Estimating the efficiency gains: For each aggregator option, we estimated gains that might accrue to
society from improvements in efficiency of the product development process as a result of the new
aggregator mechanism. We assume that an aggregator mechanism could improve efficiency in several
ways, such as: (i) improved allocative efficiencies from better decision making about investments; (ii)
improved operational efficiencies and reduced operational costs from centralizing
application/disbursements and use of shared administrative resources; and (iii) improved technical
efficiencies of clinical trials through increased funding of cutting-edge approaches such as adaptive clinical
trials. We describe each of these in more detail below.
i. Potential improvements in allocative efficiencies include decision-making to allocate aggregator
funds in ways that prioritize development of candidate products with higher potential for success,
and/or higher market potential. Based on responses from the interviews we conducted, there is a

Developing an aggregator mechanism for late-stage clinical trials WORKING PAPER • 23
clear preference for this mechanism to be a non-profit fund rather than a fund driven by return-
seeking behavior. Therefore, disease burden will be the main prioritization factor—not market
size or profit potential. The aggregator could also choose to prioritize candidates with higher
potential for success (i.e., optimizing the number of launches per dollar spent), or allow multiple
parallel trials of similar candidates where possible (i.e., optimizing speed by shortening time to
market). For this analysis, we assume the latter, such that any product candidate ready to enter
phase III will be funded regardless of whether there are other similar candidates in phase III. Our
results should be interpreted through that lens.
ii. Improvements in operational efficiencies from an aggregator mechanism (compared to not
having an aggregator) could arise from centralizing applications, reviews, and disbursement of
funds. Such centralization in turn will translate to lower transaction costs. Indeed, interview
respondents believe that this would be an improvement over the current mechanism and would
save multiple hours currently spent on fund raising. However, current data on transaction costs
from donors and recipients are not available, making a quantitative assessment of efficiencies
impracticable. Therefore, for this analysis, we included only qualitative assessments of potential
efficiency gains from reduction in transaction costs. Moreover, compared to pipeline
development costs, setup and administrative costs comprise a small fraction of total aggregator
costs. For example, setup costs for an aggregator ranged from US$ 36 million for Option 1 to US$
87 million for Option 3, while operational costs ranged from US$ 25 million per annum for Option
1 to US$ 60 million per annum for Option 3. By contrast, drug development costs were US$ 2.1
billion for Option 1, US$ 8.3 billion for Option 2, and US$ 15.6 billion for Option 3.
iii. Potential gains from improved technical efficiencies include gains that would accrue from funding
adaptive clinical trials. Following expert consultations, we surmise that adaptive trial designs can
shorten phase-times by up to six months per phase, lower study sample size by up to 40%, and
lower overall trial costs by up to 15%. We therefore modeled three efficiency scenarios. The first
was a business-as-usual scenario with no efficiency gains. The second was a “feasible” efficiency
improvement scenario in which 50% of the trials supported by the aggregator adopted adaptive
designs (which translates into an aggregate reduction of 3 months in phase length for all phases and
a 7.5% reduction in late-stage trial costs). The third was an “ambitious” efficiency improvement
scenario in which all trials supported by the aggregator use adaptive designs (translating into a
reduction of 6 months in phase length for all phases and a 15% reduction in late-stage trial costs).
Due to data limitations, we limited the analysis for this working paper to the potential gains from
improved technical efficiencies that would accrue from funding adaptive clinical trials.
Limitations of our study
This study used a novel mixed-methods approach to examine the feasibility and potential impact of a new
funding aggregator for late-stage trials. Over a short timeframe, we conducted a very large number of KIIs
(165 KIs in the first interview round and 27 KIs in the second wave) with all key organizations in the R&D
landscape for PRNDs, and we complemented this consultative approach with quantitative modeling to build
an investment case.

Developing an aggregator mechanism for late-stage clinical trials WORKING PAPER • 24
Despite these strengths, our approach also had a number of limitations. We highlight several of these below.
Literature review. Given time constraints, we conducted only a rapid synthesis of the literature, including a
rapid assessment of existing aggregator-type mechanisms. But these were not formal systematic reviews or
meta-analyses—they were aimed at quickly gathering key background data.
Key informant interviews. Our KIIs were semi-structured interviews aimed at gaining an in-depth
understanding of stakeholders’ views about a new funding mechanism (they were not a formal quantitative
survey). KIs sometimes did not wish to answer all questions. When we present numerical results (e.g., the
proportion of KIs who were supportive of an aggregator), these are therefore not based on all first-round
interviews with 165. Throughout the paper, when we present these types of numerical data, we have given
the sample size (N). The 27 KIs interviewed during the second round of interviews received a different set of
questions related to our initial options, and were not included in the counts.
Data on costs, success rates, and cycle times. Our models used the same data inputs from the P2I model. These
data on costs, success rates, and cycle times were based review of 25,000 development candidates. They
were validated with peer-reviewed estimates, and industry records. They therefore represent averages over
the entire pool (not the highest or lowest) and therefore more reflective of a real-world experience.9
Modeling for the benefit-cost ratio. As described in detail in Annex 2, as with all models, our modeling was
based on a number of assumptions, such as the potential impact of new health technologies. For all
assumptions, we based these on the best available data, but there will always be uncertainties around these
assumptions. For example, we only have data about candidates that are currently in the pipeline so we made
assumptions about the future flow of new candidates into the pipeline (see Annex 2 for details on these
assumptions). In addition, our model only includes four phases of development: advanced pre-clinical, phase
I, phase II (it does not distinguish between phase IIa and phase IIb), and phase IIII, and thus it under-estimates
the full costs of developing a new product for PRNDs. However, since we are primarily interested in the phase
III costs, this did not affect our estimates.

Developing an aggregator mechanism for late-stage clinical trials WORKING PAPER • 25
THE VALLEY OF DEATH IN FUNDING LATE-STAGE DEVELOPMENT FOR PRNDS
In this section, we assess the annual funding gap for late-stage clinical trials. We also summarize the main
findings from our literature review and from our rapid analysis of the global ecosystem for PRND product
development.
3.1 Quantifying the valley of death
Our new study of the pipeline of candidates under development for PRNDs (medicines, vaccines, diagnostics,
reproductive health technologies, and vector control products) has illustrated a valley of death at the late-
stage of development.5 There is a large drop-off in the pipeline of candidates from phase II to III, which partly
reflects the very high costs of phase III trials (see Annex 3 for the number of candidates in phase II). As of
August 31, 2019, just 49 out of the 522 candidates (9.4%) in the pipeline for PRNDs were in phase III (this
number excludes diagnostics due to their different R&D process) (Table 3).5
Table 3. Candidates under development for PRNDs in phase III (total, and as a % of all candidates), as of
August 31, 2019*
Pipeline Number of candidates in
phase III
Total number of
candidates across four
phases (advanced pre-
clinical, phases I-III)
Percentage of all candidates that
are in phase III
PRNDs 49 522 9.4%
*Table excludes diagnostics.
Key reasons for this valley of death in late-stage trials are that there is too little funding for such trials, there
are too few funders, and the financing is highly fragmented, creating inefficiencies. The result is that for many
fatal or disabling conditions, the prospects for developing urgently needed control tools are very poor.
Funding for basic and early-stage research has historically received the largest share of all funding for
neglected disease R&D, and it still received the largest share (43%) in 2018. Funding for all clinical
development and post-registration studies only accounted for about a third of all R&D funding for PRNDs (34%
or US$1.4 billion) in the same year (the remaining 26% of funding was unspecified by R&D stage). 4
How much additional funding is needed for late-stage trials of products for PRNDs? A reasonable estimate of
the need comes from our new study on the current R&D pipeline for neglected diseases.5 We used the P2I
tool to estimate (a) how much it would cost to move current candidates through the pipeline, (b) the likely
associated launches, and (c) the costs to develop critically needed “missing” products that are unlikely to be
launched based on the current pipeline. We had previously done this analysis based on the 2017 pipeline for
35 PRNDs (comprising the list of diseases that Policy Cures Research used for its annual G-FINDER survey),9
There is a large funding gap for late-stage clinical trials of products for PRNDs. While our own research shows that annually about US$1.7 billion is needed for such late-stage clinical trials, current spending on these trials amounts to an estimated US$700 million. As such, there is an annual funding gap of around US$1.0 billion. While this gap is substantial, it would be feasible to mobilize this amount from the global community.

Developing an aggregator mechanism for late-stage clinical trials WORKING PAPER • 26
and we repeated this analysis for the current pipeline (as of August 31, 2019).5 For the current pipeline review,
Policy Cures Research expanded its list to include a total of 45 diseases (see Annex 4). For these 45 diseases,
we identified 754 candidates. Our modeling using the P2I tool found that it would costUS$21.0 billion to move
these 754 candidates through the pipeline, leading to 207 launches by 2031 (Annex 5).
For the purposes of this paper, we then amended the list of diseases included in our costing so that we could
compare the estimated costs of moving candidates through the pipeline with the annual disbursements from
the 2019 G-FINDER report.4 We tried to make this an “apples to apples” comparison. This amendment was
necessary because our initial costing of 45 diseases does not fully match the list of diseases included in the G-
FINDER report. For example, the G-FINDER report does not include funding for product development for
sexual and reproductive health, Ebola, and a few other diseases that were all part of our costing. On the other
hand, snakebite envenoming was not included in our costing but has since been included in the G-FINDER
report. Thus, our comparison of costs versus the disbursements documented in the G-FINDER report has
some limitations.
Based on the amended list of PRNDs, the costs of moving product candidates through the pipeline total
US$15.9 billion. Almost two thirds (US$9.9 billion, 62%) of the US$15.9 billion needed would be for late-stage
clinical trials (Annex 6). Over three quarters of the costs would be incurred in the first 5 years – a total of
US$7.41 billion or US$1.48 billion per year over the next 5 years.
In addition, there would still be 16 highly needed “missing products” based on the current pipeline (e.g., a
hepatitis C vaccine, a vaccine for multiple diarrhea diseases). It would cost a median of about US$9.85 billion
(ranging from US$5.5-14.2 billion, depending on product complexity) to develop these products, of which
US$1.74 billion (US$1.37 billion to US$2.1 billion) would be required for phase III trials through 2031. Seventy
percent of these additional costs would be incurred in the next five years (US$1.21 billion) – the annual cost
would thus amount to US$0.24 billion.
The total annual resource needs for late-stage trials of products for PRNDs are therefore estimated to be
US$1.72 billion (US$1.48 billion + US$0.24 billion). As highlighted above, currently all annual funding for all
clinical development and post-registration studies is around US$1.4 billion.4 If we assume that half of this
US$1.4 billion is spent on phase III trials, a conservative estimate is that there is an annual funding gap of at
least US$1.0 billion for late-stage clinical trials (Table 4).
This is a substantial gap – however, when put into perspective, the gap seems to be manageable. In 2018,
official and private donors provided a total of US$26.2 billion in official development assistance for health.
The financing gap for late-stage clinical trials is only 3.9% of this amount.10 If compared with estimates from
the Institute for Health Metrics and Evaluation (IHME), which uses a different definition of global health
financing and gives the estimated global funding at US$38.9 billion in 2018, the amount needed for late-stage
clinical trials is an even smaller proportion (2.6%).11

Developing an aggregator mechanism for late-stage clinical trials WORKING PAPER • 27
Table 4. Annual funding gap for phase III trials over next 5 years
Cost category Annual costs, US$ billion Available annual
funding, US$ billion Annual funding gap, US$ billion
Costs to move current
candidates through the
pipeline
1.48 0.7* 1.02
Additional costs to
launch “missing”
products
0.24
Total 1.72
*Assumes that 50% of all funding for clinical and post marketing R&D (i.e., 50% of US$1.4 billion) is currently being spent on phase III.
3.2 A mismatch between funding and needs
Specifically, we found that the size of the R&D pipeline (i.e., the number of candidates under development)
for diarrheal diseases, salmonella infections, helminth infections, and kinetoplastid infections (Chagas disease,
visceral leishmaniasis, and sleeping sickness) either fell or was at best unchanged from 2017 to 2019. Of the
35 diseases included in our review of the 2017 pipeline, 15 still had fewer than four candidates each in the
pipeline in 2019. Many of these are neglected tropical diseases, whose funding has remained more or less
stagnant over the course of the last decade, while funding for HIV/AIDS, TB, malaria, and Ebola has grown
significantly.4 It is also very concerning that there was no increase in the number of NCE candidates in the
R&D pipeline (in fact there were two fewer in 2019 than in 2017), despite the overall pipeline growing by
more than a quarter.
3.3 The valley of death for vaccine trials
For vaccine development specifically, Rappuoli and colleagues have recently shown the challenges of
conducting late-stage trials (Figure 1).1 While there have been improvements in early stage development,
thanks to investments by the Bill & Melinda Gates Foundation, PATH, and others, “these improvements in the
early development process have revealed a new, and possibly more perilous, Valley of Death in the late
vaccine development phase.” According to Rappuoli et al, late development is responsible for 70% of total
vaccine development costs. However, there is a major gap in the financing architecture for such late
development (Figure 1 shows this gap, which is denoted by “?”). The large costs and time commitments are
explained by the need to (a) produce vaccine candidates according to good manufacturing practice standards
in purpose-built production facilities, (b) conduct large-scale phase III trials, (c) submit data to regulators, and
In addition to highlighting the financing gap for late-stage trials, our new study of the pipeline of candidates for PRNDs also shows that (a) there continues to be insufficient R&D for a number of the “most neglected” diseases, and (b) there has been little growth in recent years in the number of candidates that are NCEs.
The current global ecosystem for R&D suffers from a particularly large gap for late-stage clinical trials for vaccines.

Developing an aggregator mechanism for late-stage clinical trials WORKING PAPER • 28
(d) conduct post-marketing surveillance. Although not shown in the figure, phase IV costs can also be
substantial.1
Figure 1. Stages of vaccine development and delivery The figure shows three stages of vaccine development: discovery (10% of the R&D budget), early development (20% of the budget), and late development (70% of the budget). Under the graph are the funders and stakeholders involved at each step. A major gap can be seen in the financing architecture for late development (denoted by “?”). Figure adapted from a figure in reference 1.
3.4 The current R&D landscape for PRNDs
How has the valley of death arisen, why is there a mismatch between funding and R&D needs, and how has
the international community attempted to address these challenges? Below, we briefly address these
questions. We show how the current R&D architecture, despite yielding successes, still has a major gap when
it comes to funding late-stage trials. In launching a new aggregator, it would be important to (a) build on and
complement the existing architecture, and (b) fill a “niche” that has clearly not been filled to date.
As argued above, funding of late-stage clinical trials for PRNDs is extremely limited in the current landscape
with only about 10% of all candidates in clinical development currently in phase III. Late-stage trials of PRND
candidates conducted in LMICs are costly. In the P2I model, for example, which is based on historical data
from around 25,000 product development candidates, the assumption is that the phase III costs for
development of a complex vaccine are US$223 million, compared with US$2.5 million for phase I and US$13.9
million in phase II. There are at least three main factors that prevent the mobilization of large amounts of
financing for late-stage trials.
0
50
100
Inve
stm
en
t in
R&
D (
%)
10 %
30 %
Commercial
Discovery Early development Delivery & stockpilingLate development
Antigen discovery,Adjuvant discovery,Formulation, Animal studies
Academia, Industry, Biotech, BMGF,Wellcome Trust,Human Vaccine Project
Systematic discovery,Optimization, Phase Iand II
Industry, Biotech, BMGF Medical Research Institute,Wellcome Trust, GSKVaccines Institute forGlobal Health, Hille-man Laboratories,CEPI, PATH, IAVI, IVI
Final manufacturing pro-cess, Final facilities, Phase III, Licensure, Monitoring, Recommendation
Industry
?
Procurement, Deploy-ment, Vaccination
Governments, WHO,Gavi, Unicef, Industry,Developing countrymanufacturing facilities
Pro
cess
fo
r R
&D
com
me
rcia
liza
tio
nSt
ake
ho
lde
rs
Proof of concept in the clinic
Proof of concept in
the laboratory
Registration,Monitoring,
Recommendation

Developing an aggregator mechanism for late-stage clinical trials WORKING PAPER • 29
Barriers to financing late-stage trials
The first barrier is the “free-rider” problem in global health R&D. If one country can potentially benefit from
the investments made by another country, there is a temptation for countries to stay on the sidelines when
it comes to funding R&D (they can reap the benefits without taking any risks). The phenomenon may
contribute to aggregate global underinvestment in R&D, including late-stage trials.13
The second factor is market failure, especially for the “most neglected” PRNDs. Governments and patients in
countries where PRNDs dominate have limited purchasing power. These diseases predominantly affect
countries in LMIC markets where per capita income is almost thirty times less than high-income markets.14 As
a result, pharmaceutical companies have no incentive to produce diagnostics, drugs, and vaccines for these
diseases since high-income country markets will likely have no reason to purchase these products.4
Third, there is limited existing late-stage clinical trial capacity and expertise in some LMICs. Grover and
colleagues highlighted these barriers in the context of gynecological malignancies.15 In some LMICs, concerns
include poor quality of informed consent, sub-optimal regulatory processes for new drugs and clinical trials,
inadequate protection of patients’ rights and compensation, too few facilities, lack of trained human
resources, and limited expertise and motivation to conduct research. These findings are in line with a recent
report specifically focused on late-stage clinical trials capacity and innovation in South Africa.16 In-country
barriers thus limit global appetite to fund clinical trials in countries where there is a large population affected
by PRNDs.
Initiatives aimed at financing product development for PRNDs
Over the past two decades, a number of “push” and “pull” incentives have been developed and tried in an
attempt to address these barriers. Push mechanisms, such as R&D tax credits and research subsidies, reduce
R&D costs. Pull mechanisms provide financial incentives aimed at increasing revenues—examples include
priority review vouchers, milestone prizes and competitions, and advanced market commitments. Other
policy initiatives that have aimed to improve the overall R&D ecosystem for PRNDs include open science
approaches, patent pools, and providing technical assistance with technology transfer to build research and
production capacity.
An important governance innovation that has shaped the PRNDs R&D landscape is PDPs. In addition to
offering centralized coordination, PDPs also have lower research costs than research-based pharmaceutical
companies due to (i) lower capital costs (because they can leverage in-kind inputs) and (ii) selectively investing
in projects from a pool of existing public/private projects.17 Examples of PDPs that have brought drugs for PRNDs
to market include the Medicines for Malaria Venture (MMV), which has helped develop eleven new medicines
or formulations for malaria, and the Drugs for Neglected Diseases initiative (DNDi), which has successfully
developed two new medicines for sleeping sickness. Of note, very few PDPs have brought new vaccines to
market for PRNDs – PATH’s RTS,S/AS01 malaria vaccine is the most notable one currently in registration.18
PDPs have not been the only mechanism for improving R&D coordination. The World Health Organization
(WHO) and the European Commission have also strived to streamline coordination of funding for clinical trials,
particularly in the pre-clinical and early clinical trial stages, to varying degrees of success.
Developing an aggregator mechanism for late-stage clinical trials WORKING PAPER • 30
The WHO’s Consultative Expert Working Group on Research and Development (CEWG) proposed the creation
of a voluntary pooled fund to finance global health R&D needs in LMICs, accompanied by a global observatory
to monitor such R&D and a series of demonstration projects to show how the fund would work.19 While a few
countries initially pledged funds to this pooled mechanism (e.g., Switzerland pledged US$6 million, Norway
pledged US$1.3 million, and Brazil pledged US$1 million), the mechanism failed to gain traction.
The European Parliament and Council created the European and Developing Countries Clinical Trials Partnership
(EDCTP) in 2003 with a similar mandate to promote collaborative research supported by multiple funding
agencies. The EDCTP is funded by the European Commission (EC), matched by contributions from participating
states. Under the EU’s Horizon 2020 program, the EU is providing up to €683 million for the period 2014-
2024. The first two programs (EDCTP1 and EDCTP2) have funded more than 184 clinical trials to date.20
There have been similar efforts for AMR. The Global AMR R&D Partnership (GARDP) was launched in May
2016 by the WHO and DNDi to improve coordination and collaboration in global AMR R&D and increase
investments into R&D for AMR. Since its launch, over US$60 million has been pledged and four products have
achieved registration status with investments from GARDP.21 GARDP also works closely with a global
knowledge center called the Global AMR R&D Hub that attempts to centralize global priorities for AMR R&D
across the one health continuum.22
Assessment of aggregator-type mechanisms
To better understand the landscape of existing coordination mechanisms (which we call “aggregator-type
mechanisms”), we conducted a rapid assessment of 12 mechanisms that vary in terms of their size, scope,
focus, and approach. The 12 mechanisms comprised (a) five PDPs (the International AIDS Vaccine Initiative
[IAVI], MMV, PATH, DNDi, and the TB Alliance) that collectively receive about 65% of total annual funding to
PDPs, and (b) seven intermediary funding mechanisms (EDCTP, the Global Health Technology Fund [GHIT],
the Global Health Investment Fund [GHIF], CEPI, GARDP, the Combating Antibiotic Resistant Bacteria
Biopharmaceutical Accelerator [CARB-X], and UNITAID) that account for US$1 billion in annual funding.2 These
initiatives target the development of drugs, diagnostics, and/or vaccines for PRNDs, AMR (CARB-X), and EIDs with
epidemic potential (CEPI). Annex 7 summarizes the key features of these 12 aggregator-type mechanisms,
including their partners, the amount of funding they have mobilized, their governance, and the status of their
products/trials to date.
Four key findings emerged from our assessment of these mechanisms:
First, most mechanisms are narrow in scope, focusing on just one or two diseases. For example, in an analysis
of eight projects in its portfolio, DNDi spent almost 75% of its funding to develop two trypanosomiasis
(sleeping sickness) drugs.23 Similarly, HIV, TB, and malaria accounted for about two-thirds of all grants
disbursed by EDCTP in 2018.3 The GHIF is an example of mechanism that has invested funds across a broader
range of diseases—it has made investments in eleven products to treat/prevent conditions such as polio,
measles, rubella, zika, malaria, and dengue – with grants averaging US$5-10 million.24 Some global health
researchers argue that a disease-specific focus (as in the case of DNDi and EDCTP) in the setting of limited
coordination across funding platforms can contribute to competition for scarce resources.7
Second, an analysis of the portfolios of these 12 mechanisms shows that there are very few late-stage
products in the pipeline for PRNDs, AMR, and EIDs. As mentioned above, although most coordination

Developing an aggregator mechanism for late-stage clinical trials WORKING PAPER • 31
platforms fund product development across phases I-IV, most candidates are still highly concentrated in
preclinical research and early-stage trials rather than in phase III (Tables 5 and 6). For example, of IAVI’s 20
candidates currently in the pipeline, only two candidates are in phase III.4 Although these mechanisms have
few candidates in phase III and IV, these late-stage clinical trials are still responsible for the bulk of their
expenses. For example, in a 2018 report of DNDi’s portfolio, phases II, III and registration accounted for 65-
70% of all expenses.23 This finding is in line with our own estimate that about 62% of the total cost of moving
candidates through the pipeline can be attributed to phase III (Annex 6).5 Thus, even with the many
aggregator-type mechanisms in place today, we still see a gap when it comes to late-stage trials, explained in
part by the high trial costs.
Table 5. Number of candidates in the pipeline for top 4 PDPs by funding (based on publicly available
information as of September 15, 2020)
PDP Discovery and pre-clinical
Phase I Phase II Phase III Registration and beyond
Source
PATH (Malaria Vaccine Initiative)
6 5 0 1 https://www.malariavaccine.org/projects/mvi-portfolio
IAVI 8 10 2 0 https://www.iavi.org/our-science/pipeline
TB Alliance n/a 2 2 3 2 https://www.tballiance.org/portfolio
DNDi 19 6 11 13 https://dndi.org/wp-content/uploads/2020/06/DNDi-June2020-RDPortfolio.pdf
NOTES: Because PATH only provides a breakdown of candidates by stage for malaria vaccine projects, reported numbers may not be indicative of PATH’s entire portfolio. MMV is one of the top five PDPs by funding, but is not captured in the table given its use of a different taxonomy for reflecting a product’s status. MMV focuses on malaria drugs. According to MMV’s website, as of September 2020, there are nine products in the translational phase, nine products in the development phase, and 13 products approved/available for access. For IAVI, phase I and II candidates are combined given the way its candidates are reported in its pipeline. The breakdown as reported by IAVI is as follows: phase I (3), phase I/II (5), phase II (1), phase IIb (1).
Table 6. Number of candidates in the pipeline for selected funding mechanisms (based on publicly
available information as of September 15, 2020)
Funding mechanism
Discovery and pre-clinical
Phase I
Phase II
Phase III
Registration and beyond
Source
EDCTP n/a 6 16 18 8 https://edctp.maglr.com/international-partnerships-against-infectious-diseases/cover
GHIT 38 1 3 1 1 https://www.ghitfund.org/investment/portfolio
CARB-X 38 1 0 0 0 https://carb-x.org/portfolio/portfolio-pipeline/

Developing an aggregator mechanism for late-stage clinical trials WORKING PAPER • 32
CEPI 16 11 3 0 https://cepi.net/research_dev/our-portfolio/
NOTE: For EDCTP, we relied on data from its 2018 annual report. Candidates may have changed and are not reflected in the above table. EDCTP does not report diagnostic trials by phase. According to its 2018 annual report, there were a total of four candidates in observational studies and eight candidates in non-phase diagnostic trials.
A number of these mechanisms are considering expanding their focus to include more late-stage clinical trials.
For example, CARB-X is considering expansion from preclinical research and phase I to include support for
Phases II and III for candidates that have successfully graduated from CARB-X. A coalition of PDPs is advocating
that EDCTP double its funding to 1.36 billion Euros to successfully support “EDCTP3’s goal of funding more
Phase III and IV trials.”25
Third, disaggregating by product type shows that mechanisms that have a broad product type focus are more
likely to fund drugs and diagnostics in phase III than vaccines. For example, in 2018, out of 14 vaccine studies
funded by EDCTP, only three (21%) were categorized as candidates in phases III or IV; in contrast, out of 33
drug studies, 22 (67%) were categorized as candidates in phases III or IV. Similarly, out of 30 drug candidates
funded by GHIT, one (3%) was in phase III; in contrast, out of 14 vaccine candidates, none (0%) was in phase
III. In addition, two out of the top five PDPs by funding focus only on drugs (DNDi and MMV). Since its
inception, DNDi has funded clinical trials for drug therapies targeting sleeping sickness, leishmaniasis, and
Chagas while MMV has funded pediatric formulations and new combination drug therapies for malaria. The
focus on drugs over vaccines may reflect the likelihood of market failure for high-risk, low-margin products,
like vaccines, and underscores the need to develop innovate funding mechanisms for such products.
Fourth, aggregator-type mechanisms have historically relied on funding from governments and foundations
to fund clinical trials, but there have been some recent initiatives to diversify funding streams by leveraging
private funding. Annual private sector funding of product development for PRNDs has increased from US$331
million in 2009 (9% of all funding for such product development) to US$598 million 2018 (17% of all funding).4
This shift can be partially attributed to an increasing push to develop incentives for private sector
pharmaceutical companies using impact investing principles. For example, in 2013, GHIF pioneered a funding
model where investors receive a small return on investment for funding R&D for PRNDs. The Bill & Melinda
Gates Foundation offers a loss-sharing agreement to private investors that limits downside risk of any
investments that fail in the long-term. A number of companies such as JP Morgan, GSK, Pfizer, and Merck
have invested into GHIF since 2013 with almost US$108 million total committed.26 Governments have offered
innovative value propositions to partner with pharmaceutical companies, as seen with GHIT in Japan.
In summary, the current landscape of product development for PRNDs, AMR, and EIDs is fragmented across
aggregator-type mechanisms with no concerted coordination or priority setting between them. The
mechanisms we reviewed predominantly focus on funding early-stage product development; the gap in
funding late-stage trials for vaccines is particularly acute. Few aggregators take a multi-disease approach. The
gap in the existing architecture points to the need for a new kind of aggregator funding mechanism that could
play a critical role in coordination of late-stage trials. In their review of existing aggregator-type mechanisms,
Beyeler and colleagues also conclude that a global health R&D coordination platform is needed, and that it
should (1) develop broad-based and public ownership and management, (2) separate coordination and
financing functions, (3) create multi-disease platforms, (4) pair global and national efforts, (5) develop an

Developing an aggregator mechanism for late-stage clinical trials WORKING PAPER • 33
international roadmap for conducting R&D, and (6) develop a strategy for the sustainability of the platform’s
secretariat.7
What COVID-19 means for the R&D landscape
The flurry of R&D activity devoted to development of COVID-19 control tools shows that if a single infectious
disease threatens all nations (not just LMICs), large amounts of financing for product development can be
quickly mobilized and new aggregator-type structures can be rapidly launched:
R&D financing for COVID-19. R&D financing has been raised through a combination of existing mechanisms
(e.g., CEPI has mobilized financing for COVID-19 vaccine development) and new approaches (e.g., the May 4
2020 COVID-19 pledging conference, hosted by the European Union).
Aggregator-type mechanisms for COVID-19 R&D. On April 24 2020 a new aggregator-type governance
mechanism was launched, the Access to COVID-19 Tools (ACT) Accelerator. The ACT Accelerator is defined as
a “landmark, global and time-limited collaboration to accelerate the development, production and equitable
global access to new COVID-19 essential health technologies.”27
The accelerator has four pillars:
• The diagnostics pillar, co-led by FIND and the Global Fund
• The therapeutics pillar, co-led by UNITAID and the Wellcome Trust
• The vaccine pillar, co-led by Gavi, CEPI, and the WHO
• The health systems pillar, led by the World Bank and Global Fund, and supported by the WHO, which
aims to support the delivery of diagnostics, therapeutics, and vaccines.
In addition, on June 4 2020, Gavi launched an advanced market commitment for COVID-19 vaccines, the first
building block of a broader mechanism, the COVAX Facility. Countries that participate in the facility will be
guaranteed access to enough vaccine to cover 20% of their population (i.e., high-risk groups such as health workers
and the medically vulnerable). HICs and upper middle-income countries will participate as self-funding countries,
while lower middle-income countries and low-income countries will be funded by Gavi to participate. The deadline
for the first binding financial commitments to the Facility is August 31, 2020.
Overall, the COVID-19 pandemic has led to an increased awareness of global health (i.e., of the inter-
connectedness of nations) and of the need for global health R&D. As the closure of businesses and stay-at-
home orders ravage economies, governments are realizing the importance of investing in the development
of new technologies to save trillions of dollars down the road. But it remains unclear whether there are
transferable lessons from COVID-19 to PRNDs. Clearly high-income nations have been hit hard by COVID-19
in terms of numbers of cases and deaths (for example, as of August 12, 2020, the US accounts for about a
quarter of the world’s cases), so these countries have an incentive to invest in R&D. Similarly, the
pharmaceutical industry has an incentive to invest in COVID-19 diagnostics, treatments, and vaccines because
there is a huge global market for COVID-19 technologies.
While the incentive structure is different for COVID-19, the crisis could potentially have a positive impact on
product development for PRNDs. The international efforts that have emerged to fund COVID-19 R&D and to
channel such funding to multiple, simultaneous development efforts show that large-scale global investment

Developing an aggregator mechanism for late-stage clinical trials WORKING PAPER • 34
for targeted health R&D can be mobilized. COVID-19 has also raised awareness of the large gaps in global
health funding more broadly, including funding for product development. Crucially, this awareness has gone
far beyond the “usual suspects” and it could help to convince decision-makers that a new funding system for
PRNDs is needed. COVID-19 has shown, very clearly, that the current global health R&D system has major
weaknesses, not just a lack of financing but lack of prioritization, coordination, and information. The pandemic
has shown now, more than ever, why we need an overarching aggregator that not only aggregates financing,
but also know-how, technical expertise, prioritization, and other critical functions.

Developing an aggregator mechanism for late-stage clinical trials WORKING PAPER • 35
DEVELOPING AN AGGREGATOR FOR LATE-STAGE CLINICAL TRIALS
In the previous section, we showed that there is a funding gap for late-stage clinical trials alongside an
institutional gap in the global ecosystem for PRND product development. In this section and the following
sections, we present the results from our first round of KIIs, which we conducted to better define the need
for and ideal characteristics of an aggregator.
4.1 Overall levels of support, main advantages, and risks
We found widespread buy-in for the notion of a new aggregator mechanism. Most key informants were
supportive of launching such a mechanism for late-stage clinical trials: 48% of all stakeholders strongly
supported the creation of an aggregator mechanism and 38% offered moderate support. Fourteen percent
of stakeholders opposed the idea of an aggregator (Figure 2).
Figure 2. Do consulted stakeholders support the creation of a new aggregator mechanism? (N= 107)
What would be the main benefits of an aggregator? The number one benefit offered by key informants,
proposed by 77% of those interviewees who expressed an opinion on this topic, was mobilization of funding
(Figure 3). Stakeholders saw a range of other potential benefits of an aggregator. Forty-four percent argued
that the aggregator should help to boost qualified human resources (e.g., trialists, scientists, and data experts)
and 37% argued that an aggregator could mobilize increased investment in the clinical trial infrastructure in
LMICs. Building such capacity would have benefits beyond PRNDs. Strong clinical trials systems could also
support trials for other areas, such as NCDs, EIDs, and AMR. Some KIs expressed an even broader vision in
which strengthened trial capacity could be valuable for LMICs in reaching universal health coverage and in
strengthening primary health care and health systems—for example, if this capacity was used to test different
service delivery approaches or provider payment mechanisms.
There is substantial support for the creation of an aggregator mechanism for late-stage clinical trials: 86% of consulted stakeholders expressed strong or moderate support for such an aggregator. The availability of funding for late-stage trials is seen as the number one benefit of an aggregator. Stakeholders would also want such an aggregator to invest in infrastructure and human resources to build sustainable clinical trial systems in LMICs. Stakeholders that opposed the notion of an aggregator (14%) believe that it could divert funding from existing initiatives.
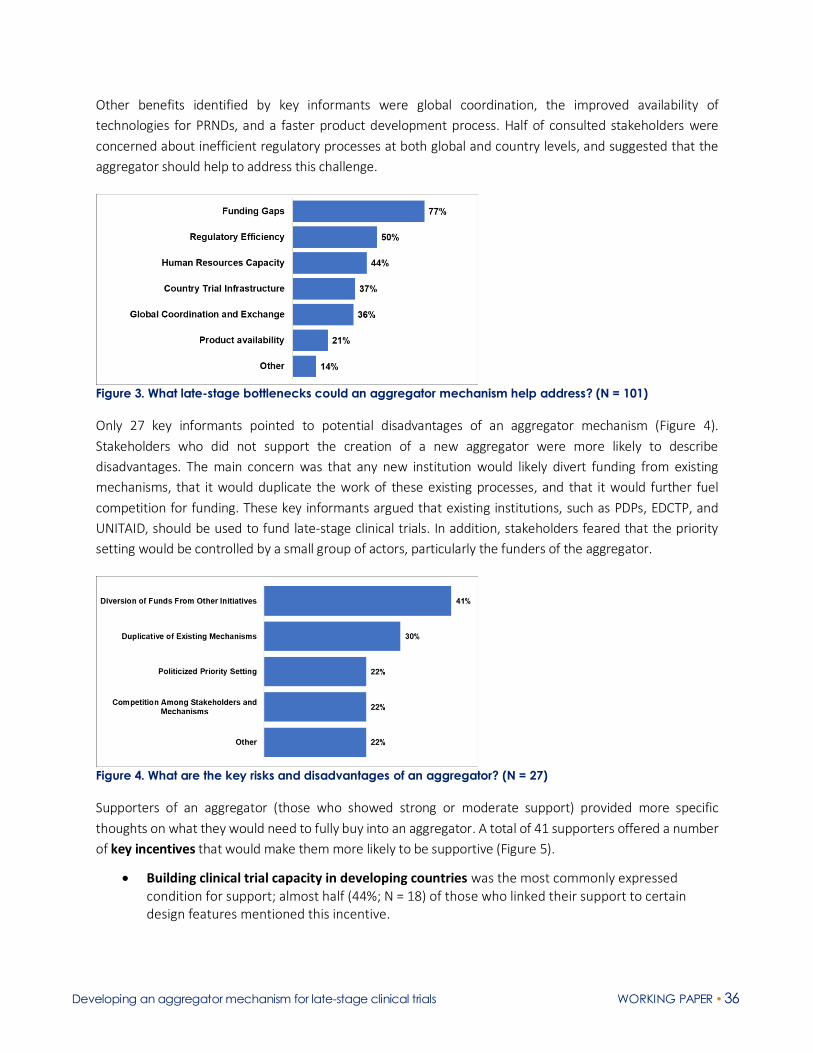
Developing an aggregator mechanism for late-stage clinical trials WORKING PAPER • 36
Other benefits identified by key informants were global coordination, the improved availability of
technologies for PRNDs, and a faster product development process. Half of consulted stakeholders were
concerned about inefficient regulatory processes at both global and country levels, and suggested that the
aggregator should help to address this challenge.
Figure 3. What late-stage bottlenecks could an aggregator mechanism help address? (N = 101)
Only 27 key informants pointed to potential disadvantages of an aggregator mechanism (Figure 4).
Stakeholders who did not support the creation of a new aggregator were more likely to describe
disadvantages. The main concern was that any new institution would likely divert funding from existing
mechanisms, that it would duplicate the work of these existing processes, and that it would further fuel
competition for funding. These key informants argued that existing institutions, such as PDPs, EDCTP, and
UNITAID, should be used to fund late-stage clinical trials. In addition, stakeholders feared that the priority
setting would be controlled by a small group of actors, particularly the funders of the aggregator.
Figure 4. What are the key risks and disadvantages of an aggregator? (N = 27)
Supporters of an aggregator (those who showed strong or moderate support) provided more specific
thoughts on what they would need to fully buy into an aggregator. A total of 41 supporters offered a number
of key incentives that would make them more likely to be supportive (Figure 5).
• Building clinical trial capacity in developing countries was the most commonly expressed condition for support; almost half (44%; N = 18) of those who linked their support to certain design features mentioned this incentive.

Developing an aggregator mechanism for late-stage clinical trials WORKING PAPER • 37
• To make an aggregator mechanism attractive to MICs, informants argued that it would need to have domestic commercial benefits through local manufacturing, ownership of intellectual property, and free licensing. It was not just MIC interviewees who expressed this view. Donors from high-income countries also expressed interest in greater use of MIC manufacturing capacity because of lower costs (a win-win situation).
• Supporters would be incentivized by the aggregator having a narrow focus on a specific set of priority diseases and by it providing sustainable support (including for infrastructure).
• There needs to be an equal partnership between Northern and Southern countries across all dimensions, such as participation in global governance structures, data ownership, and trial leadership (making sure, for example, that trials have principal investigators from the Global South).
• Affordability and low product costs were cited as being as important (especially to MICs) – any new products funded by the mechanism need to be affordable to countries.
• The aggregator should leverage and support existing PDPs.
Figure 5. What supportive stakeholders need to fully buy into an aggregator (N = 41)
4.2 Support for an aggregator across geographies and stakeholder types
Support was particularly strong among key informants based in the four MICs: 64% of stakeholders in MICs
strongly supported the creation of an aggregator mechanism and 36% gave moderate support (Figure 6). No
stakeholders in MICs opposed the creation of an aggregator. In Europe, 41% strongly supported the creation
of a mechanism and 34% gave moderate support. The lowest levels of support came from the US, with only
24% strongly supporting the creation of a new mechanism while 24% expressed low support for a new
mechanism.
Stakeholders from MICs voiced strong support for an aggregator for late-stage clinical trials. The level of support differs significantly across high-income countries and across different groupings of global experts and stakeholders.

Developing an aggregator mechanism for late-stage clinical trials WORKING PAPER • 38
Figure 6. Levels of support by broad geography (N = 107)
A high proportion of key informants across all stakeholder types expressed strong support for an aggregator,
ranging from 43% among regulators to 67% among private sector KIs (Figure 7). Half (50%) of consulted
philanthropic organizations and 49% of government stakeholders strongly supported the launch of a new
mechanism for late-stage clinical trials. Within each stakeholder group, more than two-thirds of interviewees
expressed strong or moderate support for a mechanism. A grouping that we categorized as “other
stakeholders” (e.g., civil society organizations) was most skeptical about a new mechanism – only 33% of
stakeholders from this group voiced strong support for the creation of an aggregator mechanism. Notably, no
private sector informants opposed the mechanism and only 9% of government stakeholders expressed low
levels of support.
Figure 7. Levels of support by stakeholder type
Support from MICs
Most interviewees from MICs, both as a whole as well as by individual countries, strongly support the
establishment of a new mechanism. Very solid support for an aggregator came from Kenya and India, where
79% and 64% of consulted stakeholders, respectively, expressed strong support for a new mechanism (Figure
8). Stakeholders in each country expressed that they would be willing to contribute trial infrastructure to a
mechanism, and to some extent financing.

Developing an aggregator mechanism for late-stage clinical trials WORKING PAPER • 39
Figure 8. Levels of support for an aggregator across four MICs
Conditions for support. All four MICs noted that both capacity building and domestic commercial benefits
(e.g., job creation) are key conditions to giving their support, although KIs in South Africa and India expressed
the importance of these conditions more than KIs in Kenya and China. All four MICs recognize that there are
shortcomings in their clinical trial systems, and specifically mentioned that they face limitations in their
regulatory capacity, human resources, and infrastructure. Pooling expertise and facilitating cross-country
knowledge sharing is of high importance across these countries. Capacity building is considered essential for
the success of an aggregator mechanism in these settings.
Consensus areas. There was broad consensus across these countries on three key issues: pricing of products,
priority setting, and governance. Stakeholders in all MICs argued that any resulting product from this
mechanism must be affordable. All MIC stakeholders said that disease burden should be the driving factor for
prioritizing diseases and guiding allocation decisions. However, all MICs emphasized the need for ensuring
domestic stakeholders are engaged in the priority setting process to ensure local buy-in. Stakeholders were
united in their vision for North-South equity in the governance of an aggregator, and some argued that there
should be representation from civil society organizations (CSOs), faith-based groups, and affected
populations. There was no concern expressed in the KIIs conducted in MICs in engaging the private sector in
the mechanism, as long as technical experts guide decision-making and a balance is struck between
profitability and affordability of resulting products.
Key incentives. MIC informants described three incentives that an aggregator could offer. The first is
affordable access to domestically manufactured products. The second is ensuring sustainability—i.e., making
sure that the government can continue such manufacturing after an aggregator mechanism ends. Attracting
local manufacturing was also seen as a major incentive for engagement, although this was emphasized more
in India and South Africa than China and Kenya.
Differences between countries. There were a number of key differences in how different countries saw the
value of an aggregator. KIs in China and India said knowledge sharing is potentially more valuable to them
than receiving funding, whereas the other countries expressed a need for financial support for late-stage
trials. South African informants expressed interest in identifying ways to embed the clinical trial system into
the broader health system. Indian stakeholders noted that while the country has significant experience with
generics, it needs support to develop innovative products– an external mechanism could help support entry
into this space, including through the distribution of knowledge and best practices. Kenya’s R&D system, said

Developing an aggregator mechanism for late-stage clinical trials WORKING PAPER • 40
KIs in Kenya, remains heavily reliant on external funders. Kenya has interest in expanding its R&D footprint,
but requires more infrastructure and investment to do so.
Support from HICs
We found variation in support levels for a new aggregator across the four HICs included in our study. The
proportion of KIs in each country who offered “strong support” ranged from 24% in the US to 60% in Germany
(Table 7).
Table 7. Levels of support in HICs and from global/regional/other stakeholders
High-Income Countries
Support Level US UK Germany Netherlands Global/
Regional Other
Strong 24% 50% 60% 33% 20% 46%
Moderate 52% 40% 40% 33% 50% 15%
Low 24% 10% 0% 33% 30% 38%
Common themes across all HICs. We identified a number of common themes. First, across the four HICs
included in our study, there was a very strong sense that an aggregator must pool not just money but
expertise and capabilities (as one KI said, it should be a “center of excellence that maps global capabilities and
makes connections”). Second, a view expressed across all HICs was that an aggregator must clearly do
something different to what PDPs are already doing, and should be careful not to weaken or divert funds from
existing PDPs. It should build on the success of PDPs and not be duplicative. Third, an aggregator should link
and coordinate with existing initiatives – for example, EDCTP and the US National Institutes for Health (US
NIH) trial networks.
Differences in funding approaches and priorities. We also identified some important differences in the ways
that HICs fund product development for PRNDs and in their research priorities. The US is an outlier in that it
has not traditionally put funding for such R&D into pooled mechanisms over which it has no control. The US
has, however, provided technical assistance and other assets (e.g., trial sites) to pooled R&D funding
mechanisms. A good example is US support for CEPI—the US has not funded CEPI but has supported it in
other ways. KIs in the US also had more positive views on the role of return-seeking behavior in an aggregator
and in general on the role of the for-profit pharmaceutical industry. With respect to priorities, different HICs
have publicly stated their own priorities when it comes to global health R&D. Some countries, for example,
strongly prioritize sexual and reproductive health (SRH) in their global health efforts and indicated that an
aggregator should also include SRH-related R&D.28 There was also no agreement about the scope of the
aggregator. A range of KIs from HICs thought that the aggregator should have a broad scope (in terms of
product types and diseases) so that it can help to coordinate and rationalize the R&D ecosystem. Other HICs
think that an aggregator with a narrower mandate (e.g., vaccine-focused) would be more valuable.

Developing an aggregator mechanism for late-stage clinical trials WORKING PAPER • 41
4.3 Contributions to the aggregator
Stakeholders agreed that there should be a global funding pool to finance late-stage clinical trials of candidate
products for PRNDs. Contributions to the global pool of funding would certainly come from traditional
donors—that is, governments of HICs and philanthropic organizations, though some key informants in HICs
argued that it should not just be the “usual donors” that come forward.
Some stakeholders from China, India, and South Africa indicated that these countries should also contribute
to the global pool, although government representatives from these countries indicated that their
contributions would rather be made through in-country investments. These MIC government stakeholders
proposed that they could support the trials through the provision of funding to public and private research
institutes and developers within their own country (India is taking such an approach in its funding to CEPI). In
addition, LMICs would cover the costs for human resources and infrastructure. They could also put in place
policies to move trials forward and increase regulatory capacity. In this sense, LMICs would “match" the
contributions of HICs. Investments from LMICs will be critical and MICs signaled in our conversations a
willingness to invest. In exchange for providing these matched contributions, LMICs could be given
manufacturing rights—which could be a powerful incentive to bring LMICs to the table.
Representatives from industry indicated that they could provide expertise and potentially funding for trials
on a case by case basis (i.e., cost sharing). However, the KIs who we interviewed from industry said that they
would not be able to make contributions to the pool. However, they were very supportive of an aggregator
as it would provide predictable funding for late-stage clinical trials, facilitate exchange of information, and
provide a list of prioritized products. As such, industry was very interested in an aggregator.
As we highlighted above, stakeholders in all MICs argued that any resulting product from this mechanism
must be affordable. Country stakeholders made it very clear that their participation is linked to affordable
products. Even many MICs struggle to purchase health technologies due to high prices, which is one of the
reasons why there is so much concern worldwide about the final price of COVID-19 vaccines once they are
developed.29 The price of the products is a “deal breaker” for the aggregator, argued many KIs. For this reason,
it is very unlikely that an aggregator could be funded from return-seeking investors (or even a blend of public
and return-seeking investment), since the expected financial returns would drive up product prices
unaffordable to many poor countries. While recent research has suggested that up to US$1 billion annually
could be mobilized from return-seeking investments by 2030, these types of investments are unlikely to be a
good fit for a late-stage trials aggregator.
Contributions to the aggregator’s global pool of funding would have to come from HIC donors but LMICs will also have to contribute – either through direct investments into the global pool or through financial support to trials that are conducted in their own countries. In this sense, LMICs would “match" the contributions of HICs.

Developing an aggregator mechanism for late-stage clinical trials WORKING PAPER • 42
4.4 Scope of an aggregator mechanism for late-stage clinical trials
Consulted stakeholders fully recognized that there is a need for an aggregator for phase III trials (Figure 9).
No single interviewee disagreed that an aggregator mechanism should provide funding for phase III. A total
of 21 consulted stakeholders made the case to include Phase IV funding. They argued that post-marketing
costs can be substantial and that these studies are critically important.
Other stakeholders rather opted to “go down a bit” in phase, i.e., to also include earlier phases, especially
phase IIb trials for vaccines (a total of 15 stakeholders suggested including phase IIb). This group of
stakeholders argued that very few candidates make it to and survive phase III. They argued that if the phase
III trial is successful, there will be funders who come in and fund phase IV activities.
A few KIs also made the case for a much broader mechanism, including for early clinical stages and basic
research. Five consulted stakeholders suggested that the mechanism should include phases IIa through IV.
Only two stakeholders suggested that the new fund work with existing delivery mechanisms or surveillance
systems in addition to funding phases IIb to IV.
R&D Phases (# of Respondents) I IIA IIB III IV Delivery
3 2 3 4 14 5 2
Total 3 10 15 33 21 2
Figure 9. Which product development phases should an aggregator fund? How to read this table. The first row shows that 3 interviewees suggested an aggregator should include phase I to phase III. The second row shows that 2 interviewees suggested that the aggregator should include phase IIA to phase III. The total in the second column (labeled phase IIA) shows that 10 interviewees said that phase IIA should be funded by an aggregator.
Almost two-thirds of stakeholders (64%) suggested that an aggregator mechanism should fund late-stage
trials for all product types (drugs, vaccines, diagnostics, and vector control products). The remaining 36%
indicated that the mechanism should at least initially have a focus on specific product types: (a) 24%
advocated for an aggregator mechanism that would target vaccines, and (b) 12% argued in favor of a
mechanism that would fund late-stage clinical trials for TB therapeutics because of the increasing number of
cases of multi-drug resistance TB (MDR-TB) and extensively drug-resistant TB (Figure 10).
In terms of which development phases an aggregator should support, consulted stakeholders agreed that phase III funding is key, though many argued that mobilizing funds for phase IIb vaccine trials and for phase IV are also crucial. However, consulted stakeholders had different views about the scope of an aggregator (i.e., the product types and diseases). One group was in favor of a broad aggregator mechanism that would support the entire spectrum of product types and all PRNDs from the G-FINDER list. A second, albeit smaller, group was in favor of a narrower, more targeted aggregator mechanism that at least initially focusses on late-stage clinical trials for vaccines and a smaller number of diseases. The group that favored a narrow approach argued that such a mechanism would be more feasible and less costly to launch and it could help to show proof of principle by bringing some targeted quick wins.

Developing an aggregator mechanism for late-stage clinical trials WORKING PAPER • 43
In addition, 80% of stakeholders argued that an aggregator should cover all PRNDs, while 20% found a more
targeted disease focus more viable (Figure 11). The need to develop new technologies for TB control was
mentioned most often (N = 6).
A few stakeholders offered a different vision and advocated for an aggregator that would only fund “truly”
neglected tropical diseases (e.g., kinetoplastid infections), which receive very little attention and for which a
substantial treatment gap persists. These stakeholders believed that HIV, TB, and malaria should be excluded
from the list of supported diseases because they receive the lion’s share of the funding (the three diseases
collectively received 69% or US$2.8 billion of all global funding for neglected disease R&D in 20184). Yet others
acknowledged this fact and made the case to earmark a share of the aggregator’s funding for clinical trials for
the most neglected diseases.
Figure 10. Scope of aggregator in terms of product types supported (N=33)
Figure 11. Scope of aggregator in terms of diseases supported (N=55)

Developing an aggregator mechanism for late-stage clinical trials WORKING PAPER • 44
As such, stakeholders fell in two groups with respect to the scope:
• A first group was in favor of a broad aggregator mechanism, which would support the entire spectrum of product types and all PRNDs from the G-FINDER list. This group emphasized the need to coordinate the fragmented and inefficient global community that works on product development for PRNDs. For this group, the main benefit of the aggregator is to rationalize the product pipeline based on a strong prioritization process (see the section on governance below) and to provide coordinated funding to late-stage clinical trials.
• A second, albeit smaller, group made the case for a narrower, more targeted aggregator mechanism that at least initially focusses on clinical trials for vaccines and a smaller number of diseases. Once this narrow mechanism has proven to be effective, its scope could potentially be broadened. This group believes that a targeted approach would have several advantages:
o A targeted scope is more appealing to donors because the initial investments would be smaller than for a broad aggregator.
o The return on investment would be easier to measure.
o The set up and annual running costs would be lower. The management unit (secretariat) would require less expertise (e.g., it would need expertise just in vaccines and not in all product types) compared to a broader mechanism, and the governance could also be organized in a more efficient way.
o A narrowly defined aggregator could be launched much faster.
o The aggregator mechanism could be more easily attached to an existing organization (e.g., CEPI or Gavi for vaccines); in contrast, a broader, more encompassing aggregator would very likely require the launch of a new institution.
Overall, stakeholders from the second group referred to CEPI as a successful example of a funding mechanism
with a narrow focus on infections with epidemic potential, and suggested that a similar design and process to
the one used by CEPI could be a useful approach. The rapid launch of new mechanisms to fund product
development for COVID-19 control has also shown the feasibility of launching a very narrow aggregator with
a tightly defined scope for a disease that threatens all nations.
4.5 Governance and prioritization of product candidates
Stakeholders argued that there are successful existing governance models (e.g., those used by CEPI, the TB
Alliance, or Gavi) that could provide a valuable blueprint for the governance of the aggregator—there is no
need to “reinvent the wheel.” In addition, KIs referred to broad governance principles:
Membership model: Key informants proposed that the aggregator would be based on a “membership”
model, i.e., those who are members of the aggregator mechanism must make contributions (funding, policy
or other contributions), and thus get representation on the board. Stakeholders stressed that representation
from LMICs will be critically important because PRNDs mostly affect these countries, and thus the decisions
The governance of an aggregator mechanism should include multiple stakeholders, including from LMICs. In addition, strong governance must also include a robust, independent scientific process for prioritization of research funding.

Developing an aggregator mechanism for late-stage clinical trials WORKING PAPER • 45
made by the aggregator board affects them the most. As one key informant noted, the aggregator needs “to
balance out considerations: technically strong countries may not have a heavy burden of disease. Beneficiary
countries should have a voice too.”
Strong participation of LMICs in the aggregator’s scientific committee: KIs argued that there needs to be a
scientific committee that provides scientific guidance and recommends which product candidates should be
prioritized. Depending on the scope of the mechanism, there may need to be multiple committees – for
example, one for diagnostics, one for vaccines, and one for therapeutics. Key informants considered that the
inclusion of LMICs in the scientific panel would be crucial to ensure both bottom-up and top-down views
(LMICs cannot just be included as “window dressing”). There is a need for a “domestic group” on the panel,
when deciding on projects, as LMIC scientists “understand the capacity, the national situation better.”
Well-resourced secretariat: The secretariat needs expertise in a range of areas (e.g., the science of R&D,
coordination, partnership management, fundraising, communications, and M&E) and there needs to be an
adequate budget for supporting these functions (some KIs argued that the aggregator’s secretariat should be
based in an LMIC, to counterbalance the fact that all major funding mechanism for PRND R&D are in the
Global North).
A global versus a regional aggregator mechanism. Overall, stakeholders agree that a global mechanism
would be most appropriate, though there could be strong regional roles within a global mechanism (i.e., a
global system with strong regional factions). For example, regional bodies could make a global fund more
efficient by limiting the mechanism’s interactions with individual countries. One stakeholder recommended
that funding allocations by a global fund could be made regionally (e.g., 25% to Latin America), and regional
bodies could further decide on how best to implement. Another stakeholder suggested making some
accommodations to LMICs to gain buy-in for a global fund, for example by ensuring their contributed funds
could remain local/regional. Finally, a few stakeholders suggested that piloting this mechanism in one region
before expanding globally could help mitigate some of the perceived risks of a global mechanism. Table 8
summarizes the trade-offs in launching a global versus a regional aggregator.

Developing an aggregator mechanism for late-stage clinical trials WORKING PAPER • 46
Table 8. Advantages and disadvantages of a global or regional mechanism Advantages Limitations (in comparison to other option)
Global mechanism
• Coordination/reduced fragmentation • Greater diversity of trial sites and trial
data
• Shared use of experts and knowledge exchange
• Balances out potential nationalistic tendencies
• Lack of LMIC ownership • Greater complexity
Regional mechanism
• Closer to decision-making authority
• Improved priority setting
• More likely to have LMIC buy-in
• Potential to become too country-specific
• Increased administrative burden
• Not necessarily more effective than global bodies • Increased competition for resources/benefits would
remain domestically
Assuming an aggregator for late-stage trials is launched, and mobilizes new financing, we asked stakeholders
about the criteria that they would use for choosing which candidates are funded. Eighty-five percent of
respondents referred to health impact (burden of disease) and 51% to scientific and technical feasibility
(Figure 12). In addition to these two criteria, a substantial share of respondents (46%) felt that the most
neglected diseases should also be in the mix. These stakeholders believe that the aggregator should set aside
funding for diseases for which there is a large treatment gap.
Figure 12. Which prioritization criteria should an aggregator use? (N=41) Abbreviations: BoD: burden of disease; S&T: scientific and technical
Overall, there was agreement among consulted stakeholders that there needs to be a strong scientific process
to prioritize among potential candidates and allocate available funding. This process would draw on a range
Health impact and scientific/technical feasibility are considered to be the two most important criteria for prioritizing products. However, stakeholders felt that the development of technologies for the most neglected diseases should also be in the mix. Stakeholders agreed that there need to be approved metrics to prioritize across potential candidates to be funded, but there was less consensus about the decision-making process (i.e., who gets to decide and how). Investors cannot dominate the allocation process. The role of funders and of the WHO in the prioritization process were both areas of contention among stakeholders.

Developing an aggregator mechanism for late-stage clinical trials WORKING PAPER • 47
of data from multiple sources, such as WHO (e.g., from the Global Observatory on Health R&D), universities,
academics (e.g., Duke University’s work on the pipeline of products for PRNDs5), the G-FINDER report,4 the
World Bank, and high-burden countries themselves. As one key informant said, “funding allocation should be
based on need, given to projects that have passed all the robust stage gates, and agnostic as to disease or
technology.”
The role of WHO. One area of contention was the role of WHO in the prioritization process:
• One group of stakeholders saw a very strong role for WHO in the prioritization process. While the aggregator’s pooled fund itself should be housed somewhere independent, this group argued that the prioritization process should be led by WHO. These stakeholders believed that WHO clearly has crucial role for priority-setting, but it has been under-funded. For example, there has been pushback against the WHO’s role in R&D priority setting from countries such as the US, who not want to be constrained in terms of what they can invest in. The group that sees a strong role for WHO also argues that WHO represents all countries and that it is already doing a lot of prioritization, pointing to examples such as the WHO’s role in developing the roadmap for neglected diseases 2021-2030,30 the WHO’s access to medicines initiatives,31 the R&D Blueprint,32 and the End TB Strategy’s R&D priorities.33 KIs in this group argued that WHO “had done a good job” on prioritizing R&D for AMR and EIDs and on the ESSENCE on health research initiative.34 There has also been renewed interest at WHO in the need for more joined-up thinking on R&D—for example, the R&D accelerator in the Global Action Plan for SDG3 is supposed to look at the complete product development pipeline and how this is linked to product prequalification, access, and the R&D Observatory. Under the restructure, WHO wants to take more of a streamlined end-to-end approach to supporting product development, and one KI said that “inherent in this is the idea of priority setting.” The idea behind the streamlined approach is that it would connect together a number of disparate activities at WHO in a more strategic, better sequenced manner (e.g., development of target product profiles, R&D prioritization processes, pre-qualification, the essential medicines list, and WHO’s work on access to medicines).
• A second group took more of a middle-ground perspective and argued that WHO could play a technical advisory role, supporting the decision-making on candidates. Rather than “outsourcing” the prioritization, WHO would be a key actor – an advisor – at the table but it would not manage the process. One KI in this group argued: “I’m not sure the WHO is best, given that the CEWG [the Consultative Expert Working Group on R&D Financing and Coordination] was a resounding disaster.” However, this second group argued that alongside WHO, the prioritization process would involve many other actors with technical expertise in science and innovation as well as public health expertise. For example, PDPs would have a role, given that they have joint drug development and public health expertise. “When it comes to deciding what to fund,” said one KI, “it can’t just be scientists who decide. You must have people with pharma experience, with in-country experience, people who know how the interventions would actually be used, etc.”
• A third group believed that the prioritization should be performed by independent experts from academia. Everybody (including WHO) with financial or political interests would be excluded from the decision-making. WHO could be an observer.
The role of funders. Another contentious area was the role of funders. Stakeholders agreed that a scientific
process is essential, but some also acknowledged that “there is always a political process in the end,” which

Developing an aggregator mechanism for late-stage clinical trials WORKING PAPER • 48
would reflect the interests of the investors. However, stakeholders made clear that funders cannot and must
not dominate this new aggregator fund – there must be a strong scientific process. Others went a step further
and argued that funders who provide money into the financing mechanism should not be involved in the
decision on which priority trials will be funded. Funders should ‘trust’ the decision-making body to make the
right decision. This is a critical aspect that needs to be carefully managed – some of the stakeholders opposed
the idea of an aggregator because they fear that it could be controlled by a small group of investors.
With respect to the role of industry in governance, stakeholders argued that industry’s capacity and expertise
would be critical to have but that it needs some careful thinking. Industry could be an observer in the scientific
committee but would have no voting rights in the prioritization.

Developing an aggregator mechanism for late-stage clinical trials WORKING PAPER • 49
DEVELOPING OPTIONS FOR THE DESIGN OF AN AGGREGATOR
MECHANISM FOR LATE-STAGE CLINCAL TRIALS
In section 3 of this paper, we showed that the current ecosystem for neglected disease R&D is biased towards
earlier stages of development, with insufficient attention given to late-stage clinical trials. In addition, our
stakeholder consultation indicated that there is substantial support for an aggregator mechanism to
accelerate development of products for neglected diseases (section 4). The consultation process, in which we
consulted with 165 key stakeholders in our first round of KIIs and with 27 selected stakeholders in a second
interview wave, also helped us to delineate the potential scope and other key design features of an aggregator
for late-stage clinical trials.
Based on the literature review and the KIIs, we developed three options for an aggregator mechanism. We
analyzed these options along three dimensions: scope, costs and benefits, and feasibility.
Scope: As described previously, in our first interview wave, KIs had different views on the scope of the
mechanism. One group was in favor of a broad aggregator mechanism that would support all product types
and all PRNDs. A second group was in favor of a targeted aggregator that at least initially focusses on late-
stage clinical trials for vaccines against a small number of diseases. A range of KIs also emphasized the need
to build clinical trial capacity in LMICs. We reflected these aspects in the development of our options.
Costs and benefits: For each option, we estimated the costs and benefits (based on a number of different
assumptions, as described below). There are two broad cost categories – the costs of the clinical trials
themselves, which we calculated based on our model, and the operational costs of the mechanism itself
(including the costs of supporting the secretariat). As described in Section 2, we also modeled the health
benefits in terms of deaths and DALYs averted for the three options and estimated their cost-effectiveness
and benefit-cost ratio. We modeled the benefit-cost ratio and the cost effectiveness from both a societal
perspective and the perspective of the aggregator’s investors. In this section, we first present the results from
a societal perspective, and then the results from the investors’ perspective. The benefit-cost ratios from the
investors’ perspective are much higher than the benefit-cost ratios from the societal perspective. Annex 8
gives further details of the modeling of costs and benefits and includes an overview of potential product
launches by years and type.
Efficiency gains: As described earlier, our quantitative models focused on estimating potential gains from
improving the technical efficiency of clinical trials funded by the aggregator. We modeled the efficiency gains
that would arise from the aggregator’s ability to use adaptive designs in clinical trials, which could potentially
shorten phase times, reduce the required study sample size, and lower trial costs. In addition to a business-
as-usual scenario with no efficiency gains, we modeled two efficiency improving scenarios. The first – a
“feasible” efficiency improvement scenario – was one in which 50% of the trials supported by the aggregator
adopted adaptive designs (which translates into an aggregate reduction of 3 months in phase length for all
phases and a 7.5% reduction in late-stage trial costs). The second – an “ambitious” efficiency improvement
scenario – was one in which all trials (100%) supported by the aggregator use adaptive designs (translating
into a reduction of 6 months in phase length for all phases and a 15% reduction in late-stage trial costs). We

Developing an aggregator mechanism for late-stage clinical trials WORKING PAPER • 50
report the results for the feasible (50%) efficiency improvement scenario in this report and compare the
results of all three scenarios in Annex 8.
Feasibility: Finally, we also assessed the potential to rapidly launch a new mechanism in the near future. This
included an assessment of likely political support from key actors.
Table 9 further operationalizes our three assessment categories.
Table 9. Criteria for analyzing design options for an aggregator Dimension Criteria Scope • Product types supported
• Diseases supported
• Functions performed by the aggregator (e.g., mobilizing funding, building trial capacity, sharing best practices)
• Phases supported Costs and benefits • Pipeline/development costs
• Set up and running costs
• Capacity building costs
• Efficiency gains • Benefits (e.g., DALYs/deaths averted)
Efficiency gains • Operational efficiencies e.g., improvements in global coordination (qualitatively assessed)
• Technical efficiencies e.g., through adaptive clinical trials (quantitatively modelled)
• Allocative efficiencies (qualitatively assessed) Feasibility • Likelihood of mobilizing political support from key decision-makers to implement the option
• Potential for rapid implementation, considering the complexity of the option (e.g., expertise needed, complexity of governance and number of actors involved, resource needs
• Risks
The three options are not necessarily mutually exclusive. If the first option (the narrowly defined aggregator
for vaccine trials) were to be launched and was effective, the aggregator’s scope could expand to include
additional product types and diseases (Figure 13).
Figure 13. Options staircase

Developing an aggregator mechanism for late-stage clinical trials WORKING PAPER • 51
Option 1: Aggregator for late-stage vaccine trials against a narrow set of diseases
Option 1 reflects the large gap in the global health R&D architecture for the late vaccine development phase,
which was also acknowledged in our consultation process. The key benefit of this option would be the
availability of funding for late-stage vaccine trials and the de-risking of investments. In addition, through the
prioritization process, the aggregator would also contribute to the rationalization of the pipeline for vaccines.
Table 10 gives an overview of Option 1.
Scope: Option 1 is the narrowest in terms of the aggregator’s scope. It focuses on late-stage clinical trials for
vaccines against a targeted subset of PRNDs, which would have to be agreed upon at (or shortly after) the launch
of the aggregator. Our analysis assumes that the aggregator funds vaccine trials for the four PRNDs with the
highest global burden of disease as measured using DALYs (HIV, TB, malaria, and pneumonia).
The aggregator would cover the costs of late-stage trials. It would also make targeted strategic investments
into the manufacturing capacity of LMICs (US$50 million over five years) but participating LMICs would have
to use their own resources to build their clinical trial systems as part of the matching approach (i.e., funds
from the global pool would not be used to build clinical trial capacity).
Costs and benefits: The start up and running costs would be relatively low compared with those of Options
2 and 3, as the secretariat and the scientific committee could be small—both would just need expertise on
vaccines (rather than all product types). We estimate that the cost for this option would total US$2.6 billion
over 11 years, including US$2.1 billion in pipeline costs and US$250-300 million in start-up and running costs.
In addition, the aggregator would provide US$50 million per year over five years for building manufacturing
capacity in LMICs. If this option is implemented, we estimate that it would avert 19.8 million deaths and 566
million DALYs in the period 2021-2035. The benefit-cost ratio is 5.65 (i.e., for every US$1 invested, there is a
return of US$5.65).
Feasibility: An aggregator of this type could be quickly launched, given that it is narrow in scope and that key
stakeholders signaled interest. Option 1 will probably require the launch of a new organization as no current
institution could easily expand its mandate. However, CEPI – which currently funds vaccine development for
EIDs with epidemic potential across R&D stages – seems to potentially open to the possibility. CEPI has already
expanded its initial mandate to also include late-stage trials, and it is currently considering expanding to fund
COVID-19 therapeutics (which, like vaccines, could reduce viral transmission).
If this option proves to be successful and shows that a dedicated funding mechanism for late-stage vaccine
development can effectively accelerate the R&D process, the mechanism could be broadened to include
additional product types and diseases (i.e., Option 2).
Table 10. Key features of Option 1: an aggregator for late-stage vaccine trials against a narrow set of diseases
Scope
Product type Vaccines Disease focus Small subset of prioritized diseases. Modelling for the investment case assumes
the diseases are HIV, TB, malaria, and pneumonia (based on high global burden of disease)
Functions performed
▪ Mobilization and allocation of funding for late-stage vaccines trials ▪ Targeted investments in building local manufacturing capacity (US$50 million per year over 5 years) ▪ Vaccine-related coordination and knowledge sharing ▪ Accountability for trials funded by the aggregator

Developing an aggregator mechanism for late-stage clinical trials WORKING PAPER • 52
R&D phases: Phase III
Costs and benefits
Pipeline costs (2021-2031) US$2.1 billion Set-up/running costs (2021-2031) Initial set up costs of US$36 million and annual running costs of US$25.0 million Capacity building costs US$50 million per year over the first 5 years (for building LMIC manufacturing
capacity) Deaths and DALYs averted (2021-2035)
Deaths averted: 19.8 million DALYs averted: 566 million
Benefit-cost ratio 5.65 Cost-effectiveness Cost per death averted: US$2,282
Cost per DALY averted: US$80 Efficiency gains
▪ Global coordination/prioritization will reduce duplication ▪ Using adaptive trial designs would drive efficiencies over a business-as-usual case with no adaptive trials. 50% is a feasible percentage of adaptive trials in the portfolio
Feasibility
Political support
Rapid launch possible as funders expressed interest in a vaccine-focused aggregator
Ease of implementation ▪ Low start-up costs ▪ Fewer resource needs compared to other options due to vaccine focus ▪ Likely requires launch of a new organization but some potential to add a funding window to CEPI as an existing organization
Risks
Option is less attractive to bilateral development agencies and LMIC health ministries as the focus is strictly on product development rather than strengthening health research capacity more broadly
Option 2: Aggregator for late-stage clinical trials of all product types for control of a
wider range of diseases
Compared with Option 1, Option 2 tackles a broader range of diseases with a wider range of product types.
Table 11 gives an overview of Option 2.
Scope: Option 2 would fund all product types for the control of a larger set of diseases. In addition to clinical
trial costs, the aggregator would set aside funding for building clinical trial systems and manufacturing
capacity in LMICs (we assume about US$100 million per year over the first 5 years).
Costs and benefits: Costs for this option will be substantial. Set up and running costs are higher than those for
Option 1 because the secretariat and the scientific committee would need expanded capacity, including
expertise across all product types and a larger number of diseases. Different scientific committees are likely
to be needed for different product types (e.g., a vaccines committee, a therapeutics committee, and a
diagnostics committee). We estimate the start-up costs at US$58 million and the annual running costs at
US$40 million. The cost for the trials amount to US$8.3 billion. Adding a capacity building cost of US$100
million per year over the first 5 years, the total costs for this option are US$9.2 billion (the individual costs do
not total US$9.2 billion because we used the net present value of future costs using a discount rate of 3%).
The total costs of US$9.2 billion are more than 3.5 times higher than those of Option 1. The BCR of Option 2
is also lower (4.06 compared with a BCR of 5.65 for Option 1). However, Option 2 is more cost-effective than
Option 1 - it has a lower cost per death and per DALY averted. The overall impact (deaths and DALYs averted)
is also higher due to its wider scope. If this option were implemented, it would avert 24.7 million deaths and
738 million DALYs between 2021 and 2035.
Feasibility: Launching Option 2 would be more challenging than launching Option 1. For Option 2, the
resource needs would be greater, and we found less support from funders for this option who considered
this mechanism as too broad.

Developing an aggregator mechanism for late-stage clinical trials WORKING PAPER • 53
Table 11. Key features of Option 2: an aggregator for all product types to control a wider range of diseases
Scope
Product type All product types (current modelling for the investment case includes vaccines and drugs) Disease focus Moderately expanded subset of prioritized diseases (compared with Option 1). Modelling
for the investment case assumes the diseases are HIV, TB, malaria, pneumonia, Chagas, schistosomiasis, visceral leishmaniasis, dengue, and leprosy
Functions performed
• Mobilization and allocation of funding for late-stage trials across all product types and several diseases
• Moderate investments in building clinical trial systems and manufacturing capacity in LMICs
• Substantial knowledge generation and sharing, and a key role in coordination of product development
• Accountability for trials funded by the aggregator R&D phases: Phase III
Costs and benefits
Pipeline costs (2021-2031)
US$8.3 billion
Set-up/running costs (2021-2031)
Start-up costs of US$58.0 million and annual running costs US$40.0 million
Capacity building costs (2021-2025)
US$100 million per year over the first 5 years
Deaths and DALYs averted (2021-2035)
Deaths averted: 24.7 million DALYs averted: 738 million
Benefit-cost ratio 4.06 Cost-effectiveness Cost per death averted: US$2,145
Cost per DALY averted: US$72 Efficiency gains
• Modest gains from global coordination/prioritization, which reduces duplication
• Using adaptive trial designs would drive efficiencies over a business-as-usual case with no adaptive trials. 50% is a feasible percentage of adaptive trials in the portfolio.
Feasibility
Political support
A number of KIs suggested that global coordination and prioritization is needed, so there is likely some support
Ease of implementation
• Larger resource requirements than those for Option 1
• Requires the launch of a new mechanism Risks
The mechanism might be considered as being too broad and thus lacking in focus. Start-up/running costs are more significant compared with Option 1
Option 3: Comprehensive aggregator that builds clinical trial capacity through
investments in health systems
This option would be the broadest type of aggregator, not just in scope but in the functions that it supports.
Table 12 gives an overview of Option 3.
Scope: Option 3 would fund all product types and all PRNDs. In addition to covering the trial costs, this third
type of aggregator would invest substantially in the health systems of LMICs. The overall goal is to build sustain-
able trial networks to gain efficiencies and to fully embed the clinical trial system into the overall health system.
Costs and benefits: Costs for this option will be high because of higher investments into the health system
and pipeline costs. We estimate the start-up costs at US$87 million and the annual running costs at US$60
million. The cost for the trials amount to US$15.6 billion. Adding a capacity building cost of US$250 million per
year over the first 5 years (for building heath research and manufacturing capacity), the total costs for this option
are US$17.3 billion (the individual costs do not total to US$17.3 billion because we used the net present value
of future costs using a discount rate of 3%).

Developing an aggregator mechanism for late-stage clinical trials WORKING PAPER • 54
The BCR for Option 3 would be US$2.73 (i.e., every US$1 invested would return US$2.73). Implementing this
option would avert 30.0 million deaths and 1.2 billion DALYs. Option 3 is the least cost effective with a cost
per DALY averted of US$105, and cost per death averted of US$4,209.
Feasibility: This option appeals to health generalists, particularly those who see building health research
capacity as a critical plank in strengthening PHC and reaching UHC. This audience noted the importance of
trials as a tool not only for assessing candidate health technologies for PRNDs and potentially other conditions
(e.g., NCDs) but also to test different PHC service delivery, financing, and governance approaches. Under this
option, the aggregator would contribute to the creation of a sustainable trial network in LMICs that could go
beyond trials of PRND products. As such, it could broaden the funding base for the aggregator through
mobilization from a broader array of development agencies and ministries of health in LMICs (currently, PRND
product development is mostly funded by public science and technology agencies and private developers
rather than by health and aid agencies). But the overall feasibility of this option is currently low. It appears
unlikely that it could be implemented in the near future. However, the option is an important longer-term
vision for the aggregator.
Table 12. Key features of Option 3: an aggregator for all product types for all PRNDs
Scope
Product type All product types Disease focus All PRNDs (plus potentially non-communicable diseases and EIDs) Functions performed
• Mobilization and allocation of funding for late-stage trials for all product types and diseases, and for local manufacturing, including from LMICs
• Substantial capacity building investments to integrate the clinical trial into the larger health system
• Strong coordination and knowledge sharing function R&D phases: Phase III
Costs and benefits
Pipeline costs US$15.6 billion Set-up/running costs Start-up costs of US$87.0 million and annual running costs US$60.0 million Capacity building costs US$250 million per year over the first 5 years Deaths and DALYs averted (2021-2035)
Deaths averted: 30.0 million DALYs averted: 864 million
Benefit-cost ratio 2.73 Cost-effectiveness Cost per death averted: US$4,209
Cost per DALY averted: US$105 Efficiency gains (not yet quantified)
• Large gains due to coordination at global level, i.e., cost savings due to less duplication/waste/fragmentation
• Initial upfront investment in health care systems will pay off later
• Using adaptive trial designs would drive efficiencies over a business-as-usual case with no adaptive trials. 50% is a feasible percentage of adaptive trials in the portfolio
Feasibility
Political support
Some donors will like the focus on R&D as a tool for strengthening PHC and achieving UHC. However, resource needs are high and it is unclear if these supportive donors would provide the funding
Ease of implementation • Substantial start-up costs
• Large resource requirements Risks • Success depends on multiple global and domestic funders
• High costs
• Diverts focus from product development to the strengthening of clinical trial systems, which could scare off traditional R&D funders and those interested in clearly measurable and attributable return on investment (the broad mandate of Option 3 makes it difficult to measure success)

Developing an aggregator mechanism for late-stage clinical trials WORKING PAPER • 55
Trade-offs between options and recommendation
Each option has specific advantages and disadvantages and prioritizing between them inevitably involves
trade-offs (Figure 14). If we benchmark Option 1 against Option 2, Option 1 appears to be attractive for three
reasons. First, its costs (US$2.6 billion) are about 3.5 times lower than the costs of Option 2 (US$9.2 billion).
Second, it also has a higher BCR than Option 2 (5.65 vs. 4.06). Third, rapid implementation seems to be more
feasible given its more narrow focus and that key stakeholders were interested in an aggregator that focuses
initially on vaccines. And while Option 3 is arguably a much larger enterprise—and ranks low in feasibility—it
would be important to keep it in sight for pursuing goals that go beyond developing new health technologies
to also using R&D as a tool for achieving UHC through PHC.
Based on a combination of likely impact and feasibility, we recommend that the international community
pursues Option 1—an aggregator that funds late-stage trials of vaccines for a narrow range of high-burden
PRNDs. This type of aggregator could be rapidly implemented and would have substantial impact at a
moderate annual cost. It would also drive efficiencies, streamlining, and accountability in the vaccine
development space, while testing a new approach of funding late-stage clinical trials in a targeted manner.
Overall, most KIs in the second-round interviews agreed with our recommendation to pursue Option 1 and
to potentially expand the vaccine aggregator to include additional product types and diseases if it proves to
be successful. Only a few of them, in particular Chinese officials and some representatives from Kenya, were
in favor of Option 2 (those in favor of Option 2 emphasized the need for new treatments against diseases
such as TB, and the need to develop new technologies for the most neglected diseases, such as leishmaniasis).
We thus recommend launching Option 1. Option 1 could serve as a proof of concept and become a stepping-
stone for Option 2. Option 2 has a larger public health impact, as measured by deaths and DALYs averted, and
is also more cost-effective (the costs per death and per DALY averted are lower in Option 2 than in Option 1).
Figure 14. Trade-offs in feasibility, scope, benefit-cost ratio, and deaths averted between options
Societal perspective vs. investors’ perspective
In addition to our investment case modeling from a societal perspective, we also modeled the investment
case from the perspective of the funders of the aggregator mechanism. The societal perspective seeks to
answer the question: “how much would society benefit for each dollar invested in the aggregator
mechanism?” In contrast, the investors’ perspective seeks to answer the question: “how much would society
benefit for each dollar the investor puts into the aggregator mechanism?” We adopted this modified

Developing an aggregator mechanism for late-stage clinical trials WORKING PAPER • 56
investors’ perspective for two reasons. First, a plurality of respondents would like the aggregator mechanism
to be non-profit therefore we did not model potential profits to the aggregator from commercialization of
launched products. Second, social investors are more likely to make investment decisions based on the
potential benefit to society for each dollar investment they make, therefore this metric would be useful for
decision-making at the level of individual investors.
The benefit-cost ratios are understandably larger for the investors’ perspective compared to the societal
perspective (Table 13). In addition, when viewed from the perspective of the innovator, Option 1 becomes
much more attractive compared to the other options. Moreover, for each option, the gains from efficiency
improvements are substantially higher from the investors’ perspective than from the societal perspective
(Table 13). Therefore, from an investor’s perspective, participating in the aggregator would make a big
difference compared to supporting individually-funded trials because of the aggregator’s ability to
systematically support the use of adaptive trial designs. This added value of an aggregator mechanism is less
visible from the societal perspective because this perspective includes other costs to be covered by society
(see Annex 8),
Table 13. Comparison of benefit-cost ratios from societal and investors’ perspectives
Business as usual (No efficiency gains)
Feasible efficiency improvement scenario
(50% adaptive trials)
Ambitious efficiency improvement scenario
(100% adaptive trials)
Societal Perspective
Investors Perspective
Societal Perspective Investors Perspective
Societal Perspective
Investors Perspective
BCR BCR BCR % gain BCR % gain BCR % gain BCR % gain
Option 1 5.5 70.8 5.7 4 81.2 15 5.7 4 96.0 36 Option 2 3.9 15.9 4.1 5 18.7 18 4.2 8 22.6 42
Option3 2.5 10.6 2.7 8 13.2 25 2.9 16 17.2 62

Developing an aggregator mechanism for late-stage clinical trials WORKING PAPER • 57
KEY FEATURES OF AN AGGREGATOR MECHANISM FOR LATE-STAGE
CLINICAL TRIALS
We recommend the development of an aggregator for late-stage clinical vaccine trials. In this section, we
describe a number of the underlying features of such as late-stage trial aggregator for PRND vaccine
development.
Governance
There are existing governance models that provide a valuable blueprint for the governance of the
aggregator—there is no need to “reinvent the wheel”. The aggregator’s governance mechanism would have
three key structures: (i) a board comprising the investors group (ii) a scientific committee that advices on the
selection of candidates to fund, and (iii) a secretariat for the day-to-day management of the aggregator.
Governing board: The aggregator would be based on a “membership” model, i.e., those who are make final
decisions must make contributions (funding, policy or other contributions). However, there is also the need
for strong LMIC participation and not all LMICs will make financial contributions to the aggregator (e.g., they
may fund domestic manufacturing capacity to support manufacturing of aggregator products). Strong LMIC
representation will be important because PRNDs mostly affect these countries, and thus the decisions made
by the aggregator board affects them the most. In addition, there is the need for technical expertise in a range
of areas, such as science, global health, industry, and finance. The board structure needs to balance out these
demands to satisfy the requirements of the membership while simultaneously ensuring broad participation
and strong technical expertise.
To balance out these different demands, we envision a similar governance structure to the one that CEPI uses.
CEPI’s primary governing body is the board, but there is also an investors’ council, which nominates investor
representatives to the board. This council has some specific rights, including approval of any single investment
overUS$100 million. The aggregator could function in the same vein - there would be a smaller investors’
group within the board that would have specific rights on the final investment decisions based on guidance
from the scientific committee and other forums (see below). Overall, we expect strong interest and
investment from LMICs (see subsection on resource mobilization and contributions below).
Scientific committee: There needs to be a scientific committee that provides scientific guidance and
recommends which product candidates should be prioritized. The inclusion of LMICs in the scientific panel
would be crucial to ensure both bottom-up and top-down views (LMICs cannot just be included as “window
dressing”). There is a need for a “domestic group” on the panel, when deciding on projects, as LMIC scientists
“understand the capacity, the national situation better.” One way to engage LMICs is by inviting leading
institutions (rather than individuals or projects); leading institutions usually have comprehensive capacity and
even a mature R&D industry chain that covers basic science, pharmacology, and clinical trial sites.
Secretariat: The secretariat needs expertise in a range of areas (e.g., the science of R&D, coordination,
partnership management, fundraising, communications, and M&E) and there needs to be an adequate
budget for supporting these functions. The secretariat would also be responsible for the global pool of funding
and for ensuring that LMICs make substantial national contributions as part of the matching approach. The
global pool of funding could be administered through a World Bank financial intermediary fund (FIF).

Developing an aggregator mechanism for late-stage clinical trials WORKING PAPER • 58
Overall, we envision a two-stage prioritization process – a list of priority products established through a WHO
process, based on which the aggregator would further select products to be funded. While the very final
decisions on which product candidates should be funded will be taken by the investors group, strong inputs
by WHO need to be made earlier in the process based on guidance provided by WHO. This is critical in order
to facilitate the best selection of candidates and increase the legitimacy of the aggregator. This process is
similar to CEPI’s process. CEPI’s Scientific Advisory Committee used the WHO’s list of Blueprint diseases as a
starting point and then made further decisions about which priority diseases and candidates to fund. The
details of this process would have to be developed as part of a business plan for the aggregator, which would
have to be established based on an inclusive process.
There has been renewed interest at WHO for more joined-up thinking on R&D. Under the planned
restructure, WHO wants to take more of a streamlined end-to-end approach to supporting product
development, which would connect a number of activities at WHO in a strategic, sequenced manner. These
activities include the development of target product profiles, R&D prioritization processes, pre-qualification,
the essential medicines list, and WHO’s work on access to medicines. The R&D accelerator in the Global Action
Plan for SDG3 also aims to improve the coordination of late-stage trials. WHO’s Product Development for
Vaccines Advisory Committee (PDVAC) would also have a key role to play in the selection of vaccines.
Resource mobilization and contributions
Contributions to the global pool of funding would need to come from traditional donors—that is,
governments of HICs and philanthropic organizations. While traditional donors will remain critical, there is a
need for other funders to step up, given the large costs of vaccine development. Regional investment banks,
for example, could become a new source of funding: in July 2020, a new AMR Action Fund was launched,
which aims to develop two to four new antibiotics by 2030. This fund is also supported by the European
Investment Bank, which has shown more interest in the health sector – especially the AMR field – in recent
years.
Contributions by LMICs will be most crucial – either to the global pool or through significant domestic
contributions. In the past, R&D decisions were dominated by the North and this dominance needs to come
to end. But this shift will require LMICs to contribute to the aggregator in a substantial way. While LMICs are
unlikely to contribute to a global pool of funding, they need to make substantial financial contributions within
their own borders. From our perspective, these financial contributions could be done in many different ways
– countries could take over the costs of the late-stage clinical trials, they could help with post-licensure
studies, address regulatory issues, build local manufacturing capacity including through tax benefits for local
manufacturers, and make advanced purchasing commitments to buy the new technologies. Overall, there
needs to be flexibility regarding these contributions due to different country contexts and the differing ability
of countries to pay. A threshold would probably have to be set for different groups of countries to become
part of the investors group. The detailed criteria would have to be established as part of the business planning
for the aggregator.
As we highlighted in Section 4, private sector key informants were very supportive of the aggregator because
it would contribute to the availability of predictable funding for late-stage clinical trials, a prioritized list of
products, and an exchange of information between key stakeholders. The Access to Medicines Foundation

Developing an aggregator mechanism for late-stage clinical trials WORKING PAPER • 59
identified these three factors as crucial for driving pharmaceutical engagement (Box 1).35 In this context, the
Foundation’s 2018 Access to Medicine Index shows that five pharmaceutical companies account for the
majority of “priority R&D” (defined as R&D for products needed as a priority for people living in LMICs) – an
even smaller number than in previous years because large MNCs decided to leave this space.36,37 As the
aggregator would provide substantial incentives for companies to rethink their investment strategies, it could
help to bring MNCs back to PRND product development. The COVID-19 pandemic has pushed access to
medicine up the agenda,38 and the aggregator could help prolong and reinforce this recent trend.
1. Clear priorities endorsed by the international community of experts in global health. For companies,
a clear and agreed-upon agenda lowers the barrier to engagement.
2. Publicly funded de-risking or market-shaping mechanisms, which enable resource sharing and
reduce uncertainty.
3. Long-term and coordinated financial support from multiple donors and sustained investment in
health from national governments, including to support healthy markets.
Box 1. Three critical factors for driving pharmaceutical engagement in global health product development35
Finally, country stakeholders made it very clear that their participation is linked to affordable products. For
this reason, it is very unlikely that an aggregator could be funded from return-seeking investors (or even a
blend of public and return-seeking investment), since the expected financial returns would drive up product
prices to levels unaffordable to many poor countries. In addition, social impact investors might also be
reluctant to pool funding.
End-to-end thinking and local manufacturing
In addition to the three entities described above (the board, the scientific advisory committee, and the
secretariat), a crucial aspect of governance is to ensure that the aggregator is embedded within the larger
global health architecture. The funding aggregator for late-stage trials needs alignment both upstream and
downstream with other key global health entities so that there is a “seamless transition” between the
different development phases and major delivery mechanisms. Partnership agreements with initiatives
focusing on earlier stages of development will be key. Based on such partnership agreements, the aggregator
could make commitments to companies, universities, and other early stage clinical developers to invest in
their candidates if the early stage clinical development is successful. This would incentivize additional
investment into earlier development stages. Likewise, vaccine development by the aggregator should also be
linked to procurement agencies—for example, it should be linked to Gavi’s vaccine investment strategy to
ensure that vaccines are purchased and distributed to the poorest countries.
As the aggregator will likely mostly be funded through public funding, there is a very strong argument that it
must also ensure that products launched through the aggregator are accessible and affordable in LMICs. Thus,
an aggregator would have a key role in ensuring that LMICs have access to the technical know-how and
intellectual property that they need to manufacture products themselves.
Support for the development of manufacturing capacity would be part of the aggregator’s remit. Unless the
aggregator covers tech transfer, local manufacturing, and post-licensure studies (Phase IV), it will leave major

Developing an aggregator mechanism for late-stage clinical trials WORKING PAPER • 60
gaps and fall short of facilitating access to affordable products in LMICs. Only a few LMICs have vaccine
production capacity. The COVID-19 crisis has brought a new impetus for building local production capacity,
including as a way to overcome disruption in the supply of other key vaccines. Some MICs, such as India and
China, already have capacity to manufacture vaccines. Other MICs, particularly in Sub-Saharan Africa, are
eager to develop their capacity and build their own domestic manufacturing industries. Kenya, for example,
plans to become a vaccine manufacturing hub for East Africa over the next years. The aggregator could link
with many activities that are up and running, such as a partnership between the East African Community,
Merck, the Kenyan government and the local manufacturer Dawa Limited to build a vaccine production
facility.
A main added value of the aggregator would thus be that it not only addresses tech transfer to countries with
existing manufacturing capacity, such as India, but also contributes to building regional production capacity
in Africa. In addition to smaller strategic investments into local manufacturing capacity, the aggregator will
have to be a platform for forging partnerships with governments and companies to strengthen this capacity.
This will also require incentivizing more pharmaceutical companies to become involved in PRND vaccine
development again (multinationals; small and medium-sized enterprises, and biotechs).
Although newer approaches to building country capacity in manufacturing, such as using modular
(“prefabricated”) manufacturing techniques, could help bring the costs down, these costs remain substantial.
HIC donors are unlikely to provide sufficient resources to build this capacity. It is thus important that LMICs
invest in their own national production capacity. The aggregator would enable LMICs to become a true part
of the innovation spectrum. Rather than purchasing new technologies from Northern companies, LMICs could
do the local manufacturing themselves. In this sense, the aggregator would also strongly promote access and
affordability, as well as vaccine security. Donors also highlighted the need to scale up local manufacturing
capacity as this would imply the ability to manufacture more products at better prices.
Clearly, if the aggregator ignores the importance of manufacturing right from the start, this will reduce the
chances of developing and scaling up a product and making it widely available. COVID-19 has also shown the
crucial role of manufacturing “at risk.” Just as it would not be acceptable to first develop a COVID-19 vaccine
and then have a delay of many years to scale up manufacturing capacity, it would also not be acceptable to
develop new products for PRNDs and then have a 5-year delay before they can be manufactured at scale
(arguably a failed outcome). Thus, the aggregator would also support the at-risk manufacture of the most
promising products.

Developing an aggregator mechanism for late-stage clinical trials WORKING PAPER • 61
CONCLUSIONS
Our working paper has presented a powerful case for launching a new aggregator that would pool funds for
late-stage clinical trials of products to control PRNDs. Our modeling suggests that one dollar invested in such
an aggregator could generate returns of about US$2.73 to 5.65, depending on the design of the mechanism
(the BCR is indicated by the size of the “bubble” in the left-hand panel of Figure 14). There also appears to be
substantial support for a new mechanism, with 86% of KIs expressing strong or moderate support for an
aggregator.
We recommend that the international community pursues Option 1—an aggregator that funds late-stage
trials of vaccines for a narrow range of high-burden PRNDs. This type of aggregator could be rapidly
implemented and would have substantial impact at a moderate annual cost. It would also drive efficiencies,
streamlining, and accountability in the vaccine development space, while testing a new approach of funding
late-stage clinical trials in a targeted manner. When viewed from the investors’ perspective, the attractiveness
of Option 1 becomes even more apparent – its BCR is much higher than the BCR of Options 2 and 3.
Overall, Option 1 promises a pragmatic but also ambitious approach to strategically address the weaknesses
in the global R&D ecosystem through coordinated funding for late-stage clinical trials. If the WHO is successful
in rolling out a new streamlined approach to supporting product development (including pre-qualification,
essential medicines list, etc.), products funded by this aggregator could potentially be fed into a pilot of the
streamlined approach, which could smooth the product’s pathway to scale-up. Option 1 could serve as a proof
of concept and become a stepping stone for Option 2. While Option 1 will probably require the launch of a
new mechanism, CEPI seems to be potentially open to the possibility of expanding its portfolio. If this is the
case, the aggregator could initially be “incubated” in CEPI, and – if it turns out to be successful – a new
mechanism (independent of CEPI) could be put in place that covers a larger set of diseases and product types
(Option 2).
It will also be critical for the aggregator to support tech transfer and local manufacturing. Such benefits would
incentivize both LMICs and high-income country donors to participate. The COVID-19 pandemic has shown
the critical need to globalize manufacturing capacity for medicines, vaccines, and diagnostics. Globalizing such
capacity could help to (a) bring down the price of these control tools, (b) ensure that these tools are more
readily available in LMICs, and (c) boost economic growth.
We believe that the COVID-19 pandemic, and the current urgency to fund COVID-19 control tools, is not a
threat to launching an aggregator for PRNDs but rather the opposite: it opens a window of opportunity. It is
true that the funds needed for the development, manufacturing, deployment, and delivery of COVID-19
technologies could end up being diverted from funding from PRND product development. Nevertheless, the
conversations that are now happening at the highest political levels—e.g., on mobilizing funds for R&D, scaling
up and globalizing manufacturing capacity, creating trial networks in the Global South, and establishing fair
pricing and fair allocation—are setting the terms for new forms of governance in global health R&D. They are
creating a clear window of opportunity to establish a new system for funding a broader range of technologies
for neglected diseases, not just for EIDs. In addition, the COVID-19 pandemic has led to an increased
awareness of vaccines and global health more broadly (i.e., of the inter-connectedness of nations) and of the

Developing an aggregator mechanism for late-stage clinical trials WORKING PAPER • 62
need for global health R&D. It will be critical to make the case that we need to invest in a set of high priority
diseases, not just one. If we can establish a proper prioritization mechanism, then of course COVID-19 would
rise to the top right now, but other diseases would also be high on the list, including TB (the world’s number
one infectious disease killer), HIV, and malaria.
Although we have argued that the launch of an aggregator focusing on vaccines for an initially narrow set of
diseases is feasible, we recognize that getting any new initiative off the ground is challenging—both financially
and in its governance. We estimate that Option 1 would cost around US$2.6 billion over 11 years, a price tag
that in theory at least should not cause “sticker shock” among funders. However, the fact that the ACT
Accelerator faces a massive funding gap (it has raised only about 10% of what it needs) suggests that resource
mobilization for a PRNDs aggregator will not necessarily be straightforward. Despite this caveat, our study
suggests that the timing is right for launching an aggregator that funds late-stage trials of candidate products
to control PRNDs.
Acknowledgement: We thank Heather Hille for design work and project coordination support.

Developing an aggregator mechanism for late-stage clinical trials WORKING PAPER • 63
⚫ REFERENCES
1. Rappuoli R, Black S, Bloom DE. Vaccines and global health: In search of a sustainable model for vaccine development and delivery. Sci Transl Med. 2019;11(497):eaaw288. Available from: doi:10.1126/scitranslmed.aaw2888
2. Yamey G, Morel C. Investing in health innovation: A cornerstone to achieving global health convergence. PLoS Biol. 2016; 14(3):e1002389. Available from: doi.org/10.1371/journal.pbio.1002389
3. Watkins DA, Yamey G, Schaferhoff M, Adeyi O, Alleyne G, Alwan A et al. Alma-Ata at 40 years: reflections from the Lancet Commission on Investing in Health. Lancet. 2018;392:1434-1460. Available from: doi.org/10.1016/S0140-6736(18)32389-4
4. Chapman N, Doubell A, Barnsley P, Goldstein M, Oversteegen L, Chowdhary V et al. Neglected disease research and development: uneven progress. Policy Cures Research. G-FINDER Report; 2019. Available from: https://s3-ap-southeast-2.amazonaws.com/policy-cures-website-assets/app/uploads/2020/02/11150341/G-Finder2019.pdf
5. Bandara S, Chapman N, Chowdhary V, Doubell A, Hynen A, Rugarabamu G, Gunn A, Yamey G. Analysis of the health product pipeline for poverty-related and neglected diseases using the Portfolio-to-Impact (P2I) modeling tool. F1000Research. 2020;9:416. Available from: doi.org/10.12688/f1000research.24015.1
6. Van Der Meeren O. Further development of M72: industrial perspective. Presentation at the WHO high-level consultation on accelerating the development of the M72/AS01E tuberculosis vaccine candidate. Geneva, Switzerland; April 6, 2019. https://www.who.int/who-documents-detail/report-of-the-high-level-consultation-on-accelerating-the-development-of-the-m72-as01-e-tuberculosis-vaccine-candidate
7. Beyeler N, Fewer S, Yamey G. Improving resource mobilisation for global health R&D: a role for coordination platforms? BMJ Glob Health. 2019;4:e001209. Available from: doi.org/10.1136/bmjgh-2018-001209.
8. http://centerforpolicyimpact.org/our-work/our-publications/funding-development-and-manufacturing-of-covid-19-vaccines/.
9. Young R, Bekele T, Gunn A et al. Developing new health technologies for neglected diseases: a pipeline portfolio review and cost model [version 3; peer review: 3 approved]. Gates Open Res. 2020;2:23. Available from: doi.org/10.12688/gatesopenres.12817.3
10. Terry RF, Yamey G, Miyazaki-Krause R et al. Funding global health product R&D: the Portfolio-to-Impact Model (P2I), a new tool for modelling the impact of different research portfolios [version 2; peer review: 2 approved]. Gates Open Res. 2018;2:24. Available from: doi.org/10.12688/gatesopenres.12816.2
11. OECD.Stats. Creditor Reporting System (CRS) [online database]. Disbursements, US$ billions (constant 2018 prices). Official and private donors. ODA and private. Health: 120 and 130. Organization for Economic Co-operation and Development (OECD). Paris, France; 2020. Available from: https://stats.oecd.org/Index.aspx?DataSetCode=crs1
12. Institute for Health Metrics and Evaluation. Financing global health 2018. Countries and programs in transition. University of Washington. Seattle, Washington; 2018. Available from: http://www.healthdata.org/sites/default/files/files/policy_report/FGH/2019/FGH_2018_full-report.pdf
13. Moon S, Bermudez J, ‘t Hoen E. Innovation and access to medicine for neglected populations: Could a treaty address a broken pharmaceutical R&D system? Plos Medicine. 2012;9(5):e1001218. Available from: doi.org/10.1371/journal.pmed.1001218
14. World Health Organization. Access to medicines: making market forces serve the poor. Geneva, Switzerland; 2017. Available from: https://www.who.int/publications/10-year-review/medicines/en/index1.html
15. Grover S, Xu M, Jhingran A, Mahantshetty U, Chuang L, Small Jr W, Gaffney D. Clinical trials in low-and-middle income countries—successes and challenges. Gynecologic Oncology Reports. 2017;19:5-9. Available from: doi.org/10.1016/j.gore.2016.11.007
16. Berger M, Murugi J, Buch E, IJsselmuiden C, Moran M, Guzman J et al. Strengthening pharmaceutical innovation in Africa. Council on Health Research for Development (COHRED), New Partnership for Africa’s Development (NEPAD). 2010. Available from: http://www.cohred.org/downloads/cohred_publications/Strengthening_Pharmaceutical_Innovation_Africa_Report.pdf
17. Moran M, Guzman J, Ropars AL, Illmer A. The role of product development partnerships in research and development for neglected diseases. Int Health. 2010;2(2):114-122. Available from: doi.org/10.1016/j.inhe.2010.04.002

Developing an aggregator mechanism for late-stage clinical trials WORKING PAPER • 64
18. Program for Appropriate Technology in Health (PATH) Malaria Vaccine Initiative. RTS,S. Washington, DC; 2020. Available from: https://www.malariavaccine.org/malaria-and-vaccines/rtss
19. Global Health Technologies Coalition [internet]. WHO Executive Board agrees on set-up of pooled fund for global health R&D. Available from: https://www.ghtcoalition.org/blog/who-executive-board-agrees-on-set-up-of-pooled-fund-for-global-health-r-d
20. The European & Developing Countries Clinical Trials Partnership (EDCTP) [internet]. Annual report 2018. Available from: https://publications.edctp.org/en_US/14737/220093/cover_.html
21. Global Antibiotic Research & Development Partnership (GARD P). GARDP Pipeline. 2020. Available from: https://gardp.org/uploads/2020/05/GARDP-pipeline.pdf
22. Global AMR R&D Hub [internet]. Our work. Available from: https://globalamrhub.org/our-work/.
23. Drugs for Neglected Disease initiative (DNDi). 15 years of needs-driven innovation for access: Key lessons, challenges, and opportunities for the future. Geneva, Switzerland; 2018. Available from: https://www.dndi.org/wp-content/uploads/2019/10/DNDi_ModelPaper_2019.pdf
24. Global Health Investment Fund (GHIF) [internet]. GHIF Announcements: Global Health Investment Fund portfolio addressing COVID-19 pandemic. 2020. Available from: http://www.ghif.com/news/.
25. Program for Appropriate Technology in Health (PATH), Drugs for Neglected Diseases Initiative (DNDi), the European Vaccine Initiative, FIND, IAVI, International Partnership for Microbicides, Medicines for Malaria Venture, and the TB Alliance. PDP position paper on EDCTP3: Enhanced opportunities, partnerships, and flexibility for greater impact. 2019. Available from: https://www.path.org/resources/pdp-position-paper-successor-edctp-enhanced-opportunities-partnerships-and-flexibility-greater-impact/.
26. Harris K. How a Gates Foundation-backed fund is revolutionizing global health impact investing. Forbes. 2019. Available from: https://www.forbes.com/sites/kevinharris/2019/04/09/how-the-gates-foundation-is-revolutionizing-global-health-impact-investing/#2d0a16744fc7
27. World Health Organization. Access to COVID-19 tools (ACT accelerator). Geneva, Switzerland; 2020. Available from: https://www.who.int/who-documents-detail/access-to-covid-19-tools-(act)-accelerator
28. Schäferhoff M, van Hoog A, Martinez A, Fewer A, Yamey G. Funding for sexual and reproductive health and rights in low- and middle-income countries: Threats, outlook and opportunities. The Partnership for Maternal, Newborn & Child Health; World Health Organization. 2019. Available
from: https://www.who.int/pmnch/media/news/2019/srhr_forecast_web.pdf?ua=1
29. Yamey G, Schäferhoff M, Hatchett R, Pate M, Zhao F, McDade KK. Ensuring global access to COVID-19 vaccines. Lancet. 2020;395(10234):1405-1406. Available from: Doi.org/10.1016/S0140-6736(20)30763-7
30. World Health Organization [internet]. WHO revises new road map documentation for consideration by World Health Assembly. Geneva, Switzerland; 2020. Available from: https://www.who.int/neglected_diseases/WHONTD-roadmap-2030/en/.
31. World Health Organization [internet]. Innovation, access, and use. Geneva, Switzerland; 2020. Available from: https://www.who.int/medicines/access/en/.
32. World Health Organization [internet]. R&D blueprint. Geneva, Switzerland; 2020. Available from: https://www.who.int/teams/blueprint/about
33. World Health Organization [internet]. End TB strategy. Geneva, Switzerland; 2020. Available from: https://www.who.int/tb/strategy/end-tb/en/.
34. World Health Organization Special Programme for Research and Training in Tropical Diseases [internet]. Essence on health research. Geneva, Switzerland; 2020. Available from: https://www.who.int/tdr/partnerships/essence/en/.
35. Access to Medicine Foundation. Are Phamaceutical Companies Making Progress When It Comes to Global Health? May 2019. Available from: https://accesstomedicinefoundation.org/media/uploads/downloads/5d93329e141cb_Access-to-Medicine-Index-10-Year-Analysis.pdf
36. Access to Medicine Foundation. Access to Medicine Index 2018. Available from: https://accesstomedicinefoundation.org/media/uploads/downloads/5e27136ad13c9_Access_to_Medicine_Index_2018.pdf
37. Cheney C. One trend in access to medicines may be cause for concern. Devex, November 20, 2018. Available from: https://www.devex.com/news/one-trend-in-access-to-medicines-may-be-cause-for-concern-93842
38. Access to Medicine Foundation. Will COVID-19 harm or help pharma’s access to medicine efforts, asks 2021 Access to Medicine Index. July 10, 2020. Available from: https://accesstomedicinefoundation.org/news/will-covid-19-harm-or-help-pharmas-access-to-medicine-efforts-asks-2021-access-to-medicine-index

Developing an aggregator mechanism for late-stage clinical trials WORKING PAPER • 65
⚫ ANNEXES
Annex 1. Semi-structured interview questionnaire
High-income countries (HICs)
1) From your perspective, what are the main barriers inhibiting the development of new technologies for poverty-related and neglected diseases (PRNDs)? a) And, to what extent are barriers to late-stage clinical trials a significant contributor to delays in the
development and lack of new technologies for PRNDs? If so, why?
2) To what extent could this global financing mechanism help to overcome existing barriers for late-stage clinical trials for PRNDs? a) Do you see any advantages of a new financing mechanism for late-stage clinical trials? b) Do you see any disadvantages and/or unintended negative effects?
3) How would you assess the potential of regional financing mechanisms for late-stage clinical trials? Do you want regional mechanisms instead of a global mechanism or would you want both (and why)?
4) Would your country/organization support the development of a financing mechanism for late-stage clinical trials for PRNDs? If so, how?
5) How do you assess the overall political appetite for the creation of a financing mechanism for late-stage clinical trials for PRNDs? a) Which countries/organizations would likely be key supporters and potentially champions of a
global/regional financing mechanism for late-stage clinical trials? b) Which countries/organizations will likely be reluctant to support a new mechanism, and why?
6) What should the design of the new financing mechanism ideally look like? a) Which structures should be created (e.g., a board, scientific committee, secretariat)? b) Which bodies decide about priorities and who makes financial decisions? Who needs to be on the
main decision-making body? c) How should the available funding for late-stage clinical trials be allocated across recipients? And,
based upon what criteria (e.g., likely health impact, scientific promise, priority disease, type of tool, likelihood of success, other)?
d) Which resources could low- and middle-income countries best bring to the table in support of the mechanism (e.g., infrastructure, human resources, financing)?
7) What capacity building goals should be pursued (if any)? For example, how do you rate the importance of human resources, trial networks, manufacturing capacity, and infrastructure? (For industry: what is important for you in terms of the capacity that you would need?)
8) How would you suggest handling the following issues? a) ownership of intellectual property, pricing, licensing, and trial data b) local manufacturing c) technology transfer
9) Do you have any other comments and advice?
10) Whom else should we contact to inform our research?

Developing an aggregator mechanism for late-stage clinical trials WORKING PAPER • 66
Additional questions for finance stakeholders (e.g., ministries of finance, treasuries, parliamentarians)
1) Do you think that your government would provide new and additional financing for a new mechanism in support of late-stage clinical trials?
2) Are there examples of where you have funded a similar initiative? If yes, please tell us about that.
Additional questions for HIC domestic health agencies (e.g., departments of health)
1) Are you involved in any issues that have developing country overlap (e.g., TB control, Ebola, etc.)? If yes, what are they?
2) Would you be interested in integrating with a global effort?
Additional questions for HIC domestic industry (e.g., departments of industry and innovation)
1) Do you fund companies or innovators that are working on any issues that have developing country overlap (e.g., TB control, Ebola, etc.)? If yes, what are they?
2) Would you be interested in integrating with a global effort?
Additional questions for HIC regulatory agencies (e.g., FDA)
1) If there is a financing mechanism, should it include a regulatory component? If so, why and what should it look like?
2) Would you be interested in integrating with a global effort?
Middle-income countries (MICs)
1) From your perspective, what are the main barriers inhibiting the development of new technologies for poverty-related and neglected diseases (PRNDs)? a) And, to what extent are barriers to late-stage clinical trials a significant contributor to delays in the
development and lack of new technologies for PRNDs? If so, why?
2) To what extent could a global (or a regional) financing mechanism help to overcome existing barriers for late-stage clinical trials for PRNDs? a) What opportunities and benefits would a new financing mechanism for late-stage clinical trials
create for your country? b) Do you see any disadvantages and/or unintended negative effects?
3) What is your own country’s current capacity for regulatory-standard late-stage clinical trials? a) Are there any areas/diseases where particularly good capacities/skills exist? If so, which? b) Which specific areas need capacity-strengthening to benefit from an aggregator financing model
(e.g., human, health system, trial networks, manufacturing capacity, regulatory)? c) To what extent does your regulatory authority have the capacity to regulate clinical trials? Are
ethical reviews of clinical trials straightforward?
4) Who are the main (inter-)national partners for late-stage clinical trials in your country?
5) To what extent would your country be interested to get involved in a new mechanism?
6) From your perspective, how would your country get involved? a) What area do you think your country would be most interested in supporting?
7) What should the design of the new financing mechanism ideally look like? a) Which structures should be created (e.g., a board, scientific committee, secretariat)? b) Which bodies decide about priorities and who makes financial decisions? Who needs to be on the
main decision-making body?

Developing an aggregator mechanism for late-stage clinical trials WORKING PAPER • 67
c) How would the available funding for late-stage clinical trials be allocated across recipients? And based upon what criteria (e.g., likely health impact, scientific promise, likelihood of success, other)?
d) Which resources should low- and middle-income countries bring to the table in support of the mechanism (e.g., infrastructure, human resources, financing)?
8) How would you suggest handling the following issues? a) ownership of intellectual property, pricing, licensing, and trial data b) local manufacturing c) technology transfer
9) Do you have any other comments and advice?
10) Whom else should be contact to inform our research?
Additional questions for MIC finance stakeholders (e.g., ministries of finance, treasuries,
parliamentarians, central bank)
1) Do you think that your government would provide new and additional financing for a new mechanism in support of late-stage clinical trials?
2) Are there examples of where you have funded a similar initiative? If yes, please tell us about that.
Additional questions for MIC domestic industry (e.g., departments of industry and innovation)
1) Do you fund companies or innovators that are working on any neglected disease products? If yes, why? a) biotech b) local manufacturing
2) Would you be interested in integrating with a global effort to support this?

Developing an aggregator mechanism for late-stage clinical trials WORKING PAPER • 68
Annex 2. Detailed methods and assumptions used to estimate costs and benefits of an
aggregator
Tables 2A, 2B, 2C, and 2D provide details of the model variables and parameters used for our analyses. We
had two goals for our modeling exercise. The first was to project the required phase III investment and
expected product launches based on the aggregator design options identified through our analysis of the key
informant interviews and literature review. The second was to estimate the long-term health and economic
benefits of these successful launches over the period 2021 to 2035. In this methods annex, we include the
specific equations that we used in estimating these costs and benefits.
Baseline disease profile
The baseline DALYs were calculated as the sum of the baseline years of life lost (YLL) and years lived with
disability (YLD) (Equations 1 and 2). To calculate YLLs and YLDs, we first used data from the United Nations
World Population Prospects to identify life expectancy at birth and life expectancy at age x. Then, we reviewed
the literature and the databases of the Institute of Health Metrics and Evaluation (IHME) to identify the
baseline prevalence, incidence, annual number of deaths by age group, and disability weights for different
diseases and disease states. 2017 data were used.
Equation 1: Years of Life Lost (YLL) for population
𝑌𝐿𝐿 = 𝐷𝑖 ∗ 𝑌𝐿𝐿𝑖
Where 𝑌𝐿𝐿𝑖 is the average YLL per individual case (see Equation 3), and 𝐷𝑖 is the total number of deaths from
disease 𝑖 in all age groups.
Equation 2: Years Lived with Disability (YLD) for population
𝑌𝐿𝐷 = (𝐼𝑏 ∗ 𝐶𝑏 ∗ 𝑌𝐿𝐷𝑡𝑖) + (𝐼 ∗ 𝑌𝐿𝐷𝑖) ∗ (1 − 𝐶𝑏)
Where 𝐼𝑏 is the baseline incidence, 𝐶𝑏 is the baseline treatment coverage, 𝑌𝐿𝐷𝑡𝑖 is the YLD per individual case
with treatment, and 𝑌𝐿𝐷𝑖 is the YLD per individual case without treatment.
Equation 3: Years of Life Lost from Disease i (𝒀𝑳𝑳𝒊) by individual
𝑌𝐿𝐿𝑖 = ∑ 𝑑𝑎𝑖 ∗ 𝐿𝑎 ∗ 𝑅𝑛
𝑎=1
𝐷𝑡𝑖
Where d is the number of deaths in age group a from disease 𝑖, L is the average life expectancy at age a, and
𝑑𝑎𝑖 is the total number of deaths from disease 𝑖 in age group a. R is treatment mortality reduction if with
treatment and 1 otherwise, and 𝐷𝑡𝑖 is the total number of deaths from disease 𝑖 and treatment status 𝑡.
Equation 4: Years Lived with Disability for disease 𝒊 (𝒀𝑳𝑫𝒊) by individual
𝑌𝐿𝐷𝑖 = ∑ 𝐼𝑎𝑖 ∗ 𝑇𝑎𝑖 ∗ 𝐷𝑊𝑖
𝑛𝑎=1
𝐼𝑖
Where 𝐼𝑖𝑎 is the incidence of disease 𝑖 in age group a, 𝐷𝑊𝑖 is the disability weight for disease 𝑖, 𝑇𝑖𝑎 is the
duration of illness for disease 𝑖 in age 𝑎 for treatment status 𝑡.
For chronic diseases with multiple disease states and a very long duration of illness (e.g., HIV and Chagas
disease), we multiplied the duration spent in each disease state by the corresponding disability weight for that

Developing an aggregator mechanism for late-stage clinical trials WORKING PAPER • 69
disease state. Detailed disability weights assumptions, incidence, prevalence, number of death inputs, and
YLLs/ YLDs result tables are available in Tables 2C and 2D below.
Equation 5: Number of cases (i.e., illness episodes) averted
𝐶𝑎𝑠𝑒𝑠 𝑎𝑣𝑒𝑟𝑡𝑒𝑑 = 𝐼𝑏 − 𝐼𝑣
Where 𝐼𝑣 is the incidence (i.e., number of cases) with vaccination at a given year x, and 𝐼𝑏 is the incidence at
baseline without vaccination.
Equation 6: Deaths averted
𝐷𝑒𝑎𝑡ℎ𝑠 𝑎𝑣𝑒𝑟𝑡𝑒𝑑 = [((𝐼𝑏 ∗ 𝐶𝑏 ∗ 𝐶𝐹𝑅𝑡 ) + ((1 − 𝐶𝑏) ∗ 𝐶𝐹𝑅0)) − ((𝐼𝑣 ∗ 𝐶𝑏 ∗ 𝐶𝐹𝑅𝑡) + ((1 − 𝐶𝑏) ∗ 𝐶𝐹𝑅0))]
Where, 𝐶𝐹𝑅0 is the case fatality rate without treatment, and 𝐶𝐹𝑅𝑡 is the case fatality rate with treatment, 𝐼𝑣
is the incidence (i.e., number of cases) with vaccination at a given year x, and 𝐼𝑏 is the incidence at baseline
without vaccination.
Equation 7: Disability Adjusted Life Years (DALYs) averted
𝐷𝐴𝐿𝑌𝑠 𝑎𝑣𝑒𝑟𝑡𝑒𝑑 = 𝐵𝑎𝑠𝑒𝑙𝑖𝑛𝑒 𝐷𝐴𝐿𝑌𝑠 − 𝐷𝐴𝐿𝑌𝑠 𝑤𝑖𝑡ℎ 𝑣𝑎𝑐𝑐𝑖𝑛𝑒
Treatment costs averted: The treatment costs averted were the product of the number of cases averted and
the average treatment cost per case (Table 2B). Since treatment costs vary significantly by disease state (e.g.,
MDR-TB vs. drug-sensitive TB) and severity (HIV with a CD4 count > 500 vs < 200), we took a weighted average
cost for different disease states.
Model variables, parameters and assumptions
Table 2A. Assumptions for the product pipeline development model

Developing an aggregator mechanism for late-stage clinical trials WORKING PAPER • 70
Table 2B. Treatment costs data
Disease Treatment cost ($US)
Notes Reference
HIV $336.00 Average ART cost per person year across different disease states (CD4 >500 to <200)
Ross JM, Ying R, Celum CL, et al. Modeling HIV disease progression and transmission at population-level: The potential impact of modifying disease progression in HIV treatment programs. Epidemics. 2018;23:34-41. doi:10.1016/j.epidem.2017.12.001
Tuberculosis $1,251.00 Weighted average of treatment cost per case for drug sensitive TB and MDR-TB
WHO: Global TB Report 2019
Malaria $72.00 Weighted average of treatment cost of moderate malaria and severe malaria
White MT, Conteh L, Cibulskis R, Ghani AC. Costs and cost-effectiveness of malaria control interventions--a systematic review. Malar J. 2011;10:337. Published 2011 Nov 3. doi:10.1186/1475-2875-10-337
Pneumonia $81.00 n/a Anh, Dang Duc, et al. "Treatment costs of pneumonia, meningitis, sepsis, and other diseases among hospitalized children in Viet Nam." Journal of health, population, and nutrition 28.5 (2010): 436. Tichopad, Ales, et al. "Clinical and economic burden of community-acquired pneumonia among adults in the Czech Republic, Hungary, Poland and Slovakia." PLoS One 8.8 (2013).
Chagas disease $286.00 Average cost per person year across different disease states Wilson LS, Strosberg AM, Barrio K. Cost-effectiveness of Chagas disease interventions in latin america and the Caribbean: Markov models. Am J Trop Med Hyg. 2005;73(5):901‐910.
Schistosomiasis $4.40 Cost per person Salari P, Fürst T, Knopp S, Utzinger J, Tediosi F. Cost of interventions to control schistosomiasis: A systematic review of the literature. PLoS Negl Trop Dis. 2020;14(3):e0008098. Published 2020 Mar 30. doi:10.1371/journal.pntd.0008098
Leishmaniasis $150.93 Average cost per person across different treatment strategies Meheus F, Balasegaram M, Olliaro P, et al. Cost-effectiveness analysis of combination therapies for visceral leishmaniasis in the Indian subcontinent. PLoS Negl Trop Dis. 2010;4(9):e818. Published 2010 Sep 7. doi:10.1371/journal.pntd.0000818
Dengue $263.00 Average cost per patient for moderate dengue and severe dengue Lee JS, Mogasale V, Lim JK, et al. A multi-country study of the economic burden of dengue fever: Vietnam, Thailand, and Colombia. PLoS Negl Trop Dis. 2017;11(10):e0006037. Published 2017 Oct 30. doi:10.1371/journal.pntd.0006037
Leprosy $309.70 Cost of treatment per person per year Xiong M, Li M, Zheng D, et al. Evaluation of the economic burden of leprosy among migrant and resident patients in Guangdong Province, China. BMC Infect Dis. 2017;17(1):760. Published 2017 Dec 11. doi:10.1186/s12879-017-2869-8
Shigellosis $1.11 Outpatient treatment cost for diarrheal disease Baral, Ranju, et al. "Cost of illness for childhood
diarrhea in low-and middle-income countries: a systematic review of evidence and modelled estimates." BMC Public Health 20 (2020): 1-13.
Ebola $915.35 Extensive supportive care EVD treatment and PPE costs per case Bartsch, Sarah M., Katrin Gorham, and Bruce Y. Lee.
"The cost of an Ebola case." Pathogens and global health 109.1 (2015): 4-9.
Hepatitis C $980.00 12-week course of sofobuvir for countries like Mongolia, Egypt,
Pakistan.
Iyengar, Swathi, et al. "Prices, costs, and affordability of new medicines for hepatitis C in 30 countries: an economic analysis." PLoS medicine 13.5 (2016): e1002032.
Enterotoxigenic E. coli
$36.56 Outpatient treatment cost for diarrheal disease Baral, Ranju, et al. "Cost of illness for childhood diarrhea in low-and middle-income countries: a systematic review of evidence and modelled estimates." BMC Public Health 20 (2020): 1-13.
Non-typhoidal salmonella
$20.91 Cost per treatment per case (USD 2016). We used estimates for typhoidal salmonella
Luthra K, Watts E, Debellut F, Pecenka C, Bar-Zeev N, Constenla D. A Review of the Economic Evidence of Typhoid Fever and Typhoid Vaccines. Clin Infect Dis. 2019;68(Suppl 2):S83-S95. doi:10.1093/cid/ciy1122
Sleeping Sickness (HAT)
$845.99 Average total cost of Elfornithine administration. Keating, Joseph, et al. "Human African trypanosomiasis prevention, treatment and control costs: a systematic review." Acta tropica 150 (2015): 4-13.
Onchocerciasis $38.80 One dose of ivermectin Keating, Joseph, et al. "Lymphatic filariasis and
onchocerciasis prevention, treatment, and control costs across diverse settings: a systematic review." Acta tropica 135 (2014): 86-95.
Cholera $34.04 Ilboudo, Patrick G., et al. "Cost-of-illness of cholera
to households and health facilities in rural Malawi." PloS one 12.9 (2017).

Developing an aggregator mechanism for late-stage clinical trials WORKING PAPER • 71
Schaetti, Christian, et al. "Costs of illness due to cholera, costs of immunization and cost-effectiveness of an oral cholera mass vaccination campaign in Zanzibar." PLoS neglected tropical diseases 6.10 (2012). Sarker, Abdur Razzaque, et al. "Cost of illness for cholera in a high risk urban area in Bangladesh: an analysis from household perspective." BMC infectious diseases 13.1 (2013): 518.
Hookworm
$0.31 Cost per round of treatment for pre school-age child Hall A, Horton S, de Silva N (2009) The Costs and Cost-Effectiveness of Mass Treatment for Intestinal Nematode Worm Infections Using Different Treatment Thresholds. PLOS Neglected Tropical Diseases 3(3): e402. https://doi.org/10.1371/journal.pntd.0000402
Meningitis
$1,749.17 Average treatment cost per infection across 144 LMICs (2012 USD)
Portnoy A, Jit M, Lauer J, et al. Estimating costs of care for meningitis infections in low- and middle-income countries. Vaccine. 2015;33 Suppl 1:A240-A247. doi:10.1016/j.vaccine.2014.11.061
Rheumatic Fever
$15,081.73 RHD admission +RHD valve surgery + RHD medical management Irlam, James, et al. "Primary prevention of acute rheumatic fever and rheumatic heart disease with penicillin in South African children with pharyngitis: a cost-effectiveness analysis." Circulation: Cardiovascular Quality and Outcomes 6.3 (2013): 343-351.
Multiple diarrhoeal diseases
$36.56 Used outpatient cost of illness for diarrheal diseases Baral, Ranju, et al. "Cost of illness for childhood diarrhea in low-and middle-income countries: a systematic review of evidence and modelled estimates." BMC Public Health 20 (2020): 1-13.
Buruli Ulcer
$4,058.30 Buruli Ulcer (severity NR) Omansen, Till F., et al. "Global Epidemiology of Buruli Ulcer, 2010–2017, and Analysis of 2014 WHO Programmatic Targets." Emerging infectious diseases 25.12 (2019): 2183. Drummond, Christina, and James RG Butler. "Mycobacterium ulcerans treatment costs, Australia." Emerging infectious diseases 10.6 (2004): 1038. Asiedu, Kingsley, and Samuel Etuaful. "Socioeconomic implications of Buruli ulcer in Ghana: a three-year review." The American journal of tropical medicine and hygiene 59.6 (1998): 1015-1022.
Trachoma
$35.29 Cost per patient of targeted azythromycin treatment in regions of Africa with high adult mortality and high child mortality.
Baltussen RM, Sylla M, Frick KD, Mariotti SP. Cost-effectiveness of trachoma control in seven world regions. Ophthalmic Epidemiol. 2005;12(2):91-101. doi:10.1080/09286580590932761
Typhoid and Paratyphoid
$20.91 Cost per treatment per case (USD 2016) Luthra K, Watts E, Debellut F, Pecenka C, Bar-Zeev N, Constenla D. A Review of the Economic Evidence of Typhoid Fever and Typhoid Vaccines. Clin Infect Dis. 2019;68(Suppl 2):S83-S95. doi:10.1093/cid/ciy1122
Cryptosporadiosis $24.77 Symptomatic cryptospordiosis Rafferty, Ellen R., et al. "Pediatric cryptosporidiosis:
an evaluation of health care and societal costs in Peru, Bangladesh and Kenya." PloS one 12.8 (2017).
Multiple salmonella infections
$20.91 Cost per treatment per case (USD 2016) Luthra K, Watts E, Debellut F, Pecenka C, Bar-Zeev N, Constenla D. A Review of the Economic Evidence of Typhoid Fever and Typhoid Vaccines. Clin Infect Dis. 2019;68(Suppl 2):S83-S95. doi:10.1093/cid/ciy1122
Hepatitis B $34.84 Median cost per patient per year of tenofovir treatment in 2016. https://www.who.int/news-room/fact-sheets/detail/hepatitis-b
Herpes Simplex 2
$11.74 Average cost per treatment across LMICs (Acyclovir 400 mg). Korenromp EL, Wi T, Resch S, Stover J, Broutet N. Costing of National STI Program Implementation for the Global STI Control Strategy for the Health Sector, 2016-2021. PLoS One. 2017;12(1):e0170773. Published 2017 Jan 27. doi:10.1371/journal.pone.0170773
Gonorrhea
$11.38 Average cost per treatment across LMICs (Ceftriaxone 250 mg) Korenromp EL, Wi T, Resch S, Stover J, Broutet N. Costing of National STI Program Implementation for the Global STI Control Strategy for the Health Sector, 2016-2021. PLoS One. 2017;12(1):e0170773. Published 2017 Jan 27. doi:10.1371/journal.pone.0170773
Chlamydia
$11.63 Average cost per treatment across LMICs (Azithromycine 500 mg) Korenromp EL, Wi T, Resch S, Stover J, Broutet N. Costing of National STI Program Implementation for the Global STI Control Strategy for the Health Sector, 2016-2021. PLoS One. 2017;12(1):e0170773. Published 2017 Jan 27. doi:10.1371/journal.pone.0170773

Developing an aggregator mechanism for late-stage clinical trials WORKING PAPER • 72
Table 2C. Disease disability weights.
Disease Health state Disability weight (DW) Notes
HIV
Acute HIV (entry) 0.012 Used DW for early HIV without anemia
CD4 > 500 0.078 Used DW for HIV/AIDS with antiretroviral treatment without anemia
CD4 500-350 0.274 Used DW for symptomatic HIV without anemia
CD4 350-200 0.582 AIDS without anemia
CD4 <200 0.582 AIDS without anemia
Tuberculosis
Drug-susceptible tuberculosis 0.333 Used DW for drug-susceptible TB
Multidrug-resistant tuberculosis without extensive drug resistance
0.333 Used DW for multidrug-resistant TB
Extensively drug-resistant tuberculosis 0.333 Used DW for extensively drug-resistant TB
Malaria
Mild malaria 0.006 n/a
Moderate malaria 0.051 n/a
Severe malaria 0.133 n/a
Severe motor impairment due to malaria 0.402 (0.268-0.545) n/a
Pneumonia Moderate lower respiratory infections 0.051 (0.032-0.074) n/a
Severe lower respiratory infections 0.133 (0.088-0.190) n/a
Chagas disease
Asymptomatic Chagas disease n/a n/a
Acute Chagas disease 0.051 (0.032-0.074) n/a
Moderate chronic digestive disease due to Chagas disease
0.114 (0.078-0.159) n/a
Moderate heart failure due to Chagas disease
0.072 (0.047-0.103) n/a
Severe heart failure due to Chagas disease 0.179 (0.122-0.251) n/a
Treated heart failure due to Chagas disease 0.049 (0.031-0.072) n/a
Mild heart failure due to Chagas disease 0.041 (0.026-0.062) n/a
Schistosomiasis
Severe anemia due to schistosomiasis 0.149 (0.101-0.209) n/a
Moderate anemia due to schistosomiasis 0.052 (0.034-0.076) n/a
Bladder pathology due to schistosomiasis 0.011 (0.005-0.021) n/a
Hydronephrosis due to schistosomiasis 0.011 (0.005-0.021) n/a
Hepatomegaly due to schistosomiasis 0.011 (0.005-0.021) n/a
Hematemesis due to schistosomiasis 0.325 (0.209-0.462) n/a
Ascites due to schistosomiasis 0.114 (0.078-0.159) n/a
Mild diarrhea due to schistosomiasis 0.074 (0.049-0.104) n/a
Mild schistosomiasis 0.006 (0.002-0.012) n/a
Mild anemia due to schistosomiasis 0.004 (0.001-0.008) n/a
Leishmaniasis
Severe visceral leishmaniasis 0.133 (0.088-0.190) n/a
Moderate visceral leishmaniasis 0.051 (0.032-0.074) n/a
Cutaneous and mucocutaneous leishmaniasis
0.067 (0.044-0.096) n/a
Dengue Moderate dengue 0.051 (0.032-0.074) n/a
Severe dengue 0.133 (0.088-0.190) n/a
Leprosy Disfigurement level 1 due to leprosy 0.011 (0.005-0.021) n/a Disfigurement level 2 due to leprosy 0.067 (0.044-0.096) n/a
Buruli Ulcer Mild decubitus ulcer
0.027 (0.015-0.042)

Developing an aggregator mechanism for late-stage clinical trials WORKING PAPER • 73
Moderate decubitus ulcer 0.188 (0.125-0.267)
Used decubitis ulcer as proxy for buruli ulcer. Used average of all sequelae
Severe decubitus ulcer 0.576 (0.401-0.731)
Cholera Mild diarrheal diseases
0.074 (0.049-0.104)
n/a
Severe diarrheal diseases 0.247 (0.164-0.348)
n/a
Moderate diarrheal diseases 0.188 (0.125-0.264)
n/a
Cryptosporadiasis Mild diarrheal diseases
0.074 (0.049-0.104)
n/a
Severe diarrheal diseases 0.247 (0.164-0.348)
n/a
Moderate diarrheal diseases 0.188 (0.125-0.264)
n/a
Ebola Ebola cases
0.133 (0.088-0.190)
n/a
Enterotoxigenic E. coli
Mild diarrheal diseases 0.074 (0.049-0.104)
n/a
Severe diarrheal diseases 0.247 (0.164-0.348)
n/a
Moderate diarrheal diseases 0.188 (0.125-0.264)
n/a
Sleeping Sickness (HAT)
Sleeping sickness due to Trypanosoma brucei rhodesiense
0.542 (0.374-0.702)
n/a
Skin disfigurement due to Trypanosoma brucei rhodesiense
0.027 (0.015-0.042)
n/a
Sleeping sickness due to Trypanosoma brucei gambiense
0.542 (0.374-0.702)
n/a
Skin disfigurement due to Trypanosoma brucei gambiense
0.027 (0.015-0.042)
n/a
Hepatitis C Severe acute hepatitis C
0.133 (0.088-0.190)
n/a
Moderate acute hepatitis C 0.051 (0.032-0.074)
n/a
Terminal phase of liver cancer due to hepatitis C
0.540 (0.377-0.687)
n/a
Controlled phase of liver cancer due to hepatitis C
0.049 (0.031-0.072)
n/a
Cirrhosis and other chronic liver diseases due to hepatitis C, decompensated
0.178 (0.123-0.250)
n/a
Hookworm Heavy infestation of hookworm
0.027 (0.015-0.043)
n/a
Severe wasting due to hookworm disease 0.128 (0.082-0.183)
n/a
Moderate anemia due to hookworm disease
0.052 (0.034-0.076)
n/a
Severe anemia due to hookworm disease 0.149 (0.101-0.209)
n/a
Meningitis n/a
Multiple diarrhoeal diseases
Mild diarrheal diseases 0.074 (0.049-0.104)
n/a
Severe diarrheal diseases 0.247 (0.164-0.348)
n/a

Developing an aggregator mechanism for late-stage clinical trials WORKING PAPER • 74
Moderate diarrheal diseases 0.188 (0.125-0.264)
n/a
Multiple salmonella infections
Mild diarrheal diseases 0.074 (0.049-0.104)
n/a
Severe diarrheal diseases 0.247 (0.164-0.348)
n/a
Moderate diarrheal diseases
0.188 (0.125-0.264)
n/a
Non-typhoidal salmonella
Mild diarrheal diseases 0.074 (0.049-0.104)
n/a
Severe diarrheal diseases 0.247 (0.164-0.348)
n/a
Moderate diarrheal diseases 0.188 (0.125-0.264)
n/a
Onchocerciasis Severe vision impairment due to onchocerciasis
0.184 (0.125-0.258)
n/a
Blindness due to onchocerciasis 0.187 (0.124-0.260)
n/a
Mild skin disease without itch due to onchocerciasis
0.011 (0.005-0.021)
n/a
Moderate skin disease due to onchocerciasis
0.188 (0.125-0.267)
n/a
Mild skin disease due to onchocerciasis 0.027 (0.015-0.042)
n/a
Moderate vision impairment due to onchocerciasis
0.031 (0.019-0.049)
n/a
Rheumatic Fever
No sequelae listed 0.685 (0.592-0.769)
Ock M, Lee JY, Oh IH, Park H, Yoon SJ, Jo MW. Disability Weights Measurement for 228 Causes of Disease in the Korean Burden of Disease Study 2012. J Korean Med Sci. 2016;31 Suppl 2(Suppl 2):S129‐S138.doi:10.3346/jkms.2016.31.S2.S129"
Shigellosis Mild diarrheal diseases
0.074 (0.049-0.104)
n/a
Severe diarrheal diseases 0.247 (0.164-0.348)
n/a
Moderate diarrheal diseases 0.188 (0.125-0.264)
n/a
Trachoma Moderate vision impairment due to trachoma
0.031 (0.019-0.049)
n/a
Typhoid and Paratyphoid
Acute typhoid infection 0.051 (0.032-0.074)
n/a
Severe typhoid fever 0.133 (0.088-0.190)
n/a
Intestinal perforation due to typhoid 0.324 (0.220-0.442)
n/a
Gastrointestinal bleeding due to typhoid 0.325 (0.209-0.462)
n/a
Hepatitis B Severe acute hepatitis B
0.133 (0.088-0.190)
n/a

Developing an aggregator mechanism for late-stage clinical trials WORKING PAPER • 75
Terminal phase of liver cancer due to hepatitis B
0.540 (0.377-0.687)
n/a
Controlled phase of liver cancer due to hepatitis B
0.049 (0.031-0.072)
n/a
Cirrhosis and other chronic liver diseases due to hepatitis B, decompensated
0.178 (0.123-0.250)
n/a
Herpes Simplex 2 Moderate infection due to initial genital herpes episode
0.051 (0.032-0.074)
n/a
Symptomatic genital herpes 0.006 (0.002-0.012)
n/a
Gonnorhea Moderate pelvic inflammatory diseases due to gonococcal infection
0.114 (0.078-0.159)
n/a
Mild gonococcal infection 0.006 (0.002-0.012)
n/a
Secondary infertility due to gonococcal infection
0.005 (0.002-0.011)
n/a
Primary infertility due to gonococcal infection
0.008 (0.003-0.015)
n/a
Chlamydia Epididymo-orchitis due to chlamydial infection
0.128 (0.086-0.180)
n/a
Moderate pelvic inflammatory diseases due to chlamydial infection
0.114 (0.078-0.159)
n/a
Severe pelvic inflammatory diseases due to chlamydial infection
0.324 (0.220-0.442)
n/a
Mild chlamydial infection 0.006 (0.002-0.012)
n/a
Secondary infertility due to chlamydial infection
0.005 (0.002-0.011)
n/a
Primary infertility due to chlamydial infection
0.008 (0.003-0.015)
n/a
Source: IHME
Table 2D. Baseline disease burden
Disease Point prevalence Incidence Annual number of
deaths Year Source
HIV/AIDS 36,822,237 1,942,071 954,492 2017 IHME, GBD results tool
Malaria 136,085,123 208,768,201 619,827 2017 IHME, GBD results tool
Tuberculosis 1,929,208,623 8,965,814 1,183,672 2017 IHME, GBD results tool
Pneumonia n/a 471,825,514 2,558,606 n/a IHME, GBD results tool
Chagas disease 6,196,959 162,470 7,853 2017 IHME, GBD results tool
Schistosomiasis 142,788,542 71,385,000 8,837 2016 GBD 2016
Leishmaniasis 4,130,197 669,058 7,527 2017 IHME, GBD results tool
Dengue 6,267,410 104,771,911 40,467 2017 IHME, GBD results tool
Leprosy 518,527 48,477 4,000 2017 IHME, GBD results tool Engers H, Morel CM. Leprosy. Nat Rev Microbiol. 2003;1(2):94‐95. doi:10.1038/nrmicro764
Shigellosis
NA 269,191,131 212,438 2016
Khalil IA, Troeger C, Blacker BF, et al. Morbidity and mortality due to shigella and enterotoxigenic Escherichia coli diarrhoea: the Global Burden of Disease Study 1990-2016 [published correction appears in Lancet Infect Dis. 2018 Oct 30;:]. Lancet Infect Dis. 2018;18(11):1229‐1240. doi:10.1016/S1473-3099(18)30475-4
Ebola NA 20,200 7,905 2014
Cenciarelli O, Pietropaoli S, Malizia A, et al. Ebola virus disease 2013-2014 outbreak in west Africa: an analysis of the epidemic spread and response. Int
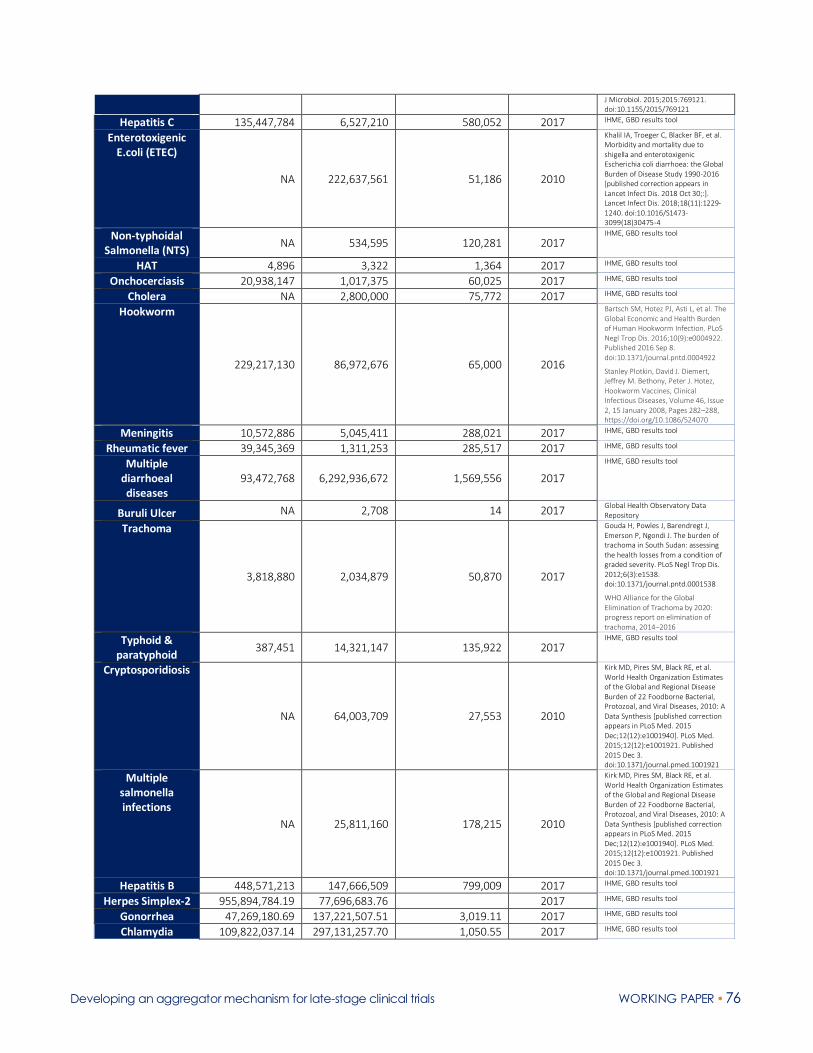
Developing an aggregator mechanism for late-stage clinical trials WORKING PAPER • 76
J Microbiol. 2015;2015:769121. doi:10.1155/2015/769121
Hepatitis C 135,447,784 6,527,210 580,052 2017 IHME, GBD results tool
Enterotoxigenic E.coli (ETEC)
NA 222,637,561 51,186 2010
Khalil IA, Troeger C, Blacker BF, et al. Morbidity and mortality due to shigella and enterotoxigenic Escherichia coli diarrhoea: the Global Burden of Disease Study 1990-2016 [published correction appears in Lancet Infect Dis. 2018 Oct 30;:]. Lancet Infect Dis. 2018;18(11):1229‐1240. doi:10.1016/S1473-3099(18)30475-4
Non-typhoidal Salmonella (NTS)
NA 534,595 120,281 2017 IHME, GBD results tool
HAT 4,896 3,322 1,364 2017 IHME, GBD results tool
Onchocerciasis 20,938,147 1,017,375 60,025 2017 IHME, GBD results tool
Cholera NA 2,800,000 75,772 2017 IHME, GBD results tool
Hookworm
229,217,130 86,972,676 65,000 2016
Bartsch SM, Hotez PJ, Asti L, et al. The Global Economic and Health Burden of Human Hookworm Infection. PLoS Negl Trop Dis. 2016;10(9):e0004922. Published 2016 Sep 8. doi:10.1371/journal.pntd.0004922
Stanley Plotkin, David J. Diemert, Jeffrey M. Bethony, Peter J. Hotez, Hookworm Vaccines, Clinical Infectious Diseases, Volume 46, Issue 2, 15 January 2008, Pages 282–288, https://doi.org/10.1086/524070
Meningitis 10,572,886 5,045,411 288,021 2017 IHME, GBD results tool
Rheumatic fever 39,345,369 1,311,253 285,517 2017 IHME, GBD results tool
Multiple diarrhoeal diseases
93,472,768 6,292,936,672 1,569,556 2017
IHME, GBD results tool
Buruli Ulcer NA 2,708 14 2017 Global Health Observatory Data Repository
Trachoma
3,818,880 2,034,879 50,870 2017
Gouda H, Powles J, Barendregt J, Emerson P, Ngondi J. The burden of trachoma in South Sudan: assessing the health losses from a condition of graded severity. PLoS Negl Trop Dis. 2012;6(3):e1538. doi:10.1371/journal.pntd.0001538
WHO Alliance for the Global Elimination of Trachoma by 2020: progress report on elimination of trachoma, 2014–2016
Typhoid & paratyphoid
387,451 14,321,147 135,922 2017 IHME, GBD results tool
Cryptosporidiosis
NA 64,003,709 27,553 2010
Kirk MD, Pires SM, Black RE, et al. World Health Organization Estimates of the Global and Regional Disease Burden of 22 Foodborne Bacterial, Protozoal, and Viral Diseases, 2010: A Data Synthesis [published correction appears in PLoS Med. 2015 Dec;12(12):e1001940]. PLoS Med. 2015;12(12):e1001921. Published 2015 Dec 3. doi:10.1371/journal.pmed.1001921
Multiple salmonella infections
NA 25,811,160 178,215 2010
Kirk MD, Pires SM, Black RE, et al. World Health Organization Estimates of the Global and Regional Disease Burden of 22 Foodborne Bacterial, Protozoal, and Viral Diseases, 2010: A Data Synthesis [published correction appears in PLoS Med. 2015 Dec;12(12):e1001940]. PLoS Med. 2015;12(12):e1001921. Published 2015 Dec 3. doi:10.1371/journal.pmed.1001921
Hepatitis B 448,571,213 147,666,509 799,009 2017 IHME, GBD results tool
Herpes Simplex-2 955,894,784.19 77,696,683.76 2017 IHME, GBD results tool
Gonorrhea 47,269,180.69 137,221,507.51 3,019.11 2017 IHME, GBD results tool
Chlamydia 109,822,037.14 297,131,257.70 1,050.55 2017 IHME, GBD results tool

Developing an aggregator mechanism for late-stage clinical trials WORKING PAPER • 77
References Anh DD, Riewpaiboon A, Le Huu Tho S, Kim BN, Nyambat G, Kilgore P. Treatment costs of pneumonia, meningitis, sepsis, and other diseases among hospitalized children in Viet Nam. J Health Popul Nutr. 2010;28(5):436.
Engers H, Morel CM. Focus: Leprosy. Nature Reviews Microbiology. 2003;1:94-95
Lee J-S, Mogasale V, Lim JK, et al. A multi-country study of the economic burden of dengue fever: Vietnam, Thailand, and Colombia. PLoS Negl Trop Dis. 2017;11(10):e0006037.
Meheus F, Balasegaram M, Olliaro P, et al. Cost-effectiveness analysis of combination therapies for visceral leishmaniasis in the Indian subcontinent. PLoS Negl Trop Dis. 2010;4(9):e818.
Ross JM, Ying R, Celum CL, et al. Modeling HIV disease progression and transmission at population-level: The potential impact of modifying disease progression in HIV treatment programs. Epidemics. 2018;23:34-41.
Salari P, Fürst T, Knopp S, Utzinger J, Tediosi F. Cost of interventions to control schistosomiasis: A systematic review of the literature. PLoS Negl Trop Dis. 2020;14(3):e0008098.
White MT, Conteh L, Cibulskis R, Ghani AC. Costs and cost-effectiveness of malaria control interventions—a systematic review. Malaria J. 2011;10(1):337.
WHO. Global Tuberculosis Report 2019. World Health Organization. 2019.
Wilson LS, Strosberg AM, Barrio KJT. Cost-effectiveness of Chagas disease interventions in Latin America and the Caribbean: Markov models. Am J Trop Med Hyg. 2005;73(5):901-910.
Xiong M, Li M, Zheng D, et al. Evaluation of the economic burden of leprosy among migrant and resident patients in Guangdong Province, China. BMC Infect Dis. 2017;17(1):760.

Developing an aggregator mechanism for late-stage clinical trials WORKING PAPER • 78
Annex 3. Number of candidates in phase II
The table below shows the number of candidates in the current pipeline.
All diagnostics (N = 168) were excluded. The total number of candidates is 522; if diagnostics were included,
the total number of candidates would be 690. The paper by Bandara et al. also includes an expanded list of
diseases with 754 candidates in the pipeline (not shown here).5
Pipeline Number of Candidates
in phase II Total Percentage
2019 study (# for direct comparison
with 2017 results; see Bandara et
al. for more details5)
103 522 19.73%

Developing an aggregator mechanism for late-stage clinical trials WORKING PAPER • 79
Annex 4. Product candidates in the 2017 and the complete 2019 pipelines categorized
by disease
Disease 2017 2019 Pipeline expansion Scope expansion
Buruli Ulcer 4 6 2 0
Chagas 18 16 -2 0
Chlamydia Not in scope 5 0 5
Cholera 3 2 -1 0
Cryptococcal meningitis 1 3 2 0
Cryptosporidiasis 0 1 1 0
Dengue 7 9 2 0
Ebola 20 82 62 0
Enterotoxigenic E.coli (ETEC) 8 6 -2 0
Giardia 1 1 0 0
Gonorrhea Not in scope 11 0 11
HAT (Sleeping sickness) 6 4 -2 0
Hepatitis B Not in scope 8 0 8
Hepatitis C 16 15 -1 0
Herpes Simplex-2 Not in scope 7 0 7
HIV/AIDS 99 105 -10 16
HPV- Cervical Cancer Not in scope 1 0 1
Hookworm 2 3 1 0
Leishmaniasis 14 19 5 0
Leprosy 2 3 0 1
Leptospirosis 1 6 5 0
Lymphatic filariasis 2 2 0 0
Malaria 109 127 18 0
Meningitis 2 11 9 0
Multiple diarrhoeal diseases 1 2 1 0
Multiple Diseases 0 1 0 1
Multiple salmonella infections 0 1 1 0
Multiple vector borne diseases 1 4 3 0
Mycetoma Not in scope 1 0 1
Non-typhoidal Salmonella (NTS) 7 4 -3 0
Onchocerciasis 4 6 2 0
Pneumonia 8 12 4 0
Reproductive Health 59 100 28 13
Rheumatic fever 2 4 2 0
Rotavirus 5 11 6 0
Schistosomiasis 16 9 -7 0
Shigellosis 13 14 1 0
Trachoma 2 2 0 0
Trichuriasis 1 1 0 0
Tuberculosis 98 120 22 0
Typhoid & paratyphoid 6 9 3 0
Total 538 754 152 64
Number of candidates Changes due to

Developing an aggregator mechanism for late-stage clinical trials WORKING PAPER • 80
Annex 5. Expected launches by disease based on the 2017 and the complete 2019 pipelines
Disease 2017Complete 2019
pipeline
Changes in
the pipeline
Scope
expansion
Classification
changes
Buruli Ulcer 2 3 1
Chagas 3 3 0
Chlamydia Not in scope 3 0 3
Cholera 1 -1
Dengue 2 3 1
Ebola 2 20 18
Enterotoxigenic E.coli (ETEC) 1 1 0
Gonorrhea Not in scope 2 0 2
HAT (Sleeping sickness) 2 3 1
Hepatitis B Not in scope 1 0 1
Hepatitis C 8 12 3 1
HIV/AIDS 23 20 -4 1
Leishmaniasis 3 6 3
Leprosy 0 1 1
Leptospirosis 1 6 5
Lymphatic filariasis 1 2 1
Malaria 27 39 11 1
Meningitis 0 5 5
Multiple vector borne diseases 0 1 1
Pneumonia 1 3 2
Reproductive Health 8 15 6 1
Rotavirus 2 3 1
Schistosomiasis 3 2 -1
Shigellosis 2 2 0
Trachoma 0 1 1
Tuberculosis 35 49 13 1
Typhoid & paratyphoid 1 1 0
Total 128 207 68 8 3
Expected launches Difference in launches due to

Developing an aggregator mechanism for late-stage clinical trials WORKING PAPER • 81
Annex 6. Cost by phase to move product candidates through the pipeline to launch for
the 2019 direct comparison pipeline and the complete 2019 pipeline
Phases
2019 direct
comparison pipeline
($US million)
Percent of the total Complete 2019 pipeline
($US million) Percent of the total
Pre-Clinical 2,334.98 11.75 2,456.86 11.68
Phase I 833.10 4.19 921.84 4.38
Phase II 4,992.70 25.13 4,715.76 22.43
Phase III 11,709.20 58.93 12,932.71 61.50
Total 19,869.98 100.00 21,027.18 100.00
As described in Section 3, we amended the list of diseases included in the costing to compare the costs for
moving product candidates through the pipeline with the disbursements from the 2019 G-FINDER 2019
report.4 The table below shows the costs per phase; a total of US$9.9 billion is needed for phase III trials
according to this modeling.
Phases Total costs ($US million) Percentage of the total
Preclinical 1,344.87 8.465868202
Phase I 644.88 4.059473438
Phase II 4,017.84 25.29198698
Phase III 9,878.23 62.18267138
Total 15,885.83 100

Developing an aggregator mechanism for late-stage clinical trials WORKING PAPER • 82
Annex 7. Summary table of major PDPs and intermediaries in PRNDs R&D
Funding Mechanism
Type Partners Description Funds mobilized ($US)
Governance structure
Product/trial status to date
International AIDS Vaccine
Initiative (IAVI)
PDP USAID, PEPFAR, BMGF, EU, World Bank, DOD, UKAID, EDCTP, DTRA, CEPI, Wellcome Trust, and the governments of Denmark, India, Japan, Norway, and Ireland
Provides grants and scientific and technical support to advance vaccine and antibody candidates for HIV/AIDS.
Shares best practices between high and middle-income countries through a network of clinical trial partners.
~$330 million from 2015-18
Governed by Board of Directors.
The day-to-day operations are overseen by senior leadership.
33 vaccine candidates advanced to clinical trials across 11 countries. No products launched.
MMV PDP BMGF, UK DFID, USAID, Wellcome Trust, Netherlands Ministry of Foreign Affairs, and other private and public sector stakeholders
Provides grants, scientific and technical expertise to facilitate equitable access to quality antimalarials, and brings forward new tools for resistance and elimination of malaria.
~$281 million from 2015-18
Governed by Board of Directors.
The Expert Scientific Advisory Committee helps to identify projects and monitor progress through an annual review.
The Access & Product Management Advisory Committee advices on strategies to drive access.
Global Safety Board reviews projects that are testing for the first time in humans.
9 products developed and registered and 4 products currently in phase III trials.
PATH PDP Government of the US, philanthropic institutions such as the Bill and Melinda Gates Foundation
Provides grants and technical expertise to bridge the gap between technologies of the developed world and family planning needs of developing nations with recent venture into malaria vaccines.
~$307 million from 2015-18
Governed by Board of Directors.
The day-to-day operations are managed by an executive team.
No quantified pipeline data publicly available.
DNDi PDP UK DFID, BMGF, MSF, Wellcome Trust, EU, UNITAid, NIH/NIAID/USAID, and governments of
Provides grants to early-stage research and product registration,
~$196 million from 2015-18
Governed by Board of Directors.
Regional entities are governed by regional
9 products developed and registered and 2 products currently

Developing an aggregator mechanism for late-stage clinical trials WORKING PAPER • 83
Netherlands, Germany, Japan, Switzerland, France, and Spain
implementation and access for neglected diseases like leishmaniasis, sleeping sickness, and Chagas disease.
boards.
The Scientific Advisory Committee advises the Board regarding project funding and decisions.
The day-to-day operations are managed by an executive team.
undergoing regulatory review.
TB Alliance PDP Australian Aid, BMGF, Cystic Fibrosis Foundation, EDCTP, GHIT, Indonesia Health Fund, Irish Aid, Medical Research Council, NIAID, USAID, Rockefeller Foundation, and the governments of Netherlands, Germany, and UK
Provides grants and technical expertise to evaluate novel combinations of TB drugs, and promotes market access by working with partner manufacturers, distributors, and purchasers to ensure consistent product supply.
~$233 million from 2015-18
Governed by Board of Directors.
The Board is advised by four committees that include: Scientific (technical expertise on drug research and development), Stakeholder (advises on R&D activities, market adoption techniques, and dissemination and sharing of global information), Access (advises on strategies to achieve adoption, availability, and affordability of new treatments), and Pediatric (provides strategic guidance on pediatric TB issues/concerns).
3 products developed and registered.
EDCTP Intermediary EU and EU member states
Provides grants, capacity building, and technical expertise to support collaborative research that accelerates the clinical development of new or improved interventions for HIV/AIDS, Malaria, TB, and NTDs.
~$650 million since 2014 (EDCTP2)
The General Assembly provides oversight with representatives from African and EU member states and representatives from EU, WHO, and the African Union.
The Scientific Advisory Committee is comprised of EU and African scientists and advises the General Assembly on technical matters.
The day-to-day operations are managed by the Secretariat.
Funded more than 100 clinical trials for drugs, vaccines, and diagnostics primarily in the early stages.
GHIT Intermediary Government of Japan, Japanese Pharmaceutical Companies, BMGF,
Invests in discovery, preclinical, and other development
$145 million since 2013 with additional
The Board of Directors approves major rules, strategic plans, and annual budget.
11 products in clinical trials with 1 in Phase III and 1 in

Developing an aggregator mechanism for late-stage clinical trials WORKING PAPER • 84
Wellcome Trust, and UNDP
phases of neglected disease projects including HIV/AIDS, Malaria, TB, and NTDs, and also provides a drug screening and discovery service to PDPs/Pharma.
$200 million for 2018-20
The Selection Committee evaluates investment proposals and reports from development partners and provides investment recommendations to the Board of Directors.
No private company representatives are represented on the Selection Committee to allow for investments into pharmaceutical products.
The day-to-day operations are managed by a leadership team.
product registration phase.
CEPI Other BMGF, Wellcome Trust, WEF, EC, and governments of Australia, Belgium, Canada, Germany, India, Japan, and Norway
Focuses on pre-outbreak vaccine development for priority diseases from the WHO R&D Blueprint for Action to Prevent Epidemics.
$630 million raised since 2016
Governed by the Board of Directors.
The Scientific Advisory Committee provides recommendations on priority pathogens and development partners.
CEPI Investment Council members engage in resource mobilization efforts and serve on the Board of Directors.
The Joint Coordination Group also advises the organization, which is a roundtable of independent institutions that play roles in R&D for vaccines.
7 products in clinical trials with 1 in phase III.
GHIF Other BMGF, JP Morgan, Swedish IDA, CIFF, KFW, GSK, Merck, Pfizer, Equitable Investment Managers, and IFC
Mobilizes capital from high-net worth individuals and institutions to fund late-stage innovations for neglected diseases seeking social impact and a return on investment.
$108 million since 2013
The Investment Committee and Charitability Oversight Committee monitor and approve investments.
This fund leverages expertise of the investor base via an Investor Advisory Committee and a Scientific Advisory Committee, which both provide investment reviews for companies.
11 products in late-phase clinical development across more than 7 diseases.

Developing an aggregator mechanism for late-stage clinical trials WORKING PAPER • 85
GARDP Other BMGF, Leo Model Foundation, MSF, UK DFID, Wellcome Trust, and the governments of UK, South Africa, Netherlands, Monaco, Luxembourg, and Germany
Identifies gaps in the antibiotic pipeline and partners with research institutions and pharmaceutical companies to advance product development—particularly new therapeutics.
$65 million pledged since 2016
Governed by a Board of Directors that determines its strategic goals and ensures that milestones are met.
The Scientific Advisory Committee advises the Board of Directors on scientific objectives and strategies.
4 products developed and in registration and 1 candidate in Phase IIb/III
CARB-X Other BARDA, Wellcome Trust, BMBG, UK Department of Health and Social Care, BMGF, NIAID, and Boston University
Provides grants as well as scientific and business support to advance the early stages of innovative antibiotics and other therapeutics, vaccines, rapid diagnostics, and devices to address drug-resistant bacterial infections with primary focus on preclinical and early-stage.
$500 million from 2016-21
The Joint Oversight Committee acts as the Board of Directors with full oversight of operational and financial activities.
The Advisory Board provides recommendations on research investment decisions.
Graduated six products to Phase I clinical trials. No products registered.
UNITAID Other BMGF and the governments of France, UK, Norway, Brazil, Spain, Republic of Korea, and Chile
Provides grants to scale up access to treatment for HIV/AIDS, Malaria, and Tuberculosis by leveraging price reductions of quality drugs and diagnostics and creates a network of innovators who produce high-quality health products.
~$680 million from 2015-18
The Executive Board determines the organization’s objectives and monitors progress.
The Finance & Accountability Committee and Policy & Strategy Committee advise the Executive Board.
The Proposal Review Committee is an independent, impartial team of experts who provide scientific, market dynamics, health economics, and implementation expertise to UNITAID on proposals and draft grant agreement development documents.
1 approved pediatric TB drug. Project status for other treatment areas unavailable.
As of May 2020

Developing an aggregator mechanism for late-stage clinical trials WORKING PAPER • 86
Annex 8. Detailed results of the modeling on costs and benefits
Required investments and expected launches
Option 1: We reviewed the pipeline of product candidates for PRNDs as of August 31, 2019 (see
https://f1000research.com/articles/9-416) and found a total of 116 vaccine candidates in the early stages of
development (defined as advanced pre-clinical, phase I, and phase II) for HIV, TB, malaria, and pneumonia
(Panel 1A). Of these 116 vaccine candidates, 23 (20%) were in the advanced pre-clinical phase, 63 (54%) were
in phase I, and 30 (26%) were in phase II. We assumed that the pipeline will be replenished through entry of
new candidates into the advanced pre-clinical phase at a rate of 10 new candidates per disease condition per
year. Based on this portfolio, about 16 vaccine candidates will make it to phase III between 2022 and 2029. Of
these 16 candidates, 3 will be simple vaccine candidates for pneumonia and 13 will be complex candidates for
HIV, TB, malaria, and pneumonia. With a phase III investment of around US$2.8 billion over 11 years, 10
vaccine launches are expected between 2023 and 2029. The first expected success is a pneumonia vaccine in
2023, followed by HIV, TB, and malaria vaccines (in 2026) and further vaccine launches after that (Panel 1B).
Panel 1C shows the needed phase III funding by year. Assuming a start-up cost of US$36 million and an annual
running cost of US$25 million, the total operational cost over 10 years for Option 1 is US$249.5 million. With
an additional US$50 million annually over five years for health system strengthening activities, the total
needed investment increases to US$2.8 billion.

Developing an aggregator mechanism for late-stage clinical trials WORKING PAPER • 87
Panel 1. Number of vaccine candidates in early stages of development (1A), expected launches by year
(1B), and needed phase III funding by year (1C) for Option 1
Option 2: For Option 2, we identified a total of 327 product candidates (therapeutics, vaccines, and
diagnostics) in early stage development (Panel 2A). Of these, 272 (83%) were candidate products for HIV, TB,
and malaria; 16 (5%) were for visceral leishmaniasis, 14 (4%) were for Chagas disease, 9 (3%) were for
pneumonia, 9 (3%) were for schistosomiasis, 5 were for dengue, and 2 were for leprosy. As with Option 1, we
assumed that the pipeline will be replenished through entry of new candidates into the advanced pre-clinical
phase at a rate of 10 new candidates per disease condition per year. The total investment needed for phase
III is US$8.96 billion, which is expected to result in 155 product launches between 2021 and 2031 (Panel 2B).
Panel 2C shows the needed phase III funding by year. Assuming an annual running cost of US$40 million, a
startup investment of US$58 million in year 0, and an additional US$100 million annually for health system
strengthening activities, the total needed investment for Option 2 is US$9.84 billion.

Developing an aggregator mechanism for late-stage clinical trials WORKING PAPER • 88
Panel 2. Number of product candidates in early stages of development (2A), expected launches by year
(2B), and needed phase III funding by year (2C) for Option 2
Option 3: For Option 3, we included an additional 21 disease conditions to those included in option 2. We
identified 179 product candidates in addition to those included in option 2. The total number of candidates in
early stage of development is 506. (Panel 3A). The highest number of candidates were for malaria (98),
tuberculosis (87), HIV (87), and Ebola (70). Combined, products for neglected tropical diseases represented
only 11.5%, where all except Chagas disease, and leishmania have less the 10 candidates. Similar to the other
options, we assumed that the pipeline will be replenished through entry of new candidates into the advanced
pre-clinical phase at a rate of 10 new candidates per disease condition per year. The total investment needed
for phase III is US$16.83 billion, which is expected to result in 256 product launches between 2021 and 2031
(Panel 3B). Panel 3C shows the needed phase III funding by year. Assuming an annual running cost of US$60
million, a startup investment of US$87 million in year 0, and an additional US$250 million annually for health
system strengthening activities, the total needed investment for Option 3 is US$18.61 billion.

Developing an aggregator mechanism for late-stage clinical trials WORKING PAPER • 89
Panel 3. Number of product candidates in early stages of development (3A), expected launches by year
(3B), and needed phase III funding by year (3C) for Option 3
Estimating post-launch demand for vaccines, therapeutics, and procurement costs
The primary benefits from vaccines derive from their effect on reducing the annual incidence of a disease,
while benefits from therapeutics could arise either from an increase in treatment coverage (e.g., from the
development of a cheaper drug) or through increase in therapeutic effectiveness. Under vaccine efficacy
assumptions of 75% (for HIV, TB, malaria, Chagas disease, schistosomiasis, and visceral leishmaniasis), and
85% for pneumonia (assuming a pneumonia vaccine will be at least as effective as PCV vaccine), and a target
annual incidence reduction of 10 percentage point increments, a pneumonia vaccine will have the highest
annual number of doses demanded. For example, our estimates show that the annual number of vaccine
doses demanded for pneumonia in the first year of introduction will be 69 million, compared with 35 million
for malaria and one million each for HIV and TB, respectively. At a vaccine price per course of US$10, the
overall vaccine procurement cost for Option 1 ranged from US$61.7 million (HIV) to US$3.7 billion for
pneumonia vaccine (Panel 4). Two factors contribute to the higher numbers for pneumonia: (i) the pneumonia
vaccine will be the first to launch in 2023, and ii) pneumonia has the highest baseline incidence compared to
all of the other diseases included in the model. At US$99.0 billion, the overall vaccine procurement cost in
design Option 3 is the highest of the 3 options, compared to US$41.0 billion and US$40.3 billion for option 2
and 1, respectively.

Developing an aggregator mechanism for late-stage clinical trials WORKING PAPER • 90
Panel 4. Number of needed doses of HIV, TB, malaria, and pneumonia vaccines (4A) and projected total
procurement costs (4B) to achieve incidence reduction targets for Option 1
For therapeutics, under the assumption that (a) the costs of new therapeutics will be similar to the costs of
existing ones, and (b) there will be a 10% year-on-year increase in treatment coverage (as described earlier),
the overall demand (for additional cases covered) over 11 years is valued at US$28.5 billion. The highest
demand will be for malaria therapeutics (US$17.3 billion), followed by TB therapeutics (US$10.7 billion). The
demand for additional HIV therapeutics will have a value of US$366.9 million. The value will be US$106.8
million, US$43.4 million, US$7 million, and US$2.1 million for schistosomiasis, Chagas disease, leishmaniasis,
and leprosy therapeutics, respectively. It is important to note that the model stops at the year 2035, so if a
product launch is expected to happen in 2031 (leprosy), only three years were modeled (2033-2035).
Therefore, the demand for therapeutics will be different if the model is extended beyond 2035. Another factor
that determines demand is the baseline treatment coverage. If the baseline coverage is high and the launch
happens towards the end of the model time horizon, the resulting demand will be low. Lastly, if there was a
successful launch of a vaccine and a therapeutic candidate for the same disease, the potential increase in
demand for therapeutics will be partly or completely offset by the potential decrease in demand for treatment
as a result of vaccine-induced reduction in incidence. For diagnostics, under the assumption that a new
diagnostic would result in higher case detection, we measured the benefits from diagnostics as an increase in
treatment coverage (of the new cases identified). We assumed a one-time 10% increase in treatment
coverage in the year of introduction and maintain that level as the baseline treatment coverage in subsequent
years. Further increases in treatment coverage can occur with new launches of therapeutics.
Net benefits
From a societal perspective, we estimated that Option 1 will avert 18.4 million deaths and 516 million DALYs
over 10 years at a cost per death averted of US$2,341, and a cost per DALY averted of US$84. Option 2 will
avert 23 million deaths and 674 million DALYs at a cost per death averted of US$2,217 and a cost per DALY
averted of US$75. Option 3 will avert 26.9 million deaths and 1.03 billion DALYs at a cost of US$4,371 and
US$114 per death averted and DALY averted, respectively. The incremental cost-effectiveness ratio (ICER) of
Option 2 compared to Option 1 is US$27.55 per DALY averted. Fund investors’ perspective only include costs
incurred by the aggregator, thus from this perspective the cost effectiveness ratios are significantly better for
all options (Table 8A)

Developing an aggregator mechanism for late-stage clinical trials WORKING PAPER • 91
Table 8A. Comparison of the cost-effectiveness of Options 1, 2 and 3
Net cost (US$ billion) DALYs averted over 10 years (in millions)
Cost per DALY averted Deaths averted over 10 years (in millions)
Cost per Death averted
Design option 1
Societal Fund investor
Societal Fund investor
Societal Fund investor
$43.07 $2.80 516 $84 $5.43 18.4 $2341 $152
Design option 2
$50.81 $9.84 674 $75 $14.60 22.9 $2217 $429
Design option 3
$117.64 $18.61 1,030 $114 $18.01 26.91 $4,371 $692
ICER (2 vs 1) $48.94 $1,714
ICER (3 vs 2) $186 $16715
Table 8B. Benefit cost ratios and net benefits: societal vs. investor’s perspective
Societal perspective Fund investor’s perspective
Net costs (US
billion)
Net benefits Benefit cost
ratio
Net costs (US
billion)
Net benefits Benefit cost
ratio
Option 1 $43.07 $238.4 5.53 $2.80 $198.11 70.78
Option 2 $50.81 $197.4 3.88 $9.8 $156.41 15.90
Option 3 $117.64 $286.67 2.52 $18.6 $197.61 10.62
For Option 1, more than half of the averted DALYs are from pneumonia vaccines (324.9 million DALYs) while
an HIV vaccine will avert 79.6 million DALYs (15%). Tuberculosis and malaria vaccines will avert 56.2 million
(11%), and 55.1 million (11%) DALYs, respectively (Panel 5). This design option is also projected to avert
US$238.4 billion in treatment costs over the period of interest to 2035. With a net cost of US$43.07 billion,
the estimated benefit cost ratio of Option 1 is 5.53 (Table 8B). For Option 2, 48% of the averted DALYs were
from pneumonia products, 23%from HIV products, 15% from malaria products, 14% from TB products, and
<1% was from other products to control other diseases (Panel 6). With a net cost of US$50.81 billion, the
estimated benefit cost ratio of Option 2 is 3.88. For option 3, In addition to the DALYs from the products
included in option 2, the majority of the DALYs averted were from hepatitis B products (175.5 million),
meningococcal meningitis products (55.4 million), shigellosis products (34 million) and, typhoid and
paratyphoid (17.9 million). (Panel 7) The net cost of design option 3 is US$117.6, and the benefit cost ratio is
2.52. We discounted costs and health benefits using an annual discount rate of 3%.

Developing an aggregator mechanism for late-stage clinical trials WORKING PAPER • 92
Overall, compared with Option 2, Option 1 has higher societal benefits as a result of the treatment costs
averted due to vaccination. While Options 2 results in high averted medical costs due to vaccination, it also
has additional medical costs as a result of increased treatment coverage. Thus, although the net health
benefits (DALYs averted) of design Option 2 are higher than those of Option 1, the net economic benefits
(treatment costs averted) are lower. Because of its large scope, option 3 has the highest net benefits, however,
for the same reason, it has the highest cost and the lowest benefit cost ratio.
Panel 5. Projected health benefits (DALYs averted, million) over 10 years for Option 1
-
20
40
60
80
100
120
140
2024 2025 2026 2027 2028 2029 2030 2031 2032 2033 2034 2035
DA
LYs
ave
rte
d, m
illio
n
Year
HIV Tuberculosis Malaria Pneumonia
-
20
40
60
80
100
120
140
160
2023 2024 2025 2026 2027 2028 2029 2030 2031 2032 2033 2034 2035
DA
LYs
ave
rted
, mill
ion
YearHIV Tuberculosis Malaria Pneumonia Chagas disease
Schistosomiasis Leishmaniasis Dengue Leprosy

Developing an aggregator mechanism for late-stage clinical trials WORKING PAPER • 93
Panel 6. Projected health benefits (DALYs averted, million) over 10 years for Option 2
Panel 7. Projected health benefits (DALYs averted, million) over 10 years for Option 3
Efficiency gains
Efficiency gains arise from the aggregator’s ability to use adaptive clinical trials. Benefits from adaptive clinical
trials result from operational and statistical efficiencies that ultimately reduce trial costs and shorten lead
times between trial phases. We modeled two scenarios. In the first scenario 50% of trials supported by the
aggregator adopt an adaptive design, resulting in a 3-month reduction in phase length for all phases and a
7.5% reduction in late-stage trial costs. In the second scenario 100% of trials supported by the aggregator
adopt an adaptive design, resulting in a 6-month reduction in phase length for all phases and a 15% reduction
in late-stage trial costs. Both scenarios were compared to a baseline scenario in which 0% of trials supported
by the aggregator adopt an adaptive design.
In our discrete event simulation (DES) model, products (vaccines, drugs, and diagnostics) were treated as entities
with attributes specifying their unique phase length times and phase success probabilities. Trial phases
(preclinical, phase I, phase II, and phase III) were treated as servers with an infinite capacity to handle entities. All
entities generated were assigned four numbers randomly sampled from a uniform distribution ranging from 0
to 1. Each of these four numbers determined an entity’s success in moving from one server to the next. An entity
-
50
100
150
200
250
300
2024 2025 2026 2027 2028 2029 2030 2031 2032 2033 2034 2035
HIV Tuberculosis Malaria
Pneumonia Chagas disease Schistosomiasis
Leishmaniasis Dengue Leprosy
Shigellosis Ebola Hepatitis C
Enterotoxigenic E.coli (ETEC) Non-typhoidal Salmonella (NTS) HAT
Onchocerciasis Cholera Hookworm
Meningitis Rheumatic fever Multiple diarrhoeal diseases
Buruli Ulcer Trachoma Typhoid & paratyphoid
Cryptosporidiosis Multiple salmonella infections Hepatits B
Herpes Simplex-2 Gonorrhea Chlamydia

Developing an aggregator mechanism for late-stage clinical trials WORKING PAPER • 94
was considered launched if it successfully exited the phase III server. The baseline model results were validated
against the results from the portfolio to impact model. Figure 8A is a diagram of our DES for option 1.
Figure 8A. Architecture of discrete event simulation model for Option 1 built with SimEvents (Matlab 2020Ra).
Given the probabilistic nature of our discrete event models that arises from random number generation, we
used a Monte Carlo approach to synthesize results. Each of the three scenarios described above were
simulated 100 times each. Product launches were averaged across all 100 simulations to obtain our final
statistic: mean launches per entity per year. Results from all three scenarios are described in Table 8C.

Developing an aggregator mechanism for late-stage clinical trials WORKING PAPER • 95
Table 8C. Cost, DALYs Averted, Deaths Averted, and BCR for All Efficiency Scenarios.
Option 1
Business-as-usual
(No improvements in
efficiency)
Feasible improvements in
efficiency
(50% adaptive trials)
Ambitious improvements in
efficiency
(100% adaptive trials)
Net Cost $43,070,968,662 $45,284,863,680 $50,055,372,038
Total DALYs Averted 515,780,177 565,965,737 617,465,617
Net Cost Per DALY Averted $84 $80 $81
Total Deaths Averted 18,401,771 19,842,072 21,647,868
Net Cost Per Death Averted $2,341 $2,282 $2,312
Benefit Cost Ratio 5.53 5.65 5.65
Option 2
Business-as-usual
(No improvements in
efficiency)
Feasible improvements in
efficiency
(50% adaptive trials)
Ambitious improvements in
efficiency
(100% adaptive trials)
Net Cost $50,809,984,900 $52,886,955,917 $57,599,563,624
Total DALYs Averted 673,901,317 738,335,962 784,506,654
Net Cost Per DALY Averted $75 $72 $73
Total Deaths Averted 22,915,217 24,655,929 26,296,865
Net Cost Per Death Averted $2,217 $2,145 $2,190
Benefit Cost Ratio 3.88 4.06 4.18
Option 3
Business-as-usual
(No improvements in
efficiency)
Feasible improvements in
efficiency
(50% adaptive trials)
Ambitious improvements in
efficiency
(100% adaptive trials)
Net Cost $117,643,715,881 $121,997,836,574 $137,792,068,261
Total DALYs Averted 1,033,172,193 1,156,616,145 1,292,684,784
Net Cost Per DALY Averted $114 $105 $107
Total Deaths Averted 26,913,715 28,986,152 32,548,970
Net Cost Per Death Averted $4,371 $4,209 $4,233
Benefit Cost Ratio 2.52 2.73 2.89

Developing an aggregator mechanism for late-stage clinical trials WORKING PAPER • 96