deutsche telekom cmd 2015 - europe
TRANSCRIPT
DEUTSCHE TELEKOM CAPITAL MARKETS DAY 2015 Bonn, February 26/27, 2015
GROUP STRATEGY COST AnD PORTfOLIO TRAnSfORMATIOn LEAD In bUSInESS SUPERIOR PRODUCTIOn MODEL EUROPE GERMAnY T-MObILE USA fInAnCE
DISCLAIMER
This presentation contains forward-looking statements that reflect the current views of Deutsche Telekom management with respect to future events. These forward-looking statements include statements with regard to the expected development of revenue, earnings, profits from operations, depreciation and amortization, cash flows and personnel-related measures. You should consider them with caution. Such statements are subject to risks and uncertainties, most of which are difficult to predict and are generally beyond Deutsche Telekom’s control. Among the factors that might influence our ability to achieve our objectives are the progress of our workforce reduction initiative and other cost-saving measures, and the impact of other significant strategic, labor or business initiatives, including acquisitions, dispositions and business combinations, and our network upgrade and expansion initiatives. In addition, stronger than expected competition, technological change, legal proceedings and regulatory developments, among other factors, may have a material adverse effect on our costs and revenue development. Further, the economic downturn in our markets, and changes in interest and currency exchange rates, may also have an impact on our business development and the availability of financing on favorable conditions. Changes to our expectations concerning future cash flows may lead to impairment write downs of assets carried at historical cost, which may materially affect our results at the group and operating segment levels. If these or other risks and uncertainties materialize, or if the assumptions underlying any of these statements prove incorrect, our actual performance may materially differ from the performance expressed or implied by forward-looking statements. We can offer no assurance that our estimates or expectations will be achieved. Without prejudice to existing obligations under capital market law, we do not assume any obligation to update forward-looking statements to take new information or future events into account or otherwise. In addition to figures prepared in accordance with IFRS, Deutsche Telekom also presents non-GAAP financial performance measures, including, among others, EBITDA, EBITDA margin, adjusted EBITDA, adjusted EBITDA margin, adjusted EBIT, adjusted net income, free cash flow, gross debt and net debt. These non-GAAP measures should be considered in addition to, but not as a substitute for, the information prepared in accordance with IFRS. Non-GAAP financial performance measures are not subject to IFRS or any other generally accepted accounting principles. Other companies may define these terms in different ways.
2
GROUP STRATEGY COST AnD PORTfOLIO TRAnSfORMATIOn LEAD In bUSInESS SUPERIOR PRODUCTIOn MODEL EUROPE GERMAnY T-MObILE USA fInAnCE
EUROPE & TECHnOLOGY
Claudia Nemat, Board member for Europe and Technology
GROUP STRATEGY COST AnD PORTfOLIO TRAnSfORMATIOn LEAD In bUSInESS SUPERIOR PRODUCTIOn MODEL EUROPE GERMAnY T-MObILE USA fInAnCE
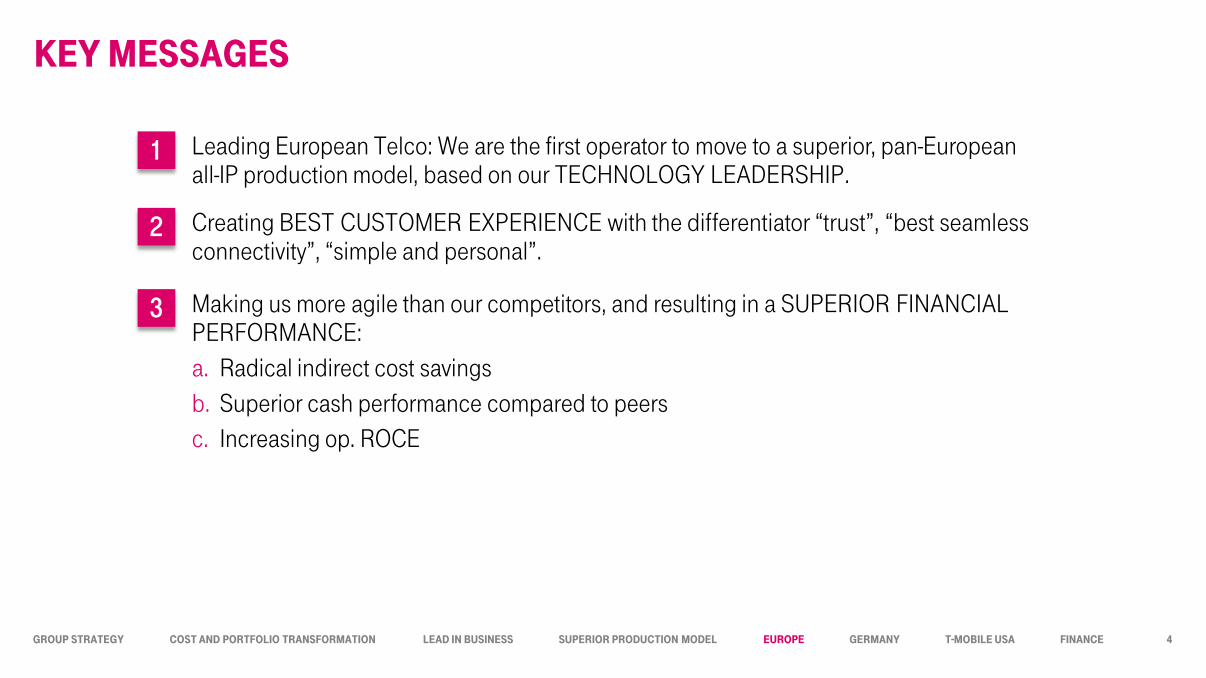
KEY MESSAGES
1 Leading European Telco: We are the first operator to move to a superior, pan-European all-IP production model, based on our Technology leadership.
2 Creating BesT cusTomer experience with the differentiator “trust”, “best seamless connectivity”, “simple and personal”.
3 Making us more agile than our competitors, and resulting in a superior Financial perFormance: a. Radical indirect cost savings b. Superior cash performance compared to peers c. Increasing op. ROCE
4
GROUP STRATEGY COST AnD PORTfOLIO TRAnSfORMATIOn LEAD In bUSInESS SUPERIOR PRODUCTIOn MODEL EUROPE GERMAnY T-MObILE USA fInAnCE
REvIEw 2013–2014
5
GROUP STRATEGY COST AnD PORTfOLIO TRAnSfORMATIOn LEAD In bUSInESS SUPERIOR PRODUCTIOn MODEL EUROPE GERMAnY T-MObILE USA fInAnCE
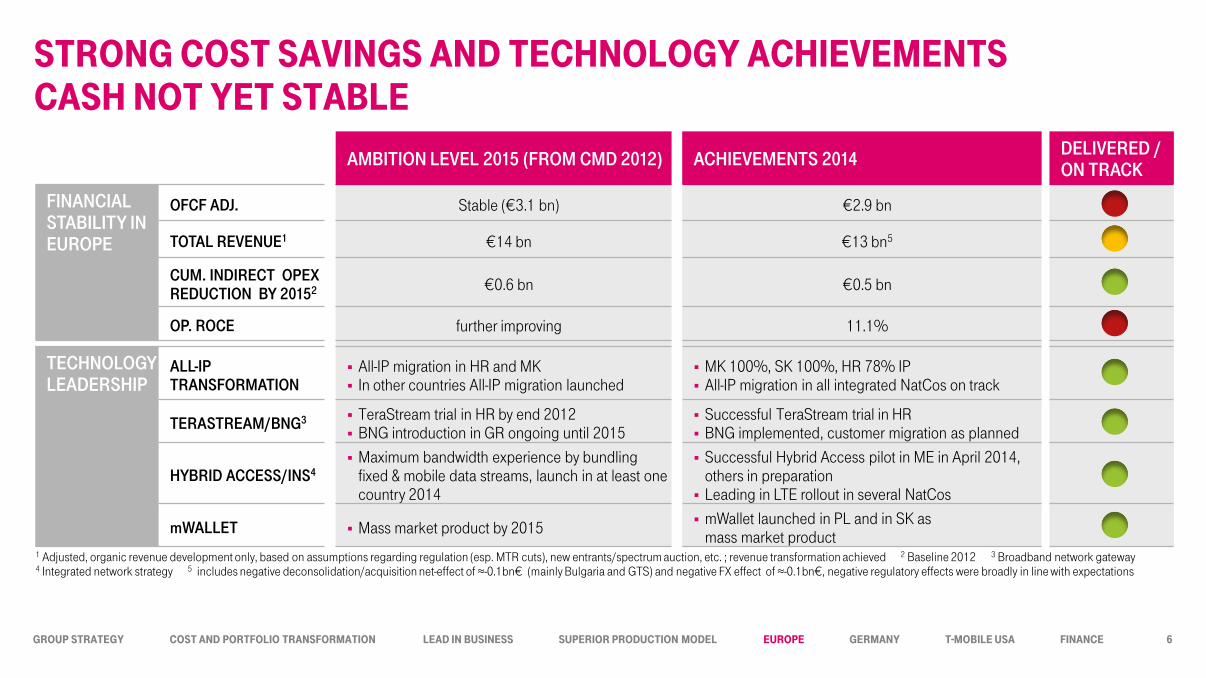
STROnG COST SAvInGS AnD TECHnOLOGY ACHIEvEMEnTS CASH nOT YET STAbLE
AMBITION LEVEL 2015 (FROM CMD 2012) ACHIEVEMENTS 2014 DELIVERED / ON TRACK
FINANCIAL STABILITY IN EUROPE
OFCF ADJ. Stable (€3.1 bn) €2.9 bn
TOTAL REVENUE1 €14 bn €13 bn5
CUM. INDIRECT OPEX REDUCTION BY 20152 €0.6 bn €0.5 bn
OP. ROCE further improving 11.1%
TECHNOLOGY LEADERSHIP
ALL-IP TRANSFORMATION
All-IP migration in HR and MK In other countries All-IP migration launched
MK 100%, SK 100%, HR 78% IP All-IP migration in all integrated NatCos on track
TERASTREAM/BNG3 TeraStream trial in HR by end 2012 BNG introduction in GR ongoing until 2015
Successful TeraStream trial in HR BNG implemented, customer migration as planned
HYBRID ACCESS/INS4 Maximum bandwidth experience by bundling
fixed & mobile data streams, launch in at least one country 2014
Successful Hybrid Access pilot in ME in April 2014, others in preparation Leading in LTE rollout in several NatCos
mWALLET Mass market product by 2015 mWallet launched in PL and in SK as mass market product
6
1 Adjusted, organic revenue development only, based on assumptions regarding regulation (esp. MTR cuts), new entrants/spectrum auction, etc. ; revenue transformation achieved 2 Baseline 2012 3 Broadband network gateway 4 Integrated network strategy 5 includes negative deconsolidation/acquisition net-effect of ≈-0.1bn€ (mainly Bulgaria and GTS) and negative FX effect of ≈-0.1bn€, negative regulatory effects were broadly in line with expectations
GROUP STRATEGY COST AnD PORTfOLIO TRAnSfORMATIOn LEAD In bUSInESS SUPERIOR PRODUCTIOn MODEL EUROPE GERMAnY T-MObILE USA fInAnCE
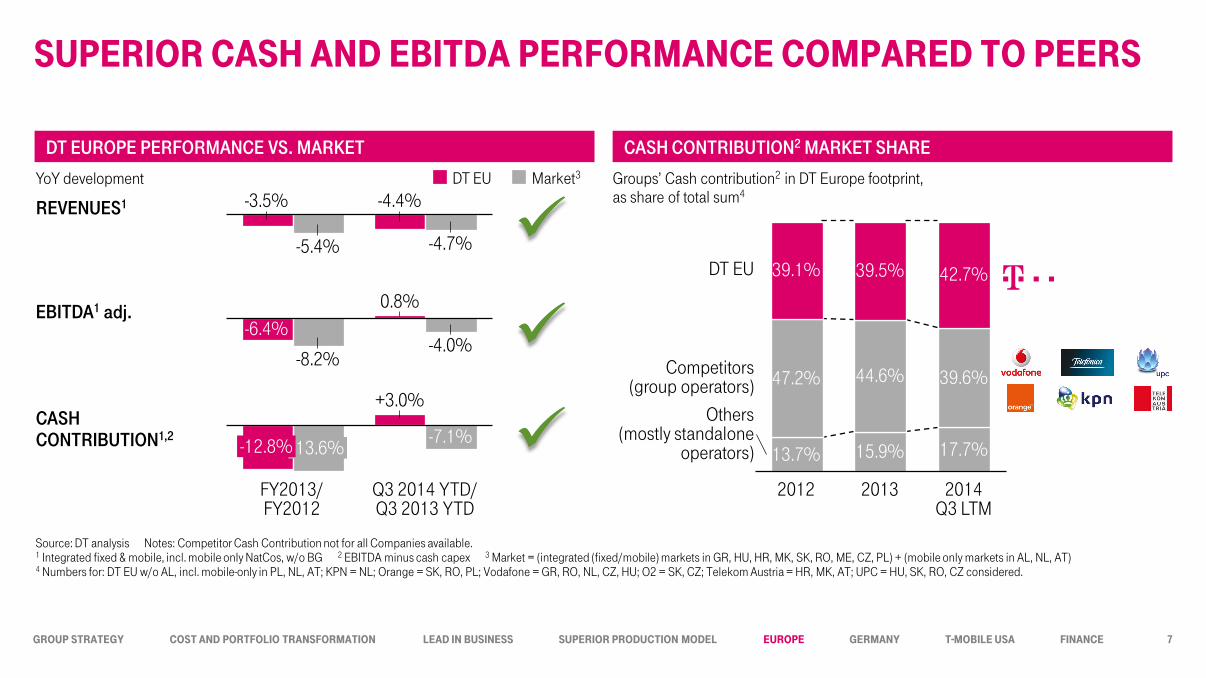
SUPERIOR CASH AnD EbITDA PERfORMAnCE COMPARED TO PEERS
REVENUES1
-4.7% -5.4%
-3.5% -4.4%
EBITDA1 adj.
CASH CONTRIBUTION1,2
DT EU Market3
-6.4% -4.0%
-8.2%
0.8%
Q3 2014 YTD/ Q3 2013 YTD
-13.6% -12.8% -7.1%
+3.0%
FY2013/ FY2012
42.7%
39.6%
17.7%
DT EU
Competitors (group operators)
13.7%
39.1% 39.5%
47.2%
2013
15.9%
44.6%
2012
Others (mostly standalone
operators)
2014 Q3 LTM
Source: DT analysis Notes: Competitor Cash Contribution not for all Companies available. 1 Integrated fixed & mobile, incl. mobile only NatCos, w/o BG 2 EBITDA minus cash capex 3 Market = (integrated (fixed/mobile) markets in GR, HU, HR, MK, SK, RO, ME, CZ, PL) + (mobile only markets in AL, NL, AT) 4 Numbers for: DT EU w/o AL, incl. mobile-only in PL, NL, AT; KPN = NL; Orange = SK, RO, PL; Vodafone = GR, RO, NL, CZ, HU; O2 = SK, CZ; Telekom Austria = HR, MK, AT; UPC = HU, SK, RO, CZ considered.
DT EUROPE PERFORMANCE VS. MARKET CASH CONTRIBUTION2 MARKET SHARE
YoY development Groups’ Cash contribution2 in DT Europe footprint, as share of total sum4
7

GROUP STRATEGY COST AnD PORTfOLIO TRAnSfORMATIOn LEAD In bUSInESS SUPERIOR PRODUCTIOn MODEL EUROPE GERMAnY T-MObILE USA fInAnCE
MARKET TREnDS
8
GROUP STRATEGY COST AnD PORTfOLIO TRAnSfORMATIOn LEAD In bUSInESS SUPERIOR PRODUCTIOn MODEL EUROPE GERMAnY T-MObILE USA fInAnCE
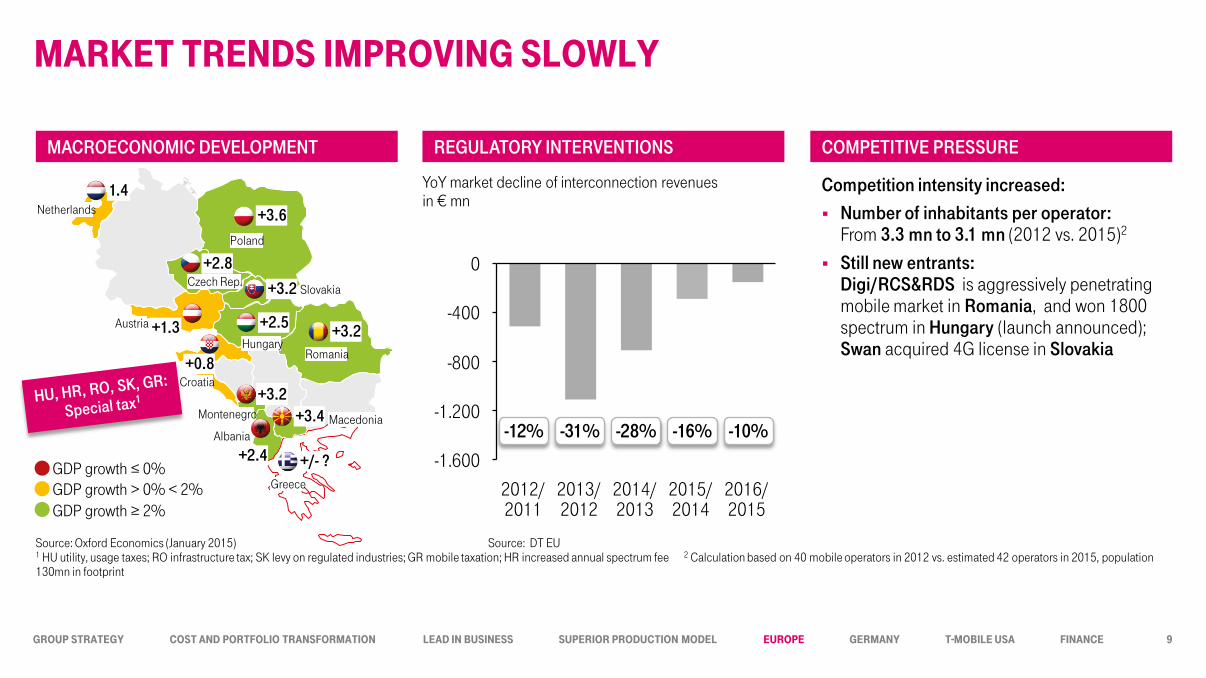
MARKET TREnDS IMPROvInG SLOwLY
-1.600
-800
-1.200
-400
0
2015/ 2014
2016/ 2015
2014/ 2013
2013/ 2012
2012/ 2011
-12% -31% -28% -16% -10%
MACROECONOMIC DEVELOPMENT REGULATORY INTERVENTIONS COMPETITIVE PRESSURE
YoY market decline of interconnection revenues in € mn
Competition intensity increased: Number of inhabitants per operator:
From 3.3 mn to 3.1 mn (2012 vs. 2015)2
Still new entrants: Digi/RCS&RDS is aggressively penetrating mobile market in Romania, and won 1800 spectrum in Hungary (launch announced); Swan acquired 4G license in Slovakia
Source: Oxford Economics (January 2015) Source: DT EU 1 HU utility, usage taxes; RO infrastructure tax; SK levy on regulated industries; GR mobile taxation; HR increased annual spectrum fee 2 Calculation based on 40 mobile operators in 2012 vs. estimated 42 operators in 2015, population 130mn in footprint
GDP growth ≤ 0% GDP growth > 0% < 2% GDP growth ≥ 2%
+2.5
+0.8
+3.4
+2.8
+3.6
+3.2
+3.2
+2.4
1.4
+1.3
+3.2
+/- ? Greece
Croatia
Romania
Macedonia Albania
Poland
Czech Rep.
Austria
Hungary
Slovakia
Netherlands
Montenegro
9
GROUP STRATEGY COST AnD PORTfOLIO TRAnSfORMATIOn LEAD In bUSInESS SUPERIOR PRODUCTIOn MODEL EUROPE GERMAnY T-MObILE USA fInAnCE
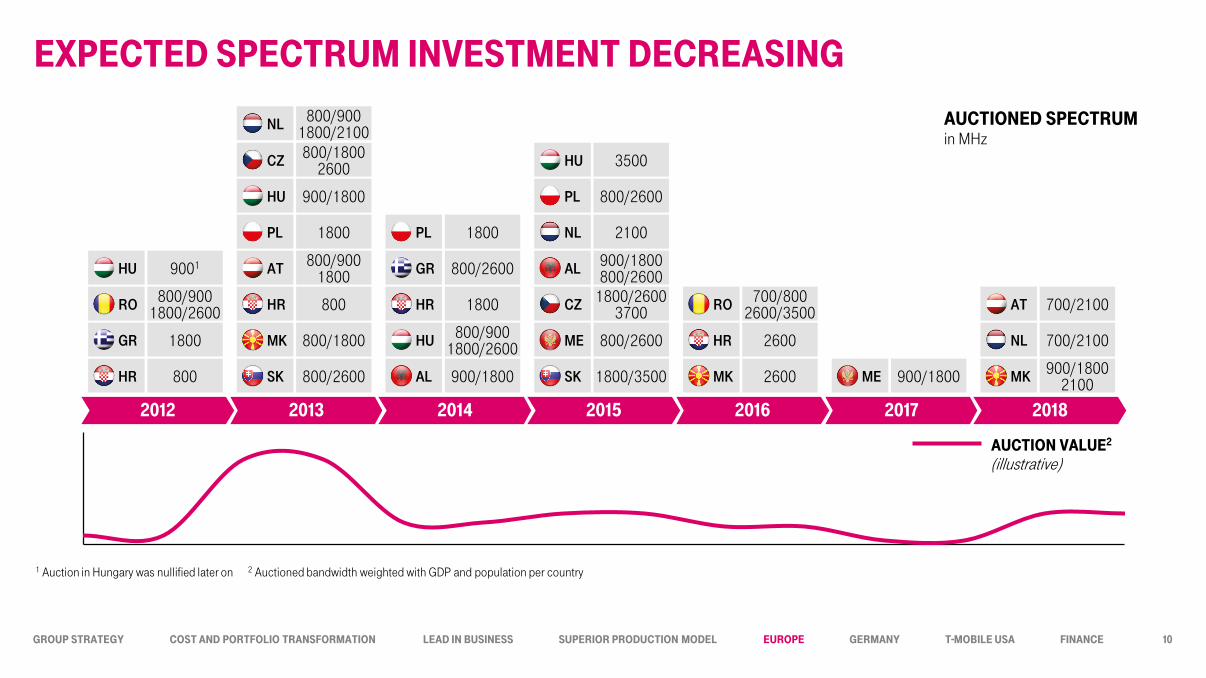
ExPECTED SPECTRUM InvESTMEnT DECREASInG
AUCTIOnED SPECTRUM in MHz
2015 2016 2017 2018 2014 2013 2012
AUCTIOn vALUE2
(illustrative)
1800/3500 2600 900/1800 900/1800 2100 900/1800 800/2600 SK MK ME MK AL SK
2100 1800 NL PL
800/2600 900/1800 PL HU
900/1800 800/2600
800/900 1800 AL AT
800/1800 2600 CZ 3500 HU
800/2600 2600 800/900 1800/2600 800/1800 ME HR HU MK 700/2100 NL
1800/2600 3700
700/800 2600/3500 800 CZ RO HR 700/2100 AT
1800 PL
800/2600 GR
800/900 1800/2600 RO
9001 HU
1800 GR
800 HR
1800 HR
800/900 1800/2100 NL
1 Auction in Hungary was nullified later on 2 Auctioned bandwidth weighted with GDP and population per country
10

GROUP STRATEGY COST AnD PORTfOLIO TRAnSfORMATIOn LEAD In bUSInESS SUPERIOR PRODUCTIOn MODEL EUROPE GERMAnY T-MObILE USA fInAnCE
STRATEGY 2015–2018
11
GROUP STRATEGY COST AnD PORTfOLIO TRAnSfORMATIOn LEAD In bUSInESS SUPERIOR PRODUCTIOn MODEL EUROPE GERMAnY T-MObILE USA fInAnCE
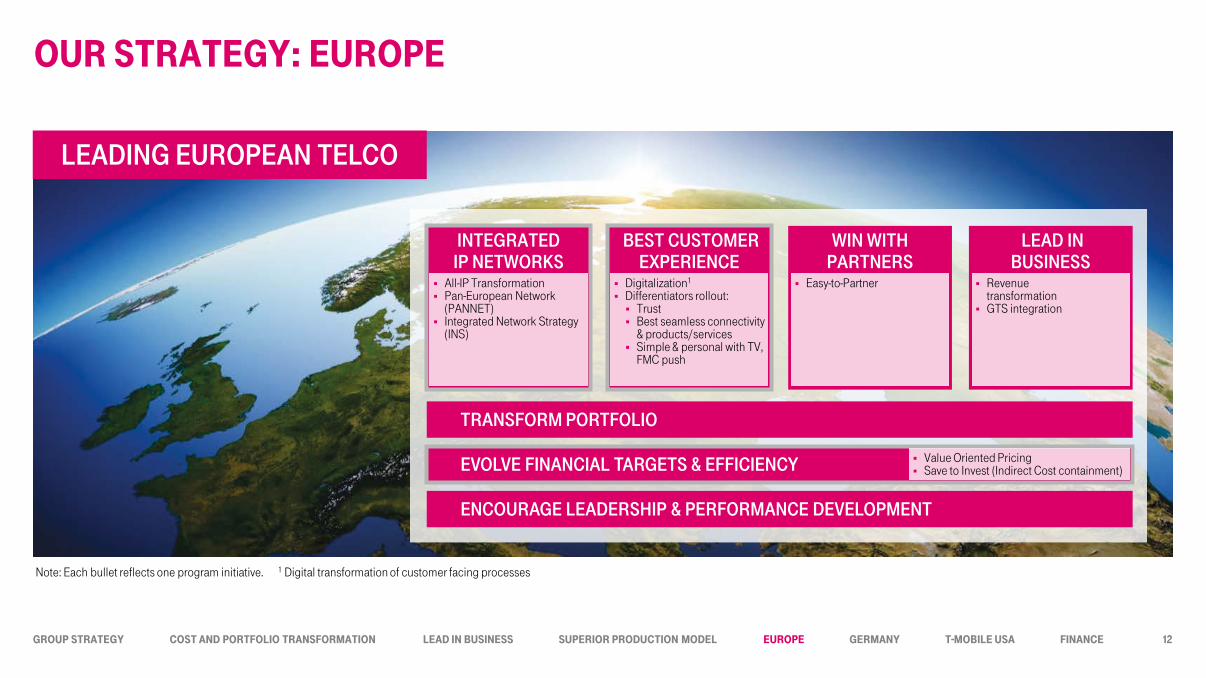
OUR STRATEGY: EUROPE
Note: Each bullet reflects one program initiative. 1 Digital transformation of customer facing processes
12
LEADING EUROPEAN TELCO
INTEGRATED IP NETWORKS
WIN WITH PARTNERS
BEST CUSTOMER EXPERIENCE
LEAD IN BUSINESS
TRANSFORM PORTFOLIO
EVOLVE FINANCIAL TARGETS & EFFICIENCY
ENCOURAGE LEADERSHIP & PERFORMANCE DEVELOPMENT
Easy-to-Partner Revenue transformation
GTS integration
All-IP Transformation Pan-European Network
(PANNET) Integrated Network Strategy
(INS)
Digitalization1
Differentiators rollout: Trust Best seamless connectivity
& products/services Simple & personal with TV,
FMC push
Value Oriented Pricing Save to Invest (Indirect Cost containment)
GROUP STRATEGY COST AnD PORTfOLIO TRAnSfORMATIOn LEAD In bUSInESS SUPERIOR PRODUCTIOn MODEL EUROPE GERMAnY T-MObILE USA fInAnCE
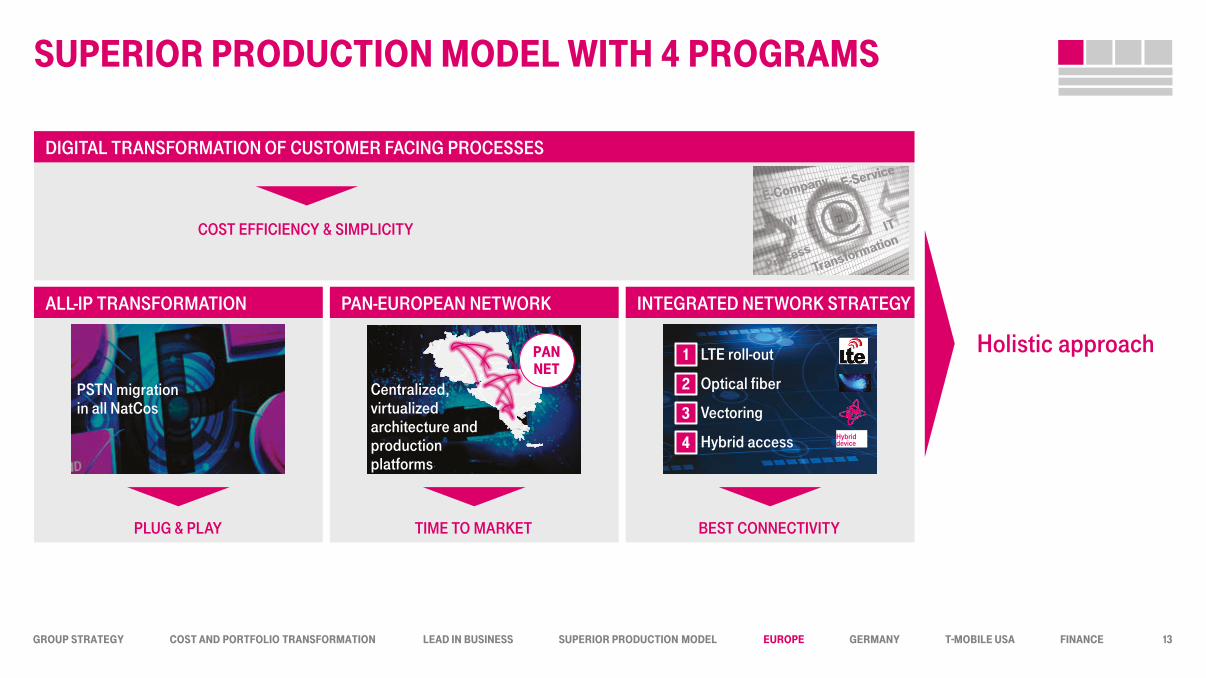
SUPERIOR PRODUCTIOn MODEL wITH 4 PROGRAMS
PSTN migration in all NatCos PSTn
MIGRATIOn
Centralized, virtualized architecture and production platforms
PAn nET
BEST CONNECTIVITY TIME TO MARKET PLUG & PLAY
COST EFFICIENCY & SIMPLICITY
DIGITAL TRANSFORMATION OF CUSTOMER FACING PROCESSES
ALL-IP TRANSFORMATION PAN-EUROPEAN NETWORK INTEGRATED NETWORK STRATEGY
Vectoring
LTE roll-out
Optical fiber
Hybrid access
2
3
4
1
Holistic approach
13
Hybrid device
GROUP STRATEGY COST AnD PORTfOLIO TRAnSfORMATIOn LEAD In bUSInESS SUPERIOR PRODUCTIOn MODEL EUROPE GERMAnY T-MObILE USA fInAnCE
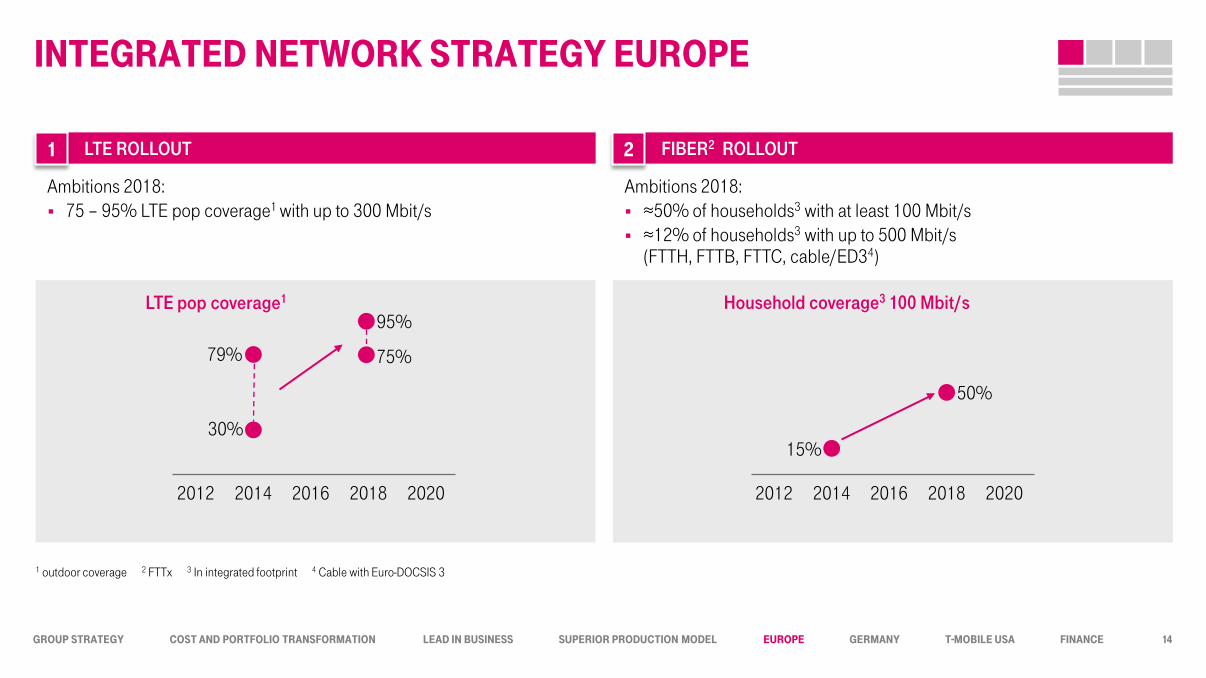
LTE ROLLOUT FIBER2 ROLLOUT
InTEGRATED nETwORK STRATEGY EUROPE
1
Ambitions 2018: 75 – 95% LTE pop coverage1 with up to 300 Mbit/s
2
Ambitions 2018: ≈50% of households3 with at least 100 Mbit/s ≈12% of households3 with up to 500 Mbit/s
(FTTH, FTTB, FTTC, cable/ED34)
LTE pop coverage1
2012 2014 2016 2018 2020
95%
75%
30%
79%
Household coverage3 100 Mbit/s
2012 2014 2016 2018 2020
50%
15%
1 outdoor coverage 2 FTTx 3 In integrated footprint 4 Cable with Euro-DOCSIS 3
14
GROUP STRATEGY COST AnD PORTfOLIO TRAnSfORMATIOn LEAD In bUSInESS SUPERIOR PRODUCTIOn MODEL EUROPE GERMAnY T-MObILE USA fInAnCE
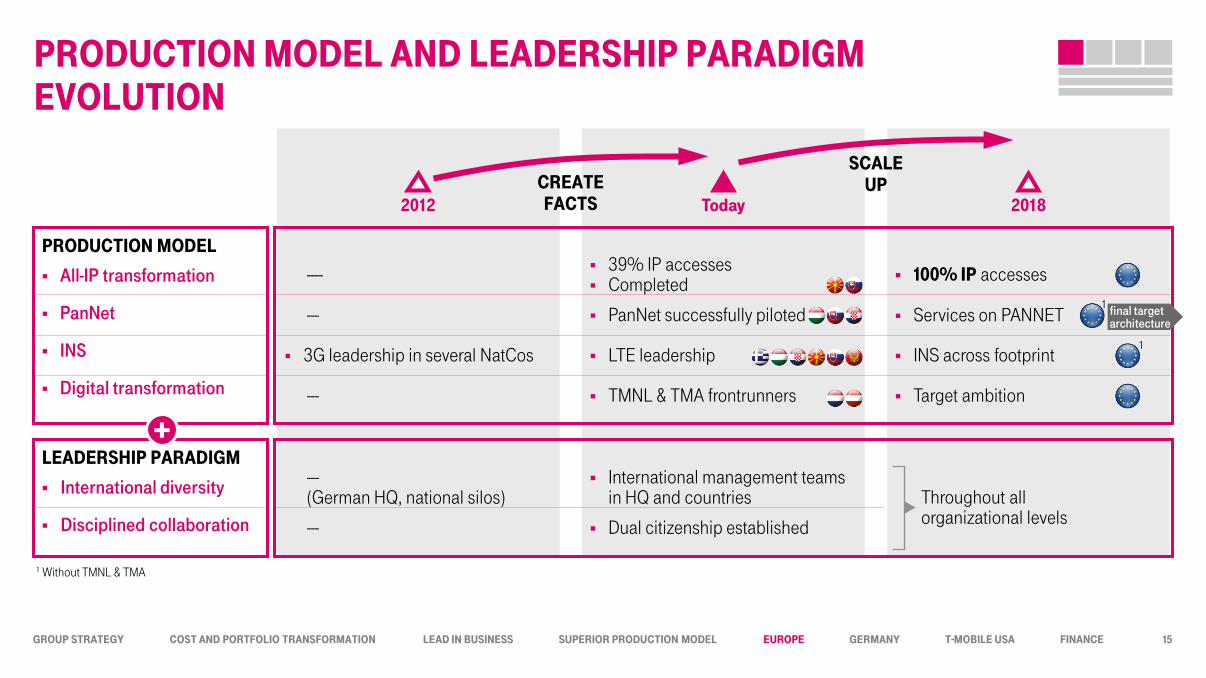
PRODUCTIOn MODEL AnD LEADERSHIP PARADIGM EvOLUTIOn
2012 Today 2018 CREATE fACTS
SCALE UP
PRODUCTIOn MODEL
All-IP transformation
PanNet
INS
Digital transformation
LEADERSHIP PARADIGM
International diversity
Disciplined collaboration
3G leadership in several NatCos
----
---
---
LTE leadership
39% IP accesses Completed
PanNet successfully piloted
TMNL & TMA frontrunners
INS across footprint
100% IP accesses
Services on PANNET
Target ambition
---
--- (German HQ, national silos)
Dual citizenship established
International management teams in HQ and countries Throughout all
organizational levels
final target architecture
1 Without TMNL & TMA
1
1
15
GROUP STRATEGY COST AnD PORTfOLIO TRAnSfORMATIOn LEAD In bUSInESS SUPERIOR PRODUCTIOn MODEL EUROPE GERMAnY T-MObILE USA fInAnCE
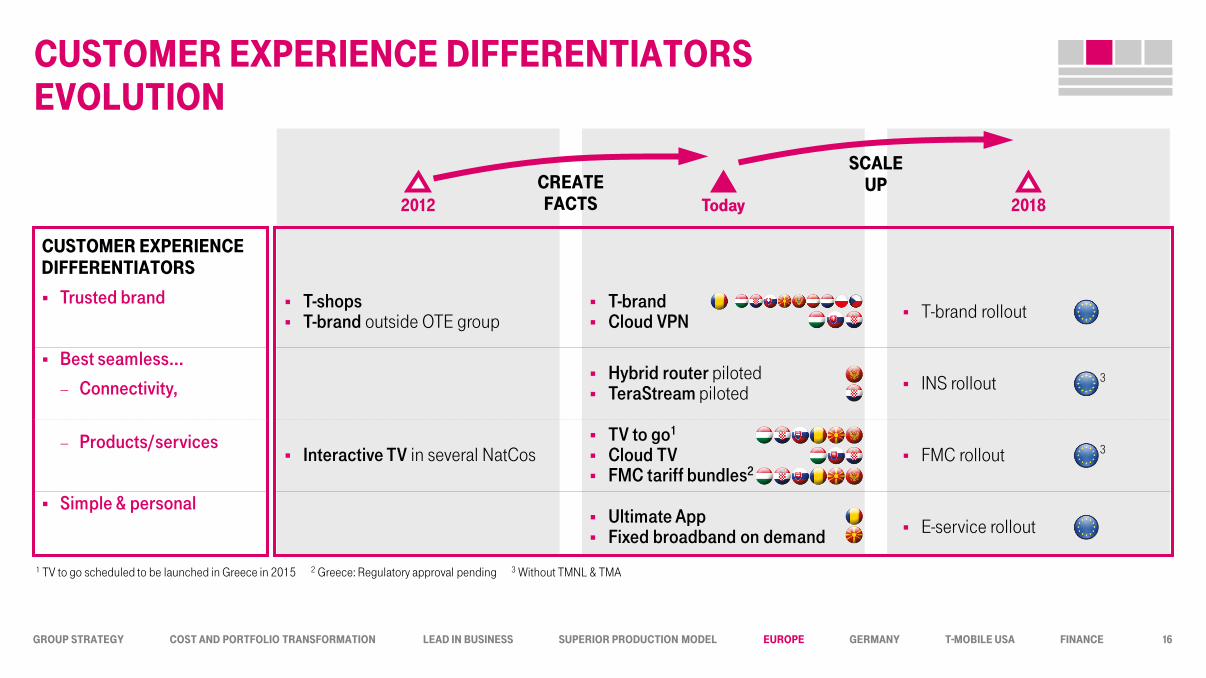
CUSTOMER ExPERIEnCE DIffEREnTIATORS
Trusted brand
Best seamless…
− Connectivity,
− Products/services
Simple & personal
CUSTOMER ExPERIEnCE DIffEREnTIATORS EvOLUTIOn
1 TV to go scheduled to be launched in Greece in 2015 2 Greece: Regulatory approval pending 3 Without TMNL & TMA
T-brand Cloud VPN T-brand rollout T-shops
T-brand outside OTE group
Ultimate App Fixed broadband on demand E-service rollout
Hybrid router piloted TeraStream piloted INS rollout 3
Interactive TV in several NatCos TV to go1
Cloud TV FMC tariff bundles2
FMC rollout 3
16
2012 Today 2018 CREATE fACTS
SCALE UP
GROUP STRATEGY COST AnD PORTfOLIO TRAnSfORMATIOn LEAD In bUSInESS SUPERIOR PRODUCTIOn MODEL EUROPE GERMAnY T-MObILE USA fInAnCE
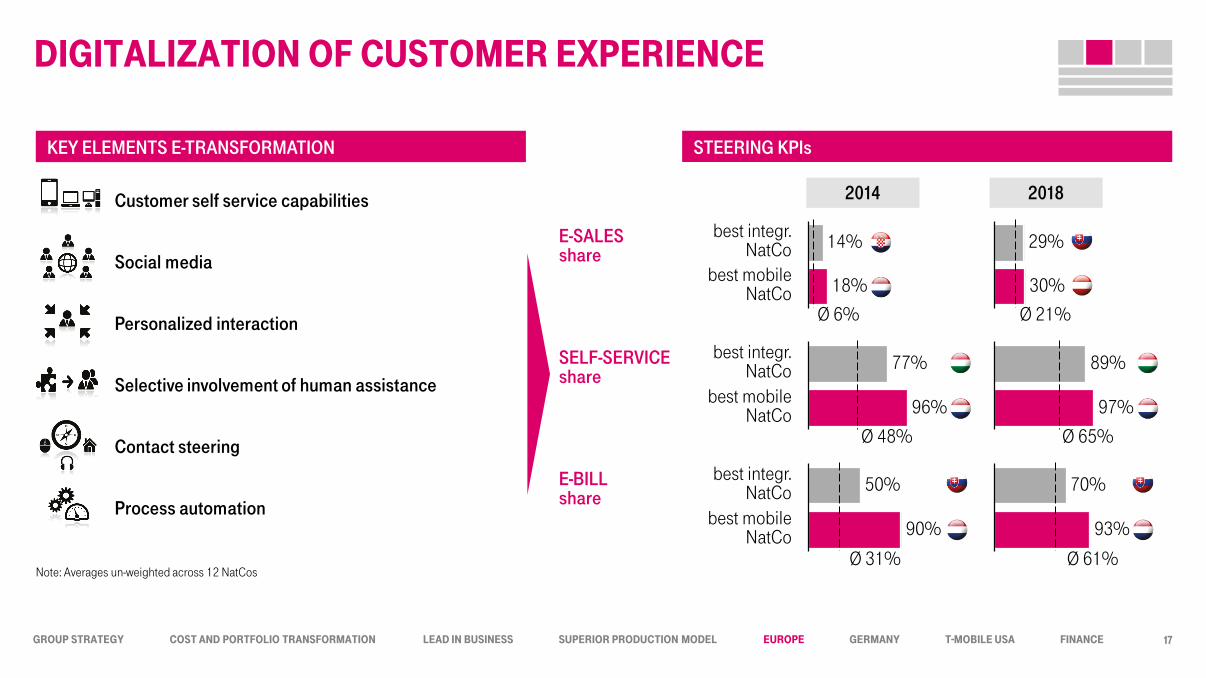
2014 2018
DIGITALIzATIOn Of CUSTOMER ExPERIEnCE
17
SELF-SERVICE share
E-SALES share
E-BILL share
18%
best integr. NatCo 14%
best mobile NatCo
best mobile NatCo 96%
best integr. NatCo 77%
best mobile NatCo 90%
best integr. NatCo 50%
30%
29%
97%
89%
70%
93%
KEY ELEMENTS E-TRANSFORMATION STEERING KPIs
Customer self service capabilities
Social media
Contact steering
Process automation
Personalized interaction
Selective involvement of human assistance
Ø 6%
Ø 48%
Ø 31%
Ø 21%
Ø 65%
Ø 61% Note: Averages un-weighted across 12 NatCos
GROUP STRATEGY COST AnD PORTfOLIO TRAnSfORMATIOn LEAD In bUSInESS SUPERIOR PRODUCTIOn MODEL EUROPE GERMAnY T-MObILE USA fInAnCE
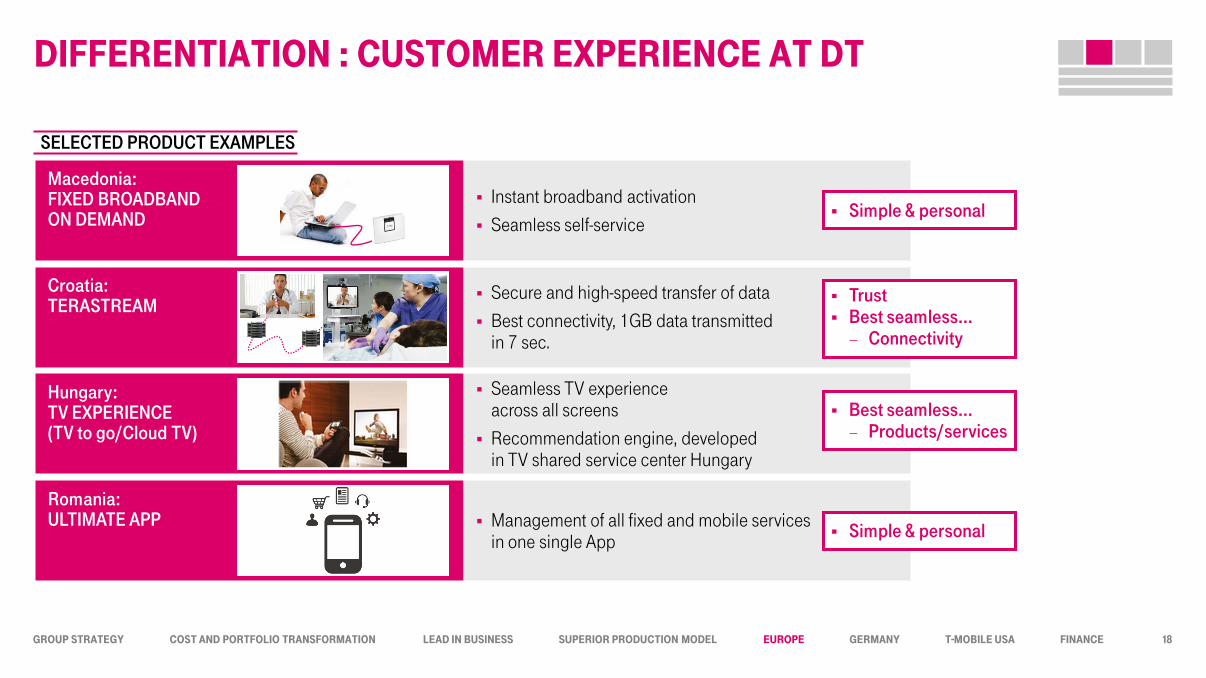
DIffEREnTIATIOn : CUSTOMER ExPERIEnCE AT DT
SELECTED PRODUCT EXAMPLES
Macedonia: FIXED BROADBAND ON DEMAND
Instant broadband activation
Seamless self-service
Romania: ULTIMATE APP Management of all fixed and mobile services
in one single App
Croatia: TERASTREAM
Secure and high-speed transfer of data
Best connectivity, 1GB data transmitted in 7 sec.
Hungary: TV EXPERIENCE (TV to go/Cloud TV)
Seamless TV experience across all screens
Recommendation engine, developed in TV shared service center Hungary
18
Simple & personal
Best seamless… − Products/services
Simple & personal
Trust Best seamless…
− Connectivity
GROUP STRATEGY COST AnD PORTfOLIO TRAnSfORMATIOn LEAD In bUSInESS SUPERIOR PRODUCTIOn MODEL EUROPE GERMAnY T-MObILE USA fInAnCE
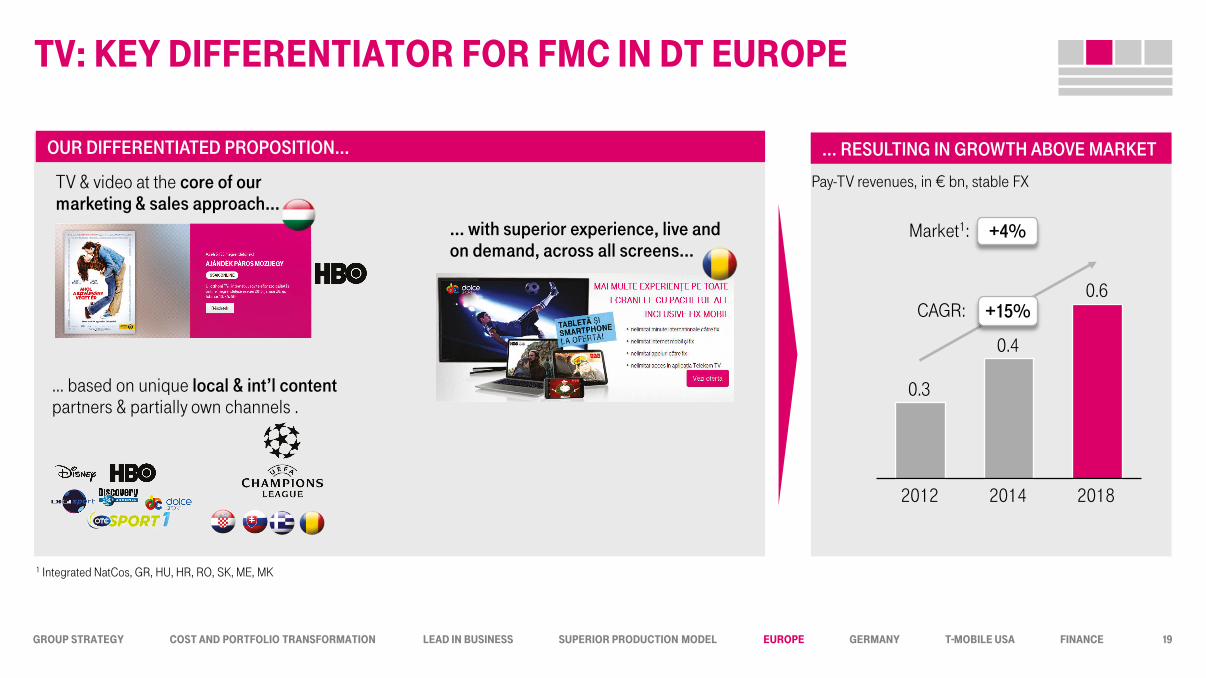
Tv: KEY DIffEREnTIATOR fOR fMC In DT EUROPE
1 Integrated NatCos, GR, HU, HR, RO, SK, ME, MK
2018
0.6
0.4
2014
+15%
2012
0.3
Pay-TV revenues, in € bn, stable FX
+4% Market1:
CAGR:
… with superior experience, live and on demand, across all screens…
… based on unique local & int’l content partners & partially own channels .
TV & video at the core of our marketing & sales approach…
OUR DIFFERENTIATED PROPOSITION… … RESULTING IN GROWTH ABOVE MARKET
19

GROUP STRATEGY COST AnD PORTfOLIO TRAnSfORMATIOn LEAD In bUSInESS SUPERIOR PRODUCTIOn MODEL EUROPE GERMAnY T-MObILE USA fInAnCE
Simple & personal
Best seamless… − Connectivity & − Products/services
Trust
EASY-2-PARTnER: EnHAnCInG CUSTOMER ExPERIEnCE
0.7
+143%
1.7
2014 YE 2013 YE
1.7
+37%
≈6.0
2018 YE 2014 YE
“EASY-TO-PARTNER” SUBSCRIBERS DEVELOPMENT1 LEADING PARTNERS TO DIFFERENTIATE CORE PRODUCTS
Subscribers on partner products, in mn
1 Only partners considered that are rolled out in at least four NatCos and with significant impact (including search fields, music, security); key local partners (e.g. SKY) not included; Evernote reported from Q2/2014 onwards
CAGR:
20
Exclusive/ innovative services
ARPU uplift potential

GROUP STRATEGY COST AnD PORTfOLIO TRAnSfORMATIOn LEAD In bUSInESS SUPERIOR PRODUCTIOn MODEL EUROPE GERMAnY T-MObILE USA fInAnCE
b2b REvEnUE TRAnSfORMATIOn
B2B REVENUE TRANSFORMATION B2B BUSINESS TRANSFORMATION & ACHIEVEMENTS
1 2013 B2B revenues: € 3.0bn; 2012 & 2013 w/o GTS, 2014 GTS incl. for 7 month, 2018 GTS incl. 12 month 2 Traditional: mobile & fixed non-data revenues 3 CAGR
B2B revenues1, in € bn
B2B organizations everywhere (2012)
New service portfolio (from 2014 onwards) Integration of GTS Cloud VPN, M2M best-coverage
Innovative partnerships (Business Wall of Fame, cooperation CISCO)
Selected deals won: Cloud based eServices for public administration (Slovakia) National Traffic Information System (Slovakia), Outsourcing of TC services for RWE (Czech Republic) Healthcare E-prescription solution & services (Greece) Smart meter pilot (Albania)
76% 67%
53%
12% 15%
21%
12% 18% 26%
Traditional & other revenues
(B2B)2
2018
B2B/ICT Mobile Data
(B2B)
3.2
2014
3.0 3.2
2012
+19%3
+6%3 +12%3
+12%3
21
GROUP STRATEGY COST AnD PORTfOLIO TRAnSfORMATIOn LEAD In bUSInESS SUPERIOR PRODUCTIOn MODEL EUROPE GERMAnY T-MObILE USA fInAnCE
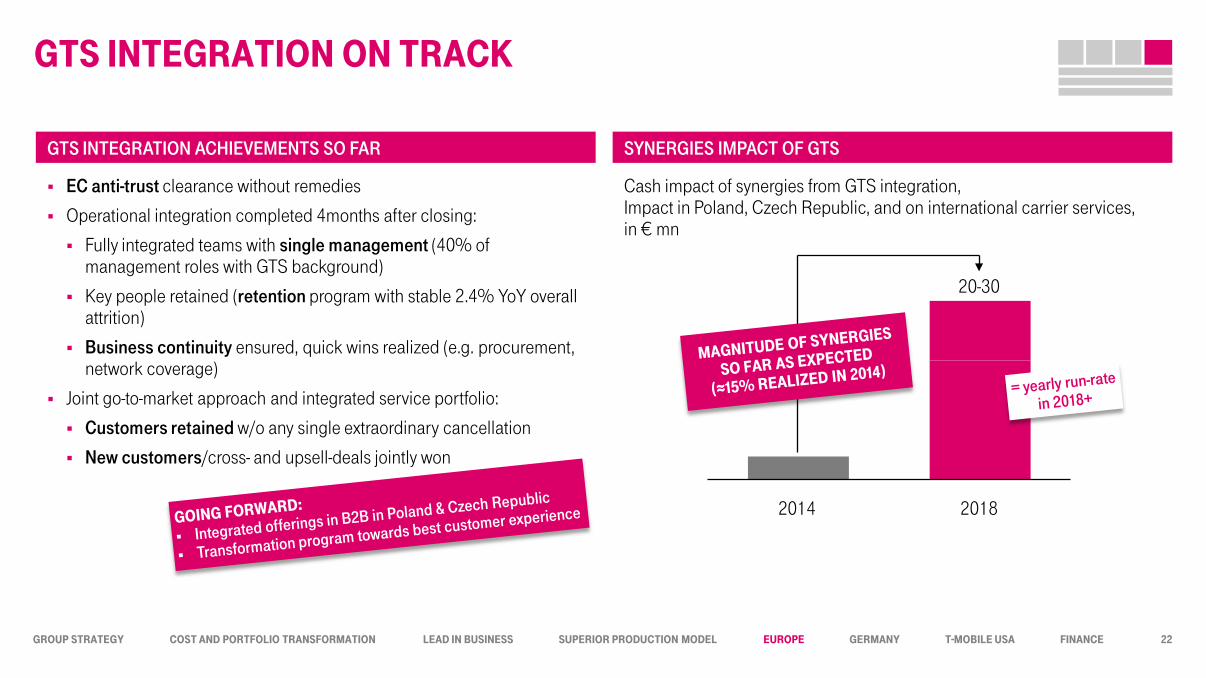
GTS InTEGRATIOn On TRACK
2018
20-30
2014
22
GTS INTEGRATION ACHIEVEMENTS SO FAR SYNERGIES IMPACT OF GTS
EC anti-trust clearance without remedies
Operational integration completed 4months after closing:
Fully integrated teams with single management (40% of management roles with GTS background)
Key people retained (retention program with stable 2.4% YoY overall attrition)
Business continuity ensured, quick wins realized (e.g. procurement, network coverage)
Joint go-to-market approach and integrated service portfolio:
Customers retained w/o any single extraordinary cancellation
New customers/cross- and upsell-deals jointly won
Cash impact of synergies from GTS integration, Impact in Poland, Czech Republic, and on international carrier services, in € mn

GROUP STRATEGY COST AnD PORTfOLIO TRAnSfORMATIOn LEAD In bUSInESS SUPERIOR PRODUCTIOn MODEL EUROPE GERMAnY T-MObILE USA fInAnCE
SPECIAL TOPICS
23
GROUP STRATEGY COST AnD PORTfOLIO TRAnSfORMATIOn LEAD In bUSInESS SUPERIOR PRODUCTIOn MODEL EUROPE GERMAnY T-MObILE USA fInAnCE
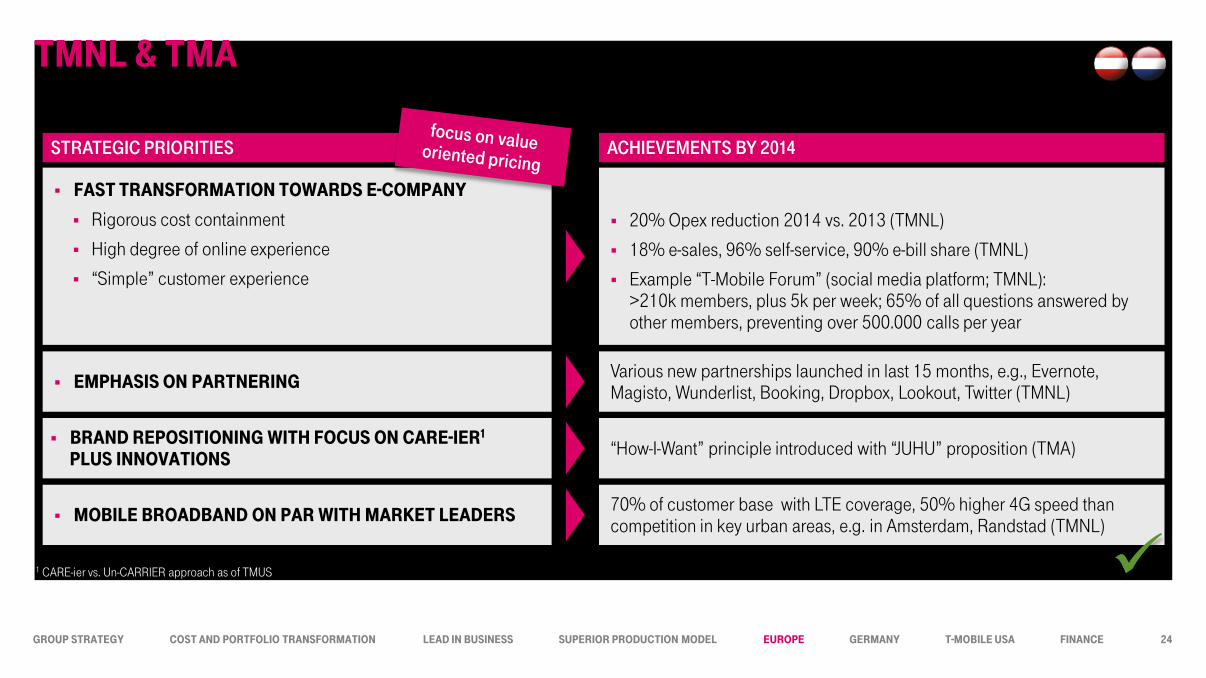
TMnL & TMA
fAST TRAnSfORMATIOn TOwARDS E-COMPAnY
Rigorous cost containment
High degree of online experience
“Simple” customer experience
1 CARE-ier vs. Un-CARRIER approach as of TMUS
20% Opex reduction 2014 vs. 2013 (TMNL)
18% e-sales, 96% self-service, 90% e-bill share (TMNL)
Example “T-Mobile Forum” (social media platform; TMNL): >210k members, plus 5k per week; 65% of all questions answered by other members, preventing over 500.000 calls per year
STRATEGIC PRIORITIES ACHIEVEMENTS BY 2014
bRAnD REPOSITIOnInG wITH fOCUS On CARE-IER1
PLUS InnOvATIOnS
EMPHASIS On PARTnERInG
MObILE bROADbAnD On PAR wITH MARKET LEADERS
“How-I-Want” principle introduced with “JUHU” proposition (TMA)
70% of customer base with LTE coverage, 50% higher 4G speed than competition in key urban areas, e.g. in Amsterdam, Randstad (TMNL)
Various new partnerships launched in last 15 months, e.g., Evernote, Magisto, Wunderlist, Booking, Dropbox, Lookout, Twitter (TMNL)
24

GROUP STRATEGY COST AnD PORTfOLIO TRAnSfORMATIOn LEAD In bUSInESS SUPERIOR PRODUCTIOn MODEL EUROPE GERMAnY T-MObILE USA fInAnCE
STRICT RULES On wHOLESALE DEALS
MVNO business is done CASE-bY-CASE & COUnTRY-bY-COUnTRY; a CEnTRAL DECISIOn TEAM ensures consistency
We design wholesale contracts that make our RETAIL DIffEREnTIATIOn possible and ensure that OUR DEALS DO nOT HAvE A nEGATIvE EffECT On MARKET vALUE
Unit based-pricing, no flat rates
Monetize network quality
Distinguish between ExISTInG MvnOS & nEw EnTRAnTS
We act within REGULATORY bOUnDARIES that determine some MVNO markets
Deal EBITDA contribut.
+3-5%
EBITDA with deal
Saved market invest
Contribution lost customers
EBITDA w/o deal
illustrative 1
1 Impact illustration based on real case assessment of one of our NatCos, 1st year view
Reach additional customers, by targeting segments with minimum overlap
Leverage partners’ assets, e.g. brand, sales channel Share the burden of network build-out
Plus: Upsides of further deals with partner
EU WHOLESALE/MVNO APPROACH: EBITDA IMPACT OF WHOLESALE/MVNO DEAL
25

GROUP STRATEGY COST AnD PORTfOLIO TRAnSfORMATIOn LEAD In bUSInESS SUPERIOR PRODUCTIOn MODEL EUROPE GERMAnY T-MObILE USA fInAnCE
fInAnCIAL OUTLOOK
26
GROUP STRATEGY COST AnD PORTfOLIO TRAnSfORMATIOn LEAD In bUSInESS SUPERIOR PRODUCTIOn MODEL EUROPE GERMAnY T-MObILE USA fInAnCE
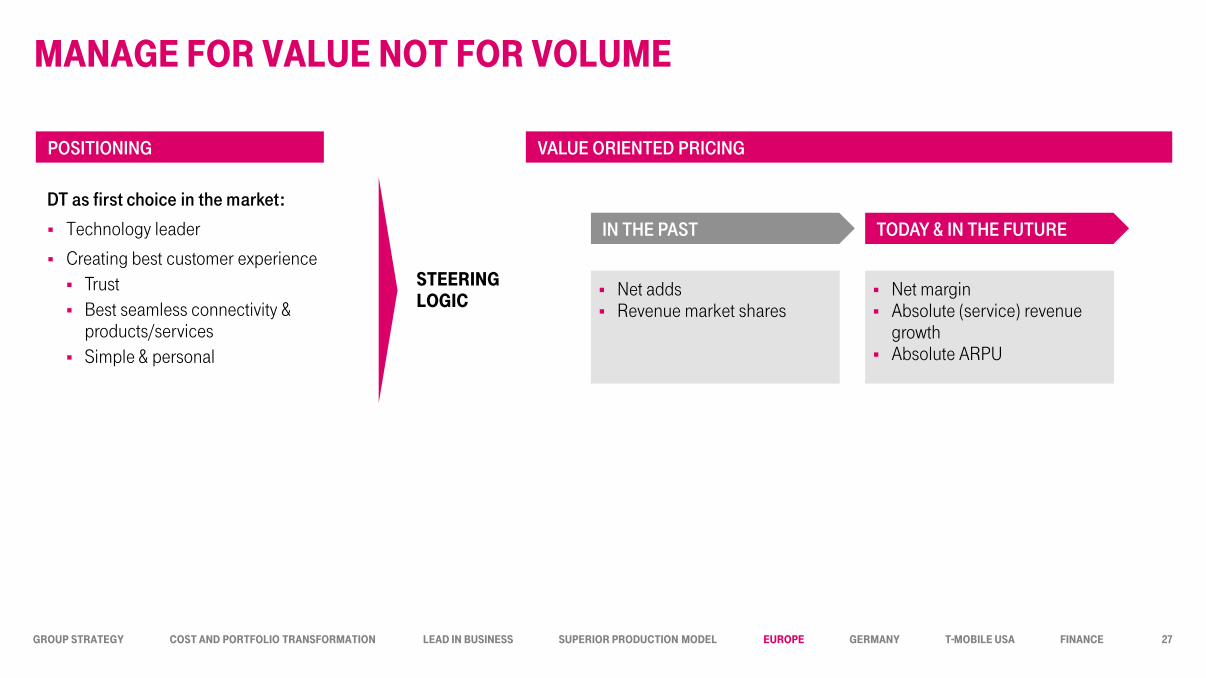
MAnAGE fOR vALUE nOT fOR vOLUME
STEERInG LOGIC
Net adds Revenue market shares
Net margin Absolute (service) revenue
growth Absolute ARPU
IN THE PAST TODAY & IN THE FUTURE
VALUE ORIENTED PRICING
DT as first choice in the market:
Technology leader
Creating best customer experience Trust Best seamless connectivity &
products/services Simple & personal
POSITIONING
27
GROUP STRATEGY COST AnD PORTfOLIO TRAnSfORMATIOn LEAD In bUSInESS SUPERIOR PRODUCTIOn MODEL EUROPE GERMAnY T-MObILE USA fInAnCE
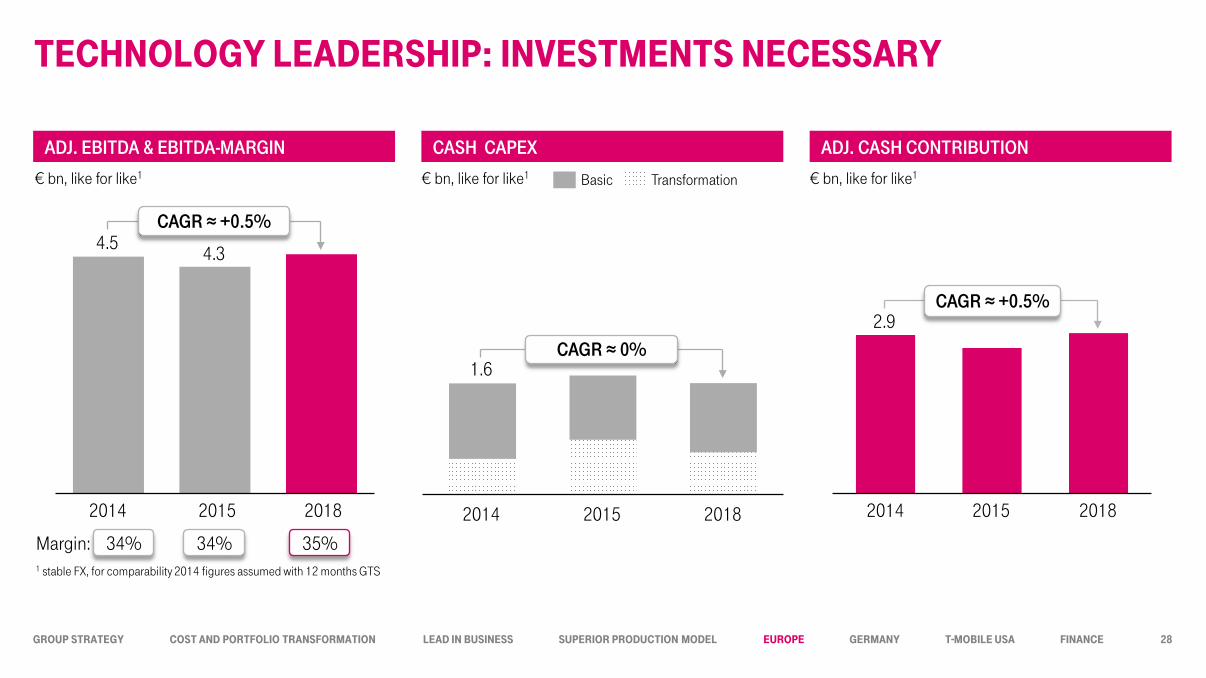
TECHnOLOGY LEADERSHIP: InvESTMEnTS nECESSARY
CAGR ≈ +0.5%
2018 2015
4.3
2014
4.5
34% 35% Margin:
2018 2014
CAGR ≈ +0.5%
2015
2.9
34%
ADJ. EBITDA & EBITDA-MARGIN CASH CAPEX ADJ. CASH CONTRIBUTION
€ bn, like for like1 € bn, like for like1 € bn, like for like1
2015 2014 2018
1.6
Transformation Basic
28
CAGR ≈ 0%
1 stable FX, for comparability 2014 figures assumed with 12 months GTS
GROUP STRATEGY COST AnD PORTfOLIO TRAnSfORMATIOn LEAD In bUSInESS SUPERIOR PRODUCTIOn MODEL EUROPE GERMAnY T-MObILE USA fInAnCE
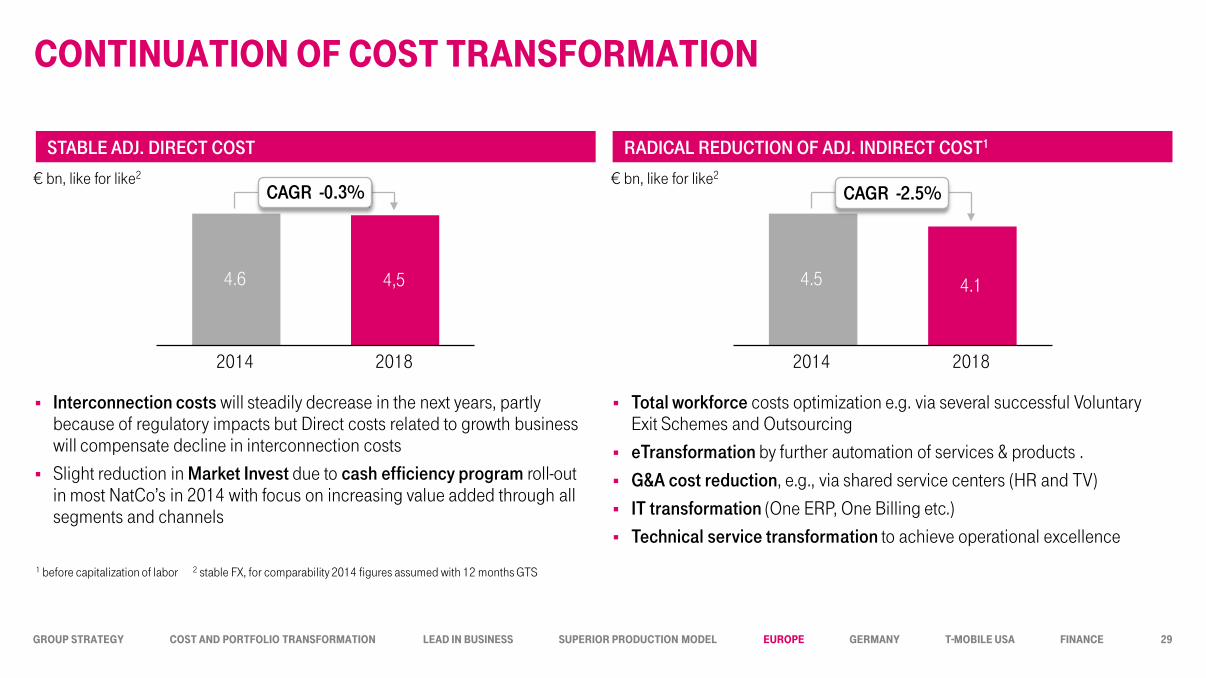
COnTInUATIOn Of COST TRAnSfORMATIOn
4.5
CAGR -2.5%
2018 2014
4.1
Total workforce costs optimization e.g. via several successful Voluntary Exit Schemes and Outsourcing
eTransformation by further automation of services & products .
G&A cost reduction, e.g., via shared service centers (HR and TV)
IT transformation (One ERP, One Billing etc.) Technical service transformation to achieve operational excellence
Interconnection costs will steadily decrease in the next years, partly because of regulatory impacts but Direct costs related to growth business will compensate decline in interconnection costs
Slight reduction in Market Invest due to cash efficiency program roll-out in most NatCo’s in 2014 with focus on increasing value added through all segments and channels
CAGR -0.3%
2014 2018
4.6 4,5
STABLE ADJ. DIRECT COST
€ bn, like for like2
RADICAL REDUCTION OF ADJ. INDIRECT COST1
€ bn, like for like2
1 before capitalization of labor 2 stable FX, for comparability 2014 figures assumed with 12 months GTS
29
GROUP STRATEGY COST AnD PORTfOLIO TRAnSfORMATIOn LEAD In bUSInESS SUPERIOR PRODUCTIOn MODEL EUROPE GERMAnY T-MObILE USA fInAnCE
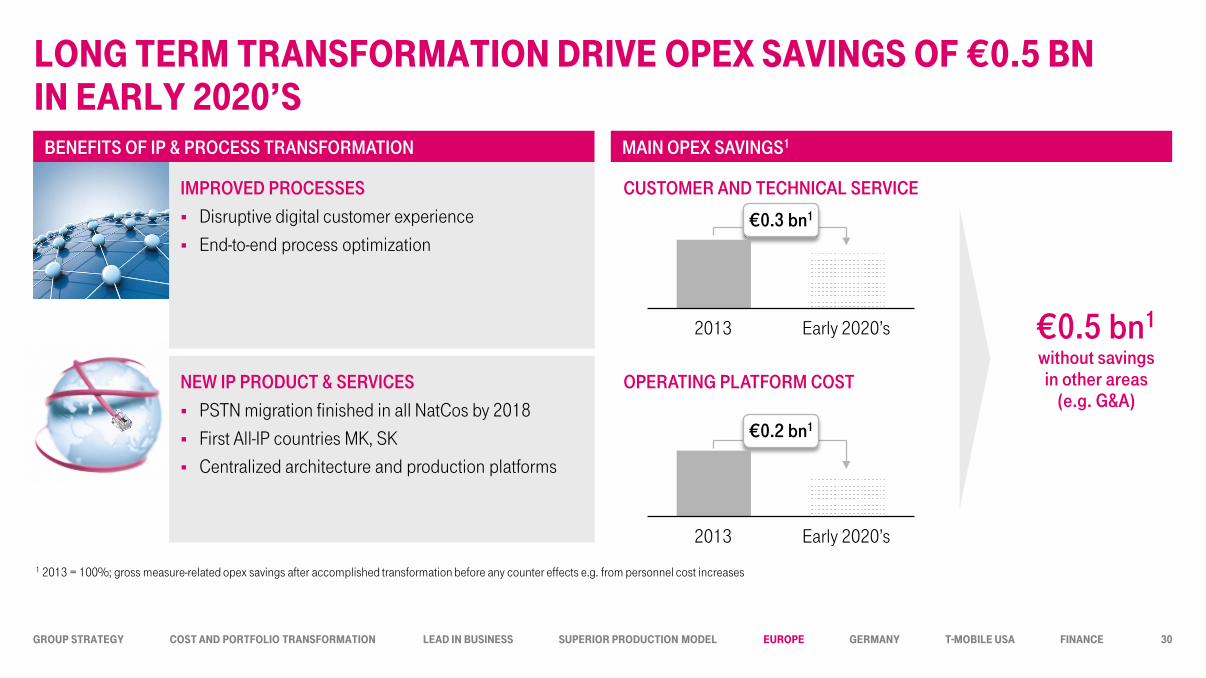
LOnG TERM TRAnSfORMATIOn DRIvE OPEx SAvInGS Of €0.5 bn In EARLY 2020’S
Early 2020’s 2013
Early 2020’s 2013
NEW IP PRODUCT & SERVICES PSTN migration finished in all NatCos by 2018
First All-IP countries MK, SK Centralized architecture and production platforms
IMPROVED PROCESSES Disruptive digital customer experience
End-to-end process optimization
CUSTOMER AND TECHNICAL SERVICE
OPERATING PLATFORM COST
€0.3 bn1
€0.2 bn1
€0.5 bn1 without savings in other areas
(e.g. G&A)
BENEFITS OF IP & PROCESS TRANSFORMATION MAIN OPEX SAVINGS1
1 2013 = 100%; gross measure-related opex savings after accomplished transformation before any counter effects e.g. from personnel cost increases
30
GROUP STRATEGY COST AnD PORTfOLIO TRAnSfORMATIOn LEAD In bUSInESS SUPERIOR PRODUCTIOn MODEL EUROPE GERMAnY T-MObILE USA fInAnCE
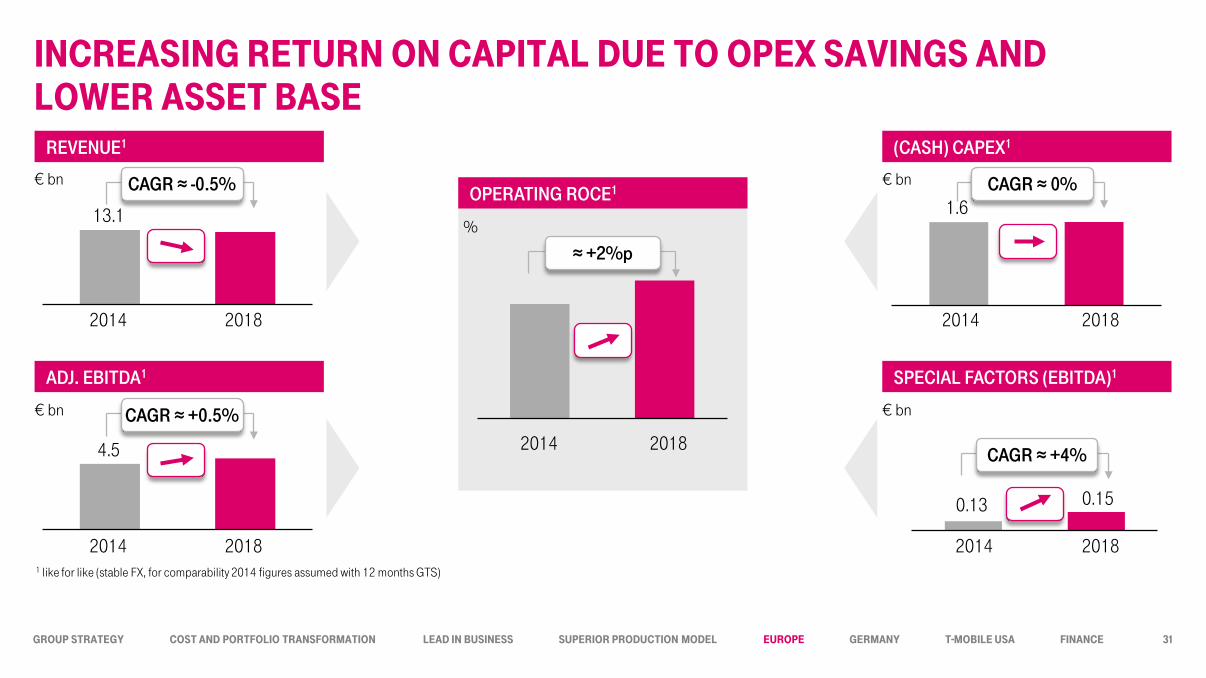
1 like for like (stable FX, for comparability 2014 figures assumed with 12 months GTS)
InCREASInG RETURn On CAPITAL DUE TO OPEx SAvInGS AnD LOwER ASSET bASE
13.1
2014 2018
2014 2018
4.5
REVENUE1
ADJ. EBITDA1
(CASH) CAPEX1
SPECIAL FACTORS (EBITDA)1
OPERATING ROCE1 € bn
€ bn
1.6
2014 2018
0.13
2014 2018
€ bn
€ bn
CAGR ≈ 0%
CAGR ≈ +0.5%
CAGR ≈ -0.5%
%
CAGR ≈ +4% 2014 2018
≈ +2%p
31
0.15
GROUP STRATEGY COST AnD PORTfOLIO TRAnSfORMATIOn LEAD In bUSInESS SUPERIOR PRODUCTIOn MODEL EUROPE GERMAnY T-MObILE USA fInAnCE
MID TERM AMbITIOn LEvEL
32
GROUP STRATEGY COST AnD PORTfOLIO TRAnSfORMATIOn LEAD In bUSInESS SUPERIOR PRODUCTIOn MODEL EUROPE GERMAnY T-MObILE USA fInAnCE
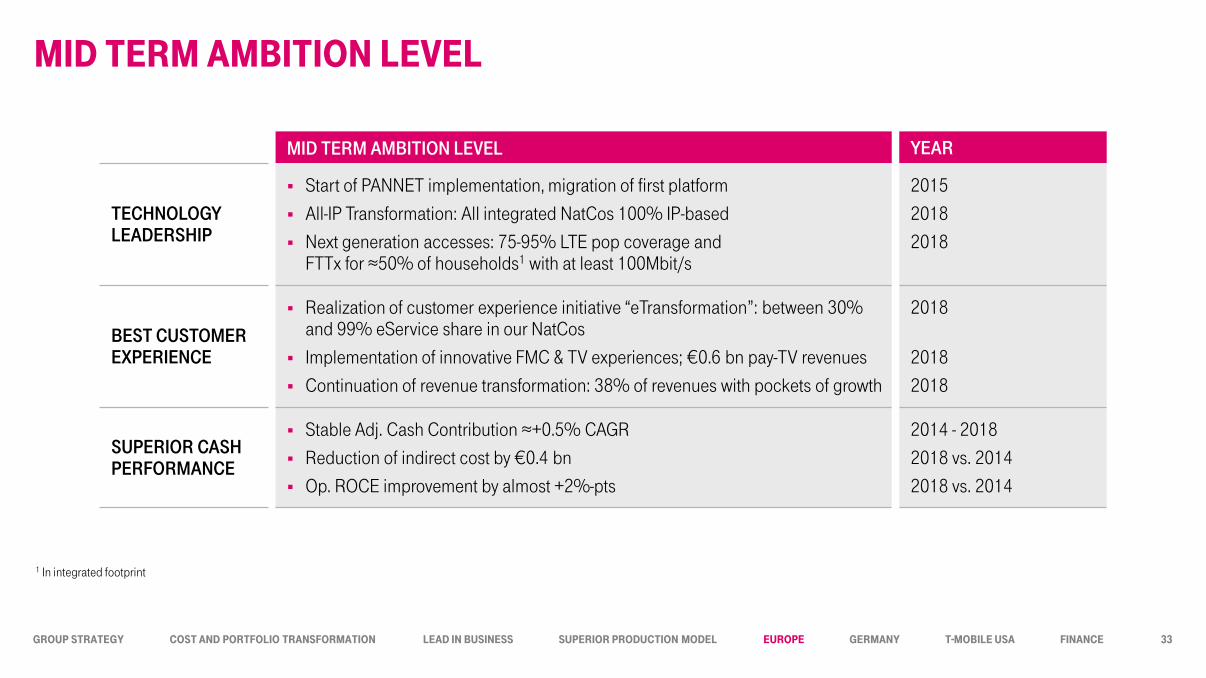
MID TERM AMBITION LEVEL YEAR
TECHNOLOGY LEADERSHIP
Start of PANNET implementation, migration of first platform
All-IP Transformation: All integrated NatCos 100% IP-based
Next generation accesses: 75-95% LTE pop coverage and FTTx for ≈50% of households1 with at least 100Mbit/s
2015
2018
2018
BEST CUSTOMER EXPERIENCE
Realization of customer experience initiative “eTransformation”: between 30% and 99% eService share in our NatCos
Implementation of innovative FMC & TV experiences; €0.6 bn pay-TV revenues
Continuation of revenue transformation: 38% of revenues with pockets of growth
2018
2018
2018
SUPERIOR CASH PERFORMANCE
Stable Adj. Cash Contribution ≈+0.5% CAGR
Reduction of indirect cost by €0.4 bn
Op. ROCE improvement by almost +2%-pts
2014 - 2018
2018 vs. 2014
2018 vs. 2014
MID TERM AMbITIOn LEvEL
1 In integrated footprint
33