determining the grain size distribution of granular soils using...
TRANSCRIPT

29.Acta Geotechnica Slovenica, 2017/1
Abstract
Image-processing technology includes storing the images of objects in a computer and processing them with the computer for a specified purpose. Image analysis is the numerical expression of the images of objects by means of mimicking the functioning of the human visual system and the generation of numerical data for calculations that will be made later. Digital image analysis provides the capability for rapid measurement, which can be made in near-real time, for numerous engineering parameters of materials. Recently, image analysis has been used in geotechnical engineering practices. Grain size distribution and grain shape are the most fundamental properties used to interpret the origin and behaviour of soils. Mechanical sieving has some limitations, e.g., it does not measure the axial dimension of a particle, particle shape is not taken into consideration, and especially for elongated and flat particles a sieve analysis will not yield a reliable measure. In this study the grain size distribution of sands has been determined following image-analysis techniques, using simple apparatus, non-professional cameras and open-code software. The sample is put on a transparent plate that is illuminated with a white backlight. The digital images were acquired with a CCD DSLR camera. The segmentation of the particles is achieved by image thresh-olding, binary coding and particle labeling. The geometri-cal measurements of each particle are obtained using an automated pixel-counting technique. Local contacts or limited overlaps were overcome using a watershed split. The same sample was tested by traditional sieve analysis. An image-analysis-based grain size distribution has been compared with a sieve-analysis distribution. The results show that the grain size distribution of the image-based analysis and the sieve analysis are in good agreement.
1 INTRODUCTION
Researchers in the geotechnical community under-stand that heterogeneity is a basic characteristic of geomaterials and employ considerable efforts for these heterogeneity problems. The grain size distribution (GSD) is one of the basic and most important properties of granular soils that exhibit heterogeneity. It is used in soil classification systems (such as USCS, AASHTO) and empirical estimation equations to estimate the perme-ability, shear strength, deformability and compactability. GSD is very important for geotechnical engineering. In site investigations of large engineering structures, in earthquakes and liquefaction research and before filter material selection, it is necessary to make a number of GSD analyses. The gradation of the in-situ soil often controls the groundwater drainage of the site. A poorly
DETERMINING THE GRAIN SIZE DISTRIBUTION OF GRANULAR SOILS USING IMAGE ANALYSIS
Nihat DipovaAkdeniz University,Department of Civil EngineeringAntalya, TurkeyE-mail: [email protected]
Keywords
image analysis, image processing, grain size, sand

30. Acta Geotechnica Slovenica, 2017/1
N. Dipova: Determining the grain size distribution of granular soils using image analysis
graded soil will have better drainage than a well graded soil. When a fill material is being selected for a highway embankment or an earthen dam, the soil gradation is considered. A well-graded soil can be compacted more than a poorly graded soil. These types of projects may also have gradation requirements that must be met before the soil to be used is accepted. When options for ground-remediation techniques are being selected, the soil gradation is a controlling factor. In addition to geotechnical applications in geological and agricultural studies, GSD is widely used.
There are two common test methods to determine the GSD: mechanical sieving for the coarse-grained soils and sedimentation tests (pipette and hydrometer methods) for the fine-grained soils. In sieve analysis, the particle size is determined by a dimension that represents the sieve aperture through which the particle passes. Although the size distribution can be obtained roughly, the shape of a grain cannot be taken into consideration in these traditional methods. Moreover, sample drying before the test and the sieving procedure make this method time and effort consuming; hence, it is an expensive method. Digital image analysis would be a practical alternative to make GSD measurements easier.
Digital image analysis extracts information from objects that are captured by an imaging system. The digital image processing and analysis techniques can be summarized in four basic steps: taking photographs with a digital camera, storing the image file as a digital file, image processing to edit the digital images for specific analysis, and analysis of the modified image to quantify the properties of an object. Digital image processing and analysis are used for detailed works of many disciplines, including medicine, genetics, biology, textiles, food science, geology, physics, chemistry, agriculture, forestry, mining, computer engineering, civil engineering and environmental sciences. In the past decade image-anal-ysis techniques have been used with increasing intensity in areas of geotechnical engineering such as deformation measurements [1, 2], failure analysis [3], porosity analy-sis [4, 5], grain size and shape analysis [6, 7, 8, 9, 10] and the determination of geotextile properties [11].
In this study the grain size distributions of sands are determined using a mechanical method with traditional sieves and image-analysis techniques using simple appa-ratus and consumer-grade cameras. A new approach to determine the mass-based distribution from 2D images is introduced. The results of these two techniques are compared. The advantages and limitations of the image-analysis-based grain size distribution determination are evaluated.
2 IMAGE PROCESSING AND ANALYSIS
Digital image processing (DIP) is the use of computer algorithms to create, process, communicate, and display digital images for specified purposes. After the process-ing of the digital images, digital image analysis (DIA) techniques are used for measurement, classification, database and statistical purposes. Some properties of the numbers of objects in an image (shape, dimension, area, location, boundary properties etc.) can be determined easily by means of DIA. Most DIP and DIA studies are based on binary modeling. A binary model consists of pixels that are quantized using only two values, 0 and 1, representing the full black and the full white colors, respectively. Editing of the binary images is often required to enhance the delineation of the individual object.
There are many types of software used for filtering, color and contrast adjustment, measurement, and classifica-tion. ImageJ [12] is commonly used image-processing and analysis software that was developed as a Java-based program by the National Institutes of Health (NIH). ImageJ and similar programs (e.g., Scion Image, Imag-eTool, Digimizer, Clemex, Image Pro Plus) are being used to solve numerous tasks in scientific disciplines, including the analysis of geo-materials (e.g., Szramek et al, [13], Polacci et al., [14]). These softwares are designed to process input images that can include rectangular raster files (e.g., *.tiff, *.jpg, *.gif, etc.) encoded in 8-bit grey-scale formats.
Developments in digital-imaging technology and image-processing/analysis software have provided the means for the development of new methods for particle size analysis based on image analysis [15, 16, 17, 18, 19]. In addition to a grain size distribution, using the digital image-analysis techniques other soil grain characteris-tics, such as sphericity, particle elongation, roundness, etc. can be readily quantified [20].
3 GRAIN SIZE OF GRANULAR SOILS
The grain size and shape are the most fundamental properties used to interpret the origin and behaviour of soils. Grain size distribution (GSD), also known as gradation, refers to the proportions by dry mass of a soil distributed over specified particle size ranges. Although there are several methods for measuring the GSD of fine-grained soils (such as pipette, hydrometer, laser diffraction, X-ray sedimentation), for the GSD of granular soil there is no current method more practical than sieve analysis. Laser diffraction can be used for

31.Acta Geotechnica Slovenica, 2017/1
N. Dipova: Determining the grain size distribution of granular soils using image analysis
fine sands, but it cannot work over 3 mm in size and the amount of sample tested is very small. Therefore, the sieve analysis is an indispensable and widely used method in geotechnical applications.
Mechanical sieving is a simple method that is commonly used in the civil engineering disciplines. Although the size distribution can be obtained roughly, the shape of a particle is not easy to describe in simplified terms. The size of a spherical object or a cube can be described with one dimension; however, the particles in a soil mass are irregular and nonuniform in shape in general. In a sieve analysis, the size of a particle is related to the size of the square aperture in which the particle passes. The size distribution is calculated based on the mass of all the particles retained on a sieve. The method has some limitations; it does not measure the axial dimension of a particle [19]. Particle shape is not taken into consider-ation, especially for elongated and flat particles a sieve analysis will not yield a reliable measure [21, 22, 23, 24].
Figure 1. Dimension terms; Fmin: Minimum Ferret’s diameter, Fmax: Maximum Ferret’s diameter, MBR: Minimum bounding rectangle,
B: Width, L: Length. Fit ellipse: Ellipse which fit in a MBR.
In reality, irregular particles need to be measured with more than one dimension. The maximum Ferret’s diam-eter, Fmax (also known as the maximum caliper) is the longest distance between any two points along the parti-cle boundary. Similarly, the minimum caliper diameter of the particle is the minimum Ferret’s diameter (Fmin). The minimum bounding rectangle (MBR), also known as the bounding box, is an expression of the maximum extents of a 2-dimensional object that fits in a rectangle. The dimensions of the MBR can be used to obtain the dimensions of the fit ellipse (the ellipse that fits into the MBR) (Figure 1). Rectangularity and ellipticity are two index parameters that define the shape similarity of a particle to a rectangle or ellipse, respectively. A simple approach to measuring rectangularity is to use the ratio of the area of the region to the area of its minimum bounding rectangle (MBR). Similarly, ellipticity is the ratio of the area of the region to the area of an ellipse that fits in the minimum bounding rectangle (MBR).
4 METHODOLOGY
4.1 Imaging and Processing
The experimental arrangement used in the present work is simple and inexpensive. Figure 2 shows a schematic diagram of the imaging system. Sand samples to be analyzed were washed on a 0.075 mm sieve using tap water and dried in an oven. In practice an air-dried sample is adequate. The sand sample is put on a transparent glass plate that is illuminated with a white backlight. A high contrast between the soil grains and the background is supplied by backlight illumination. An upright mounted light and diffuser white plate under the glass plate provide uniform illumination and main-tain a sufficient contrast. To increase the total image size
Figure 2. Experimental Set-Up.

32. Acta Geotechnica Slovenica, 2017/1
N. Dipova: Determining the grain size distribution of granular soils using image analysis
without reducing the resolution, stitching consecutively taken pictures into a long strip picture provides a practi-cal solution. In this technique, a camera that is mounted on a stage takes pictures continuously, while the glass plate moves laterally (Figure 2). The images of adjacent fields should be captured with at least a 30 % overlap.
Digital images have been acquired with a charged-coupled device (CCD) camera having a 15-megapixels resolution. To maintain high quality, a vibration-reduction (VR) lens and a remote-control device were used. Due to electronic noise in the camera system or nonuniformity in the background, random noise (dirt) occurs on an RGB (color) image. This problem can be effectively eliminated by filtering these noises, using noise-reduction filters. The segmentation of the particles is achieved by image thresholding, binary coding and particle labeling. The initial color image is converted into a binary image in which the particles are set to black (0), while the background is set to white (1).
Having a clear binary image after image processing, the geometrical measurements of each particle can be made by pixel counting. The true dimensions are determined by scaling. The soil sample should be placed sparsely, such that all individual grains should not overlap with each other. An overlap of the grains in the sample results in agglomeration. Local contacts or limited overlaps can be overcome using ‘‘watershed analysis’’, which has been proposed to determine the boundaries of objects in digi-tal images [25, 26]. In the case of the crowded placement of particles, watershed analysis may not be sufficient or lead to reduced individual particle sizes.
4.2 Calculations
The chain code (Freeman chain code) and mid-crack code are popular coding techniques for determining the outline of binary images. These codes encode the boundary of the object as a sequence of steps, from pixel to pixel, all around the object. The chain code moves along the center of the border pixels, while the crack code moves along a sequence of "cracks" between two adjacent border pixels. In both ways the outline is a connected sequence of straight-line segments with specified lengths and directions (Figure 3).
The chain code is disadvantageous when the area and perimeter of a particle is to be calculated. The inside chain code underestimates the area and perimeter, while the outside chain code overestimates them. The mid-crack code in area and perimeter computation results in a lower error value compared to the chain code and therefore the mid-crack code may be desirable in outline tracing [27]. However, if the backlight is used, such as in our case,
Figure 3. (a) 8 code words represent 8 directions (8-neigh-borhoud), (b) The Freeman chain code of the object,
(c) The mid-crack code of the object.
the situation is reversed. The measured area of a particle based on pixel counting will be larger than the true parti-cle area. When a backlight is used the background pixels have a gray-scale value equal to just 255. If a particle boundary intersects a background pixel, the projected light is diminished and its gray-scale value will be less than 255. Thus, Raschke and Hryciw [15] calculated the true particle area as equal to the pixel counted area minus one half the areas of the boundary pixels. Actually, this can be achieved by using the Freeman chain code approach instead of the mid-crack code. In this study the particle outlines were drawn using the chain code and the areas of this outline were calculated accordingly.
Using image-analysis techniques the projection areas of individual particles are calculated automatically. An area-based particle size distribution can be obtained easily; however, a mass-based distribution would be more realistic. The problem here is the pictures are in two dimensions and a measurement of the particle thickness is impossible. A uniform particle shape in soils such as a cube or a sphere is rare. However, soil particles are nonuniform, most of the particles have resemblance to standard geometries such as cube, prism, sphere and ellipsoid. In fact a cube is a rectangular prism with three equal dimensions. Similarly, a sphere is a special case of an ellipsoid. Therefore, the volume of particles similar to an ellipse and a rectangle projection area can be calcu-lated automatically.
If soil particles are dropped onto a horizontal plane, they will always drop on their smallest dimension perpendic-

33.Acta Geotechnica Slovenica, 2017/1
N. Dipova: Determining the grain size distribution of granular soils using image analysis
ular to that plane. Therefore, particle thickness should be the minimum dimension of a particle. The thickness and volume of particles cannot be obtained directly from the 2D images. Based on the assumption that particles from the same source should have more or less the same shape characteristics [16], the mean thickness of a particle from the breadth of the particle can be estimated as:
1
= n
i
MMean thickness breathbreath area
(1)
where M is the total mass of the aggregate sample.
In Mora and Kwan's approach [16] the particle shape is supposed to be a polygonal prism. In reality the particle shape is irregular in 3D. However, some particles look like an ellipsoid (a sphere is a special form of an ellipse) and some a rectangular prism (a cube is a special form of a rectangle) (Figure 4). This assumption is more realistic and results in a smaller error.
Figure 4. Ellipsoid (a sphere is a special form of ellipsoid) and rectangular prism (a cube is a special form of rectanglular
prism) assumption for soil particles.
In 2D image analysis the rectangularity and ellipticity of the particles can be calculated. Therefore, in this study the volume of the particles have been calculated for ellip-soidal shape if the ellipticity is higher than the rectangu-larity, otherwise the volume is calculated for a rectangular prismatic shape. Initially, the thickness of particles is assumed to be equal to the medial dimension (b). The density of dry sand ranges between 2.64 and 2.67 g/cm3, and a calculation of the mass, taking the dry density equal to 2.65, is reasonable. Dividing the weighted mass of the whole soil sample to a cumulative mass calculated according to the way explained above, a correction factor will be obtained (bracket in equation 1). Multiplying this by a medial dimension (b) of every individual particle, the thickness can be estimated (Equation 2).
1
= n
i
MThickness bvolume
(2)
The grain size distribution curve is drawn as a semi-logarithmic graph of percent passing - particle diameter. In a sieve analysis the particle diameter is assumed to be equal to the sieve opening. In reality, the medial dimen-sion or minimum Ferret's dimension of a particle in 2D passes through the diagonal of a square sieve aperture (Figure 5a). Therefore, the equivalent particle diameter (De) for 2D analysis should be calculated as;
min / 2eD F (3)
(Figure 5a). In this study the images of particles are assumed to be ellipsoid or a rectangular prism according
Figure 5. a) Minimum Ferret’s dimension of a particle may pass through the diagonal of square sieve aperture, b) Ellipsoid
assumption, c) Rectangular prism assumption.
to the shape similarity of a particle to an ellipse or a rectangle, respectively. Therefore, the equivalent particle diameter (De) should be:
2 20.5eD b c (4)
for an ellipsoid (Figure 5b) and
/ 2eD b c (5)
for a rectangular prism (Figure 5c).
a)
b) c)

34. Acta Geotechnica Slovenica, 2017/1
N. Dipova: Determining the grain size distribution of granular soils using image analysis
4.3 Mechanical (sieve) analysis
A grain-size distribution by sieve analysis was performed in accordance with the procedure suggested by ASTMD422-63 [28]. Traditional grain-size distribution curves based on a sieve analysis are shown in figures 6-11.
5 RESULTS AND DISCUSSION
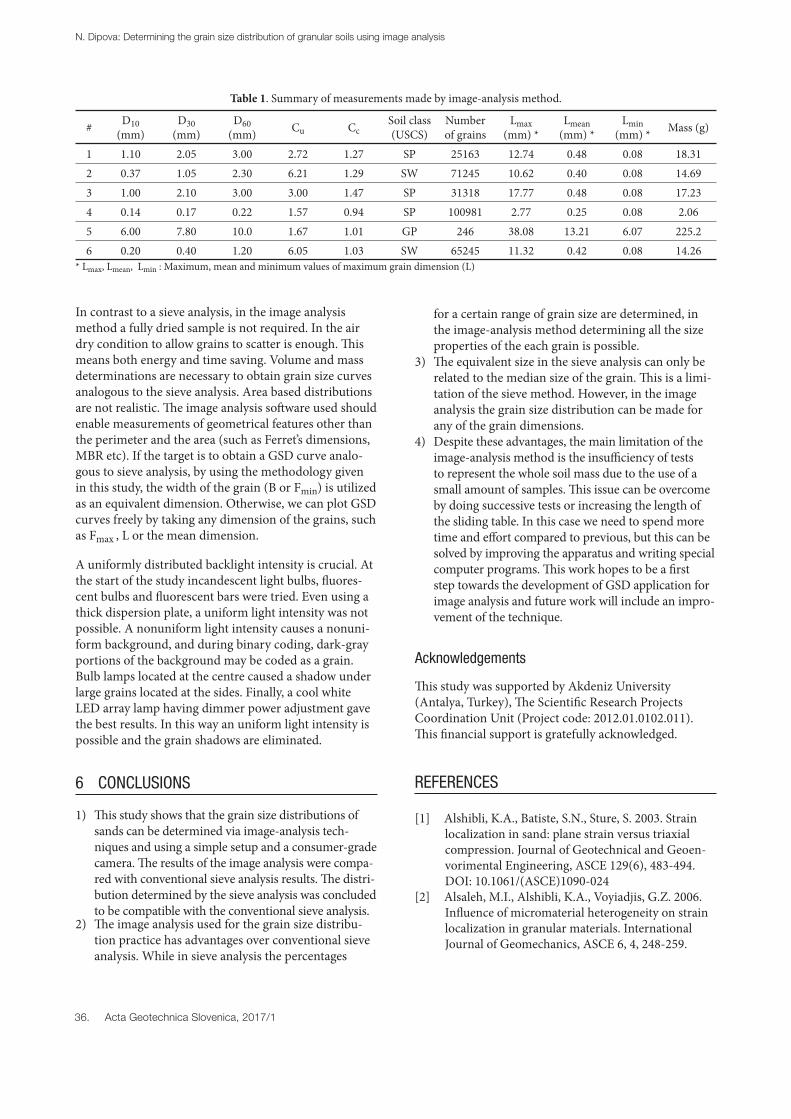
Six different samples were analyzed (Table 1). A 24 MP CCD DSLR camera, 300 mm / macro lens and remote control were used for the photography. In the binary images the grains were numbered and geometrical
Figure 6. Comparison of sieve analysis and image analysis results for sample 1.
Figure 7. Comparison of sieve-analysis and image-analysis results for sample 2.
Figure 8. Comparison of sieve-analysis and image-analysis results for sample 3.

35.Acta Geotechnica Slovenica, 2017/1
N. Dipova: Determining the grain size distribution of granular soils using image analysis
Figure 9. Comparison of sieve analysis and image analysis results for sample 4.
Figure 10. Comparison of sieve-analysis and image-analysis results for sample 5.
Figure11. Comparison of sieve-analysis and image-analysis results for sample 6.
measurements of the grains were made automatically. Fmax, Fmin , the minimum boundary rectangle (MBR) and area measurements were made. The volume calcula-tions were carried out with the assumption of a rectan-gular prism and ellipsoid. For every grain the equivalent grain size and percent finer values were calculated and
plotted on semi-logarithmic graphs (Figure 6-11). The soil samples were also tested using a conventional sieve analysis technique for comparison purposes. Most parts of the grain size distributions determined using the sieve analysis and the image analysis are in good agreement.
36. Acta Geotechnica Slovenica, 2017/1
N. Dipova: Determining the grain size distribution of granular soils using image analysis
# D10 (mm)
D30 (mm)
D60 (mm) Cu Cc
Soil class (USCS)
Number of grains
Lmax (mm) *
Lmean (mm) *
Lmin (mm) * Mass (g)
1 1.10 2.05 3.00 2.72 1.27 SP 25163 12.74 0.48 0.08 18.312 0.37 1.05 2.30 6.21 1.29 SW 71245 10.62 0.40 0.08 14.693 1.00 2.10 3.00 3.00 1.47 SP 31318 17.77 0.48 0.08 17.234 0.14 0.17 0.22 1.57 0.94 SP 100981 2.77 0.25 0.08 2.065 6.00 7.80 10.0 1.67 1.01 GP 246 38.08 13.21 6.07 225.26 0.20 0.40 1.20 6.05 1.03 SW 65245 11.32 0.42 0.08 14.26
Table 1. Summary of measurements made by image-analysis method.
* Lmax, Lmean, Lmin : Maximum, mean and minimum values of maximum grain dimension (L)
In contrast to a sieve analysis, in the image analysis method a fully dried sample is not required. In the air dry condition to allow grains to scatter is enough. This means both energy and time saving. Volume and mass determinations are necessary to obtain grain size curves analogous to the sieve analysis. Area based distributions are not realistic. The image analysis software used should enable measurements of geometrical features other than the perimeter and the area (such as Ferret’s dimensions, MBR etc). If the target is to obtain a GSD curve analo-gous to sieve analysis, by using the methodology given in this study, the width of the grain (B or Fmin) is utilized as an equivalent dimension. Otherwise, we can plot GSD curves freely by taking any dimension of the grains, such as Fmax , L or the mean dimension.
A uniformly distributed backlight intensity is crucial. At the start of the study incandescent light bulbs, fluores-cent bulbs and fluorescent bars were tried. Even using a thick dispersion plate, a uniform light intensity was not possible. A nonuniform light intensity causes a nonuni-form background, and during binary coding, dark-gray portions of the background may be coded as a grain. Bulb lamps located at the centre caused a shadow under large grains located at the sides. Finally, a cool white LED array lamp having dimmer power adjustment gave the best results. In this way an uniform light intensity is possible and the grain shadows are eliminated.
6 CONCLUSIONS
1) This study shows that the grain size distributions of sands can be determined via image-analysis tech-niques and using a simple setup and a consumer-grade camera. The results of the image analysis were compa-red with conventional sieve analysis results. The distri-bution determined by the sieve analysis was concluded to be compatible with the conventional sieve analysis.
2) The image analysis used for the grain size distribu-tion practice has advantages over conventional sieve analysis. While in sieve analysis the percentages
for a certain range of grain size are determined, in the image-analysis method determining all the size properties of the each grain is possible.
3) The equivalent size in the sieve analysis can only be related to the median size of the grain. This is a limi-tation of the sieve method. However, in the image analysis the grain size distribution can be made for any of the grain dimensions.
4) Despite these advantages, the main limitation of the image-analysis method is the insufficiency of tests to represent the whole soil mass due to the use of a small amount of samples. This issue can be overcome by doing successive tests or increasing the length of the sliding table. In this case we need to spend more time and effort compared to previous, but this can be solved by improving the apparatus and writing special computer programs. This work hopes to be a first step towards the development of GSD application for image analysis and future work will include an impro-vement of the technique.
Acknowledgements
This study was supported by Akdeniz University (Antalya, Turkey), The Scientific Research Projects Coordination Unit (Project code: 2012.01.0102.011). This financial support is gratefully acknowledged.
REFERENCES
[1] Alshibli, K.A., Batiste, S.N., Sture, S. 2003. Strain localization in sand: plane strain versus triaxial compression. Journal of Geotechnical and Geoen-vorimental Engineering, ASCE 129(6), 483-494. DOI: 10.1061/(ASCE)1090-024
[2] Alsaleh, M.I., Alshibli, K.A., Voyiadjis, G.Z. 2006. Influence of micromaterial heterogeneity on strain localization in granular materials. International Journal of Geomechanics, ASCE 6, 4, 248-259.
37.Acta Geotechnica Slovenica, 2017/1
N. Dipova: Determining the grain size distribution of granular soils using image analysis
DOI: 10.1061/(ASCE)1532-3641[3] Alshibli, K.A., Sture, S. 1999. Sand shear band
thickness measurements by digital imaging tech-niques. Journal of Computing in Civil Engineering 13, 2, 103-109. DOI: 10.1061/(ASCE)0887-3801
[4] Bhatia, S., Soliman, A. 1990. Frequency distribution of void ratio of granular materials determined by an image analyzer. Soils and Foundations 30, 1, 1-16. DOI:10.3208/sandf1972.30.1
[5] Kuo, C.Y., Frost, J.D. 1996. Uniformity evaluation of cohesionless specimens using digital image analysis. ASCE Journal of Geotechnical and Geoenviron-mental Engineering 122, 5, 390–396. DOI: 10.1061/(ASCE)0733-9410
[6] Alshibli, K.A., Alsaleh, M.I. 2004. Characterizing surface roughness and shape of sands using digital microscopy. Journal of Computing in Civil Engineer-ing 18, 1, 36-45. DOI: 10.1061/(ASCE)0887-3801
[7] Masad, E., Saadeh, S., Rousan, T.A., Garboczi, E., Little, D. 2005. Computations of particle surface characteristics using optical and X-ray CT images. Computational Materials Science 34, 406-424. DOI: 10.1016/j.commatsci.2005.01.010
[8] Al-Rousan, T., Masad, E., Tutumluer, E., Pan, T. 2007. Evaluation of image analysis techniques for quantifying aggregate shape characteristics. Construction and Building Materials 21, 978–990. DOI: 10.1016/j.conbuildmat.2006.03.005
[9] Ohm, H., Hryciw, R. 2014. Size Distribution of Coarse-Grained Soil by Sedimaging. J. Geotech. Geoenviron. Eng. 140, 4, 04013053. DOI: 10.1061/(ASCE)GT.1943-5606.0001075
[10] Araujo, G.S., Bicalho, K.V., Tristao, F.A. 2015. Use of image analysis to determine the shape and texture of sands. Revista Brasileira De Ciencia Do Solo 39, 1, 94-99. DOI: 10.1590/01000683rbcs20150274
[11] Aydilek A.H., Kutay, M.E., Sparacino, R., Dafla, H. 2007. Image Analysis for QC/QA of Geosynthetic Deforma-tion during Wide Width Tensile Testing. Proceedings of Geosynthetics 2007, Washington, D.C., 6 p.
[12] Rasband, W.S. 2005. ImageJ, U. S. National Insti-tutes of Health, Bethesda, Maryland, USA.
[13] Szramek, L., Gardner, J.E., Larsen, J. 2006. Degas-sing and microlite crystallization of basaltic andesite magma erupting at Arenal Volcano, Costa Rica. Journal of Volcanology and Geothermal Research 157, 182–201. DOI: 10.1016/j.jvolgeo-res.2006.03.039
[14] Polacci, M., Baker, D.R., Mancini, L., Tromba, G., Zanini, F. 2006. Three-dimensional investigation of volcanic textures by X-ray microtomogra-phy and implications for conduit processes. Geophysical Research Letters 33, L13312, 1-5. DOI: 10.1029/2006GL026241
[15] Raschke, S. A., Hryciw, R. D. 1997. Grain-size
distribution of granular soils by computer vision. ASTM Geotech. Testing Journal 20, 4, 433–442. DOI: 10.1520/GTJ10410J
[16] Mora, C.F., Kwan, A.K.H., Chan, H.C. 1998. Particle Size Distribution Analysis Of Coarse Aggregate Using Digital Image Processing. Cement and Concrete Research 28, 6, 921–932. DOI: 10.1016/S0008-8846(98)00043-X
[17] Ghalib, A.M., Hryciw, R.D. 1999. Soil particle size distribution by mosaic imaging and watershed analysis. Journal of Computing in Civil Engineering 13, 2, 80-87. DOI: 10.1061/(ASCE)0887-3801
[18] Mora, C.F., Kwan, A.K.H. 2000. Sphericity, Shape Factor, and Convexity Measurement of Coarse Aggregate for Concrete Using Digital Image Processing. Cement and Concrete Research 30, 3, 351-358. DOI: 10.1016/S0008-8846(99)00259-8
[19] Mertens, G., Elsen, J. 2006. Use of computer assisted image analysis for the determination of the grain-size distribution of sands used in mortars. Cement and Concrete Research 36, 1453-1459. DOI: 10.1016/j.cemconres.2006.03.004
[20] Kuo, C.Y., Frost, J.D., Lai, J.S., Wang, L.B. 1996. Three-Dimensional Image Analysis of Aggregate Particles from Orthogonal Projections. Trans-portation Research Record 1526, 98-103. DOI: 10.3141/1526-12
[21] Fernlund, J.M.R., Zimmerman, R.W., Kragic, D. 2007. Influence of volume/mass on grain-size curves and conversion of image-analysis size to sieve size. Engineering Geology 90, 124–137. DOI: 10.1016/j.enggeo.2006.12.007
[22] Allen,T. 1968. Particle size measurement, Chapman and Hall, London.
[23] Pettijohn F.J. 1984. Sedimentary Rocks. S.K. Jain, India.
[24] Fernlund, J.M.R. 1998. The effect of particle form on sieve analysis: a test by image analysis. Engineer-ing Geology 50, 111-124. DOI: 10.1016/S0013-7952(98)00004-0
[25] Vincent, L. 1991. Morphological transformations of binary images with arbitrary structuring elements. Signal Processing 22, 1, 3–23. DOI: 10.1016/0165-1684(91)90025-E
[26] Vincent, L., Soille, P. 1993. Watersheds in digital spaces, an efficient algorithm based on immer-sion simulations. IEEE Trans. Pattern Anal. and Machine Intelligence 13, 6, 583–598. DOI: 10.1109/34.87344
[27] Dunkelberger, K. A., Mitchell, 0. R. 1985. Contour tracing for precision measurement. Proc. IEEE Inter Conf. Robotics and Automation, St. Louis, 22-27.
[28] ASTM, 1998 Standard test method for particle-size analysis of soils ASTM D422-63, ASTM Standards, Philadelphia, Pennsylvania.