determination of sotolon content in south african white wines by two novel hplc–uv and uplc–ms...
TRANSCRIPT
Food Chemistry 169 (2015) 180–186
Contents lists available at ScienceDirect
Food Chemistry
journal homepage: www.elsevier .com/locate / foodchem
Analytical Methods
Determination of sotolon content in South African white wines by twonovel HPLC–UV and UPLC–MS methods
http://dx.doi.org/10.1016/j.foodchem.2014.07.1530308-8146/� 2014 Elsevier Ltd. All rights reserved.
⇑ Corresponding author.E-mail address: [email protected] (W.J. du Toit).
Mario Gabrielli a, Astrid Buica b, Daniela Fracassetti a, Marietjie Stander c,d, Antonio Tirelli a,Wessel J. du Toit b,⇑a Department of Food, Environmental and Nutritional Sciences, Università degli Studi di Milano, Via G. Celoria 2, 20133 Milano, Italyb Department of Viticulture and Oenology, University of Stellenbosch, Private Bag X1, Matieland (Stellenbosch) 7602, South Africac Central Analytical Facility (CAF), University of Stellenbosch, Private Bag X1, Matieland (Stellenbosch) 7602, South Africad Department of Biochemistry, University of Stellenbosch, Private Bag X1, Matieland (Stellenbosch) 7602, South Africa
a r t i c l e i n f o a b s t r a c t
Article history:Received 2 September 2013Received in revised form 16 May 2014Accepted 20 July 2014Available online 10 August 2014
Keywords:SotolonWhite wineLiquid chromatography
Sotolon has been reported to play an important role in the atypical ageing and aroma character of manywines. A number of analytical techniques for sotolon analysis in wine have been reported, but these oftenrequire extensive sample preparation. In this work we report a HPLC–UV method and a novel UPLC–MSmethod to determine sotolon concentrations in white wines with little sample preparation applied forthe first time for the evaluation of sotolon levels in South African wines. The validation showed thatthe instrumental methods had good accuracy, repeatability and linearity, but the UPLC–MS methodproved more sensitive. For both methods, quantification limits were lower than the sotolon odour thresh-old in wine (10 lg/L), 0.86 lg/L and 0.013 lg/L, for HPLC–UV and UPLC–MS methods, respectively.Sotolon levels in 65 South African white wines were often found to be lower than the reported odourthreshold, with the highest concentration being 9.11 lg/L. However, for low levels (<1 lg/L), unknowninterferences in certain wines led to sotolon not being quantified with the HPLC–UV method, which madethe UPLC–MS method more suitable.
� 2014 Elsevier Ltd. All rights reserved.
1. Introduction
Sotolon (3-hydroxy-4,5-dimethyl-2(5)-furanone) is a powerfulflavour compound with an intense spicy/curry odour (Girardon,Sauvaire, Baccou, & Bessiere, 1986). Sotolon has an aromaassociated with aged sake (Takahashi, Tadenuma, & Sato, 1976),roasted coffee (Blank, Sen, & Grosh, 1992), fenugreek (Girardonet al., 1986) and sugar cane (Tokitomo, Kobayashi, Yamanishi, &Murahi, 1980). Sotolon has been identified and quantified in differ-ent wines, such as botrytised (or noble rot) wines (5–20 lg/L)(Masuda, Okawa, Nishimura, & Yunome, 1984), port (5–958 lg/L)(Silva Ferreira, Barbe, & Bertrand, 2003), vin Javen (120–268 lg/L) (Pham, Guichard, Schlich, & Charpentier, 1995), sherry(0–500 lg/L) (Martin, Etiévant, Le Quéré, & Schlich, 1992) andMadeira (0–2 000 lg/L) (Camara, Marques, Alves, & Silva Ferreira,2004), and in barrel-aged white wines (0–140 lg/L) (Lavigne,Pons, Darriet, & Dubourdieu, 2008). Its odour threshold is extre-
mely low: 0.02 lg/L in air (Blank, Lin, Fumeaux, Welti, & Fay,1996), 0.3 lg/L in water (nasal detection) (Blank et al., 1996) and10 lg/L in white wine (human perception) (Guichard, Pham, &Etiévant, 1993). Although it is associated to a typical flavour notein Madeira, port, sherry and long-aged sweet wines, sotolon is con-sidered to be one of the compounds responsible for the atypicalageing and oxidative off-flavour in dry white wines when its con-centration is higher than the odour threshold (Du Toit, Marais,Pretorius, & Du Toit, 2006).
Several pathways for the formation of sotolon are reported inthe literature. It can be produced by thermal degradation of inter-mediate compounds of the Maillard reaction (Blank et al., 1996;Guerra & Yaylayan, 2011; Hofmann & Schieberle, 1997). Cutzach,Chatonnet, and Dubourdieu (1999) showed a pathway for the for-mation of sotolon via aldol condensation between a-keto butyricacid and acetaldehyde. Konig et al. (1999) explained that sotolonis produced by the reaction between ethanol and ascorbic acid.During winemaking and ageing, sotolon formation is affected bychemical and physical factors such as the presence of oxygen(Cutzach et al., 1999; Lavigne et al., 2008), the reducing sugar con-centration (Camara et al., 2004), storage temperature and time
M. Gabrielli et al. / Food Chemistry 169 (2015) 180–186 181
(Cutzach et al., 1999), and concentrations of certain antioxidants(e.g. sulphur dioxide, glutathione) (Dubourdieu & Lavigne, 2004).
Due to the number of physical and chemical factors affectingthe formation of sotolon in wine, this compound was suggestedas a chemical marker of the shelf-life for dry white wine (Lavigne& Dubourdieu, 2004). However, the levels of sotolon in South Afri-can white wine have not been investigated before.
Several analytical techniques have been reported for the deter-mination of sotolon in wine, including Multi-Dimensional GasChromatography (MDGC–MS) and High-Resolution GC (HRGC–MS) (Konig et al., 1999); High-Resolution GC Olfactometry(HRGC–MS–O) (Escudero, Cacho, & Ferreira, 2000); GC Olfactome-try (GC–O) (Silva Ferreira et al., 2003); Two Dimensional CapillaryGC (2D-CGC) (Dugo et al., 2014; Martin & Etiévant, 1991); GC–MS(Castro, Martins, Teixeira, & Silva Ferreira, 2014; Pons, Lavigne,Landais, Darriet, & Dubourdieu, 2010; Zea, Moyano, Ruiz, &Medina, 2013); Two Dimensional GC (2D-GC) (Martin et al.,1992); and High Pressure Liquid Chromatography (HPLC–UV)(Guichard et al., 1993). Moreover, the sotolon concentration inwine is usually low and the compound has high boiling tempera-ture (184 �C), both affecting negatively the sensitivity of the analy-tical methods based on head space sampling technique (DHS andSPME) (Ferreira, Jarauta, López, & Cacho, 2003; Ferreira, Ortega,Escudero, & Cacho, 2000). The sample preparation requires bothan extraction step (liquid/liquid extraction or solid phase extrac-tion (SPE)) followed by a concentration step prior the chromato-graphic separation (Cutzach et al., 1999; Konig et al., 1999).Generally, these reported methods use either instrumentation thatis not standard in oenology laboratories or long extraction time(Escudero et al., 2000), and substantial volumes of both sampleand solvents (Konig et al., 1999; Schneider, Baumes, Bayonove, &Razungles, 1998; Takahashi et al., 1976).
The two main aims of this study thus were to develop, validateand compare two fast and reproducible chromatographic methods(UPLC–MS and HPLC–UV) for sotolon analysis in wine, and to usethese methods to assess sotolon levels in South African whitewines in order to understand the occurrence of atypical ageingcausing a decrease of wine shelf-life.
2. Materials and methods
2.1. Chemicals
4,5-Dimethyl-3-hydroxy-2,5-dihydrofuran-2-one (P97%),dichloromethane (P99.8%), sodium chloride (P99.5%), methanol(P99.9%), acetonitrile LC–MS CHROMASOLV� (P99.0%), iso-propanol LC–MS CHROMASOLV� (P99.0%) and anhydrous sodiumsulphate (P99.0%) were purchased from Sigma–Aldrich (St. Louis,MO, USA). UPLC water was obtained from a Milli-Q filtration sys-tem (Millipore Filter Cor., Bedford, MA, USA). Polyvinylpolypyrroli-done (PVPP) resin was purchased from Dal Cin Gildo spa (Sesto SanGiovanni, Milano, Italy). The model wine contained 12% (v/v) etha-
Table 1Gradients: UPLC–MS (A: formic acid 1% and B: methanol:acetonitrile:is
ULPC–MS gradient H
Time (min.) Flow (mL/min) Eluent A (%) Eluent B (%) T
0.0 0.4 91 93.0 0.4 91 93.1 0.4 30 704.0 0.4 0 100 15.0 0.4 0 100 15.1 0.4 91 9 26.5 0.4 91 9
nol and 5 g/L of tartaric acid, and the pH was adjusted to 3.5 withsodium hydroxide (Sigma–Aldrich St. Louis, MO, USA).
2.2. White wine samples
Sotolon analysis was carried out on 70 commercial SouthAfrican white wines. The commercial wines were produced fromten different grape cultivars (Sauvignon blanc, Chardonnay, Cheninblanc, Viognier, Semillon, Grenache blanc, Pinot Grigio, Colombard,Gewurztraminer and Rhine Riesling) and sixteen different vintages(from 1983 to 2013). The wine samples coded by number (1–65)were sourced directly from local cellars, while the wines codedby letter (a–e) were stored for 2 years at 37 �C.
2.3. Sample preparation
The sample preparation was done according to Gabrielli (2014),Gabrielli, Fracassetti, and Tirelli (2014). The equivalent of 3 g/LNaCl was added to 30 mL of white wine. The wine was extractedtwice with 20 mL dichloromethane for 10 min with stirring. Theorganic phases were combined and 2 g anhydrous Na2SO4 wasadded to remove traces of water. Dichloromethane was evaporatedto dryness under a gentle nitrogen stream, and the dry materialwas re-dissolved in 2 mL of 5% methanol solution. The concen-trated extract was further purified with 50 mg of PVPP resin by dis-persion in the sample. The solution was filtered (0.22 lm PVDF,Millipore, MO, USA) before injection.
2.4. UPLC–MS/MS and HPLC–UV analysis
UPLC–MS separations were performed with a Waters Acquity HClass UPLC system connected to a Waters Xevo triple quadrupolemass spectrometer (Waters, Milford, MA, USA). The column usedwas a BEH C18, 2.1 � 100 mm, 1.7 lm (Waters, Milford, MA,USA). Data were acquired in multiple reaction monitoring (MRM)mode, electrospray positive ionisation, precursor ion at m/z 129,and the product ions at m/z 55 and 83, using a collision energyof 20 V and 15 V, respectively. A cone voltage of 20 V was used.The desolvation temperature was set at 400 �C, and the desolvationgas was 900 L/h. A capillary voltage of 3.5 kV was used and the restof the MS settings were optimised for best sensitivity. The mobilephases were (A) 1% formic acid in water and (B) methanol:acetoni-trile:iso-propanol (49:49:2), and the flow rate was 0.4 mL/min. Theinjection volume was 3 lL and the column temperature was at30 �C.
HPLC–UV separations were performed with an Agilent 1260Series system fitted with a diode array detector (Agilent, Palo Alto,CA, USA). The column used was a Kinetex C18 100 � 3 mm �2.6 lm, from Phenomenex (Torrence, CA, USA). The sotolon wasdetected and quantified at 235 nm. The mobile phases used were(A) water and (B) methanol, and the flow rate was 0.45 mL/min.The injection volume was 20 lL and the column temperaturewas 30 �C. The gradients are reported in Table 1.
o-propanol (49:49:2)) and HPLC–UV (A: water and B: methanol).
PLC–UV gradient
ime (min.) Flow (mL/min) Eluent A (%) Eluent B (%)
0 0.45 95 58 0.45 95 59 0.45 0 1001 0.45 0 1002 0.45 95 50 0.45 95 5
182 M. Gabrielli et al. / Food Chemistry 169 (2015) 180–186
2.5. Validation procedure
The validation of the methods was carried out with respect toqualitative (selectivity) and quantitative (linearity, LOD, LOQ,repeatability and accuracy) parameters.
2.5.1. SelectivitySelectivity was tested by spiking model wine and a young dry
white wine with 10 lg/L sotolon, performing the sample prepara-tion procedure and the separation, and comparing the chromato-grams. In this way, the selectivity of the method was evaluatedby comparing the results obtained for the detection of sotolon inthe absence and presence of possible interferences originatingfrom the white wine matrix.
2.5.2. LinearityThe linearity interval tested was 5–50 lg/L at six concentration
levels, in young dry white wine and in model wine, with extrac-tions done in duplicate. The linearity correlation coefficients (R2)were calculated from the regression analysis. The limit of detection(LOD) and limit of quantitation (LOQ) were calculated as the lowestconcentration of analyte in a sample that resulted in a signal-to-noise ratio of 3 (LOD) and 10 (LOQ), respectively. The baselinenoise was calculated by the software (MassLynx, Waters).
2.5.3. Accuracy (recovery test)Accuracy was measured for two levels of sotolon, specifically
10.7 lg/L and 21.5 lg/L. Spiked model wine (at both concentra-tions), white wine (blank) and the same white wine, spiked (atboth concentrations) were extracted in duplicate.
2.5.4. PrecisionPrecision was expressed as repeatability (intra-day measure-
ments) and intermediate precision (inter-day measurements).The model wine and white wine were spiked with two levels ofsotolon corresponding to a medium–low (10.7 lg/L) and med-ium–high (21.5 lg/L) concentrations. The extractions were donein triplicate, and the intermediate precision calculated over threedays. For the instrumental repeatability, spiked white and modelwines containing 21.5 lg/L of sotolon were injected five times.
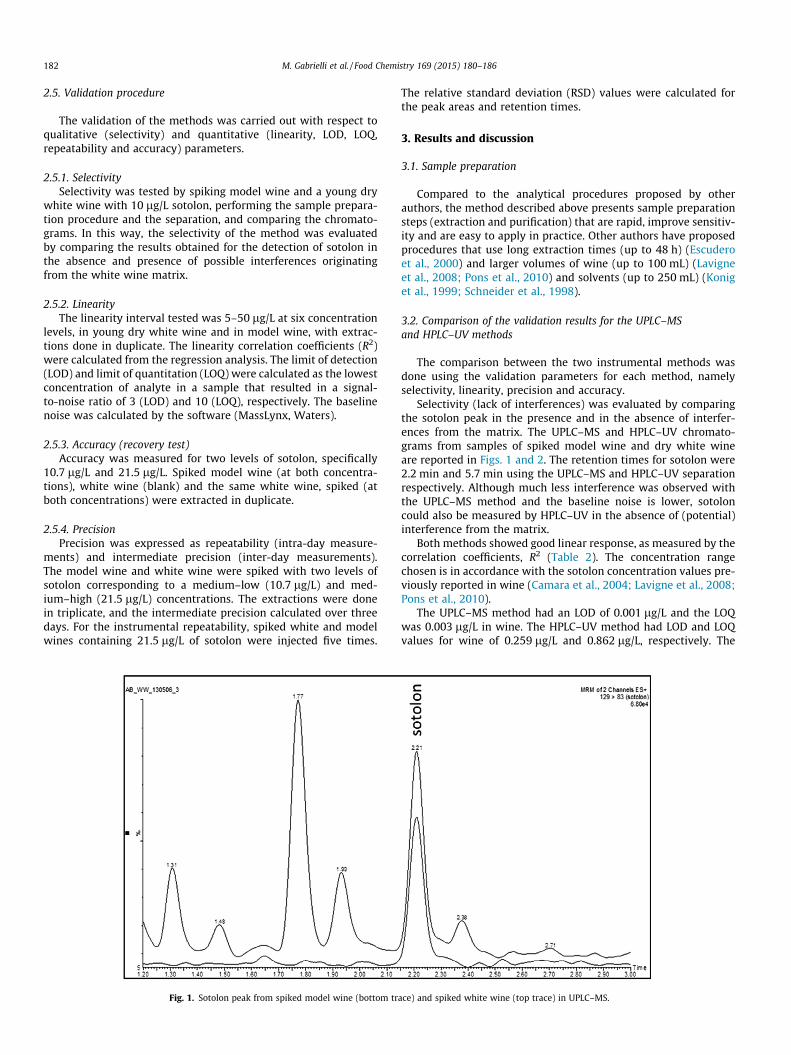
Fig. 1. Sotolon peak from spiked model wine (bottom tr
The relative standard deviation (RSD) values were calculated forthe peak areas and retention times.
3. Results and discussion
3.1. Sample preparation
Compared to the analytical procedures proposed by otherauthors, the method described above presents sample preparationsteps (extraction and purification) that are rapid, improve sensitiv-ity and are easy to apply in practice. Other authors have proposedprocedures that use long extraction times (up to 48 h) (Escuderoet al., 2000) and larger volumes of wine (up to 100 mL) (Lavigneet al., 2008; Pons et al., 2010) and solvents (up to 250 mL) (Koniget al., 1999; Schneider et al., 1998).
3.2. Comparison of the validation results for the UPLC–MSand HPLC–UV methods
The comparison between the two instrumental methods wasdone using the validation parameters for each method, namelyselectivity, linearity, precision and accuracy.
Selectivity (lack of interferences) was evaluated by comparingthe sotolon peak in the presence and in the absence of interfer-ences from the matrix. The UPLC–MS and HPLC–UV chromato-grams from samples of spiked model wine and dry white wineare reported in Figs. 1 and 2. The retention times for sotolon were2.2 min and 5.7 min using the UPLC–MS and HPLC–UV separationrespectively. Although much less interference was observed withthe UPLC–MS method and the baseline noise is lower, sotoloncould also be measured by HPLC–UV in the absence of (potential)interference from the matrix.
Both methods showed good linear response, as measured by thecorrelation coefficients, R2 (Table 2). The concentration rangechosen is in accordance with the sotolon concentration values pre-viously reported in wine (Camara et al., 2004; Lavigne et al., 2008;Pons et al., 2010).
The UPLC–MS method had an LOD of 0.001 lg/L and the LOQwas 0.003 lg/L in wine. The HPLC–UV method had LOD and LOQvalues for wine of 0.259 lg/L and 0.862 lg/L, respectively. The
ace) and spiked white wine (top trace) in UPLC–MS.
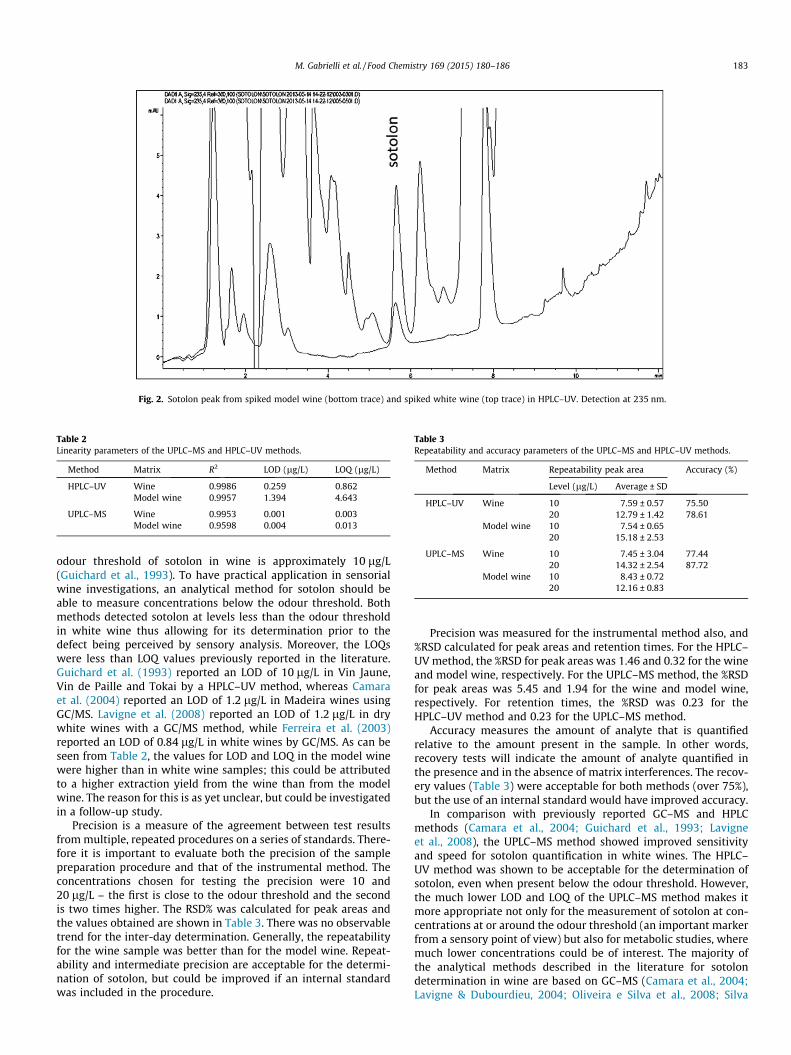
Fig. 2. Sotolon peak from spiked model wine (bottom trace) and spiked white wine (top trace) in HPLC–UV. Detection at 235 nm.
Table 3Repeatability and accuracy parameters of the UPLC–MS and HPLC–UV methods.
Method Matrix Repeatability peak area Accuracy (%)
Level (lg/L) Average ± SD
HPLC–UV Wine 10 7.59 ± 0.57 75.5020 12.79 ± 1.42 78.61
Model wine 10 7.54 ± 0.6520 15.18 ± 2.53
UPLC–MS Wine 10 7.45 ± 3.04 77.4420 14.32 ± 2.54 87.72
Model wine 10 8.43 ± 0.7220 12.16 ± 0.83
Table 2Linearity parameters of the UPLC–MS and HPLC–UV methods.
Method Matrix R2 LOD (lg/L) LOQ (lg/L)
HPLC–UV Wine 0.9986 0.259 0.862Model wine 0.9957 1.394 4.643
UPLC–MS Wine 0.9953 0.001 0.003Model wine 0.9598 0.004 0.013
M. Gabrielli et al. / Food Chemistry 169 (2015) 180–186 183
odour threshold of sotolon in wine is approximately 10 lg/L(Guichard et al., 1993). To have practical application in sensorialwine investigations, an analytical method for sotolon should beable to measure concentrations below the odour threshold. Bothmethods detected sotolon at levels less than the odour thresholdin white wine thus allowing for its determination prior to thedefect being perceived by sensory analysis. Moreover, the LOQswere less than LOQ values previously reported in the literature.Guichard et al. (1993) reported an LOD of 10 lg/L in Vin Jaune,Vin de Paille and Tokai by a HPLC–UV method, whereas Camaraet al. (2004) reported an LOD of 1.2 lg/L in Madeira wines usingGC/MS. Lavigne et al. (2008) reported an LOD of 1.2 lg/L in drywhite wines with a GC/MS method, while Ferreira et al. (2003)reported an LOD of 0.84 lg/L in white wines by GC/MS. As can beseen from Table 2, the values for LOD and LOQ in the model winewere higher than in white wine samples; this could be attributedto a higher extraction yield from the wine than from the modelwine. The reason for this is as yet unclear, but could be investigatedin a follow-up study.
Precision is a measure of the agreement between test resultsfrom multiple, repeated procedures on a series of standards. There-fore it is important to evaluate both the precision of the samplepreparation procedure and that of the instrumental method. Theconcentrations chosen for testing the precision were 10 and20 lg/L – the first is close to the odour threshold and the secondis two times higher. The RSD% was calculated for peak areas andthe values obtained are shown in Table 3. There was no observabletrend for the inter-day determination. Generally, the repeatabilityfor the wine sample was better than for the model wine. Repeat-ability and intermediate precision are acceptable for the determi-nation of sotolon, but could be improved if an internal standardwas included in the procedure.
Precision was measured for the instrumental method also, and%RSD calculated for peak areas and retention times. For the HPLC–UV method, the %RSD for peak areas was 1.46 and 0.32 for the wineand model wine, respectively. For the UPLC–MS method, the %RSDfor peak areas was 5.45 and 1.94 for the wine and model wine,respectively. For retention times, the %RSD was 0.23 for theHPLC–UV method and 0.23 for the UPLC–MS method.
Accuracy measures the amount of analyte that is quantifiedrelative to the amount present in the sample. In other words,recovery tests will indicate the amount of analyte quantified inthe presence and in the absence of matrix interferences. The recov-ery values (Table 3) were acceptable for both methods (over 75%),but the use of an internal standard would have improved accuracy.
In comparison with previously reported GC–MS and HPLCmethods (Camara et al., 2004; Guichard et al., 1993; Lavigneet al., 2008), the UPLC–MS method showed improved sensitivityand speed for sotolon quantification in white wines. The HPLC–UV method was shown to be acceptable for the determination ofsotolon, even when present below the odour threshold. However,the much lower LOD and LOQ of the UPLC–MS method makes itmore appropriate not only for the measurement of sotolon at con-centrations at or around the odour threshold (an important markerfrom a sensory point of view) but also for metabolic studies, wheremuch lower concentrations could be of interest. The majority ofthe analytical methods described in the literature for sotolondetermination in wine are based on GC–MS (Camara et al., 2004;Lavigne & Dubourdieu, 2004; Oliveira e Silva et al., 2008; Silva
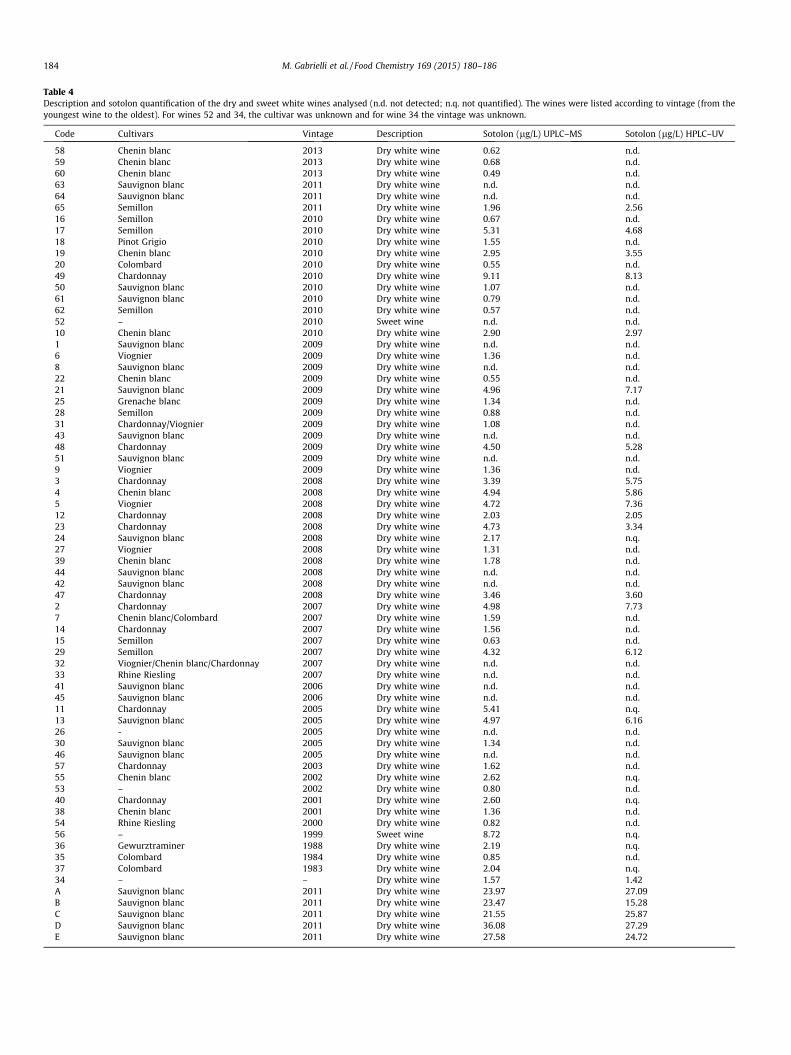
Table 4Description and sotolon quantification of the dry and sweet white wines analysed (n.d. not detected; n.q. not quantified). The wines were listed according to vintage (from theyoungest wine to the oldest). For wines 52 and 34, the cultivar was unknown and for wine 34 the vintage was unknown.
Code Cultivars Vintage Description Sotolon (lg/L) UPLC–MS Sotolon (lg/L) HPLC–UV
58 Chenin blanc 2013 Dry white wine 0.62 n.d.59 Chenin blanc 2013 Dry white wine 0.68 n.d.60 Chenin blanc 2013 Dry white wine 0.49 n.d.63 Sauvignon blanc 2011 Dry white wine n.d. n.d.64 Sauvignon blanc 2011 Dry white wine n.d. n.d.65 Semillon 2011 Dry white wine 1.96 2.5616 Semillon 2010 Dry white wine 0.67 n.d.17 Semillon 2010 Dry white wine 5.31 4.6818 Pinot Grigio 2010 Dry white wine 1.55 n.d.19 Chenin blanc 2010 Dry white wine 2.95 3.5520 Colombard 2010 Dry white wine 0.55 n.d.49 Chardonnay 2010 Dry white wine 9.11 8.1350 Sauvignon blanc 2010 Dry white wine 1.07 n.d.61 Sauvignon blanc 2010 Dry white wine 0.79 n.d.62 Semillon 2010 Dry white wine 0.57 n.d.52 – 2010 Sweet wine n.d. n.d.10 Chenin blanc 2010 Dry white wine 2.90 2.971 Sauvignon blanc 2009 Dry white wine n.d. n.d.6 Viognier 2009 Dry white wine 1.36 n.d.8 Sauvignon blanc 2009 Dry white wine n.d. n.d.22 Chenin blanc 2009 Dry white wine 0.55 n.d.21 Sauvignon blanc 2009 Dry white wine 4.96 7.1725 Grenache blanc 2009 Dry white wine 1.34 n.d.28 Semillon 2009 Dry white wine 0.88 n.d.31 Chardonnay/Viognier 2009 Dry white wine 1.08 n.d.43 Sauvignon blanc 2009 Dry white wine n.d. n.d.48 Chardonnay 2009 Dry white wine 4.50 5.2851 Sauvignon blanc 2009 Dry white wine n.d. n.d.9 Viognier 2009 Dry white wine 1.36 n.d.3 Chardonnay 2008 Dry white wine 3.39 5.754 Chenin blanc 2008 Dry white wine 4.94 5.865 Viognier 2008 Dry white wine 4.72 7.3612 Chardonnay 2008 Dry white wine 2.03 2.0523 Chardonnay 2008 Dry white wine 4.73 3.3424 Sauvignon blanc 2008 Dry white wine 2.17 n.q.27 Viognier 2008 Dry white wine 1.31 n.d.39 Chenin blanc 2008 Dry white wine 1.78 n.d.44 Sauvignon blanc 2008 Dry white wine n.d. n.d.42 Sauvignon blanc 2008 Dry white wine n.d. n.d.47 Chardonnay 2008 Dry white wine 3.46 3.602 Chardonnay 2007 Dry white wine 4.98 7.737 Chenin blanc/Colombard 2007 Dry white wine 1.59 n.d.14 Chardonnay 2007 Dry white wine 1.56 n.d.15 Semillon 2007 Dry white wine 0.63 n.d.29 Semillon 2007 Dry white wine 4.32 6.1232 Viognier/Chenin blanc/Chardonnay 2007 Dry white wine n.d. n.d.33 Rhine Riesling 2007 Dry white wine n.d. n.d.41 Sauvignon blanc 2006 Dry white wine n.d. n.d.45 Sauvignon blanc 2006 Dry white wine n.d. n.d.11 Chardonnay 2005 Dry white wine 5.41 n.q.13 Sauvignon blanc 2005 Dry white wine 4.97 6.1626 - 2005 Dry white wine n.d. n.d.30 Sauvignon blanc 2005 Dry white wine 1.34 n.d.46 Sauvignon blanc 2005 Dry white wine n.d. n.d.57 Chardonnay 2003 Dry white wine 1.62 n.d.55 Chenin blanc 2002 Dry white wine 2.62 n.q.53 – 2002 Dry white wine 0.80 n.d.40 Chardonnay 2001 Dry white wine 2.60 n.q.38 Chenin blanc 2001 Dry white wine 1.36 n.d.54 Rhine Riesling 2000 Dry white wine 0.82 n.d.56 – 1999 Sweet wine 8.72 n.q.36 Gewurztraminer 1988 Dry white wine 2.19 n.q.35 Colombard 1984 Dry white wine 0.85 n.d.37 Colombard 1983 Dry white wine 2.04 n.q.34 – – Dry white wine 1.57 1.42A Sauvignon blanc 2011 Dry white wine 23.97 27.09B Sauvignon blanc 2011 Dry white wine 23.47 15.28C Sauvignon blanc 2011 Dry white wine 21.55 25.87D Sauvignon blanc 2011 Dry white wine 36.08 27.29E Sauvignon blanc 2011 Dry white wine 27.58 24.72
184 M. Gabrielli et al. / Food Chemistry 169 (2015) 180–186
M. Gabrielli et al. / Food Chemistry 169 (2015) 180–186 185
Ferreira et al., 2003). The setting up of an analytical method allow-ing sotolon determination using HPLC–UV could represent analternative tool for oenological and cellar laboratories that do nothave routine access to GCMS.
3.3. Sotolon quantification in white wine
The methods developed were successfully applied for the deter-mination of sotolon levels in 65 South African white wines (sweetand dry). The sotolon concentrations as determined with theUPLC–MS and HPLC–UV methods are shown in Table 4.
Using the UPLC–MS method, the highest sotolon concentrationswere found in wine 49 (9.11 lg/L, dry, 2010) and 56 (8.72 lg/L,sweet, 1999). In both these wines, sotolon was close to thereported odour threshold. Using this method, sotolon was notdetected in 15 other wines, while it was lower than the odourthreshold for most of the wines analysed.
The HPLC–UV method also detected the highest sotolon concen-tration in wine 49 (8.13 lg/L), even though it was lower (�10.8%)than the concentration measured by ULPC–MS. Sotolon was notdetected in 42 wines using this method, 27 more than when usingthe UPLC–MS method, and was not quantifiable in seven wines,including wine 56. As expected, sotolon could be measured in morewines by UPLC–MS, due to the lower LOQ of the method, than byHPLC–UV. Moreover, due to the better selectivity of MS than UV,the measurement of sotolon with the UPLC–MS method did notsuffer from interference. The levels of sotolon marked as ‘‘notquantifiable’’ (Table 4) are for samples in which the measurementwas impeded by the presence of an interfering peak, which needsfurther investigation.
The sotolon content in wine is reported to be related to thewinemaking conditions, e.g. oxidative/reducing conditions, barrelageing (Cutzach et al., 1999; Schneider et al., 1998), as well asthe sugar content in the wine (Camara et al., 2004). However, thesotolon level in most of the South African wines was less thanthe odour threshold, even in wines containing sugar and/or thoseolder than 10 years. Thus, these levels were lower than those pre-viously reported (Camara et al., 2004; Guichard et al., 1993; Martinet al., 1992; Oliveira e Silva et al., 2008; Silva Ferreira et al., 2003).Dagan, Schneider, Lepoutre, and Baumes (2006) also found sotolonlevels in different older wines to be less than the odour threshold.However, five additional wines stored at a higher temperature(37 �C) for 2 years (wines a–e) had sotolon levels 1.5–3 timeshigher than the odour threshold (Table 4). This finding confirmsthe significant effect that temperature has on sotolon in whitewine (Cutzach et al., 1999).
This study, although performed on a limited number of whitewines, indicates that sotolon does not occur at concentrationshigher than the odour threshold in most South African wines andtherefore has a limited role in atypical ageing character. However,sotolon may contribute to the atypical ageing character of SouthAfrican white wines by acting in a synergistic manner witharoma-related compounds such as maltol, furaneol, homofuraneoland cyclotene (Dagan et al., 2006). This is a matter that needsfurther attention.
4. Conclusions
The analytical methods developed used sample preparationsteps that were quicker and easier to apply in practice than otherpreviously reported methods. The validation showed that theinstrumental methods (UPLC–MS and HPLC–UV) had good accu-racy, repeatability and were linear. The UPLC–MS method showedbetter sensitivity, but the repeatability was best for the HPLC–UVmethod. Even so, both methods were proven to be suitable forthe determination of sotolon below the sensory odour threshold
in most white wines. The two methods were used successfullyfor the screening of commercial South African wines. In general,sotolon does not occur in South African white wines at levelsgreater than the odour threshold. However, sotolon levels can beincreased in white wines stored for prolonged periods at hightemperatures.
Acknowledgements
We would like to extend our gratitude to Winetech, THRIP, andthe cellars that donated wine.
References
Blank, I., Lin, J., Fumeaux, R., Welti, D. H., & Fay, L. B. (1996). Formation of3-hydroxy-4,5-dimethyl-2(5H)-furanone (sotolone) from 4-hydroxy-L-isoleucine and 3-amino-4,5-dimethyl-3,4-dihydro-2(5H)-furanone. Journal ofAgricultural and Food Chemistry, 44, 1851–1856.
Blank, I., Sen, A., & Grosh, W. (1992). Potent odorants of the roasted powder andbrew of Arabica coffee. Z Lebensm Unters Forsh, 195, 239–245.
Camara, J. S., Marques, J. C., Alves, M. A., & Silva Ferreira, A. C. (2004). 3-Hydroxy-4,5-dimethyl-2(5H)-furanone levels in fortified Madeira wines: Relationship tosugar content. Journal of Agricultural and Food Chemistry, 52, 6765–6769.
Castro, C. C., Martins, R. C., Teixeira, J. A., & Silva Ferreira, A. C. (2014). Application ofa high-throughput process analytical technology metabolomics pipeline to Portwine forced ageing process. Food Chemistry, 143, 384–391.
Cutzach, I., Chatonnet, P., & Dubourdieu, D. (1999). Study of the formationmechanisms of some volatile compounds during the aging of sweet fortifiedwines. Journal of Agricultural and Food Chemistry, 1999(47), 2837–2846.
Dagan, L., Schneider, R., Lepoutre, J. P., & Baumes, R. (2006). Stability of sotolon inacidic and basic aqueous solutions application to the synthesis of a deuteratedanalogue for its quantitative determination in wine. Analytica Chimica Acta, 563,365–374.
Du Toit, W. J., Marais, J., Pretorius, I. S., & Du Toit, M. (2006). Oxygen in must andwine: A review. South African Journal of Enology and Viticulture, 27, 76–94.
Dubourdieu, D., & Lavigne, V. (2004) (cited 2011 Aug 24 infowine).Dugo, G., Franchina, F. A., Scandinaro, M. R., Bonaccorsi, I., Cicero, N., Tranchida, P.
Q., et al. (2014). Elucidation of the volatile composition of Marsala wines byusing comprehensive two-dimensional gas chromatography. Food Chemistry,142, 262–268.
Escudero, A., Cacho, J., & Ferreira, V. (2000). Isolation and identification of odorantsgenerated in wine during its oxidation: A gas chromatography–olfactometricstudy. European Food Research and Technology, 211, 105–110.
Ferreira, V., Jarauta, I., López, R., & Cacho, J. (2003). Quantitative determination ofsotolon, maltol and free furaneol in wine by solid-phase extraction and gaschromatography-ion-trap. Journal of Chromatography A, 1010, 95–103.
Ferreira, V., Ortega, L., Escudero, A., & Cacho, J. (2000). A comparative study of theability of different solvents and adsorbents to extract aroma compounds fromalcoholic beverages. Journal of Chromatographic Sciences, 38, 469–476.
Gabrielli, M. (2014). Chemical markers for the evaluation of sensory and antioxidantproperties of wines (Ph.D. thesis), Università degli Studi di Milano.
Gabrielli, M., Fracassetti, D., & Tirelli, A. (2014). UHPLC determination of sotolon inwine. Journal of Agricultural and Food Chemistry. http://dx.doi.org/10.1021/jf500508m.
Girardon, P., Sauvaire, Y., Baccou, J. C., & Bessiere, J. M. (1986). Identification de la3-hydroxy-4,5-dimethyl-2(5H)-furanone dans l’Arome des Graines de Fenugrec(Trigonella foenum graecum L.). Lebensmittel-Wissenschaft & Technologie, 19,44–46.
Guerra, P. V., & Yaylayan, V. A. (2011). Thermal generation of 3-amino-4,5-dimethylfuran-2(5H)-one, the postulated precursor of sotolone, from aminoacid model systems containing glyoxylic and pyruvic acids. Journal ofAgricultural and Food Chemistry, 59, 4699–4704.
Guichard, E., Pham, T. T., & Etiévant, P. (1993). Quantitative determination ofsotolon in wines by high-performance liquid chromatography.Chromatographia, 37, 539–542.
Hofmann, T., & Schieberle, P. (1997). Identification of potent aroma compounds inthermally treated mixtures of glucose/cysteine and rhamnose/cysteine usingaroma extract dilution techniques. Journal of Agricultural and Food Chemistry, 45,898–906.
Konig, T., Gutsche, B., Hartl, M., Hubscher, R., Schreier, P., & Schwab, W. (1999).3-Hydroxy-4,5-dimethyl-2(5H)-furanone (sotolon) causing an off-flavor:Elucidation of its formation pathways during storage of citrus soft drinks.Journal of Agricultural and Food Chemistry, 47, 3288–3291.
Lavigne, V., & Dubourdieu, D. (2004). Affinamento sulle fecce e freschezza dei vinibianchi. Vignevini, 31, 58–66.
Lavigne, V., Pons, A., Darriet, P., & Dubourdieu, D. (2008). Changes in the sotoloncontent of dry white wines during barrel and bottle aging. Journal of Agriculturaland Food Chemistry, 56, 2688–2693.
Martin, B., & Etiévant, P. (1991). Quantitative determination of solerone and sotolonin flor sherries by two-dimensional-capillary GC. Journal of High ResolutionChromatography, 14, 133–135.
186 M. Gabrielli et al. / Food Chemistry 169 (2015) 180–186
Martin, B., Etiévant, P. X., Le Quéré, J. L., & Schlich, P. (1992). More clues aboutsensory impact of sotolon in some flor sherry wines. Journal of Agricultural andFood Chemistry, 40, 475–478.
Masuda, M., Okawa, E., Nishimura, K., & Yunome, H. (1984). Identification of 4-5dimetil-3-idrossi-2(5H)-furanone (sotolon) and ethyl 9-hydroxynonanoate inbotrytised wine and evaluation of role of compounds characteristic of it.Agricultural Biology and Chemistry, 48(11), 2707–2710.
Oliveira e Silva, H., Guedes di Pinho, P., Machado, B. P., Hogg, T., Marques, J. C.,Camara, J. S., et al. (2008). Impact of forced-aging process on Madeira wineflavor. Journal of Agricultural and Food Chemistry, 56, 11989–11996.
Pham, T. T., Guichard, E., Schlich, P., & Charpentier, C. (1995). Optimal conditions forthe formation of sotolon from a-ketobutyric acid in the French vin Jaune. Journalof Agricultural and Food Chemistry, 43, 2616–2619.
Pons, A., Lavigne, V., Landais, Y., Darriet, P., & Dubourdieu, D. (2010). Identificationof a sotolon pathway in dry white wines. Journal of Agricultural and FoodChemistry, 58, 7273–7279.
Schneider, R., Baumes, R., Bayonove, C., & Razungles, A. (1998). Volatilecompounds involved in the aroma of sweet fortified wines (vins douxnaturels) from Grenache Noir. Journal of Agricultural and Food Chemistry, 46,3230–3237.
Silva Ferreira, A. C., Barbe, J. C., & Bertrand, A. (2003). 3-Hydroxy-4,5-dimethyl-2(5H)-furanone: A key odorant of the typical aroma of oxidative aged port wine.Journal of Agricultural and Food Chemistry, 51, 4356–4363.
Takahashi, K., Tadenuma, M., & Sato, S. (1976). 3-Hydroxy-4,5-dimethyl-2(5H)-furanone, a burnt flavoring compound from aged sake. Agricultural Biology andChemistry, 40(2), 325–330.
Tokitomo, Y., Kobayashi, A., Yamanishi, T., & Murahi, S. (1980). Studies on the‘‘sugary flavor’’ of raw cane sugar. III. Proceedings of the Japan Academy Series B,56.
Zea, L., Moyano, L., Ruiz, M. J., & Medina, M. (2013). Odor descriptors and aromaticseries during the oxidative aging of oloroso sherry wines. International Journal ofFood Properties, 16(7), 1534–1542.