determination of seismic design forces by equivalent...
TRANSCRIPT
Determination of seismic design forces byequivalent static load method1
JagMohan Humar and Mohamed A. Mahgoub
Abstract: In the proposed 2005 edition of the National Building Code of Canada (NBCC), the seismic hazard will berepresented by uniform hazard spectra corresponding to a 2% probability of being exceeded in 50 years. The seismicdesign base shear for use in an equivalent static load method of design will be obtained from the uniform hazard spec-trum for the site corresponding to the first mode period of the building. Because this procedure ignores the effect ofhigher modes, the base shear so derived must be suitably adjusted. A procedure for deriving the base shear adjustmentfactors for different types of structural systems is described and the adjustment factor values proposed for the 2005NBCC are presented. The adjusted base shear will be distributed across the height of the building in accordance withthe provisions in the current version of the code. Since the code-specified distribution is primarily based on the firstmode vibration shape, it leads to an overestimation of the overturning moments, which should therefore be suitably ad-justed. Adjustment factors that must be applied to the overturning moments at the base and across the height are de-rived for different structural shapes, and the empirical values for use in the 2005 NBCC are presented.
Key words: uniform hazard spectrum, seismic design base shear, equivalent static load procedure, higher mode effects,base shear adjustment factors, distribution of base shear, overturning moment adjustment factors.
Résumé : Dans l’édition 2005 proposée du Code National du Bâtiment du Canada (CNBC), le risque sismique sera re-présenté par un spectre de risque uniforme pour lequel la probabilité d’être dépassé en 50 ans est de 2 %. La valeur ducisaillement de base utilisée par la méthode de construction parasismique à charge statique équivalente sera obtenue àpartir du spectre de risque uniforme du site correspondant à la période du premier mode du bâtiment. Puisque cetteprocédure ignore l’effet des modes supérieurs, le cisaillement de base ainsi dérivé doit être ajusté convenablement. Uneprocédure permettant de dériver les facteurs d’ajustement du cisaillement de base, pour les différents types de systèmesstructuraux, est décrite, et les valeurs du facteur d’ajustement proposées pour le CNBC sont présentées. Le cisaillementde base ajusté sera distribué sur toute la hauteur du bâtiment, en accord avec les clauses de la version actuelle du code.Puisque la distribution spécifiée par le code est basée en premier lieu sur la forme du premier mode de vibration, celamène à une surestimation des moments de renversement, lesquels devraient donc être ajustés convenablement. Les fac-teurs d’ajustement qui doivent être appliqués aux moments de renversement localisés à la base du bâtiment et sur toutesa hauteur sont dérivés, ce pour différentes formes structurales, et les valeurs empiriques à utiliser dans le CNBC 2005sont présentées.
Mots clés : spectre de risque uniforme, cisaillement de base d’une construction parasismique, procédure de charge sta-tique équivalente, effets d’un mode supérieur, facteurs d’ajustement du cisaillement de base, distribution du cisaillementde base, facteurs d’ajustement du moment de renversement.
[Traduit par la Rédaction] Humar and Mahgoub 307
Introduction
The response of a structure to earthquake-induced forcesis a dynamic phenomenon. Consequently, a realistic assess-
ment of the design forces can be obtained only through a dy-namic analysis of the building models. Although this haslong been recognized, dynamic analysis is used only infre-quently in routine design, because such an analysis is bothcomplicated and time-consuming. A major complicationarises from the fact that most structures are designed withthe expectation that they would be strained into the inelasticrange when subjected to the design earthquake. Although theability to carry out a nonlinear analysis has seen significantimprovement over recent years, considerable uncertaintypersists in modelling the nonlinear behaviour of structuralmaterials and components. In addition, nonlinear response totwo different ground motions may differ significantly, evenwhen such ground motions produce similar elastic re-sponses. This means that for the purpose of obtaining designforces, nonlinear analysis must be repeated for several dif-ferent ground motion records that are representative of theseismicity of the site.
Can. J. Civ. Eng. 30: 287–307 (2003) doi: 10.1139/L02-067 © 2003 NRC Canada
287
Received 5 December 2001. Revision accepted 1 August2002. Published on the NRC Research Press Web site athttp://cjce.nrc.ca on 4 April 2003.
J. Humar2 and M.A. Mahgoub. Department of Civil andEnvironmental Engineering, Carleton University,1125 Colonel By Drive, Ottawa, ON K1S 5B6, Canada.
Written discussion of this article is welcomed and will bereceived by the Editor until 31 August 2003.
1This article is one of a selection of papers published in thisSpecial Issue on the Proposed Earthquake DesignRequirements of the National Building Code of Canada,2005 edition.
2Corresponding author (e-mail: [email protected]).
I:\cjce\cjce3002\L02-067.vpMonday, March 31, 2003 3:03:55 PM
Color profile: DisabledComposite Default screen

© 2003 NRC Canada
288 Can. J. Civ. Eng. Vol. 30, 2003
In view of the difficulties associated with nonlinear analy-sis, linear dynamic analysis is often carried out to determinethe design forces. Computer programs that are capable ofcarrying out a linear dynamic analysis, either a time-historyanalysis or a mode-superposition analysis, are widely avail-able, and designers are becoming increasingly comfortablein using them. In view of these facts, the proposed 2005 edi-tion of the National Building Code of Canada (NBCC) willrecognize dynamic analysis as the preferred procedure forobtaining the design forces and, in fact, make such analysismandatory for all irregular structures except those of lowheight or located in zones of low seismicity. Dynamic analy-sis will also be mandatory for structures that are regular buttall and are located in zones of high seismicity. Saatciogluand Humar (2003) discuss the code provisions related to dy-namic analysis.
The 2005 NBCC will continue to permit the use of anequivalent static load procedure for the following class ofstructures: (i) structures located in zones of low seismicitywhere IeFaSa(0.2) is less than 0.35, Ie being the importancefactor, Fa the acceleration-related foundation factor, andSa(0.2) the uniform hazard spectral response acceleration inunits of g, the gravity constant, corresponding to a period of0.2 s; (ii) regular structures, located in any seismic zone, thatare less than 60 m in height and have a fundamental lateralperiod less than 2 s; and (iii) irregular structures, located inany seismic zone, that are less than 20 m height, have a fun-damental lateral period less than 0.5 s, and are not torsion-ally sensitive.
The equivalent static load procedure proposed for the2005 NBCC is similar to that in the 1995 NBCC (NBCC1995). In the 2005 NBCC, however, the seismic hazard at asite will be represented by a uniform hazard spectrum (UHS)and not by an idealized response spectrum as in the 1995NBCC. The equivalent static load procedure should there-fore be appropriately revised so as to be used in associationwith a UHS. This paper provides details of the revisions pro-posed to the equivalent static load procedure.
The proposed revisions to the NBCC described in this pa-per have been developed by the authors for the CanadianNational Committee of Earthquake Engineering (CANCEE)and reflect the current views of that committee. Revisions toother aspects of the NBCC and discussion of several issuesrelated to the provisions described in this paper appear in aseries of related papers in this issue of the Journal.
Design spectral acceleration curve
The seismic design force for an elastic single-degree-of-freedom (SDOF) system having a specified period anddamping can be derived from the spectral acceleration that
the system is likely to experience. The design value of thespectral acceleration depends on the seismic hazard at thesite. In the 1995 NBCC the seismic hazard was expressed interms of the peak ground acceleration and peak ground ve-locity at the site with a 10% probability of being exceededin 50 years. A design response spectrum was constructed byapplying appropriate amplification factors to the ground mo-tion bounds. For use in the equivalent static load method ofdesign, the resulting response spectrum was approximatedby a set of empirical expressions.
The seismic hazard calculations for the 1995 NBCC werebased on historic data of earthquakes up to the year 1985.Since then, additional data have become available on earth-quake events, both Canadian and foreign. Also, new groundmotion relations that describe how shaking varies with mag-nitude and distance have been developed. Taking into ac-count these developments and the innovations in hazardcalculation methodology, the Geological Survey of Canadahas produced new seismic hazard maps for the country. Thehazard is now expressed in terms of site-specific spectral ac-celeration values at selected values of the period and 5%damping. The curve passing through such values is referredto as a uniform hazard spectrum (UHS). The UHS for a siteprovides the maximum spectral acceleration that an SDOFsystem located at the site and having 5% damping is likelyto experience during the entire range of earthquakes that itmay be exposed to. It is proposed that the probability ofexceedance to be used in the derivation of the uniform haz-ard spectra be 2% in 50 years (Adams and Halchuk 2003).
In the Geological Survey of Canada calculations of uni-form hazard spectra, spectral acceleration values have beendetermined for eight different period values ranging from 0.1to 2.0 s (Adams and Halchuk 2003). For use with the 2005NBCC, however, the UHS will be defined through the spec-tral acceleration values at only four periods, namely 0.2, 0.5,1.0, and 2.0 s, specified in the table of climatic data for mostcities throughout Canada. Adams and Atkinson (2003) pro-vide detailed discussions on hazard calculation, probabilityof exceedance, and development of UHS.
The Geological Survey of Canada uniform hazard spectraare derived for a specific reference ground condition andhave to be modified for cases where the ground condition isdifferent from the reference condition. The provisions re-lated to foundation soil effects, described in another paper inthis series (Finn and Wightman 2003), specify two differentsoil amplification factors, an acceleration-related factor Faand a velocity-related factor Fv. Using these amplificationfactors, the design spectral acceleration value S(T) is derivedfrom the uniform hazard spectral response acceleration forreference ground condition, Sa(T), as follows:
[1]
S(T) F S T
S(T) F S F S
= ≤a a
v a a a
0.2 for 0.2 s
= 0.5 or 0.2 w
( )
( ) ( ), hichever is smaller, for 0.5 s
2.0 for 2.0 sv a
T
S(T) F S T
== =( )
S(T) F S T
S(T) F S T
= ≥=
v a
v a
2.0 for 4.0 s
= 1.0 for 1.0 s
( )/
( )
2
I:\cjce\cjce3002\L02-067.vpMonday, March 31, 2003 3:03:57 PM
Color profile: DisabledComposite Default screen
where T is the period of the SDOF system. A linear interpo-lation must be used for intermediate values of T.
It will be noted that for T ≤ 0.2 s the spectral accelerationcurve has a plateau. In reality, for T < 0.2 s, the spectral ac-celeration values generally decrease with the period. It isstandard practice, however, to replace the descending branchfor T < 0.2 s by a plateau, because when a structure having aperiod T < 0.2 s softens during an earthquake it experiencesan elongation in its period and may therefore attract in-creased seismic forces. A plateau is also used for T > 4.0 s.This is because of a lack of sufficient seismological dataneeded to obtain the uniform hazard spectral values for thisrange. In fact, even the spectral acceleration values for T =4.0 s have not been obtained by the same rigorous procedureas that used for T ≤ 2.0 s. The proposed spectral shape forperiods between 2.0 and 4.0 s can therefore be considered asonly approximate.
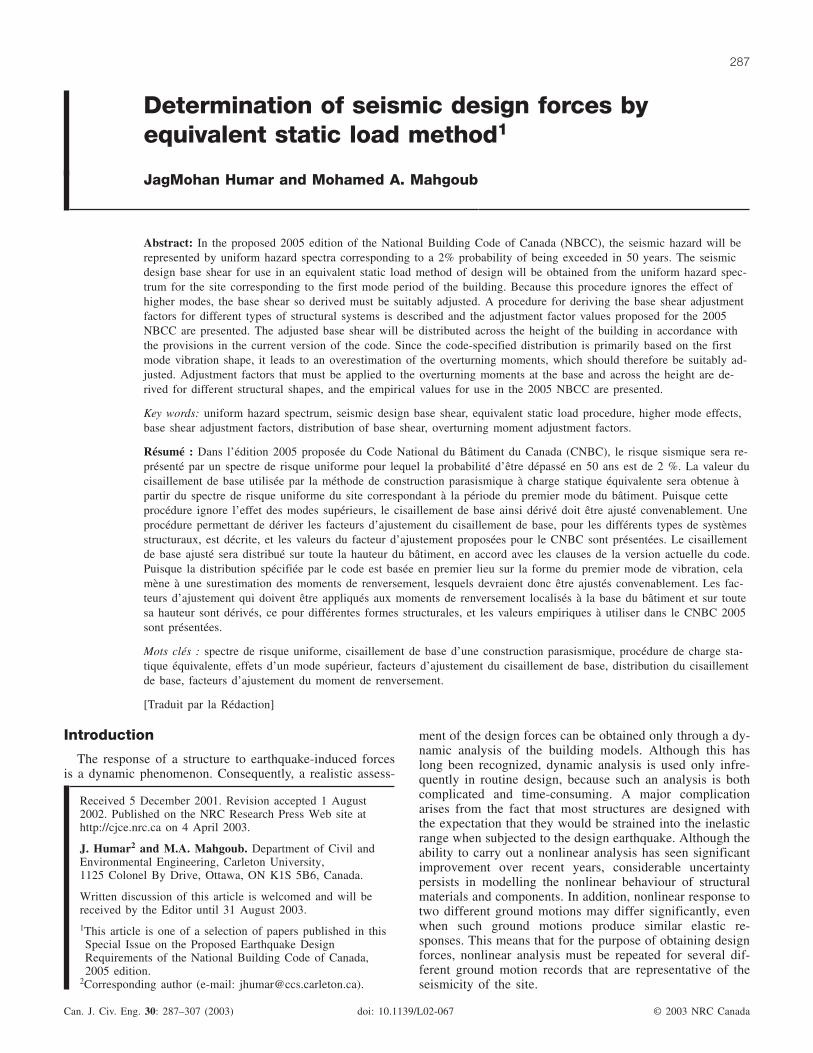
For the purpose of comparison, the uniform hazard spec-tra for Vancouver and Montréal are drawn in Fig. 1 for twodifferent soil types, soil class C, which is the reference soilwith Fa = Fv = 1.0, and soil class D, which is a softer soil.
Base shear formulationThe elastic base shear Ve produced in an SDOF structure
of period T can be obtained from the UHS for the site by us-ing the following equation:
[2] Ve = S(T)W
where W is the weight of the structure at the time of theearthquake. In the 2005 NBCC, eq. [2] is modified as fol-lows to obtain the design base shear V in a structure thatmay have one or more degrees of freedom:
[3] VS T M IW
R RS M I W
R R= ≥( ) ( )a v
o d
v e
o d
2.0
where Ta is the first mode period of the structure, Mv is thebase shear adjustment factor, Ro is the overstrength factor,and Rd is the ductility factor. The proposal also specifies thatfor structures with Rd ≥ 1.5, V need not be taken as beinggreater than two thirds of the value calculated for Ta = 0.2 s.Thus
[4] VS I W
R R≤ 2
3( )0.2 e
d o
The rationale for the lower limit specified in eq. [3] is asfollows. The Geological Survey of Canada has suppliedspectral acceleration values for periods greater than 2.0 s.These values have been derived by an indirect procedure,however, and there is considerable uncertainty associatedwith them. It is therefore proposed that for the purpose ofdetermining the design base shear the spectral accelerationsfor periods greater than 2.0 s should be taken as equal to thatat Ta = 2.0 s. The rationale for specifying the upper limit ineq. [4] has been described by Heidebrecht (2003).
In eq. [3], Ie is a factor that depends on the importancecategory of the building. For normal buildings and buildingsof low human occupancy, Ie is assigned a value of 1.0. Forbuildings that are likely to be used as post-disaster shelters,for example schools and community centres, and for manu-
facturing and storage facilities containing toxic, explosive,or other hazardous substances, Ie is taken as 1.3. For post-disaster buildings, such as hospitals, telephone exchanges,power generating stations, water and sewage treatment facil-ities, and fire and police stations, Ie is assigned a value of1.5. A value of Ie greater than 1 ensures that the ductility de-mand imposed on the structure by the design earthquake islower, reducing the amount of inelastic deformation, yield-ing, and cracking, so any damage to the building is lesslikely to impair the functioning of the facility housed in thebuilding or to release any toxic or hazardous substance con-tained in the building. Factor Ie is similar to I in the 1995NBCC.
Factor Rd is used to reduce the design forces in recogni-tion of the fact that a ductile structure designed for suchlower forces is able to dissipate the energy input by theearthquake through inelastic deformation without collapsing.The value of Rd is dependent on the ductility capacity of thestructure. The factor Ro is also used to reduce the designforces but is meant to take into account the dependableoverstrength known to exist in structures designed accordingto the code provisions. Together, factors Ro and Rd replacethe factor R/U in the 1995 NBCC. The ductility factor Rdand the overstrength factor Ro and their recommended valuesare described in detail in another paper in this series (Mitch-ell et al. 2003). The factor Mv, which does not exist in the1995 NBCC, is meant to account for higher mode effectspresent in a multistorey building. It is discussed in detail inthe subsequent sections of this paper.
The application of eq. [3] requires that an estimate of thefundamental period Ta be available. The 2005 NBCC provi-sions for determining the fundamental period are discussedin another paper in this series (Saatcioglu and Humar 2003).
Use of a uniform hazard spectrum in modalanalysis
It is important to distinguish between a UHS and a classi-cal response spectrum. A classical response spectrum pro-
© 2003 NRC Canada
Humar and Mahgoub 289
Fig. 1. Elastic uniform hazard spectra for Montréal and Vancouver.
I:\cjce\cjce3002\L02-067.vpMonday, March 31, 2003 3:03:58 PM
Color profile: DisabledComposite Default screen

vides the maximum response of an SDOF elastic oscillatorhaving a range of values of period and specified damping toa single earthquake ground motion. On the other hand, aUHS represents a composite of maximum spectral responsesfor given damping at different periods. The spectral valuesat different periods, and even at the same period, may arisefrom earthquakes having different distances to source anddifferent magnitudes but the same annual probability ofexceedance. In general, the short-period UHS values aredominated by earthquakes at close distances, whereas thelong-period values are contributed by more distant earth-quakes.
It is evident that, as contrasted to a classical responsespectrum, a UHS does not correspond to a single earthquake.Thus if a simulated time history is generated to match theUHS, it will correspond to a simultaneous occurrence of anumber of potentially damaging events and would thereforebe unrealistic. In other words, a number of different timehistories must be generated to match the different regions ofUHS. Atkinson and Beresnev (1998) have produced physi-cally realistic time histories that not only match the hazardspectrum but also are representative of motions correspond-ing to the magnitude source distance scenarios for the site.They have also shown that a UHS can be adequatelymatched with just two types of earthquakes: a lower magni-tude, smaller distance earthquake to match the short-periodpart of the spectrum, and a larger magnitude, greater dis-tance earthquake to match the long-period part of the spec-trum.
According to Atkinson and Beresnev (1998), the UHS for2% probability of exceedance in 50 years can be approxi-mated in the case of eastern Canadian locations by M6.0events for short-period ranges and M7.0 events for long-period ranges, and in the case of western Canadian locationsby M6.5 events for short-period ranges and M7.2 events forlong-period ranges. The distances at which these events areplaced depend on the seismicity of the site. Figure 2 showsthe spectra for the two sets of UHS-compatible records gen-erated by Atkinson and Beresnev for Montréal. One of thetwo sets is for the short-period range and the other is for thelong-period range. In each set there are four different groundmotion records. For each set the spectrum plotted in Fig. 2 isan average of the spectra of the four ground motions in theset. For the purpose of comparison, the UHS values are alsoshown in Fig. 2.
If modal superposition is used to obtain the response of amultistorey building located in Montréal, for example, atleast two sets of analyses would be required, one with eachof the two simulated spectra shown in Fig. 2. The larger ofthe response values obtained from the two analyses wouldprovide the design forces. For illustration, consider a shearwall structure located in Montréal. The first two modal peri-ods of the structure are 1.00 and 0.159 s, respectively, as in-dicated in Fig. 2. Considering only the first two modes, amodal superposition analysis in which the resultant responseis obtained by taking the square root of the sum of thesquares (SRSS) of modal responses gives a base shear equalto 0.630W when the long-period spectrum shown by a bro-ken line is used and 0.730W when the short-period spectrumshown by solid line is used. The design shear can thus betaken as 0.730W. Now if the envelope of the two spectra,
which is representative of UHS, is used in the mode super-position analysis, the base shear works out to 0.742W. In thepresent example, use of UHS in a mode superposition analy-sis overestimates the base shear by 1.6%.
Because a UHS can be considered as the envelope ofmaximum spectral acceleration values produced by differentearthquakes, it is apparent that the use of UHS in a mode su-perposition analysis would lead to conservative results. Forthe spectra shown in Fig. 2 this is so whenever the period islonger than that at the crossover point, that is, longer thanabout 0.40 s. The degree of conservatism is not large, how-ever. A number of calculations, similar to those illustratedearlier, for different regions of the country have shown thatthe overestimate is no more than 10% and in most cases issignificantly smaller. This degree of conservatism is for mostpractical purposes quite insignificant. It is therefore accept-able to use a UHS in carrying out a mode superpositionanalysis, and this assumption has been made in arriving atthe results presented in the remaining parts of this paper.
The discussion in this section is limited to the use of UHSfor a planar response spectral analysis. The application ofsuch an analysis to asymmetric buildings where modal cou-pling may occur between torsion and translation is discussedin a companion paper in this issue (Humar et al. 2003). Itshould also be noted that the 2005 NBCC will not permit theuse of the equivalent static load method for determining thedesign forces in a torsionally sensitive building, in whichstrong modal coupling may exist (Humar et al. 2003; DeVall2003)
Effect of higher modes on base shear
In a multistorey building all vibration modes of the build-ing contribute to the base shear. For an elastic structure, therelative contribution of higher modes depends on the spec-tral shape and on two dynamic characteristics of the system:(i) the relative values of the modal periods, and (ii) themodal weights for different modes. The two sets of charac-teristics, in turn, depend on the structural type. For an illus-tration of these observations consider two widely different
© 2003 NRC Canada
290 Can. J. Civ. Eng. Vol. 30, 2003
Fig. 2. Short- and long-period acceleration response spectra forMontréal. UHS, uniform hazard spectra.
I:\cjce\cjce3002\L02-067.vpMonday, March 31, 2003 3:04:00 PM
Color profile: DisabledComposite Default screen
structural types, a shear cantilever representing a shearframe and a flexural cantilever representing a flexural wall.In terms of the dynamic characteristics noted earlier, moststructural types will fall between the two extremes. The rela-tive modal periods and modal weights for the first fivemodes of the two structural types are shown in Table 1.Now consider a building structure with first mode period of1.50 s, and for simplicity assume that contributions fromonly the first two modes are significant. The first and secondmode periods for structures of the two different types, andthe corresponding spectral acceleration values are indicatedin Fig. 1. The second mode period of the flexural cantileveris 0.25 s, and that of the shear cantilever is 0.50 s. Using thespectral accelerations obtained from UHS, the design shearsfor buildings of two different structural types and two differ-ent locations, Vancouver and Montréal, have been calculatedand are shown in Table 2. For the shear cantilever buildingin Vancouver, the first mode contributes a major portion ofthe base shear; the second mode contribution is only 0.28times the first mode contribution. The base shear estimateobtained by taking SRSS of the modal contributions issmaller than that if the entire response is assumed to be inthe first mode, and an adjustment factor, Mv = 0.84, must beapplied to the latter to obtain a more precise value. For asimilar building located in Montréal, the first mode contribu-tion would still be higher than that in the second mode, butcompared with the building in Vancouver the second modemakes a more significant contribution, as much as 0.41times that of the first mode. This difference is related to thespectral shape. Compared with Vancouver, the spectral ac-celeration for Montréal drops more rapidly with an increasein period, so the spectral acceleration in the second mode isproportionally larger for Montréal. The adjustment factor Mvto be applied to the estimate based on the first mode alonenow works out to 0.90.
For a flexural wall building located in Vancouver, the sec-ond mode contribution is larger than the first mode contribu-tion. This is because in a wall structure the separationbetween the modal periods is comparatively large, the sec-ond mode period being only 0.167 times the first mode pe-riod, compared with 0.333 times the first mode period in ashear frame structure. This, combined with the shape of thedesign spectrum, whereby the spectral acceleration dropsfairly rapidly with an increase in the period, leads to a sig-nificantly higher spectral acceleration for the second andhigher modes compared with that for the first mode. In addi-tion, when compared with a shear frame, the modal weightfor the second mode of a flexural wall constitutes a largerproportion of the total weight. A higher spectral acceleration
and a higher modal weight together lead to a larger contribu-tion from the second mode. The adjustment factor Mv to beapplied to the response based on first mode alone is still lessthan 1.
When the flexural wall building is located in Montréal,the second mode contribution is substantially higher than thefirst mode contribution. This is because of (i) the rapidlydropping spectral shape for Montréal, (ii) the larger separa-tion between modal periods, and (iii) the larger modalweight for the second period. The combined effect of allthese factors is such that the adjustment factor Mv works outto 1.35. The foregoing discussion indicates quite clearly thatthe base shear obtained by using the spectral accelerationvalue in the UHS corresponding to the first mode periodneeds to be modified by a factor Mv to get a more precise es-timate of the elastic response.
Methodology for estimating the shearadjustment factors
Humar and Rahgozar (2000) have studied the variation ofMv factors for frame and wall models for two locations, Van-couver and Montréal. In their study they used the UHS forthese two cities and carried out response spectrum analysesfor determining Mv factors. In the present paper this studyhas been extended in the following manner. First, severaldifferent structural configurations, other than a frame and awall, are considered. These are braced frames, coupled wallsystems, and hybrid systems comprising moment frame anda wall. Second, studies have been carried out for 22 differentcities, 10 located in the western region of Canada and 12 inthe eastern region. A list of the cities included in this studyand complete spectral acceleration data for such cities areprovided by Adam et al. (1999).
In the present study the structure is assumed to remainelastic. Based on this assumption, the adjustment factor tobe applied to the base shear obtained by assuming that theentire response is in the first mode is given by
[5] MS T W
S T W
i iv
a
a
= ∑ [ ( ) ]
( )
2
1
where Sa(Ti) is the spectral acceleration corresponding to theith mode having a period Ti, Wi is the modal weight in theith mode, and W is the total weight of the structure. Ineq. [5] the base shear obtained by taking the square root ofthe sum of squares of modal base shears is assumed to be areasonably close estimate of the true value. It is evident fromeq. [5] that for a given spectral shape the Mv factor dependson only the modal periods and modal weights.
Description of structural models
A simplified symmetric multistorey building model is se-lected for the present study. The building floors are assumedto be infinitely rigid in their own planes. The torsional ef-fects are neglected so that the response of the building canbe studied by analysing a single planar frame. For the pur-pose of this study the building model is assumed to consistof two identical parallel single-bay frames. The entire massof the structure is assumed to be uniformly distributed at the
© 2003 NRC Canada
Humar and Mahgoub 291
Flexural cantilever Shear cantilever
Mode PeriodModalweight Period
Modalweight
1 1.000 0.616 1.000 0.8112 0.167 0.188 0.333 0.093 0.057 0.065 0.200 0.034 0.030 0.032 0.143 0.025 0.018 0.020 0.111 0.01
Table 1. Relative modal periods and modal weightsfor flexural and shear cantilevers.
I:\cjce\cjce3002\L02-067.vpMonday, March 31, 2003 3:04:02 PM
Color profile: DisabledComposite Default screen
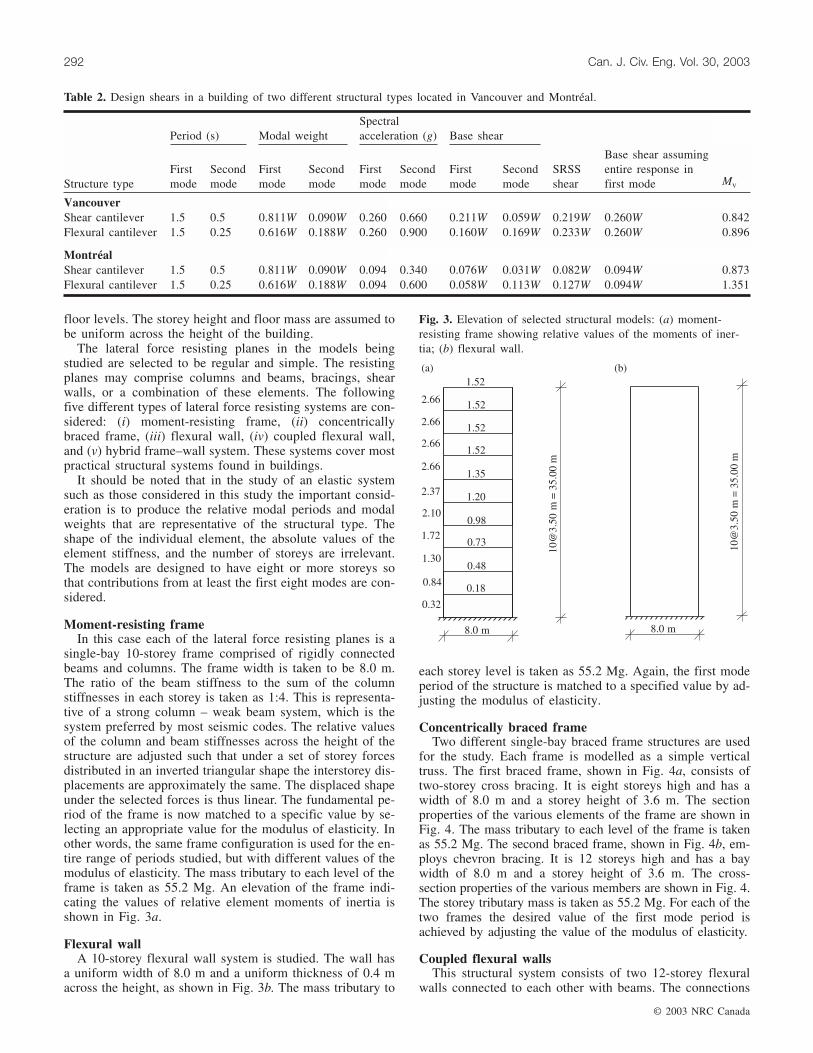
floor levels. The storey height and floor mass are assumed tobe uniform across the height of the building.
The lateral force resisting planes in the models beingstudied are selected to be regular and simple. The resistingplanes may comprise columns and beams, bracings, shearwalls, or a combination of these elements. The followingfive different types of lateral force resisting systems are con-sidered: (i) moment-resisting frame, (ii) concentricallybraced frame, (iii) flexural wall, (iv) coupled flexural wall,and (v) hybrid frame–wall system. These systems cover mostpractical structural systems found in buildings.
It should be noted that in the study of an elastic systemsuch as those considered in this study the important consid-eration is to produce the relative modal periods and modalweights that are representative of the structural type. Theshape of the individual element, the absolute values of theelement stiffness, and the number of storeys are irrelevant.The models are designed to have eight or more storeys sothat contributions from at least the first eight modes are con-sidered.
Moment-resisting frameIn this case each of the lateral force resisting planes is a
single-bay 10-storey frame comprised of rigidly connectedbeams and columns. The frame width is taken to be 8.0 m.The ratio of the beam stiffness to the sum of the columnstiffnesses in each storey is taken as 1:4. This is representa-tive of a strong column – weak beam system, which is thesystem preferred by most seismic codes. The relative valuesof the column and beam stiffnesses across the height of thestructure are adjusted such that under a set of storey forcesdistributed in an inverted triangular shape the interstorey dis-placements are approximately the same. The displaced shapeunder the selected forces is thus linear. The fundamental pe-riod of the frame is now matched to a specific value by se-lecting an appropriate value for the modulus of elasticity. Inother words, the same frame configuration is used for the en-tire range of periods studied, but with different values of themodulus of elasticity. The mass tributary to each level of theframe is taken as 55.2 Mg. An elevation of the frame indi-cating the values of relative element moments of inertia isshown in Fig. 3a.
Flexural wallA 10-storey flexural wall system is studied. The wall has
a uniform width of 8.0 m and a uniform thickness of 0.4 macross the height, as shown in Fig. 3b. The mass tributary to
each storey level is taken as 55.2 Mg. Again, the first modeperiod of the structure is matched to a specified value by ad-justing the modulus of elasticity.
Concentrically braced frameTwo different single-bay braced frame structures are used
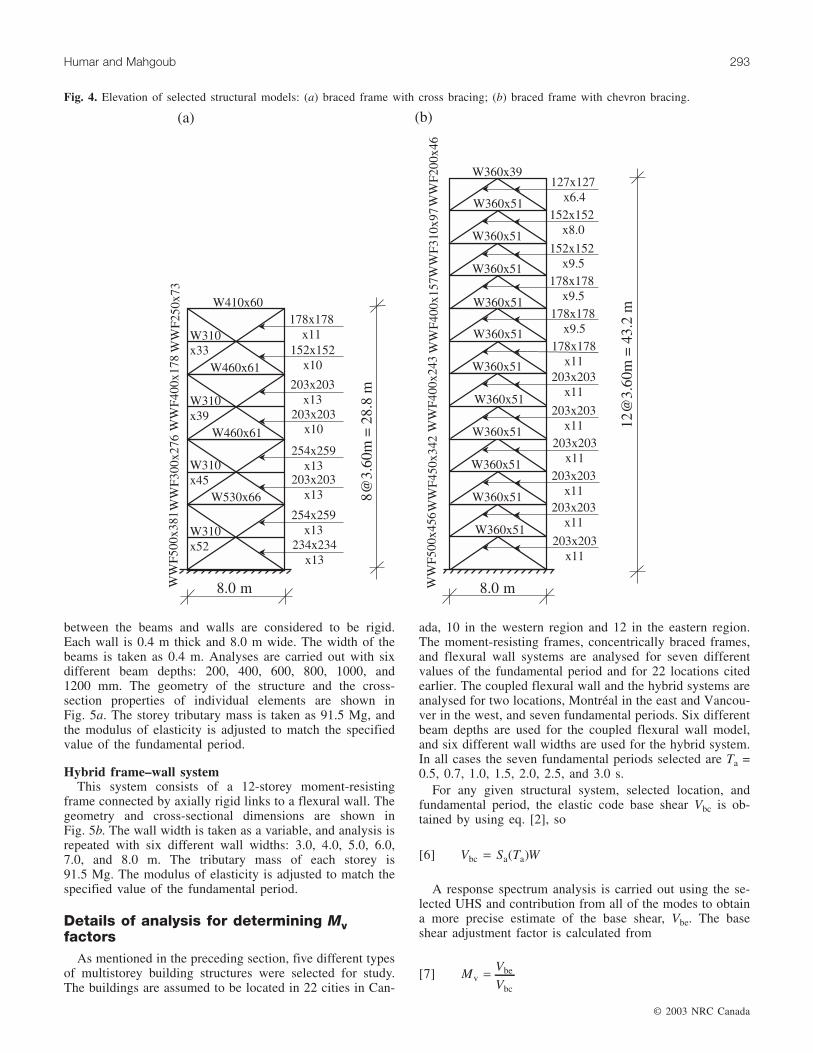
for the study. Each frame is modelled as a simple verticaltruss. The first braced frame, shown in Fig. 4a, consists oftwo-storey cross bracing. It is eight storeys high and has awidth of 8.0 m and a storey height of 3.6 m. The sectionproperties of the various elements of the frame are shown inFig. 4. The mass tributary to each level of the frame is takenas 55.2 Mg. The second braced frame, shown in Fig. 4b, em-ploys chevron bracing. It is 12 storeys high and has a baywidth of 8.0 m and a storey height of 3.6 m. The cross-section properties of the various members are shown in Fig. 4.The storey tributary mass is taken as 55.2 Mg. For each of thetwo frames the desired value of the first mode period isachieved by adjusting the value of the modulus of elasticity.
Coupled flexural wallsThis structural system consists of two 12-storey flexural
walls connected to each other with beams. The connections
© 2003 NRC Canada
292 Can. J. Civ. Eng. Vol. 30, 2003
Period (s) Modal weightSpectralacceleration (g) Base shear
Structure typeFirstmode
Secondmode
Firstmode
Secondmode
Firstmode
Secondmode
Firstmode
Secondmode
SRSSshear
Base shear assumingentire response infirst mode Mv
VancouverShear cantilever 1.5 0.5 0.811W 0.090W 0.260 0.660 0.211W 0.059W 0.219W 0.260W 0.842Flexural cantilever 1.5 0.25 0.616W 0.188W 0.260 0.900 0.160W 0.169W 0.233W 0.260W 0.896
MontréalShear cantilever 1.5 0.5 0.811W 0.090W 0.094 0.340 0.076W 0.031W 0.082W 0.094W 0.873Flexural cantilever 1.5 0.25 0.616W 0.188W 0.094 0.600 0.058W 0.113W 0.127W 0.094W 1.351
Table 2. Design shears in a building of two different structural types located in Vancouver and Montréal.
Fig. 3. Elevation of selected structural models: (a) moment-resisting frame showing relative values of the moments of iner-tia; (b) flexural wall.
I:\cjce\cjce3002\L02-067.vpMonday, March 31, 2003 3:04:04 PM
Color profile: DisabledComposite Default screen
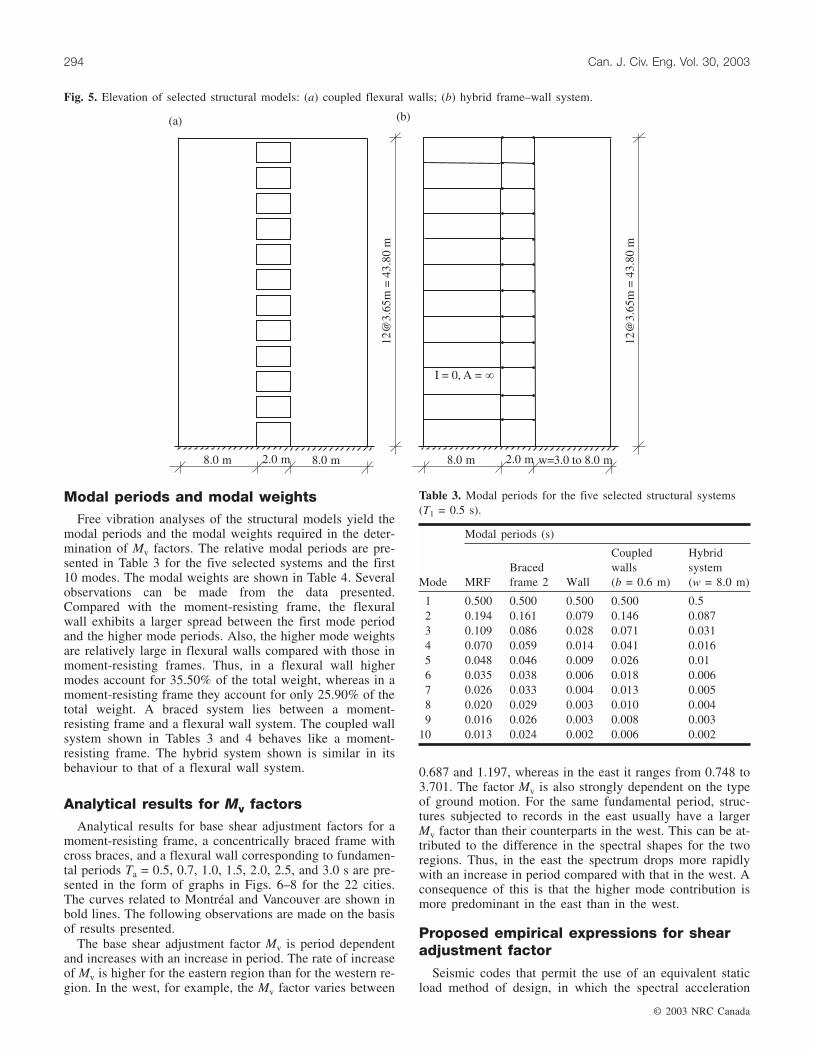
between the beams and walls are considered to be rigid.Each wall is 0.4 m thick and 8.0 m wide. The width of thebeams is taken as 0.4 m. Analyses are carried out with sixdifferent beam depths: 200, 400, 600, 800, 1000, and1200 mm. The geometry of the structure and the cross-section properties of individual elements are shown inFig. 5a. The storey tributary mass is taken as 91.5 Mg, andthe modulus of elasticity is adjusted to match the specifiedvalue of the fundamental period.
Hybrid frame–wall systemThis system consists of a 12-storey moment-resisting
frame connected by axially rigid links to a flexural wall. Thegeometry and cross-sectional dimensions are shown inFig. 5b. The wall width is taken as a variable, and analysis isrepeated with six different wall widths: 3.0, 4.0, 5.0, 6.0,7.0, and 8.0 m. The tributary mass of each storey is91.5 Mg. The modulus of elasticity is adjusted to match thespecified value of the fundamental period.
Details of analysis for determining Mvfactors
As mentioned in the preceding section, five different typesof multistorey building structures were selected for study.The buildings are assumed to be located in 22 cities in Can-
ada, 10 in the western region and 12 in the eastern region.The moment-resisting frames, concentrically braced frames,and flexural wall systems are analysed for seven differentvalues of the fundamental period and for 22 locations citedearlier. The coupled flexural wall and the hybrid systems areanalysed for two locations, Montréal in the east and Vancou-ver in the west, and seven fundamental periods. Six differentbeam depths are used for the coupled flexural wall model,and six different wall widths are used for the hybrid system.In all cases the seven fundamental periods selected are Ta =0.5, 0.7, 1.0, 1.5, 2.0, 2.5, and 3.0 s.
For any given structural system, selected location, andfundamental period, the elastic code base shear Vbc is ob-tained by using eq. [2], so
[6] V S T Wbc a a= ( )
A response spectrum analysis is carried out using the se-lected UHS and contribution from all of the modes to obtaina more precise estimate of the base shear, Vbe. The baseshear adjustment factor is calculated from
[7] MVV
vbe
bc
=
© 2003 NRC Canada
Humar and Mahgoub 293
Fig. 4. Elevation of selected structural models: (a) braced frame with cross bracing; (b) braced frame with chevron bracing.
I:\cjce\cjce3002\L02-067.vpMonday, March 31, 2003 3:04:05 PM
Color profile: DisabledComposite Default screen
Modal periods and modal weightsFree vibration analyses of the structural models yield the
modal periods and the modal weights required in the deter-mination of Mv factors. The relative modal periods are pre-sented in Table 3 for the five selected systems and the first10 modes. The modal weights are shown in Table 4. Severalobservations can be made from the data presented.Compared with the moment-resisting frame, the flexuralwall exhibits a larger spread between the first mode periodand the higher mode periods. Also, the higher mode weightsare relatively large in flexural walls compared with those inmoment-resisting frames. Thus, in a flexural wall highermodes account for 35.50% of the total weight, whereas in amoment-resisting frame they account for only 25.90% of thetotal weight. A braced system lies between a moment-resisting frame and a flexural wall system. The coupled wallsystem shown in Tables 3 and 4 behaves like a moment-resisting frame. The hybrid system shown is similar in itsbehaviour to that of a flexural wall system.
Analytical results for Mv factorsAnalytical results for base shear adjustment factors for a
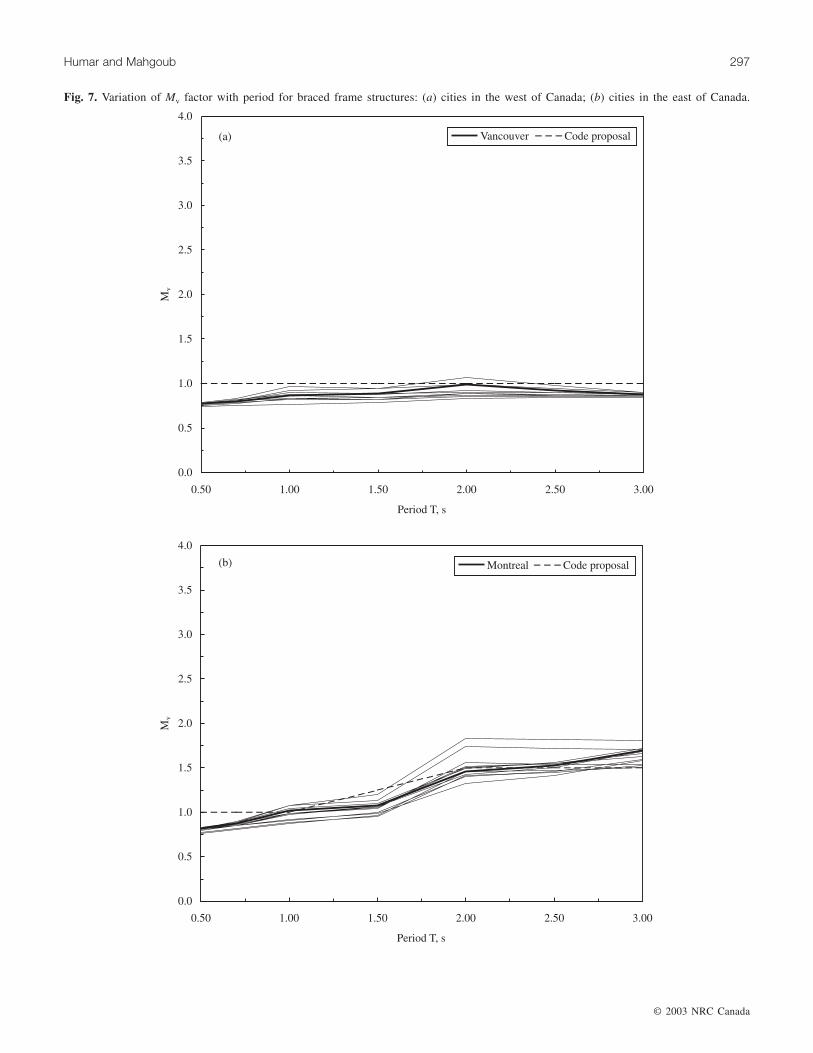
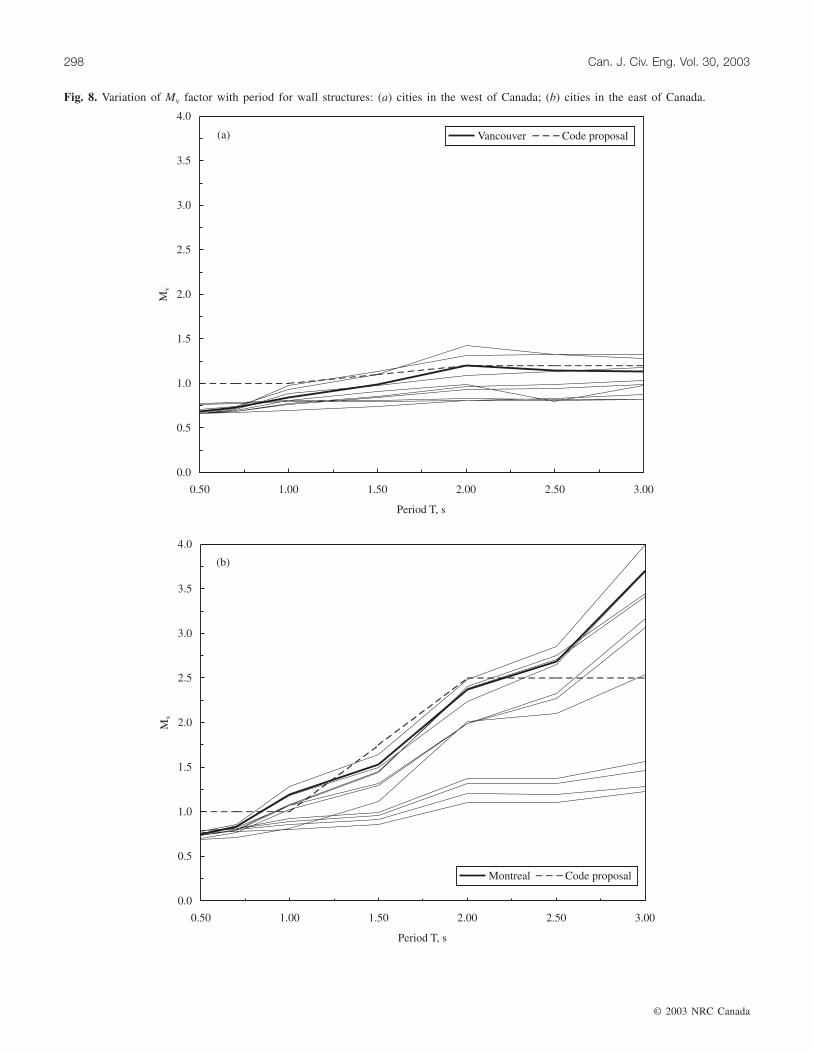
moment-resisting frame, a concentrically braced frame withcross braces, and a flexural wall corresponding to fundamen-tal periods Ta = 0.5, 0.7, 1.0, 1.5, 2.0, 2.5, and 3.0 s are pre-sented in the form of graphs in Figs. 6–8 for the 22 cities.The curves related to Montréal and Vancouver are shown inbold lines. The following observations are made on the basisof results presented.
The base shear adjustment factor Mv is period dependentand increases with an increase in period. The rate of increaseof Mv is higher for the eastern region than for the western re-gion. In the west, for example, the Mv factor varies between
0.687 and 1.197, whereas in the east it ranges from 0.748 to3.701. The factor Mv is also strongly dependent on the typeof ground motion. For the same fundamental period, struc-tures subjected to records in the east usually have a largerMv factor than their counterparts in the west. This can be at-tributed to the difference in the spectral shapes for the tworegions. Thus, in the east the spectrum drops more rapidlywith an increase in period compared with that in the west. Aconsequence of this is that the higher mode contribution ismore predominant in the east than in the west.
Proposed empirical expressions for shearadjustment factor
Seismic codes that permit the use of an equivalent staticload method of design, in which the spectral acceleration
© 2003 NRC Canada
294 Can. J. Civ. Eng. Vol. 30, 2003
Fig. 5. Elevation of selected structural models: (a) coupled flexural walls; (b) hybrid frame–wall system.
Modal periods (s)
Mode MRFBracedframe 2 Wall
Coupledwalls(b = 0.6 m)
Hybridsystem(w = 8.0 m)
1 0.500 0.500 0.500 0.500 0.52 0.194 0.161 0.079 0.146 0.0873 0.109 0.086 0.028 0.071 0.0314 0.070 0.059 0.014 0.041 0.0165 0.048 0.046 0.009 0.026 0.016 0.035 0.038 0.006 0.018 0.0067 0.026 0.033 0.004 0.013 0.0058 0.020 0.029 0.003 0.010 0.0049 0.016 0.026 0.003 0.008 0.003
10 0.013 0.024 0.002 0.006 0.002
Table 3. Modal periods for the five selected structural systems(T1 = 0.5 s).
I:\cjce\cjce3002\L02-067.vpMonday, March 31, 2003 3:04:06 PM
Color profile: DisabledComposite Default screen

values are determined from a design spectrum representingthe response of an SDOF system, usually include a proce-dure to account for the effect of higher modes. In the 1995NBCC this is accomplished by somewhat arbitrarily raisingthe spectrum in the long-period range, where the highermode effects may lead to an increase in the design baseshear. The National Earthquake Hazard Reduction Programguidelines (NEHRP 1997), on which the U.S. codes arebased, use a similar indirect procedure. As stated earlier, thehigher mode effects depend on a number of factors, includ-ing the fundamental period, the type of structural system,and the shape of the response spectrum. Since a simple ad-justment in the shape of the design spectrum cannot accountfor all of the factors, the use of design forces obtained fromthe adjusted spectrum will not ensure a uniform level of pro-tection. The Canadian National Committee on EarthquakeEngineering (CANCEE) decided to move toward added ra-tionality in accounting for higher mode effects, without in-troducing undue complexity in the design process. Thecommittee took the view that the UHS should be specified inits original form as obtained from hazard analysis. In addi-tion to maintaining transparency in the design process, thiswould permit the use of UHS in a response spectrum analy-sis and in producing spectrum-compatible ground motionsfor a time history analysis. It follows that specific provisionsmust be developed to account for the effect of higher modes.At the same time, an opportunity exists to relate the highermode effects to the fundamental period, structural type, andspectral shape.
As stated earlier, the shape of UHS is different for eachsite. Consequently, the higher mode effects will also be dif-ferent for each site. Clearly, it would be impractical to takethis into account in a simplified method of design. Fortu-nately, in Canada the spectral shapes can be grouped intojust two distinct categories, one for the eastern region andone for the western region. The characteristics of the UHSfor sites in one region are more or less similar. Higher modeeffect factors have therefore been developed for the two re-gions and for the structural types identified in earlier sec-tions.
Based on the analytical results obtained for the 22 cities,empirical expressions are derived for Mv for use in design.
The empirical values are shown in Table 5 and in Figs. 6–8for three structural types: moment-resisting frame, bracedframe, and wall. The values vary with period and differ forthe western and eastern regions. In Table 5, the two regionsare identified by the spectral ratio Sa(0.2)/Sa(2.0). This ratiois less than 8.0 for the western region and greater than 8.0for the eastern region where the spectrum drops more rap-idly with an increase in the period. As a conservative esti-mate Mv is selected to be no less than 1. In other words, amulti-degrees-of-freedom (MDOF) system is designed for atleast the same shear as a SDOF system having a periodequal to the fundamental period of the former. The factor Mvis assumed to be constant for Ta ≥ 2.0 s. As stated earlier,considerable uncertainty is associated with the spectral ac-celeration values for periods greater than 2.0 s. It has there-fore been proposed that for the purpose of design thespectral accelerations for periods greater than 2.0 s shouldbe taken as equal to that at Ta = 2.0 s. With this assumption,Mv can be taken as being constant for Ta > 2.0 s. The analyt-ical values of Mv for Ta > 2.0 s do not influence the designexpressions. They have been included here for the sake ofcomparison with the design values. It may be noted thateven when a dynamic analysis is used in design, the 2005NBCC requires that the dynamic shears, moments, andforces be tied back to the base shear obtained from theequivalent static load method of analysis (Saatcioglu andHumar 2003).
In some cases the calculated value of Mv is less than 1 forthe entire period range. In such cases Mv is taken as 1 for allperiods. When Mv increases with an increase in period to avalue greater than 1 at 2 s, a value of Mv = 1 applies in theshort-period range. In most cases Mv is less than 1 for peri-ods up to 1 s, which is therefore taken as the boundary ofthe short-period range. For periods between 1 and 2 s astraight-line interpolation is used. In general, the designvalue corresponding to a period of 2 s is close to the meanfor that period and the straight line joining the design valuesat 1 and 2 s is representative of the data. A single straightline, rather than a series of straight lines joining the meanvalues at selected periods, is used to maintain simplicity. Ina few cases where the calculated values for a large urbancentre, such as Montréal, lie significantly above the mean,the straight line representing Mv is selected to be close to thevalues for the urban centre under reference. The foregoingdiscussions and Table 5 form the basis for the 2005 NBCCprovisions related to base shear adjustment factor.
Distribution of shear
According to the 1995 NBCC, the base shear is distrib-uted across the height of the structure considering a vibra-tion shape that is representative of the first mode of thestructure. The force at floor level i is given by
[8] Fw h
w hVi
i i
i i
=∑
where wi is the weight assigned to the ith storey, and hi isthe height of the ith storey above the base.
For uniform floor masses and uniform storey heights, thedistribution shape given by eq. [8] is an inverted triangle.This linear shape provides a reasonably good approximation
© 2003 NRC Canada
Humar and Mahgoub 295
Modal weight (as percent of total weight)
Mode MRFBracedframe 2 Wall
Coupledwalls(b = 0.6 m)
Hybridsystem(w = 8.0 m)
1 74.10 67.70 64.50 75.30 64.62 11.80 21.20 19.80 11.30 193 5.10 5.60 6.80 5.10 6.74 3.00 2.30 3.50 2.90 3.45 2.00 1.20 2.10 1.80 2.16 1.40 0.80 1.40 1.20 1.47 1.00 0.40 0.90 0.90 18 0.80 0.40 0.60 0.60 0.79 0.60 0.20 0.40 0.40 0.5
10 0.20 0.10 0 0.3 0.4Total 100 99.90 100 99.80 99.8
Table 4. Modal weights in percent of total weight for the fiveselected structural systems.
I:\cjce\cjce3002\L02-067.vpMonday, March 31, 2003 3:04:08 PM
Color profile: DisabledComposite Default screen

© 2003 NRC Canada
296 Can. J. Civ. Eng. Vol. 30, 2003
Fig. 6. Variation of Mv factor with period for moment-resisting frame structures: (a) cities in the west of Canada; (b) cities in the eastof Canada.
I:\cjce\cjce3002\L02-067.vpMonday, March 31, 2003 3:04:08 PM
Color profile: DisabledComposite Default screen
© 2003 NRC Canada
Humar and Mahgoub 297
Fig. 7. Variation of Mv factor with period for braced frame structures: (a) cities in the west of Canada; (b) cities in the east of Canada.
I:\cjce\cjce3002\L02-067.vpMonday, March 31, 2003 3:04:08 PM
Color profile: DisabledComposite Default screen
© 2003 NRC Canada
298 Can. J. Civ. Eng. Vol. 30, 2003
Fig. 8. Variation of Mv factor with period for wall structures: (a) cities in the west of Canada; (b) cities in the east of Canada.
I:\cjce\cjce3002\L02-067.vpMonday, March 31, 2003 3:04:08 PM
Color profile: DisabledComposite Default screen
of the first mode. The code recognizes that the first modedistribution fails to account for the effect of higher modes,which tend to increase the shear in the upper storeys. Also,the higher mode effect becomes more significant as the fun-damental period increases. These factors are taken into ac-count in the code by specifying that a portion of the baseshear, Ft, be assigned to the top floor level and the remain-ing shear distributed according to eq. [8], with V replaced byV – Ft. The top force Ft is given by
[9]
F T
F T V T
F V T
t
t
t
0.7
0.07 0.7 3.6
0.25 3.6
= ≤= < <= ≥
0 1
1 1
1
As pointed out earlier, the contribution of higher modesdepends on both the characteristics of the structure and theshape of the response spectrum. Higher mode effects aremore predominant in a flexural wall structure than in a shearframe structure. Similarly, the response of a structure locatedin the eastern region of Canada is affected more by contribu-tions from higher modes when compared to a structure lo-cated in the western region. This is because of the differentshapes of the spectra in the two regions. Obviously a singleformula for distribution of base shear across the height of astructure cannot capture the variation caused by differentstructural characteristics and different structural shapes. Ingeneral, for a given base shear, the NBCC distribution as-signs smaller shears to the upper stories and larger shears tothe lower stories than would be provided by a modal analy-sis. These differences are larger for long periods, eastern re-gions of Canada, and shear wall type structures. Despitethese discrepancies, the 1995 NBCC distribution is judged tobe adequate for design purposes (Humar and Rahgozar2000) and remains unchanged in the 2005 edition.
The manner in which the base shear is distributed acrossthe height of a structure affects the estimated overturningmoment produced at various storey levels. For a given baseshear the largest overturning moments are produced whenthe shear is distributed according to the first mode; the mo-ments become proportionately smaller when higher modecontributions are accounted for in the distribution of baseshear. Since the NBCC distribution of shear is based pre-dominately on the first mode, the overturning moments cal-
culated from the resulting storey-level forces overestimatethe true moments. The 1995 NBCC specifies correction fac-tors to be applied to the calculated moments so as to obtainmore realistic estimates. A factor J is applied to the baseoverturning moment and a factor Jx is applied to the over-turning moment at level x. The 1995 NBCC overturning mo-ment reduction factors need to be revised in order for themto be used in association with seismic base shear calculatedfrom a UHS.
Methodology for estimating J factors
The methodology used for calculating the J factors is sim-ilar to that used for calculating the Mv factors. For a givenbuilding model, the base shear obtained by modal analysis,that is MvVbc = Vbe = Σ[ ( ) ]S T Wi ia
2 , is distributed according
to eqs. [8] and [9] to yield storey-level forces. These forcesare used to calculate the storey-level overturning momentsMxc and base overturning moment Mbc. More precise esti-mates of these parameters obtained from response spectrumanalysis are designated as Mxe and Mbe, respectively. Thestorey-level overturning moment adjustment factor Jx and thebase overturning moment adjustment factor J are now givenby
[10a] JMM
xx
x
= e
c
[10b] JMM
= be
bc
Analytical results for J factors
Analytical results for base overturning moment reductionfactors for different structural models are presented in theform of graphs in Figs. 9–11 for 22 locations. The followingobservations are made. The adjustment factor J decreaseswith an increase in period. The rate of decrease is higher forthe eastern region than for the western region. Thus, factor Jvaries from 1.030 to 0.601 in the west and from 0.950 to0.304 in the east. Factor J is also strongly dependent on thetype of ground motion. For the same value of Ta, structuresin the east usually have a lower J factor than their counter-
© 2003 NRC Canada
Humar and Mahgoub 299
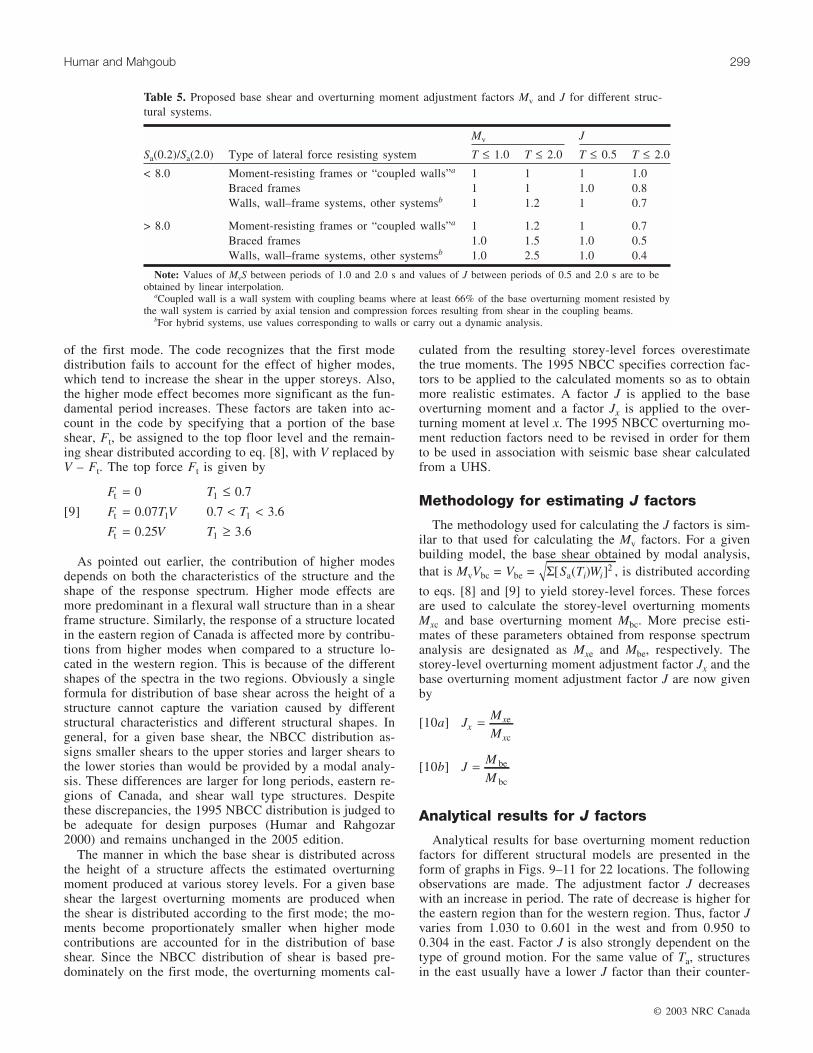
Mv J
Sa(0.2)/Sa(2.0) Type of lateral force resisting system T ≤ 1.0 T ≤ 2.0 T ≤ 0.5 T ≤ 2.0
< 8.0 Moment-resisting frames or “coupled walls”a 1 1 1 1.0Braced frames 1 1 1.0 0.8Walls, wall–frame systems, other systemsb 1 1.2 1 0.7
> 8.0 Moment-resisting frames or “coupled walls”a 1 1.2 1 0.7Braced frames 1.0 1.5 1.0 0.5Walls, wall–frame systems, other systemsb 1.0 2.5 1.0 0.4
Note: Values of MvS between periods of 1.0 and 2.0 s and values of J between periods of 0.5 and 2.0 s are to beobtained by linear interpolation.
aCoupled wall is a wall system with coupling beams where at least 66% of the base overturning moment resisted bythe wall system is carried by axial tension and compression forces resulting from shear in the coupling beams.
bFor hybrid systems, use values corresponding to walls or carry out a dynamic analysis.
Table 5. Proposed base shear and overturning moment adjustment factors Mv and J for different struc-tural systems.
I:\cjce\cjce3002\L02-067.vpMonday, March 31, 2003 3:04:10 PM
Color profile: DisabledComposite Default screen

© 2003 NRC Canada
300 Can. J. Civ. Eng. Vol. 30, 2003
Fig. 9. Variation of J factor with period for moment-resisting frame structures: (a) cities in the west of Canada; (b) cities in the east ofCanada.
I:\cjce\cjce3002\L02-067.vpMonday, March 31, 2003 3:04:10 PM
Color profile: DisabledComposite Default screen

© 2003 NRC Canada
Humar and Mahgoub 301
Fig. 10. Variation of J factor with period for braced frame structures: (a) cities in the west of Canada; (b) cities in the east of Canada.
I:\cjce\cjce3002\L02-067.vpMonday, March 31, 2003 3:04:10 PM
Color profile: DisabledComposite Default screen
© 2003 NRC Canada
302 Can. J. Civ. Eng. Vol. 30, 2003
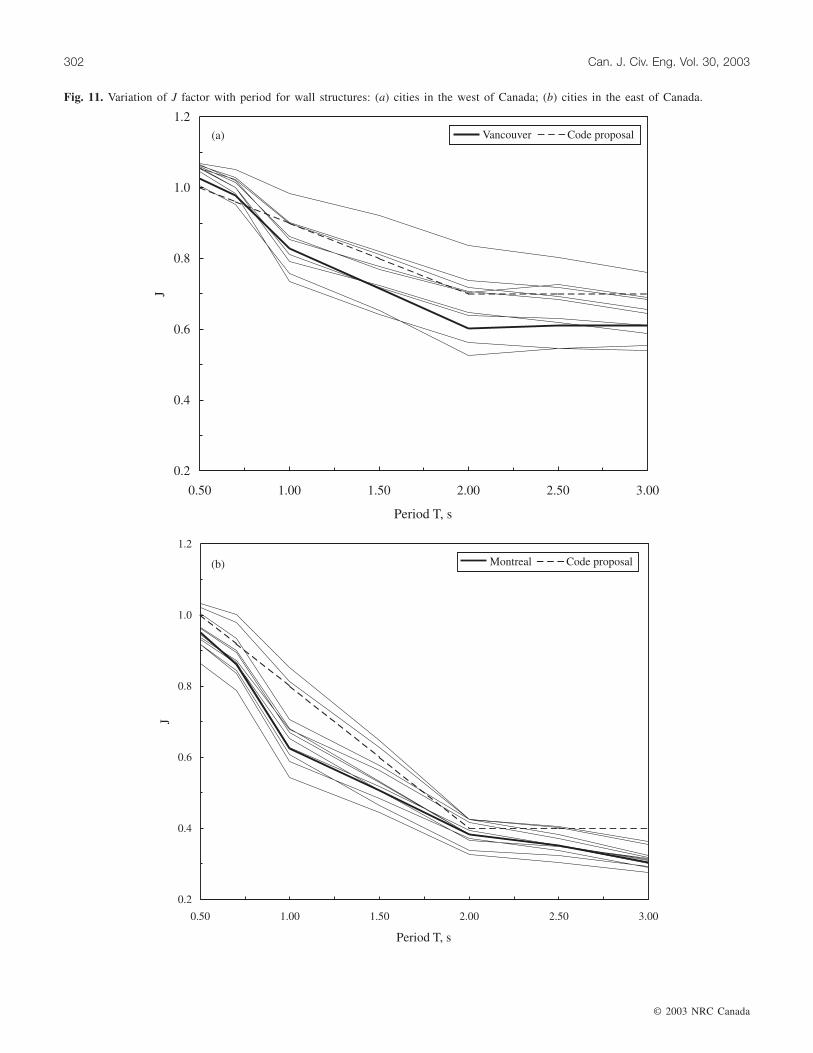
Fig. 11. Variation of J factor with period for wall structures: (a) cities in the west of Canada; (b) cities in the east of Canada.
I:\cjce\cjce3002\L02-067.vpMonday, March 31, 2003 3:04:10 PM
Color profile: DisabledComposite Default screen
parts in the west. This is because the spectrum drops morerapidly with an increase in period in the east than in thewest, so the higher mode contribution is more predominantin the east. Based on the analytical results obtained for the22 cities, empirical expressions are derived for the J factorto be used in design. These values are listed in Table 5 andshown as broken lines in Figs. 9–11.
The variation of Jx obtained from eq. [10a] across theheight of a structure is shown in Fig. 12 for a flexural wallhaving a fundamental period of 2.0 s, for both the westernand eastern regions. The factor Jx is significantly greaterthan 1 in the upper storeys. Evidently, this is because theNBCC distribution underestimates the shear in the upperstoreys. However, the absolute values of overturning momentsare not large in upper storeys, hence from the point of view ofdesign it is sufficient to take Jx = 1 in these storeys. Takingthis into account and based on the shape of the variation of Jx,the following simple expressions are proposed for Jx:
[11a] J h hx x n= ≥1.0 for 0.6
[11b] J J J h h h hx x n x n= + − <( ) ( / )1 for 0.6
where hn is the total height of the structure.
Coupled flexural walls
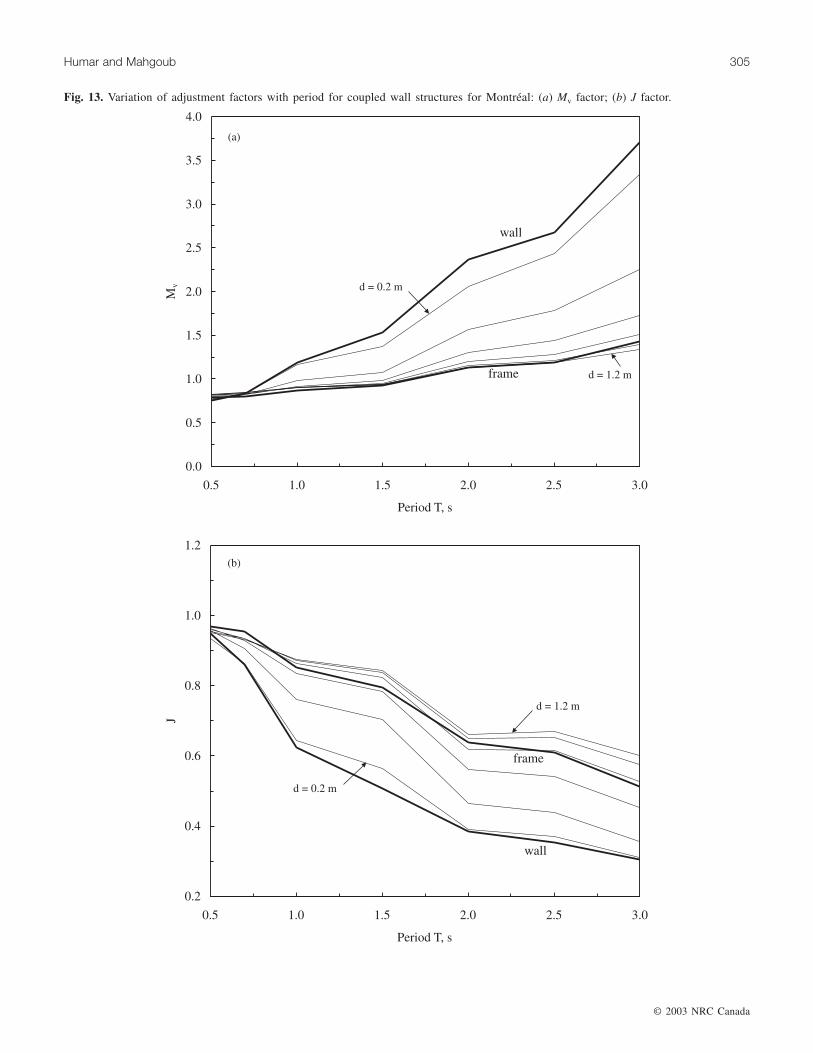
Coupled flexural wall structures are often used in build-ings to resist the lateral loads. The model considered here isthe 12-storey coupled walls system shown in Fig. 5a. Re-sponse spectrum analyses are carried out for different com-binations of connecting beam depths (d = 0.2, 0.4, 0.6, 0.8,1.0, and 1.2 m) and different fundamental time periods (Ta =0.5, 0.7, 1.0, 1.5, 2.0, 2.5, and 3.0 s) for two Canadian cities,Vancouver in the west and Montréal in the east.
Figure 13 shows the variation of the factors Mv and J withperiod for six different coupled flexural walls systems lo-cated in Montréal. For the sake of comparison, Fig. 13 alsoshows the values of Mv and J for a moment-resisting frameand an isolated flexural wall. Figure 13 shows that, as ex-pected, the response of the coupled wall system lies betweenthat of a moment-resisting frame and that of an isolated flex-ural wall. When the beam is very flexible (d = 0.2 m), thesystem behaves like an isolated wall; when the beam is stiff(d = 1.2 m), the system behaves like a moment-resistingframe. In most practical structures the beams in a truly cou-pled system would be stiff enough that the coupled wall sys-tem can be assumed to behave like a moment-resistingframe.
For the 2005 NBCC it is proposed that a coupled wallsystem be treated as a moment-resisting frame for derivingthe values of Mv and J. The criterion for classifying a systemas a coupled wall system is similar to that specified in theCanadian Standards Association concrete design code CSAA23.3, namely that the coupling beams should be stiffenough so that at least 66% of the base overturning momentis carried by axial tension and compression forces resultingfrom shear in the coupling beams.
Hybrid systems
A hybrid system is defined here as one in which the lat-eral forces are shared by moment-resisting frames and flex-ural walls. An idealized model of a hybrid system is shownin Fig. 5b. The selected model is a 12-storey structure with astorey height of 3.65 m. Response spectrum analyses arecarried out for different combinations of wall widths (w =3.0, 4.0, 5.0, 6.0, 7.0, and 8.0 m) and different fundamentaltime periods (T1 = 0.5, 0.7, 1.0, 1.5, 2.0, 2.5, and 3.0 s) fortwo Canadian cities, Vancouver in the west and Montréal inthe east.
Figure 14 shows the variation of Mv and J with the funda-mental period for different hybrid systems located inMontréal. For the purpose of comparison, Fig. 14 also showsthe values of Mv and J for moment-resisting frame and flex-ural wall systems. As would be expected, the response of ahybrid system lies between that for a flexural wall and thatfor a moment-resisting frame. When the wall width is verysmall (2.0 m), the system behaves essentially like a moment-resisting frame. When the wall width is larger, 7.0 or 8.0 m,the system behaves essentially like a wall. In most practicalstructures the flexural wall will be considerably stiffer thanthe frame, so the hybrid system will behave more like a wall.In the 2005 NBCC a hybrid system will be treated as a wallsystem for determining the values of Mv and J.
Summary and conclusions
The equivalent static load procedures specified in manyseismic codes including the 1995 NBCC require that theelastic base shear be obtained from a design response spec-trum using the first mode period of the structure under con-sideration. The elastic base shear is then reduced by a factorthat reflects the capacity of the structure to undergo inelasticdeformation without collapse. In the 1995 NBCC the elasticresponse spectrum is obtained by applying appropriate am-plification factors to the peak ground motion bounds. In re-cent years, methodologies have been developed that allowthe direct determination of maximum spectral accelerationsfor specified values of the period and damping and for agiven probability of exceedance. A plot of such spectral ac-celerations against the period is referred to as a UHS. Theearthquake design provisions of the 2005 NBCC will bebased on the use of UHS to define the seismic hazard and toobtain the design forces.
Since the spectral acceleration values for different periodsmay be contributed by different earthquakes, a UHS is dif-ferent from the response spectrum of a single earthquake.Consequently, when used in a modal analysis a UHS pro-vides somewhat conservative values for the response of anMDOF system. Such conservatism, however, is not exces-sive, and the results of a modal analysis based on a UHSmay be considered quite appropriate for use in design.
In an equivalent static procedure of design based on UHSthe elastic base shear will be determined by using the spec-tral acceleration corresponding to the first mode period ofthe structure. This process ignores the effect of highermodes on response; consequently, the base shear derivedfrom the first mode period must be suitably adjusted. Ad-justment factors for the base shear are derived in this paper
© 2003 NRC Canada
Humar and Mahgoub 303
I:\cjce\cjce3002\L02-067.vpMonday, March 31, 2003 3:04:12 PM
Color profile: DisabledComposite Default screen

© 2003 NRC Canada
304 Can. J. Civ. Eng. Vol. 30, 2003
Fig. 12. Height-wise distribution of storey level overturning moment modification factor Jx: (a) cities in the west of Canada; (b) citiesin the east of Canada (flexural wall, T1 = 2.0 s).
I:\cjce\cjce3002\L02-067.vpMonday, March 31, 2003 3:04:12 PM
Color profile: DisabledComposite Default screen
© 2003 NRC Canada
Humar and Mahgoub 305
Fig. 13. Variation of adjustment factors with period for coupled wall structures for Montréal: (a) Mv factor; (b) J factor.
I:\cjce\cjce3002\L02-067.vpMonday, March 31, 2003 3:04:13 PM
Color profile: DisabledComposite Default screen

© 2003 NRC Canada
306 Can. J. Civ. Eng. Vol. 30, 2003
Fig. 14. Variation of adjustment factors with period for hybrid structures for Montréal: (a) Mv factor; (b) J factor.
I:\cjce\cjce3002\L02-067.vpMonday, March 31, 2003 3:04:13 PM
Color profile: DisabledComposite Default screen
© 2003 NRC Canada
Humar and Mahgoub 307
for several different structural types including moment-resisting frames, braced frames, flexural walls, coupled flex-ural walls, and hybrid systems.
The corrected base shear can be distributed across theheight of a structure according to the NBCC procedures. Be-cause the NBCC distribution is primarily in the form of thefirst mode, however, the resulting overturning moments gen-erally overestimate the true moments, which arise from acombination of various modes. Adjustment factors to be ap-plied to the overturning moments that have been determinedfrom the NBCC distribution are also derived in this paperfor the various structural types.
The base shear and overturning moment adjustments pre-sented in this paper form the basis for the correspondingprovisions in the 2005 NBCC. The following conclusionsare drawn from the results presented in this paper:(1) The base shear adjustment factor Mv and the overturning
moment reduction factor J are both dependent on thecharacteristics of the lateral force resisting system. Thefactor Mv is largest for a flexural wall system and small-est for a moment-resisting frame. On the other hand, Jis smallest for a flexural wall and largest for a moment-resisting frame.
(2) The factors Mv and J also depend on the first mode pe-riod Ta. Thus Mv increases with an increase in Ta,whereas J decreases with an increase in Ta.
(3) The factors Mv and J strongly depend on the shape ofthe response spectrum. Compared with the western re-gions of Canada, the UHS for the eastern regions dropsmore rapidly with an increase in period. Thus the highermode contribution is more predominant in the east; as aconsequence, Mv values are larger and J values smallerfor the eastern region.
(4) The distribution of shear across the height of a structureas specified in the current provision of the 1995 NBCCis reasonable but underestimates the shear in the upperstoreys while overestimating it in the lower storeys.
(5) The underestimation of shear in the upper storeys alsoleads to underestimation of the overturning moments. Itis therefore proposed that the expression for Jx be re-vised. A new formula for Jx that is simpler than the cur-rent version is proposed.
(6) The dynamic behaviour of a practical coupled flexuralwall system is expected to be similar to that of a frame,so Mv and J for a moment-resisting frame can be ap-plied to a coupled wall structure as well.
(7) The dynamic behaviour of a practical hybrid systemcomprising a flexural wall and a moment-resistingframe is expected to be closer to that of a flexural wall,so the factors Mv and J for walls can also be applied to ahybrid system.
Acknowledgements
This study was carried out to provide a basis for the workof the first author on the Canadian National Committee onEarthquake Engineering. The comments and suggestionsprovided by the members of the committee are gratefully ac-knowledged. The authors also acknowledge the financialsupport provided for the present study by the Natural Sci-ences and Engineering Research Council of Canada.
References
Adams, J., and Atkinson, G. 2003. Development of seismic hazardmaps for the proposed 2005 edition of the National Building Codeof Canada. Canadian Journal of Civil Engineering, 30: 255–271.
Adams, J., and Halchuk, S. 2003. Fourth generation seismic hazardmaps of Canada: Values for over 650 Canadian localities in-tended for the 2005 National Building Code of Canada. Geolog-ical Survey of Canada Open File 4459. 155 p. Available fromhttp://www.seismo/nrcan.gc.ca as of 1 April 2003.
Atkinson, G.M., and Beresnev, I.A. 1998. Compatible ground-motion time histories for new national seismic hazard maps. Ca-nadian Journal of Civil Engineering, 25: 305–318.
DeVall, R.H. 2003. Background information for some of the pro-posed earthquake design provisions for the 2005 edition of theNational Building Code of Canada. Canadian Journal of CivilEngineering, 30: 279–286.
Finn, W.D.L., and Wightman, A. 2003. Ground motion amplifica-tion factors for the proposed 2005 edition of the National Build-ing Code of Canada. Canadian Journal of Civil Engineering, 30:272–278.
Heidebrecht, A.C. 2003. Overview of seismic provisions of theproposed 2005 edition of the National Building Code of Canada.Canadian Journal of Civil Engineering, 30: 241–254.
Humar, J.L., and Rahgozar, M.A. 2000. Application of uniformhazard spectra in seismic design of multistorey buildings. Cana-dian Journal of Civil Engineering, 27: 1–18.
Humar, J., Yavari, S., and Saatcioglu, M. 2003. Design for forcesinduced by seismic torsion. Canadian Journal of Civil Engi-neering, 30: 328–337.
Mitchell, D., Tremblay, R., Karacabeyli, E., Paultre, P., Saatcioglu,M., and Anderson, D.L. 2003. Seismic force modification fac-tors for the proposed 2005 edition of the National BuildingCode of Canada. Canadian Journal of Civil Engineering, 30:308–327.
NBCC. 1995. National Building Code of Canada. Institute for Re-search in Construction, National Research Council of Canada,Ottawa, Ont.
NEHRP. 1997. NEHRP recommended provisions for seismic regu-lations of new buildings. National Earthquake Hazard ReductionProgram, Building Seismic Safety Council, Washington, D.C.
Saatcioglu, M., and Humar, J. 2003. Dynamic analysis of buildingsfor earthquake-resistant design. Canadian Journal of Civil Engi-neering, 30: 338–359.
I:\cjce\cjce3002\L02-067.vpMonday, March 31, 2003 3:04:14 PM
Color profile: DisabledComposite Default screen