determination of curcumin stability in various gastro ......determination of curcumin stability in...
TRANSCRIPT
Determination of curcumin stability in various gastro-intestinal pH by Arrhenius equation using HPLC methodSakonjan Treesinchai, Tasana Pitaksuteepong, Srisagul Sungthongjeen*
Department of Pharmaceutical Technology, Faculty of Pharmaceutical Sciences, Naresuan University, Phitsanulok-Nakornsawan Road, Phitsanulok 65000, Thailand
ABSTRACT
Curcumin is the major bioactive constituent of Curcuma longa L. It has been used for many ailments due to its wide spectrum of pharmacological activities, including antioxidant, anti-inflammatory and anti-microbial activities. Besides its low solubility, curcumin instability is a crucial factor affecting its bioavailability and therapeutic efficacy. This study aimed to investigate the effect of temperature and gastrointestinal (GI)
pH on curcumin stability. The Arrhenius equation was used to describe the dependence of the curcumin degradation rate constant on temperature and thus predict curcumin shelf life.
HPLC method was validated according to ICH guidelines in terms of linearity, LOD, LOQ and precision. The results revealed that the degradation of curcumin followed first-order kinetics.
The degradation rate constant of curcumin increased with increasing media pH. Curcumin was more stable in an acidic condition (0.1 N HCl) than in basic conditions (pH 6.8 and pH 7.4 phosphate buffer). This data is useful to design site-targeted drug delivery systems e.g. a gastroretentive DDS to improve the bioavailability and therapeutic efficacy of curcumin. Curcumin degradation accelerated with increasing temperature. The Arrhenius plot exhibited high linearity over the experimental temperature range (37-80 °C) (r2 = 0.9886-0.9994). The predicted degradation rate and shelf life of curcumin in 0.1 N HCl at room temperature (26 + 2 °C) and body temperature (37 °C) obtained from Arrhenius plot were close to those obtained from actual storage. This indicated that Arrhenius equation appeared reliable for shelf life prediction of curcumin at room temperature.
1. INTRODUCTION In Thailand, Curcuma longa L. or turmeric is a well-
known medicinal herb that has been recognised as a fundamental drug for primary health care treatment of dyspepsia1. Turmeric also has been used as a dietary spice, coloring agent, preservative and traditional medicine in the south and southeast of Asia for thousands of years2. Curcumin, a yellow-orange pigment, is the major bioactive constituent in the turmeric rhizome. Curcumin has been reported to have numerous pharmacological activities, including antioxidant, anti-inflammatory, anti-microbial and anti-carcinogenic activities3-5. It also has therapeutic effects, for instance hepatoprotective, nephroprotective, thrombosuppressive,
Research Article
KEYWORDS:Curcumin; Stability; HPLC; Gastrointestinal pH; Arrhenius equation
https://www.pharmacy.mahidol.ac.th/journal/© Faculty of Pharmacy, Mahidol University (Thailand) 2020
*Corresponding author: [email protected]
Pharmaceutical Sciences Asia Pharm Sci Asia 2020; 47 (1), 86-96DOI:10.29090/psa.2020.01.019.0013

87
Pharmaceutical Sciences Asia
cardiovascular (i.e., as protection against myocardial infarction), hypoglycemic and antirheumatic (i.e., as protection against rheumatoid arthritis)4,6,7.
Interestingly, the continuing traditional therapeutic use of curcumin is due to its extremely good safety profile. To date, several studies have demonstrated that curcumin is not toxic even at very high doses in either acute or chronic administration of turmeric extract8-10.
Although curcumin has multiple advantages, its poor bioavailability continues to be highlighted as a major challenge in developing formulations for applications11. Besides its low solubility, curcumin instability is a crucial factor affecting its bioavail-ability and therapeutic efficacy. Generally, curcumin (1,7-bis(4-hydroxy-3-methoxyphenyl)-1,6-hepadiene-
3,5-dione) is a hydrophobic polyphenol that has poor water-solubility, but it is soluble in ethanol, dimethylsulfoxide (DMSO) and acetone4,5. The chemical structure of curcumin is shown in Figure 1.
Curcumin appears to have a brilliant yellow hue at pH values from 2.5-7 and red colour at pH > 74,5.
Curcumin rapidly degraded by hydrolysis under basic pH conditions, however, the degradation of curcumin is extremely slow at pH 1-6, as normally
encountered in the stomach12, 13. Moreover, curcumin is known to be a photolabile substance. As a result of photosensitivity demonstrated by several researchers, curcumin should be protected from light14, 15. There have been a few published studies on the effect of temperature on curcumin stability and application of the Arrhenius equation to predict curcumin stability. Giménez et al.16 studied the color degradation of curcumin in 60% v/v ethanol over a temperature range 30–90 °C. The results showed that the variations observed in the color degradation rate constants with temperature followed the Arrhenius relationship. Naksuriya et al.17 investigated the kinetic degradation of curcumin from a natural curcuminoid mixture under various conditions (pH, temperature, and the dielectric constant of the medium). The results showed that increasing pH, temperature, and the dielectric constant of the medium resulted in an increase in the degradation rate. The Arrhenius plot showed a linear relationship between log kobs and 1/T.
Nevertheless, no studies have reported both the effect of gastrointestinal pH on curcumin stability and the use of the Arrhenius equation for prediction of curcumin stability as compared to actual storage.
Figure 1. Chemical structure of curcumin.
This study aimed to investigate the effect of temperature and normal gastrointestinal pH values on curcumin stability. The Arrhenius equa-tion was used to describe the dependence of the curcumin degradation rate constant on temperature and predict curcumin degradation rate and shelf life at room temperature. In order to obtain curcumin stability data under gastrointestinal pH, curcumin solutions were prepared in an acidic condition similar to the pH of the stomach and basic conditions similar to the pH of the intestine and colon and then stored at various temperatures. The results of this study provided the optimal gastrointestinal
pH for curcumin delivery and thus determine the suitable target delivery site.
2. MATERIALS AND METHODS2.1. Materials
Curcumin (>95%) was purchased from Naturalin Bio-Resources Co., Ltd., Hunan, China.
Dimethylsulfoxide (DMSO) was purchased from Merck, Darmstadt, Germany and used to dissolve curcumin. Acetonitrile and glacial acetic acid were high performance liquid chromatography grade and purchased from RCI Labscan Ltd., Bangkok,
88
S. Treesinchai et al. Pharm Sci Asia 2020; 47 (1), 86-96
Thailand. Sodium hydroxide (RCI Labscan Ltd., Bangkok, Thailand) and monobasic potassium phosphate (Fisher Scientific UK, Ltd., Leicestershire, UK) were used for preparation of phosphate buffer (pH 6.8 or 7.4). Hydrochloric acid 37% was obtained from RCI Labscan Ltd., Bangkok, Thailand. All other reagents were analytical or high performance liquid chromatography grade.
2.2. Preparation of standard solutions for calibration curve
The curcumin calibration curve was prepared using a mobile phase solution. Curcumin (20 mg)
was dissolved in a mobile phase solution and adjusted to 200 ml in a volumetric flask to give the stock solution a final concentration of 100 µg/ml.
The mobile phase solution was composed of 2% v/v acetic acid solution and acetonitrile at a volume ratio of 50:50. Standard curcumin solutions with concentrations ranging from 0.3125 to 60 µg/ml were prepared from the stock solution, diluted with the mobile phase solution. All samples were filtered through a 0.45 µm polyvinylidene fluoride (PVDF) filter and then determined by HPLC analysis (Shimadzu UFLC, Shimadzu Corporation, Kyoto, Japan).
2.3. Determination of curcumin by high perfor-mance liquid chromatography (HPLC)
2.3.1. Chromatographic conditions
A reversed-phase C18 column (Luna®, 150 x 4.6 mm, 100 Å, 5-μm particle size) linked with a C18 guard column was used. The flow rate of the mobile phase was 1 ml/min and the injection volume was 20 µl. The UV detector was set at a wavelength of 424 nm, and the temperature of the column was maintained at 33 °C.
2.3.2. Validation of HPLC method
System suitability test
The system suitability was assessed by six replicated injections of the sample. The retention time, peak area and tailing factor were determined.
Linearity (calibration curve)
The HPLC method was validated according to the International Conference on Harmonisation
(ICH) guidelines18. The linearity of the HPLC method was evaluated by analyzing the different concentrations of curcumin ranging from 0.3125 to 60 µg/ml. Nine different standard solutions were analyzed in triplicate for each concentration.
Calibration curve was constructed by plotting average peak areas versus concentrations. The linearity was assessed by calculating slope, y-intercept and correlation coefficient (r) using linear regression.
Detection and quantification limits
The linear regression equation of the calibration curve was used to determine the limit of detection (LOD) and limit of quantification (LOQ) according to the International Conference on Harmonisation (ICH) guidelines. The LOD and LOQ were calculated based on the standard deviation (SD) of the y-intercept and the slope(s) as 3.3SD/s and 10SD/s, respectively
Intra-day and inter-day precision
The repeatability (intra-day precision) and the intermediate precision (inter-day precision)
of the method were determined at three different concentrations. Intra-day precision was performed by three replicate analyses for each concentration on the same day (n = 3). Inter-day precision was performed for each concentration on three different days (n = 3). The precision was expressed as percentage relative standard deviation (% RSD).
2.4. Curcumin stability study
The stock solution of curcumin was prepared by dissolving 22.5 mg of curcumin in dimethyl-sulfoxide (DMSO) which was adjusted to 100 ml in a volumetric flask to obtain a concentration of 225 µg/ml. Varying aqueous solution pH values were obtained by transferring 20 ml of curcumin stock solution to 100 ml volumetric flasks and then adjusting the volume to 100 ml with 0.1 N HCl (pH 1.0) or phosphate buffers (pH 6.8 or pH 7.4).
The final solutions were composed of curcumin 45 µg/ml and 20% v/v DMSO. Phosphoric acid was used for final pH adjustment of these solutions.
The sample solutions were poured into amber glass bottles. The bottles were then stored at room temperature (RT) and in thermostatically controlled

89
Pharmaceutical Sciences Asia
ovens at set 37, 60, 70 and 80 °C. Sample solutions were taken at predetermined time intervals. The remaining amount of curcumin was determined after appropriate dilution with acetonitrile using HPLC at a wavelength of 424 nm (n = 3).
2.5. Kinetic study on the stability of curcumin solutions
To understand the kinetics of curcumin degradation, the data collected on the percentage of curcumin remaining over time from the different media and storage temperatures was applied to zero-order, first-order and second-order reaction kinetic models. The zero-order reaction Eq. (1)
described a system where the degradation rate was independent of substance concentration, while the first-order reaction Eq. (2) described a system where the degradation rate was dependent on one substance concentration and the second-order reaction Eq. (3) described a system where the degradation rate was dependent on two substance concentrations as follows:
C = C0 –k.t (1)
ln C = ln C0 – k.t (2)
1/C = 1/ C0 + k.t (3)
where C0 and C are the percentages of curcumin at the beginning and after an incubation time, t, of the reactions at a given temperature, respectively, and k is the reaction rate constants.
The Arrhenius equation was used to model temperature-dependence of the reaction rate constants, expressed mathematically in Eq. (4) as follows:
ln k = ln A – Ea / RT (4) where k is the reaction rate constant of substance degradation, R denotes the gas constant (1.987 calories Kelvin-1 mole-1), A is the frequency factor, Ea is the activation energy (calories mole-1)
and T is the absolute temperature (Kelvin-1).
2.6. Statistical analysis
The best fitted straight line was determined by the linear regression method. The correlation
coefficient of the curves was calculated. The differences in average of data were compared by simple analysis of variance (one-way ANOVA) or independent-sample T-test. The significance of the difference was determined at 95% confident limit (α = 0.05).
3. RESULTS AND DISCUSSION3.1. Method validation
High performance liquid chromatography condition was investigated in order to obtain an acceptable retention time, and a symmetrical and narrow peak. The result revealed that curcumin was eluted at a retention time of around 8 min as presented in Figure 2. The results of the system suitability test are summarized in Table 1. The relative standard deviation (%RSD) value was less than 2% for peak area and retention time, indicating low variation in the measured values. The tailing factor (T) of curcumin chromatogram was 1.50, demonstrating symmetry of the peak (T<2)19. These results indicated the suitability of this HPLC system and conditions. The validity of the HPLC method was assessed according to ICH guidelines in terms of linearity, LOD, LOQ and precision. A linear relationship was established by plotting the peak area of various curcumin concentrations in 2% v/v acetic acid solution and acetonitrile at a ratio of 50:50 against the corresponding concentrations. The slope, y-intercept, and correlation coefficients (r) were obtained from regression analysis. The calibra-tion curve was linear throughout the concentration ranges (0.3125 - 60 µg/ml). The regression equation was y = 159608x - 20401. The correlation coefficient (r) was 1.0000, indicating a perfectly high degree of correlation and good linearity of the method.
The LOD and LOQ of this method were 0.04 and 0.14 µg/ml, respectively. The results indicated that the method provided adequate sensitivity.
Repeatability (intra-day) and intermediate precision (inter-day) are shown in Table 2. The inter-day and intra-day precision were assessed by %RSD. The %RSD of all the samples were < 2%, which demonstrated the high precision of the method19.

90
S. Treesinchai et al. Pharm Sci Asia 2020; 47 (1), 86-96
3.2. Curcumin stability
3.2.1. Kinetic studies on the stability of curcumin solutions
The stability properties of curcumin under an acidic condition, similar to the pH of the stomach and basic condition, similar to the pH of intestine and colon were investigated. The curcumin solutions were prepared in 0.1 N HCl and pH 6.8 or 7.4 phosphate buffer and then the stability of curcumin was
determined under accelerated conditions at 37, 60, 70, and 80 °C. To determine curcumin degradation kinetics, graphs of the percentage of remaining curcumin (zero-order), the natural log of the percentage of remaining curcumin (first-order) and the reciprocal of the percentage of remaining curcumin (second-
order) versus time were plotted, respectively, and the coefficient of determination (r2) was calculated.
The degradation behavior of curcumin solutions at 37 °C is shown in graphs A, B and C in Figure 3.
Figure 2. HPLC chromatogram of curcumin.
Parameter Value ± %RSD
Retention time 8.12 ± 0.03 Peak area 771,593 ± 1.27 Tailing factor 1.50 Linearity range 0.3125 - 60 µg/ml Regression equation y = 159608x - 20401 Correlation coefficient (r) 1.0000 ± 0.0000 Limit of detection (LOD) 0.04 µg/ml Limit of quantitation (LOQ) 0.14 µg/ml
x = concentration of curcumin (µg/ml) and y = average peak areas
Table 1. System suitability data of HPLC method for curcumin determination.
Table 2. Intra- and inter-day precision of HPLC method for curcumin determination.
Concentration (µg/ml) Precision (%RSD)
Intra-day Inter-day
0.3125 1.49 1.72 5 0.64 1.03 60 0.48 0.97

91
Pharmaceutical Sciences Asia
Figure 3. Kinetic degradation profiles of curcumin in 0.1 N HCl and pH 6.8 or 7.4 phosphate buffer during storage at 37°C: A) zero-order (normal scale), B) first-order (log scale) and C) second- order (reciprocal scale) degradation.
92
S. Treesinchai et al. Pharm Sci Asia 2020; 47 (1), 86-96
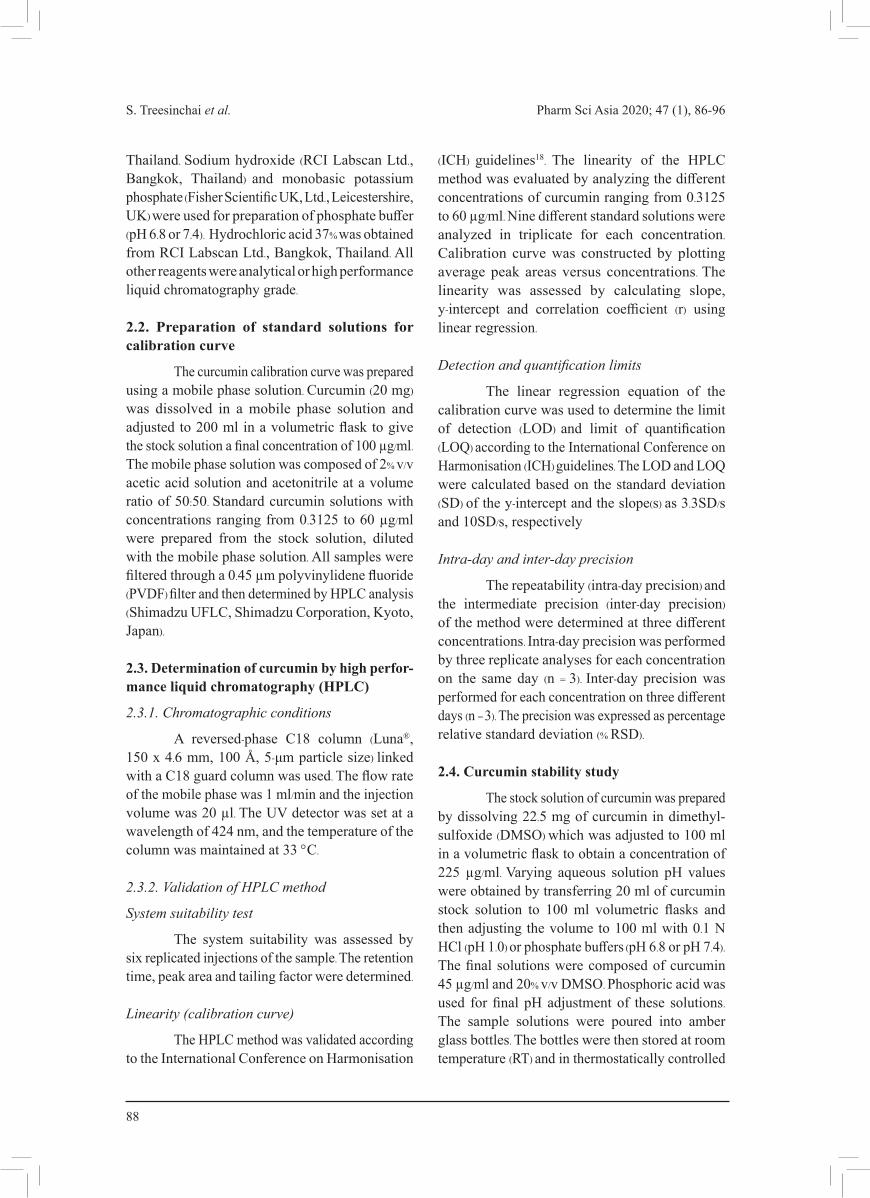
The observed coefficient of determination (r2) for curcumin degradation in 0.1 N HCl and pH 6.8 or 7.4 phosphate buffer at all temperatures tested are summarized in Table 3. The highest correlations in linear regressions for the natural log of the percentage of remaining curcumin over time for all media and temperature treatments were obtained (r2 > 0.95, 0.9519 – 0.9962). These results revealed that the degradation of curcumin fitted well with first-order kinetic as the r2 were close to 1, indicating that degradation of curcumin followed apparent first-
order kinetic. It means that the degradation rates of curcumin were dependent on curcumin concentration.
These findings were in accordance with the results of other researches 12, 20.
3.2.2. Effect of pH on the stability of curcumin
The effect of pH of media (pH 1.0, pH 6.8 and pH 7.4) on the stability of curcumin was investigated.
As presented in Figure 3A, at 37 °C, over 80% of curcumin remained in 0.1 N HCl, however only 57% and 47% of curcumin remained in pH 6.8 and 7.4 phosphate buffer, respectively after 12 h storage.
Curcumin degradation behavior in the same manner
was also found during storage at room temperature and 60, 70, and 80 °C. As summarized in Table 4, the first-order degradation rate constant (k) of curcumin was obtained from the slopes of the natural log of the percentage of remaining curcumin over time graph. The k values for the pH 7.4 phosphate buffer were the highest, followed by the k values of the pH 6.8 phosphate buffer and 0.1 N HCl, respectively. These results indicated that curcumin was degraded more rapidly under basic conditions than under acidic condition. Under basic conditions, curcumin is rapidly hydrolyzed. These findings were in accordance with the results of other researches12, 14. Therefore, the degradation of curcumin was pH-dependent and occurred faster at basic conditions. The increased stability of curcumin under acidic conditions may be attributed to its conjugated diene structure. In addition, when the pH was adjusted to neutral-basic conditions a proton was removed from the phenolic group, leading to the destruction of this structure. Wang et al.12
reported that curcumin was unstable in a 0.1 M phosphate buffer (pH 7.2) at 37 °C, and over 90%
degradation of curcumin in a 0.1 M phosphate buffer.
3.2.3. Effect of temperature on the stability of curcumin
As expressed in Table 4, the degradation rate constant (k) of curcumin strongly increased as the storage temperature increased. Curcumin is readily decomposed when exposed to bright light, high temperature or oxidative conditions21. These results indicated that the degradation rate constant of curcumin was temperature-dependent
as suggested by the Arrhenius equation. In this study, the natural logarithm of degradation rate constants over a temperature range of 37 - 80 °C were plotted versus the reciprocal of temperature according to the Arrhenius equation. The plot exhibits high linearity (r2 = 0.9967, 0.9994 and 0.9886 for curcumin in pH 7.4 phosphate buffer, pH 6.8 phosphate buffer and 0.1 N HCl, respectively) as shown in Figure 4.
Coefficientofdetermination,r2
Temperature 0.1NHCl pH6.8phosphatebuffer pH7.4phosphatebuffer (°C) Zero First Second Zero First Second Zero First Second order order order order order order order order order
80 0.9793 0.9793 0.9259 0.9577 0.9864 0.9646 0.9357 0.9935 0.8917 70 0.9704 0.9932 0.9855 0.9751 0.9942 0.9413 0.9770 0.9794 0.8353 60 0.9796 0.9923 0.9848 0.9453 0.9962 0.9715 0.9794 0.9870 0.8873 37 0.9502 0.9669 0.8816 0.8066 0.9519 0.7953 0.7343 0.9600 0.9517
Table 3. Observed coefficient of determination (r2) for curcumin degradation in 0.1 N HCl and pH 6.8 or 7.4 phosphate buffer during storage at different temperatures.
93
Pharmaceutical Sciences Asia
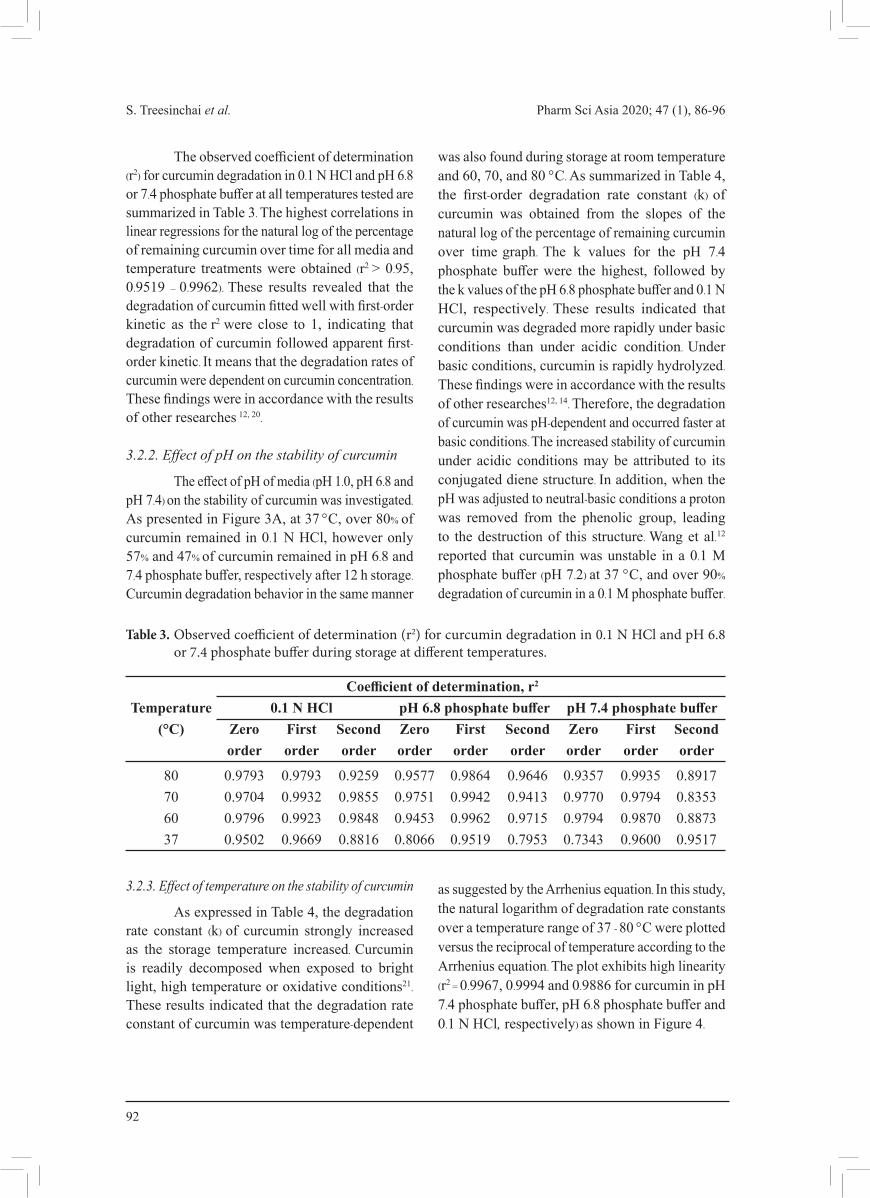
Temperature (°C) k x 10-3 (h-1)
0.1NHCl pH6.8phosphatebuffer pH7.4phosphatebuffer
80 52.9 156.1 663.1 70 31.8 96.2 279.9 60 25.6 52.5 140.6 37 7.4 13.8 24.2
Table 4. The first-order degradation rate constant (k) of curcumin in 0.1 N HCl and pH 6.8 or 7.4 phosphate buffer during storage at different temperatures.
Figure 4. Arrhenius plot for the first-order rate constant of curcumin degradation in 0.1 N HCl and pH 6.8 or 7.4 phosphate buffer over a temperature range of 37 to 80 °C
The equations for the curves corresponding to Arrhenius equation were as follows:
ln k = 22.9630 – 8284.1 / T (5) ln k = 15.7040 – 6199.2 / T (6) ln k = 10.9480 – 4905.2 / T (7) The activation energy (Ea) of the reaction was obtained from the slope of the Arrhenius plot.
The Ea values for degradation of curcumin in pH 7.4 phosphate buffer, pH 6.8 phosphate buffer and 0.1 N HCl were 16.46, 12.32 and 9.75 kcal/mol, respectively. The Ea can be thought of as a “tempe-rature-sensitivity parameter”. The higher the activa-tion energy, the greater the effect temperature has on the rate of the reaction, so a smaller temperature change will be sufficient to rapidly degrade the substance22. Additionally, the stability of curcumin at the room temperature or any lower temperature could be extrapolated from this accelerated data
by using Arrhenius relation. Therefore, Eq.(5) - Eq.(7)
were used to predict the degradation rate constant under the different ranges of temperatures of curcumin in pH 7.4 phosphate buffer, pH 6.8 phosphate buffer and 0.1 N HCl, respectively. The predicted rate of degradation (k) can therefore, be used to determine shelf-life (t90) of the formulations from the following equation:
t90 = 0.105/k (8) where k is the first-order degradation rate constant.
The predicted and actual values of rate constant and shelf life (t90) of curcumin in all media at human body temperature (37 °C) and in the most stable curcumin medium (acidic condition, 0.1 N HCl) at room temperature (26 ± 2°C) were investigated and compared. The results in Table 5 showed that the predicted values at both temperatures

94
S. Treesinchai et al. Pharm Sci Asia 2020; 47 (1), 86-96
were quite close to those obtained from actual storage.
This result was in accordance with a previous study,23 which showed that the predicted rate constant and shelf-life (at room temperature) of ascorbic
acid syrup lay in the range of the actual values. These suggested that the Arrhenius equation could be applied for accelerated stability testing to calculate and predict the rate constant and shelf-life of the formulations.
Media
kx10-3 (h-1) ± SD t90 (h) ± SD Predicted value Observed value Predicted value Observed value
At 37 °C 0.1 N HCl 7.63 7.43 ± 0.25 13.76 14.14 ± 0.48 pH 6.8 phosphate buffer 13.66 13.87 ± 1.01 7.69 7.60 ± 0.56 pH 7.4 phosphate buffer 23.29 24.17 ± 4.46 4.51 4.44 ± 0.79At room temperature (26 ± 2°C) 0.1 N HCl 4.26 4.70 ± 0.20 24.62 22.37 ± 0.95
Table 5. Predicted and observed degradation rate constant (k) and shelf-life (t90) of curcumin solution at 37 °C and room temperature (26 ± 2°C).
4. CONCLUSIONS
The stability of curcumin solutions was determined for three pH values found in the GI tract, pH 1.0, 6.8 and 7.4, which were achieved using 0.1 N HCl, phosphate buffers pH 6.8 and pH 7.4 media, respectively. HPLC method for curcumin determination was validated and met the requirements according to ICH guidelines in terms of linearity, LOD, LOQ and precision. It was found that the degradation of curcumin followed first-order kinetics.
The degradation rate constants (k) increased with increasing temperature and media pH. The results confirmed that curcumin was more stable in an acidic condition than in a basic condition. This data is useful to design suitable site-targeted drug delivery systems, e.g. gastroretentive DDS, to improve curcumin bioavailability and therapeutic efficacy.
The Arrhenius plot exhibited high linearity over the experimental temperature range, indicating the dependence of the curcumin degradation rate constant on temperature. The predicted degradation rate and shelf life of curcumin solutions at room temperature (26 + 2°C) and body temperature (37°C)
obtained from Arrhenius plot were close to those obtained from actual storage. The Arrhenius equation seemed to be helpful and reliable for accelerated stability testing and shelf life prediction of curcumin at low or room temperatures.
5. ACKNOWLEDGEMENTS
The authors are very grateful for the financial
support of this work by the Center of Excellence for Innovation in Chemistry (PERCH-CIC), the Royal Golden Jubilee Ph.D. Program (grant number PHD/0096/2557) under the Thailand Research Fund (TRF), and the Embassy of France in Thailand. The authors would like to thank Mr. Thomas Elliott of The Graduate School at Naresuan University for his assistance in the presentation of this research in English
Conflictofinterests
Authors declare no conflict of interest.
Funding
The study was supported by the Center of Excellence for Innovation in Chemistry (PERCH-CIC), the Royal Golden Jubilee Ph.D. Program (grant number PHD/0096/2557) under the Thailand Research Fund (TRF), and the Embassy of France in Thailand.
Ethical approval
This article does not contain any studies involving animals and human participants performed by any of the authors.
Article info:Received February 13, 2019Received in revised form March 12, 2019Accepted March 20, 2019
REFERENCES 1. Prucksunand C, Indrasukhsri B, Leethochawalit

95
Pharmaceutical Sciences Asia
M, Hungspreugs K. Phase II clinical trial on effect of the long turmeric (Curcuma longa Linn) on healing of peptic ulcer. Southeast Asian J Trop Med Public Health. 2001;2(1):
208-15.
2. Zheng B, Zhang Z, Chen F, Luo X, McClements DJ. Impact of delivery system type on curcumin stability: Comparison of curcumin degradation in aqueous solutions, emulsions, and hydrogel beads. Food Hydrocoll. 2017;71:187-97.
3. Bisht S, Maitra A. Systemic delivery of curcumin:
21st century solutions for an ancient conundrum.
Curr Drug Disc Technol. 2009;6(3):192-9.
4. Goel A, Kunnumakkara AB, Aggarwal BB.
Curcumin as “Curecumin”: from kitchen to clinic. Biochem Pharmacol. 2008;75(4):787-809.
5. Sharma RA, Gescher AJ, Steward WP. Curcumin:
The story so far. Eur J Cancer. 2005;41(13):
1955-68.
6. Anand P, Thomas SG, Kunnumakkara AB, Sundaram C, Harikumar KB, Sung B, et al.
Biological activities of curcumin and its analogues (Congeners) made by man and Mother Nature. Biochem Pharmacol. 2008; 76(11):1590-611.
7. Seo S-W, Han H-K, Chun M-K, Choi H-K.
Preparation and pharmacokinetic evaluation of curcumin solid dispersion using Solutol® HS15 as a carrier. Int J Pharm. 2012;424(1):18-25.
8. Aggarwal BB, Kumar A, Aggarwal MS, Shishodia S. Curcumin derived from turmeric (Curcuma longa): a spice for all seasons. In:
Bagchi D, Preuss HG. editors. Phytopharma- ceuticals in Cancer Chemoprevention. New York:
CRC Press; 2005. p. 349-87.
9. Bengmark S, Mesa MD, Gil A. Plant-derived health: the effects of turmeric and curcuminoids.
Nutr Hosp. 2009;24(3):273-81.
10. Irving GR, Karmokar A, Berry DP, Brown K, Steward WP. Curcumin: the potential for efficacy in gastrointestinal diseases. Best Pract. Res Clin Gastroenterol. 2011;25(4):519-34.
11. Pu C, Tang W, Li X, Li M, Sun Q. Stability enhancement efficiency of surface decoration on curcumin-loaded liposomes: Comparison of guar gum and its cationic counterpart. Food Hydrocoll. 2019;87:29-37.
12. Wang Y-J, Pan M-H, Cheng A-L, Lin L-I, Ho Y-S, Hsieh C-Y, et al. Stability of curcumin in buffer solutions and characterization of its
degradation products. J Pharm Biomed Anal. 1997;15(12):1867-76.
13. Tønnesen HH. Solubility and stability of curcumin in solutions containing alginate and other viscosity modifying macromolecules-
studies of curcumin and curcuminoids. Int J
Pharm Sci. 2006;61(8):696-700.
14. Tønnesen HH, Másson M, Loftsson T. Studies of curcumin and curcuminoids. XXVII.
Cyclodextrin complexation: solubility, chemical and photochemical stability. Int J Pharm. 2002; 244(1):127-35.
15. Grynkiewicz G, Ślifirski P. Curcumin and curcuminoids in quest for medicinal status.
Acta Biochim Pol. 2012;59(2):201-12.
16. Giménez PJ, Fernández-López JA, Angosto JM, Obón JM. Comparative thermal degradation patterns of natural yellow colorants used in foods. Plant Foods Hum. Nutr. 2015;70(4):380-7.
17. Naksuriya O, van Steenbergen MJ, Torano JS, Okonogi S, Hennink WE. A kinetic degradation study of curcumin in its free form and loaded in polymeric micelles. AAPS J. 2016;18(3):
777-87.
18. Guideline ICH. Validation of analytical procedures: text and methodology Q2 (R1).
International Conference on Harmonization, Geneva, Switzerland, 2005.
19. Wichitnithad W, Jongaroonngamsang N, Pummangura S, Rojsitthisak P. A simple isocratic HPLC method for the simultaneous determination of curcuminoids in commercial turmeric extracts. Phytochem Anal. 2009;20(4):
314-9.
20. Zebib B, Mouloungui Z, Noirot V. Stabilization of curcumin by complexation with divalent cations in glycerol/water system. Bioinorg
Chem Appl. 2010;2010:1-8.
21. Revanthy S, Elumalai S, Benny M, Antony B.
Isolation, Purification and identification of curcuminoids from turmeric (Curcuma Longa L.) by column chromatography. J Exp Sci. 2011; 2(7):21-5.
22. Scrivens G, Clancy D, Gerst P. Chapter 3 -
Theory and fundamentals of Accelerated Predictive Stability (APS) studies. In: Qiu F, Scrivens G, editors. Accelerated Predictive Stability. Boston: Academic Press; 2018. p.
33-73.

96
S. Treesinchai et al. Pharm Sci Asia 2020; 47 (1), 86-96
23. Sungthongjeen S. Application of Arrhenius equation and Plackett-Burman design to ascorbic
acid syrup development. Naresuan Univ J.
2013;12(2):1-12.