determinants of price-earnings ratio: nigerian experience ...ijebmr.com/uploads/art_01_90.pdf ·...
TRANSCRIPT
International Journal of Economics, Business and Management Research
Vol. 1, No. 05; 2017
ISSN: 2456-7760
www.ijebmr.com Page 46
DETERMINANTS OF PRICE-EARNINGS RATIO: NIGERIAN EXPERIENCE
(QUANTILE REGRESSION)
Dr Ochuko Benedict Emudainohwo
Lecture in Delta State University, Abraka, Delta State, Nigeria.
ABSTRACT
The study examines the determinants of price-earnings ratio using 47 non-financial firms listed
in the Nigerian Stock Exchange over the period 2012 to 2016. The essence of the study is to
suggests alternative way of valuing stock by investors. Using quantile regression and pooled
regression models, the study finds that the independent variables explained more of the
systematic variation in P/E ratio at the 25th percentile. Dividend pay-out ratio, share price and
dividend per share were statistically significant to explain P/E ratio at the 25th, 50th and 75th
percentiles. At the 25th percentile, dividend per share has significantly negative impacts on P/E
ratio while dividend pay-out ratio, profitability, market return, average share price and total
dividend paid has positively significant impacts on P/E ratio. at the 50th percentile, dividend
pay-out ratio, profitability, average share price and firm size has significantly positive impacts on
P/E ratio while earnings per share and dividend per share has significantly negative influence on
P/E ratio. at the 75th percentile, earnings growth rate has significantly negative impacts on P/E
ratio while dividend pay-out ratio and average share price has positively significant effects onP/E
ratio.
Keywords:. Price-earnings ratio, non-financial firms, Nigerian Stock Exchange, Quantile
Regression model
JEL Classification: C31
INTRODUCTION
To determine firm’s value and risk in the absence of underlying theory of what determine firm’s
value, the financial theory and economic logic remain the guideline. One of such logic is price-
earnings ratio which is a valuation technique used for assessing stock value at various levels. The
price-earnings (P/E) ratio providesa rough appraisal ofvalue per unit of current firm’s earnings to
investors’ (Hillier, Ross, Westerfield, Jaffe & Jordan, 2010), that is, which stock is cheaper or
expensive: cheaper stocks are the more valuable ones. P/E ratioalso helpsinvestors make
prediction into what firms’ future performances may look like (Afza and Tahir, 2012).Though,
changes in demand and supply of shares remain a key factor that determine stock prices, the P/E
ratio remain a strong assessment tools investors hinges their choice on,whether to buy or sell
International Journal of Economics, Business and Management Research
Vol. 1, No. 05; 2017
ISSN: 2456-7760
www.ijebmr.com Page 47
shares depending on its foreseen future value. Firms having higher P/E ratio are considered to
have significant prospects for growth (Hillier, et al, 2010).
Recently, Nigeria was confirmed to be in recession, the Nigerian Stock Market also revealed
some features of recession that includes; decline in market capitalisation, fall in stock price as
well as the economy experiencing fall in investment spending. Given that stock price has fallen,
existing shareholders will not be interested to sell, avoiding making losses, except they have
arbitrage opportunity in another market: a prudent investor will sell only if expected return from
investing the proceeds in financial assets of comparable risk is greater. On the other hand, a fall
in share price creates opportunity for new entrants, but given the situation of a recession,
investors may not be confidence to buy; for the fear that it may fall further.
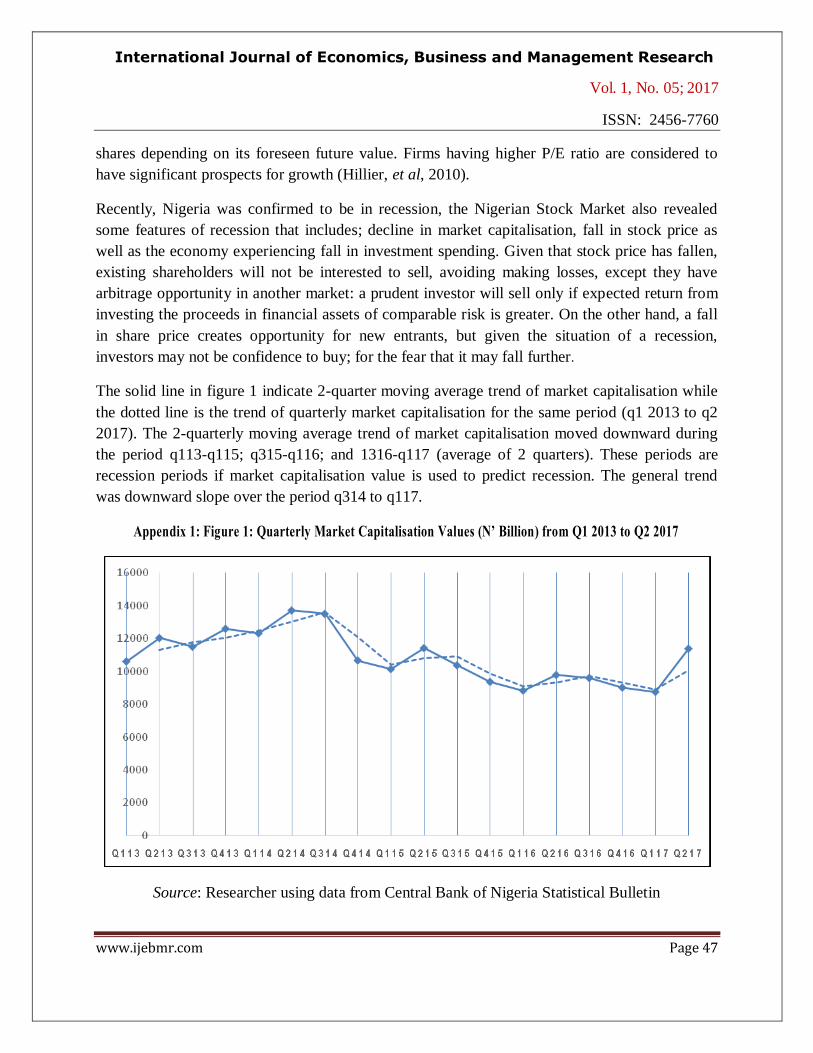
The solid line in figure 1 indicate 2-quarter moving average trend of market capitalisation while
the dotted line is the trend of quarterly market capitalisation for the same period (q1 2013 to q2
2017). The 2-quarterly moving average trend of market capitalisation moved downward during
the period q113-q115; q315-q116; and 1316-q117 (average of 2 quarters). These periods are
recession periods if market capitalisation value is used to predict recession. The general trend
was downward slope over the period q314 to q117.
Appendix 1: Figure 1: Quarterly Market Capitalisation Values (N’ Billion) from Q1 2013 to Q2 2017
Source: Researcher using data from Central Bank of Nigeria Statistical Bulletin

International Journal of Economics, Business and Management Research
Vol. 1, No. 05; 2017
ISSN: 2456-7760
www.ijebmr.com Page 48
Perhaps, it is interesting to note that existing and prospective investors can be confidence to buy
or sell shares if they know the bearings and magnitude of the determinants of P/E ratio. The
numerator (share price) and the denominator (earnings) of the P/E ratio are themselves, influence
by accounting inherent factors and fundamental factors. Premkanth (2013, p. 44) remarked that
‘comparison of price-earnings ratio over time are meaningless unless changes in the underlying
fundamental determinants of P/E ratio are taken into account.’
Thus, an understanding of the relationship between P/E ratio and its determinants, will act as a
timing indicator to predict when to buy or sell stock (Ward and Stathoulis, 1993/94).Though,
several literatures have analysed empirically, the variation of the P/E ratio and its determinants,
given that changing business environment and the difference in business environment between
the developed and the developing countries, a regular research in this field of study becomes
necessary. Empirical studies have provide supporting and conflicting results on the bearing of the
impacts of P/Eratio determinants, and its variation over the years. Breen (1968) suggest
analysing P/E ratio to the whole market as it is superior to analysing the P/E ratio of industry
groups. This study examines the determinants of P/E ratio of non-financial firms’ stocks listed on
the Nigerian Stock Exchange (NSE): excluding financial firms and conglomerate firms. Since
P/E ratio of firms varied to one another, a regular review is necessary since the P/E ratio drivers
are also not static because of diverse growth prospects. At the end of this study, knowledge of
the relationship of P/E ratio determinants will have been added to literature which will enable
investors to have knowledge of when to buy or sell their stocks.
The remainder of this paper is as follows. Section 2 discusses P/E ratio concepts and the
relationship between P/E ratio and its determinants. In addition, the section discusses some of the
variables that form the core of the study’s analysis. Section 3 is the review of theoretical and
empirical results from which the study’s hypotheses will be drawn. Section 4 discusses the
sources of data, variable measurement and the study’s model specification. Section 5 states the
method of data analysis. Section 6 is results presentation and analysis, and Summary, conclusion
and recommendations is section 7.
CONCEPTUAL RELATIONSHIP AND DETERMINANTS OF PRICE-EARNINGS (P/E)
RATIO
P/E ratio is a market value based measure of share price for publicly traded companies of the
earnings of a company. P/E ratio is investors’ estimates about stock value and for choice of
investment decision (Ramcharran, 2002).P/E ratio is how much value per share the market places
on a unit of accounting currency earnings of a firm.
International Journal of Economics, Business and Management Research
Vol. 1, No. 05; 2017
ISSN: 2456-7760
www.ijebmr.com Page 49
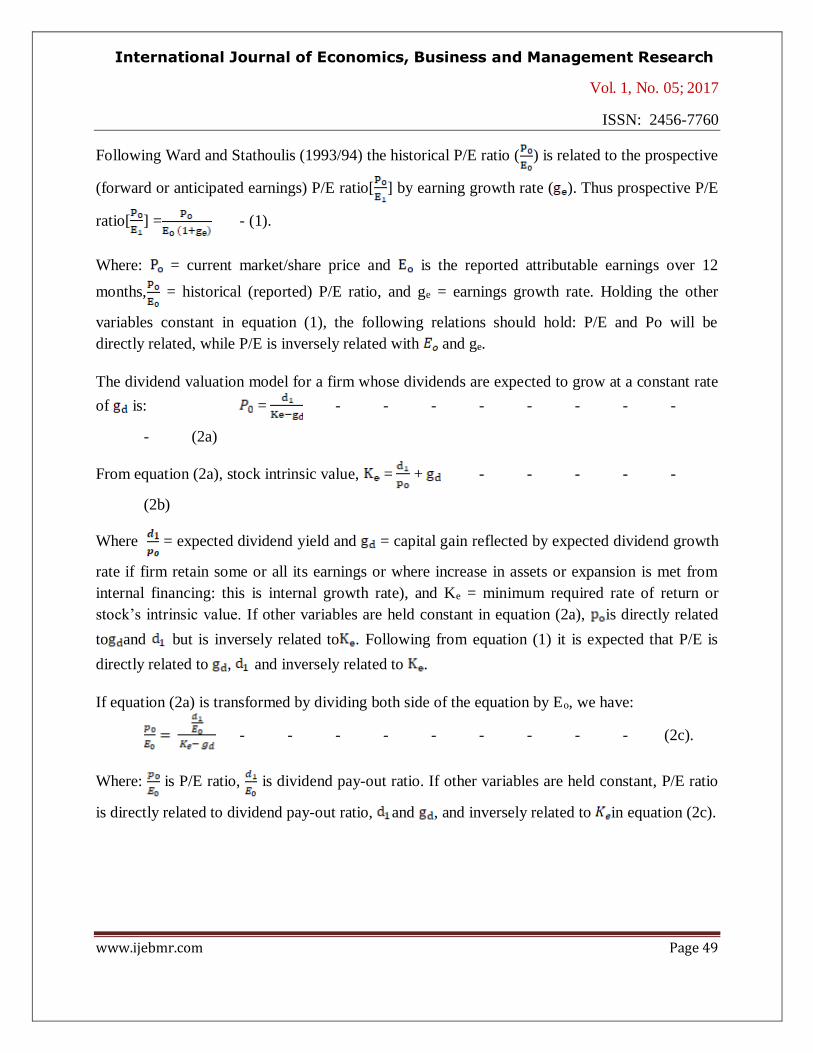
Following Ward and Stathoulis (1993/94) the historical P/E ratio ( ) is related to the prospective
(forward or anticipated earnings) P/E ratio[ ] by earning growth rate ( ). Thus prospective P/E
ratio[ ] = - (1).
Where: = current market/share price and is the reported attributable earnings over 12
months, = historical (reported) P/E ratio, and ge = earnings growth rate. Holding the other
variables constant in equation (1), the following relations should hold: P/E and Po will be
directly related, while P/E is inversely related with and ge.
The dividend valuation model for a firm whose dividends are expected to grow at a constant rate
of is: = - - - - - - - -
- (2a)
From equation (2a), stock intrinsic value, = + - - - - -
(2b)
Where = expected dividend yield and = capital gain reflected by expected dividend growth
rate if firm retain some or all its earnings or where increase in assets or expansion is met from
internal financing: this is internal growth rate), and Ke = minimum required rate of return or
stock’s intrinsic value. If other variables are held constant in equation (2a), is directly related
to and but is inversely related to . Following from equation (1) it is expected that P/E is
directly related to , and inversely related to .
If equation (2a) is transformed by dividing both side of the equation by Eo, we have:
- - - - - - - - - (2c).
Where: is P/E ratio, is dividend pay-out ratio. If other variables are held constant, P/E ratio
is directly related to dividend pay-out ratio, and , and inversely related to in equation (2c).
International Journal of Economics, Business and Management Research
Vol. 1, No. 05; 2017
ISSN: 2456-7760
www.ijebmr.com Page 50
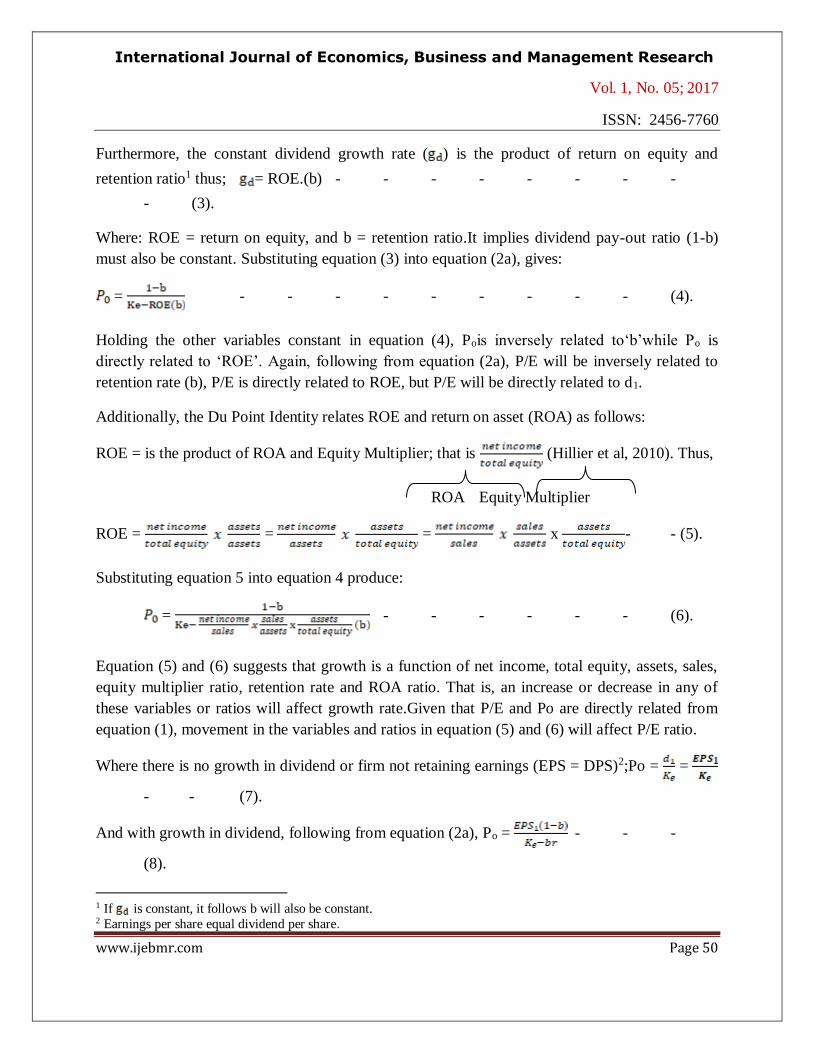
Furthermore, the constant dividend growth rate ( ) is the product of return on equity and
retention ratio1 thus; = ROE.(b) - - - - - - - -
- (3).
Where: ROE = return on equity, and b = retention ratio.It implies dividend pay-out ratio (1-b)
must also be constant. Substituting equation (3) into equation (2a), gives:
= - - - - - - - - - (4).
Holding the other variables constant in equation (4), Pois inversely related to‘b’while Po is
directly related to ‘ROE’. Again, following from equation (2a), P/E will be inversely related to
retention rate (b), P/E is directly related to ROE, but P/E will be directly related to d1.
Additionally, the Du Point Identity relates ROE and return on asset (ROA) as follows:
ROE = is the product of ROA and Equity Multiplier; that is (Hillier et al, 2010). Thus,
ROA Equity Multiplier
ROE = = = x - - (5).
Substituting equation 5 into equation 4 produce:
= - - - - - - (6).
Equation (5) and (6) suggests that growth is a function of net income, total equity, assets, sales,
equity multiplier ratio, retention rate and ROA ratio. That is, an increase or decrease in any of
these variables or ratios will affect growth rate.Given that P/E and Po are directly related from
equation (1), movement in the variables and ratios in equation (5) and (6) will affect P/E ratio.
Where there is no growth in dividend or firm not retaining earnings (EPS = DPS)2;Po = =
- - (7).
And with growth in dividend, following from equation (2a), Po = - - -
(8).
1 If is constant, it follows b will also be constant. 2 Earnings per share equal dividend per share.

International Journal of Economics, Business and Management Research
Vol. 1, No. 05; 2017
ISSN: 2456-7760
www.ijebmr.com Page 51
Where: br = expected dividend growth rate ( ) and = expected earnings per share. Holding
other variables constant in equation (8) and following from equation (2a) where P/E is directly
related to Po, P/E ratio will be directly related to . For equations (2), (4) and (6) to hold,
.
Similarly, equation (5) can be substituted into equation (8) to produce:Po =
- (9).
The general model for Po (Current share price) for stream of dividend with growth rate (gd) is:
Po= - - - - - - - - - (10).
Where in time t; = constant dividend per share; = cost of equity (Minimum required rate of
return.), for period t = 1, 2…, n, and gd = dividend growth rate.The equations above except
equation (10) assumed constant normal growth which is anyway, unreal.
From equation (10), = f(t, , , gd).t ispartly a function of time value of information from the
past years filtering into the model that have not been quantified and time value of money.
Following equations(2a),(2b), (4), (6) and (10), firms should earn a return on retained funds
equal to Ke to ensure growth of dividends and share price. If return earned on retained earnings
is less than Ke, the market price of the firm’s share will fall (Pandey, 2015).
REVIEW OF THEORETICAL AND EMPIRICAL STUDIES
The P/E ratio has been used to evaluate investment quality— stocks having relatively low P/E
ratio is assumed to have better investment performance standing over that with high P/E ratio in
terms of valuable investment opportunity (Sezgin, 2010; Basu, 1977). According to Anderson
and Brooks (2006) low P/E ratio is associated with mature, stable and moderate growth potential
sectors while high P/E ratios can be found in relatively young and fast growing sectors.Average
P/E ratios of group of firms tend to maintain their rank over time within their industry classes
(Mantripragada, 1979).Mantripragada (1979) observed that individual stocks have significant
stability in their P/E ratio rank, more strongly so over shorter periods of time in an examination
of 429 stocks listed on the New York Stock Exchange over the period 1960-1976. P/E ratio can
vary either positively or negatively, depending on the market risk condition.
If the above information is correct, P/E ratio can be used to predict how well stock market and
the stocks is progressing. For instance, in a situation where highP/E ratio starts to fall, investors
International Journal of Economics, Business and Management Research
Vol. 1, No. 05; 2017
ISSN: 2456-7760
www.ijebmr.com Page 52
may sell their stock to avoid losses and buy shares whose P/E ratio is rising. However, P/E ratio
is used with caution because, firms with little or no earnings would probably depict higher
P/Eratio. If firms are not in the same line of business or their performance is not affected by
similar business factors, P/E ratio may not be appropriate for comparison. Also, P/E ratio cannot
be applied for loss making firms. Literature identified several factors that influenceP/E ratios and
they include: dividend pay-out ratio, earnings growth, dividend growth, market price, return on
equity, dividend, and earnings per share and so forth. The determinants are discussed below.
Dividend growth rate
Dividend growth is fundamental to equity valuation [the Gordon growth model (equation 2a &
2b)]. Theoretically, dividend growth rate and P/E ratio are expected to rise together (see equation
2a). The Gordon growth model suggests P/E ratio is positively related to growth. Investors’
assume dividend growth determines the extent to which equity income will keep pace with
inflation rate. To preserve purchasing power, dividend growth should be higher than fall in
purchasing power through inflation.Reilly, Griggs & Wang (1983) showed direct relation
between P/E ratio and dividend growth in a study of quarterly Standard & Poor 500 data for the
period 1963 to 1980. The study hypothesis as follows:
H1a: The effects of dividend growth rate are positive for all quantiles in the conditional firm P/E
ratio distribution for non-financial firms listed in the NSE.
H1b: The magnitude of positive effects of dividend growth rate is larger for upper quantiles
or/and are smaller for lower quantiles in the conditional firms’P/E ratio distribution for non-
financial firms listed in the NSE.
Dividend pay-out ratio
Dividend pay-out policy is deciding on how a corporate profit should be distributed: either pay it
whole as dividend or retain whole or part of it for expansion. Dividend policy remain
controversial in area of finance and 3 schools have evolved on the impact of dividend policy on
firm: firstly, that firm’s value will increase with increasing dividend pay-out (bird-in-hand
hypothesis); secondly, that firm value will reduce with increase in dividend pay-out ratio, and
thirdly, that dividend pay-out ratio make no difference (Miller and Modigliani, 1961) in a world
without tax, no transaction costs or other uncertainties in a perfect capital market. Dividend pay-
out policy is a function of various factors; it is inversely related to firm’s need such as financing
firm’s growth opportunities. Firms that expect higher growth rate may need a low dividend pay-
out policy, thus avoiding external financing costs. Notwithstanding, Arnotta&Asness (2003) and
Ping &Ruland (2006) showed positive bearing between dividend pay-out and growth. According
to Khan, Naeem, Rizwan& Salman (2016), P/E ratio has no impact on dividend pay-out ratio.

International Journal of Economics, Business and Management Research
Vol. 1, No. 05; 2017
ISSN: 2456-7760
www.ijebmr.com Page 53
According to Wenjing (2008), the return and stock value expected by investors will rise when
high dividend pay-out are made and consequently, it leads to a high P/E ratio. Given that
investors will prefer higher return increase in stock value (see: Wenjing, 2008) and
Arnotta&Asness (2003) that showed positive association between dividend pay-out ratio and P/E
ratio, the study hypothesis that:
H2a: The impacts of dividend pay-out ratio are positive for all quantiles in the conditional firm
P/E ratio distribution for non-financial firms listed in the NSE.
2b: The magnitude of positive effects of dividend pay-out ratio is larger for upper quantiles
or/and are smaller for lower quantiles in the conditional firms’ P/E ratio distribution for non-
financial firms listed in the NSE.
Earnings growth
This is the size of growth in a firm’s net income over a specific period, often one year or the
percentage gain over time. It’s a driving force behind stock’s appreciation. Earnings growth is
percentage change in the year’s earnings per share relative to the previous year’s earnings.
Bakshi& Chan (2000) examined over 15,000 stocks taken from 42 countries and shows that
expected earnings growth is a critical determinant of P/E ratio in cross-section of individual
stocks. In examination of what determines P/E ratio, Beaver & Morse (1978) observed earnings
growth explain little of the persistence differences in P/E ratio. The study further shows that P/E
ratio correlate negatively with earnings growth in the year portfolio was formed, but positively in
the year following. Ramcharran (2002) found that growth (earnings potential) is a determinant of
cross-country variation of the P/E ratio in emerging markets. In a study of the links between P/E
ratio and expected earnings growth rate of over 15,000 stocks from 42 countries, Bakshi& Chan
(2000) established that expected earnings growth rate is a significant determinant of P/E ratio in
the cross-section of individual stocks. Reilly et al (1983) realised earnings growth result in
increase in P/E ratio. Loughli (1996) show positive relationship between P/E ratio and expected
earnings growth rate. White (2000) reported that P/E ratio exerts positively on expected earnings
growth rate in an examination of US Stock Market (proxy with Standard & Poor’s 500 Stock
Index). A positive influence of earnings growth on P/E suggests high earnings growth will offset
the risk effect, and leads to an increase in investors’ confidence and thus, the price-earnings ratio
(Afza& Tahir, 2012).Bakshi& Chan (2000) also show that a higher anticipated earnings growth
rate significantly bid the stock’s price-earnings upward in a cross-section examination.Following
the theoretical argument that earnings growth and price-earnings ratio are negatively related
(equation 1) and the study that observed P/E ratio correlate negatively with earnings growth in
the year portfolio was formed (Beaver & Morse, 1978), this study hypothesis that:
International Journal of Economics, Business and Management Research
Vol. 1, No. 05; 2017
ISSN: 2456-7760
www.ijebmr.com Page 54
H3a: The influence of earnings growth is negative for all quantiles in the conditional firm P/E
ratio distribution for non-financial firms listed in the NSE.
H3b: The magnitude of negative effects of earnings growth rate is larger for upper quantiles
or/and are smaller for lower quantiles in the conditional firms’ P/E ratio distribution for non-
financial firms listed in the NSE.
Share price/market price:
This is the amount investors are ready to pay or sell a unit of share in the stock market. It is the
current price at which an asset or service can be bought or sold. Malhotra, Chandiwala&Tandon
(2013) observed that P/E ratio has positive and significant bearing with stock price in an
examination of NSE 100 companies in sample of 95 companies over the period 2007-2012.
Beaver & Morse (1978) reported that market risk is insufficient to explain movement in P/E
ratios over the period longer than 2 years. Kumar & Warne (2009) shows that variability in
market price is a significant determinant of P/E ratio of Indian Capital Market firm data. This
suggests that investors’ may prefer these firms’ share whose market price move in the same
direction.Afza& Tahir (2012) recorded P/E ratio is positively and significantly related to
variability in market price. Arslan& Zaman (2014) in an examination of non-financial listed
firms’ data in Pakistan reported that P/E ratio has significantly positive influence on stock price.
Following Malhotra et al (2013), Afza& Tahir (2012); Arslan& Zaman (2014) the study
hypothesises that:
H4a: The impact of share price is positive for all quantiles in the conditional firm P/E ratio
distribution for non-financial firms listed in the NSE.
H4b: The magnitude of positive impacts of share price is larger for upper quantiles or/and are
smaller for lower quantiles in the conditional firms’ P/E ratio distribution for non-financial firms
listed in the NSE.
Earnings per share (EPS)
EPS is one of the investment tools used for evaluating firm’s performance either in the short or
long term, and is also one of the measures of managerial efficiency. The estimated earnings can
be used to measure the financial health and prospect of a company. Beaver & Morse (1978)
defined EPS as that constant cash flow whose present value is equivalent to the present value of
cash flows generated from current equity investment. The International Accounting Standards
Board (IASB) in its International Financial Reporting Standard (IFRS) 14 defines EPS as: the
company’s net after-tax earnings that belong to equity shareholders divided by the number of
International Journal of Economics, Business and Management Research
Vol. 1, No. 05; 2017
ISSN: 2456-7760
www.ijebmr.com Page 55
outstanding shares. Theoretically, EPS impact directly on P/E ratio: ahighEPS will reflect a high
P/E ratio and vice-versa (see equation 8). This study hypothesis that:
H5a: The influence of EPSis negative for all quantiles in the conditional firm P/E ratio
distribution for non-financial firms listed in the NSE.
H5b: The magnitude of negative effects of EPS are larger for upper quantiles or/and are smaller
for lower quantiles in the conditional firms’ P/E ratio distribution for non-financial firms listed in
the NSE.
Market return
Given the Markowitz portfolio theory, it is the gain or loss on the overall theoretical market
portfolio, and that include all assets. A positive market returns to P/E suggests firms with high
market returns raise investor’s confidence to select those firms in their portfolio (Afza& Tahir,
2012). White (2000) in multiple regression model showed that market return has positive and
significant impact on P/E multiple. Similarly, Abbasi&Pagghe (2013) show P/E ratio is a
significant determinant for the stock returns in Tehran Stock Exchange. Following the result by
Afza& Tahir (2012) and Abbasi&Pagghe (2013) that found direct relation between market return
and P/E ratio, we hypothesis that:
H6a: The influences of market return are positive for all quantiles in the conditional firm P/E
ratio distribution for non-financial firms listed in the NSE.
H6b: The magnitude of positive influence of earnings growth rate is larger for upper quantiles
or/and are smaller for lower quantiles in the conditional firms’ P/E ratio distribution for non-
financial firms listed in the NSE.
Profitability
Firm performance (profitability) concept is evaluating the outcome of how effective and
efficiently, management have employed the firm’s resources (Neely, Gregory &Platts, 1995;
Emudainohwo, 2016). Thus firm’s success is judged by its performance over period of times,
just as firms with good performance or profitability are those that will attract investors
(Emudainohwo, 2016). Profitability is one indicator for evaluating firm performance. Amongst
profitability indicators are: return on equity, return on asset, asset turnover and so forth. In an
examination of the association between the forward P/E ratio and profitability, Wu (2014)
observed U-shape relationship between forward P/E ratio and return on equity. Besides, the
study shows that firms having high P/E ratio tend to have lower ROE in the following years. The
study by Premkanth (2013) on sample of 30 companies listed on the Colombo Stock Exchange
International Journal of Economics, Business and Management Research
Vol. 1, No. 05; 2017
ISSN: 2456-7760
www.ijebmr.com Page 56
over the period 2007-2011 show that ROE impact negatively on P/E multiple, but not sufficient
to explain P/E multiple. Sezgin (2010) observed unidirectional Granger’s running from return on
equity to P/E ratio. Truong (2009) finds that consistent superior return is achieved from investing
in low P/E stocks. Following Wu (2014) and Premkanth (2013) that observed inverse
relationship between firms with low P/E ratio and better investment performance, this study
hypothesised that:
H7a: The impacts of profitability are negative for all quantiles in the conditional firm P/E ratio
distribution for non-financial firms listed in the NSE.
H7b: The magnitude of negative impactsis larger for upper quantiles or/and are smaller for lower
quantiles in the conditional firms’ P/E ratio distribution for non-financial firms listed in the NSE.
Dividend per share (DPS)
Dividend is the apportionment of earnings in real assets among the firm’s shareholders in
proportion to their ownership. The decision to pay out dividends is based on a firm’s dividend
policy. DPS is the dividends declared by a company divided by the number of outstanding
ordinary shares issued. Companies that are in a better cash position are in a better position to pay
dividend except they have some leverage to cheap source of fund. Increase in DPS over time
while maintaining a long-term growth rate is expected to relate with higher P/E ratio
(Nikbakht&Polat, 1998). Perhaps, due to promising information contents from firms, the
relatively more dividend paying firms should be related with relatively higher P/E multiples.
However, in an examination of Iran Khodro Company, Mirfakhr, Dehavi, Zarezadeh, Armesh,
Manafi&Zraezadehand (2011) find negative and significant relation between DPS and P/E ratio.
Theoretically (see equation 2a and 2b), dividend is directly related to P/E ratio. Nevertheless,
following the argument by Nikbakht&Polat (1998), we hypothesis that:
H8a: The effects of DPS are positive for all quantiles in the conditional firm P/E ratio
distribution for non-financial firms listed in the NSE.
H8b: The magnitude of positive effects is larger for upper quantiles or/and are smaller for lower
quantiles in the conditional firms’ P/E ratio distribution for non-financial firms listed in the NSE.
Control variables
Control variables are not primary variable of interest but are related to the target variables. We
use 3 control variables to account for their potential effects on P/E ratio for non-financial firms
listed in the NSE. The inclusion of control variables is meant to remove their effects from the
model. The following control variablesare included in the examination of the data.
International Journal of Economics, Business and Management Research
Vol. 1, No. 05; 2017
ISSN: 2456-7760
www.ijebmr.com Page 57
Shareholders’ equity (proxy with log of number of shares issued and ranking for dividend)
Shareholders’ equity is the worth of a firm owners’ claim against firm’s assets— it is the residual
difference between assets and liabilities which means it is not fixed. Value of shareholders’
equity will increase when firm retain part of earnings for reinvestment. Retaining part of
earnings will result in capital gain. Given that price-earnings ratio is directly related to capital
gain (gd) (see equation 2a and 2b), theoretically, an increase in shareholders’ equity through
retained earnings should increase P/E ratio. This study expects that shareholders’ equity is
directly related to P/E ratio and hypothesis that:
H9: Shareholders’ equity effects are positive for all quantiles in the conditional firm P/E ratio
distribution for non-financial firms listed in the NSE.
H9b: The magnitude of shareholders’ equity positive effects is larger for upper quantiles or/and
are smaller for lower quantiles in the conditional firms’ P/E ratio distribution for non-financial
firms listed in the NSE.
Total dividend
Dividend is the portion of the profit after tax, which is distributed to the shareholders for their
investment bearing risk in the company. While Miller & Modigliani (1961) proposed the
dividend irrelevancy theorem, Jensen &Meckling (1976) advocated that dividends may matter
for investors in agency cost considerations. They argued that dividends enforced managerial
discipline and efficiency in an organisation and for this reason, investors may prefer the dividend
paying firms. Dividend provides signals that convey information to the outside world about the
current and future earnings prospects of the corporation (Miller & Rock, 1985). Dividends are
important regarding the explanatory power of stocks prices. Based on these propositions, we
expect positive association between dividend paid and P/E ratio and hypothesis that:
H10a: Total dividend paid impacts are positive for all quantiles in the conditional firm P/E ratio
distribution for non-financial firms listed in the NSE.
H10b: The magnitude of the total dividend paid positive effects is larger for upper quantiles
or/and are smaller for lower quantiles in the conditional firms’ P/E ratio distribution for non-
financial firms listed in the NSE.
Firm size (proxy with log of average total assets)
The concept of economy of scale is that bigger firms’ marginal cost is lower when compared to
the marginal cost of a smaller firm (Niresh&Velnampy, 2014). Larger sized firms are more likely

International Journal of Economics, Business and Management Research
Vol. 1, No. 05; 2017
ISSN: 2456-7760
www.ijebmr.com Page 58
to be successful than smaller sized firms from the perspective of earnings from scale, advantages
to creditor, assets’ use as collateral to creditors and for diversification advantages
(Emudainohwo&Tarurhor, 2016) and internal trading, superior technology knowhow, bulk
purchases, monitoring and research and development capacity that enhance future profits than
smaller ones (Bhattacharyya &Saxena, 2009). Firm size has been found to have significant
impact on value-relevance of firms’ accounting information (Ghayoumi, Nayeri, Ansari
&Raeesi, 2011). On the contrary, Kumar (2015) had shown firm size proxy with total assets is
inversely related to the value creation of firms. Investors assessment of P/E ratio is a function of
firms present and future value and there is a significant relation between stock value and total
assets (firm size). Thus, we hypothesis that:
H11a: Firms’ size influences are positive for all quantiles in the conditional firm P/E ratio
distribution for non-financial firms listed in the NSE.
H11b: The magnitude of the firms’ size positive influences is larger for upper quantiles or/and
are smaller for lower quantiles in the conditional firms’ P/E ratio distribution for non-financial
firms listed in the NSE.
METHODOLOGY AND MODEL SPECIFICATION
Sources of data and variables measurement
Companies annual report is the source of data for the study. The data is for the period 2012 to
2016 representing 47non-financial firms listed in the NSE. The study has a panel data set of
235firms’ year’s observation. The measurement of the variables for the study is contained in table 1.
Table 1: Variable and measurement
Variables Measuremment: for firm i and time t
1
Price-earnings (P/E) ratio:
Dependent variable
Market value per share divided by earning per share (Kumar, 2015; Afza & Tahir,
2012)
2 *Dividend growth rate % change in the year’s DPS relative to the previous year’s DPS (Nikbakht & Polat,
1998). Scaled down by 10.
3 Dividend pay-out ratio
(DP)
Ratio of DPS to EPS (Afza & Tahir, 2012; Ward & Stathoulis, 1993/94)

International Journal of Economics, Business and Management Research
Vol. 1, No. 05; 2017
ISSN: 2456-7760
www.ijebmr.com Page 59
4 *Earnings growth rate Percentage change in net income (Afza & Tahir, 2012; Nikbakht & Polat, 1998).
Scaled down by 100.
5 Profitability (proxy with
return on equity)
Income before extraordinary items available for common equity divided by common
equity (Wu, 2013)
6 Earnings per share Profit after tax minus Preferred dividend divided by number of ordinary share
outstanding (Kumar, 2015)
7 Dividend per share Total dividend divided by number of ordinary shares outstanding (Malhotra et al,
2013; Nikbakht & Polat, 1998)
8 Market return Ratio of dividend plus change in share price to last year share price, of firm i for time
period t (Afza & Tahir, 2012; Nikbakht & Polat, 1998)
9 Share price/stock price Average closing share price.
10 *Total dividend paid It is the portion of the profit after interest and tax, which is distributed to
theshareholders for their investment bearing risk in thecompany (Malhotra et al,
2013). Scaled down by 1,000,000.
11 *Shareholders’ equity Proxy with logarithm of number of ordinary shares issued and ranking for dividend.
12 *Firm size Proxy with log of average of total assets at the beginning and end of the year
* natural log and values scaled down to reduce heteroscedasticity and support the constant variance assumption of
ordinary least square.
Model specification
Following Afza& Tahir (2012) and Nikbakht&Polat (1998), the study model P/E ratio with
dividend growth rate, dividend pay-out ratio, earnings growth rate, market price, EPS, market
returns, profitability, DPS, shareholders’ equity, total dividend paid and average total assets. The
model is specified as follows:
P/Eit = boit + b1DGRit+ b2DPORit+ b3EGRit + b4ASPit + b5EPSit+ b6MRit+ b7PRTtit +
b8DPSit+ b9SHEit + b10TDit + b11AAEitεit.
Where:
P/E is price-earnings ratio, bo is constant term, DGR is dividend growth rate, DPOR is dividend
pay-out ratio, EGR is earnings growth rate, ASP is average share price, EPS is earnings per
International Journal of Economics, Business and Management Research
Vol. 1, No. 05; 2017
ISSN: 2456-7760
www.ijebmr.com Page 60
share, MR is market return, PRT is profitability (proxy with return on equity), DPS is dividend
per share, SHE is shareholders’ equity (proxy with log of number of shares issued and ranking
for dividend), TD is total dividend paid, AAE is average assets employed, b1 to b11 are the
independent variables coefficients, i is specific firm, t is time and ε is the error term.
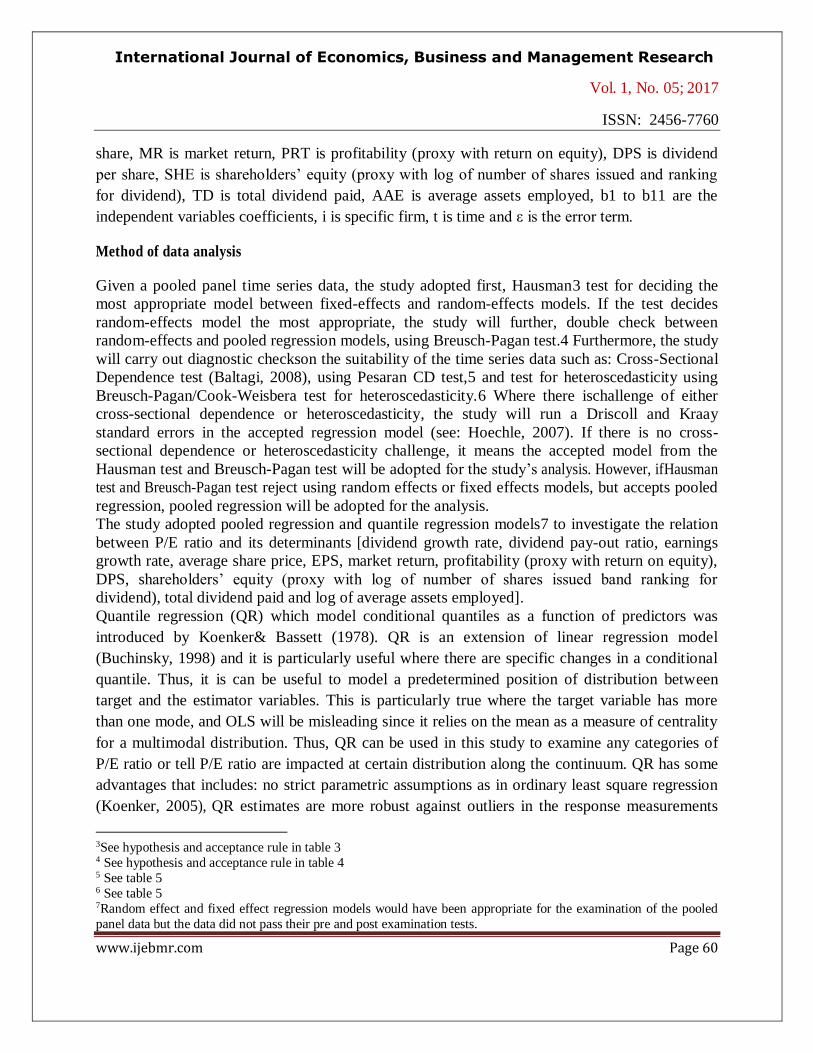
Method of data analysis
Given a pooled panel time series data, the study adopted first, Hausman3 test for deciding the
most appropriate model between fixed-effects and random-effects models. If the test decides
random-effects model the most appropriate, the study will further, double check between
random-effects and pooled regression models, using Breusch-Pagan test.4 Furthermore, the study
will carry out diagnostic checkson the suitability of the time series data such as: Cross-Sectional
Dependence test (Baltagi, 2008), using Pesaran CD test,5 and test for heteroscedasticity using
Breusch-Pagan/Cook-Weisbera test for heteroscedasticity.6 Where there ischallenge of either
cross-sectional dependence or heteroscedasticity, the study will run a Driscoll and Kraay
standard errors in the accepted regression model (see: Hoechle, 2007). If there is no cross-
sectional dependence or heteroscedasticity challenge, it means the accepted model from the
Hausman test and Breusch-Pagan test will be adopted for the study’s analysis. However, ifHausman
test and Breusch-Pagan test reject using random effects or fixed effects models, but accepts pooled
regression, pooled regression will be adopted for the analysis.
The study adopted pooled regression and quantile regression models7 to investigate the relation
between P/E ratio and its determinants [dividend growth rate, dividend pay-out ratio, earnings
growth rate, average share price, EPS, market return, profitability (proxy with return on equity),
DPS, shareholders’ equity (proxy with log of number of shares issued band ranking for
dividend), total dividend paid and log of average assets employed].
Quantile regression (QR) which model conditional quantiles as a function of predictors was
introduced by Koenker& Bassett (1978). QR is an extension of linear regression model
(Buchinsky, 1998) and it is particularly useful where there are specific changes in a conditional
quantile. Thus, it is can be useful to model a predetermined position of distribution between
target and the estimator variables. This is particularly true where the target variable has more
than one mode, and OLS will be misleading since it relies on the mean as a measure of centrality
for a multimodal distribution. Thus, QR can be used in this study to examine any categories of
P/E ratio or tell P/E ratio are impacted at certain distribution along the continuum. QR has some
advantages that includes: no strict parametric assumptions as in ordinary least square regression
(Koenker, 2005), QR estimates are more robust against outliers in the response measurements
3See hypothesis and acceptance rule in table 3 4 See hypothesis and acceptance rule in table 4 5 See table 5 6 See table 5 7Random effect and fixed effect regression models would have been appropriate for the examination of the pooled
panel data but the data did not pass their pre and post examination tests.
International Journal of Economics, Business and Management Research
Vol. 1, No. 05; 2017
ISSN: 2456-7760
www.ijebmr.com Page 61
(Rose, Pranger, Chen, Chatterjee, Wei, Heatwole& Warren (2017), QR overcomes various
problems that is frequently challenging to ordinary linear regression such as error terms not
constant across a distribution thereby violating the axiom of homoscedasticity (Abdullahi, 2015),
it is an effective method for investigating the relationship outside the mean between the response
variable and the predictive variables (Cade & Noon, 2003), and it is an effective model for
detecting relationship between variables when there is no, or a weak, relationship exists between
means (Cade & Noon, 2003).
PRESENTATION AND INTERPRETATION OF RESULTS
Hausman’s test, Breusch-Pagan tests anddiagnostic checks
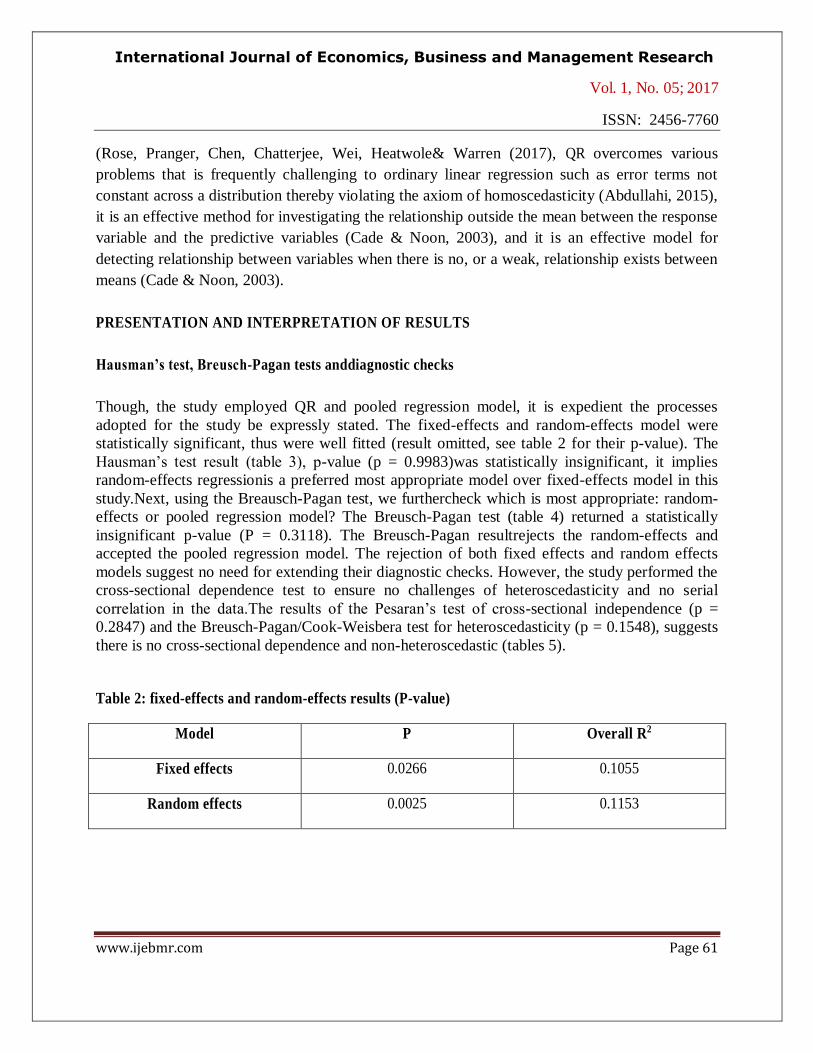
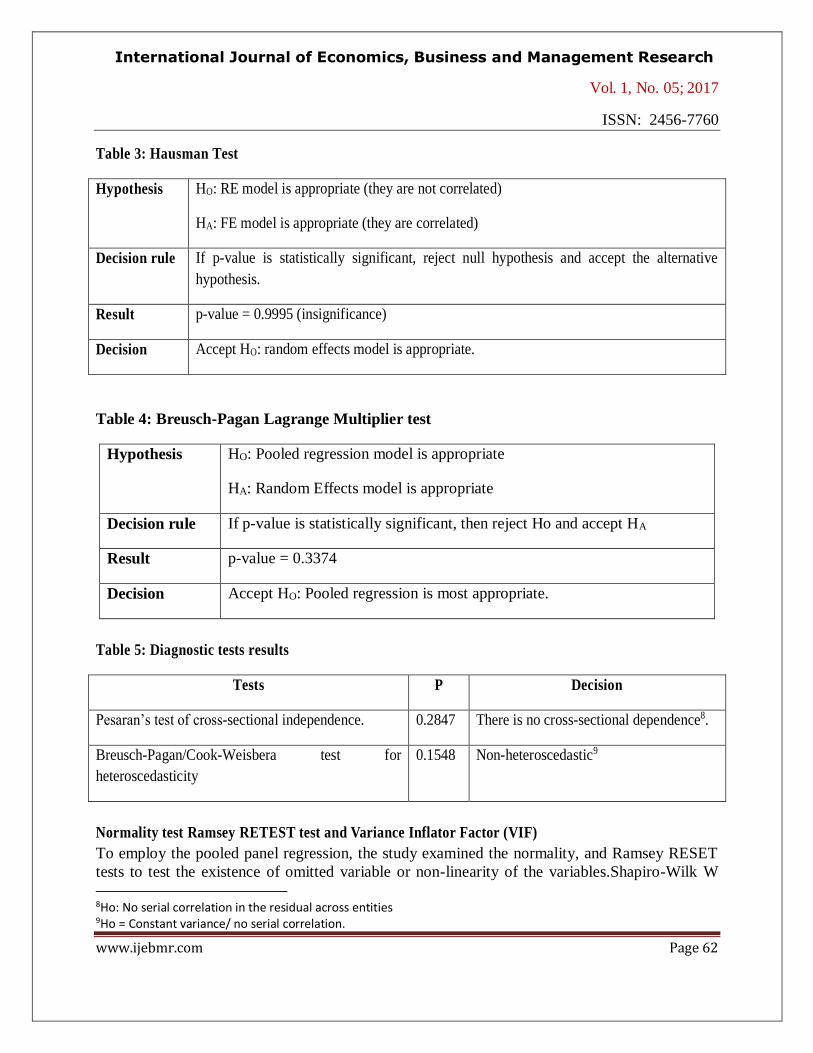
Though, the study employed QR and pooled regression model, it is expedient the processes
adopted for the study be expressly stated. The fixed-effects and random-effects model were
statistically significant, thus were well fitted (result omitted, see table 2 for their p-value). The
Hausman’s test result (table 3), p-value (p = 0.9983)was statistically insignificant, it implies
random-effects regressionis a preferred most appropriate model over fixed-effects model in this
study.Next, using the Breausch-Pagan test, we furthercheck which is most appropriate: random-
effects or pooled regression model? The Breusch-Pagan test (table 4) returned a statistically
insignificant p-value (P = 0.3118). The Breusch-Pagan resultrejects the random-effects and
accepted the pooled regression model. The rejection of both fixed effects and random effects
models suggest no need for extending their diagnostic checks. However, the study performed the
cross-sectional dependence test to ensure no challenges of heteroscedasticity and no serial
correlation in the data.The results of the Pesaran’s test of cross-sectional independence (p =
0.2847) and the Breusch-Pagan/Cook-Weisbera test for heteroscedasticity (p = 0.1548), suggests
there is no cross-sectional dependence and non-heteroscedastic (tables 5).
Table 2: fixed-effects and random-effects results (P-value)
Model P Overall R2
Fixed effects 0.0266 0.1055
Random effects 0.0025 0.1153
International Journal of Economics, Business and Management Research
Vol. 1, No. 05; 2017
ISSN: 2456-7760
www.ijebmr.com Page 62
Table 3: Hausman Test
Hypothesis HO: RE model is appropriate (they are not correlated)
HA: FE model is appropriate (they are correlated)
Decision rule If p-value is statistically significant, reject null hypothesis and accept the alternative
hypothesis.
Result p-value = 0.9995 (insignificance)
Decision Accept HO: random effects model is appropriate.
Table 4: Breusch-Pagan Lagrange Multiplier test
Hypothesis HO: Pooled regression model is appropriate
HA: Random Effects model is appropriate
Decision rule If p-value is statistically significant, then reject Ho and accept HA
Result p-value = 0.3374
Decision Accept HO: Pooled regression is most appropriate.
Table 5: Diagnostic tests results
Tests P Decision
Pesaran’s test of cross-sectional independence. 0.2847 There is no cross-sectional dependence8.
Breusch-Pagan/Cook-Weisbera test for
heteroscedasticity
0.1548 Non-heteroscedastic9
Normality test Ramsey RETEST test and Variance Inflator Factor (VIF)
To employ the pooled panel regression, the study examined the normality, and Ramsey RESET
tests to test the existence of omitted variable or non-linearity of the variables.Shapiro-Wilk W
8Ho: No serial correlation in the residual across entities 9Ho = Constant variance/ no serial correlation.
International Journal of Economics, Business and Management Research
Vol. 1, No. 05; 2017
ISSN: 2456-7760
www.ijebmr.com Page 63
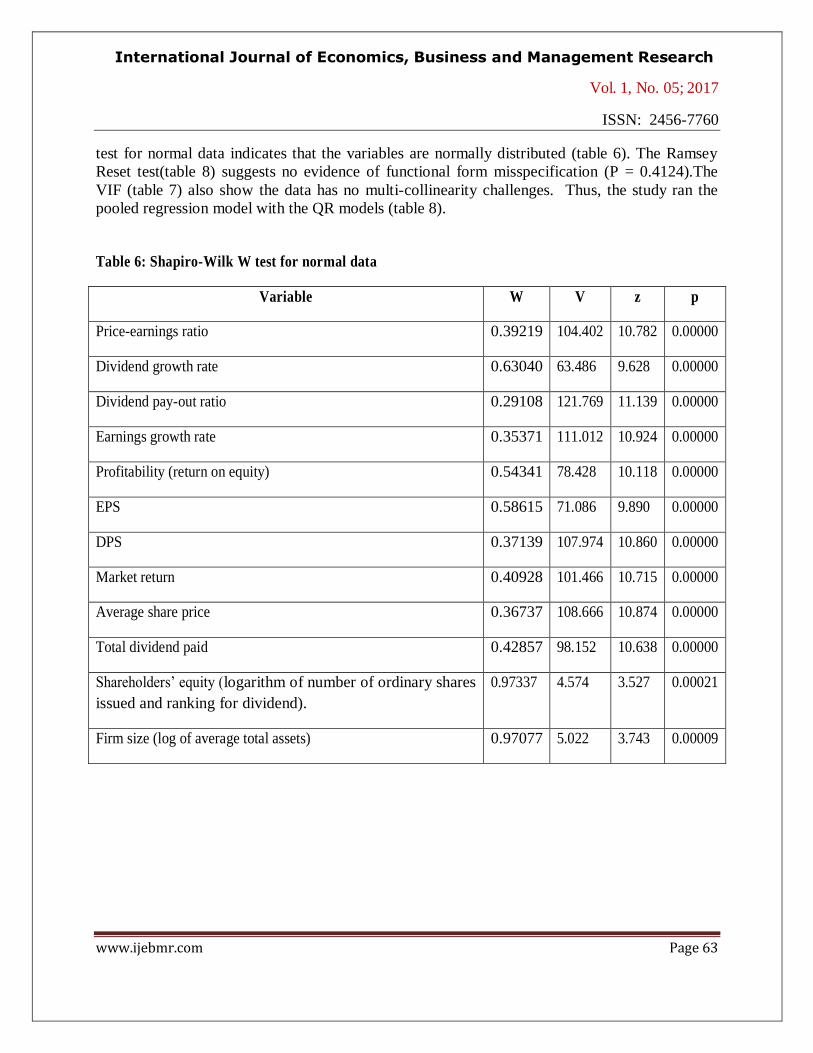
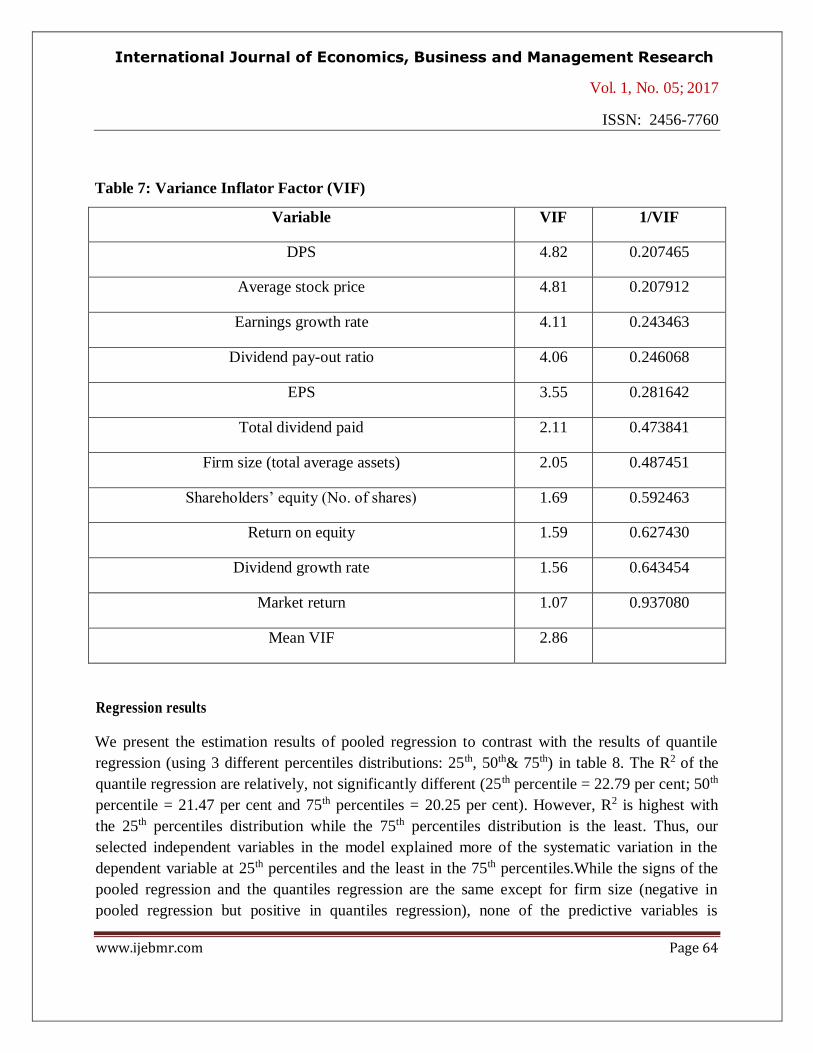
test for normal data indicates that the variables are normally distributed (table 6). The Ramsey
Reset test(table 8) suggests no evidence of functional form misspecification (P = 0.4124).The
VIF (table 7) also show the data has no multi-collinearity challenges. Thus, the study ran the
pooled regression model with the QR models (table 8).
Table 6: Shapiro-Wilk W test for normal data
Variable W V z p
Price-earnings ratio 0.39219 104.402 10.782 0.00000
Dividend growth rate 0.63040 63.486 9.628 0.00000
Dividend pay-out ratio 0.29108 121.769 11.139 0.00000
Earnings growth rate 0.35371 111.012 10.924 0.00000
Profitability (return on equity) 0.54341 78.428 10.118 0.00000
EPS 0.58615 71.086 9.890 0.00000
DPS 0.37139 107.974 10.860 0.00000
Market return 0.40928 101.466 10.715 0.00000
Average share price 0.36737 108.666 10.874 0.00000
Total dividend paid 0.42857 98.152 10.638 0.00000
Shareholders’ equity (logarithm of number of ordinary shares
issued and ranking for dividend).
0.97337 4.574 3.527 0.00021
Firm size (log of average total assets) 0.97077 5.022 3.743 0.00009
International Journal of Economics, Business and Management Research
Vol. 1, No. 05; 2017
ISSN: 2456-7760
www.ijebmr.com Page 64
Table 7: Variance Inflator Factor (VIF)
Variable VIF 1/VIF
DPS 4.82 0.207465
Average stock price 4.81 0.207912
Earnings growth rate 4.11 0.243463
Dividend pay-out ratio 4.06 0.246068
EPS 3.55 0.281642
Total dividend paid 2.11 0.473841
Firm size (total average assets) 2.05 0.487451
Shareholders’ equity (No. of shares) 1.69 0.592463
Return on equity 1.59 0.627430
Dividend growth rate 1.56 0.643454
Market return 1.07 0.937080
Mean VIF 2.86
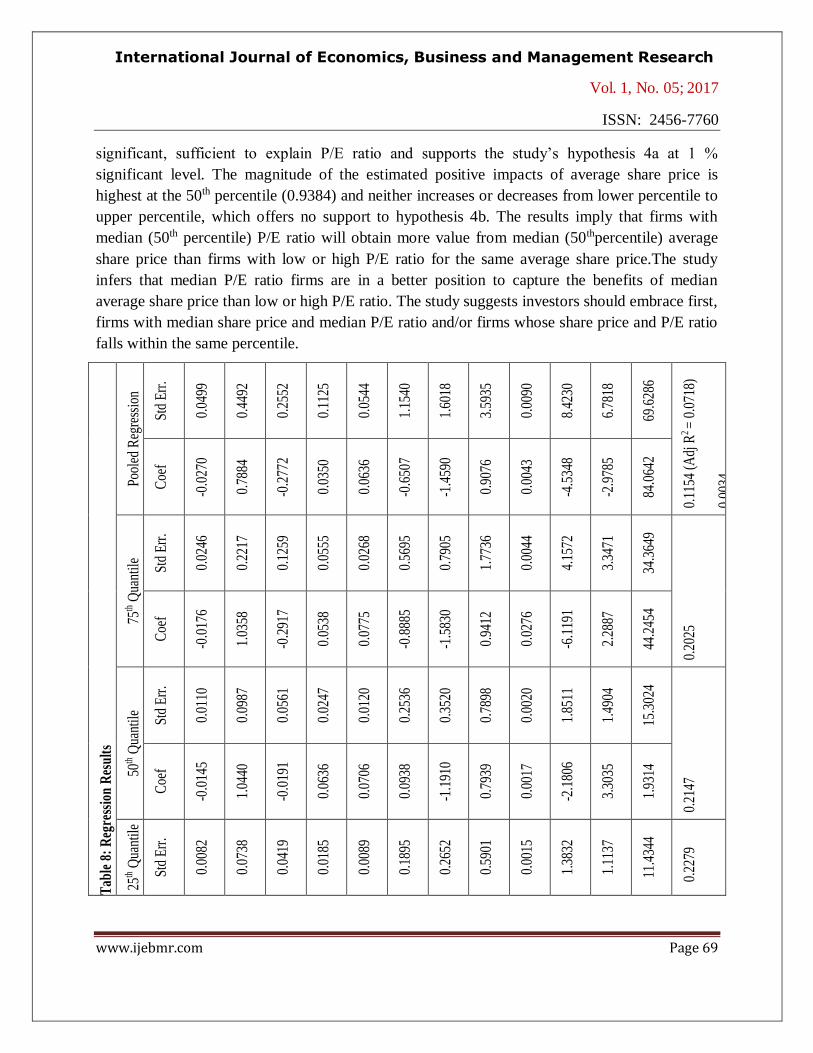
Regression results
We present the estimation results of pooled regression to contrast with the results of quantile
regression (using 3 different percentiles distributions: 25th, 50th& 75th) in table 8. The R2 of the
quantile regression are relatively, not significantly different (25th percentile = 22.79 per cent; 50th
percentile = 21.47 per cent and 75th percentiles = 20.25 per cent). However, R2 is highest with
the 25th percentiles distribution while the 75th percentiles distribution is the least. Thus, our
selected independent variables in the model explained more of the systematic variation in the
dependent variable at 25th percentiles and the least in the 75th percentiles.While the signs of the
pooled regression and the quantiles regression are the same except for firm size (negative in
pooled regression but positive in quantiles regression), none of the predictive variables is
International Journal of Economics, Business and Management Research
Vol. 1, No. 05; 2017
ISSN: 2456-7760
www.ijebmr.com Page 65
significant to explain P/E ratio with pooled regression. The relatively low value of the R2 for the
results (it is 11.54 per cent in the pooled regression), is an indication of the difficulty in
explaining the determinants of price-earnings ratio for non-financial firms listed in the NSE over
the examined period. The low R2 values suggests that more variables are needed to improve the
predictive ability of P/E ratio for non-financial firms listed in the NSE.
A critical observation shows that 3 of the explanatory variables (dividend pay-out ratio, share
price and DPS) are significant to explain P/E ratio at all examined percentiles.Generally, the
strongest and positive determinants of P/E ratio from the results are pay-out ratio followed by
share price amongst the non-financial firms listed in the NSE over the examined period.
Dividend growth rate and shareholders’ equity (proxy with log of number of shares issued and
ranking for dividend) are not significant to explain P/E ratio neither in the pooled regression
model nor in the QR model.
Dividend growth rate [25th percentile = -0.0195(0.115), 50th percentile = -0.0145(0.187), 75th
percentile = -0.0176(0.476) and pooled regression = -0.0270(0.589)] coefficients are both
insignificantly negative with P/E ratio in QR and pooled regression models, indicating that
dividend growth rate has a negative impact on P/E ratio. The finding did not support the study’s
hypothesis 1a. Specifically, the magnitude of the estimated negative effects of dividend growth
rate did not gradually decreases nor increases from lower percentile to upper percentile of the
P/E ratio distribution: which offers no support to hypothesis 1b. The results did not also
corroborate Reilly et al (1983) that showed direct relation between P/E ratio and dividend growth
rate in a study of quarterly Standard and Poor 500 data for the period 1963-1980 and is also not
sufficient to explain movements in P/E ratio for non-financial firms listed in the NSE over the
period examined. Although, the results are not sufficient to explain movement in P/E ratio, it
however tends to suggest that dividend growth rate is inversely related to P/E ratio, but not
moving in the same direction as theoretically expressed.
Dividend pay-out ratio [25th percentile = 0.9904(0.000), 50thpercentile = 1.0440(0.000), 75th
percentile = 1.0358(0.000) and pooled regression = 0.7884(0.081)] coefficients are both positive
with P/E ratio in QR and pooled regression models, except that it is significant in the QR model.
It indicates that with QR model, dividend pay-out ratio has a positive impact that is sufficient to
explain P/E ratio at 1 per cent level of significant in the examined percentiles. The results
support hypothesis 2a (except with the pooled regression model) and the magnitude of the
estimated positive impacts of dividend pay-out ratio did not gradually decreases or increases
from lower percentile to higher percentile of the P/E ratio distribution, instead, it is highest at the
50th percentile (coefficient of 1.0440) which offers no support to hypothesis 2b. For example, the
dividend pay-out ratio coefficient is 0.9904, 1.0440 and 1.0358 at 25th, 50th and 90th percentiles,
respectively. The results of the QR model further corroborates Arnott &Asness (2003) and Ping
International Journal of Economics, Business and Management Research
Vol. 1, No. 05; 2017
ISSN: 2456-7760
www.ijebmr.com Page 66
&Ruland (2008) that showed positive bearings between dividend pay-out ratio and P/E ratio. It
however, disagrees with Khan et al (2016) that showed P/E ratio has no impact on dividend pay-
out ratio. The results imply that firms with themedian P/E ratio derive more value from median
dividend pay-out ratio than from low or high dividend pay-out ratio. Perhaps, firm’s value may
be affected with increase or decrease in dividend pay-out ratio from the median position,
particularly that theoretically, dividend pay-out ratio is inversely related to firm’s need such as
financing firms’ growth. A high pay-out ratio means that external financing costs and firm’s
financial risk may increase. Where high dividend pay-out ratio leads to high price-earnings ratio,
the return and stock value expected by investors may rise (Wenjing, 2008) since risk and return
are directly related. However, the study suggests that level of dividend pay-out ratio and P/E
ratio should be within same percentile.
Earnings growth rate [25th percentile = -0.0699(0.097), 50th percentile = -0.0191(0.734), 75th
percentile = -0.2917(0.021) and pooled regression = -0.2772(0.279)] coefficients are both
negativewith P/E ratio in QR and pooled regression models, indicating that earnings growth rate
has a negative influence on P/E ratio. However, earnings growth rate impact is significant with
P/E ratio and thus, support the study’s hypothesis 3a only at the 75th percentile distribution at 5
per cent significant level. The magnitude of the estimated negative influences of earnings growth
rate is highest at the 75th percentile distribution but did not increase or decreases from lower
percentile to higher percentile of the P/E ratio distribution, which offers no support to hypothesis
3b. Only the result at the 75th percentile distribution corroborates an earlier study that show
growth rate is a significant determinant of P/E ratio (Bakshi& Chan, 2000) but disagrees with the
findings that show direct relation between earnings growth and P/E ratio (Reilly et al., 1983;
Loughli, 1996; White, 2000). The result implies that firms with high (75th percentile distribution)
P/E ratio derive more value from low earnings growth rate than firms with high P/E ratio for the
same earnings growth rate. The implication of the result at the 75th percentile distribution of P/E
ratio is that investors may perceive that there exist little or no unusual earnings opportunities at
the lower percentile distributions but only at the 75th percentile distribution. This may however,
be due to temporary factors peculiar to the firm, which may cause low earnings growth rate or
increasing risk (see: Beaver & Morse, 1978). Furthermore, in terms of valuable investment
opportunities, firms with low price-earnings ratio is preferred to the ones with high P/E ratio
(Sezgin, 2010; Basu, 1977). This is particularly true because, firms with little earnings would
probably depict higher P/E ratio and investors would be more cautious to make investment,
except for loss or very low profit making firms. A further caution is that since earnings growth
rate is inversely associated with P/E ratio, at low earnings growth, firms may have to raise
external funds to expand or make investment, and unless they operate minimum dividend pay-
out policy, they may face increasing financial risk and cost of debt. On the other hand, given the
inverse association between earnings growth and P/E ratio, a high earnings growth and a low
International Journal of Economics, Business and Management Research
Vol. 1, No. 05; 2017
ISSN: 2456-7760
www.ijebmr.com Page 67
dividend pay-out ratio within the 75th percentile distribution firm means that the firm might be
relatively self-sufficient to sustain expansion. Though, this study recommends low P/E ratio and
high earnings growth firm within the 75th percentiles firms for an investors’ valuable P/E ratio,
however, investors rational for making investment will still play key role in decision to invest:
either to pay higher amount for low earnings growth or lower amount to high earnings growth.
Profitability (proxy with return on equity) [25th percentile = 0.0456(0.014), 50th percentile =
0.0636(0.011), 75th percentile = 0.0538(0.334) and pooled regression = 0.0350(0.756)]
coefficients are both positive with P/E ratio in QR and pooled regression models. It indicates that
profitability of firms has a positive bearing on P/E ratio. The results are however, only
significant at 5 per cent level of significant and sufficient to explain movement in P/E ratio at the
25th and 50th percentiles distribution and however, did not support the study’s hypothesis 7a. The
magnitude of the estimated positive impact did not gradually increase or decreases from lower
percentile to upper percentile of the P/E ratio distribution, which offers no support for hypothesis
7b. The highest magnitude is found at the 50th percentile distribution (0.0636). The QR result at
the 25thand 50thpercentiles, corroborated Wu (2014) and Truong (2009) that showed that superior
return is associated with low price-earnings ratio. It however, did not support Premkanth (2013)
that show return on equity impact negatively on price-earnings ratio but not sufficient to explain
price-earnings ratio. The implications of the results at the 25th and 50th percentiles distribution
should be taken with caution. On one hand, it is argued that firms having higher price-earnings
ratio are considered to have significant prospects for growth (Hillier et al., 2010) and on the
other hand, in terms of valuable investment opportunities, it is argued that stocks with relatively
low price-earnings ratio is preferred to one with high price-earnings ratio (Sezgin, 2010; Basu,
1977). Furthermore, given that low P/E ratio is associated with mature, stable and moderate
growth potential sector, potential investors are in the best position to advise themselves.
Earnings per share [25th percentile = -0.0552(0.771), 50th percentile = -0.8150(0.002), 75th
percentile = -0.8885(0.120) and -0.6507(0.573)] coefficients are both negative with P/E ratio in
QR and pooled regression models, indicating that EPS of firms has negative bearings on P/E
ratio. However, it is only statistically significant, supports hypothesis 5a and is sufficient to
explain P/E ratio at the 50th percentile distribution at 1 per cent level of significance. The
magnitude of the estimated negative impacts of EPS gradually increases from lower percentile to
upper percentile of the P/E ratio distribution, which offers support to hypothesis 5b. It may be
implied from the results that firms at the 75th percentile P/E ratio derive more value from the 75th
percentile EPS than firms with low or higher P/E ratio for the same EPS. But for sufficiency to
explain the result, the result of the P/E ratio 50th percentile distribution firms are better off to
attract prospective investors. at the corresponding 50th EPS percentile distribution. Thus, the
International Journal of Economics, Business and Management Research
Vol. 1, No. 05; 2017
ISSN: 2456-7760
www.ijebmr.com Page 68
study suggests investors invest in firms whose earnings per share and P/E ratio falls within the
50th percentiles for optimal benefits.
Dividend per share (DPS) [25th percentile = -0.7002(0.008), 50th percentile = -1.1910(0.001), 75th
percentile = -1.5830(0.046) and pooled regression = -1.4590(0.363)] coefficients are both
negative with P/E ratio in QR and pooled regression models, indicating that the DPS of firms has
negative effects on P/E ratio. However, only the effects of the QR are significant to explain P/E
ratio but they did not support hypothesis 8a. The QR results corroborates Mirfakhret al (2011)
that found negative and significant relation between DPS and P/E ratio and generally,
contradicted Nikbakht&Polat (1998) argument that increase in dividend should produce higher
P/E ratio. The study’s result shows that the magnitude of the estimated negative effects of DPS
gradually increases from 25th percentile distribution to 75th percentile distribution, which offers
support to hypothesis 8b. For example, the DPS coefficient is -0.7002, -1.1910 and -1.5830 at
25t, 50th and 75th percentiles, respectively. As the percentiles increase, the magnitude of DPS
coefficient also increases. The implication of the results is that firms with high P/E ratio
percentiles distribution derive more value from a lower degree of DPS percentiles distribution
than firms with high P/E ratio percentile distribution for the same degree of DPS: the reverse is
the case for firms with low P/E ratio taken into consideration, the inverse association between
DPS and P/E ratio. The study infers that high P/E ratio firms are better-off given their magnitude
for attracting low DPS within the same percentile.
Market return [25th percentile = 1.5397(0.010), 50th percentile = 0.7939(0.316), 75th percentile =
0.9412(0.596) and pooled regression = 0.9076(0.801)] coefficients are both positive with P/E
ratio in QR and pooled regression models, signifying that the market return of firms has a
positive influence on P/E ratio. However, only the 25th percentile distribution result is
significant, supports hypothesis 6a and is sufficient to explain P/E ratio at 1 per cent significant
level. The result corroborates earlier studies by White (2000) and Afza& Tahir (2012) that found
positive and significant relation between market return and P/E ratio. Specifically, the study
observes that the magnitude of the estimated positive impacts of market return did not gradually
increases or decreases from lower percentile to upper percentiles, rather, it is highest at the lower
(25th) percentile. Thus hypothesis 6b is not supported. The QR at the 25th percentile suggests
firms with low P/E ratio derive more value from low market return than firms with high P/E ratio
for the same market return. The QR at the 25th percentiles imply that firms with low market
return and low P/E ratio should attract more investors for better value.
Average share price [25th percentile = 0.0284(0.002), 50th percentile = 0.9384(0.000), 75th
percentile = 0.0775(0.004) and pooled regression = 0.0636(0.243)] coefficients are both positive
with P/E ratio in QR and pooled regression models, signifying that the average share price of
firms has a positive impact on P/E ratio. Nevertheless, only the QR results are statistically
International Journal of Economics, Business and Management Research
Vol. 1, No. 05; 2017
ISSN: 2456-7760
www.ijebmr.com Page 69
significant, sufficient to explain P/E ratio and supports the study’s hypothesis 4a at 1 %
significant level. The magnitude of the estimated positive impacts of average share price is
highest at the 50th percentile (0.9384) and neither increases or decreases from lower percentile to
upper percentile, which offers no support to hypothesis 4b. The results imply that firms with
median (50th percentile) P/E ratio will obtain more value from median (50thpercentile) average
share price than firms with low or high P/E ratio for the same average share price.The study
infers that median P/E ratio firms are in a better position to capture the benefits of median
average share price than low or high P/E ratio. The study suggests investors should embrace first,
firms with median share price and median P/E ratio and/or firms whose share price and P/E ratio
falls within the same percentile.
Tab
le 8
: R
egre
ssio
n R
esul
ts
Pool
ed R
egre
ssio
n
Std
Err
.
(t)
0.04
99
(-0.
54)
0.44
92
(1.7
6)
0.25
52
(-1-
09)
0.11
25
(0.3
1)
0.05
44
(1.1
7)
1.15
40
(-0.
56)
1.60
18
(-0.
91)
3.59
35
(0.2
5)
0.00
90
(0.3
8)
8.42
30
(-0.
54)
6.78
18
(-0.
44)
69.6
286
(1.2
1)
0.1
154
(Adj
R2 =
0.0
718)
0.0
034
0.3
891
Coe
f
(p)
-0.0
270
(0.5
89)
0.78
84
(0.0
81)
-0.2
772
(0.2
79)
0.03
50
(0.7
56)
0.06
36
(0.2
43)
-0.6
507
(0.5
73)
-1.4
590
(0.3
63)
0.90
76
(0.8
01)
0.00
43
(0.7
02)
-4.5
348
(0.5
91)
-2.9
785
(0.6
61)
84.0
642
(0.2
29)
75th
Qua
ntile
Std
Err
.
(t)
0.02
46
(-0.
71)
0.22
17
(4..6
7)
0.12
59
(-2.
32)
0.05
55
(0.9
7)
0.02
68
(2.8
9)
0.56
95
(-1.
56)
0.79
05
(-2.
00)
1.77
36
(0.5
3)
0.00
44
(0.6
2)
4.15
72
(-1.
47)
3.34
71
(0.6
8)
34.3
649
(1.2
9)
0.2
025
Coe
f
(p)
-0.0
176
(0.4
76)
1.03
58
(0.0
00)
-0.2
917
(0.0
21)
0.05
38
(0.3
34)
0.07
75
(0.0
04)
-0.8
885
(0.1
20)
-1.5
830
(0.0
46)
0.94
12
(0.5
96)
0.02
76
(0.5
33)
-6.1
191
(0.1
42)
2.28
87
(0.4
95)
44.2
454
(0.1
99)
50th
Qua
ntile
Std
Err
.
(t)
0.01
10
(-1.
32)
0.09
87
(10.
58)
0.05
61
(-0.
34)
0.02
47
(2.5
7)
0.01
20
(7.8
5)
0.25
36
(-3.
21)
0.35
20
(-3.
38)
0.78
98
(1.0
1)
0.00
20
(0.8
5)
1.85
11
(-1.
18)
1.49
04
(2.2
2)
15.3
024
(0.5
4)
0.2
147
Coe
f
(p)
-0.0
145
(0.1
87)
1.04
40
(0.0
00)
-0.0
191
(0.7
34)
0.06
36
(0.0
11)
0.07
06
(0.0
00)
0.09
38
(0.0
00)
-1.1
910
(0.0
01)
0.79
39
(0.3
16)
0.00
17
(0.3
96)
-2.1
806
(0.2
40)
3.30
35
(0.0
28)
1.93
14
(0.8
97)
25th
Qua
ntile
Std
Err
.
(t)
0.00
82
(-1.
58)
0.07
38
(13.
43)
0.04
19
(-1.
67)
0.01
85
(2.4
7)
0.00
89
(3.1
8)
0.18
95
(-0.
29)
0.26
52
(-2.
49)
0.59
01
(2.6
1)
0.00
15
(2.9
2)
1.38
32
(-1.
29)
1.11
37
(1.4
9)
11.4
344
(-0.
00)
0
.227
9
International Journal of Economics, Business and Management Research
Vol. 1, No. 05; 2017
ISSN: 2456-7760
www.ijebmr.com Page 70
Coe
f
(p)10
-0
.019
5
(0.1
15)
0.99
04
(0.0
00)
-0.0
699
(0.0
97)
0.04
56
(0.0
14)
0.02
84
(0.0
02)
-0.0
552
(0.7
71)
-0.7
002
(0.0
08)
1.53
97
(0.0
10)
0.00
43
(0.0
04)
-1.7
779
(0.2
00)
1.65
63
(0.1
38)
-0.0
083
(0.9
99)
Var
iabl
e
Div
iden
d gr
owth
rat
e
Div
iden
d pa
y-ou
t rat
io
Ear
ning
s gr
owth
rat
e
Prof
itabi
lity
(Ret
urn
on e
quity
)
Ave
rage
sha
re p
rice
Ear
ning
s pe
r sh
are
Div
iden
d pe
r sh
are
Mar
ket r
etur
n
Tot
al d
ivid
end
paid
Shar
ehol
ders
’ eq
uity
(N
o. o
f sh
ares
rank
ing
Firm
siz
e (A
vera
ge to
tal a
sset
s)
_con
s
R2
Prob
. > F
Ram
sey
RE
SET
test
11
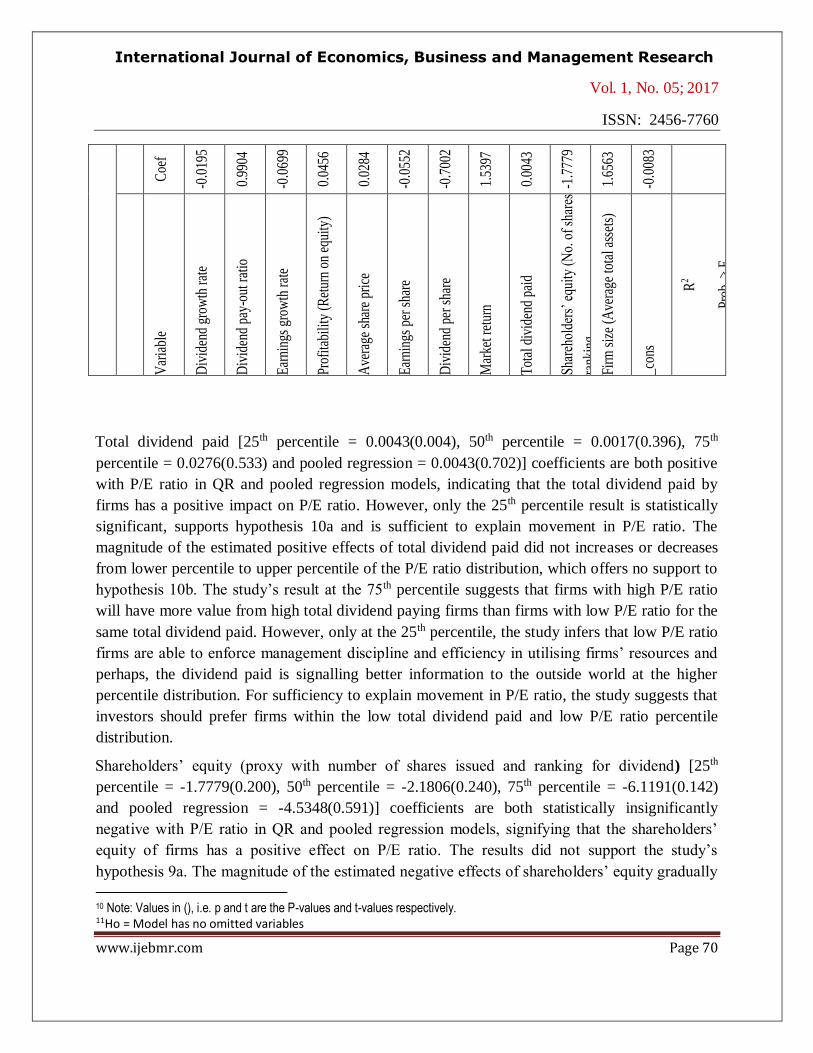
Total dividend paid [25th percentile = 0.0043(0.004), 50th percentile = 0.0017(0.396), 75th
percentile = 0.0276(0.533) and pooled regression = 0.0043(0.702)] coefficients are both positive
with P/E ratio in QR and pooled regression models, indicating that the total dividend paid by
firms has a positive impact on P/E ratio. However, only the 25th percentile result is statistically
significant, supports hypothesis 10a and is sufficient to explain movement in P/E ratio. The
magnitude of the estimated positive effects of total dividend paid did not increases or decreases
from lower percentile to upper percentile of the P/E ratio distribution, which offers no support to
hypothesis 10b. The study’s result at the 75th percentile suggests that firms with high P/E ratio
will have more value from high total dividend paying firms than firms with low P/E ratio for the
same total dividend paid. However, only at the 25th percentile, the study infers that low P/E ratio
firms are able to enforce management discipline and efficiency in utilising firms’ resources and
perhaps, the dividend paid is signalling better information to the outside world at the higher
percentile distribution. For sufficiency to explain movement in P/E ratio, the study suggests that
investors should prefer firms within the low total dividend paid and low P/E ratio percentile
distribution.
Shareholders’ equity (proxy with number of shares issued and ranking for dividend) [25th
percentile = -1.7779(0.200), 50th percentile = -2.1806(0.240), 75th percentile = -6.1191(0.142)
and pooled regression = -4.5348(0.591)] coefficients are both statistically insignificantly
negative with P/E ratio in QR and pooled regression models, signifying that the shareholders’
equity of firms has a positive effect on P/E ratio. The results did not support the study’s
hypothesis 9a. The magnitude of the estimated negative effects of shareholders’ equity gradually
10 Note: Values in (), i.e. p and t are the P-values and t-values respectively. 11Ho = Model has no omitted variables
International Journal of Economics, Business and Management Research
Vol. 1, No. 05; 2017
ISSN: 2456-7760
www.ijebmr.com Page 71
increases from lower quantile to upper quantile of the P/E ratio distribution, which is in
agreement with hypothesis 9b. For example, the shareholders’ equity coefficient is -1.7779, -
2.1806 and -6.1191 at 25th, 50th and 75th percentiles, respectively. The coefficient of the quantile
increases as the quantiles increases. Nevertheless, the results are not sufficient to explain P/E
ratio.
Firm size (proxy with average assets employed) [25th percentile = 1.6563(0.138), 50th percentile
= 3.3035(0.028), 75th percentile = 2.2887(0.495) and pooled regression = -2.9785(0.661)] QR
coefficients has insignificant positive impact with P/E ratio while the pooled regression
coefficient has insignificant negative impact with P/E ratio. The results did not support the
study’s hypothesis 11a. neither is it sufficient to explain movement in P/E ratio. The magnitude
of the estimated positive effects of firm size did not gradually increases or decreases from lower
percentile to upper percentile of the P/E ratio distribution, which offers no support for hypothesis
11b. The magnitude of the estimated positive effects of firm size on P/E ratio is greatest at the
50th percentile distribution. It nevertheless suggests firms’ value to investors is greatest at the
50th percentile distribution of firm size and P/E ratio distribution.
SUMMARY, CONCLUSION AND RECOMMENDATION
Summary and conclusion
After random-effects and fixed-effects regression failed pre and post estimation tests and checks,
the study employed pooled regression and QR models to examine the determinants of P/E ratio
in non-financial firms listed in the NSE over the period 2012-2016. The results showed that R2
was highest at the 25th percentile distribution, thus, our selected independent variables in the QR
model explained more of the systematic variation in the P/E ratio at 25th percentile and the least
is the 75th percentile. The bearings of the P/E ratio determinants are the same except for firm
size that has negative sign in the pooled regression while QR have positive signs. Dividend pay-
out ratio, share price, and DPS were generally statistically significant to explain P/E ratio
movement at the 25th, 50th and 75th percentiles distribution. Across the regression results, pay-
out ratio was the strongest determinant of P/E ratio followed by share price amongst the non-
financial firms listed in the NSE over the period examined. Dividend growth rate and
shareholders’ equity were not significant to explain P/E ratio at any of the examined percentiles
distribution nor in the pooled regression model.
At the 25th percentile distribution, dividend growth rate, earnings growth rate, EPS, DPS and
shareholders’ equity have negative impacts on P/E ratio, but only DPS has significantly negative
impact on P/E ratio at the 25th percentile distribution. At the 25th percentile distribution,
dividend pay-out ratio, profitability, market return, average share price, and total dividend paid
has positively significant impacts on P/E ratio while firm size has positive but insignificant
International Journal of Economics, Business and Management Research
Vol. 1, No. 05; 2017
ISSN: 2456-7760
www.ijebmr.com Page 72
impact on P/E ratio.At the 50th percentile, dividend pay-out ratio, profitability, average share
price and firm size has significantly positive impact on P/E ratio while market return and total
dividend paid has insignificantly positive influence on P/E ratio. on the other hand, earnings
growth rate and shareholders’ equity has insignificantly negative influence on P/E ratio while
EPS and DPS has significantly negative influence on P/E ratio.
At the 75th percentile, dividend growth rate, EPS and shareholders’’ equity has insignificantly
negative bearings with P/E ratio while earnings growth rate has a significantly negative bearing
with P/E ratio. On the other hand, dividend pay-out ratio and average share price has
significantly positive effects on P/E ratios while profitability, market return, total dividend paid
and firm size has insignificantly positive effects on P/E ratio. under the pooled regression model,
dividend paid-out ratio, profitability, market return, average share price and total dividend paid
return positive impacts on P/E ratio while dividend growth rate, earnings growth rate, EPS, DPS,
shareholders’ equity and firm size has negative impacts on P/E ratio. however, none of the
determinants has significant impacts on P/E ratio.
Recommendation
Based on results sufficiency to explain movement in P/E ratio, the study makes the following
recommendations which are further dependent on investors rational for investment. Since
earnings growth rate is inversely related to P/E ratio, at a lower earnings growth rate, firms will
have to raise additional external funds for expansion. And, if they must maintain high dividend
pay-out policy, it means they may be facing increasing financial risk or high cost of debt. On the
other hand, combining a high earnings growth and a low P/E ratio, firms may be self-sufficient to
sustain future expansion. Thus, this study recommends low P/E ratio and a high earnings growth
ratio firm for an investors value for P/E consideration. The study also recommends that
inconsideration of P/E ratio as a valuation basis, investors should invest where dividend pay-out
ratio and P/E ratio are within the same percentile. Furthermore, the study recommends firms
having high P/E ratio and low earnings growth rate to that of a low P/E ratio and high earning
growth rate. This is because, they are inversely related but with a precaution since low P/E ratio
is associated with mature, stable and moderate growth potential sector (Anderson & Brooks,
2006). Investors should invest in firms having low market return and low P/E ratio for better
value and still, investors should embrace firms whose share price and P/E ratio are within the
same percentile: investing in firm whose share price is inversely related to P/E ratio should be
avoided since they may not be worthwhile to an investor. Finally, investors are recommended to
invest in firms whose total dividend paid is directly related to P/E ratio for optimal value, lower
total dividend and lower P/E ratio combination is recommended.
REFERENCES
Abbasi E &Pagghe A.M. 2013. The relationship between inflation, price-earnings ratio (p/e) and
price behavior of stocks in Tehran Stock Exchange. International Research Journal of
Management Sciences, 1(4): 98–104.
International Journal of Economics, Business and Management Research
Vol. 1, No. 05; 2017
ISSN: 2456-7760
www.ijebmr.com Page 73
Abdullahi I. 2015.Analysis of quantile regression as alternative to ordinary least squares
regression. Thesis submitted at the Department of Mathematics, Ahmadu Bello University, Zaria
Nigeria.
Afza T. & Tahir S. 2012. Determinants of price-earnings ratio: The case of chemical sector of
Pakistan. International Journal of Academic Research in Business and Social Sciences2(8): 331–
343.
Anderson K. & Brooks C. 2006. Decomposing the price-earnings ratio. Journal of Asset
Management6(6): 456–469.
Arnott R. &Asness C. 2003. Surprise! higher dividends = higher earnings growth. Financial
Analysts Journal, 59(1), 70–87.
Arslan M. & Zaman R. 2012. Impact of dividend yield and price earnings ratio on stock returns: a study
non-financial listed firms of Pakistan. Research Journal of Finance and Accounting, 5(19): 68–74.
Bakshi G. & Chan A. 2000. Price-to-earnings ratio and expected earnings growth rate in global
equity markets. Available at: http://citeseerx.ist.psu.edu/viewdoc/download?doi=1
0.1.1.197.2971&rep=rep retrieved 10 January, 2017.
Baltagi B.H. 2008. Forecasting with panel data. Journal of Forecasting,27(2): 153–173.
Basu S. 1977. Investment performance of common stock in relation to their P/E ratio: A test of
the efficienct market hypothesis. The Journal of Finance 32(3): 662–682.
Beaver W. & Morse D. 1978. What determines price-earnings ratio? Financial Analysts
Journal34(4): 65–76
Bhattacharyya S &Saxena A. 2009. Does the firm size matter? An empirical enquiry into the performance
of Indian manufacturing firms. Online: available @ mpra.ub.uni-muenchen.de/13029/MPRA/ MPRA Paper
No. 13029. Retrieved 15th October, 2017.
Breen W. 1968. Price-earning ratios and industry ralatives. Financial Analyst Journal24: 125–
127.
Buchinsky M. 1998. Recent advances in quantile regresion models: a practical guideline for
empirical research. Journal of Human Resources,33(1): 88–126.
Cade B.S & Noon B.R. 2003. A gentle introduction to quantile regression for ecologists.
Frontiers in Ecology and the Environment1(8): 412–420.
International Journal of Economics, Business and Management Research
Vol. 1, No. 05; 2017
ISSN: 2456-7760
www.ijebmr.com Page 74
Cornell B. 2010. Economic growth and equity investing. Financial Analysts Journal 66(1): 54–
64.
Emudainohwo O.B. &Tarurhor M.E. (2016). Accounting Information Impacts on Market Value of Equity:
Nigeria Experience. Ambrose Alli University (AAU) Journal of Management Sciences.7(2): 70–82.
Emudainohwo O.B. 2016. Firm Size and Firms’ Performance: Evidence from non-Financial Service
Industries in Nigeria. Ilorin Jounal of Management Science3(1): 1–17.
Ghayoumi A. F., Nayeri M. D, Ansari M. &Raeesi T. 2011. Value-relevance of accounting
information: evidence from Iranian Emerging Stock Exchange. World Academy of Science,
Engineering and Technology. International Journal of Social, Behavioural, Educational,
Economic, Business and Industrial Engineering5(6): 830–835.
Hillier D., Ross S.A., Westerfield R.W., Jaffe J.F. & Jordan B.D. 2010. Corporate finance.
McGraw-Hill Higher Education, London.
Hoechle D. 2007. Robust standard errors for panel regressions with cross-sectional dependence. The Stata
Journal x(x): 1–31.
Jensen M.C & Meckling W.H. 1976. Theory of the firm: managerial behaviour, agency costs,
and ownership structure. Journal of Financial Economics3: 305–360.
Kane A.; Marcus A. & Noh J. 1996. The P/E multiple and market volatility. Financial Analyst
Journal52(4): 16–24.
Khan M.N., Naeem M.U., Rizwan M. & Salman M. 2016. Factors affecting the firm dividend policy: an
empirical evidence from textile sector of Pakistan. International Journal of Advanced Scientific Research
and Management, 1(5): 144–149.
Koenker R. & Bassett G. 1978. Regression quantiles. Journal of Economic Perspective15(4):
143–156.
Koenker R. 2005. Quantile regression. New York: Cambridge University Press.
Kumar B.R. 2015. Determinants of value creation: An empirical examination from UAE market.
International Journal of Economics and Financial Issues 5(1): 75–85.
Kumar S. & Warne D.P. 2009. Parametric determinants of price-earnings ratio in Indian capital
markets. The ICFAI Journal of Applied Finance, 15(9): 63–82.

International Journal of Economics, Business and Management Research
Vol. 1, No. 05; 2017
ISSN: 2456-7760
www.ijebmr.com Page 75
Loughlin J.J. 1996. Determinants of price-earnings multiple for Standard and Poor’s 500
composite stock index and the effects of determinants volatility. Doctoral dissertation, St Louis
University, MO.
Malhotra N., Chandiwala B. & Tandon K. 2013. Determinants of stock prices: Empirical
evidence from NSE 100 companies. International Journal of Research in Management and
Technology3(3): 86–95.
Mantripragada K.G. 1979. Structural stability of P/E ratios of common stocks. Journal of
Business Research 7: 175–186.
Miller M.H & Modigliani F. 1961. Dividend policy, growth, and the valuation of shares. The
Journal of Business34: 411–433.
Miller M.H & Rock K. 1985. Dividend policy under asymmetric information. The Journal of
Finance40: 1031–1051.
Mirfakhr S.H., Dehavi H.D., Zarezadeh E., Armesh H., Manafi M. &Zraezadehand S. 2011. Fitting the
relationship between financial variables and stock price through fuzzy regression case study: Iran Khodro
Company. International Journal of Business and Social Science, 2(11): 140–146.
Neely A, Gregory M &Platts K. 2005. Performance measurement system design: a literature review and
research agenda, International Journal of Operations & Production Management, 25(12): 1228–1263.
Nikbakhi E & Polat C. 2014.A global perspective of P/E ratio determinants: the case of ADRS.
Global Finance Journal, 9(2): 253–267
Niresh A.J. &Velnampy T. 2014. Firm size and profitability: a study of listed manufacturing firms in Sri
Lanka.International Journal of Business and Management; 9(4): 57–64.
Pandey I.M. 2015.Financial management, 11th Edition, Vikas Publishing House.
Ping, Z. &Ruland P. 2006, Dividend pay-out and future earnings growth. Financial Analysts
Journal, 62(1), 58–69.
Premkanth P. 2013. Determinant of price earning multiple in Sri Lanka listed companies.
European Journal of Business and Innovation Research1(2): 44–56.
Ramcharran H. 2002. An empirical analysis of the determinants of the P/E ratio in emerging
markets. Emerging Markets Review3: 165–178.
International Journal of Economics, Business and Management Research
Vol. 1, No. 05; 2017
ISSN: 2456-7760
www.ijebmr.com Page 76
Reilly F.K., Griggs FT. & Wang W. 1983. Determinants of the aggregate stock market earnings
multiple. Journal of Portfolio Management1(1): 36–45.
Rose A., Pranger F., Chen Z., Chatterjee S., Wei D., Heatwole N. & Warren E. 2017. Springer
Nature, Singerpore Pte Ltd.
Sezgin F.H. 2010. An empirical investigation of the relationship among P/E ratio, stock returns
and dividend yields for Instanbul Stock Exchange. International Journal of Economic and
Finanace Studies2(1): 15–23.
Truong C. 2009. Value investing using price earnings ratio in New Zealand. Business Review,
11(1): 1–7.
Ward M. & Stathoulis J. 1993/94. An analysis of the price/earning ratio of the industrial sector of
the Johannesburg Stock Exchange. Investment Analysts Journal 38: 37–42
Wenjing H. 2008. Price –earnings ratio and influence factors: evidence from China. Master’s
Thesis in Accounting and Finance. University of VAASA, Finland, Faculty of Business Studies,
Department of Accounting and Finance.
White C.B. 2000. What P/E will the US stock market support? Financial Analysts Journal56(6):
30–38.
Wooldridge J.M. 2002. Econometric analysis of cross section and panel data. Cambridge, M.A:
MIT Press
Wu W. 2014. The P/E ratio and profitability. Journal of Business and Economics Research12(1):
67–76.