determinants of international portfolio investment flows to a small market: empirical evidence
TRANSCRIPT

J. of Multi. Fin. Manag. 15 (2005) 211–233
Determinants of international portfolio investmentflows to a small market: Empirical evidence
Eva Liljeblom∗, Anders LoflundSwedish School of Economics and Business Administration, P.O. BOX 479, 00101 Helsinki, Finland
Received 6 May 2003; accepted 12 September 2004Available online 19 March 2005
Abstract
This paper investigates the determinants of foreign portfolio investment flows into a market onwhich restrictions for foreign investments were removed in 1993, the Finnish stock market. Duringour research period, the relative share of the Finnish stock market owned by foreign investors hadgrown rapidly and was in December 1998, 53% of the total market value of the listed shares. Usingcompany-specific data on the degree of foreign ownership, we report that foreign investment flowsare above all significantly related to variables related to (i) investment barriers, as proxied by the vari-ables Dividend yield, Liquidity, and firm size, and (ii) profitability or risk related variables. Additionalanalysis of subsequent portfolio performance did not provide robust evidence of apparent informa-tional differences, which would result in either group (foreign or domestic investors) systematicallyoutperforming the other.© 2005 Elsevier B.V. All rights reserved.
JEL classification:G11; F2
Keywords: International diversification; Portfolio flows; Home bias
1. Introduction
The two recent decades have evidenced a general relaxation of restrictions for foreignportfolio investments in the most developed countries. Despite the benefits of international
∗ Corresponding author. Tel.: +358 9 431 33 291; fax: +358 9 431 33 393.E-mail address:[email protected] (E. Liljeblom).
1042-444X/$ – see front matter © 2005 Elsevier B.V. All rights reserved.doi:10.1016/j.mulfin.2004.09.003

212 E. Liljeblom, A. Loflund / J. of Multi. Fin. Manag. 15 (2005) 211–233
diversification, as documented in a large number of international studies1 and surveyed, e.g.in Shawky et al. (1997), a strong domestic bias as documented, e.g. byFrench and Poterba(1991), Cooper and Kaplanis (1994)and Tesar and Werner (1995), and surveyed, e.g.in Lewis (1999), seems to exist in national equity portfolios. Although some differencesin relative portfolio weights for investors from different countries can be explained byinternational asset pricing models,2 Cooper and Kaplanis (1994)showed that the magnitudeof deviations from PPP combined with plausible deadweight cost estimates would be ableto explain the observed home bias only if investors have very low levels of risk aversion.
Other suggested explanations for an observed home bias include various barriers due to,e.g. (1) transaction costs, (2) differences in taxation, (3) exchange rate and capital marketregulation and other restrictions for international investments, (4) omitted assets,3 (5) infor-mational differences, and (6) barriers due to investors’ attitudes.Tesar and Werner (1995)found that the turnover of foreign portfolio holdings was much higher than the turnoveron the domestic market, a phenomenon, which suggests that variable transaction costs areunlikely to explain the home bias. BothFrench and Poterba (1991)andCooper and Kaplanis(1994)found that the home bias was much more severe than what could be explained by theeffects of differential taxation. Finally, most forms of direct capital market regulation wereabolished in the 1980s in major developed countries. Political risk remains, butFrankel’s(1991)measures for the political risks, as reflected in interest rate differences, indicated thatthey were too small in order to explain a significant part of the observed home bias.Glassmanand Riddick (2001)tested jointly the effects of perceived riskiness of foreign assets as wellas effects of omitted assets, and found that no individual adjustment as such was sufficient,although combined effects produced a more promising albeit somewhat insufficient result.
Asymmetric information between domestic and foreign investors has been suggested,e.g. byLow (1992), Gehrig (1993), Gordon and Bovenberg (1996), Kang and Stulz (1997),andBrennan and Cao (1997). Some empirical support for asymmetric information as onedeterminant for foreign portfolio investment flows has also been found by, e.g.Kang andStulz (1997), Brennan and Cao (1997), andDomowitz et al. (1997)when analyzing thedeterminants of stock price premia (Dahlquist and Robertsson, 2001; Choe et al., 2001).The findings indicate, e.g. that larger firms, i.e. firms that are better known internationally,attract a disproportionally large share of foreign portfolio investments/higher stock price
1 For classical, mainly U.S. based results, see e.g.Grubel (1968), Levy and Sarnat (1970), Solnik (1974a),Lessard (1973, 1976), Solnik and Noetzlin (1982), Logue (1982), Jorion (1985), andGrauer and Hakansson(1987). For results concerning the Nordic countries, seeLiljeblom et al. (1997).
2 In a standard model of portfolio choice with independent and identically distributed random returns, andinvestors only differing with respect to their risk aversion, only the weights of the risky asset portfolio and theriskless one will differ across investors (but not the composition of the risky portfolio), see e.g.Dumas (1989).International asset pricing models allowing for deviations from PPP, in line withSolnik (1974b), create a needto hedge for inflation and lead to differences in portfolio holdings, but mainly concerning the bond part of theportfolio. However,Adler and Dumas (1983)andUppal (1993)show that deviations from PPP could also createa home bias in investment portfolios.
3 The effect of human capital as an omitted asset has been discussed, e.g. inBrainard and Tobin (1992)andBottazzi et al. (1996). Baxter and Jermann (1997)suggest that the home bias in fact would be worse when humancapital is taken properly into account since hedging human capital risk would imply a substantial short position inthe domestic market.Tesar (1993)andBaxter et al. (1998), among others, discuss the effects of non-traded goodsfor international risk sharing.

E. Liljeblom, A. Loflund / J. of Multi. Fin. Manag. 15 (2005) 211–233 213
premium.4 If foreign investors were to have an informational disadvantage, this could in-fluence not only their stock choices but also the timing of their investment decisions. Themodel ofBrennan and Cao (1997)predicted that if foreign investors had an informationaldisadvantage as compared to domestic investors, international portfolio investment flowswould be positively related to the current return on national stock market indexes, a predic-tion for which they also found support. Moreover, not only foreign investors alone mightsuffer from informational asymmetries. RecentlyCoval and Moskowitz (1999)have founda local equity preference also in the domestic U.S. mutual fund portfolios and have sug-gested informational differences as an explanation. In summary, if there are informationaldifferences between domestic and foreign investors, or other barriers for foreign investment,these can be expected to influence the foreign investors’ stock choices and the timing of theinvestments.
If the foreign investors suffer from an informational disadvantage, this can also be ex-pected to result in poorer subsequent investment performance. Hence performance analysisof foreign and domestic investors’ portfolio strategies can be considered as a way to testfor investment barriers due to informational asymmetries. This topic has also recently at-tracted a lot of attention in several papers. The empirical evidence on this issue is mixed.Brennan and Cao (1997)tested their model, which predicted that when foreign investors hadan informational disadvantage, they were likely to pursue momentum strategies but wouldachieve inferior performance. Their empirical results supported the model, e.g. for U.S.investors abroad, whereas evidence of an informational disadvantage for foreign investorson the U.S. market was not detected in their study.Kang and Stulz (1997)found weak evi-dence of foreign investor underperformance on the Japanese market, as didDahlquist andRobertsson (2004)on the Swedish market.Froot et al. (2001)found that foreign investmentflows were positively related to future returns on developing markets, but did not forecastpositive returns on developed markets. Instead, at longer horizons, returns on developedmarket would be negative after foreign investment inflows.Choe et al. (2001)found thatdomestic individual investors on the Korea Stock Exchange had more information and tradeat better prices than foreign investors, whereas foreign investors did not have a disadvantagecompared to domestic institutional investors. Contrary to these studies indicating some dis-advantage for foreign investors, analyzing 16 Finnish stocks during a period of two years(1995 to 1996),Grinblatt and Keloharju (2000)reported that foreign investors pursued mo-mentum strategies in Finland, and in general outperformed domestic households. Focusingon 20 emerging markets exclusively,Bekaert et al. (2002)also found a positive relationshipbetween equity flows and stock returns.Hau and Rey (2004)found similar results betweenthe U.S. and five other developed equity markets.
As was the case for Japan inKang and Stulz (1997), Finland is currently a country whereforeign ownership constraints are not binding, and where company specific data on foreignownership is available. Prior to 1993, foreign ownership was restricted to 40% of the equityof the company (and 20% of the votes). From the beginning of 1993, restrictions on foreignownership were abolished with a few exceptions. The foreign ownership of the shares ofFinnish listed companies has since then grown rapidly. For example, the average foreign
4 However, the results ofDahlquist and Robertsson (2001)indicate that this would above all be an institutionalinvestor bias and not a foreign investor bias as such.

214 E. Liljeblom, A. Loflund / J. of Multi. Fin. Manag. 15 (2005) 211–233
ownership of Finnish listed companies was 34.8% in December 1998; the market valueweighted average 53.0%; and in approximately one-third of the 500 largest companies inFinland, foreign ownership exceeded 50%. Foreign ownership data is available on a monthlybasis from the end of 1993, i.e. almost immediately after the removal of the binding foreignownership constraints.
The purpose of this paper is to investigate the determinants of foreign investment portfolioallocations to the rapidly internationalized Finnish equity market. In the same way, asbarriers to international investment will lead to countries being under- or overrepresentedrelative to their weight in the international market portfolio, these barriers are likely toproduce differences in the within-country holdings of foreign investors. That is, we want tolook at whether foreign investors hold Finnish stocks proportionally to their market valueweights, and if not, to investigate for the determinants of these deviations. In line withKang and Stulz, we test for company-specific variables related to asymmetric informationas well as to other explicit and implicit barriers. As another way to test for the existenceof informational asymmetry-related barriers for international investment, we will also lookat the relative performance of foreign investors as compared to domestic investors. Thisalso relates to research concerning the relative sophistication of various investor groups.Since foreign investors on the Finnish market are mainly institutional investors, the questionconcerning which investor group has an informational advantage is clearly by no meansevident. This part of our study differs from that byGrinblatt and Keloharju (2000)in usingmethods that allow for a more detailed analysis of the time-series dynamics of capital flowsas inFroot et al. (2001). We also analyze a longer time period and a broader sample ofstocks.
The outline of the paper is as following. In Section2, the data used in this study isdescribed and variables specified. We also discuss how different explanatory variables areexpected to influence foreign ownership of Finnish shares. In Section3.1 results fromthe full model estimated are presented. Section3.2 further investigates the asymmetricinformation-based explanation by focusing on the dynamics of the investment flows. Con-cluding comments are given in Section4.
2. The data
2.1. The sample
This study was performed on data for Finnish non-financial companies that have beenlisted on the Helsinki Stock Exchange during 1993–1998. We used year-end data from cor-porate financial statements (from the database of ETLA, the Research Institute of the FinnishEconomy) from 1992 onwards. All financial statement based variables were measured atthe end of the fiscal year and used to predict foreign ownership later on.5 When computingmarket price based variables, stock price data from the Helsinki Stock Exchange, and totalreturns (i.e. dividends included) computed at HANKEN (the Swedish School of Economics
5 The prediction is made both 4 and 12 months ahead, reflecting a possible publication and/or adjustment lag.Our foreign ownership data ranges from October 1993 to April 1998.

E. Liljeblom, A. Loflund / J. of Multi. Fin. Manag. 15 (2005) 211–233 215
Table 1The sample of companies used in the study
Number of listed firms at the end of Total
1992 1993 1994 1995 1996 1997
Total number of listed firms 67 62 67 74 74 80 424Unlisted during estimation period 5 7 13 16 5 9 55Lacking ownership data 33 11 7 6 3 3 63Lacking financial statement data 8 13 14 10 17 17 79
Remains in final sample 21 31 33 42 49 51 227
This table describes how our final sample is constructed from our initial sample of all listed companies on theHelsinki Stock Exchange, after the enforcement of various data availability criteria. The last line, companieseliminated due to the lack of financial statement data include financial companies.
and Business Administration) were used. When an estimation period for the market pricebased variables was needed, data for the previous year was used. For companies with severalshares listed, data for the most frequently traded one have been used.
In Finland, the shares of most listed companies are currently registered, and foreign(non-resident) investors (individual as well as institutional) holdings are in a separate regis-ter. Data on company-specific foreign ownership can be obtained on a monthly basis fromFinnish Central Securities Depositary from October 1993 onwards. We denote this unad-justed foreign ownership series as “FOROWN” below. Since the system of registration wasdeveloped from 1993 onwards, and not all listed companies joined the system at once, wehowever lack the data for some listed companies especially at the beginning of our studyperiod.
Since some of the variables require a previous estimation period of one year, we mustrestrict our analysis to companies that have been listed during the estimation period as wellas during the test period. This brings in some albeit not very severe survivorship bias. In linewith many similar studies using financial statement data, see e.g.Kang and Stulz (1997),we restricted the study to non-financial firms because many variables such as leverage orexport ratio are non-comparable or non-existent for financial companies like banks.6 Wemissed data not because of later delistings after disappointing returns but mostly because oflate listing or missing share depositary register information (large firms entered the registerearlier).7 Table 1describes the original total sample and the remaining sample after havingenforced our data availability criteria.
2.2. Foreign ownership
Our purpose was to conduct a multivariate pooled (time series and cross-sectional) re-gression of foreign ownership of Finnish listed companies on firm characteristics, measuringexplicit and implicit investment barriers, i.e. testing the importance of variables related tosuggested reasons for home bias.
6 The number of observations lost because of this restriction is 6 up to 1995, and later 5, out of which one(Skopbank) is a state-owned (>99%) non-operational entity in default.
7 Section3.1provides some robustness checks for the effects of possible survivorship bias.

216 E. Liljeblom, A. Loflund / J. of Multi. Fin. Manag. 15 (2005) 211–233
In order to explain deviations from optimal portfolio holdings, we must first have anexpectation of the optimal holdings as such. The international capital asset pricing model(ICAPM) by Adler and Dumas (1983)andSercu (1980)predicted that in a multicurrency,global setting with homogenous beliefs and no transaction costs or taxes, risky assets shouldoptimally be held in proportion to their market weights. However, in the presence of pur-chasing power risk, there is also a hedging demand possibly tilting the optimal portfolioaway from the market-weighted portfolio.8 In this paper, we have followedKang and Stulz(1997), Cooper and Kaplanis (1994), andDahlquist and Robertsson (2001), and treatedthe market-weighted portfolio as a first approximation of the true optimal portfolio. Giventhis simplification, foreign investors would invest time periodt in Finnish stocks (indexedi) roughly proportionally to their Finnish stock market value weightswM
i,t . The main de-pendent variable in our study was therefore RELFOROWN, the deviation of the foreigninvestors’ Finnish portfolio weight (wF
i,t) from the Finnish market portfolio (wMi,t). We mea-
sured RELFOROWN as a “relative difference” from our “raw” foreign ownership dataFOROWNi,t (the percentage of shares out of total held by foreign investors in Finnishcompanyi) in time periodt as follows:9,10
RELFOROWNi,t = wFi,t − wM
i,t
wMi,t
(1)
where
wFi,t = FOROWNi,t · MV i,t∑N
i=1FOROWNi,t · MV i,t
, (2)
MV i,t is the total market value of firmi in time periodt, and the superscript F refers toforeign investors investing in Finnish equities.
The RELFOROWN measure can be seen as a normalized “active” portfolio weight withthe underlying passive benchmark portfolio being the Finnish market portfolio. Positive(negative) values of RELFOROWN thus represent “over-(under)-weighting” of a Finnishshare in the foreign investors’ Finnish equity portfolio.
Since the foreign investors’ decision rule above relies on the ICAPM, which clearly isa simplification and can, e.g. overstate under-investment abroad by as much as 100% (see,e.g.Glassman and Riddick, 1996), we alternatively utilized the original unadjusted foreignownership measure FOROWN.
As Table 1shows, the number of companies for which there is data available has grownrapidly during our test period. Moreover, several of the companies are not the same fromyear to year due to many mergers. We have a choice between a full panel with a narrowsample and the most efficient use of all the data available. In order to avoid a survivorshipbias, we will mainly use the latter alternative and utilize all companies for which we havedata for the sample period.
8 This implication has been tested, e.g. byCooper and Kaplanis (1994). They found that home bias could notbe attributed to inflation hedging motives or transaction costs.
9 During the time period, all companies listed on the Helsinki Stock Exchange were firms with a domestic origin,i.e. no foreign firms listed by the means of Finnish Depositary Receipts (FDRs) are included in our study.10 This measure has also been used byDahlquist and Robertsson (2001)for the Swedish market.
E. Liljeblom, A. Loflund / J. of Multi. Fin. Manag. 15 (2005) 211–233 217
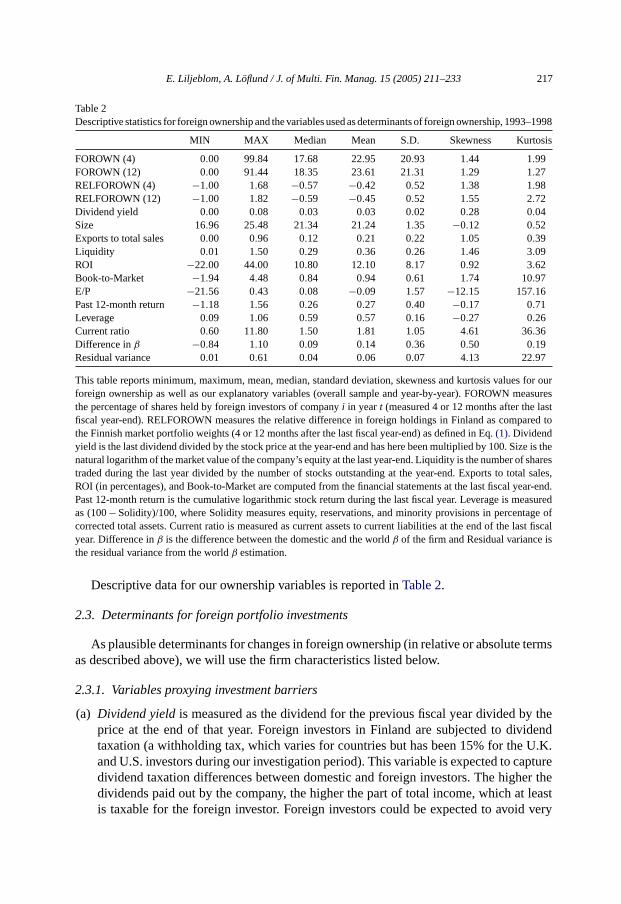
Table 2Descriptive statistics for foreign ownership and the variables used as determinants of foreign ownership, 1993–1998
MIN MAX Median Mean S.D. Skewness Kurtosis
FOROWN (4) 0.00 99.84 17.68 22.95 20.93 1.44 1.99FOROWN (12) 0.00 91.44 18.35 23.61 21.31 1.29 1.27RELFOROWN (4) −1.00 1.68 −0.57 −0.42 0.52 1.38 1.98RELFOROWN (12) −1.00 1.82 −0.59 −0.45 0.52 1.55 2.72Dividend yield 0.00 0.08 0.03 0.03 0.02 0.28 0.04Size 16.96 25.48 21.34 21.24 1.35 −0.12 0.52Exports to total sales 0.00 0.96 0.12 0.21 0.22 1.05 0.39Liquidity 0.01 1.50 0.29 0.36 0.26 1.46 3.09ROI −22.00 44.00 10.80 12.10 8.17 0.92 3.62Book-to-Market −1.94 4.48 0.84 0.94 0.61 1.74 10.97E/P −21.56 0.43 0.08 −0.09 1.57 −12.15 157.16Past 12-month return −1.18 1.56 0.26 0.27 0.40 −0.17 0.71Leverage 0.09 1.06 0.59 0.57 0.16 −0.27 0.26Current ratio 0.60 11.80 1.50 1.81 1.05 4.61 36.36Difference inβ −0.84 1.10 0.09 0.14 0.36 0.50 0.19Residual variance 0.01 0.61 0.04 0.06 0.07 4.13 22.97
This table reports minimum, maximum, mean, median, standard deviation, skewness and kurtosis values for ourforeign ownership as well as our explanatory variables (overall sample and year-by-year). FOROWN measuresthe percentage of shares held by foreign investors of companyi in yeart (measured 4 or 12 months after the lastfiscal year-end). RELFOROWN measures the relative difference in foreign holdings in Finland as compared tothe Finnish market portfolio weights (4 or 12 months after the last fiscal year-end) as defined in Eq.(1). Dividendyield is the last dividend divided by the stock price at the year-end and has here been multiplied by 100. Size is thenatural logarithm of the market value of the company’s equity at the last year-end. Liquidity is the number of sharestraded during the last year divided by the number of stocks outstanding at the year-end. Exports to total sales,ROI (in percentages), and Book-to-Market are computed from the financial statements at the last fiscal year-end.Past 12-month return is the cumulative logarithmic stock return during the last fiscal year. Leverage is measuredas (100− Solidity)/100, where Solidity measures equity, reservations, and minority provisions in percentage ofcorrected total assets. Current ratio is measured as current assets to current liabilities at the end of the last fiscalyear. Difference inβ is the difference between the domestic and the worldβ of the firm and Residual variance isthe residual variance from the worldβ estimation.
Descriptive data for our ownership variables is reported inTable 2.
2.3. Determinants for foreign portfolio investments
As plausible determinants for changes in foreign ownership (in relative or absolute termsas described above), we will use the firm characteristics listed below.
2.3.1. Variables proxying investment barriers
(a) Dividend yieldis measured as the dividend for the previous fiscal year divided by theprice at the end of that year. Foreign investors in Finland are subjected to dividendtaxation (a withholding tax, which varies for countries but has been 15% for the U.K.and U.S. investors during our investigation period). This variable is expected to capturedividend taxation differences between domestic and foreign investors. The higher thedividends paid out by the company, the higher the part of total income, which at leastis taxable for the foreign investor. Foreign investors could be expected to avoid very

218 E. Liljeblom, A. Loflund / J. of Multi. Fin. Manag. 15 (2005) 211–233
high yield stocks. This assumption is supported by evidence of ex-dividend trading(dividend avoidance) related to foreign ownership characteristics on the Finnish market,as reported inLiljeblom et al. (2001).
(b) Sizeis measured as the natural logarithm of the market value of the company’s equityat the end of the previous fiscal year. Size can proxy for several things. Firstly, itmay capture the effect of informational asymmetries. More information on a regularbasis is available on large firms, and informational asymmetries between domestic andforeign investors are less likely. Secondly, transaction costs such as spreads are likelyto be smaller for larger firms. Hence foreign investors are expected to prefer largerfirms.
(c) Exports to total salesis computed from financial statements at the end of the previousfiscal year. Informational asymmetries is one of the suggested barriers to internationalinvestment.Merton (1987)argues that investors invest in securities they know about.This variable may therefore capture differences between companies concerning theextent of informational asymmetries, and we expect a positive sign for it.
(d) Liquidity is measured as the number of shares traded (in the most traded stock series)11
during the previous fiscal year divided by the number of stocks outstanding at the end ofthe year. Liquidity also proxies several things. Firstly, transaction costs such as spreadsare smaller for more liquid stocks. Secondly, political risk may drive foreign investorsto extensively prefer assets with high liquidity.
2.3.2. Stock selection criteria related to valuation and risk
(e) Return on investments(ROI) is measured as net income plus interest divided by in-vested capital. ROI is based on financial statement data at the end of the previous fiscalyear.
(f) Book-to-Marketis measured as the adjusted book value of equity divided by market valueof equity, both from the end of the previous fiscal year. Empirical results from manyinternational studies sinceFama and French (1992)indicate that Book-to-Market mayserve as a better risk-based determinant of cross-sectional return differences betweenstocks thanβ.12
(g) Earnings per share(E/P) is measured as net earnings per share divided by the marketprice of the share, both from the end of the previous fiscal year. We include E/P onthe same grounds as Book-to-Market. Due to high pair-wise correlation, E/P is neverincluded jointly with Book-to-Market.
(h) Past 12-month returnis measured as the cumulative total stock return during the previousfiscal year. This variable is included in order to investigate whether foreign investors arecontrarians or operate on the basis of past performance. The main bulk of prior studiesindicates that foreign investors would be momentum investors.
(i) Leverageis measured as (100− Solidity)/100 in the ETLA database, where Solidityis measured as equity, reservations, and minority provisions as a percentage of cor-
11 These numbers have been corrected for stock distributions such as splits.12 One large outlier in our data had a Book-to-Market value exceeding 26 for 1 year. This value was truncated to
equal the next highest Book-to-Market value in our sample. The company later went bankrupt.

E. Liljeblom, A. Loflund / J. of Multi. Fin. Manag. 15 (2005) 211–233 219
rected total assets, from the end of the previous fiscal year. Leverage is a long-termmeasure of financial distress. It has historically been quite high for Finnish firms,and it is possible that foreign investors may under-invest in highly leveraged Finnishfirms.
(j) Current ratiois measured as current assets to current liabilities at the end of the previousfiscal year, and is a measure of the short-run financial health of a firm. Current ratio isincluded as a measure for more short-term financial distress. To avoid multicollinearity,Current ratio is not used together with Leverage.
(k) Difference in systematic riskis measured as the difference in the company’s domesticβ and its world marketβ. Theβs are estimated with OLS on weekly market data forthe previous fiscal year using the HEX index (a value-weighted market index for theHelsinki Stock Exchange) and the Morgan Stanley Capital International (MSCI) worldmarket index as the market indexes. If the Finnish market is partially segmented, as e.g.the results ofVaihekoski (1999)indicate, both domestic and foreign risk factors mightbe priced on the market. Well-diversified foreign investors would however not require apremium for the domestic systematic risk of Finnish stocks, and might consider stockswith domesticβs that exceed the corresponding foreign ones as under-priced. We expecta positive sign for this variable by measuring how much the domesticβs exceed theworld marketβs for the same stocks.
(l) Residual varianceis measured as the residual variance from the worldβ estimationmodel, and measures the idiosyncratic world risk of the firm. Diversification benefitsmay drive investors to invest into companies, the risk of which to a higher degree isunsystematic. The level of world residual risk might also proxy for other risk factorsthat may be priced on the domestic level but may be diversifiable in an internationalportfolio context. Hence a positive sign for this variable is expected.
Table 2also provides descriptive statistics for the explanatory variables used in ouranalysis.
3. Empirical results
3.1. Foreign ownership and firm characteristics
In this section, we present results from our analysis of the determinants of foreign own-ership. Firstly, we run a pooled regression of foreign ownership on the firm characteristicsusing RELFOROWN or simply FOROWN, measured either 4 or 12 months after the endof the previous accounting year as dependentyit variables. A positive (negative) value forour dependent variableyit , measured as FOROWN/RELFOROWN, implies that foreignersinvest more (less) in firmi/relatively more (less) in firmi than into the whole Finnish marketportfolio. The regression model run is
yit = αt + β′ xit + εit (3)
wherexit is a matrix of firm characteristics associated with firmsi and yearst, β is theestimated parameter vector,εit is an error term, and fixed (year) effects are allowed viaαt.

220 E. Liljeblom, A. Loflund / J. of Multi. Fin. Manag. 15 (2005) 211–233
Table 3Determinants of relative foreign ownership (deviations from market value weights), 1994–1998
Explanatory variables(number ofobservations)
Dependent variable (number of observations)
RELFOROWN 4months ahead(196)
RELFOROWN12 months ahead(222)
RELFOROWN12 months ahead(222)
RELFOROWN12 months ahead(222)
Dividend yield −9.0372 (−2.99* ) −8.8830 (−3.19* ) −7.9117 (−2.98* ) −10.0386 (−3.75* )Size 0.0744 (2.37* ) 0.0755 (2.62* ) 0.0847 (3.28* ) 0.0685 (2.33* )Exports to total sales −0.2342 (−1.63) −0.1383 (−0.92) −0.1766(−1.30) −0.1216 (−0.85)Liquidity 0.3560 (2.66* ) 0.3110 (1.98* ) 0.3718 (2.52* ) 0.2730 (1.65* )ROI 0.0242 (3.05* ) 0.0139 (1.27) 0.0138 (1.33) 0.0134 (1.37)Book-to-Market 0.0494 (0.57) 0.0732 (0.58) 0.0869 (0.71)E/P −0.0913 (−3.77* )Past 12-month return 0.0207 (0.14) 0.1783 (1.29) 0.1294 (1.11) 0.01521 (1.13)Leverage 0.3149 (1.32) 0.4596 (1.60) 0.3839 (1.27)Current ratio −0.0806 (−1.92* )Difference inβ 0.0509 (0.37) −0.0023 (−0.02) 0.0070 (0.06) −0.0051 (−0.04)Residual variance −0.2209 (−0.30) 0.1238 (0.21) −0.2287 (−0.36) 0.4784 (0.89)AdjustedR2 0.2185 0.1794 0.2435 0.1906
This table reports the results of multiple regressions of foreign ownership on firm specific determinants using pooleddata, fixed (year) effects, over the years 1994–1998. Constants and year effects are not shown. RELFOROWNmeasures the relative difference in foreign holdings in Finland as compared to the Finnish market portfolio weights(4 or 12 months after the end of the last fiscal year). Dividend yield is the last dividend divided by the stock priceat the year-end. Size is the natural logarithm of the market value of the company’s equity at the last year-end.Liquidity is the number of shares traded during the last year divided by the number of stocks outstanding atthe year-end. Exports to total sales, ROI, and Book-to-Market are computed from the financial statements at thelast fiscal year-end. Past 12-month return is measured as the cumulative stock return during the last fiscal year.Leverage is measured as (100− Solidity)/100, where Solidity is measured as equity, reservations, and minorityprovisions as percentage of corrected total assets. Current ratio is measured as current assets to current liabilitiesat the end of the last fiscal year. Difference inβ is the difference between the domestic and the world marketβ
of the firm and Residual variance is the residual variance from the worldβ estimation model.t-values based onheteroscedasticity corrected standard errors according toWhite (1980)are reported in parentheses.
∗ t-values significant at the 5% level (one-tailed test).
The results for model (3) using as the dependent variable RELFOROWN or alternativelyFOROWN, are reported inTables 3 and 4, respectively (constants and the fixed effects arenot shown) in the first two columns.
Of the variables proxying for investment barriers, all but Exports to total sales have theexpected signs. In line with our expectations, foreign investors seem to have a strongerpreference for large and liquid companies as compared to domestic investors since Size andLiquidity are persistently significant at 5 or 1% level. Exports to total sales is not significant.Dividend yield in turn is strongly significant at the 1% with a negative sign, indicating thatforeign investors avoid high-yield stocks due to the additional burden of the with-holdingtax.13 The results do not seem to be sensitive to the model specification (FOROWN orRELFOROWN as a dependent variable).
13 This is in line with the evidence on ex-dividend day tax arbitrage on the Finnish market, reported inLiljeblomet al. (2001).

E. Liljeblom, A. Loflund / J. of Multi. Fin. Manag. 15 (2005) 211–233 221
Table 4Determinants of foreign ownership (raw, unadjusted percentage of shares held by foreign investors), 1994–1998
Explanatory variables(number ofobservations)
Dependent variable (number of observations)
FOROWN 4monthsahead (196)
FOROWN12 monthsahead (222)
FOROWN12 monthsahead (222)
FOROWN12 monthsahead (222)
Dividend yield −474.42 (−4.00* ) −384.19 (−3.28* ) −369.22 (−3.14* ) −439.17 (−3.95* )Size 3.5574 (2.89* ) 3.5417 (2.74* ) 3.8366 (3.18* ) 3.2299 (2.46* )Exports to total sales −8.1575 (−1.25) −7.3666 (−1.14) −8.2694 (−1.32) −6.4777 (−1.04)Liquidity 16.0244 (2.65* ) 17.1764 (2.51) 18.1875 (2.68* ) 15.4938 (2.14* )ROI 1.2084 (3.64* ) 0.7001 (1.56) 0.7176 (1.67* ) 0.6738 (1.66* )Book-to-Market 0.8882 (0.25) 0.3501 (0.10) 0.9864 (0.29)E/P −1.6813 (−2.52* )Past 12-month return −1.7498 (−0.38) 1.8906 (0.40) 1.3660 (0.30) 0.6841 (0.15)Leverage 29.0206 (3.29* ) 21.7285 (1.86* ) 20.109 (1.67* )Current ratio −3.6390 (−2.22* )Difference inβ −1.7511 (−0.36) 0.7099 (0.14) 0.3729 (0.08) 0.5610 (0.11)Residual variance −7.8074 (−0.27) 8.3506 (0.34) 2.6593 (0.10) 24.8450 (1.14)AdjustedR2 0.3487 0.2208 0.2345 0.2327
This table reports the results of multiple regressions of foreign ownership on firm specific determinants usingpooled data, fixed (year) effects, over the years 1994–1998. Constants and year effects are not shown. FOROWNmeasures the percentage of shares held by foreign investors of companyi in year t (measured 4 or 12 monthsafter the last fiscal year-end). Dividend yield is the last dividend divided by the stock price at the year-end. Sizeis the natural logarithm of the market value of the company’s equity at the last year-end. Liquidity is the numberof shares traded during the last year divided by the number of stocks outstanding at the year-end. Exports tototal sales, ROI, and Book-to-Market are computed from the financial statements at the last fiscal year-end. Past12-month return is measured as the cumulative stock return during the last fiscal year. Leverage is measured as(100− Solidity)/100, where Solidity is measured as equity, reservations, and minority provisions as percentage ofcorrected total assets. Current ratio is measured as current assets to current liabilities at the end of the last fiscalyear. Difference inβ is the difference between the domestic and the world marketβ of the firm and Residualvariance is the residual variance from the worldβ estimation model.t-values based on heteroscedasticity correctedstandard errors according toWhite (1980)are reported in parentheses.
∗ t-values significant at the 5% level (one-tailed test).
Of the variables proxying for return characteristics, only ROI is significantly positiveat the 1% level in the RELFOROWN model, 4 month ahead prediction, and consistentlysignificant at the 1 or 5% level in the FOROWN specification. Book-to-Market and Past12-month return have mostly positive signs but are insignificant. Using a shorter timeperiod,Grinblatt and Keloharju (2000)presented results on foreign investors being (6-month) momentum investors on the Finnish market. However, these results show that whenusing a somewhat longer time period, the past return when measured on an annual level isnot a significant determinant for foreign investments.
Of the risk variables, Leverage is insignificant in the RELFOROWN specification whilesignificantly positive at the 1 or 5% level, i.e. with a sign contrary to our expectations, inthe FOROWN model. Difference inβ and Residual variance are both insignificant.
We performed several robustness and specification tests. First, we examined the ro-bustness of the model for different specifications of the explanatory variables. We eitherreplaced Book-to-Market with E/P, or Leverage with the Current ratio; see columns 3 and

222 E. Liljeblom, A. Loflund / J. of Multi. Fin. Manag. 15 (2005) 211–233
4 in Tables 3 and 4. Replacing Book-to-Market with E/P, altered the sign to a negative one,and the variable was strongly significant at the 1% level in both model specifications indi-cating that foreign investors prefer growth stocks on the Finnish market. This is in line withthe sign obtained byDahlquist and Robertsson (2001)for Book-to-Market on the Swedishmarket. The sign for Current ratio is in turn negative, and the variable is significant at the 1or 5% level in the two model specifications, which is in line with the results obtained usingthe variable Leverage. Since these measures for default risk obtain a somewhat counterin-tuitive sign, default risk does not seem to be a major deterrent of foreign investor demandof Finnish stocks. Since especially a 6-month return momentum has been observed in priorstudies also on the Finnish market, we replaced the past 12-month return by the past 6-monthreturn. The results (not reported here but can be obtained from the authors) remained verysimilar to those inTables 3 and 4.14
The results are robust for the two alternative specifications of the dependent variable(RELFOROWN and FOROWN), as shown by the general sign patterns inTables 3 and 4. Wealso ran the regression tests using a third specification, the plain weight difference betweenforeign investor portfolio and the market portfolio rather than the percentage differenceused inTable 4. The only change was that now Leverage turns out significantly positive, aswas the case when using FOROWN.15
Since the Finnish market has lately been dominated largely by one single company,Nokia, the market value of which was about 60% of the combined market value of allcompanies in the HEX main list towards the end of our research period, and which alsois mainly owned by foreign investors,16 we also performed sensitivity tests by excludingNokia. These results are reported in theAppendix Afor the specification RELFOROWN.The results were robust with respect to the exclusion of Nokia, the main difference beingthat the Size variable attained weaker significance levels.17
We also performed univariate non-parametric Wilcoxon–Mann–Whitney median testsbetween groups of high and low foreign ownership (FOROWN). The results support ourgeneral conclusion that especially the investment barrier related variables are highly sig-nificant. Higher foreign ownership is significantly positively related to Size and Liquidity(with z-scores of 4.04 and 4.15) and significantly negatively to Dividend yield (az-score of−3.89). As inTable 4, also e.g. the stock specific risk variables measuring financial distress,
14 Currency risk robustness control was suggested by a referee. A substantial proportion of foreign capital flowsto Finland stem from Europe. However, FIM was quite stable with respect to the currencies of the forthcomingEuro area during our investigation period for the capital flows, i.e. from the end of 1993 onwards. Furthermore,Liljeblom and Loflund (1999)reported that currency risk contributed little to portfolio risk for investments withinEurope in the 1990s. For investments outside Europe, however, currency risk was indeed notable. Therefore, wereplaced the time dummies with the annual log change in the FIM against the USD exchange rate. The resultswere unchanged by the inclusion of the currency variable, and the currency variable was insignificant.15 As a final check we used as the dependent variable the estimated foreign investors aggregate “portfolio weight”
as defined in Eq.(2), and found again the results robust with a single exception: the residual variance explanatoryvariable attained a positively significant coefficient in the regressions including the FIM/USD currency variablebut remained insignificant with time dummies included instead. This does not change our conclusion that, overall,the impact of diversifiable risk through the residual variance variable appears marginal.16 At the end of 1998, 76.6% of the stocks of Nokia were owned by foreign investors.17 Furthermore, excluding Nokia does not change our inference concerning the different specifications for the
dependent variable.

E. Liljeblom, A. Loflund / J. of Multi. Fin. Manag. 15 (2005) 211–233 223
the Current ratio and Leverage are significant either at the 1 or 5% level (z-scores of−3.37and 2.02). The results are also robust to alternative split points between high and low foreignownership groups.
As some variables deviate from normality (seeTable 2), we also estimated Eq.(3) withthe same model specifications as inTables 3 and 4, using the least absolute error estimationmethod. The results are virtually unchanged with the exception of the highly skewed E/Pvariable, which previously was significant in only one model specification, but is now soconsistently.
Finally, we also performed year-by-year analyses in order to test for the robustness of ourvariables and the pooled regression model formulation, as well as tests using a fixed sampleof firms throughout the time period (a full panel of 20 firms during 5 years). Whereas somesign reversals occurred for individual years for the insignificant variables from our pooledregression, the variables with the strongest significance, i.e. Dividend yield, Size, Liquidity,and ROI showed remarkable persistence in sign. In the full panel, our results closely matchedthose already reported inTables 3 and 4, with marginally higher significance levels inTable 4.Finally, we tightened our selection criteria by excluding the smallest 25% of our sample,which was most likely under-represented because of our sampling criteria. The results didnot change and the statistical significance levels were only marginally higher suggestingfurther that survivorship issues are not likely to affect our inference.18
3.2. Additional evidence on potential informational differences
Next we address the question of relative investment performance of foreign and domesticinvestors on the Finnish market. Such tests can provide evidence on which investor categorymay possess an informational advantage on this market. Significant portfolio performancedifferences may thus provide indirect evidence of asymmetric information related barriersfor international investment.
In order to investigate the interaction between capital flows and company specific returns,we regress company-specificmonthlychanges in foreign ownership during our data period,November 1993 to December 1998, on both leads and lags of monthly stock total returns.This test studies two questions. The first is whether capital flows are momentum-driven, i.e.affected by past (lagged) returns in a more refined way as could be tested by the inclusionof the lagged 12-month (or 6-month) return in the regressions in Section3.1. The secondis whether capital flows either immediately affect the market (tests of the coefficient forthe simultaneous relationship), or are associated with positive returns later on (potentiallyindicating some informational advantage for foreign traders, in line with, e.g.Froot et al.,2001). That is, the tests of the lagged coefficients are related to the determinants part of thispaper, and the tests of the lead returns to the performance issue. Since a 6-month momentumis often among the strongest ones detected,19 and since more leads than six would radicallyreduce our sample (many companies are merged later on), we select both six lags and sixleads for the analysis.
18 The regression results of all robustness checks are available from the authors upon request.19 See e.g.Grinblatt and Keloharju (2000)on the Finnish market,Jagadeesh and Titman (1993)andChan et al.
(1996)for the U.S., andRouwenhorst (1998)on European data.

224 E. Liljeblom, A. Loflund / J. of Multi. Fin. Manag. 15 (2005) 211–233
All companies on the Helsinki Stock Exchange with available foreign ownership data andwith at least 3 years of continuous monthly stock return data are included in the analysis.20
These selection criteria produce an overall sample of 61 stocks, out of which a subset of43 stocks has a foreign ownership fraction exceeding 10% at the end of the period.Table 5reports summary statistics for this test.
Our results for simultaneous monthly relationships between capital flows (foreign own-ership changes) and returns are in line with those detected for the aggregate market, e.g.by Brennan and Cao (1997)andFroot et al. (2001), and also for individual stocks on theSwedish market inDahlquist and Robertsson (2001); i.e. we find predominantly positiverelationships between ownership changes and individual stock returns. The simultaneouscoefficient is positive in 44 (33) cases in the sample of 61 (43) stocks. Using a binomial signtest assuming equal probabilities for positive and negative coefficients, these numbers aresignificant at the 1% level. Fifteen (7) out of the 61 individual coefficients are significantlypositive at the 10% (1%) level, while hardly any significantly negative coefficients for thesimultaneous relationship are detected.
When studying the relationships between lagged returns, we find some evidence for mo-mentum trading in terms of predominately positive coefficients for the relationship betweenforeign ownership changes and prior returns. Out of the 366 estimated lag coefficients (sixlags for each of the 61 stocks), 47 are significantly positive at the 10% level, and 14 at the 1%level. These frequencies are higher than their random occurrence under the null hypothesisof no relationship. The sum of all six lagged stock specific coefficients is also significantly(at the 1% level) more often positive than negative in both samples (the full sample and thesubset).
When studying the relationship between ownership changes and subsequent (leaded)returns, we on the other hand do not find any evidence of a relationship. Thirty-five (25) outof the 366 (258) of the lead coefficients in our full sample (subset) are significantly differentfrom zero at the 10% level in double-sided tests, which is what would be expected underthe null hypothesis of no relationship, and the distribution between negative and positivecoefficients is even (e.g. 17 positive, 18 negative in the full sample). Hence, the results sofar do not support any informational advantage or disadvantage for the foreign owners onthe Finnish market.21
These time-series regressions therefore provide some evidence of a positive relationshipbetween simultaneous ownership changes and foreign investor momentum trading at hori-zons less than or equal to 6 months, i.e. results in line with theGrinblatt and Keloharju(2000)study using a shorter time period. According to our results in Section3.1, at anannual level, the prior stock return was, however, no longer significantly related to foreigninvestment. Stock by stock analysis of subsequent investment performance provides weakerindication of either an informational advantage or disadvantage for foreign investors.
20 In case of multiple stock series listed, the most frequently traded is used.21 As an alternative specification, we ran Granger causality tests between foreign ownership changes and stock
returns using six lags. While the GrangerF-test tests for the overall significance of a relationship, it ignores signpatterns. These tests provide broadly similar inference asTable 5. At the 5% significance level, the prior stockreturns significantly Granger-caused foreign ownership changes in 13 out of 61 stocks. The opposite, i.e. foreignownership changes Granger-causing stock returns was significant in only 5 out of 61 cases.

E.L
iljeblom,A
.Loflu
nd/J.o
fMulti.F
in.M
anag.1
5(2005)211–233
225Table 5Summary statistics from testing the relationship between changes in foreign ownership and lagged and leaded stock returns
Number of positivecoefficient
Simultaneous returns
Number of significantpositive coefficient at10% (1%)
Number of significantnegative coefficient at10% (1%)
Panel AFull sample (N= 61) 44* 15 (7) 2 (0)Foreign ownership >10% (N= 43) 33* 11 (5) 0 (0)
Lags Leads
Number of significantpositive coefficient at10% (1%)
Number of significantnegative coefficient at10% (1%)
Number of significantpositive coefficient at10% (1%)
Number of significantnegative coefficient at10% (1%)
Panel BFull sample (N= 61) 47 (14) 12 (2) 17 (2) 18 (6)Foreign ownership >10% (N= 43) 39 (12) 9 (1) 15 (2) 10 (3)
Number of times when sum of all six coefficients was positive
Lags Leads
Panel CFull sample (N= 61) 47* 28Foreign ownership >10% (N= 43) 35* 22
This table reports summary statistics from regressing monthly changes in a company’s foreign ownership on simultaneous, six lagged, and six leaded monthly returnson the company’s stock. Panel A reports simultaneous ownership changes and returns, the number of positive coefficients, and the number of coefficients significant at10% level (1% level within brackets), double-sided tests, that were obtained using our full sample of 61 stocks, or a subset of 43 stocks with foreign ownership exceeding10% at the end of the test period. Panel B reports the number of coefficients significant at 10% level (1% level within brackets) among the 366 (61× 6) and 258 (43× 6)estimated lags/leads for our full sample and the subset. The full sample includes all stocks at the Helsinki stock exchange for which at least 3 years ofdata (foreignownership as well as stock return data) was available during our time period of 1993/10 to 1998/12. Panel C reports the number of cases when the sum of alllags or leadsfor an individual stock was positive.
∗ Indicates departure from randomness at a 1% level using a binomial sign test.

226 E. Liljeblom, A. Loflund / J. of Multi. Fin. Manag. 15 (2005) 211–233
Fig. 1. Cumulative excess returns of foreign and local investor portfolios and the Finnish market portfolio, De-cember 1993 to December 1998.
Next, we will address the performance issue by means of another test. While the analy-sis of individual stock specific lead coefficients provides some information of the average(“equally weighted”) performance of foreign investors, foreign investors may have an in-formational advantage, e.g. in some large and liquid stocks, and by overweighing them,they may succeed in producing superior returns for their value-weighted portfolio.
To investigate the performance of the overall (value-weighted) Finnish part of the port-folio of the foreign investors, we next divide the Finnish market portfolio into its foreignand local components. We evaluate the performance of the foreign and local investors’portfolio strategies on this market using total returns in excess of the risk-free rate (1-monthmoney market rate HELIBOR) and conventional performance evaluation measures such asthe Sharpe ratio and Jensen’sα. If foreign investors were to have an informational disad-vantage on this market, we would expect the return on the foreign owned part of the Finnishportfolio to be inferior to that of the domestically owned part, as detected, e.g. byBrennanand Cao (1997)andKang and Stulz (1997). On the other hand, foreign investors on theFinnish market are mainly institutional investors, whereas the domestic investors includeboth households as well as institutional investors, so the foreign investors may alternativelybe more sophisticated on this market.
Table 6, Panel A, reports these benchmarking results of the foreign and locally ownedparts of the Finnish market, whereasFig. 1 shows the cumulative excess returns of theseinvestor categories as compared to the Finnish overall market portfolio.
Fig. 1reveals that in terms of cumulative excess return, foreign investors’ value-weightedportfolio manages to beat the HEX market index. The annualized volatility of the foreigninvestor portfolio excess returns (Panel A ofTable 6) is as high as 31.3% compared to themarket volatility of 25.2%. The foreign investor portfolio attains a Sharpe ratio of 0.909

E.L
iljeblom,A
.Loflu
nd/J.o
fMulti.F
in.M
anag.1
5(2005)211–233
227
Table 6Foreign investor portfolio performance evaluation, December 1993 to December 1998
Number of observations Average Jensen’sα (%) α (t-statistics) Sharpe ratio JK (z-statistics)
Excess return (%) Volatility (%)
Panel A: Stock selectionForeign investors 61 28.4 31.3 5.1 1.106 0.909 0.766Local investors 61 12.2 21.9 −4.5 −1.77 0.554 −1.638Market portfolio 61 19.7 25.2 0.785
Treynor–Mazuy Henriksson–Merton
α (%) β Market timing α (%) β Market timing
Panel B: Market timingForeign investors
Coefficientt-statistics +9.600(2.25) 1.173 (22.27) −3.59 (−0.91) +8.400(1.22) 1.135 (10.63) −0.104 (−0.52)
Local investorsCoefficientt-statistics 0.000(0.213) 0.849 (25.19) −10.44 (−2.10) −2.400(−0.808) 0.822 (16.28) −0.048 (−0.568)
The return percentages including Jensen’sαs are annualized. JK and correspondingz-test statistic refer to theJobson and Korkie (1981)test of Sharpe ratio differenceagainst the market portfolio. Treynor–Mazuy refers to the model where investor category excess returns are regressed against market excess returnsand the squares ofit. In the Henriksson–Merton model, a multiplicative dummy (0 or−1 times the market excess return) for bear markets (negative excess returns) is used parallel withthe market excess return, in which case the market timing coefficient will measure the difference between the bull and bear marketβ. One-month Finnish money marketrates (HELIBOR) are used to compute excess returns.t-statistics usingWhite (1980)standard errors are reported in parenthesis.

228 E. Liljeblom, A. Loflund / J. of Multi. Fin. Manag. 15 (2005) 211–233
as compared to 0.554 for local investors. The annualized Jensen’sα, when the foreigninvestor portfolio is benchmarked against the Finnish HEX market index, is as high 5.1%but statistically insignificantly different from zero.Jobson and Korkie (1981)test of Sharperatio difference is also insignificant. However, the average difference between the foreignand local investor excess returns is 1.36% on a monthly level (16.2% annualized) and (usinga mean error based on the time series standard deviation of this difference) statisticallydifferent from zero at the 5% level (with at-value of 2.25). This indicates that foreigninvestors have significantly outperformed local ones in terms of portfolio return but it islargely driven by higher risk. This tentative result is opposite to what was found inKangand Stulz (1997)for Japan, andDahlquist and Robertsson (2004)for Sweden, but in linewith those ofGrinblatt and Keloharju (2000)for 16 Finnish stocks.
Panel B ofTable 6reports market timing tests. For foreign investors, market timingability is on the negative side, but statistically indistinguishable from zero. Jensen’sαs arenotably higher with the market timing terms added to the regression. In the Treynor–Mazuyquadratic regression, the Jensen’sα for the foreign investors is also statistically significant.However, this result is not robust in the sense that the Henriksson–Merton market timing testyields an insignificant Jensen’sα. The local investors obtain insignificantαs and negativemarket timing coefficients, of which one (in the Treynor–Mazuy model) is significant at the5% level.
These results using value-weighted returns suggest some over performance while ear-lier equally weighted results (Table 5) did not support any ability to forecast subsequentperformance. We therefore investigate closer the sources of this difference. Using standardperformance attribution procedure, we decomposed the difference between the foreign port-folio return and the market return
Rp =N∑
i=1
wp,iRp,i −N∑
i=1
wm,iRm,i (4)
whereRp andRm are the foreign and market portfolio returns,Rj,i is the return for portfolioj’s investments in sectori, andwj,i is the weight for sectori in portfolio j, into the componentsof:
Contribution from sector selection :N∑
i=1
(wp,i − wm,i)Rm,i (5)
and
Contribution from stock selection :N∑
i=1
wp,i(Rp,i − Rm,i). (6)
Table 7summarizes the foreign investor strategy and the origins of profits for sevenFinnish business sectors. This analysis is based on total returns and a monthly decompo-sition, the averages of which are reported. The large weight in Nokia explains the 47.3%weight in metal, electronics, IT and telecom sector. It should be noted that Nokia wasclassified as a multibusiness company in year 1993; hence the relatively large weight inthis sector can again be traced back to this single company. Interestingly, foreign investors

E.L
iljeblom,A
.Loflu
nd/J.o
fMulti.F
in.M
anag.1
5(2005)211–233
229
Table 7Foreign investor sector allocations and relative performance
Sector Average foreigninvestmentweight (%)
Averagemarketweight (%)
Average weightdifference (%)
Average foreigninvestmentreturn p.a. (%)
Averagemarket returnp.a. (%)
Average returndifference p.a.(%)
Return differencedue to sectorchoice (%)
Return differencedue to stockchoice (%)
Panel A: A sector decomposition of foreign investor performanceBanking and insurance 6.6 10.9 −4.4 1.17 1.63 −0.46 0.13 −0.59Forestry 6.0 10.2 −4.2 0.37 0.77 −0.40 −0.24 −0.16Trade and transportation 3.5 8.5 −5.0 0.23 1.28 −1.04 −0.17 −0.87Metal, EL, IT, telecom 47.3 37.0 10.3 27.63 18.47 9.15 3.09 6.07Food and clothing 6.2 5.9 0.3 1.19 1.00 0.19 −0.05 0.23Housing, constr., energy 0.9 2.8 −1.9 0.08 0.34 −0.26 −0.01 −0.25Multibus. and misc. 29.5 24.6 4.9 7.52 4.97 2.55 1.97 0.58Total 100 100 4.72 5.01
Foreign investors (%) Market (%) Difference (%)
Panel B: Total return and riskAverage annualized return 38.17 28.45 9.73Annualized volatility 32.07 26.11
230 E. Liljeblom, A. Loflund / J. of Multi. Fin. Manag. 15 (2005) 211–233
underweighted all other sectors including the other main Finnish industry: forestry (andperhaps food and clothing). The average return differences of the foreign investor portfolioand the Finnish market portfolio are given in column 6. The last two columns decomposethis return differential into sector and stock choice components according to(5) and(6).We compute these components (products) using monthly weights and returns and aggregatethem into the time averages reported in columns 7 and 8.
Table 7shows that of the 9.73% average annual positive total return differential, 4.72%comes from foreign investors’ successful sector weighting and 5.01% from successful stockselection and weighting. More remarkably, we note that the return differentials due to eithersector choice, or stock selection within the sector, are either negative (eight cases) or positivebut close to zero (two cases) for all other sectors except the two (Multibus., and Metal, EL,IT, telecom) that included Nokia, during various parts of our time period. The positiveperformance difference between foreign and domestic investors therefore seems to aboveall stem from overweighing Nokia during the sample.
4. Conclusions
This paper investigates determinants of foreign investor equity investment flows fol-lowing the deregulation of the Finnish stock market in early 1990s using monthly dataon company specific foreign ownership values. We especially focus on the question con-cerning informational differences as a barrier by the means of a performance evaluationtest.
Portfolios of Finnish stocks held by foreign investors are found to deviate clearly fromthe Finnish market portfolio. We find evidence of both tax-induced effects as well as effectsof potential informational barriers. Firstly, foreign investor portfolios are significantly tiltedtowards low dividend yield stocks. This is likely to be caused by an additional withholdingtax on dividends. Secondly, there is also preference for large cap, liquid stocks with astrong profitability (as measured by past ROI) record. The results are robust for variousmodel specifications.
An analysis of the relationship between foreign ownership changes and past vs. subse-quent stock specific returns gave results in line with prior studies on several markets. Wefound a significant positive relationship both between simultaneous monthly capital flowsand returns, as well as between capital flows and past (1–6 months) returns, i.e. evidence ofmomentum trading. However, we did not find any evidence of either an informational advan-tage or disadvantage for foreign investors when analyzing the average (“equally-weighted”)predicting ability of foreign investors in a set of 61 stocks.
When the focus was turned to the analysis of the overall foreign value-weighted portfolio,a somewhat clearer pattern emerged. The foreign investor portfolio compares favorably tothe local market portfolio, as evidenced by Jensen’sαs ranging from 5.1 to 9.6% p.a.(depending on whether market timing control was applied). At the 5% significance level,the foreign investment portfolio yields statistically higher returns than the local one (andifference of 16.3% p.a.). However, further analysis of the sources of this outperformanceof foreign investors on the Finnish market largely boils down to a rather successful Nokiabet. As a whole, we therefore cannot claim to have found support for either group having

E. Liljeblom, A. Loflund / J. of Multi. Fin. Manag. 15 (2005) 211–233 231
such an informational advantage over the other which would have resulted in systematicallybetter performance.
Acknowledgements
We are grateful to Richard Johansson for research assistance, and for comments receivedat seminars at the Stockholm School of Economics, Lund University, and at the JointFinance Research Seminar in Helsinki. Valuable comments from an anonymous refereeare gratefully acknowledged. Financial support from the Finnish Academy of Sciences isgratefully acknowledged.
Appendix A. Determinants of foreign ownership, 1994–1998; Nokia excluded
Explanatoryvariables
Dependent variable (number of observations)
RELFOROW 4months ahead(191)
RELFOROW12 monthsahead (216)
RELFOROW12 monthsahead (216)
RELFOROW12 monthsahead (216)
Dividend yield −8.3251 (−2.74* ) −8.5127 (−3.06* ) −7.6397 (−2.86* ) −9.7000 (−3.60* )Size 0.0396 (1.32) 0.0514 (1.75) 0.0618 (2.36* ) 0.0420 (1.39)Exports to total sales −0.3058 (−2.25* ) −0.1987 (−1.39) −0.2243 (−1.68* ) −0.1868 (−1.35)Liquidity 0.2582 (2.01* ) 0.2435 (1.52) 0.3157 (2.09* ) 0.1958 (1.16)ROI 0.0211 (2.53* ) 0.0126 (1.09) 0.0126 (1.13) 0.0121 (1.16)Book-to-Market 0.0561 (0.65) 0.0905 (0.72) 0.1059 (0.87)E/P −0.0894 (−3.43* )Past 12-month return 0.0099 (0.06) 0.1636 (1.14) 0.106 (0.87) 0.1322 (0.95)Leverage 0.3397 (1.50) 0.4834 (1.74* ) 0.4084 (1.39)Current ratio −0.0896 (−2.21* )Difference inβ −0.0376 (−0.26) −0.0956 (−0.69) −0.0673 (−0.54) −0.1019 (−0.74)Residual variance −0.6067 (−0.84) −0.1178 (−0.21) −0.4353 (−0.73) 0.2497 (0.50)AdjustedR2 0.1296 0.1209 0.1864 0.1380
The table reports the results of multiple regressions of foreign ownership on firm specific determinantsusing pooled data, fixed (year) effects, over the years 1994–1998. Constants and year effects are not shown.RELFOROWN measures the relative difference in foreign holdings in Finland as compared to the Finnish marketportfolio weights (4 or 12 months after the end of the last fiscal year). Dividend yield is the last dividend divided bythe stock price at the year-end. Size is the natural logarithm of the market value of the company’s equity at the lastyear-end. Liquidity is the number of shares traded during the last year divided by the number of stocks outstandingat the year-end. Exports to total sales, ROI, and Book-to-Market are computed from the financial statements at thelast fiscal year-end. Past 12-month return is measured as the cumulative stock return during the last fiscal year.Leverage is measured as (100− Solidity)/100, where Solidity is measured as equity, reservations, and minorityprovisions as percentage of corrected total assets. Current ratio is measured as current assets to current liabilitiesat the end of the last fiscal year. Difference inβ is the difference between the domestic and the world marketβ
of the firm and Residual variance is the residual variance from the worldβ estimation model.t-values based onheteroscedasticity corrected standard errors according toWhite (1980)are reported in parentheses.
∗ Significant on 5% level (one-sided test).

232 E. Liljeblom, A. Loflund / J. of Multi. Fin. Manag. 15 (2005) 211–233
References
Adler, M., Dumas, B., 1983. International portfolio choice and corporation finance: a synthesis. Journal of Finance38, 925–983.
Baxter, M., Jermann, U.J., 1997. The international diversification puzzle is worse than you think. AmericanEconomic Review 87, 170–180.
Baxter, M., Jermann, U.J., King, R.G., 1998. Nontraded goods, nontraded factors, and international non-diversification. Journal of International Economics 44, 211–229.
Bekaert, G., Harvey, C.R., Lumsdaine, R.L., 2002. The dynamics of emerging market equity flows. Journal ofInternational Money and Finance 21, 295–350.
Bottazzi, L., Pesenti, P., Van Wincoop, E., 1996. Wages, profits, and the international portfolio puzzle. EuropeanEconomic Review 40, 219–254.
Brainard, W.C., Tobin, J., 1992. On the internationalization of portfolios. Oxford Economic Papers 44, 433–565.Brennan, M.J., Cao, H., 1997. International portfolio investment flows. Journal of Finance 52, 1851–1880.Chan, L.K.C., Jagadeesh, N., Lakonishok, J., 1996. Momentum strategies. Journal of Finance 51, 1681–1713.Choe, H., Kho, B.-C., Stulz, R.M., 2001. Do domestic investors have more valuable information about individual
stocks than foreign investors? NBER Working Paper 8073.Cooper, I., Kaplanis, E., 1994. Home bias in equity portfolios, inflation hedging, and international capital market
equilibrium. Review of Financial Studies 7, 45–60.Coval, J.D., Moskowitz, T.J., 1999. Home bias at home: local equity preference in domestic portfolios. Journal of
Finance 54, 2045–2073.Dahlquist, M., Robertsson, G., 2001. Direct foreign ownership, institutional investors, and firm characteristics.
Journal of Financial Economics 59, 413–440.Dahlquist, M., Robertsson, G., 2004. A note on foreigner’s trading and price effects across firms. Journal of
Banking and Finance 28, 615–632.Domowitz, I., Glen, J., Madhavan, A., 1997. Market segmentation and stock prices: evidence from an emerging
market. Journal of Finance 52, 1059–1085.Dumas, B., 1989. Two-person dynamic equilibrium in the capital market. Review of Financial Studies 2, 157–
188.Fama, E., French, K.R., 1992. The cross-section of expected returns. Journal of Finance 47, 427–466.Frankel, J.A., 1991. Quantifying international capital mobility in the 1980s. In: Bernheim, D., Shoven, J.B. (Eds.),
National Savings and Economic Performance. University of Chicago Press, Chicago.French, K.R., Poterba, J.M., 1991. Investor diversification and international equity markets. American Economic
Review 81, 222–226.Froot, K.A., O’Connell, P.G., Seasholes, M.S., 2001. The portfolio flows of international investors. Journal of
Financial Economics 59, 151–193.Gehrig, T.P., 1993. An information based explanation of the domestic bias in international equity investment. The
Scandinavian Journal of Economics 21, 7–109.Glassman, D.A., Riddick, L.A., 1996. Why empirical international portfolio models fail: evidence that model
misspecification creates home asset bias. Journal of International Money and Finance 15, 275–279.Glassman, D.A., Riddick, L.A., 2001. What causes home asset bias and how should it be measured? Journal of
Empirical Finance 8, 35–54.Gordon, R.H., Bovenberg, L., 1996. Why is capital so immobile internationally? Possible explanations and impli-
cations for capital income taxation. American Economic Review 86, 57–75.Grauer, R.R., Hakansson, N.H., 1987. Gains from international diversification: 1968–1985 returns on portfolios
of stocks and bonds. Journal of Finance 42, 721–741.Grinblatt, M., Keloharju, M., 2000. The investment behavior and performance of various investor types: a study
of Finland’s unique data set. Journal of Financial Economics 55, 43–67.Grubel, H., 1968. Internationally diversified portfolios: welfare gains and capital flows. American Economic
Review 58, 1299–1314.Hau, H., Rey, H., 2004. Can portfolio rebalancing explain the dynamics of equity returns, equity flows, and
exchange rates? American Economics Review 94, 126–133.Jagadeesh, N., Titman, S., 1993. Returns to buying winners and selling losers: implications for stock market
efficiency. Journal of Finance 48, 65–91.

E. Liljeblom, A. Loflund / J. of Multi. Fin. Manag. 15 (2005) 211–233 233
Jobson, J.D., Korkie, B., 1981. Performance hypothesis testing with the Sharpe and Treynor measures. Journal ofFinance 36, 889–908.
Jorion, P., 1985. International portfolio diversification with estimation risk. Journal of Business 58, 259–278.Kang, J.-K., Stulz, R.M., 1997. Why is there a home bias? An analysis of foreign portfolio equity ownership in
Japan. Journal of Financial Economics 46, 3–28.Lessard, D., 1973. International portfolio diversification: a multivariate analysis for a group of Latin American
countries. Journal of Finance 28, 619–633.Lessard, D., 1976. World, country, and industry relationships in equity returns: implications for risk reduction
through international diversification. Financial Analysts Journal 32, 32–38.Lewis, K.K., 1999. Trying to explain home bias in equities and consumption. Journal of Economic Literature 37,
571–608.Levy, H., Sarnat, M., 1970. International diversification of investment portfolios. American Economic Review 60,
668–675.Liljeblom, E., Loflund, A., 1999. The euro and portfolio choices—a Nordic perspective. Swedish Economic Policy
Review 6, 41–82.Liljeblom, E., Loflund, A., Krokfors, S., 1997. The benefits from international diversification for Nordic investors.
Journal of Banking and Finance 21, 469–490.Liljeblom, E., Loflund, A., Hedvall, K., 2001. Foreign and domestic investors and tax induced ex-dividend day
trading. Journal of Banking and Finance 25, 1687–1716.Logue, D., 1982. An experiment on international diversification. Journal of Portfolio Management 9, 22–27.Low, A., 1992. Essays on Asymmetric Information in International Finance. Ph.D. dissertation, University of
California, Los Angeles.Merton, R.C., 1987. A simple model of capital market equilibrium with incomplete information. Journal of Finance
42, 483–510.Rouwenhorst, K.G., 1998. International momentum strategies. Journal of Finance 53, 267–284.Sercu, P., 1980. A generalisation of the international asset pricing model. Journal de l’Association Francaise de
Finance 1, 91–135.Shawky, H.A., Kuenzel, R., Mikhail, A.D., 1997. International portfolio diversification: a synthesis and an update.
Journal of International Financial Markets, Institutions and Money 7, 303–327.Solnik, B., 1974a. Why not diversify internationally? Financial Analysts Journal 20, 48–54.Solnik, B., 1974b. An equilibrium model of the international capital market. Journal of Economic Theory 8,
500–524.Solnik, B., Noetzlin, B., 1982. Optimal international asset allocation. Journal of Portfolio Management 9, 11–21.Tesar, L.L., Werner, I.M., 1995. Home bias and high turnover. Journal of International Money and Finance 14,
467–492.Tesar, L.L., 1993. International risk sharing and non-traded goods. Journal of International Economics 35, 69–89.Uppal, R., 1993. A model of intertemporal asset prices under asymmetric information. Review of Economic
Studies 60, 249–282.Vaihekoski, M., 1999. Essays on International Asset Pricing Models and Finnish Stock Returns. Ph.D. thesis,
Publications of the Swedish School of Economics and Business Administration, A80.White, H., 1980. A heteroscedasticity consistent covariance matrix estimator and a direct test of heteroscedasticity.
Econometrica 48, 817–838.