determinants of corporate dividend payout in nepal...director at securities board of nepal,...
TRANSCRIPT
Determinants of Corporate
Dividend Payout in Nepal
Nabaraj Adhikari, Ph.D.
Abstract There are several studies that investigated determinants of corporate dividend payout in developed
and emerging stock markets. Such a study is scant in pre-emerging stock markets like that of
Nepal. Therefore, the purpose of this paper is to investigate the determinants of corporate
dividend payout in Nepal. This paper examines whether enterprises’ characteristics affect
dividend payouts of the enterprises listed on Nepal Stock Exchange Ltd. A priori hypothesis
between relationship of the dividends paid by the enterprises and enterprises’ characteristics- net
profits, size, lagged dividends, liquidity, risk, investment opportunity set, and number of
shareholders are set based on theoretical framework and other empirical studies, and tested on 22
listed enterprises covering a 5-year period, 2009 to 2013 by employing regression model.
Purposive sampling technique is used to select the enterprises for the study. The relationships of
variables firstly analysed for overall sector and further for sub-sectors of financial and non-
financial sector. Overall sector analysis is performed through pooled cross-sectional data.
Further to check sectoral differences, sector wise regression analysis is performed. The results, in
overall, reveal that profitability, size, and liquidity are major determinants of corporate dividend
payout in Nepal. This study also reveals that there is sector specific importance of the
determinants of corporate dividend payout in Nepal.
Key Words: Dividend payout, Net profits, Size, Liquidity, Nepal
JEL Classification: C31, C87, G21, G32, G35
Director at Securities Board of Nepal, Lalitpur. Email: [email protected]
54 NRB Economic Review
I. INTRODUCTION
The dividend payout means the payout that managers follow in deciding the size and
pattern of cash distribution to shareholders over time. The various financial
considerations present a difficult situation to the management for coming to a decision
regarding dividend distribution. The analysis of the determinants of corporate dividend
policy belongs to the core issues in modern financial theory (Breuer et al. (2014)). Many
researchers try to uncover the issue regarding the determinants of dividend payout since
joint stock enterprises came into existence (Baskin (1988)), and still there is no an
acceptable explanation for the observed dividend behaviour of firms (Black (1976); Allen
and Michaely (2003); and Brealey et al. (2012)). Several studies appear in the extant
literature suggest that the dividend payout of the enterprises varies from country
to country due to various institutional and stock market differences. The study devoted to
identify the determinants of corporate dividend payout is little in Nepal, so this paper
aims at examining the determinants of corporate dividend payout in the stock market of
Nepal. This paper is specifically aims to address the issues that include: What are the
major determinants of corporate dividend payout in Nepal? Do the major determinants of
corporate dividend payout in the stock market of Nepal differ with the determinants of
corporate dividend payout of developed and emerging stock markets of the world
including Indian stock markets? Is there sector specific importance of determinants of
corporate dividend payout in Nepal?
Securities Marketing Centre (SMC) was established in 1976 to deal with Government
securities in Nepal. SMC was converted into Securities Exchange Centre (SEC) in 1984.
Before conversion into stock exchange SEC was the only capital market institution
undertaking the job of brokering, underwriting, managing public issue, market making for
Government bonds and other financial services, which led to have conflict of interest
between one function to another. The Government taking policy to address the conflict of
interest issue made first amendment in Securities Exchange Act, 1983 in 1993 that led to
restructure capital market in the country. The first amendment in the Act paved the way
to convert SEC into Nepal Stock Exchange Ltd. (NEPSE) in 1993 to take the exclusive
responsibility of secondary market operation and establish Securities Board on June 7,
1993 as oversight agency to regulate capital market. The second amendment in the Act,
1983 was made in 1997 which made provision to register securities businesspersons in
Securities Board of Nepal (SEBON). New Securities Act enacted in 2007 incorporating
the provisions requiring public companies to register all securities at SEBON before
making public issue and one window policy in public issue with extended disclosures
including others. Central Securities Depository (CSD) and Credit Rating Agency (CRA)
were licensed on August 25, 2011 and October 2, 2012 respectively as major
infrastructures.
Stock market activities in Nepal during mid-July 1998 to mid-July 2014 revealed that
there was annual average 15.16 percent of the listed enterprises making timely disclosure,
annual average NPR 4.54 billion funds were raised by issuing securities (quite lower as
compared to the NPR 307.70 billion loans and advances made by commercial banks
(Nepal Rastra Bank (2003 to 2014)), and annual average 4.24 percent turnover (below
than the 7.5 percent specified by World Bank for emerging markets) was in secondary
Determinants of Corporate Dividend Payout in Nepal 55
market (SEBON (1998 to 2014)). The secondary market is highly fluctuating in Nepal as
market index fluctuation ranged between 1175.38 points as on August 31, 2008 and
292.32 points as on June 15, 2011 without having any definite economic reasons.
Nepalese stock market is still in a pre-emerging stage of development with the structural
problems- Government holding in major infrastructures-NEPSE and CSD and fixed
pricing system in public offerings; infrastructural deficiencies- absence of online trading
system and proper over-the-counter (OTC) market; and regulatory weaknesses-poor
disclosure practices, dominance of banks and other financial institutions in issuing and
trading securities, highly fluctuating market index, absence of enforcement of legal
provisions, absence of cross-border listing and trading; and low level of international
networking as SEBON-capital market regulator has not yet been member of international
organisation of securities commissions (IOSCO) (Adhikari (2015)). Similarly, listing,
trading, and clearing and settlement are at present in the initial stages of development.
A study devoted to this market would be interesting not only to the researchers around the
globe but equally to the investors and corporate managers at home country as well as
stock market authorities to reform and develop stock market in the country. This paper,
thus, contributes another piece to the emerging puzzle by examining the determinants of
dividend payout in the pre-emerging stock market of Nepal. The policy implication
section of this paper will illuminate the implication of findings in greater detail.
The rest of the paper is organised as follows. Section 2 presents the review of relevant
literature. Research methodology of the study is described in Section 3. The analysis of
data is made in Section 4. Results are discussed and conclusion is made in Section 5.
Section 6 deals with policy implication along with research avenues.
II. LITERATURE REVIEW
Pogue (1971) argues that the most important determinant of dividends is corporate
income. Based on an empirical analysis of changes in dividends, Benartzi et al. (1997)
indicates that net profits and dividend paid in the previous year are the major
determinants of dividend policy. These factors are also similar to those reported by Baker
et al. (1985); Farrelly et al. (1989); and Pruitt and Gitman (1991). Taken together, the
dividend payout is largely a function of earnings and the last period‟s dividend payment.
Cruchley and Hansen (1989) on ownership, dividend policy and leverage conclude that
managers make financial policy tradeoffs to control agency costs in an efficient manner.
Agency costs arise when owner-managers sell off portions of their stockholdings to so-
called „outside‟ securities holders who have no voice in management (Jensen and
Meckling (1976)). A wealth-maximizing enterprise adopts an optimal
monitoring/bonding package, which acts to reduce agency costs. Kumar (2006) reveals
that ownership is one of the important variables influencing the dividend policy.
Kuh (1965) establishes the influence of investment on dividends by estimating regression
coefficient. Fama (1974) reveals that dividend payments are inversely related to the
demand for investment funds. Increased investment in plant and machinery, other fixed
assets and inventories may result in decreased payout ratio. As such, investment demand
in an enterprise is negatively related to its dividend payment decisions (Lintner (1956);
56 NRB Economic Review
Kuh (1965); and Dhrymes and Kurz (1967)). In view of these empirical findings, the
present paper is directed towards examining the impact of investment opportunity on
dividend decisions by explicitly introducing a variable to this account in Nepal.
Determinants of dividend payout in general could also differ by industry group. However,
Florence (1959) argues that neither the size of the enterprise nor its industry accounts
completely for the very wide variation in dividend policy. Michel (1979) and Baker
(1988) suggest that a positive relationship exists between industry classification and
dividend policy. Baker and Powell (2000) conclude that industry type appears to
influence the dividend policy of an enterprise. Similarly, Gill et al. (2010) reveals that
dividend determinants are industry specific.
Grullon and Michaely (2002) reveal that systemic risk significantly declines with the
decision to increase dividends for dividend-increasing enterprises. The decline in risk
results in an economically significant decline in their cost of capital. The study shows that
this decline in the cost of capital can account for the positive price reaction to the
dividend increase announcement. This finding indicates that systemic risk and dividend
payout ratio is negatively related. Kuo et al. (2013) indicates that risk play a major role in
firms‟ dividend policy and further points that liquidity is an important determinant of
dividend payout policy in developed markets of US and Europe. Kumar and Waheed
(2015) conclude that liquid firms tend to pay more dividends in UAE market.
Turning to the Indian context, Swamy and Rao (1975); Dhameja (1978); and Khurana
(1985) corroborate that there is an impact of investment demand on dividend payout.
Contrary to these studies, Krishnamurty and Sastry (1973) state that dividend decisions
are largely independent of the investment. Mahapatra and Sahu (1993) reveal that
dividend decision is primarily governed by cash flow and lagged dividend. Krishnamurty
and Sastry (1973); and Khurana (1985) argue that liquidity position of the enterprise is an
important determinant of dividend policy. Nigam and Joshi (1962) generalises their
findings that the higher the level of profits as a percentage of paid-up capital, the higher
the rate of dividend record. These studies imply that investment demand, cash flow,
lagged dividend, liquidity, and net profits are the determinants of dividend payout in
India.
Determinants of Corporate Dividend Payout in Nepal 57
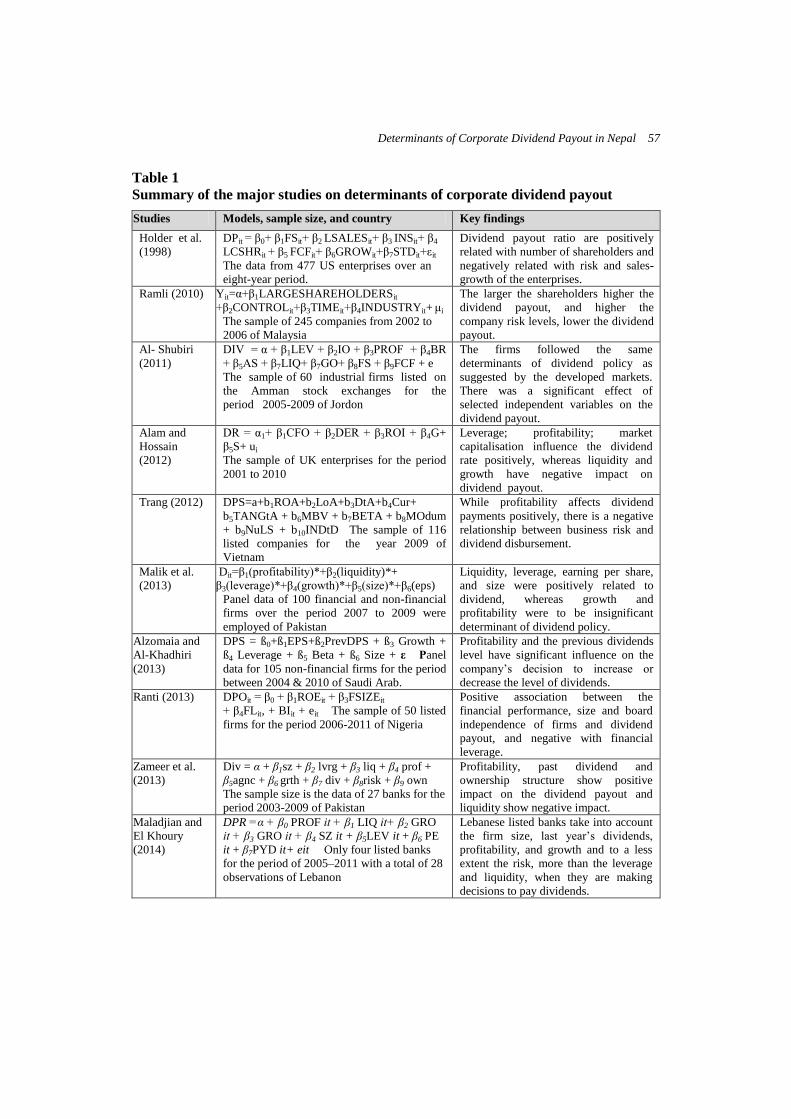
Table 1
Summary of the major studies on determinants of corporate dividend payout
Studies Models, sample size, and country Key findings
Holder et al.
(1998)
DPit = β0+ β1FSit+ β2 LSALESit+ β3 INSit+ β4
LCSHRit + β5 FCFit+ β6GROWit+β7STDit+εit
The data from 477 US enterprises over an
eight-year period.
Dividend payout ratio are positively
related with number of shareholders and
negatively related with risk and sales-
growth of the enterprises.
Ramli (2010) Yit=α+β1LARGESHAREHOLDERSit
+β2CONTROLit+β3TIMEit+β4INDUSTRYit+ μi
The sample of 245 companies from 2002 to
2006 of Malaysia
The larger the shareholders higher the
dividend payout, and higher the
company risk levels, lower the dividend
payout.
Al- Shubiri
(2011)
DIV = α + β1LEV + β2IO + β3PROF + β4BR
+ β5AS + β7LIQ+ β7GO+ β8FS + β9FCF + e
The sample of 60 industrial firms listed on
the Amman stock exchanges for the
period 2005-2009 of Jordon
The firms followed the same
determinants of dividend policy as
suggested by the developed markets.
There was a significant effect of
selected independent variables on the
dividend payout.
Alam and
Hossain
(2012)
DR = α1+ β1CFO + β2DER + β3ROI + β4G+
β5S+ ui
The sample of UK enterprises for the period
2001 to 2010
Leverage; profitability; market
capitalisation influence the dividend
rate positively, whereas liquidity and
growth have negative impact on
dividend payout.
Trang (2012) DPS=a+b1ROA+b2LoA+b3DtA+b4Cur+
b5TANGtA + b6MBV + b7BETA + b8MOdum
+ b9NuLS + b10INDtD The sample of 116
listed companies for the year 2009 of
Vietnam
While profitability affects dividend
payments positively, there is a negative
relationship between business risk and
dividend disbursement.
Malik et al.
(2013)
Dit=β1(profitability)*+β2(liquidity)*+
β3(leverage)*+β4(growth)*+β5(size)*+β6(eps)
Panel data of 100 financial and non-financial
firms over the period 2007 to 2009 were
employed of Pakistan
Liquidity, leverage, earning per share,
and size were positively related to
dividend, whereas growth and
profitability were to be insignificant
determinant of dividend policy.
Alzomaia and
Al-Khadhiri
(2013)
DPS = ß0+ß1EPS+ß2PrevDPS + ß3 Growth +
ß4 Leverage + ß5 Beta + ß6 Size + ε Panel
data for 105 non-financial firms for the period
between 2004 & 2010 of Saudi Arab.
Profitability and the previous dividends
level have significant influence on the
company‟s decision to increase or
decrease the level of dividends.
Ranti (2013)
DPOit = β0 + β1ROEit + β3FSIZEit
+ β4FLit, + BIit + eit The sample of 50 listed
firms for the period 2006-2011 of Nigeria
Positive association between the
financial performance, size and board
independence of firms and dividend
payout, and negative with financial
leverage.
Zameer et al.
(2013)
Div = α + β1sz + β2 lvrg + β3 liq + β4 prof +
β5agnc + β6 grth + β7 div + β8risk + β9 own
The sample size is the data of 27 banks for the
period 2003-2009 of Pakistan
Profitability, past dividend and
ownership structure show positive
impact on the dividend payout and
liquidity show negative impact.
Maladjian and
El Khoury
(2014)
DPR =α + β0 PROF it + β1 LIQ it+ β2 GRO
it + β3 GRO it + β4 SZ it + β5LEV it + β6 PE
it + β7PYD it+ eit Only four listed banks
for the period of 2005–2011 with a total of 28
observations of Lebanon
Lebanese listed banks take into account
the firm size, last year‟s dividends,
profitability, and growth and to a less
extent the risk, more than the leverage
and liquidity, when they are making
decisions to pay dividends.
58 NRB Economic Review
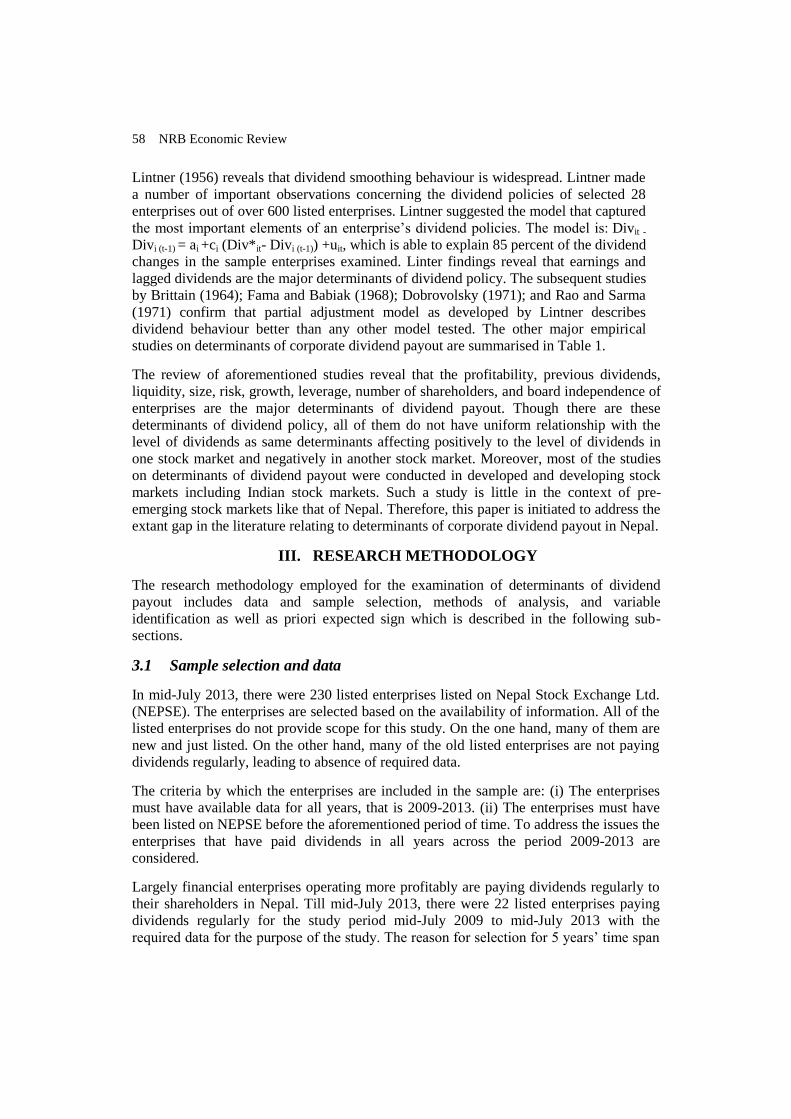
Lintner (1956) reveals that dividend smoothing behaviour is widespread. Lintner made
a number of important observations concerning the dividend policies of selected 28
enterprises out of over 600 listed enterprises. Lintner suggested the model that captured
the most important elements of an enterprise‟s dividend policies. The model is: Divit -
Divi (t-1) = ai +ci (Div*it- Divi (t-1)) +uit, which is able to explain 85 percent of the dividend
changes in the sample enterprises examined. Linter findings reveal that earnings and
lagged dividends are the major determinants of dividend policy. The subsequent studies
by Brittain (1964); Fama and Babiak (1968); Dobrovolsky (1971); and Rao and Sarma
(1971) confirm that partial adjustment model as developed by Lintner describes
dividend behaviour better than any other model tested. The other major empirical
studies on determinants of corporate dividend payout are summarised in Table 1.
The review of aforementioned studies reveal that the profitability, previous dividends,
liquidity, size, risk, growth, leverage, number of shareholders, and board independence of
enterprises are the major determinants of dividend payout. Though there are these
determinants of dividend policy, all of them do not have uniform relationship with the
level of dividends as same determinants affecting positively to the level of dividends in
one stock market and negatively in another stock market. Moreover, most of the studies
on determinants of dividend payout were conducted in developed and developing stock
markets including Indian stock markets. Such a study is little in the context of pre-
emerging stock markets like that of Nepal. Therefore, this paper is initiated to address the
extant gap in the literature relating to determinants of corporate dividend payout in Nepal.
III. RESEARCH METHODOLOGY
The research methodology employed for the examination of determinants of dividend
payout includes data and sample selection, methods of analysis, and variable
identification as well as priori expected sign which is described in the following sub-
sections.
3.1 Sample selection and data
In mid-July 2013, there were 230 listed enterprises listed on Nepal Stock Exchange Ltd.
(NEPSE). The enterprises are selected based on the availability of information. All of the
listed enterprises do not provide scope for this study. On the one hand, many of them are
new and just listed. On the other hand, many of the old listed enterprises are not paying
dividends regularly, leading to absence of required data.
The criteria by which the enterprises are included in the sample are: (i) The enterprises
must have available data for all years, that is 2009-2013. (ii) The enterprises must have
been listed on NEPSE before the aforementioned period of time. To address the issues the
enterprises that have paid dividends in all years across the period 2009-2013 are
considered.
Largely financial enterprises operating more profitably are paying dividends regularly to
their shareholders in Nepal. Till mid-July 2013, there were 22 listed enterprises paying
dividends regularly for the study period mid-July 2009 to mid-July 2013 with the
required data for the purpose of the study. The reason for selection for 5 years‟ time span
Determinants of Corporate Dividend Payout in Nepal 59
is to have a large number of enterprises having uninterrupted dividend payouts in the
sample and that one business cycle is completed in 5-7 years (Rafique (2012)). Thus,
cross-sectional data of 22 listed enterprises (17 financial enterprises and 5 non-financial
enterprises) for the period of 2009 to 2013 are used in the study as presented in Appendix
1.
As there is absence of a standard database containing information about listed enterprises
that can be commonly used by both the researchers and the industry alike in Nepal, the
required data relating to enterprise‟s dividend payout, net profits, size, lagged dividends,
liquidity, dividends per share, closing stock price per share, book value per share, opening
stock price, opening NEPSE index, closing NEPSE index, number of shareholders, etc.
are extracted from the publications of NEPSE and from the annual reports and minutes of
annual general meetings of the respective listed enterprises. The data, thus obtained are
processed for the purpose of the study.
3.2 Methods of analysis
The study examines the relationship of corporate dividend payout, with dividend payout
determinant variables, such as, net profits, size, lagged dividends, liquidity, risk,
investment opportunity set, and number of shareholders. In order to carry out this study,
descriptive cum analytical research designs are employed. Descriptive research design is
used mainly for conceptualisation of the issues. Analytical research design is employed to
analyse the data and results.
The theoretical statement of the model is that dividend payout, 'DIV', can be considered
as subject to the constraints of net profits, 'PROFIT', logarithm of assets-size, „LoA‟,
lagged dividends, 'LAG DIV', liquidity, „LIQ‟, risk, 'BETA', investment opportunity set,
'IOS' and logarithm of number of shareholders, 'LSH'. The theoretical statement is framed
as: DIV= f (PROFIT, LoA, LAG DIV, LIQ, BETA, IOS, LSH). The model to be
estimated is, therefore, specified as under:
DIV=a0+a1PROFIT+a2LoA+a3LAGDIV+ a4LIQ +a5BETA+a6IOS+a7LSH+ e
Where,
'DIV' is total dividends paid by the enterprise in period„t‟ or paid up capital multiplied
by dividend percent- a measure of an enterprise‟s dividend payout.
'PROFIT' is net profits in period„t‟; it is the earnings of the enterprise after deducting
depreciation and taxes.
„LoA‟ is natural logarithm of assets that stands for enterprise size.
'LAG DIV' is total dividends in period„t-1‟, i.e., lagged dividends of the enterprise.
„LIQ‟ is liquidity in period„t‟ is a ratio of current assets to current liabilities of the
enterprise.
60 NRB Economic Review
'BETA' is risk of the enterprise, for a given sample, „BETA‟ is constant in all test
years, beta is obtained from the following formula: β = COV (return on per share and
return on market)/ market variance.
'IOS' is the investment opportunity set in period„t‟ is a ratio of market-to-book value
of the enterprise denoting growth opportunities, this variable is included here to
capture the effect of the cost of financing. The rational for representing investment
opportunity set by closing price per share divided by net worth per share, i.e., a ratio
of market-to-book value of the enterprise as used by El Essa et al. (2012), is that an
enterprise with high closing price relative to its net worth per share has more scope of
expanding its businesses with more investment opportunities.
'LSH' is the logarithm of number of shareholders of the enterprise (LSH) in period„t‟.
This variable is considered to measure the dispersion of ownership, which is relatively
a least used variable in the empirical studies on determinants of dividend policy.
And 'e' is error term.
The model is estimated using a pooled cross-sectional data of selected Nepalese
enterprises, first in total sample and then in sub-samples. Based on theory and previous
empirical evidence, the following variables and priori expected sign are specified:
a) Dividends
An enterprise‟s dividend payout is proxied by its dividends, which is total dividends paid
by the enterprise as proxied by Zameer et al.(2013); Ranti (2013); Alam and Hossain
(2012); Al- Shubiri (2011); Ramli (2010)).
b) Net profits
The choice of this variable is guided by several empirical tests and survey results (Lintner
(1956); Brittain (1964); Arora (1965); Baker et al. (1985); Farrelly et al. (1989); Pruitt
and Gitman (1991); Baker and Powell (2000); Amidu and Abor (2006); Anil and Kapoor
(2008); Gill et al. (2010); Al-Shubiri (2011); Trang (2012); and Alam and Hossain
(2012)). Most dividend models implicitly assume that the current dividend payments of
the enterprises are a distributed lag function of current and past profits (Fama and Babiak
(1968)). Profitable enterprises are more likely to support high dividend payments to
shareholders; hence, it is hypothesized that dividend payout will increase with the net
profits.
c) Enterprise size
The variable size should be constructed in such a way that it will reflect the value of the
enterprise in real terms. The natural log of total assets is being used as a proxy for size in
this study. The previous literature assumed that there is a relationship between the
enterprise‟s size and its dividend policy; hence an enterprise's size is expected to explain
the enterprise's dividend policy. Large enterprises are more likely to be mature and thus
have easier access to capital markets, and should be able to pay more dividends.
This relationship is supported by the transaction cost explanation of dividend
Determinants of Corporate Dividend Payout in Nepal 61
policy (Holder et al. (1998); Manos et al. (2001); Chang and Rhee (2003); Ho (2003);
Aivazian et al. (2003); Eije and Megginson (2006); Kowalewski et al. (2007); Ahmed and
Javid (2009); and Mehta (2012)). Sawicki (2005) illustrates that dividend payouts can
help to indirectly monitor the performance of managers in large enterprises. Hence,
it is hypothesized that larger the enterprise higher the dividends.
d) Lagged dividends
Lintner (1956); and Baker et al. (1985) in their survey of management views on dividend
policy respectively argued that respondents were highly concerned with dividend
continuity. Dhameja (1972) in the Indian context contends that lagged dividends are
directly associated with current year dividends. Alzomaia and Al-Khadhiri (2013) in
Saudi stock market conclude that the previous dividends level has significant influence on
the company‟s decision to increase or decrease the level of dividends. Once dividends are
increased, enterprises show great reluctance to reduce them, except under the most
extreme conditions as demonstrated by Lintner (1956); and Al-Shubiri (2011). If the prior
payout is larger, then managers and shareholders may expect a greater dividend payout in
the future. Hence, it is hypothesized that dividend payout will increase with the lagged
dividends.
e) Liquidity
It is current assets divided by current liabilities. It indicates the availability of current
assets in rupees for every rupee of current liabilities. This ratio tests the short term
solvency of an enterprise. An enterprise's liquidity or cash flows position is an important
factor that affects the distribution of cash dividends. The firms with more liquidity are
more likely to pay dividends as compared to the firms with a liquidity crunch (Kanwal
and Kapoor (2008); Ahmed and Javid (2009); Mehta (2012); and (Saeed et al. (2014)).
This positive relationship is supported by the signalling theory of dividend policy (Ho
(2003)). Hence, it is hypothesized that liquidity of the enterprise will increase the
dividend payout.
f) Investment opportunity set
This variable is included here to capture the effect of the cost of external financing.
Increased investment in plant and machinery, other fixed assets and inventories may
result in decreasing payout ratio (Mahapatra and Sahu (1993)). An enterprise with a high
investment opportunity set should have relatively more investment opportunities, and in
this case, the enterprise would tend to retain funds and, therefore, will have a lower
dividend payout. Brittain (1964) argues that some indication may appear that rising
investment depresses dividends. Dividends are less likely in enterprises with more
investments (Fama and French (2001)). Higgins (1972) argues that payout ratio is
negatively related to a firm's need for funds to finance growth opportunities. Rapidly
growing large enterprises no longer feel compelled to pay dividends (Fama and French
(2001); and Eije and Megginson (2006)). In emerging economies, investment opportunity
is a major determinant of dividend policy (Arif and Akbar (2013)). It affects dividend
policy payout negatively, as firms prefer to retain funds to invest in future investments
and projects that have positive net present value (Abor and Bokpin (2010)). As defined
62 NRB Economic Review
earlier investment opportunity set is the market to book value ratio which has negative
relation with dividend payout (Amidu and Abor (2006); and (Rehman and Takumi
(2012)). Hence, the priori hypothesis is that higher the investment opportunity set of the
enterprise, the lower will be the dividend payout.
g) Risk
A natural surrogate of operating and financial leverage is the enterprise‟s risk (beta
coefficient) - the co-variance of it‟s per share return with the market return (NEPSE
return) divided by the variance of the market return. Riskier enterprises have both lower
dividend payout and lower price earnings ratios (Friend and Puckett (1964)). Enterprises
with higher risk tend to payout less dividends (Ramli (2010); Ardestani et al. (2013); and
Ranti (2013)). There is an inverse relation between a stock‟s dividend yield and its
systemic risk (Lewellyen et al. (1978)), a negative relationship is there between payout
ratio and risk (Amidu and Abov (2006), there is negative relationship between systemic
risk and dividend per share (Adhikari (2015)). Hence, it is hypothesized that the dividend
payout is negatively related to the enterprise‟s risk.
h) Number of shareholders
Enterprises with a larger dispersion of ownership of common stock will have higher
agency costs and higher dividend-payout policy to control agency costs (Holder et al.
(1998)). The ownership structure has the major impact to determine the dividend
payout policy (Ahmed and Javid (2008)). To measure ownership dispersion, the log
number of shareholders is used (Rozeff (1982)). The hypothesis is that the dividend payout
is positively related to the number of shareholders in the enterprise.
IV. ANALYSIS OF DATA
Examination of determinants of corporate dividend payout is undertaken using the pooled
cross-sectional data for various classifications of sample enterprises. As such, the study is
attempted at two levels using regression analysis, viz., (4.1) total sample; and (4.2) sub-
samples. The estimated relationships using the total sample throw light on the
significance of the parameters at the macro level of the study whereas the estimated
relationships for sub-samples are useful for insight into the parameters at the individual
sector level and also to find whether there is any sector bias in the results.
4.1 Analysis of total sample
It is better to have general idea first and then logically move forward to be specific. First
of all to have an aggregate idea, analysis of total sample is made. The results of the
regression analysis of dividend payouts on the select variables for total sample are shown
in Table 2.
Determinants of Corporate Dividend Payout in Nepal 63
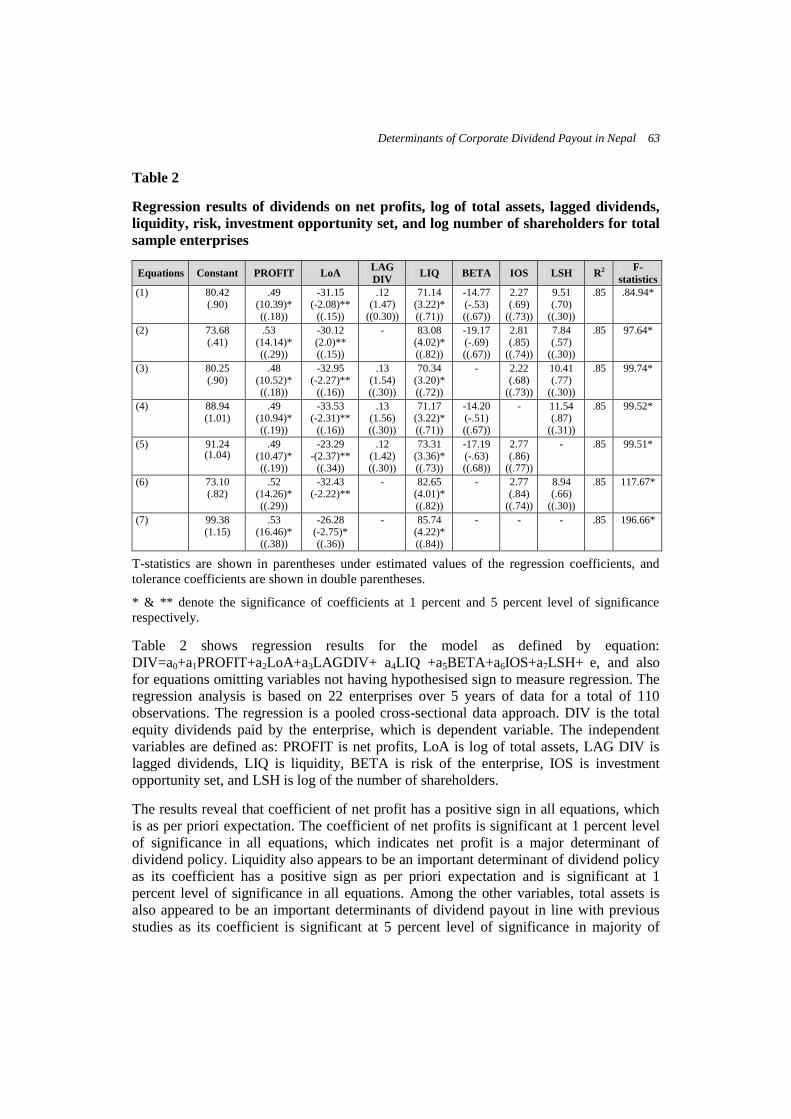
Table 2
Regression results of dividends on net profits, log of total assets, lagged dividends,
liquidity, risk, investment opportunity set, and log number of shareholders for total
sample enterprises
Equations Constant PROFIT LoA LAG
DIV LIQ BETA IOS LSH R2
F-
statistics
(1) 80.42 (.90)
.49 (10.39)* ((.18))
-31.15 (-2.08)**
((.15))
.12 (1.47)
((0.30))
71.14 (3.22)* ((.71))
-14.77 (-.53) ((.67))
2.27 (.69)
((.73))
9.51 (.70)
((.30))
.85 .84.94*
(2) 73.68 (.41)
.53 (14.14)* ((.29))
-30.12 (2.0)** ((.15))
- 83.08 (4.02)* ((.82))
-19.17 (-.69) ((.67))
2.81 (.85)
((.74))
7.84 (.57)
((.30))
.85 97.64*
(3) 80.25 (.90)
.48 (10.52)* ((.18))
-32.95 (-2.27)**
((.16))
.13 (1.54) ((.30))
70.34 (3.20)* ((.72))
- 2.22 (.68)
((.73))
10.41 (.77)
((.30))
.85 99.74*
(4) 88.94 (1.01)
.49 (10.94)* ((.19))
-33.53 (-2.31)**
((.16))
.13 (1.56) ((.30))
71.17 (3.22)* ((.71))
-14.20 (-.51) ((.67))
-
11.54 (.87)
((.31))
.85 99.52*
(5) 91.24 (1.04)
.49 (10.47)* ((.19))
-23.29 -(2.37)**
((.34))
.12 (1.42) ((.30))
73.31 (3.36)* ((.73))
-17.19 (-.63) ((.68))
2.77 (.86)
((.77))
- .85 99.51*
(6) 73.10 (.82)
.52 (14.26)* ((.29))
-32.43 (-2.22)**
- 82.65 (4.01)* ((.82))
- 2.77 (.84)
((.74))
8.94 (.66)
((.30))
.85 117.67*
(7) 99.38 (1.15)
.53 (16.46)* ((.38))
-26.28 (-2.75)* ((.36))
- 85.74 (4.22)* ((.84))
- - - .85
196.66*
T-statistics are shown in parentheses under estimated values of the regression coefficients, and
tolerance coefficients are shown in double parentheses.
* & ** denote the significance of coefficients at 1 percent and 5 percent level of significance
respectively.
Table 2 shows regression results for the model as defined by equation:
DIV=a0+a1PROFIT+a2LoA+a3LAGDIV+ a4LIQ +a5BETA+a6IOS+a7LSH+ e, and also
for equations omitting variables not having hypothesised sign to measure regression. The
regression analysis is based on 22 enterprises over 5 years of data for a total of 110
observations. The regression is a pooled cross-sectional data approach. DIV is the total
equity dividends paid by the enterprise, which is dependent variable. The independent
variables are defined as: PROFIT is net profits, LoA is log of total assets, LAG DIV is
lagged dividends, LIQ is liquidity, BETA is risk of the enterprise, IOS is investment
opportunity set, and LSH is log of the number of shareholders.
The results reveal that coefficient of net profit has a positive sign in all equations, which
is as per priori expectation. The coefficient of net profits is significant at 1 percent level
of significance in all equations, which indicates net profit is a major determinant of
dividend policy. Liquidity also appears to be an important determinant of dividend policy
as its coefficient has a positive sign as per priori expectation and is significant at 1
percent level of significance in all equations. Among the other variables, total assets is
also appeared to be an important determinants of dividend payout in line with previous
studies as its coefficient is significant at 5 percent level of significance in majority of
64 NRB Economic Review
cases. However, the coefficient of total assets does not have positive sign as theoretically
expected.
To gauge robustness and sensitivity-to-specification error of the regression, each
independent variable having insignificant coefficient and unexpected sign of the
coefficient was removed from the complete model and the regressions are re-estimated.
These results are shown in Table 2, lines 2-7. The coefficients of the variables did not
change in sign or size (regression coefficients are not remarkably sensitive to these
alterations in terms of sign and significance). In further six equations, the explanatory
power of the regression model did not increase at all.
Multicollinearity between explanatory variables may result in the wrong signs, or
implausible magnitudes, in the estimated model coefficients, and the bias of the standard
errors of the coefficients. To avoid this problem, the tolerance (TOL) test is used. The
results of this test are presented in double parenthesis below the regression coefficient of
the variable in Table 2.
The zero or closer to zero TOL of the variable indicates the greater the degree of
collinearity of that variable with other regressors (Gujrati (2003)). The TOL coefficient of
each variable in all equations is not zero or closer to zero indicating multicollinearity does
not appear to be a significant problem. This implies that the explanatory variables
included in the model are not substantially correlated with each other.
The interpretation of (Equation (1)) in Table 2 is this: if both net profits, total assets,
lagged dividends, risk, investment opportunity set, and number of shareholders are fixed
at zero value, the average value of dividend payouts is estimated to at about Rs.80. The
partial regression coefficient of 0.49 means that, holding all other variables constant, an
increase in profit, say, a rupee is accompanied by an increase in the mean dividend payout
of about 49 percent. Similarly, holding all other variables constant, the mean dividend
payout decreased at the rate of about Rs.31 by an increase in a rupee of total asset. The R2
value of 0.85 shows the seven explanatory variables accounted for 85 percent of the
variation in dividend payouts in Nepal over the period 2009- 2013, is considered good.
The same R2 in all equations may be attributed to sample of listed enterprises in the study
with stable performance and regular dividend payment. Turning to the F-value in
Equation (1) in Table 2, it shows that it is significant at 1 percent level of significance
reflecting that regression equations provide statistically significant results.
4.2 Analysis of sub-samples
Based on nature of the sector the enterprises involved and also the number of selected
listed enterprises, the total sample is classified into two sub-samples. The sub-samples
include: (i) financial sector, and (ii) non-financial sector. The financial sector includes
commercial banks, development banks, finance companies as well as a micro-finance
company whereas non-financial sector includes the manufacturing and processing
companies, trading company, hotel, and a hydro-electricity sector company. Due to low
number of listed enterprises paying uninterrupted dividends in different sectors during the
study period, the total sample could not be considered into more than two-sub-samples
for sectoral analysis.
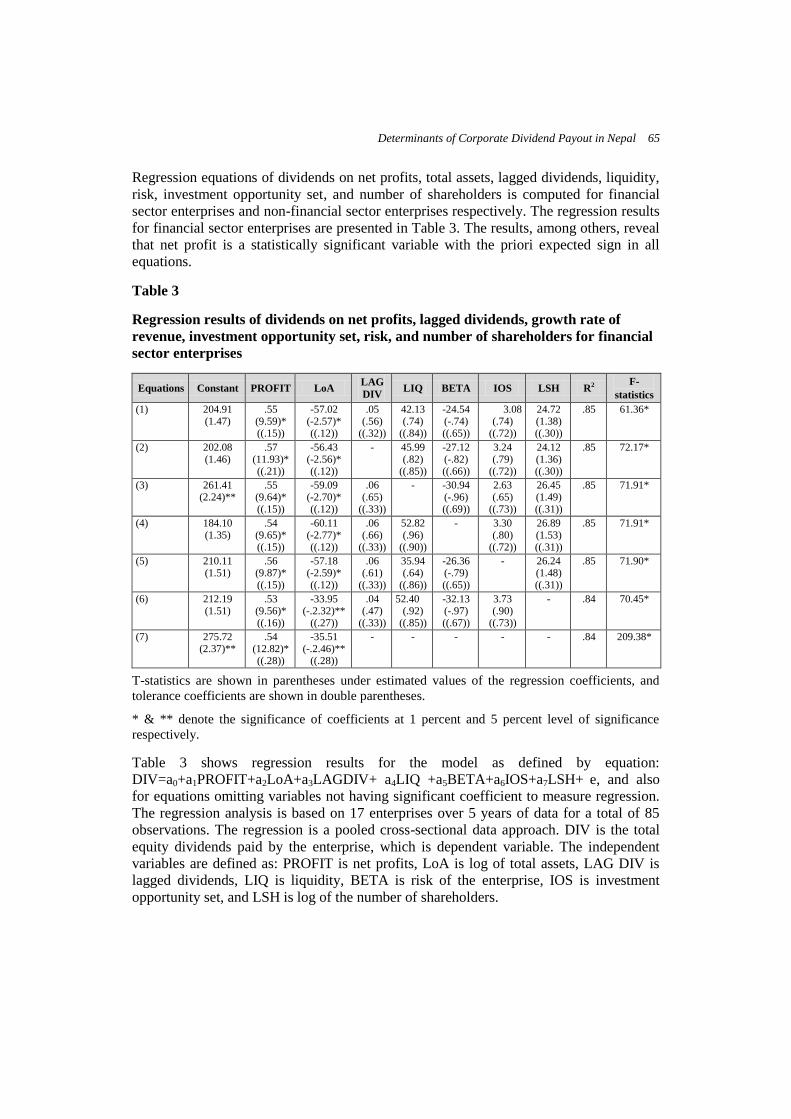
Determinants of Corporate Dividend Payout in Nepal 65
Regression equations of dividends on net profits, total assets, lagged dividends, liquidity,
risk, investment opportunity set, and number of shareholders is computed for financial
sector enterprises and non-financial sector enterprises respectively. The regression results
for financial sector enterprises are presented in Table 3. The results, among others, reveal
that net profit is a statistically significant variable with the priori expected sign in all
equations.
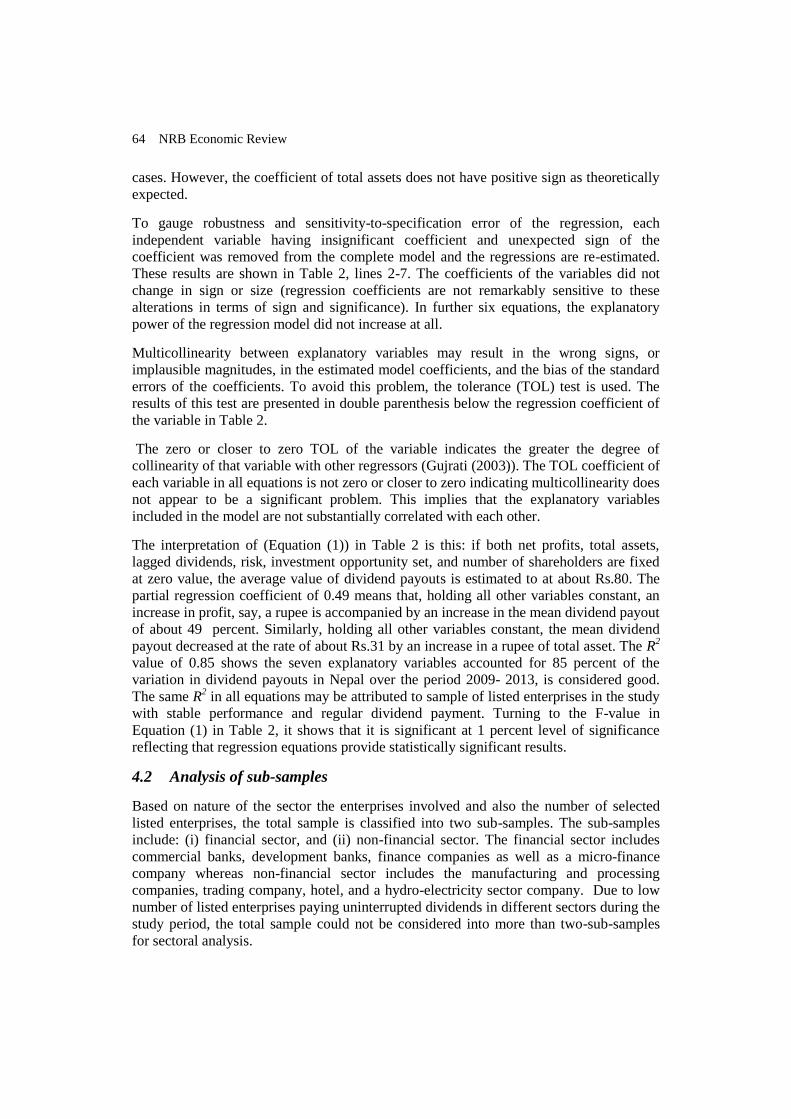
Table 3
Regression results of dividends on net profits, lagged dividends, growth rate of
revenue, investment opportunity set, risk, and number of shareholders for financial
sector enterprises
Equations Constant PROFIT LoA LAG
DIV LIQ BETA IOS LSH R2
F-
statistics
(1) 204.91 (1.47)
.55 (9.59)* ((.15))
-57.02 (-2.57)* ((.12))
.05 (.56)
((.32))
42.13 (.74)
((.84))
-24.54 (-.74) ((.65))
3.08 (.74)
((.72))
24.72 (1.38) ((.30))
.85 61.36*
(2) 202.08 (1.46)
.57 (11.93)* ((.21))
-56.43 (-2.56)* ((.12))
- 45.99 (.82)
((.85))
-27.12 (-.82) ((.66))
3.24 (.79)
((.72))
24.12 (1.36) ((.30))
.85 72.17*
(3) 261.41 (2.24)**
.55 (9.64)* ((.15))
-59.09 (-2.70)* ((.12))
.06 (.65)
((.33))
-
-30.94 (-.96) ((.69))
2.63 (.65)
((.73))
26.45 (1.49) ((.31))
.85 71.91*
(4) 184.10 (1.35)
.54 (9.65)* ((.15))
-60.11 (-2.77)* ((.12))
.06 (.66)
((.33))
52.82 (.96)
((.90))
- 3.30 (.80)
((.72))
26.89 (1.53) ((.31))
.85 71.91*
(5) 210.11 (1.51)
.56 (9.87)* ((.15))
-57.18 (-2.59)* ((.12))
.06 (.61)
((.33))
35.94 (.64)
((.86))
-26.36 (-.79) ((.65))
- 26.24 (1.48) ((.31))
.85 71.90*
(6) 212.19 (1.51)
.53 (9.56)* ((.16))
-33.95 (-.2.32)**
((.27))
.04 (.47)
((.33))
52.40 (.92)
((.85))
-32.13 (-.97) ((.67))
3.73 (.90)
((.73))
-
.84 70.45*
(7) 275.72 (2.37)**
.54 (12.82)* ((.28))
-35.51 (-.2.46)**
((.28))
- - - - - .84 209.38*
T-statistics are shown in parentheses under estimated values of the regression coefficients, and
tolerance coefficients are shown in double parentheses.
* & ** denote the significance of coefficients at 1 percent and 5 percent level of significance
respectively.
Table 3 shows regression results for the model as defined by equation:
DIV=a0+a1PROFIT+a2LoA+a3LAGDIV+ a4LIQ +a5BETA+a6IOS+a7LSH+ e, and also
for equations omitting variables not having significant coefficient to measure regression.
The regression analysis is based on 17 enterprises over 5 years of data for a total of 85
observations. The regression is a pooled cross-sectional data approach. DIV is the total
equity dividends paid by the enterprise, which is dependent variable. The independent
variables are defined as: PROFIT is net profits, LoA is log of total assets, LAG DIV is
lagged dividends, LIQ is liquidity, BETA is risk of the enterprise, IOS is investment
opportunity set, and LSH is log of the number of shareholders.
66 NRB Economic Review
Total asset is also statistically significant variable in explaining dividend payout of the
enterprises. However, this variable does not have priori expected sign. Irrespective of
theoretical expectation, total asset has negative sign, that is, higher the total assets or size
of the enterprise, lower the dividend payouts.
The variable lagged dividend not having significant coefficient is omitted from the
equation and the equation is re-estimated in Table 3 (Equation (2)). The result also
reveals that the coefficient of only one variable net profit is statistically significant with
the priori expected sign and the coefficient of other variable total asset is statistically
significant without priori expected sign. Similarly, the regression result, except the
variable liquidity (Equation (3)), risk (Equation (4)), investment opportunity set
(Equation (5)), and number of shareholders (Equation (6)) also reveal the same results.
The results of Equation (7) by omitting all variables with statistically insignificant
coefficients also reveal that net profit and total asset are statistically significant. To gauge
the robustness and sensitivity-to-specification error of the regression, each of the
independent variables having insignificant coefficient is removed from the complete
model and the regressions are re-estimated-Equation (2) to Equation (6). The regression
coefficients are not remarkably sensitive to these alterations in terms of sign and
significance, and the TOL coefficient of each variable in all equations is greater than 14,
indicates that multicollinearity is not a significant problem.
The explanatory power of the regression equations as indicated by R2
in Table 3, which
have explained more than 84 percent of cross-sectional variability in dividends with the
independent variables used in the models, and F-value in all equations in Table 3 shows
that it is significant at 1 percent level of significance reflecting that regression equations
provide statistically significant results. Hence, net profits and total assets are found to be
a major determinant of dividend payout for the financial sector enterprises in Nepal.
As explained in research methods, model is also estimated using sub-sample enterprises
as aforementioned in financial sector and as in forthcoming non-financial sector. The
regression results for non-financial sector are shown in Table 4.
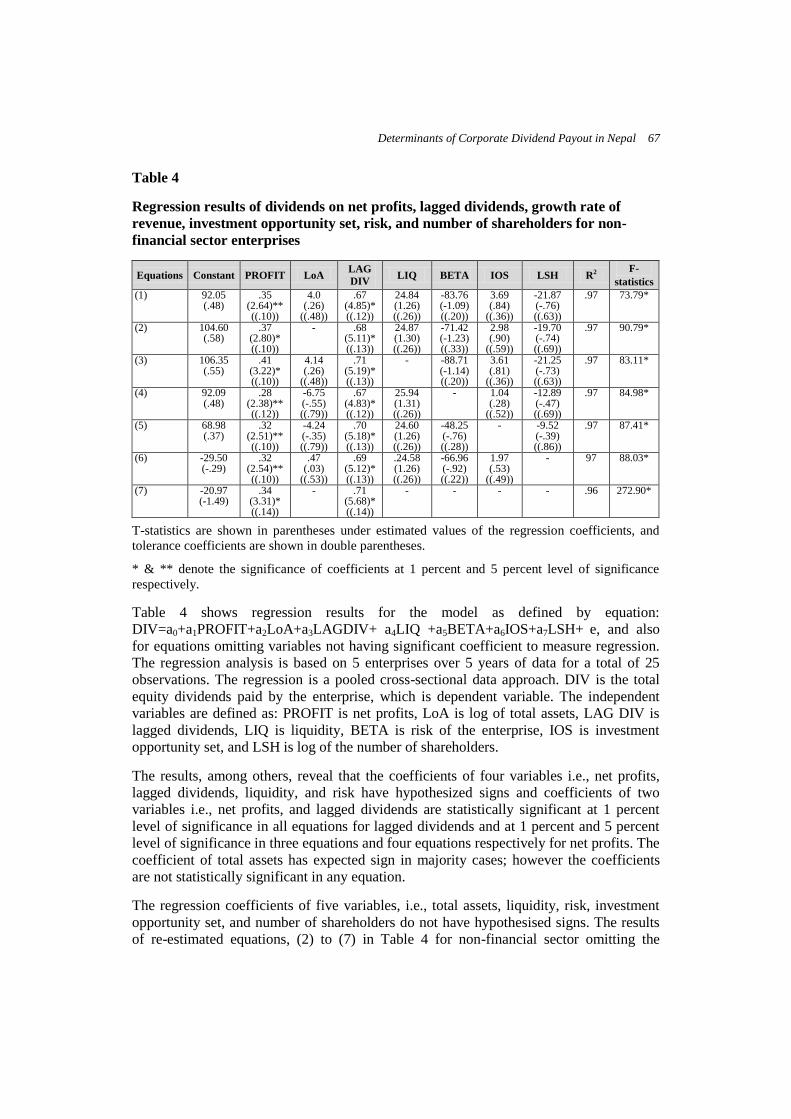
Determinants of Corporate Dividend Payout in Nepal 67
Table 4
Regression results of dividends on net profits, lagged dividends, growth rate of
revenue, investment opportunity set, risk, and number of shareholders for non-
financial sector enterprises
Equations Constant PROFIT LoA LAG
DIV LIQ BETA IOS LSH R2
F-
statistics
(1) 92.05 (.48)
.35 (2.64)** ((.10))
4.0 (.26)
((.48))
.67 (4.85)* ((.12))
24.84 (1.26) ((.26))
-83.76 (-1.09) ((.20))
3.69 (.84)
((.36))
-21.87 (-.76) ((.63))
.97 73.79*
(2) 104.60 (.58)
.37 (2.80)* ((.10))
- .68 (5.11)* ((.13))
24.87 (1.30) ((.26))
-71.42 (-1.23) ((.33))
2.98 (.90)
((.59))
-19.70 (-.74) ((.69))
.97 90.79*
(3) 106.35 (.55)
.41 (3.22)* ((.10))
4.14 (.26)
((.48))
.71 (5.19)* ((.13))
- -88.71 (-1.14) ((.20))
3.61 (.81)
((.36))
-21.25 (-.73) ((.63))
.97 83.11*
(4) 92.09 (.48)
.28 (2.38)** ((.12))
-6.75 (-.55) ((.79))
.67 (4.83)* ((.12))
25.94 (1.31) ((.26))
- 1.04 (.28)
((.52))
-12.89 (-.47) ((.69))
.97 84.98*
(5) 68.98 (.37)
.32 (2.51)** ((.10))
-4.24 (-.35) ((.79))
.70 (5.18)* ((.13))
24.60 (1.26) ((.26))
-48.25 (-.76) ((.28))
- -9.52 (-.39) ((.86))
.97 87.41*
(6) -29.50 (-.29)
.32 (2.54)** ((.10))
.47 (.03)
((.53))
.69 (5.12)* ((.13))
.24.58 (1.26) ((.26))
-66.96 (-.92) ((.22))
1.97 (.53)
((.49))
- 97 88.03*
(7) -20.97 (-1.49)
.34 (3.31)* ((.14))
- .71 (5.68)* ((.14))
- - - - .96 272.90*
T-statistics are shown in parentheses under estimated values of the regression coefficients, and
tolerance coefficients are shown in double parentheses.
* & ** denote the significance of coefficients at 1 percent and 5 percent level of significance
respectively.
Table 4 shows regression results for the model as defined by equation:
DIV=a0+a1PROFIT+a2LoA+a3LAGDIV+ a4LIQ +a5BETA+a6IOS+a7LSH+ e, and also
for equations omitting variables not having significant coefficient to measure regression.
The regression analysis is based on 5 enterprises over 5 years of data for a total of 25
observations. The regression is a pooled cross-sectional data approach. DIV is the total
equity dividends paid by the enterprise, which is dependent variable. The independent
variables are defined as: PROFIT is net profits, LoA is log of total assets, LAG DIV is
lagged dividends, LIQ is liquidity, BETA is risk of the enterprise, IOS is investment
opportunity set, and LSH is log of the number of shareholders.
The results, among others, reveal that the coefficients of four variables i.e., net profits,
lagged dividends, liquidity, and risk have hypothesized signs and coefficients of two
variables i.e., net profits, and lagged dividends are statistically significant at 1 percent
level of significance in all equations for lagged dividends and at 1 percent and 5 percent
level of significance in three equations and four equations respectively for net profits. The
coefficient of total assets has expected sign in majority cases; however the coefficients
are not statistically significant in any equation.
The regression coefficients of five variables, i.e., total assets, liquidity, risk, investment
opportunity set, and number of shareholders do not have hypothesised signs. The results
of re-estimated equations, (2) to (7) in Table 4 for non-financial sector omitting the
68 NRB Economic Review
variables not having priori expected signs are also the same as that of the equation with
all variables except in two equations for total assets.
The TOL coefficient of each variable in all equations is greater than 0.9 indicates that
multicollinearity is not a significant problem. The all regression equations have explained
more than 96 percent of the cross-section variation on dividends as revealed by R2.
Similarly, in each of the equations F value is significant at 1 percent level of significance
indicates that the model is significant and is good fit. Hence, net profits, and lagged
dividends are the major determinants of dividend policy for the non-financial sector.
The regression analysis for two sub-samples, i.e. financial sector and non-financial sector
reveals that major determinants of dividend payout are different for different sectors as
net profits and total assets are the major determinants of dividend payout in financial
sector whereas net profits and lagged dividends are the major determinants of dividend
payout in non-financial sector implying that Lintner‟s model appropriately explains the
dividend behaviour of this sector.
The other factors determining dividend payouts in developed and emerging stock markets
such as investment opportunity set, risk, and number of shareholders are found to have
insignificant effects on dividend payout the enterprises of the pre-emerging stock market
of Nepal.
V. CONCLUSION
The results of empirical tests for total sample reveal that net profits, total assets, and
liquidity are the major determinants of corporate dividend payout in Nepal. The result is
partly consistent with the proposition set in this study that the dividend policy of an
enterprise tends to depend on net profits, total assets, lagged dividends, liquidity, risk,
investment opportunity set, and number of shareholders, and also with the determinants
of corporate dividend payout of developed stock markets and emerging stock markets
including Indian stock market.
The finding of the present paper on determinants of dividend payout, such as net profits
is consistent with the finding of Lee (2009); Gill et al. (2010); Al-Shubiri (2011); Trang
(2012); and Alam and Hossain (2012) that there is positive relationship between
profitability and payout in the entire sample; and net profits and lagged dividends in non-
financial sector are similar to the major determinants of the dividend policy in developed
countries (Lintner (1956); Baker et al. (1985); Farrelly et al. (1989); Pruitt and Gitman
(1991); Baker and Powell (2000); Al-Shubiri (2011); and Alzomaia and Al-Khadhiri
(2013)). This finding is also similar to Dhameja (1972); and Khurana (1980) in India.
The finding of present paper for liquidity affecting positively to dividend payouts is
consistent with the recent findings of Al-Shubiri (2011); Malik et al. (2013), and Kumar
and Waheed (2015) in emerging stock markets, Kuo (2013) in US and Europe markets
whereas it is inconsistent with the recent findings of Alam and Hossain (2012) in
developed stock markets; and Zameer et al. (2013) in emerging stock markets that
liquidity affecting negatively to dividend payouts. Similarly, the findings of present paper
for size of the enterprise, i.e. total assets affecting negatively to dividend payouts is
consistent with the findings of Abbasi et al. (2014), and is inconsistent with the findings
Determinants of Corporate Dividend Payout in Nepal 69
of Malik et al. (2013); Ranti (2013); Al-Nawaiseh (2013); and Maladjian and El Khoury
(2014) in emerging stock markets of the world. The possible reason for this unusual
negative association of dividend payouts and total assets or size may be pre-emerging
stage problem of Nepalese stock market due to possessing excessive total assets which
eventual lead to decrease profits as well as dividend payouts. Further, the inefficiency
may be emanated from capacity utilisation problem as majority of the enterprises in
Nepal are operating with the low level of capacity utilization due to prolonged political
transition and low level of economic activities in the country.
In lieu of conclusion, profitability, size, and liquidity have a significant impact on the
dividend payouts of overall listed enterprises, profitability and liquidity influencing
positively and size affecting negatively; profitability and total assets influencing dividend
payouts of financial sector; and profitability and lagged dividends influence the dividend
payouts of non-financial sector enterprises in Nepal. The other variables considered in the
study are important from a theoretical perspective have not received practical support in
the pre-emerging stock market of Nepal.
VI. POLICY IMPLICATIONS AND RESEARCH AVENUES
Nepalese corporate managers should give due consideration to profitability, size, and
liquidity when they set dividend payout as they are found to be the most significant
variables influencing dividend payout of the enterprises in the paper. This will help
them to make their dividend payout decision efficient and effective which in the long
run will help them to achieve their profit maximising objective and satisfy employees
and shareholders‟ needs as well as impress the stock market regulator having concern on
protecting investors‟ interest and inevitably enhance enterprise value.
Understanding the determinants of corporate dividend payout has significant implication
on individual investors‟ investment policy depending on his/her dividend preference.
Since, in the absence of efficient stock market, where searching and brokerage costs are
high, especially in large enterprises where information asymmetry increases due to
ownership dispersion, decreasing the shareholders‟ ability to monitor the internal and
external activities of the enterprise, resulting in the inefficient control by management,
paying large dividends can be a solution for such a problem as it controls managers for
investing in low return projects (Sawicki (2005)). Hence, Corporate Tax Authorities and
SEBON should incentivise the listed enterprises paying dividends continuously in
establishing sound corporate governance and credible stock market in the country.
Investors considering whether they should buy, hold or sell shares with the expectation of
dividends might have to look into the net profits, size, and liquidity in overall enterprises
and net profits and total assets in financial sector enterprises, and net profits and lagged
dividends in non-financial sector enterprises as revealed determinants of dividend payout
in this paper.
The overall implication of the study is that dividend payout decision is not a decision
of the board of directors alone. The shareholders should be given recognition in a
policy like this because they are directly affected by the policy. If shareholders
cooperate with the board of directors and other factors considered too, a fair
70 NRB Economic Review
decision concerning dividend payout could be reached which would help in
ensuring the growth and development of the enterprises and ultimately affects the
fortunes of the pre-emerging stock market like that of Nepal in a positive way.
Researcher is aware of the fact that more factors than the ones included in the study have
an impact on the corporate dividend payout in Nepal. Brown et al. (2007) concludes that
top executive holdings of enterprise stock significantly influence an enterprise‟s choice
of payouts. Therefore, an extension of the present study is to examine the determinants of
dividend payout by adding executive holdings variable. One could study asset tangibility
and corporate dividend payouts in Nepal as revealed by Saeed et al. (2014) that an
increase in fixed asset will reduce the dividend payouts in Pakistan. One could also
conduct a comparative study of determinants of dividend payout of enterprises in Nepal,
Bhutan, Maldives, and Bangladesh for interesting insights.
REFERENCES
Abbasi, S., Mohammadi K. and M. Ajam. 2014. “Dividend policy and earnings management: an
empirical study of Tehran listed companies.” International Journal of Current Life Sciences,
Vol.4(4), 1516-1522.
Abor, J. and G. A. Bokpin. 2010. “Investment opportunities, corporate finance, and dividend
payout policy: Evidence from emerging markets.” Studies in Economics and Finance,
Vol.27(3), 180 - 194.
Adhikari, N. 2013. “Capital market development in Nepal.” Reshaping Organisations to Develop
Responsible Global Leadership-Conference Proceedings, Vol.1(1), 321-334.
. 2015. “Determinants of systemic risk for companies listed on Nepal Stock Exchange.”
Global Journal of Management and Business Research: C Finance, Vol 15(5), 75-83.
Ahmed, H. and A. Y. Javid. 2008. “The determinants of dividend policy in Pakistan.”MPRA
Munich Personal RePEc Archive, 1-16.
. 2009. “Dynamics and determinants of dividend policy in Pakistan (Evidence from
Karachi Stock Exchange non-financial listed firms).”International Research Journal of
Finance and Economics, 25, 148-171.
Aivazian, V., Boothm L. and S. Cleary. 2003. “Do emerging market firms follow different
dividend policies from U.S. firms?” Journal of Financial Research, Vol.26, 371-387.
Al-Nawaiseh, M. 2013. “Dividend policy and ownership structure: an applied study on industrial
companies in Amman Stock Exchange.” Journal of Management Research, Vol. 5(2), 83-
106.
Aivazian, V., Booth, L. and S. Cleary. 2003. “Do emerging market firms follow different
dividend policies from U.S. firms?” Journal of Financial Research, Vol.26(3), 371-387.
Alam MD. Z. and M. E. Hossain. 2012. “Dividend policy: A comparative study of UK and
Bangladesh based companies.” IOSR Journal of Business and Management, Vol.1(1), 57-67.
Allen, F. and R. Michaely. 2003. “Payout policy.” North-Holland Handbook of Economics edited
by George Constantinides, Milton Harris, and Rene Stulz; North-Holland.
Al-Shubiri, F. N. 2011. “Determinants of changes dividend behaviour policy: evidence from the
Amman Stock Exchange.” Far East Journal of Psychology and Business, Vol.4(2), 1-15.
Alzomaia, T. SF and A. Al-Khadhiri. 2013. “Determination of dividend policy: the evidence from
Saudi Arabia.” International Journal of Business and Social Science, Vol.4(1), 181-192.
Determinants of Corporate Dividend Payout in Nepal 71
Amidu M. and J. Abor. 2006. “Determinants of dividend payout ratios in Ghana.” Journal of Risk
Finance, Vol. 7, 136-145.
Anil K. and S. Kapoor. 2008. “Determinants of dividend payout ratios- a study of Indian
information technology sector.” International Research Journal of Finance and Economics ,
Vol.15, 1-9.
Ardestani, H. S., Rasid, S. Z. A., Basiruddin, R. and M. Mehri. 2013. “Dividend payout policy,
investment opportunity set and corporate financing in the industrial products sector of
Malaysia.” Journal of Applied Finance and Banking, Vol.3(1), 123-136.
Arif, A. and F. Akbar. 2013. “Determinants of dividend policy: a sectoral analysis from Pakistan.”
International Journal of Business and Behavioural Sciences, Vol. 3(9), 16-33.
Arora, S.P. 1965. “Dividend as a function of distributable income.” Indian Journal of Commerce
18 part 4, no. 65.
Baker, H. K. 1988. “The relationship between industry classification and dividend policy.”
Southern Business Review, Vol.14, 1-8.
Baker, H. K., Farrelly, G. E. and R. B. Edelman. 1985. “A survey of management views on
dividend policy.” Financial Management, Vol.14(3), 78-84.
and G. E. Powell. 2000. “Determinants of corporate dividend policy: A survey of NYSE
firms.” Financial Practice and Education, Vol.10(1), 29-40.
Baskin, J. B. 1988. “The development of corporate financial markets in Britain and the United
States, 1600–1914: Overcoming asymmetric information.” Business History Review, Vol.
62(2), 199-237.
Black, F. 1976. “Investment policy spectrum.” Financial Analyst Journal, Vol.32, 23-31.
Benartzi, S., Michaely, R. and R. Thaler. 1997. “Do changes in dividends signal the future or the
past?” Journal of Finance, Vol.52(3), 1007-1034.
Breuer, W., Rieger, M. O. and K.C. Soypak. 2014. “The behavioural foundations of corporate
dividend policy: a cross-country analysis.” 1-61, Available at: www. yahoo.com
Brittain, J. A. 1964. “The tax structure and corporate dividend policy.” American Economic
Review (Papers and Proceedings), Vol.54(3).
Brown, J. R., Liang, N. and S. Weisbenner. 2007. “Executive financial incentives and payout
policy: Firm responses to the 2003 dividend tax cut.” Journal of Finance, Vol.62(4), 1935-
1965.
Chang, R.P. and S.G. Rhee. 2003. “The impact of personal taxes on corporate dividend
policy and capital structure decisions.” Financial Management, Vol.19(2), 21-31.
Crutchley, C. E. and R. S. Hansen. 1989. “A test of the agency theory of managerial ownership,
corporate leverage, and corporate dividends.” Financial Management, Vol.18(1), 36-46.
Dhameja, N.L. 1972. “Dividend behaviour in Indian paper industry 1950-65: A statistical test.”
Indian Economic Journal, Vol.19(3), 432-442.
. 1978. “Dividend, investment and financial behaviour of firm.” Review of Commerce
Studies, 7.
Dhrymes and Kurz. 1967. “Investment, Dividend, and External Finance Behaviour of Firms, in
Determinants of Investment Behaviour.” Ed, Ferber, R., National Bureau of Economic
Research.
Dobrovolsky, S. 1971. The Economics of Corporation Finance. McGraw-Hill, New York.
Eije, H. V., and W. Megginson, 2006. “Dividend policy in the European Union.” 1-41, Available
at: www. yahoo.com
El Essa, D. M., H.M. M., Altaraireh, D. J. and M. A. Nofal. 2012. “A worthy factors affecting
dividends policy decisions: an empirical study on industrial corporations listed in Amman
Stock Exchange.” Interdisciplinary Journal of Contemporary Research in Business, Vol.4(5),
614-622.
72 NRB Economic Review
Fama, E. F. 1974. “The empirical relationships between the dividend and investment decisions of
firms.” American Economic Review, Vol.64(3), 304-318.
Fama, E. F. and H. Babiak. 1968. “Dividend policy: An empirical analysis.” American Statistical
Association Journal, Vol.63, 1132-1161.
and K. R. French. 2001. “Disappearing dividends: changing firm characteristics or lower
propensity to pay?” Journal of Financial Economics, Vol.60, 3-43.
Farrelly, G. E. and H. K. Baker. 1989. “Corporate dividends: views of institutional investors.”
Akron Business and Economic Review, Vol.20(2), 89-100.
Florence, P. S. 1959. “Size of Enterprise and Other Factors in Dividend Policy.” 122, Part 1, 77-
98.
Gill, A., Biger, N. and R. Tibrewala. 2010. “Determinants of dividend payout ratios: Evidence
from United States.” The Open Business Journal, Vol.3, 8-14.
Grullon G. and R. Michaely. 2002. “Dividends, share repurchases, and the substitution
hypothesis.” Journal of Finance, Vol.57(4), 1649-1684.
Gujarati, D. N. 2003. Basic Econometrics, fourth edition, McGrew-Hill higher education (A
division of the McGrew-Hill companies, Singapore).
Higgins, R. C. 1972. “Dividend policy and increasing discount rates: A clarification.” Journal of
Financial and Quantitative Analysis Vol.7, 1757-1762.
Ho, H. 2003. “Dividend policies in Australia and Japan.” IAER Vol.9(2), 91-100.
Holder, E. M., Langrehr, F. W. and J. L. Hexter. 1998. “Dividend policy determinants: An
investigation of the influences of stockholder theory.” Financial Management, Vol.27(3), 73-
82.
Kanwal, A and S. Kapoor. 2008. “Determinants of dividend payout ratios-A study of Indian
information technology sector.” International Research Journal of Finance and Economics,
15, 63-71.
Khurana, P.K. 1985. “Corporate dividend policy in India.” Panchheel Publishers, New Delhi.
Kowalewski, O., Stetsyuk, I. and O. Talawera. 2007. “Corporate governance and dividend policy
in Poland.” Paper, Warsaw School of Economics, World Economy Research Institute, 1-35.
Krishnamurty, K. and D.U. Sastry. 1973. “Dividends, External Finance and Investment: An
Analysis of the Corporate Sector in India.” Institute of Economic Growth, Mimeo.
. 1973. “Dividends, External Finance and Investment: An Analysis of the Corporate
Sector in India.” Institute of Economic Growth, Mimeo.
Kuh, E. 1965. “Income distribution over the business cycle.” in Brookings Quarterly Econometric
Model of the United States: Eds. Duesenberry, J.S. Fromm, S., Klein, L.R. and Kuh, E.: Rand
McNally co.
Kumar, J. 2006. “Corporate governance and dividends payout in India.” Journal of Emerging
Market Finance, Vol.5(1), 15-58.
Kumar, B R. and K. A. Waheed. 2015. “Determinants of dividend policy: Evidence from GCC
market.” Accounting and Finance Research,Vol.4(1), 17-29.
Kuo, J.M., Dennis, P. and Z. Qingjing. 2013. “What drives the disappearing dividends
phenomena?” Journal of Banking and Finance, Vol.37(9), 3499-3514.
Lee, S. W. 2009. “Determinants of dividend policy in Korean banking industry.” Banks and Bank
Systems, Vol. 4(1), 67-71.
Lintner, J. V. 1956. “Distribution of incomes of corporations among dividends, retained earnings,
and taxes.” American Economic Review,Vol.46(2), 97-133.
Mahapatra, R.P. and P.K. Sahu. 1993. “A note on determinants of corporate dividend behaviour in
India- An econometric analysis.” Decision, Vol.20(1), 1-22.
Determinants of Corporate Dividend Payout in Nepal 73
Maladjian, C. and R. E. Khoury. 2014. “Determinants of the dividend policy: an empirical study
on the Lebanese listed banks.” International Journal of Economics and Finance, Vol. 6(4),
240-256.
Malik, F., Sajid G., Khan, M.T., Rehman, S.U. and M. Khan. 2013. “Factors influencing corporate
dividend payout decisions of financial and non-financial firms.” Research Journal of Finance
and Accounting, Vol.4(1), 35-47.
Manos, R., Murinde, V. and C. J. Green. 2001. “Business groups and dividend policy: Evidence on
Indian firms.” Working paper series, Institute for Development Policy and Management,
University of Manchester, Paper no.33, 1-51.
Mehta, A. 2012. “An empirical analysis of determinants of dividend policy-evidence from the
UAE companies.” Global Review of Accounting and Finance Vol. 3(1), 18-31.
Michael, A. 1979. “Industry influence on dividend policy.” Financial Management Vol.8 (3), 22-
26.
NRB. 2003. Banking and Financial Statistics, 41, Nepal Rastra Bank.
. 2014. Banking and Financial Statistics, 60, Nepal Rastra Bank.
Nigam, R. K., and N.D. Joshi. 1962. “Rational of dividend policy-A critical study of dividend
criteria with reference to public enterprises in India.” The Indian Journal of Commerce,
Vol.15 part I (52), 1-24.
Pogue, T. F. 1971. “A cross section study of the relationship between dividend and investment.”
Yale Economic Essays, Vol.11(1&2).
Pruitt, S. W. and L. J. Gitman. 1991. “The interactions between the investment, financing, and
dividend decisions of major U.S. enterprises.” Financial Review,Vol.26(3),409-430.
Rafique, M. 2012. “Factors affecting dividend payout: evidence from listed non-financial firms of
Karachi Stock Exchange.” Business Management Dynamics, Vol.1 (11), 76-92.
Ramli, N. M. 2010. “Ownership structure and dividend policy: evidence from Malaysian
companies.” International Review of Business Research Papers, Vol. 6(1), 170-180.
Ranti, U. O. 2013. “Determinants of dividend policy: a study of selected listed firms in Nigeria.”
Manager, Change and Leadership, 17, 107-119.
Rao, G.N. and Y.S.R. Sarma. 1971. “Dividends and retained earnings of public and pvt. ltd.
enterprises in India: 1955-56 to 1965-66: An econometric analysis.” RBI Bulletin, Vol. 25(6).
Rehman, A. and H. Takumi. 2012. “Determinants of dividend payout ratio: evidence from Karachi
Stock Exchange (KSE).” Journal of Contemporary Issues in Business Research, Vol.1 (1),
20-27.
Rozeff, M. S. 1982. “Growth, beta and agency costs as determinants of dividend payout ratios.”
Journal of Financial Research, Vol.5 (3), 249-259.
Saeed, R., Riaz, A. , Lodhi, R. N., Munir, H. M. and A. Iqbal. 2014.“Determinants of dividend
payments in financial sector of Pakistan.” Journal of Basic and Applied Scientific Research,
Vol.4(2), 33-42.
Securities Board of Nepal. 1998-2014. Annual Reports. mid-July 1998-mid-July 2014, Jawalakhel,
Lalitpur.
Swamy and Rao. 1975. “The flow of funds in Indian manufacturing sector.” Sankhya, Vol.37,
Series C, Part 4, 185-220.
Sawicki, J. 2005. “An investigation into the dividend of firms in East Asia.” Working Paper,
Nanyang Technological University, Singapore
Trang, N. T. X. 2012. “Determinants of dividend policy: the case of Vietnam.” International
Journal of Business, Economics and Law, Vol.1, 48-57.
Zameer, H., Rasool, S., Iqbal, S. and U. Arshad. 2013. “Determinants of dividend policy: a case of
banking sector in Pakistan.” Middle-East Journal of Scientific Research, Vol.18 (3), 410-424.
74 NRB Economic Review
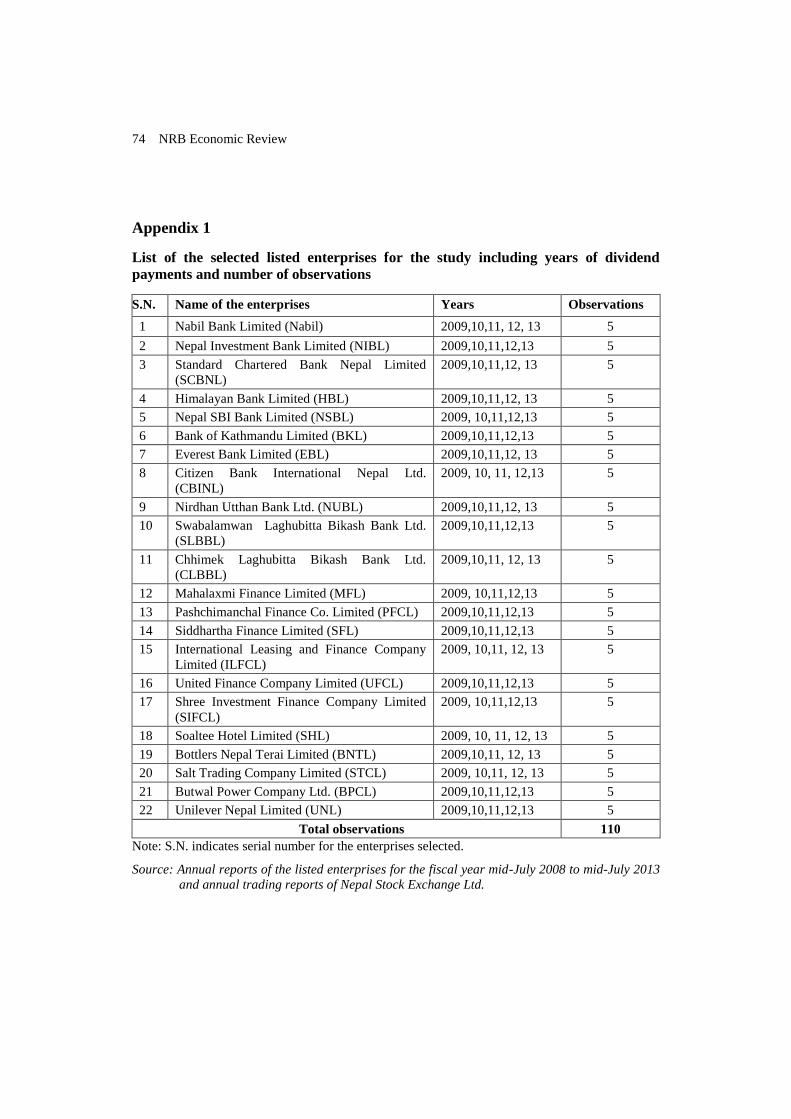
Appendix 1
List of the selected listed enterprises for the study including years of dividend
payments and number of observations
S.N. Name of the enterprises Years Observations
1 Nabil Bank Limited (Nabil) 2009,10,11, 12, 13 5
2 Nepal Investment Bank Limited (NIBL) 2009,10,11,12,13 5
3 Standard Chartered Bank Nepal Limited
(SCBNL)
2009,10,11,12, 13 5
4 Himalayan Bank Limited (HBL) 2009,10,11,12, 13 5
5 Nepal SBI Bank Limited (NSBL) 2009, 10,11,12,13 5
6 Bank of Kathmandu Limited (BKL) 2009,10,11,12,13 5
7 Everest Bank Limited (EBL) 2009,10,11,12, 13 5
8 Citizen Bank International Nepal Ltd.
(CBINL)
2009, 10, 11, 12,13 5
9 Nirdhan Utthan Bank Ltd. (NUBL) 2009,10,11,12, 13 5
10 Swabalamwan Laghubitta Bikash Bank Ltd.
(SLBBL)
2009,10,11,12,13 5
11 Chhimek Laghubitta Bikash Bank Ltd.
(CLBBL)
2009,10,11, 12, 13 5
12 Mahalaxmi Finance Limited (MFL) 2009, 10,11,12,13 5
13 Pashchimanchal Finance Co. Limited (PFCL) 2009,10,11,12,13 5
14 Siddhartha Finance Limited (SFL) 2009,10,11,12,13 5
15 International Leasing and Finance Company
Limited (ILFCL)
2009, 10,11, 12, 13 5
16 United Finance Company Limited (UFCL) 2009,10,11,12,13 5
17 Shree Investment Finance Company Limited
(SIFCL)
2009, 10,11,12,13 5
18 Soaltee Hotel Limited (SHL) 2009, 10, 11, 12, 13 5
19 Bottlers Nepal Terai Limited (BNTL) 2009,10,11, 12, 13 5
20 Salt Trading Company Limited (STCL) 2009, 10,11, 12, 13 5
21 Butwal Power Company Ltd. (BPCL) 2009,10,11,12,13 5
22 Unilever Nepal Limited (UNL) 2009,10,11,12,13 5
Total observations 110
Note: S.N. indicates serial number for the enterprises selected.
Source: Annual reports of the listed enterprises for the fiscal year mid-July 2008 to mid-July 2013
and annual trading reports of Nepal Stock Exchange Ltd.