destined for democracy? labour markets and political ... · destined for democracy? labour markets...
TRANSCRIPT

Destined for democracy? Labour marketsand political change in colonial British
America∗
Elena Nikolova (EBRD)
Abstract
This paper proposes a new explanation for the emergence of democraticinstitutions: elites may extend the right to vote to the masses in order toattract migrant workers. I argue that representative assemblies serve as acommitment device for any promises made to labourers by those in power,and test the argument on a new political and economic data set from thethirteen British American colonies. The results suggest that colonies thatrelied on white migrant labour, rather than slaves, had better representativeinstitutions. These findings are not driven by alternative factors identified inthe literature, such as inequality or initial conditions, and survive a battery ofvalidity checks.
What explains the emergence and persistence of democratic institutions? Re-
cent research shows that there may be multiple answers to this question. Scholars
have linked the probability of democratic transition and consolidation to economic
development (Lipset, 1959; Boix, 2011); historical path dependence and revolution
(Acemoglu and Robinson, 2006; Acemoglu et al., 2012; Przeworski, 2009); social
learning (Gleditsch and Ward, 2006); and financial openness (Freeman and Quinn,
2012). Some have argued that societies with a highly unequal income distribution
- which in turn may be driven by differences in initial factor endowments - are less
likely to be democratic, as the rich may prefer an authoritarian regime due to re-
distribution pressures from a low-income median voter (Boix, 2003; Engerman and
Sokoloff, 2000, 2002, 2005). Democratic institutions will thus emerge and be sus-
tained in instances of relatively low inequality, as the redistribution from rich to poor
is minimal.
∗The current word count is 12,065.
1

This paper studies one particular political institution, voting rights, to propose an
altogether different reason behind political liberalisation: elites may use the franchise
as a tool to attract migrant labour. Focusing on the political evolution of the thirteen
British American colonies from the early seventeenth century until the American
Revolution, I show that those colonies which relied on white immigrant workers,
rather than slaves, had a more liberal franchise. For example, the Northern colonies
had both a more liberal suffrage and a higher proportion of white settlers, while,
in the eighteenth century, the Southern colonies combined a restrictive franchise
with a large slave population.1 These institutional differences are hardly surprising
and have been documented by others. In the North, the staple crop (wheat) could
be efficiently grown on small family farms, which may have contributed to a more
egalitarian income distribution, and therefore better political institutions (Engerman
and Sokoloff, 2000, 2002, 2005). Alternatively, it is possible that the temperate
Northern climate appealed to entire white migrant families, which may have sought
to replicate British political institutions, emphasising private property and controls
on government power (Acemoglu et al., 2001).
Although such theories are important, they come short of explaining a different
puzzle which emerges from the data analysed in this paper. This puzzle lies in the
observation that, despite the hot and disease-ridden climate which was suitable for
growing labour intensive cash crops (such as tobacco and rice), the Southern colonies
actually had a more inclusive suffrage than the North throughout the seventeenth
century. During this period, African slaves were largely unavailable, so Southern
landowners recruited European labour through the system of indentured servitude,
under which migrants “tied” themselves to a colonial landowner for several years
1The South includes Maryland, Virginia, South Carolina and North Carolina, while the North
includes Massachusetts, Rhode Island, Connecticut, New Hampshire, New York, New Jersey, Penn-
sylvania and Delaware.
2
in exchange for a loan covering transportation costs from Europe. I argue that
Southern elites initially allowed nearly all adult males to vote in order to attract
immigrant workers. A liberal suffrage was highly desirable for such migrants, since
assemblies in which they were adequately represented guaranteed fair enforcement
of indenture contracts. As in the North, representative institutions also prevented
the expropriation of land titles and private property of landowners and newly freed
servants.2
However, the arrival of slavery in the Southern colonies in the late seventeenth
and early eighteenth centuries prompted planters to substitute white labourers with
cheaper and easily available slaves. Political concessions to white workers were no
longer warranted, so Southern elites immediately tightened the suffrage. In contrast,
the Northern franchise remained liberal and largely unchanged throughout the colo-
nial period. Black labourers were only of marginal importance, as agricultural work
was done on small family farms without the need for much additional labour.
To test the hypothesis about labour market structure as a determinant of the
colonial suffrage, I assemble an original data set covering the thirteen British Ameri-
can colonies from the early seventeenth century to the American Revolution. In order
to capture the quality of political institutions, I create an index that aggregates, for
each colony-year observation, the presence of various restrictions on the franchise,
such as those related to income, land ownership or religion. I measure labour market
composition by tracing the spread of slavery via data on each colony’s share of the
black population. I use the percentage of a colony’s white landless population to
estimate inequality, where higher percentage landless implies higher inequality. In
addition, I control for a rich set of additional variables, ranging from urbanisation
2For more on how political institutions can serve as a commitment device for self-interested
elites, see Acemoglu and Robinson (2006); Olson (2000); Congleton (2010), and North and Weingast
(1989).
3
and population density to colonial settlement patterns.
I use four complementary approaches to show that in the thirteen British Amer-
ican colonies, differences in labour markets had a causal impact on the quality of
political institutions. First, I construct a new instrument for the extensiveness of
slavery based on each colony’s propensity to produce one of the two labour-intensive
crops (tobacco and rice), interacted with the prices of these crops. The idea behind
this instrument is that once the prices for labour-intensive crops increase, landowners
will seek to acquire additional labour, turning to slaves if white labourers are not
sufficient or are too expensive. I also use the prices of slaves in the Caribbean - the
largest slave market throughout the colonial period which set prices for the rest of
the New World - as an alternative proxy for the prevalence of black workers in the
Southern colonies. Third, I control for time-invariant colony characteristics, such as
geographical or climate differences, which may affect both labour markets and the
suffrage by including colony fixed effects. Finally, in the online Appendix I supple-
ment the econometric results with a detailed historical discussion of the link between
labour markets and the franchise in the colonies, which also includes (fragmentary)
migration data.
This paper offers several contributions to the literature. By linking the com-
position of human capital and representative institutions, I not only enrich the
inequality-democracy theories developed in previous work, but also suggest a mech-
anism through which slavery could affect economic and political outcomes over the
long term (Acemoglu et al., 2012).3 Moreover, I break away from the cross-country
regression approach on which other similar studies rely and which has been criticised
due to problems of data inconsistency, unit heterogeneity and endogeneity (Pande
and Udry, 2005; Atkinson and Brandolini, 2001). The main advantage of my re-
3For recent work challenging the link between inequality and democracy, see Ansell and Samuels
(2010); Haggard and Kaufman (2012) and Houle (2009).
4

search design stems from my ability to trace the political and economic development
of the thirteen colonies from their very settlement until 150 years later. In addition,
I observe substantial variation in colonial political institutions, as from the very be-
ginning, each colony was given complete freedom to shape - as well as alter - its
representative institutions without any interference from England.
The idea that political institutions, by serving as a commitment device, can
credibly constrain the power of elites has been developed in several earlier studies,
including Congleton (2011) for the case of the North American colonies and states, as
well as Fleck and Hanssen (2006) and Fleck and Hanssen (2009) for ancient Greece.4
My findings also resonate with those of a small but growing literature which demon-
strates that one reason why US states with smaller female population enfranchised
women earlier was to attract them as settlers (Braun and Kvasnicka, 2013; Kenny,
1999, 2004). A separate strand of research has also linked the quality of institutions
to migration. Bertocchi and Strozzi (2008) and Engerman and Sokoloff (2005) argue
that electoral institutions mattered for attracting European migrants to the New
World in the 19th century. Fleck and Hanssen (2013) find a correlation between
government quality and the opportunities for population exit in cross-country data.
This paper enhances such work in at least three important ways. First, my
theory applies the institutional commitment mechanism to a new problem: how to
prevent self-interested elites from reneging on migration inducements once costly
migration has taken place. Second, unlike previous work, my argument considers
the joint impact of labour market structure and income inequality on representative
institutions. Third, a major strength of the paper lies in the use of a unique data
set and research setup which makes identification concerns in the empirical analysis
less pressing, something which is generally difficult to achieve with similar historical
4In Congleton’s model, rather than being the driving factor, labour scarcity catalyses institu-
tional reforms which occur through a process of constitutional bargaining.
5

data.
The remainder of the paper is organised as follows. The next section outlines the
theoretical argument, while section 3 discusses the data. Sections 4 and 5 present the
empirical set up and the results, respectively. Section 6 focuses on validity threats,
and the last section concludes.
Theoretical argument
Colonial labour market patterns
The primary goal of American settlement was to remedy the twin problems of scarcity
of land and abundance of labour facing England in the 17th century. While some
colonies were governed directly by the Crown, it was more common for either one
or several wealthy Englishmen to gain ownership of a colony, which gave them sub-
stantial control over political and economic affairs. Migrant labour was essential for
growing high-profit crops such as tobacco, rice and wheat, which were then exported
to Europe (Purvis, 1999). As a result, the successful development of each colony -
and the wealth of its proprietors - depended on attracting English migrants.5
Despite the importance of immigration, attracting settlers to the colonies was
not easy. Even the poorest labourers had alternatives to moving overseas, such
as going to a different part of the countryside, to London or to Ireland (Kulikoff,
2000, p. 44; 53). Moreover, the journey across the Atlantic was long, dangerous
and expensive, with its price exceeding half a year’s income for a typical English
immigrant (Rosenbloom, 2008). What is more, information about the difficulties of
colonial life traveled relatively easily from the colonies to the mainland, as highly
5The majority of English settlers went to the colonies because of the availability of economic
opportunities. However, some migrants (such as the Quakers who established Pennsylvania) left
England because of religious persecution.
6

literate colonists wrote often, and even the illiterate could hire someone to write for
them (Kulikoff, 2000, p. 47-48).
Colonial elites adopted different strategies for populating the colonies. In the
North, the temperate climate encouraged a steady inflow of migrant families. Settlers
were given small plots of land, which they used to cultivate wheat without the need
for additional labour. In contrast, the hot and disease-ridden climate of the South,
along with an agriculture centered around the production of labour-intensive crops
(such as tobacco and rice), made attracting migrants difficult.
While some slaves found their way to the colonies in the seventeenth century,
through the hands of Dutch privateers or large planters who migrated from the West
Indies, the supply of black labour was generally limited by the high demand for
slaves in the Caribbean, as well as by the tight regulation of the slave trade by the
English government. Southern elites therefore recruited European labour mainly
through the system of indentured servitude, under which migrants “tied” them-
selves to a landowner for several years in exchange for a loan covering transportation
costs. Master-servant relations were regulated through contracts, which stipulated
the length and conditions of the indenture, wages and any dues, such as land, payable
once the servant was free. Given that the end-of-contract payments were substantial
- sometimes comprising up to 66% of a contract’s price, servants were often able to
set up their own farms once their indentures were over (Grubb, 2000; Wertenbaker,
1922). As a result, the supply of free white labour in the South was largely inelastic,
except at very high wage levels. Recruiting workers from other colonies was also
costly not only because planter settlements were separated by thick forests, but also
because Southern roads, which were built to accommodate the transportation of ex-
port crops from plantations to the coast, were of very low quality (Kulikoff, 1986, p.
209-210).
Although the indenture system worked well for most of the seventeenth century,
7
the supply of English servants plummeted toward the end of the period as economic
conditions in the mother country improved. At the same time, the availability of
African slaves rapidly increased at the beginning of the eighteenth century, driven
by the rising English share in the slave trade and the low profitability of West Indies
sugar production (Gray and Thompson, 1933, p. 352-354). While slavery had a
limited impact on Northern labour markets, as family farms continued to dominate
production, in the South it prompted the relatively quick substitution of indentured
servants with slaves. As Table A2 shows, in the early eighteenth century, blacks
comprised nearly two thirds of the population of South Carolina, and nearly one third
of that in Virginia. Even though Southern planters initially preferred white workers,
by 1710 they had learned that slaves were just as productive, and “sought them
avidly every time a slave ship arrived” (Kulikoff, 1986, p. 41). In fact, landowners
used slaves not only for agricultural tasks, but also trained blacks for more highly
skilled occupations, such as builders and craftsmen.6
The link between labour markets and the suffrage
This subsection argues that one factor which explains why some colonies opted for
a liberal franchise was the degree to which their labour markets depended on white
migrant workers. When white workers were difficult to obtain - as in the South prior
6In all colonies, some sort of Indian slavery or servitude existed throughout the colonial period.
However, Indian labourers never became as popular as blacks (or as indentured servants) for several
reasons. First, four colonies, (Virginia, South Carolina, Rhode Island, and New York), declared
Indian enslavement illegal. Second, Indians were highly prone to disease, making them less suited
for rice and tobacco production than blacks. Other reasons included the decline of Indian tribes
driven by disease and fighting with the whites; the migration of Indian populations westward; as
well as the better knowledge of the surrounding areas which made escape easier for Indians than
for blacks. Moreover, Indians were perceived to have “irregular work habits,” as well as to be more
likely to engage in savage acts if provoked (Ward, 1991, p. 122-123).
8

to the arrival of slavery - colonial governments granted the franchise to virtually
all males, in order to attract settlers.7 In those colonies where white labour was
easier to attract - such as in the Northern colonies - additional suffrage regulations,
such as the requirement of owning land or property, were introduced. The most
restrictive regimes, which required voters to satisfy a combination of requirements,
including landholding, property, taxpaying and residency, were adopted in the South
once slaves replaced white indentured servants in the late seventeenth and early
eighteenth centuries.
Why was a liberal suffrage important for Englishish migrants? Although all
colonies were under English rule, representative assemblies, established soon after
settlement, enjoyed significant prerogatives including complete control over law mak-
ing and colonial finances. Therefore, political institutions in which labourers were
adequately represented ensured that rules, regulations and policies that were rele-
vant for them could not be easily changed by those in power. In particular, building
on seminal work by Acemoglu and Robinson (2006), Congleton (2010) and North
and Weingast (1989), I argue that representative assemblies served as a commitment
device for any promises made to migrants by ruling elites.
In the North, wheat growing took place on small family farms, so an inclusive
suffrage guaranteed not only that new settlers obtained the amount of land promised
to them by proprietors before arrival, but also that their land, property or profits
could not be taken away once they had settled. In the South, the protection of
property rights was relevant for those few settlers that had set up their own farms.
More importantly, representative institutions had an additional purpose, namely to
aide the enforcement of labour contracts on which the indenture system was based. In
order to undertake the long and arduous trip across the Atlantic, potential servants
7Most American states did not allow women to vote until the Nineteenth Amendment which
came into force in 1920.
9

needed a guarantee that landowners will not alter contract terms or expropriate their
wages once they arrived in the colonies, or once their contracts were over. Since
masters often refused to comply with the terms agreed in the contract, colonial
assemblies played an active role in devising laws regulating servant-master relations
(Weinberg, 2003).
Of course, political institutions are only one of the ways to credibly constrain
the power of elites. The rule of law - such as an impartial and independent court
system - can be used to both effectively resolve contracting disputes, and to force
governments to respect private property (Congleton, 2010). The development of
colonial courts, however, tended to lag behind that of political institutions (Surrency,
1967). While courts existed in some colonies, judges were seldom impartial as they
were appointed by large proprietors. Court independence was also a problem, as
judges and assemblymen often ruled on disputes in which they themselves were
involved (Morgan, 1975).
The role of inequality
Building on the idea that representative assemblies force elites to credibly commit to
promises made to migrant workers, the previous subsection has developed an argu-
ment linking the composition of labour markets and the extensiveness of the colonial
franchise. At the same time, the presented theory also enriches existing inequality-
democracy models. According to Boix (2003), elites are more likely to implement
an autocratic system when inequality increases, due to redistribution threats from
a low-income median voter. In contrast, Acemoglu and Robinson (2006) argue that
the inequality-democracy relationship follows an inverted U-shape. In their story,
the negative effect of inequality on democracy working through redistribution is mit-
igated by the higher likelihood of democratic revolution when inequality is high.
Since democratisation occurs as a commitment to future redistribution, the stronger
10

the threat of revolution, the more likely elites will be to cede democracy.
While I examine the independent role of revolutionary threats in the penultimate
section of the paper, it is possible that inequality, through its effect on redistribution,
exerts an effect on the franchise that is independent from that of labour markets.
A first question to ask is to what extent redistributive transfers mattered in the
thirteen colonies. Although an advanced system of taxation and redistribution did
not emerge until after the American Revolution, several percentage points of the
average colonist’s income went to taxes (Rabushka, 2002).8 Colonial governments
used these proceeds to finance in-kind redistribution, rather than pure monetary
transfers, such as poor relief, as well as the building of roads, bridges, and schools
(Rabushka, 2002; Einhorn, 2008; Fishback, 2006).
The extent to which labour market structure affects the relationship between
inequality and the suffrage depends on the trade-off between the redistributive costs
of a particular franchise regime and its benefits of securing migrant labour. On one
hand, liberal representative institutions under high inequality are particularly costly
for elites due to the losses associated with relinquishing assembly control to the poor,
such as higher levels of redistribution. On the other hand, an inclusive suffrage may
also attract white workers, and thus increase elite incomes when labour is difficult to
obtain. Although redistribution in the thirteen colonies was non-negligible, labour
market issues were of even greater importance, as the survival and progress of each
colony depended on attracting a sufficient number of workers. I therefore expect that
even though inequality may still have a negative effect on the extensiveness of the
franchise, labour markets will be the primary determinant of political institutions.
One concern about this theoretical model is the potential relationship between
labour markets and inequality. For instance, the spread of slavery in the South in the
8In fact, several colonies, among which Massachusetts and South Carolina, had well-developed
tax systems.
11

early eighteenth century not only decreased the importance of white workers, but also
may have led to the establishment of large plantations. This could have exacerbated
the income differences between large landowners and the rest of the population,
leading to a deterioration in the suffrage in the Southern colonies. However, the
historical evidence shows that such a scenario is not entirely convincing, as slavery
did not lead to a dramatic shift in the Southern income distribution (Main, 1965). I
investigate this concern in more detail in the penultimate section of the paper.
Testable predictions
The preceding discussion suggests that differences in labour market organisation
across colonies, driven by the varying importance of white workers, may have had
a direct effect on the extensiveness of the suffrage. Colonies that needed to attract
white labourers opted for more democratic institutions, which served as a commit-
ment device for promises made to migrants. However, the previous subsection has
also shown the labour-franchise link is moderated by income inequality, as attracting
poor labourers by extending the suffrage also imposes redistribution costs which are
particularly high when incomes are unequally distributed.
This framework suggests two empirically testable hypotheses:
Hypothesis 1. Liberal representative institution will be observed in those colonies
in which white labourers are important. The substitution of white workers with slaves
will lead to a contraction of the franchise.
Hypothesis 2. Higher inequality will have a negative effect on the colonial
franchise. The impact of inequality will be lower than that of labour market structure.
12
Data
A new data set on representative institutions
This subsection discusses the data used in the regressions to follow. More detailed
information on the data is available in the online Appendix (Part 3).
Suffrage To examine trends in colonial political institutions, I compile a new data
set which codes, for each colony and annually from the first year of its establishment,
all the different restrictions that governments placed on the suffrage. I draw on the
extensive study of the suffrage in the thirteen colonies by McKinley (1905), which
I cross-checked against other more recent work, such as Rusk (2001) and Dinkin
(1977). Even though the general reliability of the McKinley study was also confirmed
by Stanley Engerman, it is very likely that the data set measures representative
institutions with error. This should be partly mitigated by the fact that historians
agree that the suffrage restrictions on the books were binding, suggesting that the
franchise rules that I code should be highly correlated with those that were actually
enforced (Dinkin 1977, 47-48; Rusk 2001).
I create a suffrage index to use as dependent variable in the regression analysis
below as follows. First, I extract a list of all the franchise regulations in force in any
particular colony from 1619 to 1775, such as those related to income, property or
religion (the complete is available in the online Appendix, Part 3). For each colony-
year observation and suffrage restriction, I create a variable that takes a value of 1
if voters needed to satisfy this particular regulation, and 0 otherwise. I do not focus
on requirements for voting in local elections, as these differed very little from those
for colony elections.
Suffrage restrictions were almost always introduced or removed in combination
with others, so I aggregate these data into a suffrage index, and do not focus on
13

restriction-by-restriction analysis instead. In order to do so, I need to account for
the fact that colonies which allowed voters to satisfy a choice of two or more voting
requirements likely had a more liberal franchise than those who imposed one of
those restrictions. For example, while from 1698 onward, North Carolina required
all voters to be freeholders, during the same period Maryland allowed electors who
did not possess land to vote if they owned property worth at least 40 pounds. I
therefore give the freeholding restriction in North Carolina a weight of 1, while in
Maryland the restrictions for (1) freeholding, and (2) income or property, each carry
a weight of one quarter, respectively. As I assume that having a choice of two
voting criteria is only half as restrictive as needing to satisfy one of those criteria,
the sum of the two Maryland restrictions is thus one half. A similar approach is
adopted when one suffrage requirement can be substituted with two or three others,
yielding sums of one third and one fourth, respectively. I add up all the different
restrictions coded in this way and subtract from this sum the maximum number of
suffrage restrictions observed in the sample (6.5) to obtain the final suffrage variable
used in the regressions. I give periods without elections - for instance, when the
representative assembly is appointed by the governor - a suffrage value of 0. As a
result, a higher value of the suffrage index implies better political institutions.
To illustrate how my coding works, consider the case of South Carolina. From
1669 until 1691, the South Carolina suffrage index takes a value of 5.5, as the colony
allowed all freemen to vote (obtained by subtracting a coding for the existence of a
single restriction from the maximum number of restrictions in the sample (6.5)). In
1692, electors instead had to possess income or property worth ten pounds, and to
take an oath, so I code the existence of restrictions for income or property, minimum
income or property, and oath taking, yielding a suffrage index of 3.5 (obtained by
subtracting 3 from 6.5). In 1697, an additional requirement for three-month residence
in the colony prior to election was introduced, which decreases the suffrage index
14

to 2.5 (obtained by subtracting 4 from 6.5). In 1704, all previous requirements
were kept, but voters were given a choice to satisfy either the ten-pound income or
property requirement, or the possession of land of fifty acres. I give a weight of one
quarter for both of the latter requirements, which means that the suffrage index now
takes a value of 4 (obtained by subtracting 2.5 from 6.5).
Of course, it must be acknowledged that this weighting scheme is crude. An
accurate assessment of the relative importance of each restriction entails comparing,
for each colony, the proportion of the population that was eligible to vote under
each criterion (Przeworski, 2009). In the absence of such evidence, I adopt three
approaches to test the reliability of my coding. First, I experiment with several
alternative operationalisations of the suffrage index, including (1) assigning equal
weights to all component restrictions (which means that I do not account for any
possible substitutions among restrictions); (2) assigning weights of 1/2 and 1/3 (in-
stead of 1/4 and 1/9) to restrictions that can be substituted with one other or two
other restrictions, respectively; and (3) using principal component analysis, which
creates data-dependent weights.9 The correlations with these new indices are quite
high (above 0.8), and the empirical results are very similar. Second, the effect of
labour markets on the suffrage also survives when I instead replace my original suf-
frage index with a binary variable (which takes a value of 1 if any of the following
restrictions are in place: income, freeholding, the existence of minimum freeholding
or property, tax, residency or religion; and 0 otherwise). All of these results are
available in Table A4.
Third, I assemble some fragmentary data on suffrage extensiveness in the colonies
(covering mostly the 18th century) and investigate its correlation with the suffrage
index. Figures A2 and A3 show that the relationship is positive, as expected, and
9I perform orthogonal varimax rotation, and only keep the factor with the biggest eigenvalue,
which explains 0.26 of the variance.
15
ranges from 0.237 if racial restrictions are accounted for to 0.356 if they are excluded.
The correlation is also positive for the period 1775-1860 and takes a value of 0.4.10
I therefore conclude that while not perfect, the constructed suffrage index should
be an informative measure of the quality of representative institutions in colonial
British America.
Labour markets I hypothesised that more liberal political institutions will be
observed in those colonies that depend on white labourers, implying that colonies
that find it harder to attract white labour should have more democratic regimes. To
empirically evaluate this argument, one would ideally compile, for each colony and
over time, data on the importance of indentured servants, free white labour, family
labour, and slaves, as well as estimates of the demand for and supply of each labour
group.
Since such detailed information is unavailable, I make use of data on the percent-
age of each colony’s black population from Historical Statistics of the United States,
Millennial Edition Online (2006). While this is a simple proxy based on fairly reli-
able data, it is an imperfect measure of the whites and blacks actually in the labour
force.11 Moreover, this measure does not capture differences in white labour scarcity
across colonies. To account for the latter, I control for each colony’s density of the
white population. I also collect colony-level data on life expectancy and the sex
10This is based on data from Keyssar (2000) to extend the suffrage index, and Rusk (2001) for
data on suffrage extensiveness. Unfortunately, the Rusk extensiveness data only cover franchise
laws related to citizenship, race, age and sex, and excludes important laws related to economic
qualifications or residency.
11I also collected information on slave arrivals from the Trans-Atlantic Slave Trade Database
(www.slavevoyages.org). However, these data are less precise than the share of the black population,
as slave ships did not land in those Southern colonies with coastlines that were difficult to navigate,
such as Maryland.
16

ratio of men over women, but I do not have enough observations to include these
variables in the regressions, so I present simple correlations with the franchise index
in Figures A4 and A5.12 While population density is generally insignificant in the
regressions - possibly because it proxies for other variables, such as differences in
economic development, colonies with more men and a lower life expectancy had a
more liberal suffrage, which is consistent with my theory.
I supplement this measure with two additional labour market proxies. First, to
capture the arrival of slavery in the South in the late seventeenth and early eighteenth
century, I create a binary variable that is 1 for the South after 1700, and 0 for all
other colonies and years. The idea is that such an indicator, albeit crude, would
appropriately account for all three events which increased the supply of slaves in the
South around 1700: the rising English share in the slave trade; the low profitability of
West Indies sugar production; and the decrease in the supply of English indentured
servants. Second, I also collect data from Eltis et al. (2005) on the prices of slaves in
the Caribbean to construct an alternative proxy for the prevalence of black workers in
the Southern colonies. Since the Caribbean was the largest slave market throughout
the colonial period which set prices for the rest of the New World, high Caribbean
slave prices should decrease the demand for - and the number of - new slaves in the
South.
Income inequality According to the presented theory, income inequality, through
its effect on redistribution, may be an important factor in determining the quality of
colonial political institutions. Unfortunately, income distribution data for colonial
America is unavailable, so I instead utilise the percentage of a colony’s white landless
population building on data from several secondary sources described in the online
12Scholars agree that colonies which found it difficult to attract white migrants had a high
proportion of men, which made it difficult to produce a steady labour supply or to attract whole
families (Purvis 1999).
17

Appendix. The argument is that as percentage landless increases, so does income
inequality.
While this inequality proxy is clearly less precise than a more direct measure, such
as a Gini coefficient, there are several reasons why it should capture at least some of
the variation in the colonial income distribution. First, an extensive literature has
documented a positive correlation between the unequal distribution of land and an
unbalanced distribution of income (Vanhanen, 2002; Boix, 2003; Ramcharan, 2010).13
This was particularly true for colonial America, where land - through its use for the
production of export crops - was the major source of income and wealth, both in
the North and the South. Moreover, historians agree that the main class divide in
the colonies was between the few large landowners (colonial proprietors and their
friends) and landless labourers (indentured servants in the South, or poor whites
in the North) (Risch 1937, Jordan 2002). The wealth of colonial elites, amassed
from the very beginning through land grants and tax breaks granted by the Crown,
changed little over time. In addition, the share of the largest land-owning class
(middle farmers owning between 100 and 500 acers) stayed relatively constant: for
instance, in South Carolina, 60 percent of landowners held between 100 and 500 acres
(Cooper, 2000, p.6-7). As a result, taking into account those marginal farmers that
shift from landlessness to owning land (and vice versa) should track closely changes
in the overall income distribution.
Indeed, the share of the white landless population correlates well with other (less
extensive) measures of colonial economic inequality, such as the share of taxable
wealth of the top 10% of the population paying the largest wealth tax (the correlation
13In fact, a well-accepted inequality measure in this literature - the area of family farms as a
percentage of the total area of landholdings - is quite similar to the share of the white landless
population used here.
18

is 0.389).14 To dig deeper into the relationship between the white landless share and
inequality, I look beyond the colonial period and exploit land distribution data for
the American states covering the period 1860-1920, the earliest period for which
such data are available. While there is no information on the percentage of the
population with no landholdings, there is data on the number of farms under 10
acres, which should approximate, at least to some extent, owning no land (farm size
in the 19th century US ranged from 41 to 468 acres, with a mean of 175 acres).
The correlation between the proportion of farms under 10 acres and the land Gini
coefficient is 0.589, which again suggests that percentage landless should account for
a significant proportion of the variation in the colonial income distribution.
Additional control variables Differences in economic development across colonies
may have an independent effect on the colonial suffrage through at least two mech-
anisms. Colonies that are richer may not only be better able to afford the redis-
tributive costs of a democratic regime, but higher income per capita may also make
it more likely that citizens support the rule of law and democratic elections (Welzel
and Inglehart, 2007).
To capture economic development, I rely on data on colonial urbanisation and
white population density from Purvis (1999) and Historical Statistics of the United
States, Millennial Edition Online (2006). The basic idea is that, in the absence of
income per capita data, in the pre-industrial period large urban populations could
thrive only in areas with high agricultural productivity and a developed transporta-
tion network, and that only relatively prosperous areas could generally support dense
populations (Acemoglu et al., 2001). Controlling for urbanisation is also important
for ruling out concerns that rising percentage landless may be driven by the rise of
cities and the decline of agriculture, rather than by an increase in income inequality.
14These data are from Main (1965).
19

While this issue is less relevant for the South, which remained mostly agricultural
and relatively rural throughout the colonial period, it matters for the North, where
urban centers gained economic importance, particularly in the eighteenth century
(see Nash, 1979). As argued above, white population density may also proxy for the
degree of labour scarcity of white workers.
In the regressions to follow, I also control for the type of colonial settlement, using
information from Purvis (1999). While charter colonies originated when the Crown
granted patents and a land grant to a corporation or trustees, in other colonies a sin-
gle or several proprietors were in charge of colonial affairs. In contrast, royal colonies
were governed directly by England through an appointed governor. It is possible that
proprietary and charter colonies, lacking the burden of royal supervision, may have
had a stronger incentive to liberalise the suffrage in order to attract migrants.
Descriptive and graphical evidence
Table A1 presents summary statistics for the evidence I collected. For each colonial
region, it breaks down the data into two panels: before and after 1700, the approx-
imate arrival of slavery in the South. The third column in each of the two time
panels reports the difference in the means across the two groups of colonies. This
information is supplemented by the graphical evidence in Figures 1a and 1b. Figure
1a plots, for each Southern colony and using annual data, the suffrage index (left
hand-side panel), and percentage black (right hand-side panel). Figure 1b does the
same for the colonies in the North. For ease of reading, for each year, each graph
presents three data points only: the maximum value of the suffrage or percent black
variable observed across all colonies in the region (red circle), the minimum value
(blue triangle), and the value obtained using lowess smoothing (black line).
A quick look at the data reveals several interesting patterns. First, while the black
population of the South increased rapidly in the late seventeenth and early eighteenth
20

centuries (reaching an average of 40 per cent by the 1750s), the average slave share
in a typical Northern colony was less than 10 per cent during this period. Moreover,
these differences in labour market structure tracked closely the evolution of political
institutions in the two regions. In the seventeenth century, the franchise in the South
was in fact very liberal (by around 1.3 restrictions as compared to the North). In
contrast, an average Southern colony in the eighteenth century now required voters
to satisfy 1.5 more requirements in order to vote, as compared to a colony in the
North. Table A1 also shows that the South-North inequality gap (proxied by the
regional difference in the percentage of the white landless population) did increase
from 3.7 percentage points before 1700 to 11.2 percentage points. Nevertheless, the
most dramatic change was observed in the South-North difference of the share of the
black population: before 1700, this difference was only 5.9 percentage points, but
after 1700 it increased nearly fivefold.
To study in more detail this reversal in Southern representative institutions,
Figure 2a graphs, for each of the Southern colonies, the joint evolution of suffrage and
labour markets. Figure 2b does the same for suffrage and inequality. Despite some
existing difference in climate, crops, and the timing of settlement across the Southern
colonies, the regional-level relationships are consistent with this more disaggregated
analysis. All four colonies started off with liberal suffrage institutions, which however
deteriorated sharply in the late seventeenth and early eighteenth centuries. This
political transformation was accompanied by an equally dramatic rise in the share
of the slave population, which in all colonies exceeded 25% of the population by the
mid-1700s. Slavery was most prevalent in South Carolina, where in 1700, nearly half
of the population was black.
Figure 2b shows that the Southern political reversal is unlikely to have been
driven by rises in inequality following the arrival of slavery. While inequality did
increase to some extent in Maryland in the early eighteenth century and beyond,
21

this was not the case in the other three colonies: in Virginia, percent landless stayed
relatively constant, while in South and North Carolina, it actually went down. For
comparability, Figures A6-A9 in the online Appendix present the same disaggregated
graphical analysis of suffrage, inequality and the share of blacks for the Northern
colonies. In the North, both suffrage institutions and the composition of colonial
labour markets changed little, while inequality shifts do not seem to correspond to
movements in the suffrage.
Empirical setup
Base model
While the previous subsection has uncovered correlations that are consistent with the
presented theory linking labour markets and the suffrage, it is important to examine
this relationship in a more systematic way. In order to do so, I employ the following
econometric model:
Suffragect = α + β1Suffragect−1 + θ1Labourct−1 + θ2Inequalityct−1+
β2Urbanisationct−1 + β3Densityct−1 + Xct−1β4 + γt + µc + εct (1)
where Suffragect is the suffrage index in colony c and time period t; Suffragect−1 is
lagged suffrage; Labourct−1 is percentage black; Inequalityct−1 is percentage white
landless; Urbanisationct−1 is the share of the urban population; Densityct−1 is pop-
ulation density; Xct−1 is a vector of additional controls (dummies for the years in
which each colony was proprietary or charter colony, with royal colony the omitted
category); γt is a year control; µc is a colony fixed effect; and εct is the disturbance
term. All independent variables are lagged by one period (three years, see more
details below). Since a higher value of suffrage implies better political institutions,
22

Figure 1: Evolution of suffrage and labour markets, by region
(a) Southern colonies0
12
34
56
Suf
frag
e
1600 1650 1700 1750 1800Year
lowess max min
Suffrage
0.1
.2.3
.4.5
.6.7
.8La
bour
1600 1650 1700 1750 1800Year
lowess max min
Labour ( % black )
(b) Northern colonies
01
23
45
6S
uffr
age
1600 1650 1700 1750 1800Year
lowess max min
Suffrage
0.1
.2.3
.4.5
.6.7
.8La
bour
1600 1650 1700 1750 1800Year
lowess max min
Labour ( % black )
Sources: See text. Notes: This graph shows how suffrage and labour markets evolved over time
in the northern and southern colonies. A higher value of suffrage indicates a more liberal political
system. The black lines are obtained by locally weighted least squares smoothing (lowess) over
all colony-year observations. For each year, each graph presents three data points: the maximum
value of the suffrage or percent black variable observed across all colonies in the region (red circle),
the minimum value (blue triangle), and the value obtained using lowess smoothing (black dot).
23

Figure 2: Suffrage, labour markets and inequality within the South
(a) Labour (% black)
0.2
.4.6
.80
.2.4
.6.8
02
46
02
46
1600 1650 1700 1750 18001600 1650 1700 1750 1800
Maryland North Carolina
South Carolina Virginia
Suffrage Labour (% black)
Labo
ur
Suf
frag
e
Year
(b) Inequality (% landless)
0.5
0.5
02
46
02
46
1600 1650 1700 1750 18001600 1650 1700 1750 1800
Maryland North Carolina
South Carolina Virginia
Suffrage Inequality (% white landless)
Ineq
ualit
y
Suf
frag
e
Year
Sources: see text. Notes: This graph shows how suffrage, labour markets and inequality evolved
over time for each of the Southern colonies.
24

I expect θ1 and θ2 to be negative. As the share of whites, relative to blacks, in-
creases, and percentage white landless decreases (implying that inequality is lower),
democratic institutions are more likely to emerge and survive.15
The data set uses an unbalanced time series cross-section that covers the years
1619-1774. I drop observations for the Northern colonies during Dutch or Swedish
rule in order to avoid any confounding effects arising from the differing identity of
the colonisers. I also do not include observations for the years 1775-1776, as the
American Revolution was under way in this period. I furthermore exclude all the
observations for Georgia, as Georgia was only established in 1732. To alleviate any
concerns about selectivity, Table A3 presents regression results which include all
excluded years and observations. Since political institutions are “sticky”, I create
three-year panels by taking three-year averages for all variables (results are similar
when I use shorter or longer averages or an annual panel). I use robust standard
errors as clustered standard errors are not accurate when the number of clusters is
small, but also experiment with wild boostrapped errors following Cameron et al.
(2008) in Table 3 to account for the small number of clusters and minimise serial
correlation, and obtain very similar results. I capture the effect of permanent colony-
level differences, such as climate or geography, by including colony fixed effects, while
controls for urbanisation, population density and the type of colonial settlement
control for time-varying colonial characteristics.
Using a lagged dependent variable is important, since it not only controls for
institutional persistence, but also removes serial correlation. Although there may
be a bias when colony fixed effects are included together with the lagged dependent
variable, Beck and Katz (2011) and Judson and Owen (1999) show that this bias is
15A wide suffrage may decrease population income differences through transfers to the poor.
However, such an effect will be a long-term one and should not be present when inequality is
lagged.
25

small when the number of time periods per item is more than 20 or 30 (in my case,
it is nearly 40 periods per colony). Even so, in the robustness section I also obtain
very similar results with the Arellano-Bond GMM estimator, suggesting that any
fixed effects-lagged dependent variable bias is not a source of concern.
One concern about this econometric setup is that, by including colony fixed effects
and a lagged dependent variable in the regressions, it may simply capture rapid
responses to shifting circumstances very different from the historical events on which
the paper focuses. To address this, in Table A6, I present results (1) without colony
fixed effects; (2) without a lagged dependent variable; and (3) without both. While
the coefficients on the labour variable are (unsurprisingly) several times stronger in
the regressions without a lagged dependent variable, they are negative and highly
significant in all specifications. Second, in the same table I also construct a ten-year
panel, where all regression variables are averaged over ten years, rather than three, as
in the baseline specification. Again, I obtain very similar results. I also supplement
the econometric results with a detailed historical discussion of the underlying link
between labour markets and suffrage in the colonies in the online Appendix (Part
4).16
Instrumental Variables approach
While the developed theoretical framework posits that the composition of colonial
labour markets has a direct effect on the suffrage, it is plausible that this relationship
may be confounded by reverse causality, with political institutions affecting migra-
tion, and thus the future composition of labour markets. In addition, the share
of each colony’s black population may be endogenous to a variety of unobserved
variables, such as differences in colonial leaders.
16In a companion paper, I also focus on a historical examination of the evolution of political
institutions in colonial Virginia (Anonymous, 2014).
26

I address these concerns by instrumenting labour markets with a crop suitability
index (crop index), calculated as follows. For each colony, I collect data on its (fixed)
propensity to produce one of the two labour intensive colonial export crops (tobacco
and rice). I compile the same information for wheat, which can be grown in virtually
any climate without significant amounts of labour. I interact each colony’s suitability
for rice and tobacco with their respective colonial prices, which change over time,
and divide this sum by the suitability of each colony to produce wheat interacted
with its price (I take the logarithm of the final quantity). The instrument therefore
measures each colony’s revenue earning potential for tobacco and rice, relative to
that of wheat.17 Changes in the instrument within colonies are thus driven purely
by price shocks to the three crops, while cross-colony differences could also arise
because of differing crop suitabilities across colonies. Figure A10 plots the variation
in the instrument for each of the colonies included in the analysis.
The logic behind the IV is as follows. Once the prices for tobacco and rice
increase, landowners located in colonies which are suitable for producing the labour-
intensive crops will seek to acquire additional labour. If the supply of English inden-
tured servants is inelastic (as was the case in the late 17th and early 18th centuries),
those farmers will turn to slaves, leading to an increase in the share of the black pop-
ulation. Although I do not have data on the export price of these three commodities
during the time period in question, historians point out that the colonies were largely
price takers (Purvis, 1999; Kulikoff, 1986), so it is unlikely that the prices used in
the construction of the IV were endogenous to colony-level factors. I discuss in more
detail the exclusion restrictions of the IV in the next section.
I obtain the crop price data from Purvis (1999) and Historical Statistics of the
United States, Millennial Edition Online (2006). I compile the fixed crop suitability
weights from the Food and Agriculture Organization of the United Nations Global
17Cotton production did not start in the South until after the Revolution.
27
Agro-Ecological Zones (GAEZ) 2010 database (FAO, accessed April 5, 2012). Al-
though the latter data are not available historically, this should be a minor concern,
as climate and soil conditions likely changed very little in the United States since
colonial times. For each cell of approximately 56 by 56 kilometers, FAO combined
information on the physical environment and the requirements for growing 154 crops,
assuming different levels of input use and crop management. I make use of the pre-
made crop summary tables, which provide crop suitability and potential yield data
for each of the American states. Similarly to Nunn and Qian (2011), I define land to
be suitable for either tobacco or rice if it yields at least 40 per cent of the maximum
possible yield for these crops. I also assume that cultivation occurs under rain-fed
conditions (as mechanical irrigation did not become popular in the US until after
the Revolution), and low input intensity.18
Results
Table 1 reports OLS and IV estimates for equation (1), using four different specifica-
tions. First, the table shows that there is a negative relationship between the share
of each colony’s black population and the suffrage index, both in column (1), which
excludes colony fixed effects and inequality, and in column (2), which presents the
full specification. In fact, the coefficient on labour markets in column (2) is higher
than that in column (1), with inequality having, as hypothesised, a negative effect
on the quality of political institutions that is significant but nearly two times weaker
than that of labour markets. In addition, the impact of labour markets on the suf-
frage is quantitatively important. A 10 p.p. increase in percentage black leads to a
18Nunn and Qian (2011, 609-610) and Easterly (2007) provide additional information on how
these data were constructed. Results using the 20-percent and 60-percent yield cutoffs are similar
but weaker, and assuming medium output intensity does not change the estimates.
28

decrease in the suffrage index of approximately 0.159 restrictions, or close to 4.4%,
relative to the sample mean. Because I am also controlling for the lagged value of
the suffrage index, it is more appropriate to consider the long-run effect of labour
markets: a 10 p.p increase in percentage black leads to a decrease in suffrage of
roughly 0.773 restrictions, or 21.2%.19
Column (3) instruments labour market composition with the crop index variable.
The coefficient on percent black is still negative and significant, and its magnitude
is nearly 1.6 times stronger than that in the OLS specification. As argued earlier,
since percentage black is calculated using population data, rather than labour force
estimates, it likely measures the composition of colonial labour markets with error.
If this measurement error is classical, its coefficient in the OLS regressions may be
biased downward.
In the final column of Table 1, I restrict the sample to only those observations that
have a value of inequality (percentage landless) above the median value in the sample.
The negative and significant relationship between the share of each colony’s black
population and the suffrage index survives even when inequality is kept constant in
this sample of year-colonies with unequal incomes, which makes it less likely that
percent black is simply a proxy for economic inequality.
The results in Table 1 also suggest that variables such as urbanisation, population
density, and differences in colonial settlement patterns have limited impact on the
quality of colonial political institutions. Unreported estimates in which urbanisation
and population density were entered separately, rather than together produced very
similar results. In estimations which are available upon request, I also allowed in-
equality to vary non-linearly, which did not produce significant coefficients on the
higher-order inequality terms and had little effect on the overall results.
19The cumulative effect is calculated by dividing the coefficient on labour by the quantity (1-
coefficient on lagged suffrage) (column 2).
29
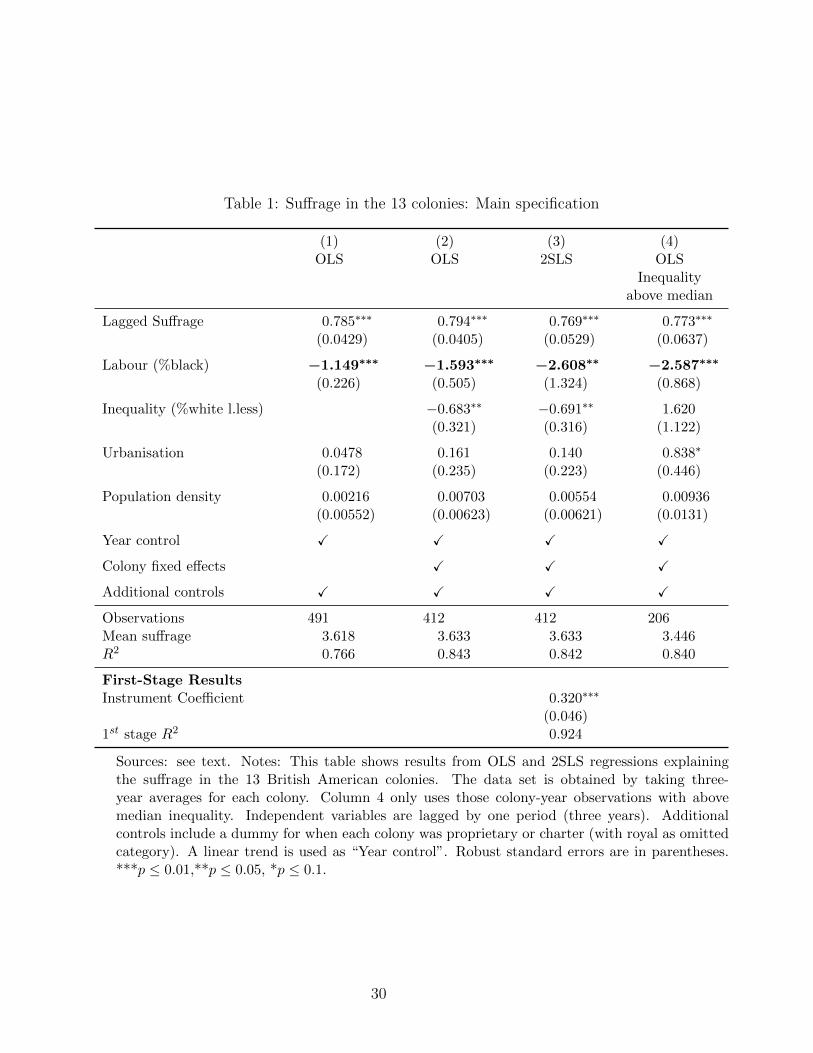
Table 1: Suffrage in the 13 colonies: Main specification
(1) (2) (3) (4)OLS OLS 2SLS OLS
Inequalityabove median
Lagged Suffrage 0.785∗∗∗ 0.794∗∗∗ 0.769∗∗∗ 0.773∗∗∗
(0.0429) (0.0405) (0.0529) (0.0637)
Labour (%black) −1.149∗∗∗ −1.593∗∗∗ −2.608∗∗ −2.587∗∗∗
(0.226) (0.505) (1.324) (0.868)
Inequality (%white l.less) −0.683∗∗ −0.691∗∗ 1.620(0.321) (0.316) (1.122)
Urbanisation 0.0478 0.161 0.140 0.838∗
(0.172) (0.235) (0.223) (0.446)
Population density 0.00216 0.00703 0.00554 0.00936(0.00552) (0.00623) (0.00621) (0.0131)
Year control X X X X
Colony fixed effects X X X
Additional controls X X X X
Observations 491 412 412 206Mean suffrage 3.618 3.633 3.633 3.446R2 0.766 0.843 0.842 0.840
First-Stage ResultsInstrument Coefficient 0.320∗∗∗
(0.046)1st stage R2 0.924
Sources: see text. Notes: This table shows results from OLS and 2SLS regressions explainingthe suffrage in the 13 British American colonies. The data set is obtained by taking three-year averages for each colony. Column 4 only uses those colony-year observations with abovemedian inequality. Independent variables are lagged by one period (three years). Additionalcontrols include a dummy for when each colony was proprietary or charter (with royal as omittedcategory). A linear trend is used as “Year control”. Robust standard errors are in parentheses.***p ≤ 0.01,**p ≤ 0.05, *p ≤ 0.1.
30

Table 2 shows that the results in Table 1 are robust to using alternative measures
of labour markets. Columns (1) to (3) substitute the share of each colony’s black
population with a binary variable that is 1 for the South after 1700, and 0 for all other
colonies and years.20 Although crude, a significant relationship between this variable
and the suffrage index should alleviate concerns that the labour markets-suffrage
relationship is driven by something idiosyncratic in the percentage black measure.
Not surprisingly, the coefficient estimates are significant, albeit much weaker than
those in Table 1.
In columns (4)-(5), I use Caribbean slave prices as a measure of labour market
structure. Since the Caribbean was the largest slave market throughout the colonial
period which set prices for the rest of the New World, high Caribbean slave prices
should decrease the demand for – and the number of – new slaves in the South. The
expected relationship between this measure of labour markets and the suffrage index
is therefore positive. I prefer to use Caribbean slave prices instead of prices in North
America, as the latter are likely endogenous to domestic demand.
Because the number of slaves in the North was very small, it is likely that North-
ern slave-owners obtained black labourers from a different market, and at different
prices, than those in the South.21 Unfortunately, I do not have data on Northern
slave prices, so I need to restrict my analysis only to colonies in the South. Moreover,
the small sample size prevents me from conducting the IV analysis in this specifica-
tion. Despite these caveats, the coefficient on Caribbean slave prices is – as expected
– positive and significant. The estimates in column (5) imply that a one standard
20Using alternative years for the cutoff (1690, 1695, 1705, and 1710) did not change the results.
21Although there were some slaves in the Northern colonies, they were very few and had little
economic significance. They did not come directly from Africa, but were either unwanted blacks
from the Caribbean or the South, or those captured by privateers or pirates operating from the
northern ports. Such slaves were “[b]roken, enfeebled and generally unfit for plantation labor,” and
“found their way to northern ports when no one else would purchase them” (Berlin, 1998, 47-48).
31

Table 2: Suffrage in the 13 colonies: alternative measures of labour markets
Labour: Binary (1 if South & after 1700) Labour: Carribean slave prices
(1) (2) (3) (4) (5)OLS OLS 2SLS OLS OLS
Lagged Suffrage 0.791∗∗∗ 0.804∗∗∗ 0.792∗∗∗ 0.856∗∗∗ 0.776∗∗∗
(0.0432) (0.0419) (0.0447) (0.0459) (0.0668)
Labour (Dummy) −0.355∗∗∗ −0.266∗ −0.384∗
(0.0892) (0.144) (0.203)
Labour (Slave prices) 0.0215∗ 0.0545∗∗∗
(0.0114) (0.0195)
Inequality (%white l.less) −0.626∗∗ −0.606∗∗ 0.705(0.312) (0.303) (0.933)
Urbanisation −0.214 0.235 0.253 −0.207 1.464∗
(0.177) (0.278) (0.271) (0.420) (0.764)
Population density 0.00341 0.00734 0.00644 −0.00160 0.0204(0.00554) (0.00628) (0.00615) (0.0138) (0.0341)
Year control X X X X X
Colony fixed effects X X X
Additional controls X X X X X
Observations 491 412 412 162 141Mean suffrage 3.618 3.633 3.633 3.270 3.123R2 0.762 0.841 0.840 0.821 0.852
First-Stage ResultsInstrument Coefficient 2.170∗∗∗
(0.126)1st stage R2 0.909
Sources: See text. Notes: This table shows results from OLS and 2SLS regressions explaining the suffrage in the 13 British Americancolonies, where labour is measured as a binary indicator (1 for the South after 1700, and 0 for all other colony-year observations), and asCaribbean slave prices (with the sample restricted only to the South; columns 4-5). The data set is obtained by taking three-year averagesfor each colony. All independent variables are lagged by one period (three years). A linear trend is used as “Year control”. Additionalcontrols include a dummy for when each colony was proprietary or charter (with royal as omitted category). Robust standard errors arein parentheses. ***p ≤ 0.01,**p ≤ 0.05, *p ≤ 0.1.
32
deviation increase in the price of a single slave improves the suffrage index in the
South by around 0.420 restrictions, or approximately 13.4% relative to the sample
mean in the short run.22
I test the robustness of these results in Table 3 below, as well as in Tables A3-A7
in the online Appendix. First, in Table 3 I include colony-specific trends, in addition
to the colony fixed effects, (columns (1) - (2)). The labour coefficient is slightly
smaller in magnitude but still significant, while inequality loses significance. Results
are similar when I instead use regional trends (columns (3)-(4)). In column (5), I
use an annual panel to calculate the standard errors using the wild boostrap method
of Cameron et al. (2008), which is a more appropriate way for modeling within-
colony correlation of the errors when the number of clusters is small, as compared to
the conventional clustered errors method. Results are analogous to those presented
earlier, and also survive when I experiment with other unreported specifications of
the errors, such as a Prais-Winsten regression, clustered standard errors, Newey-
West standard errors (with one, two or three lags), panel corrected standard errors
(PCSEs) following Beck and Katz (2011), and the inclusion of an additional lag
of the dependent variable. The last column in Table 3 implements the Arellano-
Bond GMM regression to account for the possible bias arising from the simultaneous
inclusion of colony fixed effects and a lagged dependent variable. The coefficient on
percent black is again negative and significant.
In the online appendix, I present and discuss several additional robustness tables,
which again preserve the main results. Tables A3 and A4 experiment with various
aggregations of the dependent variable, as well as regressions with an annual panel.
Table A5 instead investigates the impact of ethnic and religious fractionalisation
on the suffrage, and the role of the Scotch-Irish migration of 1717-1775 (see more
22The mean Caribbean slave price during this period was around 27.4 pounds sterling, with a
standard deviation of 7.7.
33

discussion on the latter below). Table A6 shows that the baseline results survive
when I drop the colony fixed effects, the lagged dependent variable and when I use
a ten-year average panel. Table A7 replicates the results in Table 1 but without
including inequality.
IV validity and exclusion restrictions
The adopted IV strategy would be valid provided that three conditions are satis-
fied. First, the empirical analysis above illustrates that the relationship between the
instrument and the share of each colony’s black population is indeed strong, with
F-statistics significantly above 10. Moreover, the effect of crop index on the suffrage
must work only through labour markets. More precisely, the IV should not affect the
dependent variable directly, or through variables omitted from the model. I examine
the validity of each of these assumptions below.
Could the crop index variable have a direct effect on political institutions? For
example, a rise in the prices of labour intensive crops will make farmers expand
production, and consequently increase their demands for labour. If slaves are un-
available, planters will respond by liberalising the suffrage, and thus the crop index
might affect the suffrage directly, even if the share of blacks is constant. However,
the evolution of tobacco, rice and wheat prices (Figures A11a, A11b and A11c) re-
veals that the only crop whose prices might justify a direct link between crop index
and the suffrage is tobacco, as its prices rose rapidly during the period 1647-1675.
Even so, tobacco planters would have been ambivalent about attracting additional
labour, as this upward surge was volatile and relatively short-lived. Indeed, when
I drop from the regressions all years until 1675, the (unreported) results are nearly
identical to those presented in Table 1.
A second concern is that the instrument may be correlated with other deter-
minants of the dependent variable, either observed or unobserved. First, the crop
34
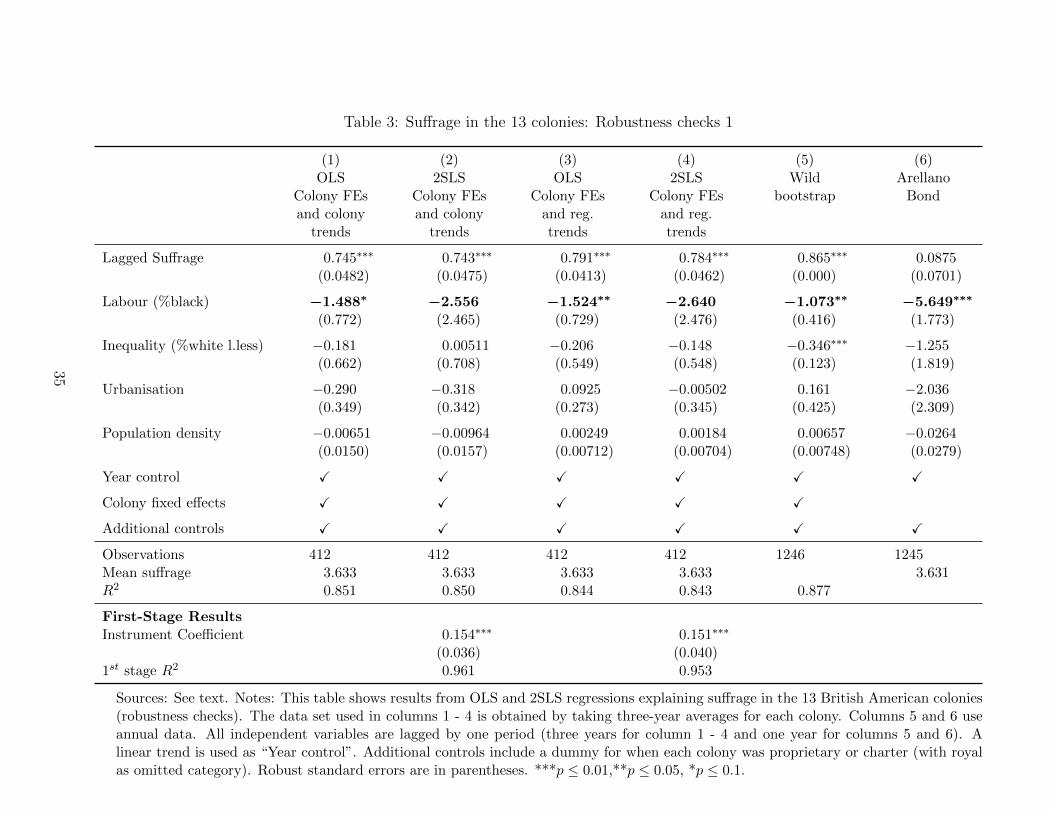
Table 3: Suffrage in the 13 colonies: Robustness checks 1
(1) (2) (3) (4) (5) (6)OLS
Colony FEsand colony
trends
2SLSColony FEsand colony
trends
OLSColony FEs
and reg.trends
2SLSColony FEs
and reg.trends
Wildbootstrap
ArellanoBond
Lagged Suffrage 0.745∗∗∗ 0.743∗∗∗ 0.791∗∗∗ 0.784∗∗∗ 0.865∗∗∗ 0.0875(0.0482) (0.0475) (0.0413) (0.0462) (0.000) (0.0701)
Labour (%black) −1.488∗ −2.556 −1.524∗∗ −2.640 −1.073∗∗ −5.649∗∗∗
(0.772) (2.465) (0.729) (2.476) (0.416) (1.773)
Inequality (%white l.less) −0.181 0.00511 −0.206 −0.148 −0.346∗∗∗ −1.255(0.662) (0.708) (0.549) (0.548) (0.123) (1.819)
Urbanisation −0.290 −0.318 0.0925 −0.00502 0.161 −2.036(0.349) (0.342) (0.273) (0.345) (0.425) (2.309)
Population density −0.00651 −0.00964 0.00249 0.00184 0.00657 −0.0264(0.0150) (0.0157) (0.00712) (0.00704) (0.00748) (0.0279)
Year control X X X X X X
Colony fixed effects X X X X X
Additional controls X X X X X X
Observations 412 412 412 412 1246 1245Mean suffrage 3.633 3.633 3.633 3.633 3.631R2 0.851 0.850 0.844 0.843 0.877
First-Stage ResultsInstrument Coefficient 0.154∗∗∗ 0.151∗∗∗
(0.036) (0.040)1st stage R2 0.961 0.953
Sources: See text. Notes: This table shows results from OLS and 2SLS regressions explaining suffrage in the 13 British American colonies(robustness checks). The data set used in columns 1 - 4 is obtained by taking three-year averages for each colony. Columns 5 and 6 useannual data. All independent variables are lagged by one period (three years for column 1 - 4 and one year for columns 5 and 6). Alinear trend is used as “Year control”. Additional controls include a dummy for when each colony was proprietary or charter (with royalas omitted category). Robust standard errors are in parentheses. ***p ≤ 0.01,**p ≤ 0.05, *p ≤ 0.1.
35
index may simply capture differences in persistent factor endowments and economic
inequality across colonies, as argued by Engerman and Sokoloff (2000, 2002, 2005).
There are at least three reasons that mitigate this concern. First, the inequality
variable included in the regressions (percent landless) should capture at least some
of the variation in the colonial income distribution. Moreover, the inclusion of colony
fixed effects ensures that the effect of the instrument is not confounded by colony-
specific fixed variables. Third, by combining price and crop suitability data, the crop
index provides information on each colony’s revenue earning potential for tobacco
and rice, compared to that of wheat, without making a statement about the rela-
tive distribution of these crop revenues. This is also confirmed by the unconditional
correlation between crop index and inequality and the sample (0.250), which is not
overwhelming enough to raise concern.
Alternatively, the effect of the instrument on the suffrage could work through
some omitted variable from the model. The very low correlation between the instru-
ment and the regression residuals (less than 0.00001), the inclusion of colony fixed
effects and time dummies, as well as the multiple robustness tests performed in the
previous section and in the online Appendix suggest that this is less likely to be the
case. Table A8, which further experiments with dropping (1) colony fixed effects;
(2) urbanisation and population density; and (3) urbanisation, population density
and inequality from the IV specification, also shows that the coefficient on labour
(percent black) remains remarkably stable across specifications, thus pointing away
from the role of unobservables.
Still, one possibility is that a rise in crop prices may also increase overall welfare,
which in turn may directly affect the emergence and stability of political institutions.
On one hand, as government revenues (largely based on crop export duties) grow
and the costs of redistribution are partially offset, elites may be more likely to extend
the suffrage. On the other hand, long-term rises in income per capita may lead to
36

attitudinal changes in the population that make a democratic regime more likely to
emerge and to be sustained.23 Although some of these effects should be captured
by the controls for urbanisation and population density included in the regressions,
these are admittedly less precise than a direct measure of income per capita, which
unfortunately does not exist. An examination of one available income proxy for
colonial Maryland, a welfare ratio calculated by Allen et al. (2012), in fact provides
some suggestive evidence against these hypotheses. In fact, the disfranchisement of
landless whites in Maryland in the early eighteenth century was accompanied by a
welfare ratio which was rising, rather than falling.24
I conclude that, in line with Hypothesis 1, there is a consistent negative relation-
ship between the share of each colony’s black population and the colonial suffrage.
I also find support for Hypothesis 2. Inequality has a negative impact on the qual-
ity of colonial political institutions, but the magnitude of the effect is several times
smaller than that of labour markets. In the next section, I discuss three potential
validity concerns which may threaten the reliability of these estimates. I elaborate
more on the role of (1) the Scotch-Irish migration wave of 1717-1775; and (2) racially
motivated conflicts in the online Appendix (Part 2).
Alternative explanations
The theoretical mechanism outlined above provides one reason why we may observe
a connection between the composition of colonial labour markets and the quality
of political institutions. Still, there may be several alternative explanations for this
23See, for instance, Limongi and Przeworski (1997), as well as Boix (2011).
24The welfare ratio is the full-time, full-year earnings of a male unskilled worker relative to the
cost of subsistence for a family of four. A welfare ratio of 1 indicates that the labourer earns just
enough to keep his family at subsistence, while values greater than 1 mean that the family could
afford additional items.
37

finding that I review below.
The relationship between inequality and labour market com-
position
An important concern about the validity of the empirical results is the potential
relationship between labour market structure (proxied by percentage black) and in-
equality (proxied by percentage white landless). If percentage black simply captures
the spread of plantation agriculture and thus increasing income inequality in the
South, as compared to the North, the presented results will be spurious. Although
I attempt to address this concern by including a control for income inequality in all
regressions, it is plausible that the only available inequality proxy that I have (the
percent of each colony’s white landless population) is less precise than a more direct
measure (such as a Gini coefficient).
Although detailed income inequality statistics for colonial America are unavail-
able, the existing evidence shows that the relationship between inequality and slavery
during this time period is not clear-cut. This is not surprising, as large Southern
landowners were able to amass significant fortunes, as compared to indentured ser-
vants, even before slaves became widely available. In a companion paper (Anony-
mous, 2014), I trace the evolution of income inequality in Virginia from the early
seventeenth century until the American revolution, using a variety of sources such
as land transfer records, wills, height data, and the distribution of slave holdings to
show that slavery benefited equally both small and large farmers, and that income
inequality in the colony did not increase substantially in the eighteenth century.
What is more, data in Jones (1980) demonstrate that, on the eve of the American
Revolution, the wealth distribution in New England was actually more unequal than
that in the South. In 1774, the richest 10 per cent of people who left probate records
held 57 per cent of the net worth in New England, compared with 49 per cent in the
38

South and 42 per cent in the Middle colonies.
Even so, it is instructive to investigate the relationship between percent white
landless and percent black in my data set. If the arrival of slavery increased inequality
because it gave the rich an opportunity to establish large plantations, then such a
relationship should be particularly pronounced in the Southern colonies. Graphical
evidence shows that there is a weak relationship between inequality and labour in
the South (the correlation for the whole region is 0.160; see Figures A11 and A12).25
Although the unconditional correlation between inequality and labour in the full
sample is somewhat higher than that in the South (0.322), a regression analysis
shows the lack of a relationship between the two variables (Figure A13).
The threat of revolution
A second explanation predicts that elites will extend the right to vote to the masses in
order to credibly commit themselves to economic concessions in the face of organised
mass resistance (Acemoglu and Robinson, 2006; Jack and Lagunoff, 2006). However,
several reasons weaken the conclusion that Southern elites implemented a restrictive
political regime which favoured the land holding class only after revolutionary threats
from the masses subsided in the early eighteenth century.
In Virginia, a series of rebellions in the period 1660-1683 - such as the servant
uprising of 1663, Bacon’s rebellion in 1676, and the tobacco cutting riots of 1683 -
included poor whites and indentured servants who protested against their gradual
loss of political rights (Breen, 1973). However, subsequent gains in the franchise
were short-lived. For example, the 1676 decision to extend the suffrage to all freemen
25Regressing (for the South only) inequality on its lagged value, labour, urbanisation, population
density, controls for colonial settlement patterns, and year and colony fixed effects produced a
significant but very weak relationship, in which one percentage point increase in percent black
leads to 0.0005 percentage points increase in inequality.
39

(rather than only freeholders) was rescinded in the same year, and only freeholders
and householders could vote until 1683. Although after 1684 a new wording of the
law did not prohibit landless freemen from voting and contained no punishment for
irregular voting, essentially allowing all freemen to vote, this law was repealed in
1698, again granting the suffrage to only freeholders (McKinley, 1905).
What is more, Virginia’s most liberal political institutions were adopted in the
early seventeenth century, at a time when there were in fact few uprisings. More
importantly, it was the switch from indentured servitude to slaves in the early eigh-
teenth century that prompted whites to view blacks as the main threat to the colony’s
tranquility, thus underlying Virginia’s stability (Breen, 1973, p.13-16). What is key,
however, is that the shift to slavery also drove the tightening of the franchise in
eighteenth-century Virginia. As Anonymous (2014) shows, slavery benefited not
only large planters, but also smaller farmers who could afford even a few slaves. As
the latter class expanded and prospered and the number of indentured servants and
poor whites dwindled, the interests of big and small landholders became more closely
aligned. This not only prompted the restriction of the suffrage to freeholders in 1699,
but also made it increasingly costly for small farmers to participate in lower class
collective action, which improved the security situation in the colony.
Evidence from other colonies further questions the idea that colonial representa-
tive institutions were driven by revolutionary threats. In Maryland and the Caroli-
nas, uprisings reflected disagreements within the elite as well as religious tensions,
rather than franchise considerations. For instance, in the 1680s, opposers of Mary-
land’s proprietary government cited a list of grievances, such as Lord Baltimore’s
appointment of his relatives for public offices; proprietary appointment of sheriffs;
excessive fees and taxes; as well as anti-Catholic sentiments against the proprietors
by the Protestant colonists. The property requirement for voting set in 1670 was also
mentioned, but colonists complained about the fact that it was set by the proprietor,
40
rather than the legislature (Ward, 1991, p. 259-262). In North Carolina, the 1677
Culpeper rebellion sought to stop payment to England of customs duties on exported
tobacco, while Cary’s rebellion (in 1704) resulted from a contest over the office of
deputy governor (Ward, 1991, p. 263-264). In South Carolina, political instability
was rooted in disagreements between the proprietors and an anti-proprietary faction.
In 1690, Seth Sothel, backed by nearly five hundred people, staged a coup against the
proprietor, while in 1719 there were clashes between the Assembly and the proprietor
motivated by the desire of the colonists to overthrow proprietary rule (Ward, 1991,
p. 264-265). In New England and New York, the Glorious Revolution in England
prompted uprisings in Boston and New York City. Although in Massachusetts, a
property basis of the suffrage replaced the earlier religious qualifications, the fran-
chise still remained rather restrictive (McKinley, 1905). There were no changes to
political institutions in New York. In sum, a possible link between representative
institutions and changing revolutionary threats is less than clear.
The importance of culture
In this subsection, I examine whether differences in migrants’ cultural backgrounds
affected the quality of colonial political institutions, and, in particular, whether
colonies with a wide franchise had a majority of inhabitants coming from more
politically liberal European countries.
There is little data on the country of origin of each colony’s population until the
first US census conducted in 1790. What we do know, however, is that by 1680,
nearly 90% of colonial Americans were English, and that by the early eighteenth
century, more and more non-English migrants were arriving in the colonies, with the
largest groups including Scotch-Irish, Germans and Dutch (Ward, 1991, p. 109-116).
An argument emphasising the importance of culture, however, is less compelling, for
at least three reasons.
41

First, no European settler experienced a suffrage as broad as the one granted in
the Southern colonies. In England, the forty-shilling freehold requirement excluded
nearly 98% of adult males (Acemoglu and Robinson, 2012), while in the Habsburg
empire, no popular parliament existed, as Habsburg family members were routinely
elected to the office of Holy Roman Emperor by seven hereditary electors. Similarly,
although the Dutch republic had a relatively strong federal parliament (the States
General) and a weak executive by the standards of late medieval and early modern
period, popular political participation was limited. Members of the States General
were selected by the provincial parliaments, selection for which was in turn limited
to a list of regential families (Congleton, 2010).26
Second, any cross-colony cultural differences which were either fixed over time or
followed linear time trends specific to each colony should be captured by the inclusion
of colony fixed effects (present in most regressions) as well as colony time trends (see
Table 3). Of course, it is possible that the rate of in-migration of particular groups
was non-linear. For instance, the arrival of large numbers of Scotch-Irish settlers
in the South in 1717-1775 may have been behind the decision of colonial elites to
tighten the franchise. These migrants came from “lawless” regions in Britain on the
border with Ulster, and were considered to be more violent and less hard-working
than the Germans or the Dutch (Sowell, 2013). I examine this possibility empirically
in the online Appendix (Table A5) and find little support for it.
26Only one Dutch province differed from this model: in Friesland, all owners of particular real
properties (without a minimum value requirement) could participate in local (county) elections
which led to provincial representation (personal communication with Jan de Vries, April 7, 2014).
42
Conclusion
Why do elites choose to extend the suffrage to the masses? Using detailed data
from the thirteen British American colonies, this paper proposes one answer to this
question: elites may wish to extend the right to vote to the lower classes in order
to attract migrant workers. I develop a theory in which a representative assembly
serves as a commitment device for any promises made to labourers by those in
power, such as those related to compensation, labour contracts, or the allocation of
land grants. While the theory also accommodates a negative relationship between
income inequality and the extent of the franchise (as argued by earlier literature), an
examination of both quantitative and historical evidence reveals a weaker and less
robust impact of income inequality.
I test the theory by analysing a new time series cross-section data set from colo-
nial British America covering more than 150 years. Colonial governments enforced
a liberal franchise only in those colonies that relied on white workers, such as the
seventeenth century South and the North, and immediately rescinded political con-
cessions once white labourers could be substituted with black workers, as in the
South after the arrival of slavery. To rule out alternative explanations, I construct
a new instrument for the composition of colonial labour markets, experiment with
several different measures of labour markets, control for a wide range of variables,
including income inequality, and include colony fixed effects in all specifications.
My work helps identify the specific conditions under which institutions can be
malleable and under which they persist, a fundamental research and policy question
about which we still know relatively little. By emphasising the link between the
quality of labour and that of political institutions, the paper suggests that democracy
is less likely to emerge and survive in countries where economic production relies
on easily replaceable, low-skill workers who have limited bargaining power vis-a-vis
the ruling politicians. Shedding light on where such differences in labour markets
43

come from, both across space and throughout history, may therefore be crucial for
understanding how democracies originate and evolve.
44
References
Acemoglu, D., C. Garcıa-Jimeno, and J. A. Robinson (2012): “FindingEldorado: Slavery and Long-Run Development in Colombia,” Journal of Compar-ative Economics.
Acemoglu, D., S. Johnson, and J. A. Robinson (2001): “The Colonial Originsof Comparative Development: An Empirical Investigation,” American EconomicReview, 91, 1369–1401.
Acemoglu, D. and J. Robinson (2012): “Why Nations Fail: Origins of Power,Poverty and Prosperity,” .
Acemoglu, D. and J. A. Robinson (2006): Economic Origins of Dictatorshipand Democracy, Cambridge University Press.
Albouy, D. Y. (2012): “The colonial origins of comparative development: anempirical investigation: comment,” The American Economic Review, 102, 3059–3076.
Alesina, A., R. Baqir, and W. Easterly (1999): “Public goods and ethnicdivisions,” The Quarterly Journal of Economics, 114, 1243–1284.
Allen, R. C., T. E. Murphy, and E. B. Schneider (2012): “The ColonialOrigins of the Divergence in the Americas: A Labor Market Approach,” TheJournal of Economic History, 72, 863–894.
Anonymous (2014): “Suffrage, labour markets and commitment: evidence fromcolonial Virginia,” .
Ansell, B. and D. Samuels (2010): “Inequality and democratization: A con-tractarian approach,” Comparative Political Studies, 43, 1543–1574.
Atkinson, A. B. and A. Brandolini (2001): “Promise and Pitfalls in the Use of“Secondary” Data-Sets: Income Inequality in OECD Countries as a Case Study,”Journal of Economic Literature, 39, 771–799.
Beck, N. and J. N. Katz (2011): “Modeling Dynamics in Time-Series-Cross-Section Political Economy Data,” Annual Review of Political Science, 14, 331–352.
Berlin, I. (1998): Many Thousands Gone: The First Two Centuries of Slavery inNorth America, Harvard University Press.
Bertocchi, G. and C. Strozzi (2008): “International Migration and the Role ofInstitutions,” Public Choice, 137, 81–102.
Boix, C. (2003): Democracy and Redistribution, Cambridge University Press.
——— (2011): “Democracy, Development, and the International System,” AmericanPolitical Science Review, 105, 809–28.
45
Bourguignon, F. and C. Morrisson (2002): “Inequality among world citizens:1820-1992,” American economic review, 727–744.
Braun, S. and M. Kvasnicka (2013): “Men, Women, and the Ballot: Gender Im-balances and Suffrage Extensions in the United States,” Explorations in EconomicHistory, 50, 405–426.
Breen, T. H. (1973): “A Changing Labor Force and Race Relations in Virginia1660–1710,” Journal of Social History, 7, 3–25.
Bruce, P. (1910): Institutional History of Virginia in the Seventeenth Century,G.P. Putnam’s sons.
Cameron, A. C., J. B. Gelbach, and D. L. Miller (2008): “Bootstrap-BasedImprovements for Inference with Clustered Errors,” The Review of Economics andStatistics, 90, 414–427.
Chute, M. (1969): The First Liberty: A History of the Right to Vote in America,1619-1850, Dutton.
Congleton, R. D. (2010): Perfecting Parliament, Cambridge University Press.
——— (2011): “Democracy in America: Labor Mobility, Liberalism, and Constitu-tional Reform1,” .
Cooper, W. J. (2000): Liberty and slavery: southern politics to 1860, Univ ofSouth Carolina Press.
Dinkin, R. J. (1977): Voting in Provincial America: A Study of Elections in theThirteen Colonies, 1689-1776, Greenwood Press.
Easterly, W. (2007): “Inequality Does Cause Underdevelopment: Insights froma New Instrument,” Journal of Development Economics, 84, 755–776.
Easterly, W. and R. Levine (1997): “Africa’s Growth Tragedy: Policies andEthnic Divisions,” The Quarterly Journal of Economics, 112, 1203–1250.
Einhorn, R. L. (2008): American Taxation, American Slavery, University ofChicago Press.
Eltis, D., F. D. Lewis, and D. Richardson (2005): “Slave Prices, the AfricanSlave Trade, and Productivity in the Caribbean, 1674–1807,” The Economic His-tory Review, 58, 673–700.
Engerman, S. L. and K. L. Sokoloff (2000): “History Lessons: Institutions,Factors Endowments, and Paths of Development in the New World,” The Journalof Economic Perspectives, 14, 217–232.
——— (2002): “Factor Endowments, Inequality, and Paths of Development amongNew World Economies,” Economıa, 3, 41–109.
46
——— (2005): “The Evolution of Suffrage Institutions in the New World,” Journalof Economic History, 65, 891.
FAO (accessed April 5, 2012): “FAO Global Agro-Ecological Zones (GAEZ) 2010database,” .
Fishback, P. (2006): “Social Insurance and Public Assistance,” in Historical Statis-tics of the United States, Millennial Edition On Line, ed. by S. B. Carter, S. S.Gartner, M. R. Haines, A. L. Omstead, R. Sutch, and G. Wright, CambridgeUniversity Press, 693–700.
Fleck, R. K. and F. A. Hanssen (2006): “The Origins of Democracy: A Modelwith Application to Ancient Greece*,” Journal of Law and Economics, 49, 115–146.
——— (2009): “Rulers ruled by women: an economic analysis of the rise and fall ofwomens rights in ancient Sparta,” Economics of Governance, 10, 221–245.
——— (2013): “When voice fails: Potential exit as a constraint on governmentquality,” International Review of Law and Economics, 35, 26–41.
Freeman, J. R. and D. P. Quinn (2012): “The Economic Origins of DemocracyReconsidered,” American Political Science Review, 106, 58–80.
Galenson, D. W. (1996): “The Settlement and Growth of the Colonies: Popu-lation, Labor and Economic Development,” The Cambridge Economic History ofthe United States, 1, 135–207.
Gleditsch, K. S. and M. D. Ward (2006): “Diffusion and the InternationalContext of Democratization,” International Organization, 60, 911.
Gray, L. and E. Thompson (1933): History of Agriculture in the Southern UnitedStates to 1860, vol. 2 of Carnegie Institution of Washington publication, CarnegieInstitution of Washington.
Grubb, F. (2000): “The Statutory Regulation of Colonial Servitude: an Incomplete-Contract Approach,” Explorations in Economic History, 37, 42–75.
Grubb, F. W. (1990): “Growth of literacy in colonial America: Longitudinal pat-terns, economic models, and the direction of future research,” Social Science His-tory, 451–482.
Haggard, S. and R. R. Kaufman (2012): “Inequality and regime change: Demo-cratic transitions and the stability of democratic rule,” American Political ScienceReview, 106, 495–516.
Hall, C. C. (1910): Narratives of early Maryland, 1633-1684, Scribner.
Harrold, S. (2001): The American Abolitionists, Pearson Education.
47
Hening, W. W. (1819-1823): The Statutes at Large: Being a Collection of All theLaws of Virginia, from the First Session of the Legislature, in the Year 1619, R.& W. & G. Bartow.
Historical Statistics of the United States, Millennial Edition Online(2006): “Part E, Government and International Relations,” in Colonial Statistics,Cambridge University Press, ed. by R. Sutch and S. Carter.
Houle, C. (2009): “Inequality and Democracy,” World Politics, 61, 589–622.
Jack, W. and R. Lagunoff (2006): “Dynamic enfranchisement,” Journal ofPublic Economics, 90, 551–572.
Jones, A. H. (1980): Wealth of a Nation to Be: The American Colonies on theEve of the Revolution, Columbia University Press.
Jordan, D. W. (2002): Foundations of Representative Government in Maryland,1632-1715, Cambridge University Press.
Judson, R. A. and A. L. Owen (1999): “Estimating Dynamic Panel Data Models:a Guide for Macroeconomists,” Economics Letters, 65, 9–15.
Kenny, L. (2004): “Votes for Women,” in The Encyclopedia of Public Choice, ed.by C. Rowley and F. Schneider, Kluwer Academic Publishers Group.
Kenny, L. W. (1999): “Explaining the Puzzle of why Men Gave Women the Rightto Vote,” Working paper.
Keyssar, A. (2000): The Right to Vote: The Contested History of Democracy inthe United States, Basic Books.
Kulikoff, A. (1986): Tobacco and Slaves: The Development of Southern Culturesin the Chesapeake, 1680-1800, University of North Carolina Press.
——— (2000): From British Peasants to Colonial American Farmers, University ofNorth Carolina Press.
Limongi, F. and A. Przeworski (1997): “Modernization: Theories and Facts,”World Politics, 49, 155–183.
Lipset, S. M. (1959): “Some Social Requisites of Democracy: Economic Develop-ment and Political Legitimacy,” American Political Science Review, 53, 69–105.
Lupu, N. and J. Pontusson (2011): “The structure of inequality and the politicsof redistribution,” American Political Science Review, 105, 316–336.
Main, J. T. (1965): The Social Structure of Revolutionary America, PrincetonUniversity Press.
48

McKinley, A. E. (1905): The Suffrage Franchise in the Thirteen English Coloniesin America, Ginn & co., Boston.
Michener, R. W. (2003): “Money in the American Colonies,” EH. Net Encyclo-pedia, Edited by Robert Whaples. URL http://eh. net/encyclopedia.
Moller, H. (1945): “Sex Composition and Correlated Culture Patterns of ColonialAmerica,” The William and Mary Quarterly, 2, 114–153.
Morgan, E. S. (1975): American Freedom, American Slavery: The Ordeal of Colo-nial Virginia, W. W. Norton, New York.
Nash, G. B. (1979): The Urban Crucible: Social Change, Political Consciousness,and the Origins of the American Revolution, Harvard University Press Cambridge,Mass.
North, D. C. and B. R. Weingast (1989): “Constitutions and Commitment:The Evolution of Institutions Governing Public Choice in Seventeenth-CenturyEngland,” The Journal of Economic History, 49, 803–832.
Nunn, N. and N. Qian (2011): “The Potato’s Contribution to Population andUrbanization: Evidence From A Historical Experiment,” The Quarterly Journalof Economics, 126, 593–650.
Olasiji, T. D. (1995): Migrants, Immigrants, and Slaves: Racial and EthnicGroups in America, University Press of America.
Olson, M. (2000): Power and Prosperity: Outgrowing Capitalist and CommunistDictatorships, New York: Basic Books.
Pande, R. and C. Udry (2005): “Institutions and Development: A View fromBelow,” Proceedings of the 9th Congress of the Econometric Society.
Perry, R. and J. Cooper (1959): Sources of Our Liberties: Documentary Ori-gins of Individual Liberties in the United States Constitution and Bill of Rights,American Bar Foundation Series, New York University Press.
Pritchett, L. (1997): “Divergence, big time,” Journal of economic perspectives,11, 3–18.
Przeworski, A. (2009): “Conquered or granted? A history of suffrage extensions,”British Journal of Political Science, 39, 291–321.
Purvis, T. L. (1999): Colonial America to 1763, Infobase Publishing.
Purvis, T. L. and R. Balkin (1995): Revolutionary America, 1763 to 1800, Factson File.
Rabushka, A. (2002): “The Colonial Roots of American Taxation, 1607-1700,”Policy Review, 114, 155–183.
49

——— (2010): Taxation in Colonial America, Princeton University Press.
Ramcharan, R. (2010): “Inequality and Redistribution: Evidence from US Coun-ties and States, 1890-1930,” The Review of Economics and Statistics, 92, 729–744.
Raper, C. L. (1904): North Carolina: a study in English colonial government,Macmillan Company: London, Macmillan & Company, Limited.
Risch, E. (1937): “Encouragement of Immigration: As Revealed in Colonial Legis-lation,” The Virginia Magazine of History and Biography, 45, 1–10.
Rosenbloom, J. (2008): “Indentured Servitude in the Colonial U.S.” in EH.NetEncyclopedia, ed. by edited by Robert Whaples, .
Rusk, J. G. (2001): A Statistical History of the American Electorate, University ofChicago.
Salley, A. S. (1959): Narratives of Early Carolina, 1650-1708, Barnes & Noble.
Smith, A. E. (1971): Colonists in Bondage: White Servitude and Convict Labor inAmerica 1607-1776, W. W. Norton, New York.
Sowell, T. (2013): Black Rednecks & White Liberals, Encounter Books.
Surrency, E. C. (1967): “The Courts in the American Colonies,” The AmericanJournal of Legal History, 11, 347–376.
United States Bureau of the Census (1975): Historical Statistics of the UnitedStates, Colonial Times to 1970, US Department of Commerce, Bureau of theCensus, US Government Printing Office.
Vanhanen, T. (2002): Prospects of Democracy: A Study of 172 Countries, Rout-ledge.
Villaflor, G. C. and K. L. Sokoloff (1982): “Migration in colonial America:Evidence from the militia muster rolls,” Social Science History, 6, 539–570.
Ward, H. M. (1991): Colonial America, 1607-1763, Pearson College Division.
Weinberg, M. (2003): A Short History of American Capitalism, New HistoryPress.
Wells, R. V. (1975): The Population of the British Colonies in America before1776: A Survey of Census Data, Princeton University Press Princeton.
Welzel, C. and R. Inglehart (2007): “Mass Beliefs and Democratic Institu-tions,” in The Oxford Handbook of Comparative Politics, Oxford University Press.
Wertenbaker, T. J. (1922): The Planters of Colonial Virginia, Princeton Uni-versity Press.
West, R. C. (1978): “Money in the colonial American economy,” Economic In-quiry, 16, 1–15.
50

Online Appendix (not for publication)
This online appendix consists of four parts. Part 1 presents additional figures and
tables. Part 2 presents additional robustness checks. Part 3 presents a detailed
description of the data used in the regressions (to complement the discussion in the
main text). Part 4 presents historical evidence.
51

Part 1: Additional figures and tables
52

Table A1: Summary statistics
Before 1700 After 1700
North South Difference N North N South North South Difference N North N South
Suffrage 3.066 4.331 -1.265*** 130 73 4.159 2.642 1.518*** 200 100(1.502) (1.092) (0.769) (1.078)
Inequality 0.264 0.301 -0.037** 79 45 0.246 0.358 -0.112*** 200 100(%white landless) (0.122) (0.041) (0.083) (0.070)Labour 0.037 0.096 -0.059*** 130 73 0.057 0.355 -0.298*** 200 100(%black) (0.034) (0.104) (0.041) (0.182)Crop Index -0.195 -0.331 0.136*** 116 60 -0.161 -0.042 -0.119*** 200 100
(0.123) (0.043) (0.109) (0.103)Population density 1.503 0.633 0.870*** 130 73 10.182 4.626 5.556*** 200 100
(1.693) (0.694) (10.638) (4.809)Urbanization 0.158 0.050 0.108*** 130 73 0.092 0.039 0.053*** 200 100
(0.221) (0.141) (0.106) (0.077)Proprietary col. 0.421 0.580 -0.159** 130 73 0.253 0.350 -0.097* 200 100
(0.490) (0.494) (0.435) (0.475)Charter col. 0.331 0.027 0.303*** 130 73 0.250 0.000 0.250*** 200 100
(0.472) (0.164) (0.434) (0.000)Royal col. 0.246 0.384 -0.137** 130 73 0.495 0.650 -0.155*** 200 100
(0.432) (0.490) (0.501) (0.479)
Sources: See text. Notes: This table shows means and standard variations of relevant variables by time period and region.The panel is obtained by taking three-year averages. The “Difference”-columns give the difference in means between Northand South for the respective period and the significance based on a simple t-test. Standard errors are in parentheses. ***p ≤0.01,**p ≤ 0.05, *p ≤ 0.1.
53

Table A2: Estimated share of blacks in the South, 1610-1780
Year Virginia Maryland North Carolina South Carolina Georgia
1610 0.00%1620 0.91%1630 2.00%1640 1.44% 3.43%1650 2.16% 6.66%1660 3.52% 9.00% 2.00%1670 5.66% 9.00% 3.90% 15.00%1680 6.88% 9.00% 3.87% 16.67%1690 17.62% 9.00% 3.95% 38.46%1700 27.99% 10.90% 3.87% 47.92%1710 25.97% 18.59% 5.95% 55.34%1720 30.26% 18.90% 14.10% 64.54%1730 30.35% 18.90% 20.00% 66.67%1740 33.25% 20.70% 21.25% 72.32% 0.00%1750 45.25% 30.80% 27.13% 66.22% 19.23%1760 41.38% 30.20% 30.38% 60.95% 37.36%1770 41.97% 31.50% 35.29% 60.51% 45.45%1780 41.00% 33.47% 33.69% 53.89% 37.15%
Source: Historical Statistics of the US Millennial Edition Online (2006), Table Eg1-59.
Notes: This table shows the growth of the black population in the South. Slavery was
forbidden in Georgia until 1749.
54

Figure A1: Colonial British America in 1763
55

Figure A2: Correlation between the suffrage index (including restrictions for race)and suffrage extensiveness
CTCTCTCTCT
GA
MA MA MA
MDMD MD
NC
NH
NHNH
NJNJNJ NJ
NYNY NY NY
NY
PARI RI
SC
VAVA
01
23
45
Suf
frag
e-w
ith r
acia
l res
tric
tions
.2 .4 .6 .8 1Extent of suffrage
restrictions_all_racial_max Fitted values
Sources: McKinley (1905) and Dinkin (1977). Notes: This figure presents the correlation between
suffrage (including restrictions for race) and fragmentary suffrage extensiveness numbers for the
period 1730-1775. A higher value of suffrage implies a more liberal political system.
56

Figure A3: Correlation between the suffrage index (excluding restrictions for race)and suffrage extensiveness
CTCTCTCTCT
GA
MA MA MA
MDMD MD
NC
NH
NHNH
NJNJNJ NJ
NYNY NY NY
NY
PARI RI
SC
VAVA
01
23
45
Suf
frag
e-w
ithou
t rac
ial r
estr
ictio
ns
.2 .4 .6 .8 1Extent of suffrage
restrictions_all_max Fitted values
Sources: McKinley (1905) and Dinkin (1977). Notes: This figure presents the correlation between
suffrage (excluding restrictions for race) and fragmentary suffrage extensiveness numbers for the
period 1730-1775. A higher value of suffrage implies a more liberal political system.
57

Figure A4: Sex ratio and the suffrage
010
020
030
040
050
0
Sex
rat
io: M
en p
er 1
00 w
omen
1 2 3 4 5 6Suffrage
Sex ratio Sex ratio fit
-VA – 1624
?
CT – before 1700
Sources: Wells (1975) and Moller (1945). Notes: This graph shows the relationship between
suffrage and the sex ratio for selected Northern and Southern colonies over time. The sex ratio is
calculated as the number of men per 100 women. The solid line is obtained by locally weighted
least squares smoothing over all observations.
58

Figure A5: Life expectancy and the suffrage - South
VA1665-1699
VA1650-1710
VA18th century
NC1661-1699
NC1700-1739
MD1618-1649
MD1650-1699
MD1700-1749
MD1750-1800
SC1650-1699
SC1700-1749
SC1750-1800
1015
2025
30Li
fe e
xpec
tanc
y
1 2 3 4 5Suffrage
Life expectancy Life expectancy linear fit
Sources: Galenson (1996) and Purvis (1999). Notes: This graph shows the relationship between
suffrage and life expectancy for selected Southern colonies. Life expectancy is male life expectancy
at age 30. The solid line is obtained by a linear fit.
59

Figure A6: Suffrage and labour markets within the North (Middle colonies)
0.5
0.5
02
46
02
46
1650 1700 1750 18001650 1700 1750 1800
Delaware New Jersey
New York Pennsylvania
Suffrage Labour (% black)
Labo
ur
Suf
frag
e
Year
Sources: see text. Notes: This graph shows how suffrage and labour markets evolved over time for
each of the Middle colonies.
60
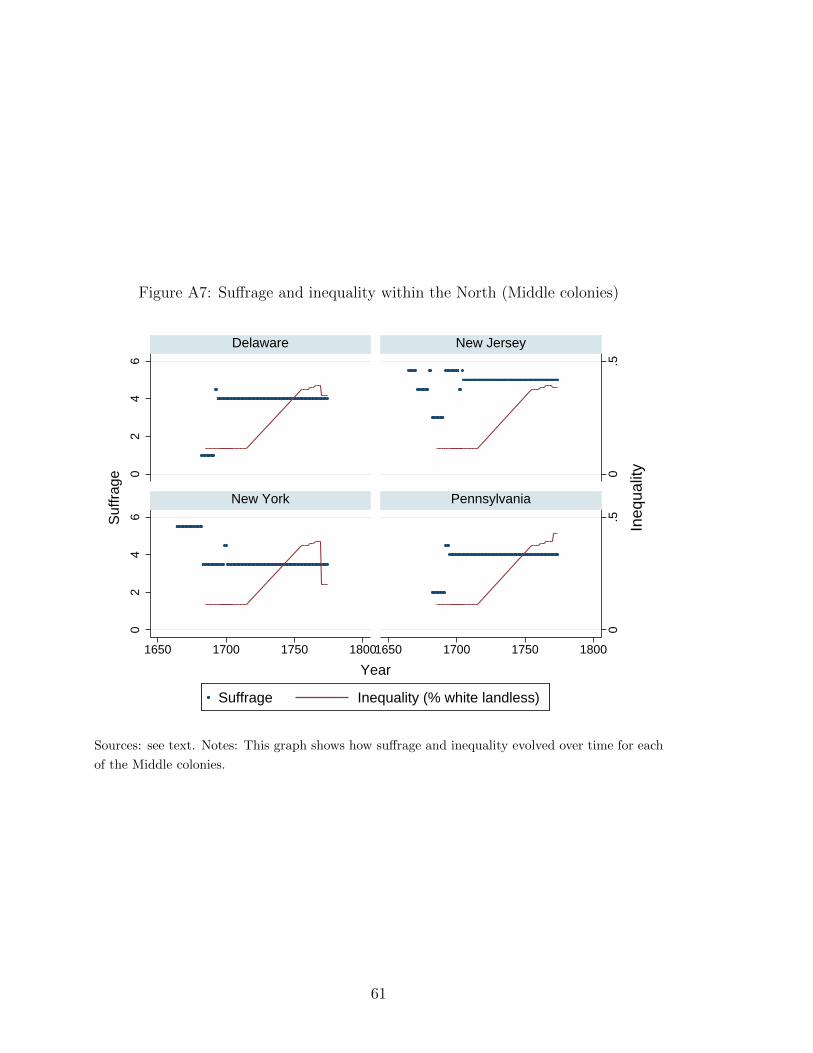
Figure A7: Suffrage and inequality within the North (Middle colonies)
0.5
0.5
02
46
02
46
1650 1700 1750 18001650 1700 1750 1800
Delaware New Jersey
New York Pennsylvania
Suffrage Inequality (% white landless)
Ineq
ualit
y
Suf
frag
e
Year
Sources: see text. Notes: This graph shows how suffrage and inequality evolved over time for each
of the Middle colonies.
61

Figure A8: Suffrage and labour markets within the North (New England colonies)
0.5
0.5
02
46
02
46
1650 1700 1750 1800 1650 1700 1750 1800
Connecticut Massachusetts
New Hampshire Rhode Island
Suffrage Labour (% black)
Labo
ur
Suf
frag
e
Year
Sources: see text. Notes: This graph shows how suffrage and labour markets evolved over time for
each of the New England colonies.
62

Figure A9: Suffrage and inequality within the North (New England colonies)
0.5
0.5
02
46
02
46
1650 1700 1750 1800 1650 1700 1750 1800
Connecticut Massachusetts
New Hampshire Rhode Island
Suffrage Inequality (% white landless)
Ineq
ualit
y
Suf
frag
e
Year
Sources: see text. Notes: This graph shows how suffrage and inequality evolved over time for each
of the New England colonies.
63
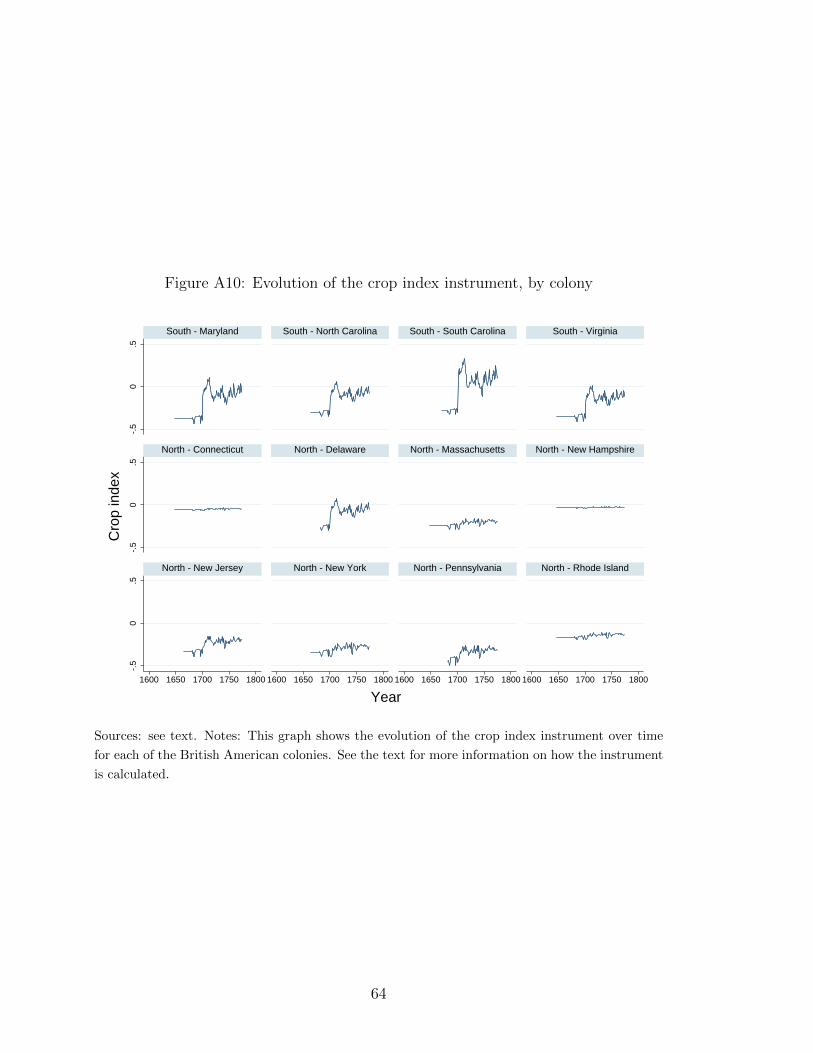
Figure A10: Evolution of the crop index instrument, by colony
-.5
0.5
-.5
0.5
-.5
0.5
1600 1650 1700 1750 1800 1600 1650 1700 1750 1800 1600 1650 1700 1750 1800 1600 1650 1700 1750 1800
South - Maryland South - North Carolina South - South Carolina South - Virginia
North - Connecticut North - Delaware North - Massachusetts North - New Hampshire
North - New Jersey North - New York North - Pennsylvania North - Rhode Island
Cro
p in
dex
Year
Sources: see text. Notes: This graph shows the evolution of the crop index instrument over time
for each of the British American colonies. See the text for more information on how the instrument
is calculated.
64

Figure A11: Price series for tobacco, rice and wheat (English pence per pound)
(a) Tobacco – Virginia
0
0.5
1
1.5
2
2.5
3
1647 1653 1659 1665 1671 1677 1683 1689 1695 1701 1707 1713 1719 1725 1731 1737 1743 1749 1755 1761 1767 1773
En
glis
h p
ence
per
pou
nd
(b) Rice – Charleston, South Carolina
0
0.2
0.4
0.6
0.8
1
1.2
1.4
1.6
1.8
1647
1653
1659
1665
1671
1677
1683
1689
1695
1701
1707
1713
1719
1725
1731
1737
1743
1749
1755
1761
1767
1773
En
glis
h p
ence
per
pou
nd
65

(c) Wheat – Talbot County, Maryland
0
0.1
0.2
0.3
0.4
0.5
0.6
0.7
0.8
0.9
1647
1652
1657
1662
1667
1672
1677
1682
1687
1692
1697
1702
1707
1712
1717
1722
1727
1732
1737
1742
1747
1752
1757
1762
1767
1772
En
glis
h p
ence
per
pou
nd
Sources: Historical Statistics of the US Millennial Edition Online (2006) and Purvis (1999). Notes:
These graphs show the price movements for the three main export crops of colonial British America.
66
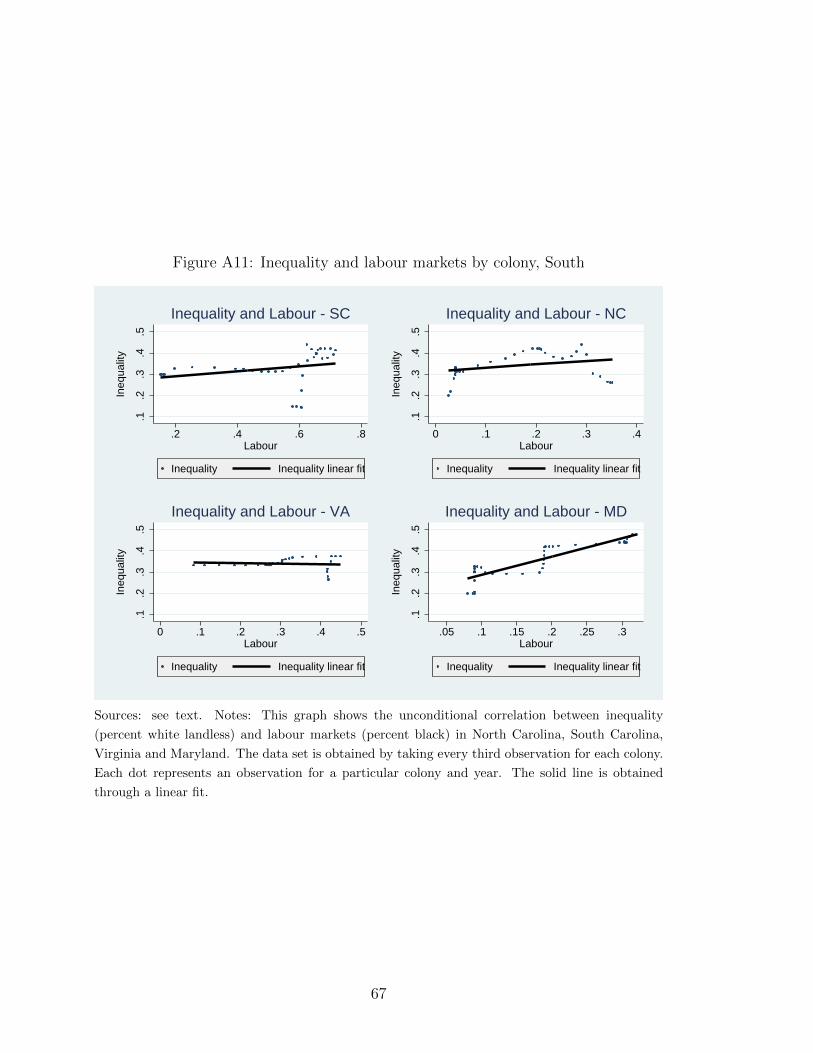
Figure A11: Inequality and labour markets by colony, South
.1.2
.3.4
.5
Ineq
ualit
y
.2 .4 .6 .8Labour
Inequality Inequality linear fit
Inequality and Labour - SC
.1.2
.3.4
.5
Ineq
ualit
y
0 .1 .2 .3 .4Labour
Inequality Inequality linear fit
Inequality and Labour - NC
.1.2
.3.4
.5
Ineq
ualit
y
0 .1 .2 .3 .4 .5Labour
Inequality Inequality linear fit
Inequality and Labour - VA
.1.2
.3.4
.5
Ineq
ualit
y
.05 .1 .15 .2 .25 .3Labour
Inequality Inequality linear fit
Inequality and Labour - MD
Sources: see text. Notes: This graph shows the unconditional correlation between inequality
(percent white landless) and labour markets (percent black) in North Carolina, South Carolina,
Virginia and Maryland. The data set is obtained by taking every third observation for each colony.
Each dot represents an observation for a particular colony and year. The solid line is obtained
through a linear fit.
67

Figure A12: Inequality and labour markets - South
MDMDMDMD
MD
MDMDMDMDMDMDMDMDMD
MDMDMDMDMD
MD
MD
MD
MD
MD
MDMDMDMDMDMD MD MDMDMDMDMDMDMDMDMD
NC
NC
NC
NCNCNCNCNCNCNCNCNCNCNCNCNC
NCNC
NCNC
NCNC
NCNCNCNCNC
NCNCNC
NC
NC
NC
NCNC
NCNCNC
SCSCSCSC
SC SC SC SC SC SC SCSCSC SCSC
SCSC
SCSCSCSCSCSCSC
SCSCSC
SC
SC
SC
SC
SC
SCSCSCSC
VA VA VA VA VA VA VAVAVAVAVAVAVAVAVAVAVAVAVAVA VA VA VA VAVA
VA
VAVA
VAVAVA
VA
.1.2
.3.4
.5
Ineq
ualit
y
0 .2 .4 .6 .8Labour
Inequality Inequality linear fit
Sources: see text. Notes: This graph shows the unconditional correlation between inequality
(percent white landless) and labour markets (percent black) in the South. The data set is obtained
by taking every third observation for each colony. Each dot represents an observation for a particular
colony and year. The solid line is obtained through a linear fit.
68

Figure A13: Inequality and labour markets - North and South
CTCTCTCTCT
CT
CT
CT
CT
CT
CT
CT
CTCTCTCTCTCTCTCTCTCTCTCTCTCTCTCTCTCTCTCTCT
CT
CT
CT
CT
CT
CTCTCT
CTCT
DEDEDEDEDEDEDE DE DEDEDE
DE
DE
DE
DE
DE
DE
DE
DE
DE
DE
DE
DE
DEDEDEDEDEDE
DEDE
MAMAMAMAMAMAMAMAMAMAMAMAMAMAMAMAMAMAMAMA
MA
MAMAMAMAMAMAMA
MA
MA
MA
MDMDMDMD
MD
MDMDMDMDMDMDMDMDMD
MDMDMDMDMD
MD
MD
MD
MD
MD
MDMDMDMDMDMD MD MDMDMDMDMDMDMDMDMD
NC
NC
NC
NCNCNCNCNCNCNCNCNCNCNCNCNC
NCNC
NCNC
NCNC
NCNCNCNCNC
NCNCNC
NC
NC
NC
NCNC
NCNCNC
NHNHNHNHNHNHNHNHNHNHNH
NH
NH
NH
NHNHNHNHNHNHNHNHNHNHNHNHNHNHNHNH
NH
NH
NH
NHNHNH
NH
NHNHNH
NHNH
NJNJNJNJNJNJNJNJNJNJNJ
NJ
NJ
NJ
NJ
NJ
NJ
NJ
NJ
NJ
NJ
NJ
NJ
NJNJNJNJNJNJNJ
NYNYNYNYNYNYNYNYNYNYNY
NY
NY
NY
NY
NY
NY
NY
NY
NY
NY
NY
NY
NYNYNYNYNY
NY
NY
PAPAPAPAPAPAPAPAPAPAPA
PA
PA
PA
PA
PA
PA
PA
PA
PA
PA
PA
PA
PAPAPAPAPAPA
PA
RIRIRIRIRIRIRIRIRIRIRIRIRI
RI
RIRIRIRIRIRIRIRIRIRIRIRIRIRI
RI
RIRIRI
RI
RIRIRI
RI
RIRIRIRI
RISCSCSCSC
SC SC SC SC SC SC SCSCSC SCSC
SCSC
SCSCSCSCSCSCSC
SCSCSC
SC
SC
SC
SC
SC
SCSCSCSC
VA VA VA VA VA VA VAVAVAVAVAVAVAVAVAVAVAVAVAVA VA VA VA VAVA
VA
VAVA
VAVAVA
VA
.1.2
.3.4
.5
Ineq
ualit
y
0 .2 .4 .6 .8Labour
Inequality Inequality linear fit
Sources: see text. Notes: This graph shows the unconditional correlation between inequality
(percent white landless) and labour markets (percent black) in the entire sample. The data set is
obtained by taking every third observation for each colony. Each dot represents an observation for
a particular colony and year. The solid line is obtained through a linear fit.
69
Part 2: Additional threats to validity and robustness checks
The importance of the Scotch-Irish
There are several reasons why the tightening of the Southern franchise in the early
eighteenth century is unlikely to have been prompted by the Scotch-Irish migration
wave of 1717-1775. First, the Scotch-Irish were never a majority of the population:
even in South Carolina, the colony with the greatest share of Scotch-Irish settlers,
they were only 18.9% of the total population in 1790. Second, as Figures 1 and 2
show, the tightening of the Southern franchise took place before 1717. Moreover, a
great number of Scotch-Irish settlers also arrived in Pennsylvania, Delaware and New
York, yet the franchise in these colonies followed a very different pattern compared
to that in the South.
Even so, I test to what extent my results are influenced by Scotch-Irish migration
patterns in Table A5. In column 5, I include a variable which interacts a dummy
for the period 1717-1775 with dummies for those colonies in which the share of
the Scotch-Irish population was above 10% in 1790 (PA, MD, VA, NC and SC). In
column 6, I instead consider colonies where the percentage of the Scotch-Irish was
above 8% (all of the previous colonies, as well as DE, ME and NY). In both cases, the
coefficient on labour is negative, significant and similar in magnitude as compared
to the estimates in the baseline specification.
Racially motivated conflicts
A final scenario is that elites opted to tighten the suffrage in colonies with large
black populations not because they no longer needed to attract white labourers, but
in order to pre-empt conflicts along racial lines. First, it is possible that colonies
that depended on slavery also had diverse white populations, which found it harder
to agree on the design of political regimes and therefore ended up with more author-
70

itarian institutions (Alesina et al., 1999). I deal with this possibility by including
controls for the ethnic and religious fractionalisation of the white population in 1790
in Table A5. I collect colony-level data on the ancestral origins of the white popula-
tion in 1790 and on the distribution of different types of churches in 1750, from which
I calculate Herfindahl-Hirschman Index-type indices of ethnic fractionalisation and
religious fractionalisation and include those in the regressions (columns 1-4). Be-
cause these variables are fixed over time, I am unable to include colony fixed effects
and instead only control for latitude in the regressions. If the colonies were highly
divided on these dimensions, it could have been more difficult for actors to coordinate
on the democratic outcome, and more autocratic institutions would have emerged
(Alesina et al. 1999 and Easterly and Levine 1997).27 The coefficients on ethnic
fractionalisation and religious fractionalisation are mostly insignificant and unstable
across regression aggregations, without affecting the significance and magnitude of
the coefficients on the rest of the variables.
Alternatively, it is also possible that Southern elites adopted a less democratic
political system after the arrival of slavery due to fears that new white settlers
may try to abolish the institution of slavery. However, with the exception of a
few Quaker activists who had limited success in persuading other Quakers to stop
using slaves, abolitionist sentiments were rare during colonial times, and slaveholders
dominated political life both before and after 1775. Last, there is little evidence that
Southern elites tightened the suffrage after the arrival of slavery in order to to prevent
joint white-black rebellions. In fact, the colonies experienced few insurrections in
the eighteenth century, and most of them involved blacks rebelling against whites
(Harrold, 2001; Olasiji, 1995).
27The correlation between these two measures is 0.87.
71

Additional robustness checks
In Table A3, I experiment with alternative definitions of the dependent variable.
First, suffrage is non-negative and censored above by 6.5, so I present a Tobit regres-
sion in column (1). In columns 2-3, I run regressions with an annual panel which also
includes all observations. In the last two columns, I run a specification which only
keeps those restrictions on the suffrage that were identified as important by Dinkin
(1977).28 The coefficients in these specification are in line with those in Table 1,
while the impact of inequality is slightly weaker.
In Table A4, I present additional aggregations of the suffrage index. I try different
weighting schemes in columns (1-4): no accounting for substitutability among restric-
tions (columns 1-2) as well as an alternative substitutability weighting (columns 3-4).
I also calculate the suffrage index using principal component analysis on each suffrage
restriction (columns 5-6). Last, in columns (7)-(8), I present a specification where
suffrage is recoded as 1 if there are restrictions related to any of the following cate-
gories: income, freeholding, the existence of minimum freeholding or property, tax,
residency or religion; and is 0 otherwise. The OLS and 2SLS coefficients on labour
in columns (7) and (8) are much smaller in magnitude - likely because all of these
restrictions matter in determining the quality of colonial representative institutions.
In Table A6, I show that the baseline results are robust to dropping the colony
fixed effects (columns 1-2), the lagged dependent variable (columns 3-4), both (columns
5-6), and to using a ten-year average panel (column 7). Not surprisingly, results are
much stronger when the lagged dependent variable is excluded. In Tables A7 and
A8, I show that the results change little when (1) inequality is dropped from the
regressions and (2) when different independent variables are excluded from the 2SLS
specifications.
28Suffrage Dinkin drops the restrictions for: freemanship, formal patenting of lands, household-
ing, and being a good person.
72

Table A3: Suffrage in the 13 colonies: Robustness checks 2
(1) (2) (3) (4) (5)Tobit OLS
All obs &years
2SLSAll obs &
year
OLSSuffrageDinkin
2SLSSuffrageDinkin
Lagged Suffrage 0.806∗∗∗ 0.870∗∗∗ 0.866∗∗∗ 0.790∗∗∗ 0.775∗∗∗
(0.0407) (0.0330) (0.0378) (0.0440) (0.0626)
Labour (%black) −1.977∗∗∗ −1.141∗∗∗ −1.318∗ −1.615∗∗∗ −2.056(0.578) (0.321) (0.688) (0.445) (1.337)
Inequality (%white l.less) −0.681∗∗ −0.255 −0.257 −0.464∗ −0.465∗
(0.322) (0.173) (0.175) (0.244) (0.239)
Urbanisation 0.207 0.136 0.132 0.190 0.185(0.273) (0.0982) (0.0976) (0.202) (0.192)
Population density 0.00712 0.00431 0.00392 0.00412 0.00355(0.00617) (0.00317) (0.00320) (0.00527) (0.00530)
Year control X X X X X
Colony fixed effects X X X X X
Additional controls X X X X X
Observations 412 1316 1316 412 412Mean suffrage 3.633 3.543 3.543 3.491 3.491R2 0.868 0.885 0.885 0.841 0.841
First-Stage ResultsInstrument Coefficient 0.299∗ ∗ ∗ 0.280∗ ∗ ∗
(0.025) (0.044)1st stage R2 0.918 0.928
Sources: See text. Notes: This table shows results from OLS, 2SLS and Tobit regressions explaining the suffrage inthe 13 British American colonies (robustness checks). All independent variables are lagged by one period (three yearsfor columns 1; 2-5; one year for columns 2-3). A linear trend is used as “Year control”. Additional controls include adummy for when each colony was proprietary or charter (with royal as omitted category). Robust standard errors arein parentheses. ***p ≤ 0.01,**p ≤ 0.05, *p ≤ 0.1.
73
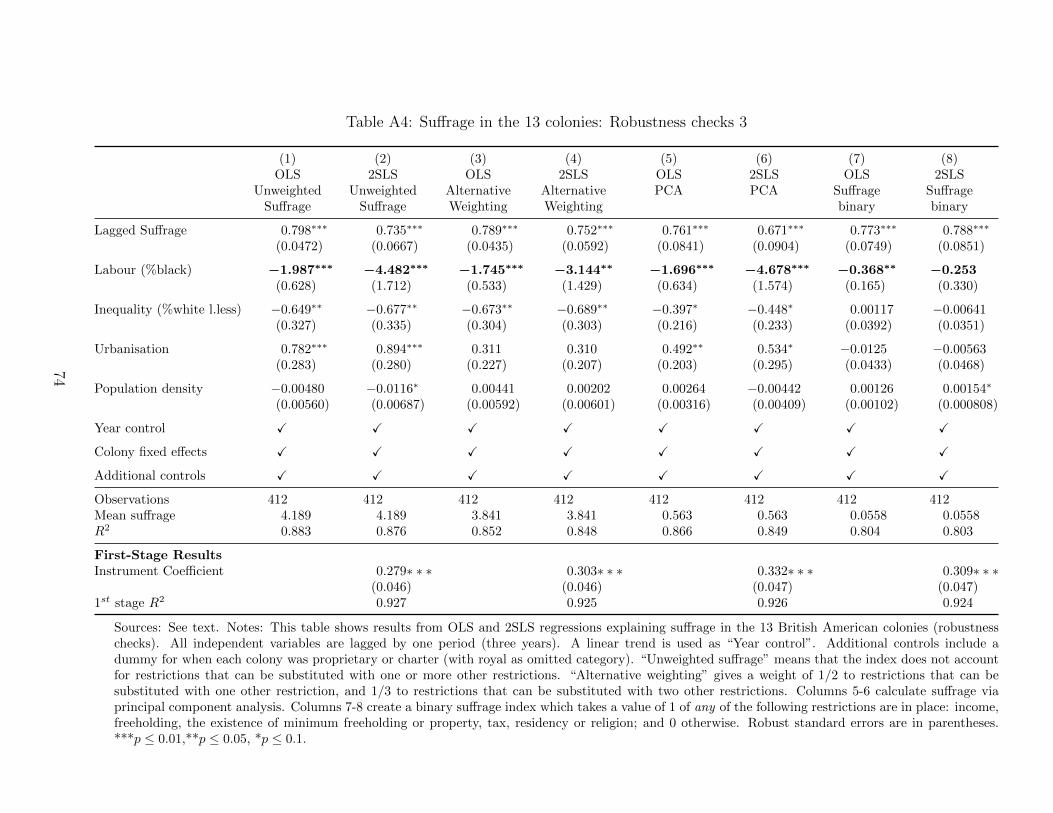
Table A4: Suffrage in the 13 colonies: Robustness checks 3
(1) (2) (3) (4) (5) (6) (7) (8)OLS
UnweightedSuffrage
2SLSUnweighted
Suffrage
OLSAlternativeWeighting
2SLSAlternativeWeighting
OLSPCA
2SLSPCA
OLSSuffragebinary
2SLSSuffragebinary
Lagged Suffrage 0.798∗∗∗ 0.735∗∗∗ 0.789∗∗∗ 0.752∗∗∗ 0.761∗∗∗ 0.671∗∗∗ 0.773∗∗∗ 0.788∗∗∗
(0.0472) (0.0667) (0.0435) (0.0592) (0.0841) (0.0904) (0.0749) (0.0851)
Labour (%black) −1.987∗∗∗ −4.482∗∗∗ −1.745∗∗∗ −3.144∗∗ −1.696∗∗∗ −4.678∗∗∗ −0.368∗∗ −0.253(0.628) (1.712) (0.533) (1.429) (0.634) (1.574) (0.165) (0.330)
Inequality (%white l.less) −0.649∗∗ −0.677∗∗ −0.673∗∗ −0.689∗∗ −0.397∗ −0.448∗ 0.00117 −0.00641(0.327) (0.335) (0.304) (0.303) (0.216) (0.233) (0.0392) (0.0351)
Urbanisation 0.782∗∗∗ 0.894∗∗∗ 0.311 0.310 0.492∗∗ 0.534∗ −0.0125 −0.00563(0.283) (0.280) (0.227) (0.207) (0.203) (0.295) (0.0433) (0.0468)
Population density −0.00480 −0.0116∗ 0.00441 0.00202 0.00264 −0.00442 0.00126 0.00154∗
(0.00560) (0.00687) (0.00592) (0.00601) (0.00316) (0.00409) (0.00102) (0.000808)
Year control X X X X X X X X
Colony fixed effects X X X X X X X X
Additional controls X X X X X X X X
Observations 412 412 412 412 412 412 412 412Mean suffrage 4.189 4.189 3.841 3.841 0.563 0.563 0.0558 0.0558R2 0.883 0.876 0.852 0.848 0.866 0.849 0.804 0.803
First-Stage ResultsInstrument Coefficient 0.279∗ ∗ ∗ 0.303∗ ∗ ∗ 0.332∗ ∗ ∗ 0.309∗ ∗ ∗
(0.046) (0.046) (0.047) (0.047)1st stage R2 0.927 0.925 0.926 0.924
Sources: See text. Notes: This table shows results from OLS and 2SLS regressions explaining suffrage in the 13 British American colonies (robustnesschecks). All independent variables are lagged by one period (three years). A linear trend is used as “Year control”. Additional controls include adummy for when each colony was proprietary or charter (with royal as omitted category). “Unweighted suffrage” means that the index does not accountfor restrictions that can be substituted with one or more other restrictions. “Alternative weighting” gives a weight of 1/2 to restrictions that can besubstituted with one other restriction, and 1/3 to restrictions that can be substituted with two other restrictions. Columns 5-6 calculate suffrage viaprincipal component analysis. Columns 7-8 create a binary suffrage index which takes a value of 1 of any of the following restrictions are in place: income,freeholding, the existence of minimum freeholding or property, tax, residency or religion; and 0 otherwise. Robust standard errors are in parentheses.***p ≤ 0.01,**p ≤ 0.05, *p ≤ 0.1.
74

Table A5: Suffrage in the 13 colonies: Robustness checks 4
(1) (2) (3) (4) (5) (6)OLS
Ethnic fract.2SLS
Ethnic fract.OLS
Rel. fract.2SLS
Rel. fract.OLS
Scotch-Irish2SLS
Scotch-Irish
Lagged Suffrage 0.820∗∗∗ 0.821∗∗∗ 0.820∗∗∗ 0.822∗∗∗ 0.750∗∗∗ 0.743∗∗∗
(0.0361) (0.0442) (0.0361) (0.0449) (0.0486) (0.0497)
Labour (%black) −1.314∗∗∗ −1.263 −1.318∗∗∗ −1.265 −1.347∗∗ −2.879∗
(0.444) (0.780) (0.443) (0.850) (0.584) (1.702)
Inequality (%white l.less) −0.663∗∗ −0.665∗∗ −0.651∗∗ −0.653∗∗ −0.812∗∗ −0.850∗∗
(0.286) (0.276) (0.289) (0.278) (0.333) (0.336)
Ethnic fractionalization −0.0720 −0.0691(0.183) (0.190)
Religious fractionalization −0.0697 −0.0669(0.122) (0.132)
Urbanisation −0.0148 −0.0223 −0.0371 −0.0440 −0.00505 −0.0262(0.159) (0.171) (0.164) (0.170) (0.246) (0.243)
Population density 0.00324 0.00325 0.00310 0.00312 0.00886 0.00815(0.00430) (0.00422) (0.00414) (0.00405) (0.00656) (0.00640)
Year control X X X X X X
Colony fixed effects X X
Additional controls X X X X X X
Scotch-Irish migration trends X X
Observations 412 412 412 412 412 412Mean suffrage 3.633 3.633 3.633 3.633 3.633 3.633R2 0.841 0.841 0.841 0.841 0.848 0.846
First-Stage ResultsInstrument Coefficient 0.394∗ ∗ ∗ 0.332∗ ∗ ∗ 0.249∗ ∗ ∗
(0.042) (0.040) (0.048)1st stage R2 0.825 0.818 0.952
Sources: See text. Notes: This table shows results from OLS and 2SLS regressions explaining suffrage inthe 13 British American colonies (robustness checks). All independent variables are lagged by one period(three years). A linear trend is used as “Year control”. Additional controls include a dummy for wheneach colony was proprietary or charter (with royal as omitted category). Robust standard errors are inparentheses. ***p ≤ 0.01,**p ≤ 0.05, *p ≤ 0.1.
75

Table A6: Suffrage in the 13 colonies: Robustness checks 5
(1) (2) (3) (4) (5) (6) (7)OLS
No FEs2SLS
No FEsOLS
No LaggedDep. Var
2SLSNo LaggedDep. Var
OLSNo LaggedDep. VarNo FEs
2SLSNo LaggedDep. VarNo FEs
OLS10 year avg.
Lagged Suffrage 0.820∗∗∗ 0.817∗∗∗ 0.493∗∗∗
(0.0360) (0.0484) (0.0906)
Labour (%black) −1.307∗∗∗ −1.404 −7.449∗∗∗ −11.05∗∗∗ −5.962∗∗∗ −6.943∗∗∗ −2.980∗∗
(0.439) (1.012) (0.679) (1.873) (0.549) (1.594) (1.231)
Inequality (%white l.less) −0.673∗∗ −0.670∗∗ −1.615∗∗∗ −1.523∗∗∗ −1.415∗∗∗ −1.340∗∗∗ −1.880∗∗∗
(0.285) (0.275) (0.512) (0.518) (0.477) (0.481) (0.656)
Urbanisation −0.000913 0.0146 1.190∗∗ 0.958∗ 0.482 0.652 −0.549(0.154) (0.196) (0.579) (0.535) (0.383) (0.414) (0.668)
Population density 0.00277 0.00271 0.0462∗∗∗ 0.0345∗∗ 0.0233∗∗∗ 0.0215∗∗ 0.00530(0.00406) (0.00398) (0.0129) (0.0136) (0.00850) (0.00857) (0.0151)
Latitude −0.0300 −0.0341 −0.150∗∗∗ −0.195∗∗∗
(0.0228) (0.0439) (0.0338) (0.0734)
Year control X X X X X X X
Colony fixed effects X X X
Additional controls X X X X X X X
Observations 412 412 412 412 412 412 123Mean suffrage 3.633 3.633 3.633 3.633 3.633 3.633 3.627R2 0.841 0.841 0.498 0.469 0.376 0.371 0.749
First-Stage ResultsInstrument Coefficient 0.248∗ ∗ ∗ 0.390∗ ∗ ∗ 0.311∗ ∗ ∗
(0.036) (0.053) (0.033)1st stage R2 0.803 0.915 0.764
Sources: See text. Notes: All independent variables are lagged by one period (three years for column 1 - 6, ten years for column 7).A linear trend is used as “Year control”. Additional controls include a dummy for when each colony was proprietary or charter (withroyal as omitted category). Robust standard errors are in parentheses. ***p ≤ 0.01,**p ≤ 0.05, *p ≤ 0.1.
76

Table A7: Suffrage in the 13 colonies: Main specification, without inequality (percent land-less)
(1) (2) (3) (4)OLS OLS 2SLS OLS
Inequalityabove median
Lagged Suffrage 0.785∗∗∗ 0.750∗∗∗ 0.824∗∗∗ 0.666∗∗∗
(0.0429) (0.0550) (0.0377) (0.0880)
Labour (%black) −1.149∗∗∗ −1.554∗∗ −1.730∗ −1.855∗∗∗
(0.226) (0.606) (0.947) (0.678)
Urbanisation 0.0478 0.395 0.309 1.065∗
(0.172) (0.296) (0.221) (0.557)
Population density 0.00216 0.0138 0.00493 0.0265(0.00552) (0.00942) (0.00619) (0.0209)
Year control X X X X
Colony fixed effects X X X
Additional controls X X X X
Observations 491 491 464 279Mean suffrage 3.618 3.618 3.594 3.497R2 0.766 0.775 0.843 0.737
First-Stage ResultsInstrument Coefficient 0.386∗ ∗ ∗
(0.045)1st stage R2 0.894
Sources: see text. Notes: This table shows results from OLS and 2SLS regressions explainingthe suffrage in the 13 British American colonies, excluding inequality (percent landless). Inde-pendent variables are lagged by one period (three years). Additional controls include a dummyfor when each colony was proprietary or charter (with royal as omitted category). A linear trendis used as “Year control”. Robust standard errors are in parentheses. ***p ≤ 0.01,**p ≤ 0.05,*p ≤ 0.1.
77

Table A8: Suffrage in the 13 colonies: different specifications of the IV estimating equation
(1) (2) (3) (4)2SLS
Baseline2SLS
No col. f.e.2SLS
No urb.pop.dens.
2SLSNo urb.,pop.dens.
ineq.
Lagged Suffrage 0.769∗∗∗ 0.816∗∗∗ 0.772∗∗∗ 0.829∗∗∗
(0.0529) (0.0494) (0.0532) (0.0377)
Labour (%black) −2.608∗∗ −1.121∗ −2.737∗∗ −1.802∗∗
(1.324) (0.672) (1.314) (0.918)
Inequality (%white l.less) −0.691∗∗ −0.516∗ −0.663∗∗
(0.316) (0.310) (0.317)
Urbanisation 0.140 −0.0475(0.223) (0.160)
Population density 0.00554 0.000966(0.00621) (0.00471)
Year control X X X X
Colony fixed effects X X X
Additional controls X X X X
Observations 412 412 412 464Mean suffrage 3.633 3.633 3.633 3.594R2 0.842 0.839 0.841 0.842
First-Stage ResultsInstrument Coefficient 0.320∗ ∗ ∗ 0.372∗ ∗ ∗ 0.325∗ ∗ ∗ 0.402∗ ∗ ∗
(0.046) (0.064) (0.046) (0.044)1st stage R2 0.924 0.509 0.923 0.893
Sources: see text. Notes: This table shows results from SLS regressions explaining the suffrage in the13 British American colonies, using different specifications of the IV estimating equation. Independentvariables are lagged by one period (three years). Additional controls include a dummy for when eachcolony was proprietary or charter (with royal as omitted category). A linear trend is used as “Yearcontrol”. Robust standard errors are in parentheses. ***p ≤ 0.01,**p ≤ 0.05, *p ≤ 0.1.
78
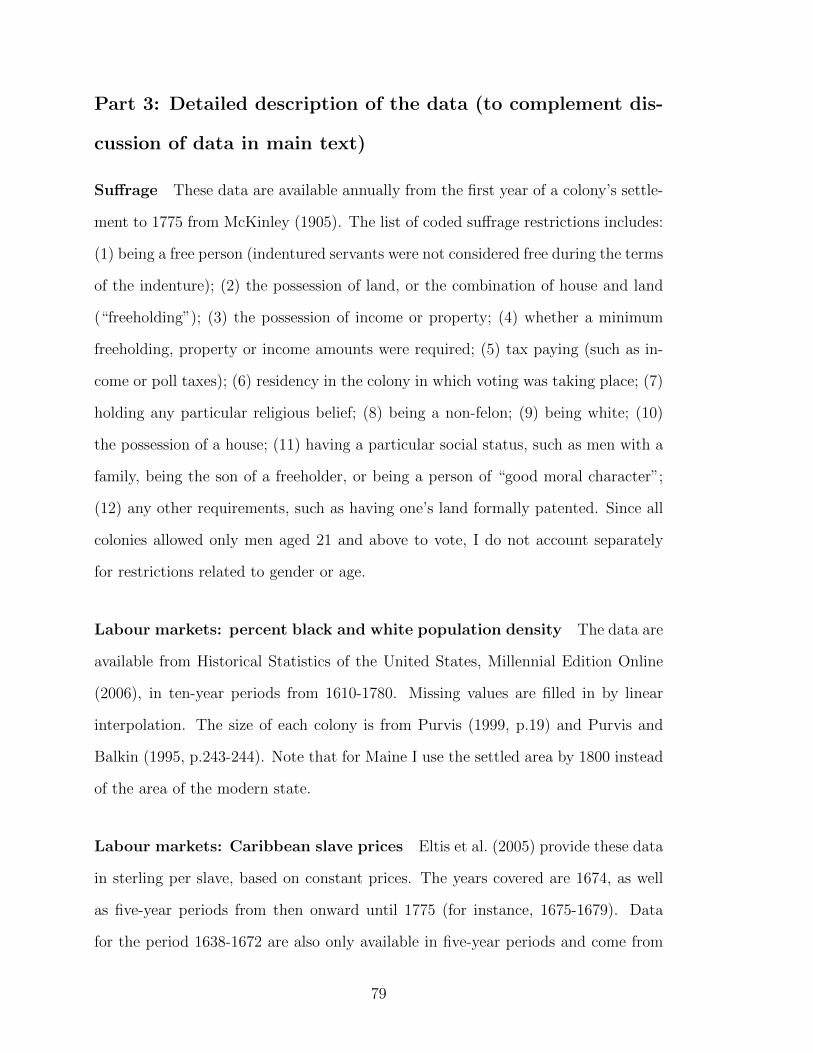
Part 3: Detailed description of the data (to complement dis-
cussion of data in main text)
Suffrage These data are available annually from the first year of a colony’s settle-
ment to 1775 from McKinley (1905). The list of coded suffrage restrictions includes:
(1) being a free person (indentured servants were not considered free during the terms
of the indenture); (2) the possession of land, or the combination of house and land
(“freeholding”); (3) the possession of income or property; (4) whether a minimum
freeholding, property or income amounts were required; (5) tax paying (such as in-
come or poll taxes); (6) residency in the colony in which voting was taking place; (7)
holding any particular religious belief; (8) being a non-felon; (9) being white; (10)
the possession of a house; (11) having a particular social status, such as men with a
family, being the son of a freeholder, or being a person of “good moral character”;
(12) any other requirements, such as having one’s land formally patented. Since all
colonies allowed only men aged 21 and above to vote, I do not account separately
for restrictions related to gender or age.
Labour markets: percent black and white population density The data are
available from Historical Statistics of the United States, Millennial Edition Online
(2006), in ten-year periods from 1610-1780. Missing values are filled in by linear
interpolation. The size of each colony is from Purvis (1999, p.19) and Purvis and
Balkin (1995, p.243-244). Note that for Maine I use the settled area by 1800 instead
of the area of the modern state.
Labour markets: Caribbean slave prices Eltis et al. (2005) provide these data
in sterling per slave, based on constant prices. The years covered are 1674, as well
as five-year periods from then onward until 1775 (for instance, 1675-1679). Data
for the period 1638-1672 are also only available in five-year periods and come from
79

United States Bureau of the Census (1975, p. 1174). Unfortunately, the latter data
are not adjusted for inflation, as the US-wide consumer price index (CPI) only starts
in 1665. Potential biases should be mitigated by the use of English pounds sterling,
which should absorb to some extent inflationary shocks to the domestic currency
(see also the discussion on the crop index IV below).
Labour markets: instrumental variable I compile the time-invariant crop
suitability weights from the Food and Agriculture Organization of the United Na-
tions Global Agro-Ecological Zones (GAEZ) 2010 database (FAO, accessed April 5,
2012).
Crop prices are from Historical Statistics of the United States, Millennial Edi-
tion Online (2006). Prices for tobacco are an average of the prices for all sweet-
scented Virginia tobacco, which are available annually for the period 1647-1775.
Missing years (1670, 1672 and 1673) are calculated via linear interpolation. The
regions included in the calculation of the tobacco prices include: York River Basin,
New Kent And King William Counties, Rappahannock River Basin, Potomac River
Basin, Hanover And Louisa Counties, and Virginia Piedmont.
Wheat prices cover the period 1680-1775. The data are annual, and those from
1680-1763 are from Purvis (1999, p.77) (covering Talbot County, Maryland), while
prices for 1763-1775 are from Historical Statistics of the United States, Millennial
Edition Online (2006) (calculated as an average of the prices in Maryland’s Eastern
and Western shores). Missing years (1689-1693; 1695) are filled via linear interpola-
tion. The 1680 prices are used to fill in the missing prices for the period 1647-1680.
Rice prices are available annually from 1701-1775 and cover Charleston, SC.
Exchange rate data. The crop prices are converted from local currency to
English pence per pound using exchange rate data from Historical Statistics of the
United States, Millennial Edition Online (2006). For Virginia, the data are available
80

for 1691, and then annually from 1708 to 1775. Years between 1691-1708 are filled
via linear interpolation, and the 1691 values are assumed to persist backward to 1647.
For Maryland, I use data on hard currency exchange rates, which are available for
the years 1702, 1709, as well as annually for the period 1715-1776. Missing values are
filled via linear interpolation, and the 1702 values are assumed to persist backward
to 1647. For South Carolina, the data are available annually for 1699-1775. The
1699 values are used to fill in the missing values for the period 1647-1699.
Since general price data are not available on a colony-by-colony basis (West,
1978), the crop prices are, unfortunately, not adjusted for inflation. To address this,
I adopt three approaches. First, as explained in the main text, when calculating
the crop index, I divide the suitability of growing rice or tobacco, multiplied by
the respective crop price, by the suitability of growing wheat, multiplied by its
price. As a result, each colony’s revenue earning potential for tobacco and rice is
calculated relative to price changes in wheat. Moreover, inflationary pressures during
the colonial era were relatively low, at least when the colonies were not at war. For
example, even in colonial New England, which was considered to have managed its
bills of credit relatively badly, inflation during peacetime was only 5% per annum.
In contrast, during wartime, such as King George’s war of 1744-1748, inflation in
New England was around 35% per year (Michener, 2003). To the extent that wars
were a shock common to all colonies, their effects should be captured by the time
fixed effects which I include in all regressions. In addition, colony and regional
trends should address the possibility that wars affected the price index in some
colonies (and regions) more disproportionately than in others (see the robustness
checks presented in Table 3). Finally, given the paucity of price indices that cover
both individual colonies as well as all colonies, the behaviour of the sterling exchange
rate should capture to a large extent fluctuations in the colonial currencies (personal
communication with Ron Michener, 20 March 2014).
81

Inequality: percent white landless I assemble the data set on the share of each
colony’s white male landless population from Kulikoff (1986, 2000), Main (1965),
and Nash (1979). Because the data are only available for certain years, I assign
colonies with missing values regional-level data whenever they are available, and fill
in any remaining missings via linear interpolation. The data set covers a total of
103 observations for the period 1655 to 1775, with around 15% of the observations
covering the period 1655-1710. While the sources generally give a particular year
for each landless data point, sometimes they are less precise, and I use my best
judgement to handle such cases. For instance, Kulikoff (2000) indicates that in the
early eighteenth century, around 1/9 of Pennsylvania residents were without land. I
therefore assume that the share of Pennsylvania’s white landless was 1/9 from 1700
to 1710.
To fill in missing values, I proceed in two steps. I first use non-missing regional-
level values based on a narrow regional classification: Lower South (NC, SC); Upper
South (VA, MD); New England (MA, NH, RI, ME, CT) and the Middle Colonies
(NY, NJ, PA and DE). I then fill in the remaining missing values using linear inter-
polation.
While the adopted approach is only a second-best solution to using detailed his-
torical data on income inequality, there are several reasons why the inequality data
used in this paper should yield adequate estimates of the income distribution in each
colony. First, filling in missing values with data from either neighbouring countries
or regional-level averages is a widely used tool in the literature. For instance, when
calculating world-wide inequality in the period 1820-1992, Bourguignon and Mor-
risson (2002) face the problem of missing data for GDP per capita and population
for a large group of Eastern European and non-European countries. To fill in the
gaps, the authors make use of growth data for comparable neighbouring countries.
To minimise the number of missing values, Acemoglu et al. (2001) assign colonial
82

settler mortality rates (covering the late eighteenth and early nineteenth century)
to neighbouring countries, since closely located countries are likely to have similar
disease environments. A somewhat similar - albeit arguably less precise - approach
is also undertaken by Pritchett (1997), who simply proxies income per capita in the
world’s poorest countries by estimating a lower bound of USD 250.
Second, linear interpolation between data values that are not available annually
is also a standard approach in the literature using historical - as well as contempo-
rary - inequality measures (see, for instance Boix (2003) and Lupu and Pontusson
(2011)). Third, one can employ at least two econometric techniques to mitigate
the potential biases arising from the implemented estimation technique. The issue
of within-colony and within-region clustering should be alleviated by clustering the
standard errors as well as by using colony and regional trends, along with colony
fixed effects (Albouy, 2012). As already discussed, these results are available in Ta-
ble 3 and are remarkably similar to those in the baseline specification. Moreover,
dropping inequality (Table A7) from the baseline regressions changes the coefficients
of interest very little, suggesting that my results are not likely to be driven by coding
peculiarities in the inequality variable.
Although percent landless should capture to a considerable extent movements
in colonial inequality, it is of course possible that this variable also accounts for
other factors that may have an important - and independent - effect on the evolution
of representative institutions. A first possibility is that it simply is a proxy for
differences in poverty rates across colonies. Colonies with many poor people may be
less likely to extend the suffrage, possibly because of the high cost of sustaining a
democratic system. Similarly, poor constituents may be less informed and may be
less likely to demand a change in political institutions. Alternatively, it is possible
that disgruntled and disenfranchised poor colonists may mobilise themselves in a
rebellion with the aim of obtaining the suffrage.
83

Even though I cannot rule out a priori that percent landless also proxies for these
other factors, there are several pieces of evidence that point against their importance.
First, persistent cross-colony income differences should be captured by the colony
fixed effects, while time-varying shifts in economic development are likely correlated
with population density and urbanisation for which the regressions also control.
Second, adequate government financing was never really an issue for any of the
colonies (Rabushka, 2010). Moreover, literacy rates were uniformly high throughout
the colonial period in both the Northern and the Southern colonies (mostly in the
range 60%-80%), suggesting that information asymmetries across voters were less
extensive (Grubb, 1990). Finally, although some colonies did experience revolts by
disenfranchised poor voters, the discussion in the penultimate section of the paper
suggests that their impact on political institutions was less clear-cut and short-lived.
Additional controls Data on the type of colonial settlement (proprietary,
charter or royal) is available annually from Purvis (1999).
Urbanisation is calculated by dividing each colony’s total urban population
(from Purvis (1999) and Purvis and Balkin (1995)) by the settled area (for the latter,
see the sources in the description of population density). The urban population
data include the following years and cities: Boston, MA, 1630-1775 (every 5 years);
Charleston, SC - 1680-1690 (every 5 years); 1710-1760 (every 10 years) and 1775;
New York, NY: 1630-1775 (every 5 years); Newport, RI: 1640-1780, also including
1775 (every 10 years); Philadelphia, PA: 1685-1775 (every 5 years); Albany, NY:
1775; Baltimore, MD: 1775; Gloucester, MA: 1790 - assumed that this value was
the same as in 1775; Hartford, CT: 1775; Lancaster, PA: 1780 - assumed that this
value was the same as in 1775, Marblehead, MA: 1760, 1775; New Haven, CT: 1780 -
assumed that this value was the same as in 1775; New London, CT: 1700 - assumed
that this value was the same as in 1775, Newburyport, MA: 1775, Norfolk, VA: 1775,
84

Norwich, CT: 1775, Portsmouth, NH: 1775, Providence, RI: 1780 - assumed that this
value was the same as in 1775, Richmond, VA: 1790 - assumed that this value was the
same as in 1775, Salem, MA: 1760 and 1775, Savannah, GA: 1775. Missing values
between years with available data are calculated via linear interpolation. Missing
data prior to each colony’s first year of available data are given a 0 value.
The latitude data were obtained from Tiger Map (Census Bureau). I use the
latitude for each colony’s state capital.
To calculate ethnic and religious fractionalisation, I collect colony-level data
on the ancestral origins of the white population in 1790 and on the distribution of
different types of churches in 1750 from
Part 4: Historical evidence
This subsection moves away from the large econometric tests undertaken in the rest
of the paper. Instead, I test the proposed theory linking labour market structure and
suffrage extensiveness by marshalling a number of primary and secondary historical
sources, ranging from assembly records to promotional pamphlets.29 This micro-
historical approach makes me more confident that labour markets did indeed have a
causal effect on political institutions in the thirteen colonies.
I start by examining some (fragmentary) migration data covering the Northern
and Southern colonies in the seventeenth and eighteenth centuries. If a liberal suf-
frage was indeed one of the effective ways to attract labour in the South in the
seventeenth century, then the number of migrants coming to the South during this
period should be higher than those in the North. In contrast, we should expect a
reversal of this pattern after 1700. This is precisely what Table A9 demonstrates.
The first panel contains information on the number of migrants in selected Southern
29See also Anonymous (2014) for a detailed historical analysis of the evolution of suffrage insti-
tutions in Virginia.
85

and Northern colonies in the seventeenth century and shows that the flow of settlers
coming to Virginia and Maryland during this period was nearly three times more
than those choosing New England and Delaware. Due to lack of direct migration
data, the second panel in the table proxies the number of foreign migrants with the
share of the foreign-born population in each colony. With the exception of Mary-
land, eighteenth-century foreign migration had decreased substantially in the three
remaining Southern colonies, at a level on a par with that in Massachusetts, and was
significantly lower than the respective figures in Pennsylvania and Delaware.
Evidence from the South
Although detailed accounts of the motives of English migrants to the colonies are
scant, several pieces of historical evidence support the idea that liberal representative
institutions in the early South were used to attract labour. First, historians point out
that assemblies appeared early in all colonies because they allowed rich planters to
influence not only how each colony was governed, but also the fate of their own county
or village (Cooper, 2000). In the seventeenth-century South, the most pressing issue
for planters was securing a constant supply of English indentured servants. As one
of Maryland’s first promotional pamphlets (published in 1635) explains, a planter
“may doe well to furnish himselfe with as many [servants] as he can, of useful and
necessary Arts: A Carpenter, of all others the most necessary;... but any lusty young
able man, that is willing to labour and take paines, although he have no particular
trade, will be beneficial enough to his Master” (Hall, 1910, p. 98-99).
Southern elites, such as Edward Sandys, the treasurer of the Virginia Company,
understood well that English immigration was instrumental for colonial development
as well as for the profits of the Company, and that assemblies could play a crucial
role in attracting migrants (Perry and Cooper 1959, p.48; Bruce 1910, p.404). Early
Southern assemblies offered various concessions to indentured servants by issuing a
86

Table A9: Migration to colonial British America, 1607-1775
(a) Before 1700: Total number of migrants
Years Virginia Maryland New England Delaware Valley
1607-1624 6,000 ... 400 ...1625-1633 3,000 ... 2,500 ...1634-1640 8,800 700 17,500 ...1641-1650 12,000 1,800 4,800 ...1651-1660 18,500 4,600 3,600 ...1661-1670 7,600 12,200 10,000 ...1671-1680 7,400 12,400 ... 1,0001681-1700 18,200 10,800 ... 8,000
1607-1700 81,500 42,500 38,800 9,000
(b) After 1700: Percent of foreign-born residing in each colony
Colony Per cent
Maryland 56%Virginia 20%South Carolina 16%North Carolina 9%Pennsylvania 74%
Delaware 61%New York 10%Massachusetts 17%
New Hampshire 10%Maine 9%Connecticut 5%
Sources: Before 1700: Purvis (1999); after 1700: Villaflor and Sokoloff (1982). Notes: This table
shows the number of migrants in selected colonies. Since data on the total number of migrants
are not available after 1700, it uses data on the share of the foreign-born from the colonial militia
muster rolls covering the French and Indian war and the pre-revolutionary years.
87

number of acts that regulated servant-master relations, sometimes as many as six
annually. In Virginia in 1642, servants were given the right to seek the support
of the local commissioner, who was the head of the county court appointed by the
governor and the Council, for complaints about “harsh or vnchristianlike vsage or
otherways for want of diet, or convenient necessaryes”(see Hening, 1819-1823, vol.
1, p. 255, ACT XXII).30 Several other acts also required masters to provide servants
with decent clothing, food and lodging. To prevent the exploitation of indentured
labourers, the Assembly issued statutes specifying the punishment that a master
could enforce when a runaway servant was apprehended, such as the number of
extra days such a servant had to serve (Smith, 1971, p. 266).
In the absence of a developed court system, the credibility of these regulations
could only be sustained if migrant workers were allowed to participate in represen-
tative government as well, something which elites quickly realised. In Maryland,
the proprietors decided to establish a liberal voting regime in order to compete for
settlers with other colonies, especially because a Catholic proprietor could have dis-
couraged some prospective colonists (Jordan, 2002, p.5). Similarly, although the
North Carolina proprietors initially wanted to govern alone, a liberal franchise was
implemented, at least until the province became more thickly settled (Raper, 1904,
p.16). As a result, despite an English franchise restricted to freeholders, which ex-
cluded nearly 97% of the electorate, the majority of seventeenth-century Southern
colonists were voters.31 In pre-slavery Virginia, indentured servants could in fact
vote until 1655, while freemen held the franchise in Maryland, North Carolina and
South Carolina for most of the seventeenth century.
Moreover, the extensiveness of the suffrage was an important consideration for mi-
30The local commissioner was a type of assembly representative who was appointed by the
governor and the Council.
31The size of the English electorate is from Acemoglu and Robinson (2012).
88

grants. In 1624, all Virginia colonists issued a declaration stating that participation
in representative government not only encouraged them to “follow their particular
labours with singular alacrity and industry,” but also had led to the establishment
of many new plantations (Perry and Cooper, 1959, 49). Chute (1969) also gives
an example of a group of highly-skilled Poles hired by the Virginia company which
decided to settle in the colony because they were enfranchised and made inhabitants.
The suffrage rights of new migrants also featured prominently in the Southern pro-
motional literature. For example, a pamphlet published for the (South and North)
Carolina proprietors in 1666 advertised both the generous land grants for which new
settlers were eligible, and the fact that all free newcomers would be given the right
to vote. Not only did these incentives attract a large number of migrants a few years
later, but the early records of the colony also suggest that the proprietors did not
renege on any of the promises made to new migrants (Salley, 1959).
In Maryland, the 1635 promotional pamphlet discussed earlier contains a section
explaining that the proprietor could only implement laws that were also approved
by the assembly, which in turn was to be elected by the greater number of free
males in the colony (Hall, 1910, p. 104-105). In 1666, to recruit indentured servants,
Maryland’s proprietor Lord Baltimore commissioned a promotional narrative from
a George Alsop, a former servant.32 An entire chapter is devoted to a discussion of
Maryland’s political system, and the existence of an annual assembly, elected by the
consent of the people, is highlighted. Alsop also “advertises” several servant-friendly
laws enacted by the Assembly, such as a law specifying that, upon completion of the
indenture, a servant must receive from his master fifty acres of land, corn, three suits
of clothes, as well as tools needed to set up his own farm. The book concludes that
“The Servant of this Province, which are stigmatiz’d for Slaves by the clappermouth
32Although the language of this pamphlet is exaggerated, historians agree that most statements
were truthful (Hall, 1910, p. 338).
89

jaws of the vulgar in England, live more like Freemen then the most Mechanick
Apprentices in London, wanting for nothing that is convenient and necessary, and
according to their several capacities, are extraordinary well used and respected” (p.
378).
If liberal suffrage institutions were so prevalent in the South in the early seven-
teenth century, then how and why did they decline? Consistent with the theoretical
and econometric analysis in the rest of the paper, the historical record suggests that
the Southern political reversal was underpinned by the substitution of indentured
servants with slaves. As labour market pressures subsided, political concessions to
poor white workers were no longer profitable and the franchise was tightened in the
late seventeenth and early eighteenth centuries. For instance, Cooper (2000, p. 9)
argues that a major benefit of Africans, as compared to indentured servants, was
that blacks could be permanently banned not only from landowning, but also from
political life. In Maryland, the law to limit the franchise to freeholders, implemented
in 1670, was debated intensely between the assembly and the Council. In the end,
the winning argument was that even if such a policy drives out the majority of “able
bodied” freemen, it is the welfare of the freeholders - and not that of the freemen -
that matters most. Similarly, in South Carolina, in sharp contrast to the rhetoric of
the promotional pamphlets from only a few decades earlier, non-freeholding freemen
were deemed not to “have an interest in this province” and excluded from voting in
several laws enacted in the late 1600s and early 1700s (McKinley, 1905, p.146).33
Evidence from the North
While indentured servants comprised the majority of the Southern workforce for
most of the seventeenth century, labour demand in the Northern colonies was met
33Election-related complaints were also considered to take too much time and to interfere with
public business.
90

mainly by family labour and only a small number of hired labourers. The temperate
climate, along with the dominance of small-scale crops like wheat, kept the demand
for additional workers low. As a result, political institutions in New England and
the Middle colonies remained largely unchanged throughout the colonial period.
Instead of attracting labourers, suffrage institutions in the New England colonies
were aimed at creating a closed community dominated by the initial settlers and
emphasising the importance of religion.34 As a result, from the very beginning,
a strict franchise including only church members emerged in Massachusetts, New
Hampshire and Maine. Although Connecticut did not formally limit the suffrage
on the basis of religion, historians suggest that church membership was likely as
important as in Massachusetts, given the close link between church and township
(McKinley, 1905, p. 389). Even in Rhode Island, which implemented the most liberal
franchise regime of all the New England colonies, a religious qualification, limiting
the freemanship and the suffrage to only Christians (excluding Roman Catholics),
was adopted in 1719. Although less restrictive than the church-members’ suffrage
in the rest of the New England colonies, this regulation remained in force until the
Revolution (McKinley, 1905, p. 430-462).
Even in those colonies where the religious qualification was eventually abolished,
it was substituted with equally limiting freeholding requirements. In Massachusetts
in 1664, ten new requirements for voting replaced those related to church member-
ship, among which freeholding, residency and the need for a certificate from the
“selectmen of one’s town” (McKinley, 1905, p. 325). A similar - and likely even
more restrictive - law was also adopted in New Hampshire in 1677 (McKinley, 1905,
34In Massachusetts, John Cotton, a pre-eminent minister, believed that “Democracy I do not
conceive that God ever did ordain as a fit Government for Church or commonwealth” and that
the liberty of electing deputies can only be entrusted to “churchmembers; for the liberties of the
freemen of this commonwealth are such as require men of faithful integrity to God and the state to
preserve the same” (McKinley, 1905, p. 305, 310).
91

p. 374). What is more, New England elites could also influence who voted by con-
trolling the admission of freemen in each township. Unlike in the Southern colonies
where any person not bound to service was considered a freeman, new freemen in
New England were accepted by deliberation of the respective towns. Some of the
requirements that candidate freemen had to satisfy - such as freeholding or church
membership - were similar to those imposed on voters. But there were also others,
including provisions for good moral character, a tax and a monetary payment, as well
as a probationary period, and a lengthy and laborious admissions process (McKin-
ley p. 307-310, 382-387). Not surprisingly, the suffrage and freemaship requirements
severely limited the number of eligible voters. In Massachusetts in 1631, the religious
qualification excluded more than one half of the adult males, and freemen were only
between one tenth to one twentieth of the population (McKinley, p. 313). Nearly
forty years later, the colony had only 350 freemen out of a total population of 5,000
(McKinley, 1905, p. 307-310, 349, 382-387).
In the Middle colonies, English proprietors overtook a network of Dutch and
Swedish settlements established in the early seventeenth century, which made at-
tracting additional migrants less pressing. What is more, the English had fewer in-
centives to grant broad political freedoms to existing settlers, as Dutch and Swedish
representative institutions were largely closed to the general population (McKinley,
1905, p. 259).35
This is not to say that colonial elites were unaware of how important political
35For example, although a quasi-representative board did come into existence in New York in
1642, its members were appointed by the director in consultation with a rather narrow group com-
posed of “masters and heads of families.” In New Jersey, the only type of government that existed
under the Dutch was in Bergen county and consisted of a four-person local court appointed by the
New Amsterdam authorities. In Delaware and Pennsylvania, popular participation in government
was similarly haphazard and never permanently established (McKinley, 1905, p. 176, 227, 273,
266-267).
92

participation was for attracting settlers; rather, the evidence suggests that European
and colonial governments simply had fewer incentives to make use of such policies.
For instance, in a petition to the Dutch government in 1644, New York’s govern-
ing body advocated, albeit unsuccessfully, establishing a representative assembly in
which inhabitants “settle in suitable places, one near the other, in the form of villages
or hamlets, and elect from among themselves a Bailiff or Schout and Schepens, who
will be empowered to send their deputies and give their votes on public affairs with
the Director and Council” (McKinley, 1905, p. 176-177).
In Delaware, the city of New Amstel, in an attempt to enlarge its population
following its transfer from the Dutch West India company to Stuyvesant in 1656, ad-
vertised political privileges along with economic inducements to new settlers. How-
ever, the promised political institutions did not allow for popular elections of office-
holders, but only for the “body of the burghers” to nominate fourteen magistrates,
out of which the New Amsterdam director would appoint seven. Further political
concessions, including an “election of commissaries” were implemented in the period
1657-1663, aimed at preventing the colonists from fleeing to English settlements, but
ultimately none of these policies were successful and the city fell to the English in
1663 (McKinley, 1905, p. 262-264).
The availability of settlers, along with the limited governmental institutions under
the Dutch and the Swedish, prompted English proprietors in the Middle colonies to
opt for a relatively stable franchise regime which was limited to freeholders. In New
York, the freeholder-only suffrage was implemented shortly after the transfer of the
colony to the English in 1664, and with few additional changes (such as the exclusion
of Catholics and Jews in 1701 and 1737, respectively), remained unchanged until
the Revolution. Remaining Dutch settlers were offered additional concessions, such
as the choice to become English citizens upon recognising the King’s authority; the
protection of property and land rights; the enforcement of Dutch rules of inheritance;
93

and the freedom of conscience and worship (McKinley, 1905, p. 197). In New Jersey,
where the original Dutch settlements were smaller and more sparsely populated, the
inducements offered to current settlers were even broader. In addition to cheap land
and “liberty of conscience,” colonists were also promised a general assembly as well
as chartered towns and cities. However, from very early on the suffrage was limited to
freeholders, a policy which paralleled the franchise regimes adopted in Delaware and
Pennsylvania. Similarly to New York, political institutions in these three colonies
changed little throughout the colonial period (McKinley, 1905, p. 228; 274).36
In short, the historical evidence analysed in this sub-section supports the con-
clusions of the extensive econometric analysis undertaken in the rest of the paper.
Representative institutions in the thirteen colonies were tightly linked to the struc-
ture of colonial labour markets. In the seventeenth-century South, a broad franchise
(which in some cases allowed even indentured servants to vote) was aimed at attract-
ing poor migrants from England. As bound labourers were replaced by slaves in the
late 1700s and early 1800s, Southern political institutions deteriorated. In contrast,
Northern political institutions, which were less inclusive than those in the pre-slavery
South, remained largely unchanged throughout the colonial period, as Northern agri-
culture, conducted mainly on small family farms, did not require additional inflows
of labour. In the New England colonies, a strict religious requirement for voting,
along with a cumbersome procedure for gaining freemanship, created a closed com-
munity which favoured the original settlers. In the Middle colonies, a network of
existing Dutch and Swedish settlements, along with their autocratic form of political
organisation, enabled English proprietors to implement a restrictive franchise regime
that was limited to freeholders.
36In Delaware, there were no popular elections from its overtake by the English in 1665 until
1682. From 1682 until 1702, the colony was part of Pennsylvania (McKinley, 1905, p. 266-270).
94