designing therapeutic cancer vaccine trials with delayed ... · bdepartment of biostatistics,...
TRANSCRIPT
Research Article
Received 29 March 2016, Accepted 2 October 2016 Published online 2 November 2016 in Wiley Online Library
(wileyonlinelibrary.com) DOI: 10.1002/sim.7157
Designing therapeutic cancer vaccinetrials with delayed treatment effectZhenzhen Xu,a*† Boguang Zhen,a Yongsoek Parkb and Bin Zhuc
Arming the immune system against cancer has emerged as a powerful tool in oncology during recent years.Instead of poisoning a tumor or destroying it with radiation, therapeutic cancer vaccine, a type of cancerimmunotherapy, unleashes the immune system to combat cancer. This indirect mechanism-of-action of vaccinesposes the possibility of a delayed onset of clinical effect, which results in a delayed separation of survival curvesbetween the experimental and control groups in therapeutic cancer vaccine trials with time-to-event endpoints.This violates the proportional hazard assumption. As a result, the conventional study design based on the regularlog-rank test ignoring the delayed effect would lead to a loss of power. In this paper, we propose two innovativeapproaches for sample size and power calculation using the piecewise weighted log-rank test to properly and effi-ciently incorporate the delayed effect into the study design. Both theoretical derivations and empirical studiesdemonstrate that the proposed methods, accounting for the delayed effect, can reduce sample size dramaticallywhile achieving the target power relative to a standard practice. Copyright © 2016 John Wiley & Sons, Ltd.
Keywords: delayed treatment effect; therapeutic cancer vaccine; cancer immunotherapy; sample size and powercalculation; non-proportional hazard assumption; cancer clinical trial
1. Introduction
In a relatively short period of time, therapeutic cancer vaccine has entered the mainstream of cancertherapy. Instead of poisoning a tumor or destroying it with radiation, the underlying basis of therapeuticcancer vaccine is to unleash the immune system to fight cancer [1]. The idea of manipulating anti-cancerimmune response is not new, but only recently have several scientific studies demonstrate what a game-changer therapeutic cancer vaccine can be [2–4]. Consequently, cancer vaccines have set off a frenzy inthe pharmaceutical industry and many drug companies are racing to conduct such trials.
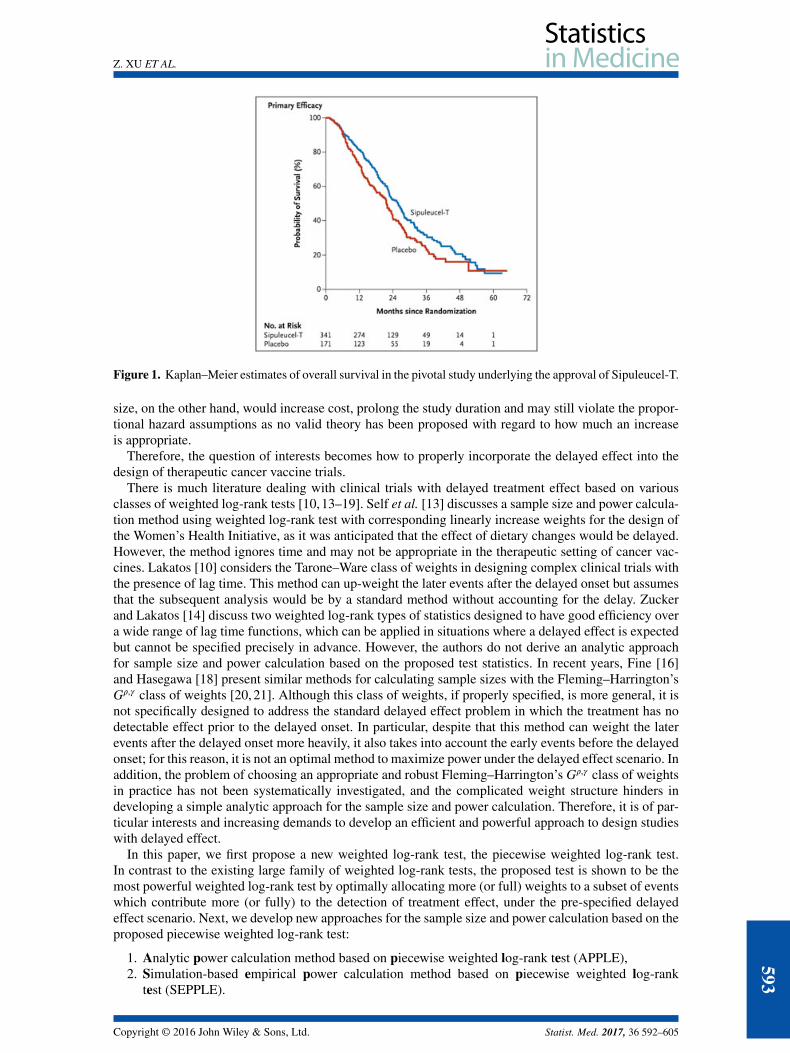
One typical feature of therapeutic cancer vaccine trial is the delayed onset of clinical effect. This delayis largely caused by the indirect mechanism-of-action of the vaccine, which requires the time to mountan effective immune response and the time for that response to be translated into an observable clinicalresponse. Thus, in such trials with a time-to-event endpoint, the delayed effect results in a pattern ofdelayed separation of survival curves between experimental and control arms [1, 5]. For example, thestudy of Sipuleucel-T, the first therapeutic cancer vaccine approved by the Food and Drug Administration,shows a delayed separation of survival curves by 6 months [6] in a Kaplan–Meier plot (Figure 1). Thisimplies that the proportional hazard assumption no longer holds in cancer vaccine trials, and the standardsample size and power calculation methods based on conventional log-rank test would generally lead toa loss of power [7–12]. Hence, designing innovative clinical trials to incorporate this unique feature ofcancer vaccine trials becomes essential.
The standard practice to account for delayed effect is either ignoring the delay or increasing the sam-ple size. However, each approach has its own limitations. Specifically, ignoring the delay will result in aloss of power or an increased chance of falsely claiming futility at early trial stage. Increasing the sample
aCBER, Food and Drug Administration, Silver Spring, MD 20993, U.S.A.bDepartment of Biostatistics, University of Pittsburgh, Pittsburgh, PA 15260, U.S.A.cDCEG, National Cancer Institute, Bethesda, MD 20892, U.S.A.*Correspondence to: Zhenzhen Xu, CBER, Food and Drug Administration, Silver Spring, MD 20993, U.S.A.†E-mail: [email protected]
592
Copyright © 2016 John Wiley & Sons, Ltd. Statist. Med. 2017, 36 592–605
Z. XU ET AL.
Figure 1. Kaplan–Meier estimates of overall survival in the pivotal study underlying the approval of Sipuleucel-T.
size, on the other hand, would increase cost, prolong the study duration and may still violate the propor-tional hazard assumptions as no valid theory has been proposed with regard to how much an increaseis appropriate.
Therefore, the question of interests becomes how to properly incorporate the delayed effect into thedesign of therapeutic cancer vaccine trials.
There is much literature dealing with clinical trials with delayed treatment effect based on variousclasses of weighted log-rank tests [10,13–19]. Self et al. [13] discusses a sample size and power calcula-tion method using weighted log-rank test with corresponding linearly increase weights for the design ofthe Women’s Health Initiative, as it was anticipated that the effect of dietary changes would be delayed.However, the method ignores time and may not be appropriate in the therapeutic setting of cancer vac-cines. Lakatos [10] considers the Tarone–Ware class of weights in designing complex clinical trials withthe presence of lag time. This method can up-weight the later events after the delayed onset but assumesthat the subsequent analysis would be by a standard method without accounting for the delay. Zuckerand Lakatos [14] discuss two weighted log-rank types of statistics designed to have good efficiency overa wide range of lag time functions, which can be applied in situations where a delayed effect is expectedbut cannot be specified precisely in advance. However, the authors do not derive an analytic approachfor sample size and power calculation based on the proposed test statistics. In recent years, Fine [16]and Hasegawa [18] present similar methods for calculating sample sizes with the Fleming–Harrington’sG𝜌,𝛾 class of weights [20, 21]. Although this class of weights, if properly specified, is more general, it isnot specifically designed to address the standard delayed effect problem in which the treatment has nodetectable effect prior to the delayed onset. In particular, despite that this method can weight the laterevents after the delayed onset more heavily, it also takes into account the early events before the delayedonset; for this reason, it is not an optimal method to maximize power under the delayed effect scenario. Inaddition, the problem of choosing an appropriate and robust Fleming–Harrington’s G𝜌,𝛾 class of weightsin practice has not been systematically investigated, and the complicated weight structure hinders indeveloping a simple analytic approach for the sample size and power calculation. Therefore, it is of par-ticular interests and increasing demands to develop an efficient and powerful approach to design studieswith delayed effect.
In this paper, we first propose a new weighted log-rank test, the piecewise weighted log-rank test.In contrast to the existing large family of weighted log-rank tests, the proposed test is shown to be themost powerful weighted log-rank test by optimally allocating more (or full) weights to a subset of eventswhich contribute more (or fully) to the detection of treatment effect, under the pre-specified delayedeffect scenario. Next, we develop new approaches for the sample size and power calculation based on theproposed piecewise weighted log-rank test:
1. Analytic power calculation method based on piecewise weighted log-rank test (APPLE),2. Simulation-based empirical power calculation method based on piecewise weighted log-rank
test (SEPPLE).
Copyright © 2016 John Wiley & Sons, Ltd. Statist. Med. 2017, 36 592–605
593
Z. XU ET AL.
APPLE is a simple analytic approach with close-form formula, which is easy to perform in practiceunder the pre-specified delayed effect scenarios, whereas SEPPLE is a Monte Carlo simulation-basedalgorithm. The purpose of SEPPLE is to verify the analytic approximation of APPLE as well as computethe empirical power. In addition, SEPPLE can provide a more flexible framework in the power calculationby incorporating more complex enrollment process or event time distribution than APPLE.
In general, the proposed piecewise weighted log-rank test and corresponding sample size and powercalculation algorithms have two advantages. First, they maximize the asymptotic study power providedthe delayed pattern being correctly specified. In case of mis-specified delayed patterns, the proposedapproaches can still achieve substantial gain in power compared with the conventional approaches ignor-ing the delayed effects, among the scenarios considered. Second, they provide an easy, elegant, andintuitive solution to address the delayed effect challenge. It is obvious that the proposed methods relycritically on the proper pre-specification of the delayed pattern. In practice, the investigators can obtaingood estimates of the true delayed pattern using the biological or medical judgments on the mechanism-of-action of the therapeutic agent, prior knowledge gained from lab studies and animal models, andpreliminary data from the early phase clinical trials. Both theoretical derivations and extensive empiricalstudies demonstrate that the proposed methods can reduce sample size dramatically while achieving thetarget power relative to the standard practice when the delayed effect is present.
The rest of this paper is organized as follows. The piecewise weighted log-rank test is presentedin Section 2. The APPLE approach is introduced in Section 3, and the SEPPLE approach outlined inSection 4. Section 5 gives results of simulation studies evaluating the characteristics of the APPLE andSEPPLE methods as opposed to the standard practice based on a conventional log-rank test by ignoringthe delayed effect and to the east procedure (version 6.0) [22] by considering the delayed effect. Thearticle concludes with a discussion in Section 7.
2. Piecewise weighted log-rank test
Consider a study to compare survival curves with n subjects randomly allocated to experimental and con-trol groups labeled as E and C, with probability PE and PC (PE + PC = 1), respectively. Let D, withsize nD, be the set of indices of patients who experienced the event of interest. At each distinct eventtime tj, j = 1,… , nD, with no ties, denote by ni(tj) (i = {E,C}) the number of subjects who are atrisk up to time tj in group i and by Xj ∈ {0, 1} the indicator whether the jth event is from the experi-mental group. Then, p(tj) = nE(tj)∕{nE(tj) + nC(tj)} is the proportion of subjects at risk at time tj in theexperimental group.
To test the hypothesis H0 ∶ hE(t) = hC(t), where hE(t) and hC(t) are the underlying hazard functionsfor the experimental and control groups, a conventional weighted log-rank test statistic S is constructedas follows:
S =∑j∈D
bj{Xj − p(tj)}∕
[∑j∈D
b2j p(tj){1 − p(tj)}
]1∕2
(1)
where bj is the pre-determined weight at the event time tj. When each bj = 1, S is the most commonlyused regular log-rank test statistic. The regular log-rank test is asymptotically fully efficient under theproportional hazard alternative. When the delayed effect exists, the hazard ratio 𝜆(t) = hC(t)∕hE(t) variesonce the treatment effect is manifested, and the proportional hazard assumption is violated. As a result,the regular log-rank test is no longer the most efficient test asymptotically as shown in Theorem 2.1.
Theorem 2.1Under condition log{hC(t)∕hE(t)} = O(n−1∕2) as n → ∞, the asymptotic power of conventional weightedlog-rank test is maximized when weights at event times are proportional to the log of the hazard ratios atthose times.
ProofSee Appendix.
With the general aim of optimizing the study power with respect to the pre-defined weights, a piecewiseweighted log-rank test is therefore proposed when a delayed effect exists. Let t∗ denote the hazard ratio
594
Copyright © 2016 John Wiley & Sons, Ltd. Statist. Med. 2017, 36 592–605
Z. XU ET AL.
changing point, which also measures the treatment effect delayed duration since randomization. Underthe general delayed effect scenario,
H1 ∶ 𝜆(t) = hC(t)∕hE(t) ={
𝜆1, t ⩽ t∗
𝜆2, t > t∗
with 𝜆2 > 𝜆1 ⩾ 1, the proposed test statistic of the piecewise weighted log-rank test takes the followingform:
Sw =∑
j∈D1w1{Xj − p(tj)} +
∑j∈D2
w2{Xj − p(tj)}[∑j∈D1
w21p(tj){1 − p(tj)} +
∑j∈D2
w22p(tj){1 − p(tj)}
]1∕2, (2)
where we assign weights w1 = log(𝜆1)∕{log(𝜆1)+log(𝜆2)}, w2 = log(𝜆2)∕{log(𝜆1)+log(𝜆2)} and denoteby D1,D2 the sets of indices of patients who died before and after t∗, respectively. According to Theorem2.1, Sw can maximize the power of the study for a given sample size under the general delayed effectscenario. We can easily see that the piecewise weighted log-rank test statistic (Sw) is a special form of theconventional weighted log-rank test statistic (S) by assigning piecewise constant weights to the earlierand later events differentiated at the changing time t∗. Specifically, bj = w1 if tj ⩽ t∗, bj = w2 if tj > t∗
and the weights bj ∝ log 𝜆(tj).In practice, the standard delayed effect scenario often arises where the treatment has no detectable
effect during the period [0, t∗], and becomes fully effective afterwards; that is, 𝜆2 > 𝜆1 = 1 asdemonstrated in the Sipuleucel-T study. In this case, the optimal weights are w1 = 0,w2 = 1, and the teststatistic becomes
Sws =∑
j∈D2{Xj − p(tj)}[∑
j∈D2p(tj){1 − p(tj)}
]1∕2.
As shown in the Appendix, with equal allocation ratio so the censoring distributions are the same, Swscan maximize the study power at
Pow∗ = Φ{1
2log(𝜆2)
√d2 − Z1− 𝛼
2
}, (3)
where we consider an one-sided 1 − 𝛼∕2 level of significance and let d2 denote the number of eventsaccumulated after the treatment effect onset. This implies that, under the standard delayed effect scenario,the piecewise weighted log-rank test with w1 = 0 and w2 = 1 is the most powerful weighted log-rank test,which is essentially the regular log-rank test taking into account only the events accumulated after thedelayed onset. This result makes intuitive sense, and the heuristic argument is as follows. If the treatmenteffect is not revealed until t∗, then the earlier events before t∗ would neither contribute to the detection oftreatment effect nor comply with the proportional hazard assumption and should be ignored. In contrast,the later events after t∗ do contribute and need to be included in the analysis exclusively. As the standarddelayed effect scenario is most common in practice, we focus on this scenario thereafter.
3. APPLE method
It is clear that power in (3) is driven by the number of events after the delayed phase. However, in practice,it is the relationship between the power function and the number of subjects instead of the number ofevents that facilitate designing a study. Thus, the APPLE method is proposed to provide an analytic,close-form approach for the sample size and power calculation when the delayed effect is present.
Assume that the number of patients arriving a study of total duration 𝜏 follows a Poisson process withan intensity rate a. During the enrollment period [0, A] since randomization, the expected number ofenrolled patients is equal to a×A. Consider an infinitesimal period of time [u, u+du], the expected numberof patients in either experimental or control group who arrive during this period is equal to a × du∕2under equal allocation ratio. Assume that patients’ event times follow an exponential distribution withrate hi1 before t∗ and hi2 after t∗, for group i ∈ {E,C} where hC1
= hC2= hC and let the corresponding
Copyright © 2016 John Wiley & Sons, Ltd. Statist. Med. 2017, 36 592–605
595
Z. XU ET AL.
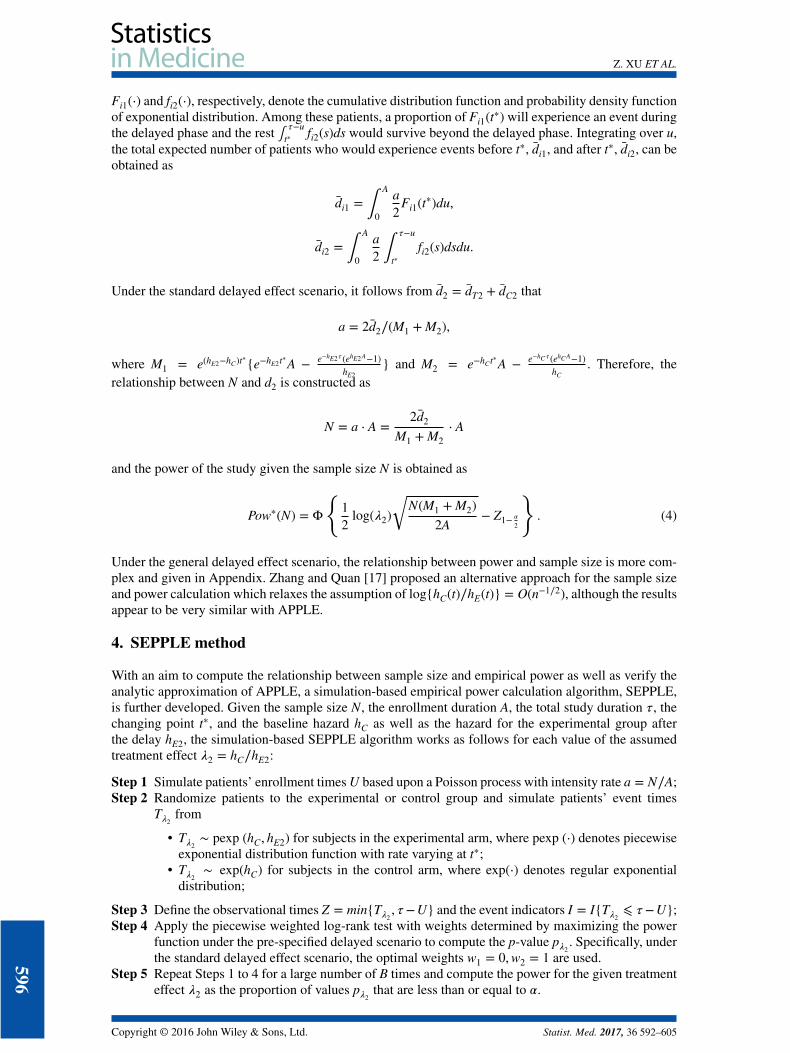
Fi1(⋅) and fi2(⋅), respectively, denote the cumulative distribution function and probability density functionof exponential distribution. Among these patients, a proportion of Fi1(t∗) will experience an event duringthe delayed phase and the rest ∫ 𝜏−u
t∗ fi2(s)ds would survive beyond the delayed phase. Integrating over u,the total expected number of patients who would experience events before t∗, d̄i1, and after t∗, d̄i2, can beobtained as
d̄i1 = ∫A
0
a2
Fi1(t∗)du,
d̄i2 = ∫A
0
a2 ∫
𝜏−u
t∗fi2(s)dsdu.
Under the standard delayed effect scenario, it follows from d̄2 = d̄T2 + d̄C2 that
a = 2d̄2∕(M1 + M2),
where M1 = e(hE2−hC)t∗{e−hE2t∗A − e−hE2𝜏 (ehE2A−1)hE2
} and M2 = e−hCt∗A − e−hC𝜏 (ehCA−1)hC
. Therefore, therelationship between N and d2 is constructed as
N = a ⋅ A =2d̄2
M1 + M2⋅ A
and the power of the study given the sample size N is obtained as
Pow∗(N) = Φ
{12
log(𝜆2)√
N(M1 + M2)2A
− Z1− 𝛼
2
}. (4)
Under the general delayed effect scenario, the relationship between power and sample size is more com-plex and given in Appendix. Zhang and Quan [17] proposed an alternative approach for the sample sizeand power calculation which relaxes the assumption of log{hC(t)∕hE(t)} = O(n−1∕2), although the resultsappear to be very similar with APPLE.
4. SEPPLE method
With an aim to compute the relationship between sample size and empirical power as well as verify theanalytic approximation of APPLE, a simulation-based empirical power calculation algorithm, SEPPLE,is further developed. Given the sample size N, the enrollment duration A, the total study duration 𝜏, thechanging point t∗, and the baseline hazard hC as well as the hazard for the experimental group afterthe delay hE2, the simulation-based SEPPLE algorithm works as follows for each value of the assumedtreatment effect 𝜆2 = hC∕hE2:
Step 1 Simulate patients’ enrollment times U based upon a Poisson process with intensity rate a = N∕A;Step 2 Randomize patients to the experimental or control group and simulate patients’ event times
T𝜆2from
• T𝜆2∼ pexp (hC, hE2) for subjects in the experimental arm, where pexp (⋅) denotes piecewise
exponential distribution function with rate varying at t∗;• T𝜆2
∼ exp(hC) for subjects in the control arm, where exp(⋅) denotes regular exponentialdistribution;
Step 3 Define the observational times Z = min{T𝜆2, 𝜏−U} and the event indicators I = I{T𝜆2
⩽ 𝜏−U};Step 4 Apply the piecewise weighted log-rank test with weights determined by maximizing the power
function under the pre-specified delayed scenario to compute the p-value p𝜆2. Specifically, under
the standard delayed effect scenario, the optimal weights w1 = 0,w2 = 1 are used.Step 5 Repeat Steps 1 to 4 for a large number of B times and compute the power for the given treatment
effect 𝜆2 as the proportion of values p𝜆2that are less than or equal to 𝛼.
596
Copyright © 2016 John Wiley & Sons, Ltd. Statist. Med. 2017, 36 592–605
Z. XU ET AL.
SEPPLE can provide a flexible framework to incorporate more complex enrollment process or event timedistribution than APPLE. For example, SEPPLE can implement a non-homogeneous Poisson process forenrollment or a complex event time distribution. When both APPLE and SEPPLE assume same distribu-tional assumptions on the enrollment process and event time, these two procedures should lead to similarresults as they both rely on the piecewise weighted log-rank test.
5. Simulation study
To evaluate the properties of the proposed APPLE and SEPPLE methods, we carry out a wide variety ofevaluations using both analytic approaches and simulation studies. These evaluations focus on two aims:
The first aim is to evaluate the effect of each pre-specified parameter on the sample size-powerrelationship empirically. Those prerequisite parameters include
• t∗: Hazard ratio changing point or treatment effect delayed duration since randomization;• p: Proportion of subjects who will survive beyond t∗. Suppose that the event time follows an expo-
nential distribution exp(hC) during the delayed phase, the proportion p would depend on the baselinehazard hC;
• 𝜆2: Hazard ratio during the post-delayed phase.
The second aim is to compare the performance of the proposed methods relative to the standard prac-tice. When the delayed effect is present, the standard practice to account for the delayed effect in thesample size and power calculation is either ignoring the delayed effect or increasing the sample size toa certain extent as suggested by the commercial software package east [22]. As east, with the optionfor dealing with the delayed effect, has been widely utilized for trial design in practice, we compare theproposed methods with east under a hypothetical practical scenario.
In what follows, we assume the standard delayed effect scenario and a 0.05 level of significance. TheSEPPLE method uses 10,000 replications in the power computation.
5.1. Evaluation #1
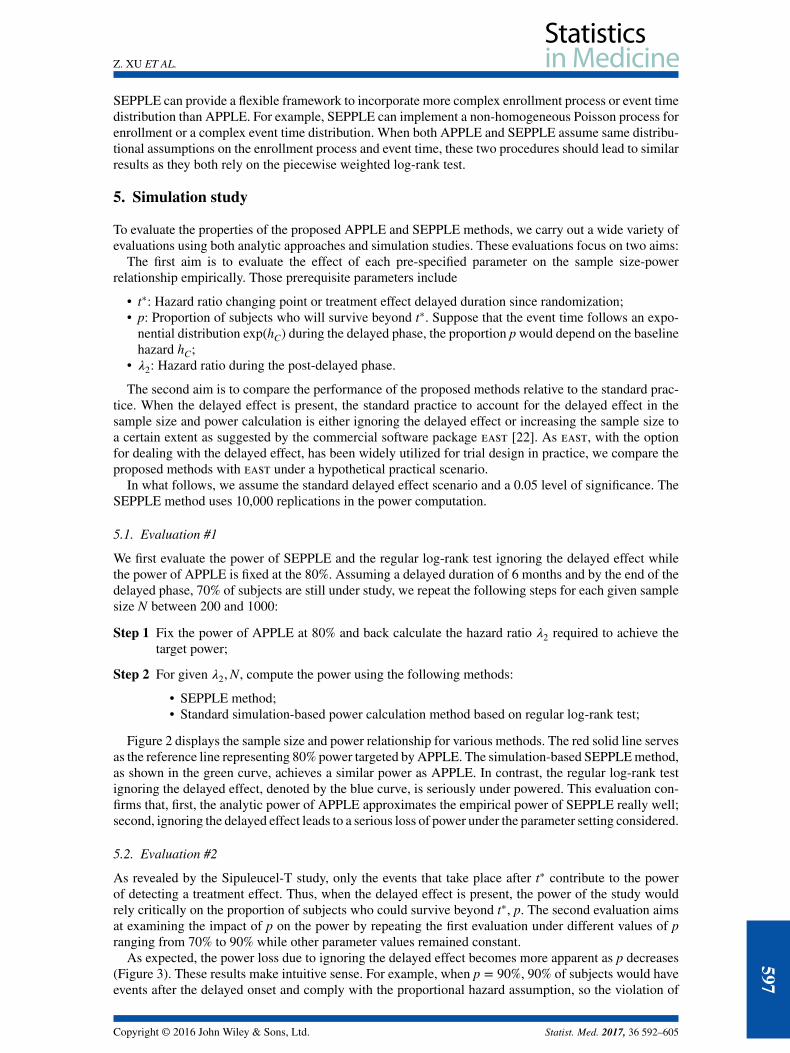
We first evaluate the power of SEPPLE and the regular log-rank test ignoring the delayed effect whilethe power of APPLE is fixed at the 80%. Assuming a delayed duration of 6 months and by the end of thedelayed phase, 70% of subjects are still under study, we repeat the following steps for each given samplesize N between 200 and 1000:
Step 1 Fix the power of APPLE at 80% and back calculate the hazard ratio 𝜆2 required to achieve thetarget power;
Step 2 For given 𝜆2,N, compute the power using the following methods:
• SEPPLE method;• Standard simulation-based power calculation method based on regular log-rank test;
Figure 2 displays the sample size and power relationship for various methods. The red solid line servesas the reference line representing 80% power targeted by APPLE. The simulation-based SEPPLE method,as shown in the green curve, achieves a similar power as APPLE. In contrast, the regular log-rank testignoring the delayed effect, denoted by the blue curve, is seriously under powered. This evaluation con-firms that, first, the analytic power of APPLE approximates the empirical power of SEPPLE really well;second, ignoring the delayed effect leads to a serious loss of power under the parameter setting considered.
5.2. Evaluation #2
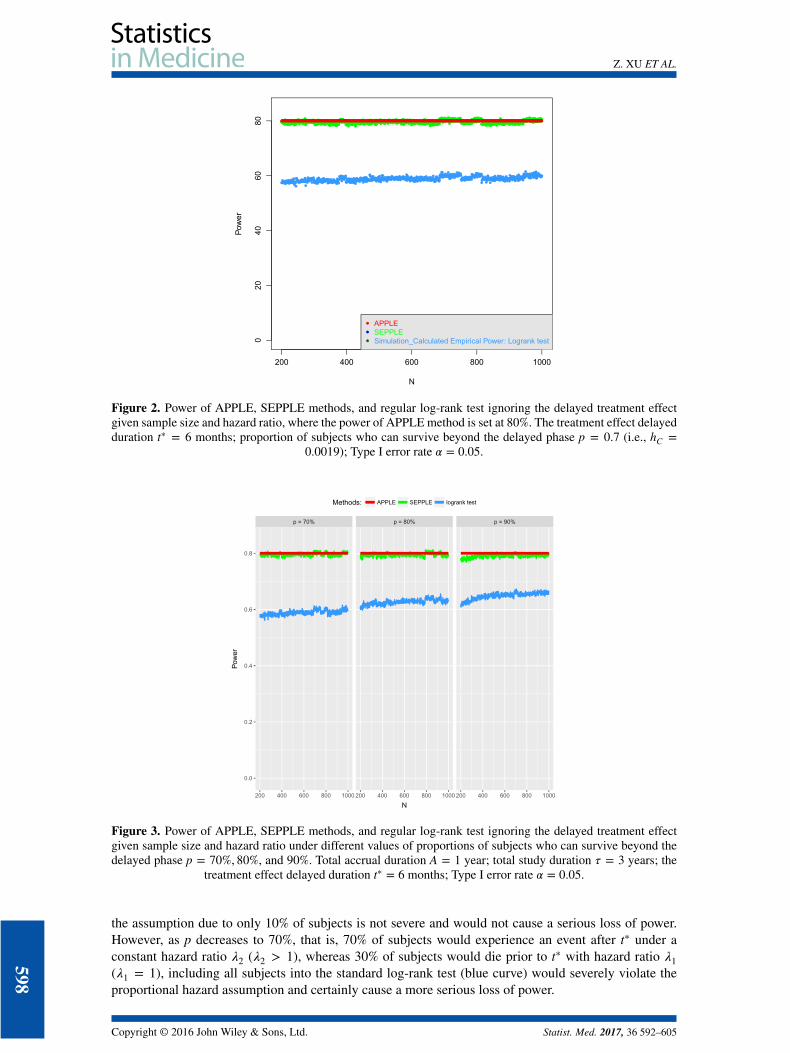
As revealed by the Sipuleucel-T study, only the events that take place after t∗ contribute to the powerof detecting a treatment effect. Thus, when the delayed effect is present, the power of the study wouldrely critically on the proportion of subjects who could survive beyond t∗, p. The second evaluation aimsat examining the impact of p on the power by repeating the first evaluation under different values of pranging from 70% to 90% while other parameter values remained constant.
As expected, the power loss due to ignoring the delayed effect becomes more apparent as p decreases(Figure 3). These results make intuitive sense. For example, when p = 90%, 90% of subjects would haveevents after the delayed onset and comply with the proportional hazard assumption, so the violation of
Copyright © 2016 John Wiley & Sons, Ltd. Statist. Med. 2017, 36 592–605
597
Z. XU ET AL.
Figure 2. Power of APPLE, SEPPLE methods, and regular log-rank test ignoring the delayed treatment effectgiven sample size and hazard ratio, where the power of APPLE method is set at 80%. The treatment effect delayedduration t∗ = 6 months; proportion of subjects who can survive beyond the delayed phase p = 0.7 (i.e., hC =
0.0019); Type I error rate 𝛼 = 0.05.
Figure 3. Power of APPLE, SEPPLE methods, and regular log-rank test ignoring the delayed treatment effectgiven sample size and hazard ratio under different values of proportions of subjects who can survive beyond thedelayed phase p = 70%, 80%, and 90%. Total accrual duration A = 1 year; total study duration 𝜏 = 3 years; the
treatment effect delayed duration t∗ = 6 months; Type I error rate 𝛼 = 0.05.
the assumption due to only 10% of subjects is not severe and would not cause a serious loss of power.However, as p decreases to 70%, that is, 70% of subjects would experience an event after t∗ under aconstant hazard ratio 𝜆2 (𝜆2 > 1), whereas 30% of subjects would die prior to t∗ with hazard ratio 𝜆1(𝜆1 = 1), including all subjects into the standard log-rank test (blue curve) would severely violate theproportional hazard assumption and certainly cause a more serious loss of power.
598
Copyright © 2016 John Wiley & Sons, Ltd. Statist. Med. 2017, 36 592–605
Z. XU ET AL.
5.3. Evaluation #3
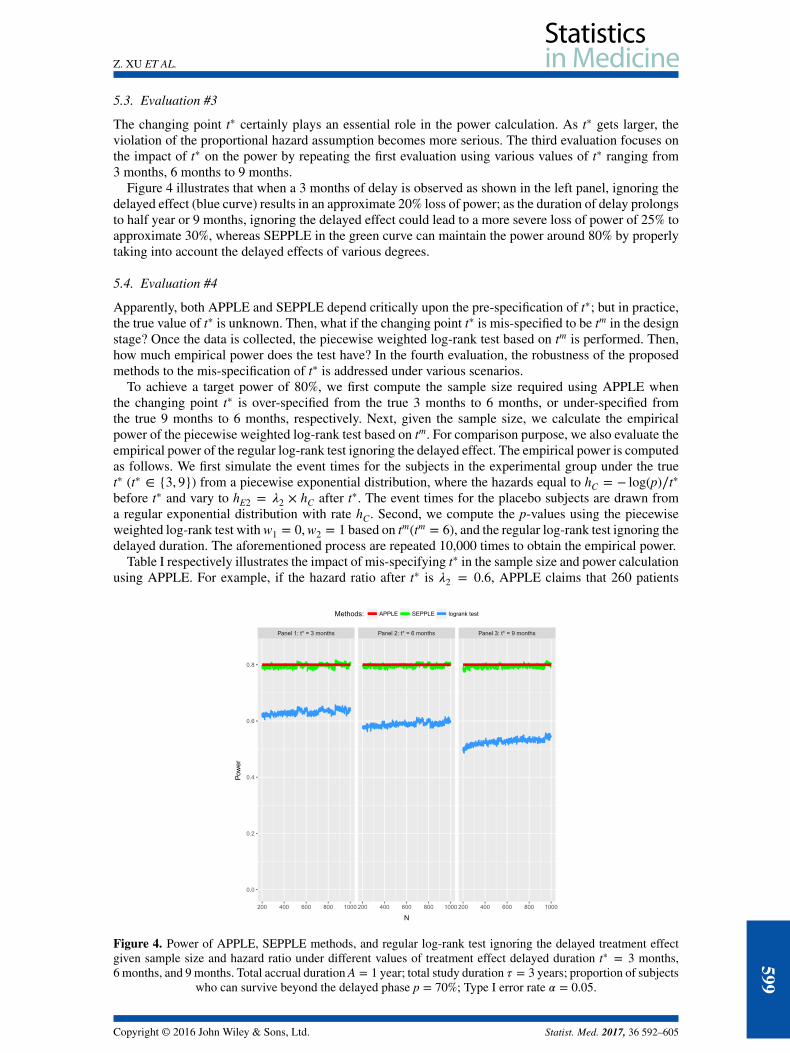
The changing point t∗ certainly plays an essential role in the power calculation. As t∗ gets larger, theviolation of the proportional hazard assumption becomes more serious. The third evaluation focuses onthe impact of t∗ on the power by repeating the first evaluation using various values of t∗ ranging from3 months, 6 months to 9 months.
Figure 4 illustrates that when a 3 months of delay is observed as shown in the left panel, ignoring thedelayed effect (blue curve) results in an approximate 20% loss of power; as the duration of delay prolongsto half year or 9 months, ignoring the delayed effect could lead to a more severe loss of power of 25% toapproximate 30%, whereas SEPPLE in the green curve can maintain the power around 80% by properlytaking into account the delayed effects of various degrees.
5.4. Evaluation #4
Apparently, both APPLE and SEPPLE depend critically upon the pre-specification of t∗; but in practice,the true value of t∗ is unknown. Then, what if the changing point t∗ is mis-specified to be tm in the designstage? Once the data is collected, the piecewise weighted log-rank test based on tm is performed. Then,how much empirical power does the test have? In the fourth evaluation, the robustness of the proposedmethods to the mis-specification of t∗ is addressed under various scenarios.
To achieve a target power of 80%, we first compute the sample size required using APPLE whenthe changing point t∗ is over-specified from the true 3 months to 6 months, or under-specified fromthe true 9 months to 6 months, respectively. Next, given the sample size, we calculate the empiricalpower of the piecewise weighted log-rank test based on tm. For comparison purpose, we also evaluate theempirical power of the regular log-rank test ignoring the delayed effect. The empirical power is computedas follows. We first simulate the event times for the subjects in the experimental group under the truet∗ (t∗ ∈ {3, 9}) from a piecewise exponential distribution, where the hazards equal to hC = − log(p)∕t∗
before t∗ and vary to hE2 = 𝜆2 × hC after t∗. The event times for the placebo subjects are drawn froma regular exponential distribution with rate hC. Second, we compute the p-values using the piecewiseweighted log-rank test with w1 = 0,w2 = 1 based on tm(tm = 6), and the regular log-rank test ignoring thedelayed duration. The aforementioned process are repeated 10,000 times to obtain the empirical power.
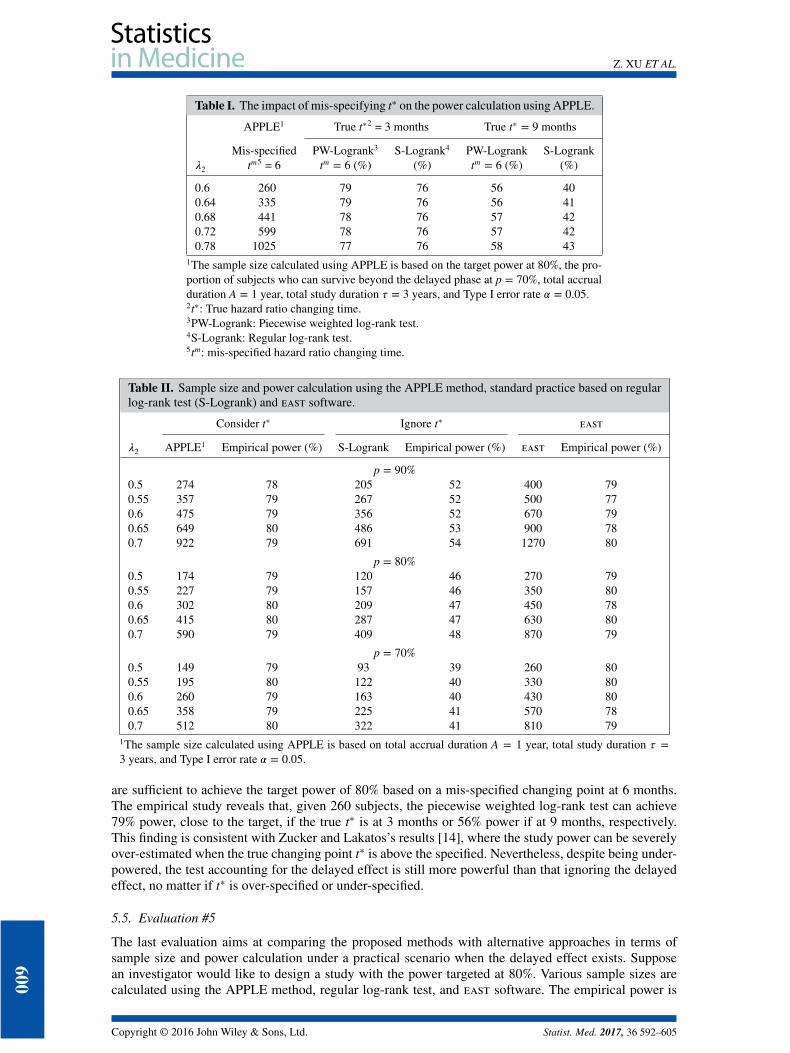
Table I respectively illustrates the impact of mis-specifying t∗ in the sample size and power calculationusing APPLE. For example, if the hazard ratio after t∗ is 𝜆2 = 0.6, APPLE claims that 260 patients
Figure 4. Power of APPLE, SEPPLE methods, and regular log-rank test ignoring the delayed treatment effectgiven sample size and hazard ratio under different values of treatment effect delayed duration t∗ = 3 months,6 months, and 9 months. Total accrual duration A = 1 year; total study duration 𝜏 = 3 years; proportion of subjects
who can survive beyond the delayed phase p = 70%; Type I error rate 𝛼 = 0.05.
Copyright © 2016 John Wiley & Sons, Ltd. Statist. Med. 2017, 36 592–605
599
Z. XU ET AL.
Table I. The impact of mis-specifying t∗ on the power calculation using APPLE.
APPLE1 True t∗2 = 3 months True t∗ = 9 months
Mis-specified PW-Logrank3 S-Logrank4 PW-Logrank S-Logrank𝜆2 tm5 = 6 tm = 6 (%) (%) tm = 6 (%) (%)
0.6 260 79 76 56 400.64 335 79 76 56 410.68 441 78 76 57 420.72 599 78 76 57 420.78 1025 77 76 58 43
1The sample size calculated using APPLE is based on the target power at 80%, the pro-portion of subjects who can survive beyond the delayed phase at p = 70%, total accrualduration A = 1 year, total study duration 𝜏 = 3 years, and Type I error rate 𝛼 = 0.05.2t∗: True hazard ratio changing time.3PW-Logrank: Piecewise weighted log-rank test.4S-Logrank: Regular log-rank test.5tm: mis-specified hazard ratio changing time.
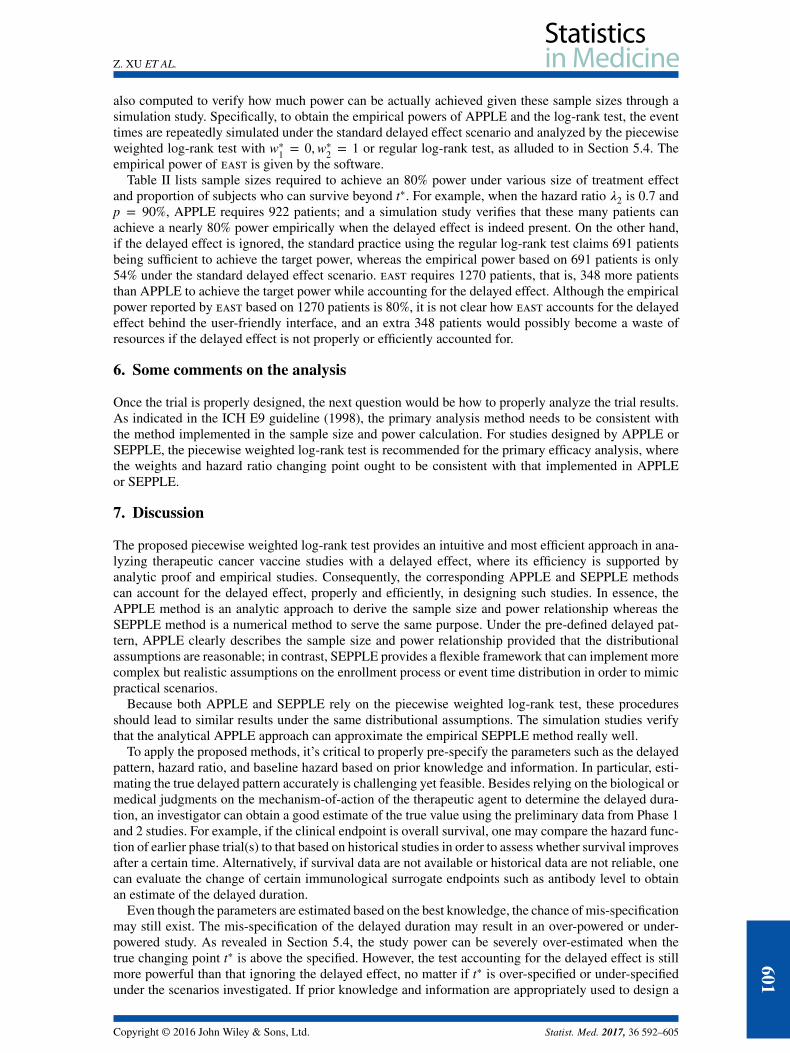
Table II. Sample size and power calculation using the APPLE method, standard practice based on regularlog-rank test (S-Logrank) and east software.
Consider t∗ Ignore t∗ east
𝜆2 APPLE1 Empirical power (%) S-Logrank Empirical power (%) east Empirical power (%)
p = 90%0.5 274 78 205 52 400 790.55 357 79 267 52 500 770.6 475 79 356 52 670 790.65 649 80 486 53 900 780.7 922 79 691 54 1270 80
p = 80%0.5 174 79 120 46 270 790.55 227 79 157 46 350 800.6 302 80 209 47 450 780.65 415 80 287 47 630 800.7 590 79 409 48 870 79
p = 70%0.5 149 79 93 39 260 800.55 195 80 122 40 330 800.6 260 79 163 40 430 800.65 358 79 225 41 570 780.7 512 80 322 41 810 79
1The sample size calculated using APPLE is based on total accrual duration A = 1 year, total study duration 𝜏 =3 years, and Type I error rate 𝛼 = 0.05.
are sufficient to achieve the target power of 80% based on a mis-specified changing point at 6 months.The empirical study reveals that, given 260 subjects, the piecewise weighted log-rank test can achieve79% power, close to the target, if the true t∗ is at 3 months or 56% power if at 9 months, respectively.This finding is consistent with Zucker and Lakatos’s results [14], where the study power can be severelyover-estimated when the true changing point t∗ is above the specified. Nevertheless, despite being under-powered, the test accounting for the delayed effect is still more powerful than that ignoring the delayedeffect, no matter if t∗ is over-specified or under-specified.
5.5. Evaluation #5
The last evaluation aims at comparing the proposed methods with alternative approaches in terms ofsample size and power calculation under a practical scenario when the delayed effect exists. Supposean investigator would like to design a study with the power targeted at 80%. Various sample sizes arecalculated using the APPLE method, regular log-rank test, and east software. The empirical power is
600
Copyright © 2016 John Wiley & Sons, Ltd. Statist. Med. 2017, 36 592–605
Z. XU ET AL.
also computed to verify how much power can be actually achieved given these sample sizes through asimulation study. Specifically, to obtain the empirical powers of APPLE and the log-rank test, the eventtimes are repeatedly simulated under the standard delayed effect scenario and analyzed by the piecewiseweighted log-rank test with w∗
1 = 0,w∗2 = 1 or regular log-rank test, as alluded to in Section 5.4. The
empirical power of east is given by the software.Table II lists sample sizes required to achieve an 80% power under various size of treatment effect
and proportion of subjects who can survive beyond t∗. For example, when the hazard ratio 𝜆2 is 0.7 andp = 90%, APPLE requires 922 patients; and a simulation study verifies that these many patients canachieve a nearly 80% power empirically when the delayed effect is indeed present. On the other hand,if the delayed effect is ignored, the standard practice using the regular log-rank test claims 691 patientsbeing sufficient to achieve the target power, whereas the empirical power based on 691 patients is only54% under the standard delayed effect scenario. east requires 1270 patients, that is, 348 more patientsthan APPLE to achieve the target power while accounting for the delayed effect. Although the empiricalpower reported by east based on 1270 patients is 80%, it is not clear how east accounts for the delayedeffect behind the user-friendly interface, and an extra 348 patients would possibly become a waste ofresources if the delayed effect is not properly or efficiently accounted for.
6. Some comments on the analysis
Once the trial is properly designed, the next question would be how to properly analyze the trial results.As indicated in the ICH E9 guideline (1998), the primary analysis method needs to be consistent withthe method implemented in the sample size and power calculation. For studies designed by APPLE orSEPPLE, the piecewise weighted log-rank test is recommended for the primary efficacy analysis, wherethe weights and hazard ratio changing point ought to be consistent with that implemented in APPLEor SEPPLE.
7. Discussion
The proposed piecewise weighted log-rank test provides an intuitive and most efficient approach in ana-lyzing therapeutic cancer vaccine studies with a delayed effect, where its efficiency is supported byanalytic proof and empirical studies. Consequently, the corresponding APPLE and SEPPLE methodscan account for the delayed effect, properly and efficiently, in designing such studies. In essence, theAPPLE method is an analytic approach to derive the sample size and power relationship whereas theSEPPLE method is a numerical method to serve the same purpose. Under the pre-defined delayed pat-tern, APPLE clearly describes the sample size and power relationship provided that the distributionalassumptions are reasonable; in contrast, SEPPLE provides a flexible framework that can implement morecomplex but realistic assumptions on the enrollment process or event time distribution in order to mimicpractical scenarios.
Because both APPLE and SEPPLE rely on the piecewise weighted log-rank test, these proceduresshould lead to similar results under the same distributional assumptions. The simulation studies verifythat the analytical APPLE approach can approximate the empirical SEPPLE method really well.
To apply the proposed methods, it’s critical to properly pre-specify the parameters such as the delayedpattern, hazard ratio, and baseline hazard based on prior knowledge and information. In particular, esti-mating the true delayed pattern accurately is challenging yet feasible. Besides relying on the biological ormedical judgments on the mechanism-of-action of the therapeutic agent to determine the delayed dura-tion, an investigator can obtain a good estimate of the true value using the preliminary data from Phase 1and 2 studies. For example, if the clinical endpoint is overall survival, one may compare the hazard func-tion of earlier phase trial(s) to that based on historical studies in order to assess whether survival improvesafter a certain time. Alternatively, if survival data are not available or historical data are not reliable, onecan evaluate the change of certain immunological surrogate endpoints such as antibody level to obtainan estimate of the delayed duration.
Even though the parameters are estimated based on the best knowledge, the chance of mis-specificationmay still exist. The mis-specification of the delayed duration may result in an over-powered or under-powered study. As revealed in Section 5.4, the study power can be severely over-estimated when thetrue changing point t∗ is above the specified. However, the test accounting for the delayed effect is stillmore powerful than that ignoring the delayed effect, no matter if t∗ is over-specified or under-specifiedunder the scenarios investigated. If prior knowledge and information are appropriately used to design a
Copyright © 2016 John Wiley & Sons, Ltd. Statist. Med. 2017, 36 592–605
601
Z. XU ET AL.
Phase 3 study with delayed effect, mis-specification of the delayed duration should be controlled withina reasonable range. In addition, sensitivity power analysis is very important while applying the proposedmethods to account for the delayed effect. One may want to compute powers under various plausibledelayed scenarios and compare those with the one with no delayed effect, in order to determine thenecessity of applying proposed methods.
The proposed approach may be extended to account for the multi-phase delayed effect scenario. Specif-ically, when the hazard ratio follows a multi-phase piecewise constant function, the piecewise weightedlog-rank test with optimal weights can be determined to maximize the study power based on Theorem2.1. The generalized APPLE and SEPPLE methods for sample size calculation can be further derived.More research is warranted in this area.
Appendix
This appendix first derives the asymptotic distribution of the weighted log-rank test statistic S underthe delayed effect alternative hypothesis with non-proportional hazard assumption and the conditionlog{𝜆(t)} = log{hC(t)∕hE(t)} = O(n−1∕2); second, based on the asymptotic distribution, it maximizes thepower of the test with respect to the optimal weight assignments. The most powerful piecewise weightedlog-rank test can then be determined.
Following the definition in [8], the statistics from the conventional weighted log-rank test is
S =∑
j∈D bj{Xj − p(tj)}[∑j∈D b2
j p(tj){1 − p(tj)}]1∕2
.
The asymptotic distribution for S under the condition of log 𝜆(tj) = O(n−1∕2) can be obtained using Taylorexpansion around zero: ∑
j∈D bj{Xj − 𝜇j}{∑j∈D b2
j 𝜇j(1 − 𝜇j)}1∕2
−∑
j∈D bj{log 𝜆(tj)}p(tj){1 − p(tj)}[∑j∈D b2
j p(tj){1 − p(tj)}]1∕2
, (A.1)
where
𝜇j =nC(tj)hC(tj)
nC(tj)hC(tj) + nE(tj)hE(tj).
Cox [23] showed that the first term in (A.1) has asymptotic standard normal distribution as long as thedenominator is equal or converges to zero. Therefore, S follows an asymptotic standard normal distribu-tion under H0 ∶ 𝜆(tj) = 1. Under the alternative hypothesis, S follows an asymptotic normal distributionwith unit variance and non-centrality mean 𝜇 denoted by the second term in (A.1).
The proof of Theorem 2.1 involves Jensen’s inequality as follows.
Lemma 8.1 (Jensen’s inequality)For a real convex function f (⋅), numbers x1,… , xn, and positive weights a1,… , an,
f
(∑ajxj∑aj
)⩽
∑ajf (xj)∑
aj
.
Equality holds if and only if x1 = x2 = · · · = xn or f (⋅) is linear.
Proof of theorem 2.1:
Given the asymptotic distribution of S under the alternative, the power function can be furtherderived as
Pow = Φ(𝜇 − Z1− 𝛼
2
). (A.2)602
Copyright © 2016 John Wiley & Sons, Ltd. Statist. Med. 2017, 36 592–605
Z. XU ET AL.
For simplicity, we consider a one-sided 1 − 𝛼∕2 level of significance. The power function of two-sided1 − 𝛼 level test can be easily obtained. In this paper, we assume no dropouts except the administrativecensoring mechanism, because the investigators are encouraged by the agencies to follow up patientseven after dropouts in practical oncology studies. The power function of the weighted log-rank test canbe optimized by maximizing the non-centrality mean 𝜇 with respect to the weights {b′j s}, which can beobtained using Jensen’s inequality.
Let aj = b2j p(tj){1−p(tj)} and xj = {log 𝜆(tj)}[
∑j∈D b2
j p(tj){1−p(tj)}]1∕2∕bj; then, square of the secondterm in (A.1) is
𝜇2 =
[∑j∈D bj{log 𝜆(tj)}p(tj){1 − p(tj)}
]2
∑j∈D b2
j p(tj){1 − p(tj)}
=
[∑j∈D bj{log 𝜆(tj)}p(tj){1 − p(tj)}
[∑j∈D b2
j p(tj){1 − p(tj)}]1∕2
]2
[∑j∈D b2
j p(tj){1 − p(tj)}]2
=
(∑j∈D ajxj∑j∈D aj
)2
⩽
∑j∈D ajx
2j∑
j∈D aj
=∑j∈D
{log 𝜆(tj)}2p(tj){1 − p(tj)} = 𝜇∗2.
The equality holds only when all xj, j ∈ D, are equal, that is, bj ∝ log 𝜆(tj), which implies that the mean𝜇 is maximized when weights at the distinct event times are all proportional to the log of hazard ratios atthose times.
Because log 𝜆(tj) is O(n−1∕2), using the central limit theorem, the maximum value of 𝜇 square is
∑j∈D
{log 𝜆(tj)}2p(tj){1 − p(tj)} = 1n
∑j∈D
n{log 𝜆(tj)}2p(tj){1 − p(tj)}
→ n∫ {log 𝜆(t)}2𝜋(t){1 − 𝜋(t)}V(t)dt,
where function V(t) denotes the probability of observing an event at time t and 𝜋(t) the probability ofobserving the event in the experimental group, given as
V(t) = PEfE(t)[1 − HE(t)
]+ PCfC(t)
[1 − HC(t)
]
𝜋(t) =PE
[1 − FE(t)
][1 − HE(t)
]PE
[1 − FE(t)
][1 − HE(t)
]+ PC
[1 − FC(t)
][1 − HC(t)
] ,where fi(t),Fi(t) (i ∈ {E,C}) are the probability density and cumulative distribution functions (pdf andcdf) of event for the ith group and Hi(t) is the cdf of censoring.
Therefore, the maximum asymptotic power is
Φ
([n∫ {log 𝜆(t)}2𝜋(t){1 − 𝜋(t)}V(t)dt
]1∕2
− Z1− 𝛼
2
). (A.3)
Remark 1bj ∝ log 𝜆(tj) uniquely holds only for those events of at-risk subjects in both groups. If p(tj) = 0 or1− p(tj) = 0, this event does not contribute to the log-rank test, and the weight at this time point does notaffect the efficiency of the test.
Copyright © 2016 John Wiley & Sons, Ltd. Statist. Med. 2017, 36 592–605
603
Z. XU ET AL.
Remark 2Although Jensen’s inequality requires aj > 0, that is, bj > 0, bj ∝ log 𝜆(tj) still holds for those j with𝜆(tj) = 1 in terms of maximizing the second term in (A.1), because the denominator increases if bj > 0while the numerator stays the same. That is, bj = 0 if 𝜆(tj) = 1.
Under the general delayed effect alternative
H1 ∶ 𝜆(tj) =hC(tj)hE(tj)
={
𝜆1, tj ⩽ t∗
𝜆2, tj > t∗,
where 𝜆2 > 𝜆1 ⩾ 1, the weighted log-rank test is most powerful when the weights bj = w1 if tj ⩽ t∗,bj = w2 if tj > t∗, w1∕w2 = log(𝜆1)∕ log(𝜆2), and w1 +w2 = 1, that is, w1 = log(𝜆1)∕{log(𝜆1) + log(𝜆2)},w2 = log(𝜆2)∕{log(𝜆1) + log(𝜆2)}. Under the standard delayed effect scenario where 𝜆2 > 𝜆1 = 1, theoptimal weights that maximize the power function can be easily solved as w1 = 0 and w2 = 1. In otherwords, the most powerful test under the delayed effect scenario is a piecewise weighted log-rank test withthe optimal weights determined by the ratio of log hazard ratios before and after t∗.
Under the condition log(𝜆(t)) = O(n−1∕2) and equal censoring distributions (HE(t) = HC(T)), HE(t) →HC(t) (FE(t) → FC(t)), 𝜋(t) → P1, as n → ∞, the maximum values of the non-centrality mean and power,𝜇∗ and Pow∗, can be further simplified as follows:
Under the general delayed effect scenario:
𝜇∗ = 12
√{log(𝜆1)}2d1 + {log(𝜆2)}2d2,
Pow∗ = Φ{1
2
√{log(𝜆1)}2d1 + {log(𝜆2)}2d2 − Z1− 𝛼
2
}.
Under the standard delayed effect scenario:
u∗ = 12
log(𝜆2)√
d2,
Pow∗ = Φ{1
2log(𝜆2)
√d2 − Z1− 𝛼
2
},
where we consider an equal allocation ratio P0 = P1 = 1∕2, a one-sided 1 − 𝛼∕2 level of significanceand let d1 and d2 denote the number of events accumulated before and after t∗.
Acknowledgements
The opinions and information in this article are those of the authors and do not represent the views and/or policiesof the US Food and Drug Administration. The authors would like to thank Dr Estelle Russek-Cohen for helpful dis-cussions. The simulation study used the high-performance computational capabilities of the Scientific ComputingLaboratory at the Food and Drug Administration, Center for Devices and Radiological Health; the authors wouldalso like to thank the super-computing support team staff especially Mr Mike Mikailov for providing excellenthigh-performance computing service support.
References1. Hoos A, Parmiani G, Hege K, Sznol M, Loibner H, Eggermont A, Urba W, Blumenstein B, Sacks N, Keilholz U, and
Nichol G. A clinical development paradigm for cancer vaccines and related biologics. Journal of Immunotherapy 2007;30(1):1–15.
2. Blattman JN, Greenberg PD. Cancer immunotherapy: a treatment for the masses. Science 2004; 305(5681):200–205.3. Mellman I, Coukos G, Dranoff G. Cancer immunotherapy comes of age. Nature 2011; 480(7378):480–489.4. Melero I, Gaudernack G, Gerritsen W, Huber C, Parmiani G, Scholl S, Thatcher N, Wagstaff J, Zielinski C, Faulkner I, and
Mellstedt H. Therapeutic vaccines for cancer: an overview of clinical trials. Nature Reviews Clinical Oncology 2014; 11(9):509–524.
5. Sliwkowski MX, Mellman I. Antibody therapeutics in cancer. Science 2013; 341(6151):1192–1198.6. Kantoff PW, Higano CS, Shore ND, Berger ER, Small EJ, Penson DF, Redfern CH, Ferrari AC, Dreicer R, Sims RB, Xu Y,
Frohlich MW, and Schellhammer PF. Sipuleucel-T immunotherapy for castration-resistant prostate cancer. New EnglandJournal of Medicine 2010; 363(5):411–422.
604
Copyright © 2016 John Wiley & Sons, Ltd. Statist. Med. 2017, 36 592–605
Z. XU ET AL.
7. George SL, Desu M. Planning the size and duration of a clinical trial studying the time to some critical event. Journal ofChronic Diseases 1974; 27(1):15–24.
8. Schoenfeld D. The asymptotic properties of nonparametric tests for comparing survival distributions. Biometrika 1981;68(1):316–319.
9. Lachin JM, Foulkes MA. Evaluation of sample size and power for analyses of survival with allowance for nonuniformpatient entry, losses to follow-up, noncompliance, and stratification. Biometrics 1986; 42:507–519.
10. Lakatos E. Sample sizes based on the log-rank statistic in complex clinical trials. Biometrics 1988; 44:229–241.11. Gail MH. Sample size estimation when time-to-event is the primary endpoint. Drug Information Journal 1994; 28(3):
865–877.12. Chen TT. Statistical issues and challenges in immuno-oncology. Journal for ImmunoTherapy of Cancer 2013; 1:18.
DOI:10.1186/2051-1426-1-18.13. Self S, Prentice R, Iverson D, Henderson M, Thompson D, Byar D, Insull W, Gorbach SL, Clifford C, Goldman S, Urban
N, Sheppard L, Greenwald P. Statistical design of the women’s health trial. Controlled Clinical Trials 1988; 9(2):119–136.14. Zucker DM, Lakatos E. Weighted log rank type statistics for comparing survival curves when there is a time lag in the
effectiveness of treatment. Biometrika 1990; 77(4):853–864.15. Shih JH. Sample size calculation for complex clinical trials with survival endpoints. Controlled Clinical Trials 1995;
16(6):395–407.16. Fine GD. Consequences of delayed treatment effects on analysis of time-to-event endpoints. Drug Information Journal
2007; 41(4):535–539.17. Zhang D, Quan H. Power and sample size calculation for log-rank test with a time lag in treatment effect. Statistics in
Medicine 2009; 28(5):864–879.18. Hasegawa T. Sample size determination for the weighted log-rank test with the Fleming–Harrington class of weights in
cancer vaccine studies. Pharmaceutical Statistics 2014; 13(2):128–135.19. He P, Su Z. A novel design for randomized immuno-oncology clinical trials with potentially delayed treatment effects.
Contemporary Clinical Trials Communications 2015; 1:28–31.20. Fleming TR, Harrington DP. A class of hypothesis tests for one and two sample censored survival data. Communications
in Statistics-Theory and Methods 1981; 10(8):763–794.21. Harrington DP, Fleming TR. A class of rank test procedures for censored survival data. Biometrika 1982; 69(3):553–566.22. Mehta C. East, 2013. Available at http://www.cytel.com/software.23. Cox DR. Partial likelihood. Biometrika 1975; 62(2):269–276.
Copyright © 2016 John Wiley & Sons, Ltd. Statist. Med. 2017, 36 592–605
605