design optimization using the latest features in helioscope
TRANSCRIPT

Design Optimization using the Latest
Features in HelioScope
October 2016
1

Agenda
1. Latest Features in HelioScope
2. Implications for Design Optimization
3. HelioScope Development Roadmap
2

About Folsom Labs & HelioScope
• Solar-focused software company
• Based in San Francisco, CA
• Flagship product is HelioScope
3
• Cloud-based sales & design software
• Integrates system design and
performance modeling
• Similar math to PVsyst (PAN file
support, irradiance calculations, etc.)
• Used for preliminary layouts, value-
engineering, and bankable energy yield
calculations
• Used on projects of all sizes
(residential, commercial, utility)
• 7,000 Users worldwide

1. Latest Features in HelioScope
4

The Latest Features in HelioScope
Performance Modeling
• Spectral adjustment & weather datasets
• Sub-hourly calculations
Engineering Process
• Team management
• Design profiles
• Permit generator (SLD, site plan)
• Document center
Design Environment
• Stringing for dual-MPPT inverters
• Automatic stringing based on ASHRAE
temperatures
• More robust AC circuit calculations
• 3D mode & improved visualization
• New layout parameters:
– East-West Racking
– Stackable Field Segments
– Frame Spacing
– Module Alignment Options
5

Performance Modeling
• Spectral adjustment & weather datasets
• Sub-hourly calculations
Engineering Process
• Team management
• Design profiles
• Permit generator (SLD, site plan)
• Document center
Design Environment
• Stringing for dual-MPPT inverters
• Automatic stringing based on ASHRAE
temperatures
• More robust AC circuit calculations
• 3D mode & improved visualization
• New layout parameters:
– East-West Racking
– Stackable Field Segments
– Frame Spacing
– Module Alignment Options
6
The Latest Features in HelioScope

Spectral Adjustment
• First Solar Spectral Adjustment (Lee, M. et al, PVSC 2015):
𝑀 ≈ 1.266 − 0.091𝑒1.199 ∙ (𝑝𝑤𝑎𝑡+0.5)−0.21
𝑀 = spectral shift
𝑝𝑤𝑎𝑡 = precipitable water
• Default for CdTe modules
• Weather Data - the biggest barrier
– Only 7% of >25k datasets in HelioScope contain 𝑝𝑤𝑎𝑡
– 𝑝𝑤𝑎𝑡 calculated from Relative Humidity or Dew Point Temp for 87% of datasets
– Rewrote parsers for all weather data sources
7

Automatic Stringing based on ASHRAE Temperatures
8

3D Mode, Stacking Field Segments, and East-West Racking
9

LiDAR (feature-gated)
10

2. Implications for Design Optimization
11

Less Reliance on Rules of Thumb
Example: Shade Tolerance
• Rule: winter solstice shade
exclusions (10am-2pm) are
needed for shade setbacks
• Advantages:
– Adjusts for location
– Fairly straightforward to
calculate
• Disadvantage:
– not all hours are created equal
12

Less Reliance on Rules of Thumb
13
Heatmap of annual
shade losses for
each module
Shade losses
calculated based on
hourly weather file
and shade patterns

More Optimization, Across More Complex Designs
14
Shade (%)
Power (kW)
Yield (kWh/kWp)
Energy (MWh/year)
96.3
1,684
162
98.3
1,674
165
108.8
1,668
181
122.4
1,647
201
2.7%
10am to
2pm
15% Shade
Threshold
10% Shade
Threshold
5% Shade
Threshold
2.7% 3.2% 4.4%
+27%
-3%
+24%

Performance Modeling using LiDAR
15
Terrain Modeling
Image curtesy of iq.intel.com
Improved Shade
Obstruction Modeling

3. Product Roadmap
16

Product Roadmap
• Expand LiDAR
• Optimization incorporating project financials & customer proposals
• Tracker modeling
• Advanced inverter modeling (current limiting, temperature dependency)
• Sub-module MPPT
• NSRDB and proprietary weather sources
• Spectral adjustment for non-CdTe modules
17

Thank you!
18


Additional Resources
20
http://www.folsomlabs.com/resources
Voltage Drop
AnalysisShading
OptimizationBinning
Cost/Benefit String Inverter
Energy Yield
AnalysisWiring
Optimization
Case Study
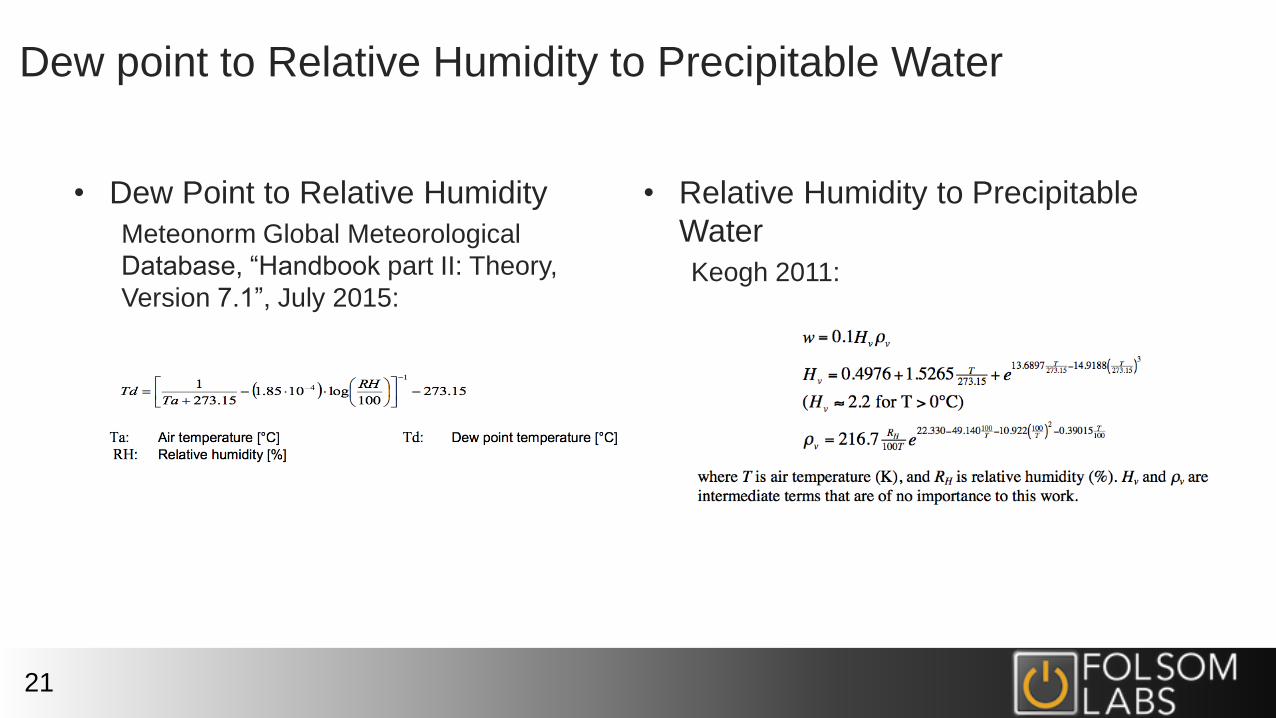
Dew point to Relative Humidity to Precipitable Water
21
• Dew Point to Relative Humidity
Meteonorm Global Meteorological
Database, “Handbook part II: Theory,
Version 7.1”, July 2015:
• Relative Humidity to Precipitable
Water
Keogh 2011: