design considerations for large roof-integrated photovoltaic arrays
TRANSCRIPT
Design Considerations forLarge Roof-integratedPhotovoltaic ArraysMichael E. Ropp,1� Miroslav Begovic,1 Ajeet Rohatgi1 and Richard Long2
1UCEP, College of Electrical and Computer Engineering, Georgia Institute of Technology, Atlanta,GA 30332-0250, USA2O�ce of Facilities, Georgia Institute of Technology, Atlanta, GA 30332, USA
This paper describes calculations and modeling used in the design of the photovoltaic
(PV) array built on the roof of the Georgia Tech Aquatic Center, the aquatic sports
venue for the 1996 Olympic and Paralympic Games. The software package PVFORM
(version 3.3) was extensively utilized; because of its importance to this work, it is
thoroughly reviewed here. Procedures required to adapt PVFORM to this particular
installation are described. The expected behavior and performance of the system,
including maximum power output, annual energy output and maximum expected
temperature, are then presented, and the use of this information in making informed
design decisions is described. Finally, since the orientation of the PV array is not
optimal, the e�ect of the unoptimized array orientation on the system's performance is
quanti®ed. # 1997 by John Wiley & Sons, Ltd. Progr. Photovolt. 5: 55±67, 1997
(No. of Figures: 8. No. of Tables: 0. No. of Refs: 12.)
INTRODUCTION
Photovoltaic (PV) systems o�er an environmentally friendly way to meet growing electricitydemand. They also o�er several other advantages that could make them attractive for manyapplications, such as modularity, peak-shaving compatibility and point-of-load generation
capability. However, the widespread use of photovoltaics has been impeded by its cost. Photovoltaic-generated electric energy presently costs about $0.25±0.35 kWhÿ1 installed, compared to a nationalaverage of about $0:08 kWhÿ1 for generation by fossil fuels. Although the PV devices themselvescontribute much of the cost, other system components and installation costs are also of great importanceand will continue to increase in importance as PV cells become less expensive. Therefore, demonstrationprojects o�ering experience with PV system components and design practices are very important in orderto continue the downward trend in PV electricity costs. Demonstration projects can also be important inincreasing the public's awareness of photovoltaics as a viable electric power generation technology.
This paper discusses one such projectÐa grid-connected PV system on the roof of the Georgia TechAquatic Center which was used as the swimming venue for the 1996 Olympic and Paralympic Games inAtlanta. The sponsors for this project are the owner of the pool (Georgia Tech), the local utility (GeorgiaPower Company) and the US Department of Energy (DOE). Each has bene®ted from the project in
CCC 1062±7995/97/010055±13$17.50 Received 3 October 1996# 1997 by John Wiley & Sons, Ltd. Revised 22 November 1996
PROGRESS IN PHOTOVOLTAICS: RESEARCH AND APPLICATIONS, VOL. 5, 55±67 (1997)
Applications
� Correspondence to: M. E. Ropp, UCEP, School of Electrical Engineering, Georgia Institute of Technology, Atlanta,GA 30332-250, USA
Contract grant sponsor: US Department of EnergyContract grant sponsor: Georgia Power CompanyContract grant sponsor: Georgia Institute of Technology
di�erent ways: the owners have substantially reduced their electricity bill, the local utility has the neededpeak-shaving support due to the match between PV generation and the utility's demand pro®le, and theDOE has gained an excellent opportunity to showcase PV technology in front of a worldwide audienceof Olympic spectators.
The design of such a large, roof-integrated PV system is greatly facilitated by the use of modelingprograms which can accurately describe the PV system performance as well as the conditions which willbe experienced by the system under actual conditions. The use of such models in the design of the GeorgiaTech Aquatic Center PV system is the topic of this paper.
DESCRIPTION OF THE SYSTEM
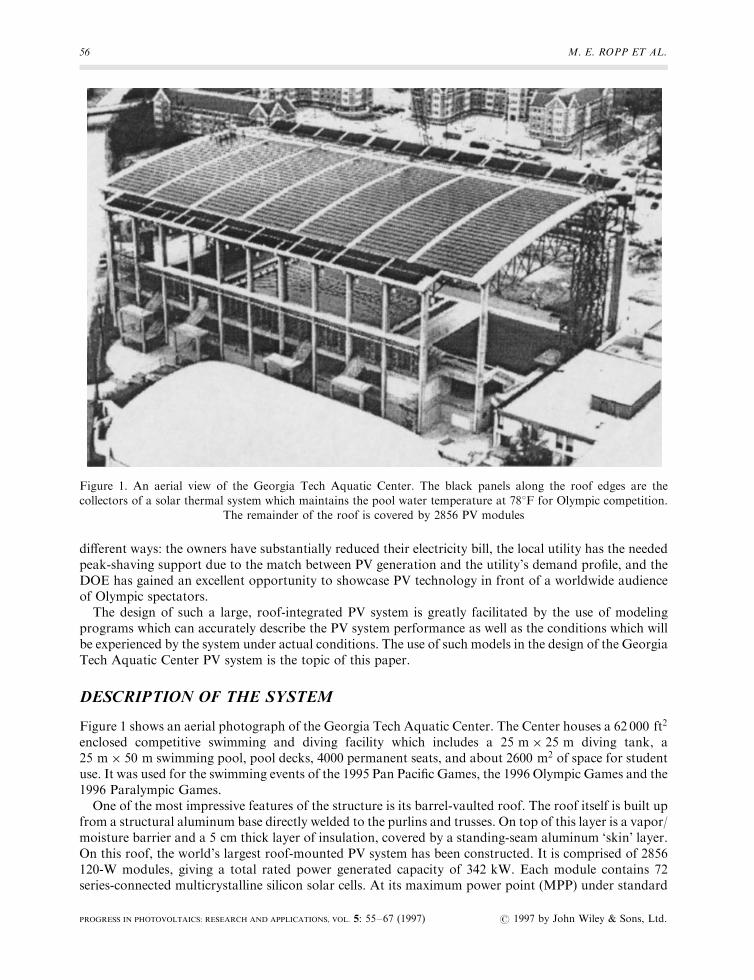
Figure 1 shows an aerial photograph of the Georgia Tech Aquatic Center. The Center houses a 62 000 ft2
enclosed competitive swimming and diving facility which includes a 25 m� 25 m diving tank, a25 m� 50 m swimming pool, pool decks, 4000 permanent seats, and about 2600 m2 of space for studentuse. It was used for the swimming events of the 1995 Pan Paci®c Games, the 1996 Olympic Games and the1996 Paralympic Games.
One of the most impressive features of the structure is its barrel-vaulted roof. The roof itself is built upfrom a structural aluminum base directly welded to the purlins and trusses. On top of this layer is a vapor/moisture barrier and a 5 cm thick layer of insulation, covered by a standing-seam aluminum `skin' layer.On this roof, the world's largest roof-mounted PV system has been constructed. It is comprised of 2856120-W modules, giving a total rated power generated capacity of 342 kW. Each module contains 72series-connected multicrystalline silicon solar cells. At its maximum power point (MPP) under standard
56 M. E. ROPP ET AL.
Figure 1. An aerial view of the Georgia Tech Aquatic Center. The black panels along the roof edges are the
collectors of a solar thermal system which maintains the pool water temperature at 788F for Olympic competition.The remainder of the roof is covered by 2856 PV modules
PROGRESS IN PHOTOVOLTAICS: RESEARCH AND APPLICATIONS, VOL. 5: 55±67 (1997) # 1997 by John Wiley & Sons, Ltd.
test conditions (STC: 258C cell temperature, 1 kW mÿ2 incident irradiation), the array will produce833 Adc at 410 Vdc . The DC power is routed to a three-phase, pulse-width-modulated power conditioningunit (PCU), the AC output of which backfeeds an AC circuit breaker in the Aquatic Center's distributionservice entrance. (Note: the terms `PCU' and `inverter' are used interchangeably in this paper.) In thisway, the PV array will provide roughly one-third of the electric energy required by the Aquatic Center.
BRIEF REVIEW OF PVFORM
PVFORM (version 3.3) is a comprehensive PV system simulation software package prepared by SandiaNational Laboratories. This program is generally accepted to be one of the most accurate and powerfulPV system computer models available today.1;2 The primary features of the package which make it such auseful analysis and design tool for PV systems are its two main submodels: the Perez anisotropic di�useirradiance model and the Fuentes thermal model.3 This section reviews these submodels. AlthoughPVFORM has been in existence for over 10 years and is relatively well-known among the PV community,this review is included to provide a sound basis for understanding the correct use and interpretation of theresults presented in this paper.
Generally, the solar irradiation, or insolation, in the plane of the array must be computed frommeasured values of the total (global) insolation on a horizontal surface, usually augmented by ameasurement of one of the components of the horizontal insolation: the direct insolation (Dh), whichcomes directly from the solar disk, or the di�use irradiation (dh), which is scattered by variousmechanisms before it strikes the horizontal surface. The plane-of-array insolation (S) consists of threecomponents: direct (Dpoa), di�use (dpoa) and a ground-re¯ected component (Dre¯). The direct componentDpoa can be determined with very little error, since it depends primarily on the position of the sun in thesky, which is a well-known function of several easily available variables, and on the array orientation.4
Cloudiness and other atmospheric factors are accounted for using the measured data. The ground-re¯ected component is given by5
Drefl � rGhf0:5�1 ÿ cos�s��gwhere r is the albedo (re¯ectance) of the surrounding ground, s is the array tilt angle and Gh is thehorizontal global irradiation. Correct determination of r has been shown to be important,5 but itsimportance for the Aquatic Center array is minimal because its tilt angle is very low. Determining thedi�use insolation, dpoa , is considerably more di�cult; in fact, the submodel which calculates the di�useinsolation in the plane of the array is a major limiting factor in the accuracy of PV system performancepredictions.1 The Perez anisotropic di�use irradiance model addresses this limitation by separating thesky into three components with di�erent brightnesses: the circumsolar disk, a `horizon band', and anisotropic background. In PVFORM, a simpli®ed version of the Perez model is used which assumes thehorizon band to have only in®nitesimal height. With this assumption, the expression for the di�useinsolation on the array becomes4
dpoa � dhf0:5�1 � cos�s���1 ÿ F 01� � F 01a
c
� �� F 02 sin�s�g
where F 01 and F 02 are the `reduced brightness coe�cients' for the circumsolar and horizon band regions,respectively, and a and c are the solid angular size of the circumsolar region weighted by its averageincidences on the tilted array and the horizontal surface, respectively.4 Both F 01 and F 02 are selected byPVFORM from a set of empirically determined values. The required inputs to the model are the directnormal irradiation and the global horizontal irradiation.
The Fuentes thermal model uses an equation for the cell temperature derived directly from an energybalance on the PV module
hc�Tc ÿ Ta� � es�T 4c ÿ T 4
s � � es�T 4c ÿ T 4
g� � mcdT c
dtÿ aS � 0
LARGE ROOF-INTEGRATED PHOTOVOLTAIC ARRAYS 57
# 1997 by John Wiley & Sons, Ltd. PROGRESS IN PHOTOVOLTAICS: RESEARCH AND APPLICATIONS, VOL. 5: 55±67 (1997)
where hc is the convective heat transfer coe�cient (calculated by PVFORM), Tc is the cell temperature, Ta
is the ambient temperature, e is the total emissivity of the module, s is the Stefan±Boltzmann constant, Ts
is the `sky temperature' (the e�ective radiating temperature of the sky, which is di�erent from Ta andis calculated by PVFORM), Tg is the ground temperature (calculated by PVFORM), m is the massof the module, c is the module's heat capacity, a � �1 ÿ r��1 ÿ Z� (where r is the module re¯ectance andZ is the module's conversion e�ciency) is the fraction of insolation converted into heat and S � Dpoa�dpoa � Drefl is the global plane-of-array insolation.6 In order from left to right, the terms represent con-vection to the air, radiation to the sky, radiation to the ground, the rate of change of thermal energy storedwithin the module and absorption of sunlight. Conduction is neglected. After linearization of the fourth-order temperature terms and assuming a linear variation between insolation data points, the energybalance equation is solved for Tc , leading to an equation which is solved iteratively to obtain the celltemperature6
Tc �hcTa � hrsT s � hrgTg � aS0 � a
DSL
� �� �1 ÿ eL� � aDS
hc � hrs � hrg� Tc0e
L
where
hrs � es�T 2c � T 2
s ��T c � T s�hrg � es�T 2
c � T 2g��T c � Tg�
S � S0 � DSt
Dt
L � ÿ �hc � hrs � hrg� Dtmc
Tc0 � cell temperature at start of Dt
As inputs, the submodel requires the ambient temperature, the insolation and the wind speed which isimportant in calculating hc .
Once the cell temperature is known, PVFORM can calculate the e�ciency of the cells using giventemperature derating coe�cients, and then the plane-of-array insolation can be used to calculate thearray's DC power output. A derating factor of 14%, which includes a 10% `dust factor' and 2% each forinterconnect and mismatch losses, is also included in our calculations. Implicit in this calculation is theassumption that the array is always operating at its MPP, an assumption which leads to consistentoverestimation of the array's power output.2
To obtain AC results for grid-interactive applications such as ours, PVFORM also includes a PCUsubmodel which uses a piecewise-de®ned function of the unit's e�ciency as a function of the fractionalloading, or the ratio of the array's DC power output to the unit's rated (full-load) power capacity7
ZPCU � ZPCU;relZPCU;rated
0:91
� �where
ZPCU;rated � PCU efficiency at rated capacity
ZPCU;rel �8:46 F ÿ 0:15; 04 F < 0:1;
0:774 � 0:663 F ÿ 0:952 F 2 � 0:426 F 3; F 5 0:1
�F � PV array output power
PCU rated capacity
58 M. E. ROPP ET AL.
PROGRESS IN PHOTOVOLTAICS: RESEARCH AND APPLICATIONS, VOL. 5: 55±67 (1997) # 1997 by John Wiley & Sons, Ltd.
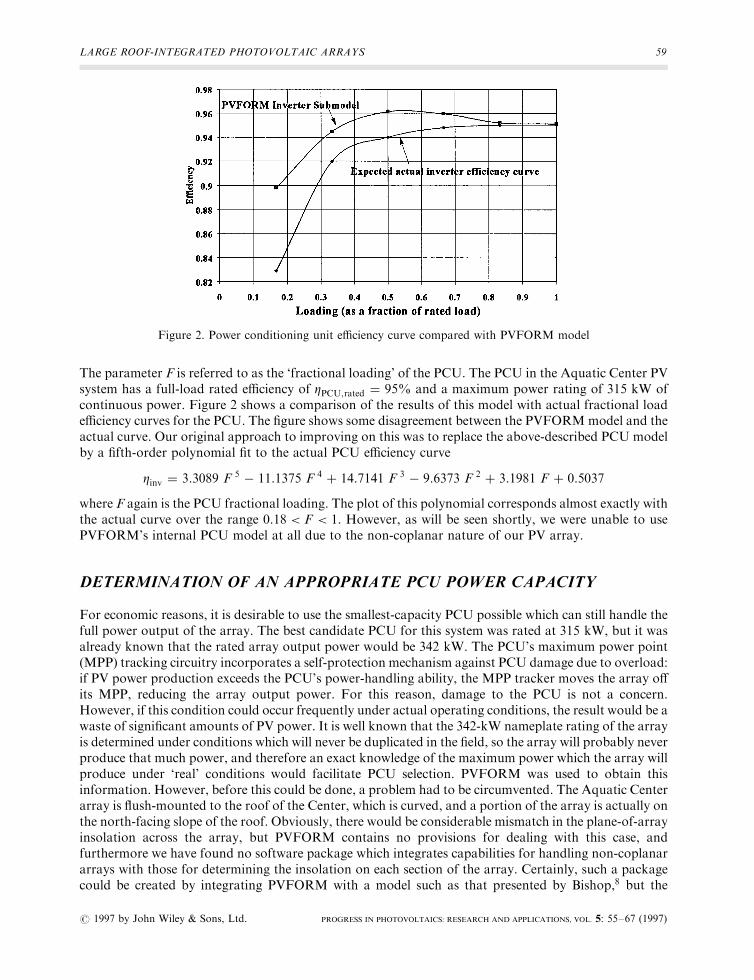
The parameter F is referred to as the `fractional loading' of the PCU. The PCU in the Aquatic Center PVsystem has a full-load rated e�ciency of ZPCU;rated � 95% and a maximum power rating of 315 kW ofcontinuous power. Figure 2 shows a comparison of the results of this model with actual fractional loade�ciency curves for the PCU. The ®gure shows some disagreement between the PVFORMmodel and theactual curve. Our original approach to improving on this was to replace the above-described PCU modelby a ®fth-order polynomial ®t to the actual PCU e�ciency curve
Zinv � 3:3089 F 5 ÿ 11:1375 F 4 � 14:7141 F 3 ÿ 9:6373 F 2 � 3:1981 F � 0:5037
where F again is the PCU fractional loading. The plot of this polynomial corresponds almost exactly withthe actual curve over the range 0:18 < F < 1. However, as will be seen shortly, we were unable to usePVFORM's internal PCU model at all due to the non-coplanar nature of our PV array.
DETERMINATION OF AN APPROPRIATE PCU POWER CAPACITY
For economic reasons, it is desirable to use the smallest-capacity PCU possible which can still handle thefull power output of the array. The best candidate PCU for this system was rated at 315 kW, but it wasalready known that the rated array output power would be 342 kW. The PCU's maximum power point(MPP) tracking circuitry incorporates a self-protection mechanism against PCU damage due to overload:if PV power production exceeds the PCU's power-handling ability, the MPP tracker moves the array o�its MPP, reducing the array output power. For this reason, damage to the PCU is not a concern.However, if this condition could occur frequently under actual operating conditions, the result would be awaste of signi®cant amounts of PV power. It is well known that the 342-kW nameplate rating of the arrayis determined under conditions which will never be duplicated in the ®eld, so the array will probably neverproduce that much power, and therefore an exact knowledge of the maximum power which the array willproduce under `real' conditions would facilitate PCU selection. PVFORM was used to obtain thisinformation. However, before this could be done, a problem had to be circumvented. The Aquatic Centerarray is ¯ush-mounted to the roof of the Center, which is curved, and a portion of the array is actually onthe north-facing slope of the roof. Obviously, there would be considerable mismatch in the plane-of-arrayinsolation across the array, but PVFORM contains no provisions for dealing with this case, andfurthermore we have found no software package which integrates capabilities for handling non-coplanararrays with those for determining the insolation on each section of the array. Certainly, such a packagecould be created by integrating PVFORM with a model such as that presented by Bishop,8 but the
LARGE ROOF-INTEGRATED PHOTOVOLTAIC ARRAYS 59
Figure 2. Power conditioning unit e�ciency curve compared with PVFORM model
# 1997 by John Wiley & Sons, Ltd. PROGRESS IN PHOTOVOLTAICS: RESEARCH AND APPLICATIONS, VOL. 5: 55±67 (1997)

computation time involved in simulating an array like the one on the Aquatic Center would be extreme.To avoid these di�culties, we adopted a simpler approach.
On the south-facing side of the roof, the tilt angles of the modules vary from about 138 up fromhorizontal to 08, with an average tilt of 6.48; on the north-facing side, the variation is from about 28 toabout 108, with an average tilt of 5.98. All series strings are coplanar; there is no insolation mismatchbetween series-connected modules. Since the sections of the array which are under di�erential illumina-tion are connected in parallel, their operating voltages will be a�ected. However, it is well-known thatthe voltage of a PV module or array is only logarithmically dependent on the insolation, and therefore arelatively large di�erence in insolation is required to produce an appreciable change in voltage.Considering the north-facing and south-facing sides of the roof separately, we noted that the variationsfrom the average tilt on each side are small, and thus, with the above-mentioned consideration about therelative insensitivity of voltage to insolation variations taken into account, the insolation over each side ofthe roof could be considered to be roughly uniform. Each side of the roof could then be modeled as aseparate array with tilt equal to the average tilt on that side. However, a suitable method for combiningthe two subarrays was required. PVFORM will assume that each subarray operates at its maximumpower point, thus ignoring their interaction (e�ectively `decoupling' them). Due to their parallel inter-connection and voltage interaction this will not be strictly true; each subarray will slightly pull the othero� its MPP. If it could be shown that the insolation di�erence between the two parallel-connectedsubarrays is su�ciently small, the power output of the subarrays computed independently by PVFORMand that actually produced under parallel interconnection would be almost the same, and the total arraypower output could then be computed by simply summing the power and energy outputs of the twosubarrays. First, PVFORM was employed to quantify the di�erence in insolation between the twosubarrays. It was found that the maximum insolation mismatch occurred during a time at which therewas 645 W mÿ2 of insolation on the south-facing side. If the mismatch was de®ned as
Gmismatch � Gsouth ÿ Gnorth
then Gmismatch at the time described above was 165 W mÿ2. Then, a software package called IVCURVEwas employed to determine the amount of voltage mismatch between the two subarrays while operatingat their maximum power points. IVCURVE computes the array I±V curve when given the insolation,module temperature and the module electrical parameters. It also can calculate the current and powerproduced by the array if given the operating voltage, so the maximum power point can be located byiteration, substituting in voltage values until the maximum in power is located. Under the conditionsdescribed above, it was found that VMP for the south-facing side was about 363 V and that for the northside was 10 V lower. This represents just under a 3% di�erence in voltage. To predict what the `real'operating voltage would be under this condition, we note that the south-facing subarray accounts for82% of the total array area and should therefore operate closer to its decoupled voltage than the north-facing side will. Thus, we linearly scale the di�erence between the two operating voltages and predict thatthe real, coupled operating voltage will be about 361 V. Plugging this operating voltage into IVCURVEand computing the PV power produced by the two subarrays, we ®nd that the di�erence in the predictedpower output between the decoupled subarrays and the parallel-interconnected subarrays would be onlyabout ÿ0:1%. This is a negligible error, particularly when compared with other known errors such asthat introduced by the assumption of 100% e�cient maximum power point tracking, which can be nearly5%.2 Therefore, the approach of modeling the Aquatic Center array as two independent subarrays andthen adding their power outputs is justi®ed and will result in negligible error.
Using this approach, the array's power output over the course of a year was calculated. Figure 3 showsa histogram of the array DC power output based on the Typical Meteorological Year (TMY) for Atlanta.(Note: the National Renewable Energy Laboratory (NREL) has recently produced a new set of TMYscalled TMY2s, which are more accurate than the TMY. However, some di�culty has been experienced inusing these data with PVFORM. Large spikes have been observed in the plane-of-array insolationcalculated from TMY2 raw data. For this reason, the TMY has been retained in this study, and work is
60 M. E. ROPP ET AL.
PROGRESS IN PHOTOVOLTAICS: RESEARCH AND APPLICATIONS, VOL. 5: 55±67 (1997) # 1997 by John Wiley & Sons, Ltd.
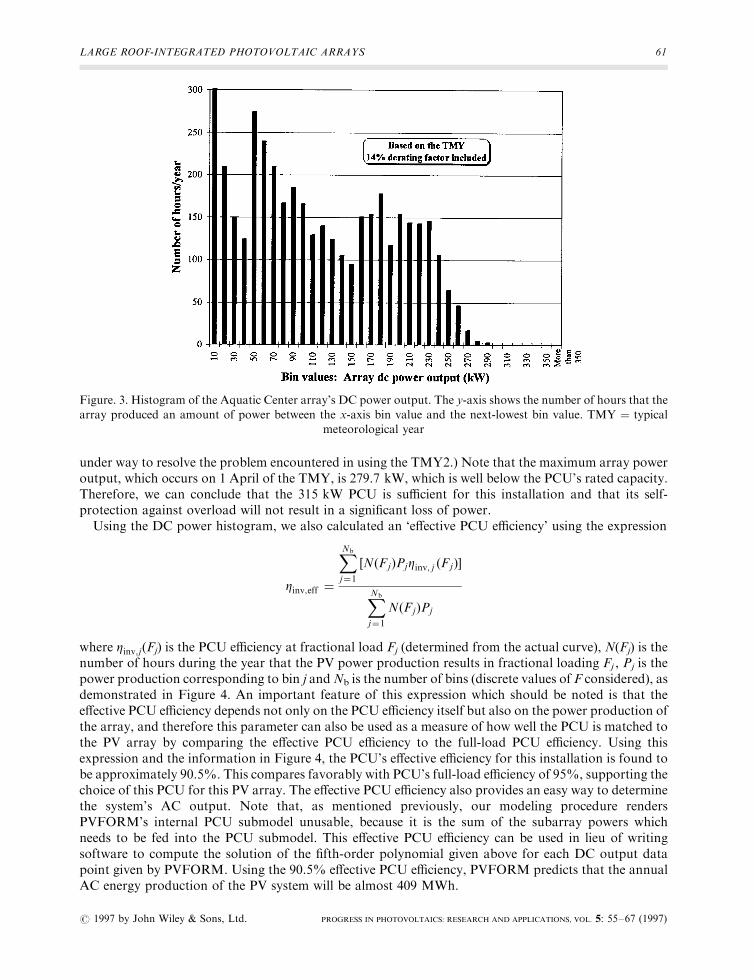
under way to resolve the problem encountered in using the TMY2.) Note that the maximum array poweroutput, which occurs on 1 April of the TMY, is 279.7 kW, which is well below the PCU's rated capacity.Therefore, we can conclude that the 315 kW PCU is su�cient for this installation and that its self-protection against overload will not result in a signi®cant loss of power.
Using the DC power histogram, we also calculated an `e�ective PCU e�ciency' using the expression
Zinv;eff �
XNb
j�1�N�Fj�PjZinv; j �Fj��
XNb
j�1N�Fj�Pj
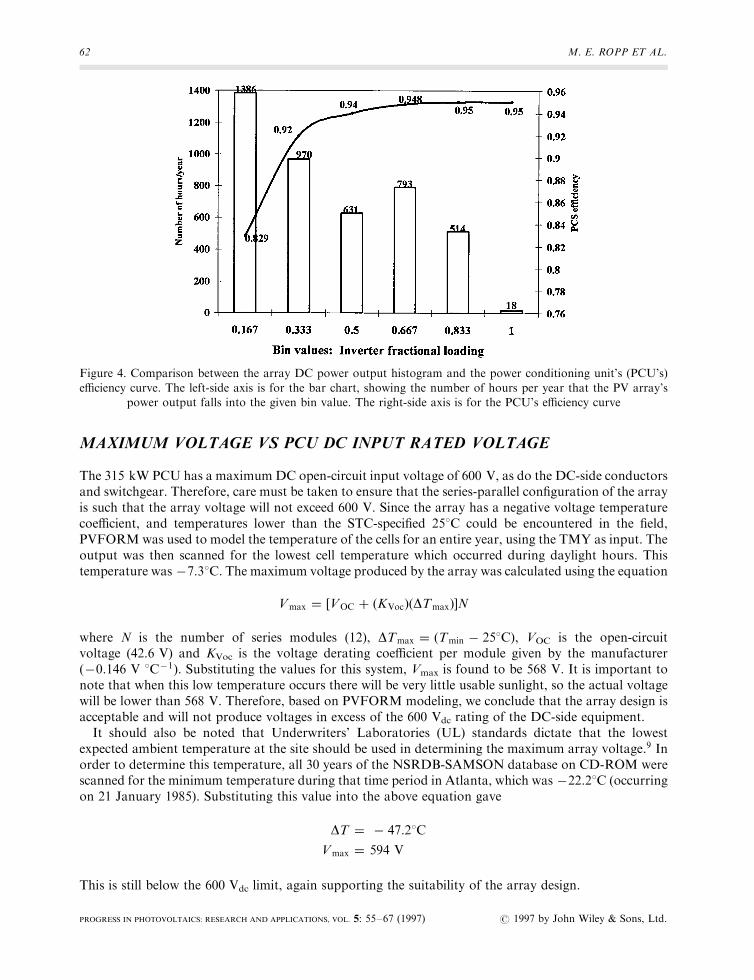
where Zinv;j(Fj) is the PCU e�ciency at fractional load Fj (determined from the actual curve), N(Fj) is thenumber of hours during the year that the PV power production results in fractional loading Fj , Pj is thepower production corresponding to bin j andNb is the number of bins (discrete values of F considered), asdemonstrated in Figure 4. An important feature of this expression which should be noted is that thee�ective PCU e�ciency depends not only on the PCU e�ciency itself but also on the power production ofthe array, and therefore this parameter can also be used as a measure of how well the PCU is matched tothe PV array by comparing the e�ective PCU e�ciency to the full-load PCU e�ciency. Using thisexpression and the information in Figure 4, the PCU's e�ective e�ciency for this installation is found tobe approximately 90.5%. This compares favorably with PCU's full-load e�ciency of 95%, supporting thechoice of this PCU for this PV array. The e�ective PCU e�ciency also provides an easy way to determinethe system's AC output. Note that, as mentioned previously, our modeling procedure rendersPVFORM's internal PCU submodel unusable, because it is the sum of the subarray powers whichneeds to be fed into the PCU submodel. This e�ective PCU e�ciency can be used in lieu of writingsoftware to compute the solution of the ®fth-order polynomial given above for each DC output datapoint given by PVFORM. Using the 90.5% e�ective PCU e�ciency, PVFORM predicts that the annualAC energy production of the PV system will be almost 409 MWh.
LARGE ROOF-INTEGRATED PHOTOVOLTAIC ARRAYS 61
Figure. 3. Histogram of the Aquatic Center array's DC power output. The y-axis shows the number of hours that the
array produced an amount of power between the x-axis bin value and the next-lowest bin value. TMY � typicalmeteorological year
# 1997 by John Wiley & Sons, Ltd. PROGRESS IN PHOTOVOLTAICS: RESEARCH AND APPLICATIONS, VOL. 5: 55±67 (1997)
MAXIMUM VOLTAGE VS PCU DC INPUT RATED VOLTAGE
The 315 kW PCU has a maximum DC open-circuit input voltage of 600 V, as do the DC-side conductorsand switchgear. Therefore, care must be taken to ensure that the series-parallel con®guration of the arrayis such that the array voltage will not exceed 600 V. Since the array has a negative voltage temperaturecoe�cient, and temperatures lower than the STC-speci®ed 258C could be encountered in the ®eld,PVFORMwas used to model the temperature of the cells for an entire year, using the TMY as input. Theoutput was then scanned for the lowest cell temperature which occurred during daylight hours. Thistemperature was ÿ7:38C. The maximum voltage produced by the array was calculated using the equation
Vmax � �VOC � �KVoc��DTmax��N
where N is the number of series modules (12), DTmax � �Tmin ÿ 258C�, VOC is the open-circuitvoltage (42.6 V) and KVoc is the voltage derating coe�cient per module given by the manufacturer�ÿ0:146 V 8Cÿ1�. Substituting the values for this system, Vmax is found to be 568 V. It is important tonote that when this low temperature occurs there will be very little usable sunlight, so the actual voltagewill be lower than 568 V. Therefore, based on PVFORM modeling, we conclude that the array design isacceptable and will not produce voltages in excess of the 600 Vdc rating of the DC-side equipment.
It should also be noted that Underwriters' Laboratories (UL) standards dictate that the lowestexpected ambient temperature at the site should be used in determining the maximum array voltage.9 Inorder to determine this temperature, all 30 years of the NSRDB-SAMSON database on CD-ROM werescanned for the minimum temperature during that time period in Atlanta, which was ÿ22:28C (occurringon 21 January 1985). Substituting this value into the above equation gave
DT � ÿ 47:28C
Vmax � 594 V
This is still below the 600 Vdc limit, again supporting the suitability of the array design.
62 M. E. ROPP ET AL.
Figure 4. Comparison between the array DC power output histogram and the power conditioning unit's (PCU's)
e�ciency curve. The left-side axis is for the bar chart, showing the number of hours per year that the PV array'spower output falls into the given bin value. The right-side axis is for the PCU's e�ciency curve
PROGRESS IN PHOTOVOLTAICS: RESEARCH AND APPLICATIONS, VOL. 5: 55±67 (1997) # 1997 by John Wiley & Sons, Ltd.
INVESTIGATION OF THE EFFECTS OF STANDOFF HEIGHT
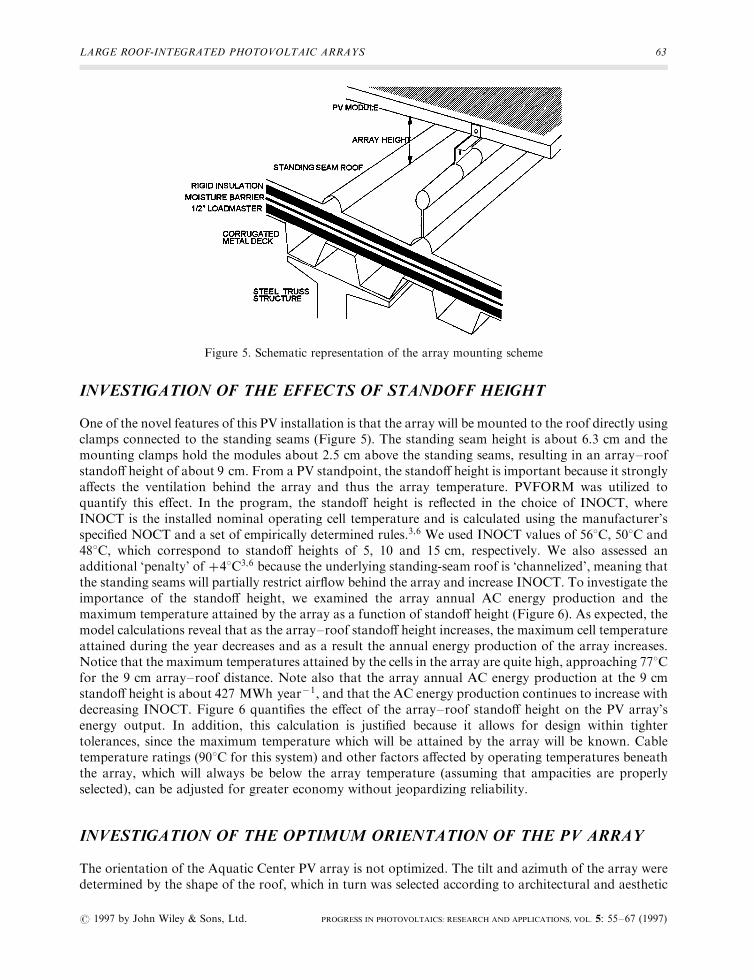
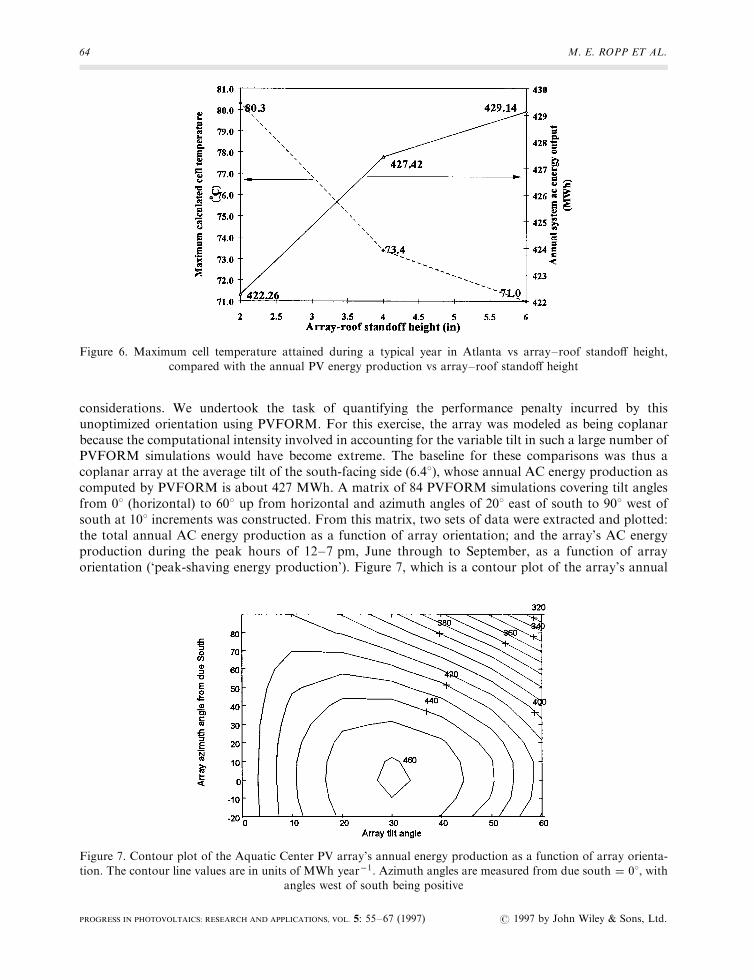
One of the novel features of this PV installation is that the array will be mounted to the roof directly usingclamps connected to the standing seams (Figure 5). The standing seam height is about 6.3 cm and themounting clamps hold the modules about 2.5 cm above the standing seams, resulting in an array±roofstando� height of about 9 cm. From a PV standpoint, the stando� height is important because it stronglya�ects the ventilation behind the array and thus the array temperature. PVFORM was utilized toquantify this e�ect. In the program, the stando� height is re¯ected in the choice of INOCT, whereINOCT is the installed nominal operating cell temperature and is calculated using the manufacturer'sspeci®ed NOCT and a set of empirically determined rules.3;6 We used INOCT values of 568C, 508C and488C, which correspond to stando� heights of 5, 10 and 15 cm, respectively. We also assessed anadditional `penalty' of �48C3;6 because the underlying standing-seam roof is `channelized', meaning thatthe standing seams will partially restrict air¯ow behind the array and increase INOCT. To investigate theimportance of the stando� height, we examined the array annual AC energy production and themaximum temperature attained by the array as a function of stando� height (Figure 6). As expected, themodel calculations reveal that as the array±roof stando� height increases, the maximum cell temperatureattained during the year decreases and as a result the annual energy production of the array increases.Notice that the maximum temperatures attained by the cells in the array are quite high, approaching 778Cfor the 9 cm array±roof distance. Note also that the array annual AC energy production at the 9 cmstando� height is about 427 MWh yearÿ1, and that the AC energy production continues to increase withdecreasing INOCT. Figure 6 quanti®es the e�ect of the array±roof stando� height on the PV array'senergy output. In addition, this calculation is justi®ed because it allows for design within tightertolerances, since the maximum temperature which will be attained by the array will be known. Cabletemperature ratings (908C for this system) and other factors a�ected by operating temperatures beneaththe array, which will always be below the array temperature (assuming that ampacities are properlyselected), can be adjusted for greater economy without jeopardizing reliability.
INVESTIGATION OF THE OPTIMUM ORIENTATION OF THE PV ARRAY
The orientation of the Aquatic Center PV array is not optimized. The tilt and azimuth of the array weredetermined by the shape of the roof, which in turn was selected according to architectural and aesthetic
LARGE ROOF-INTEGRATED PHOTOVOLTAIC ARRAYS 63
Figure 5. Schematic representation of the array mounting scheme
# 1997 by John Wiley & Sons, Ltd. PROGRESS IN PHOTOVOLTAICS: RESEARCH AND APPLICATIONS, VOL. 5: 55±67 (1997)
considerations. We undertook the task of quantifying the performance penalty incurred by thisunoptimized orientation using PVFORM. For this exercise, the array was modeled as being coplanarbecause the computational intensity involved in accounting for the variable tilt in such a large number ofPVFORM simulations would have become extreme. The baseline for these comparisons was thus acoplanar array at the average tilt of the south-facing side (6.48), whose annual AC energy production ascomputed by PVFORM is about 427 MWh. A matrix of 84 PVFORM simulations covering tilt anglesfrom 08 (horizontal) to 608 up from horizontal and azimuth angles of 208 east of south to 908 west ofsouth at 108 increments was constructed. From this matrix, two sets of data were extracted and plotted:the total annual AC energy production as a function of array orientation; and the array's AC energyproduction during the peak hours of 12±7 pm, June through to September, as a function of arrayorientation (`peak-shaving energy production'). Figure 7, which is a contour plot of the array's annual
64 M. E. ROPP ET AL.
Figure 6. Maximum cell temperature attained during a typical year in Atlanta vs array±roof stando� height,
compared with the annual PV energy production vs array±roof stando� height
Figure 7. Contour plot of the Aquatic Center PV array's annual energy production as a function of array orienta-
tion. The contour line values are in units of MWh yearÿ1. Azimuth angles are measured from due south � 08, withangles west of south being positive
PROGRESS IN PHOTOVOLTAICS: RESEARCH AND APPLICATIONS, VOL. 5: 55±67 (1997) # 1997 by John Wiley & Sons, Ltd.
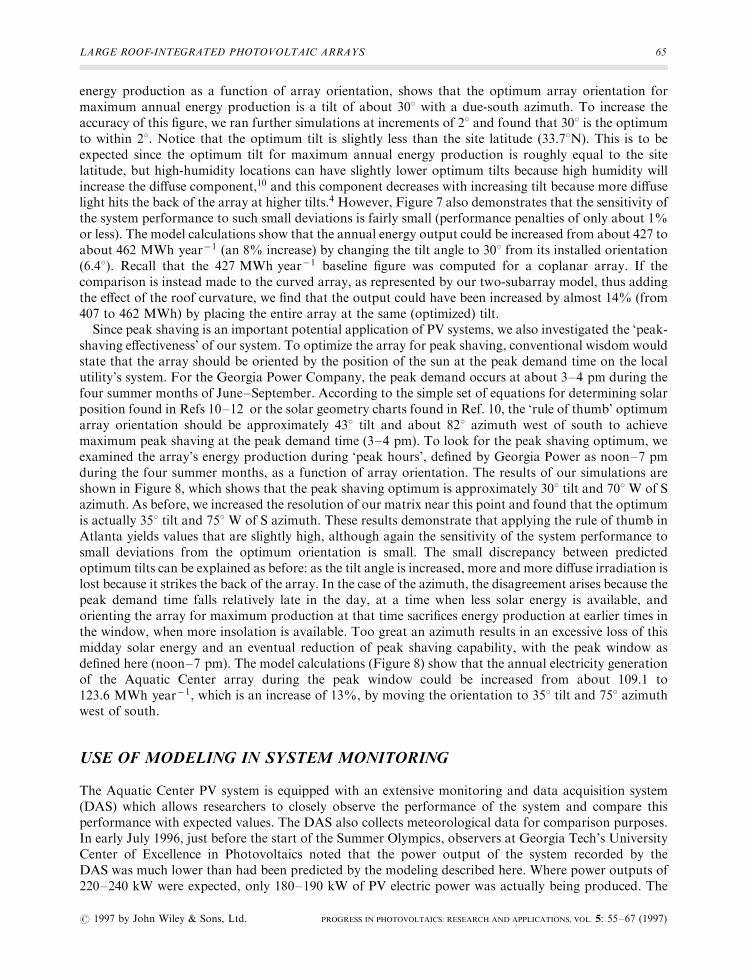
energy production as a function of array orientation, shows that the optimum array orientation formaximum annual energy production is a tilt of about 308 with a due-south azimuth. To increase theaccuracy of this ®gure, we ran further simulations at increments of 28 and found that 308 is the optimumto within 28. Notice that the optimum tilt is slightly less than the site latitude (33.78N). This is to beexpected since the optimum tilt for maximum annual energy production is roughly equal to the sitelatitude, but high-humidity locations can have slightly lower optimum tilts because high humidity willincrease the di�use component,10 and this component decreases with increasing tilt because more di�uselight hits the back of the array at higher tilts.4 However, Figure 7 also demonstrates that the sensitivity ofthe system performance to such small deviations is fairly small (performance penalties of only about 1%or less). The model calculations show that the annual energy output could be increased from about 427 toabout 462 MWh yearÿ1 (an 8% increase) by changing the tilt angle to 308 from its installed orientation(6.48). Recall that the 427 MWh yearÿ1 baseline ®gure was computed for a coplanar array. If thecomparison is instead made to the curved array, as represented by our two-subarray model, thus addingthe e�ect of the roof curvature, we ®nd that the output could have been increased by almost 14% (from407 to 462 MWh) by placing the entire array at the same (optimized) tilt.
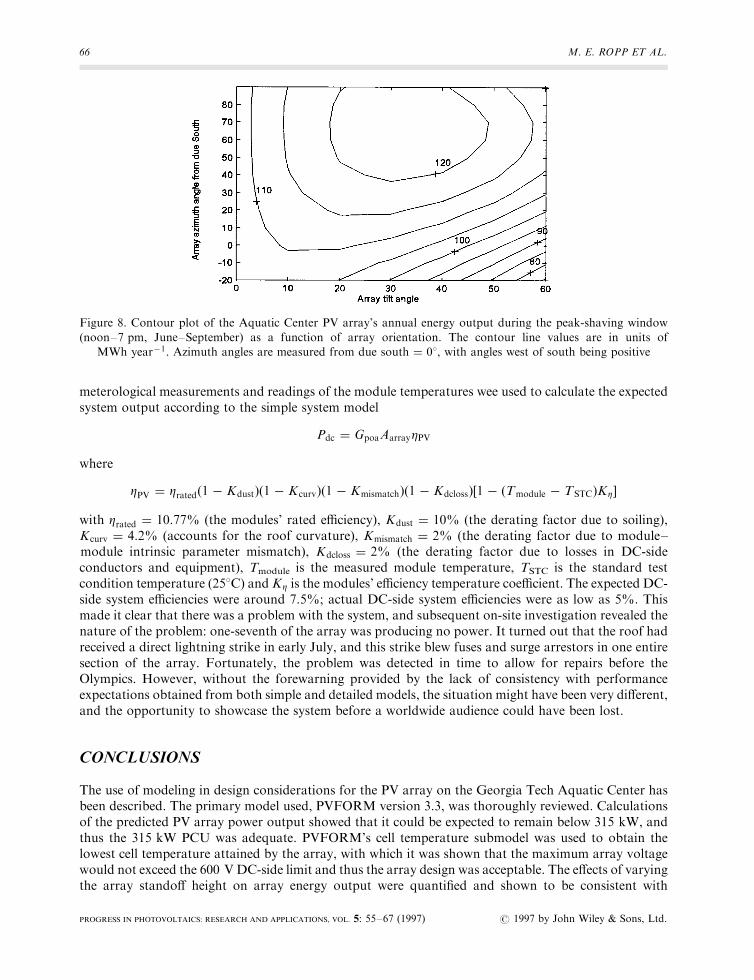
Since peak shaving is an important potential application of PV systems, we also investigated the `peak-shaving e�ectiveness' of our system. To optimize the array for peak shaving, conventional wisdom wouldstate that the array should be oriented by the position of the sun at the peak demand time on the localutility's system. For the Georgia Power Company, the peak demand occurs at about 3±4 pm during thefour summer months of June±September. According to the simple set of equations for determining solarposition found in Refs 10±12 or the solar geometry charts found in Ref. 10, the `rule of thumb' optimumarray orientation should be approximately 438 tilt and about 828 azimuth west of south to achievemaximum peak shaving at the peak demand time (3±4 pm). To look for the peak shaving optimum, weexamined the array's energy production during `peak hours', de®ned by Georgia Power as noon±7 pmduring the four summer months, as a function of array orientation. The results of our simulations areshown in Figure 8, which shows that the peak shaving optimum is approximately 308 tilt and 708 W of Sazimuth. As before, we increased the resolution of our matrix near this point and found that the optimumis actually 358 tilt and 758 W of S azimuth. These results demonstrate that applying the rule of thumb inAtlanta yields values that are slightly high, although again the sensitivity of the system performance tosmall deviations from the optimum orientation is small. The small discrepancy between predictedoptimum tilts can be explained as before: as the tilt angle is increased, more and more di�use irradiation islost because it strikes the back of the array. In the case of the azimuth, the disagreement arises because thepeak demand time falls relatively late in the day, at a time when less solar energy is available, andorienting the array for maximum production at that time sacri®ces energy production at earlier times inthe window, when more insolation is available. Too great an azimuth results in an excessive loss of thismidday solar energy and an eventual reduction of peak shaving capability, with the peak window asde®ned here (noon±7 pm). The model calculations (Figure 8) show that the annual electricity generationof the Aquatic Center array during the peak window could be increased from about 109.1 to123:6 MWh yearÿ1, which is an increase of 13%, by moving the orientation to 358 tilt and 758 azimuthwest of south.
USE OF MODELING IN SYSTEM MONITORING
The Aquatic Center PV system is equipped with an extensive monitoring and data acquisition system(DAS) which allows researchers to closely observe the performance of the system and compare thisperformance with expected values. The DAS also collects meteorological data for comparison purposes.In early July 1996, just before the start of the Summer Olympics, observers at Georgia Tech's UniversityCenter of Excellence in Photovoltaics noted that the power output of the system recorded by theDAS was much lower than had been predicted by the modeling described here. Where power outputs of220±240 kW were expected, only 180±190 kW of PV electric power was actually being produced. The
LARGE ROOF-INTEGRATED PHOTOVOLTAIC ARRAYS 65
# 1997 by John Wiley & Sons, Ltd. PROGRESS IN PHOTOVOLTAICS: RESEARCH AND APPLICATIONS, VOL. 5: 55±67 (1997)
meterological measurements and readings of the module temperatures wee used to calculate the expectedsystem output according to the simple system model
Pdc � GpoaAarray�PV
where
ZPV � Zrated�1 ÿ Kdust��1 ÿ Kcurv��1 ÿ Kmismatch��1 ÿ Kdcloss��1 ÿ �Tmodule ÿ TSTC�KZ�
with Zrated � 10:77% (the modules' rated e�ciency), Kdust � 10% (the derating factor due to soiling),Kcurv � 4:2% (accounts for the roof curvature), Kmismatch � 2% (the derating factor due to module±module intrinsic parameter mismatch), Kdcloss � 2% (the derating factor due to losses in DC-sideconductors and equipment), Tmodule is the measured module temperature, TSTC is the standard testcondition temperature (258C) and KZ is the modules' e�ciency temperature coe�cient. The expected DC-side system e�ciencies were around 7.5%; actual DC-side system e�ciencies were as low as 5%. Thismade it clear that there was a problem with the system, and subsequent on-site investigation revealed thenature of the problem: one-seventh of the array was producing no power. It turned out that the roof hadreceived a direct lightning strike in early July, and this strike blew fuses and surge arrestors in one entiresection of the array. Fortunately, the problem was detected in time to allow for repairs before theOlympics. However, without the forewarning provided by the lack of consistency with performanceexpectations obtained from both simple and detailed models, the situation might have been very di�erent,and the opportunity to showcase the system before a worldwide audience could have been lost.
CONCLUSIONS
The use of modeling in design considerations for the PV array on the Georgia Tech Aquatic Center hasbeen described. The primary model used, PVFORM version 3.3, was thoroughly reviewed. Calculationsof the predicted PV array power output showed that it could be expected to remain below 315 kW, andthus the 315 kW PCU was adequate. PVFORM's cell temperature submodel was used to obtain thelowest cell temperature attained by the array, with which it was shown that the maximum array voltagewould not exceed the 600 V DC-side limit and thus the array design was acceptable. The e�ects of varyingthe array stando� height on array energy output were quanti®ed and shown to be consistent with
66 M. E. ROPP ET AL.
Figure 8. Contour plot of the Aquatic Center PV array's annual energy output during the peak-shaving window
(noon±7 pm, June±September) as a function of array orientation. The contour line values are in units ofMWh yearÿ1. Azimuth angles are measured from due south � 08, with angles west of south being positive
PROGRESS IN PHOTOVOLTAICS: RESEARCH AND APPLICATIONS, VOL. 5: 55±67 (1997) # 1997 by John Wiley & Sons, Ltd.
expectations. Finally, the e�ect of the array's non-optimal orientation, which was ®xed by aestheticconsiderations, was examined. We have demonstrated that the array's annual energy production isreduced by 8% and that its peak shaving capability is reduced by 13% due to the unoptimizedorientation, when compared with a coplanar array. If the e�ect of the roof curvature is taken intoaccount, the reduction in annual energy production becomes almost 14%, and the reduction in peak-shaving capability would similarly increase.
Further work is under way to improve this modeling procedure using measured data from the installedsystem. In Ref. 6, a FORTRAN program is provided which solves the Fuentes thermal model for animproved INOCT value based on measured installed temperatures and insolation values; this will be runafter several months' worth of data have been collected. We are also closely scrutinizing the e�ects of thenon-coplanar array using IVCURVE, a program from Photovoltaic Resources International, andtheoretical calculations versus measured system performance. Finally, the performance of the dataacquisition system is being optimized using an error-minimization technique to be described in a futurepaper.
Acknowledgements
The authors wish to thank Mark Seiderman at the National Climatic Data Center for his invaluableassistance in this work, and also Jose Mejia and Keith Tate of Georgia Tech's University Center ofExcellence in Photovoltaics for many helpful discussions and suggestions.
This project was co-sponsored by the US Department of Energy, Georgia Power Company and theGeorgia Institute of Technology.
REFERENCES
1. S. Rahman and B. H. Chowdhury, `Simulation of photovoltaic power systems and their performance prediction',IEEE Trans. Energy Conversion, 3(3), 440±446 (1988).
2. R. Perez, J. Doty, B. Bailey and R. Stewart, `Experimental evaluation of a photovoltaic simulation program',Sol. Energy, 52(4), 359±365 (1994).
3. D. F. Menicucci and J. P. Fernandez, User's Manual for PVFORM: Photovoltaic System Simulation Program forStand-Alone and Grid-Interactive Applications, Sandia National Laboratories Publication SAND85±0376,October 1989.
4. R. Perez, R. Seals, P. Ineichen, R. Stewart and D. Menicucci, `A new simpli®ed version of the Perez di�useirradiance model for tilted surfaces', Sol. Energy, 39(3), 221±231 (1987).
5. P. Ineichen, R. Perez, and R. Seals, `The importance of correct albedo determination for adequately modelingenergy received by tilted surfaces', Sol. Energy, 39(4), 301±305 (1987).
6. M. K. Fuentes, A Simpli®ed Thermal Model for Flat-Plate Photovoltaic Arrays, Sandia National LaboratoriesPublication SAND85-0330, May 1987.
7. D. F. Menicucci, `Photovoltaic array performance simulation models', Sol. Cells, 18, 382±392 (1986).8. J. W. Bishop, `Computer simulation of the e�ects of electrical mismatch in photovoltaic interconnection
circuits', Sol. Cells, 25(1), 73±89 (1988).9. J. C. Wiles, Photovoltaic Power Systems and the National Electric Code: Suggested Practices, Photovoltaic
Design Assistance Center, Sandia National Laboratories, March 1995.10. M. Buresch, Photovoltaic Power Systems, McGraw-Hill, New York, 1981.11. S. R. Wenham, M. A. Green and M. E. Watt, Applied Photovoltaics, Centre for Photovoltaic Devices and
Systems, University of New South Wales, Australia, 1994.12. R. Hulstrom (ed.), Solar Resources, MIT Press, New York, 1989.
LARGE ROOF-INTEGRATED PHOTOVOLTAIC ARRAYS 67
# 1997 by John Wiley & Sons, Ltd. PROGRESS IN PHOTOVOLTAICS: RESEARCH AND APPLICATIONS, VOL. 5: 55±67 (1997)