derbyshire - derby city council | derby city council · derbyshire county and derby city by local...
TRANSCRIPT

Page 1 of 90
Derbyshire
Mental Health Needs Assessment
December 2011
Carol Davies & Natalie Cantillon
Page 2 of 90
Contents
1 Community risk factors for mental illness 7 1.1 Introduction 7
1.2 Deprivation 8
Table 1: Index of Multiple deprivation 2007: percentage of population living in the most deprived national quintile
Figure 1: Index of Multiple deprivation 2007: percentage of population living in the most deprived national quintile
1.3 Employment 10
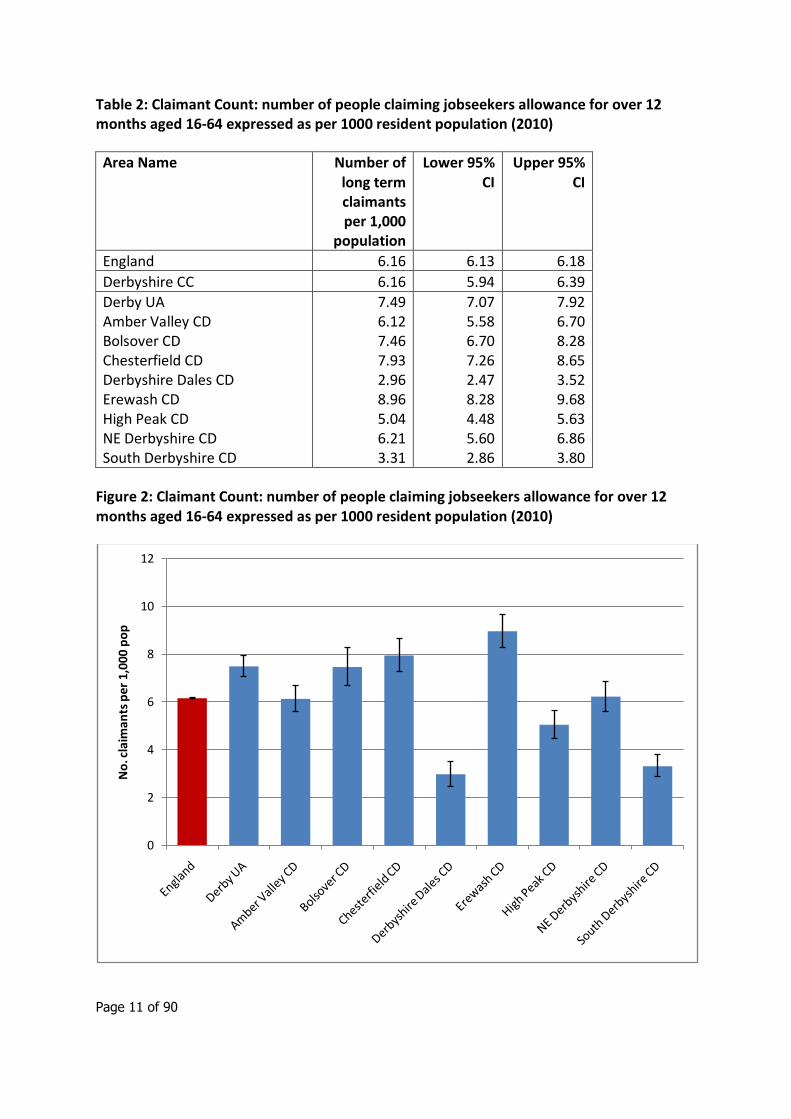
Table 2: Claimant Count: number of people claiming jobseekers allowance for over 12 months aged 16-64 expressed as per 1000 resident population (2010)
Figure 2: Claimant Count: number of people claiming jobseekers allowance for over 12 months aged 16-64 expressed as per 1000 resident population (2010)
1.4 Education 12
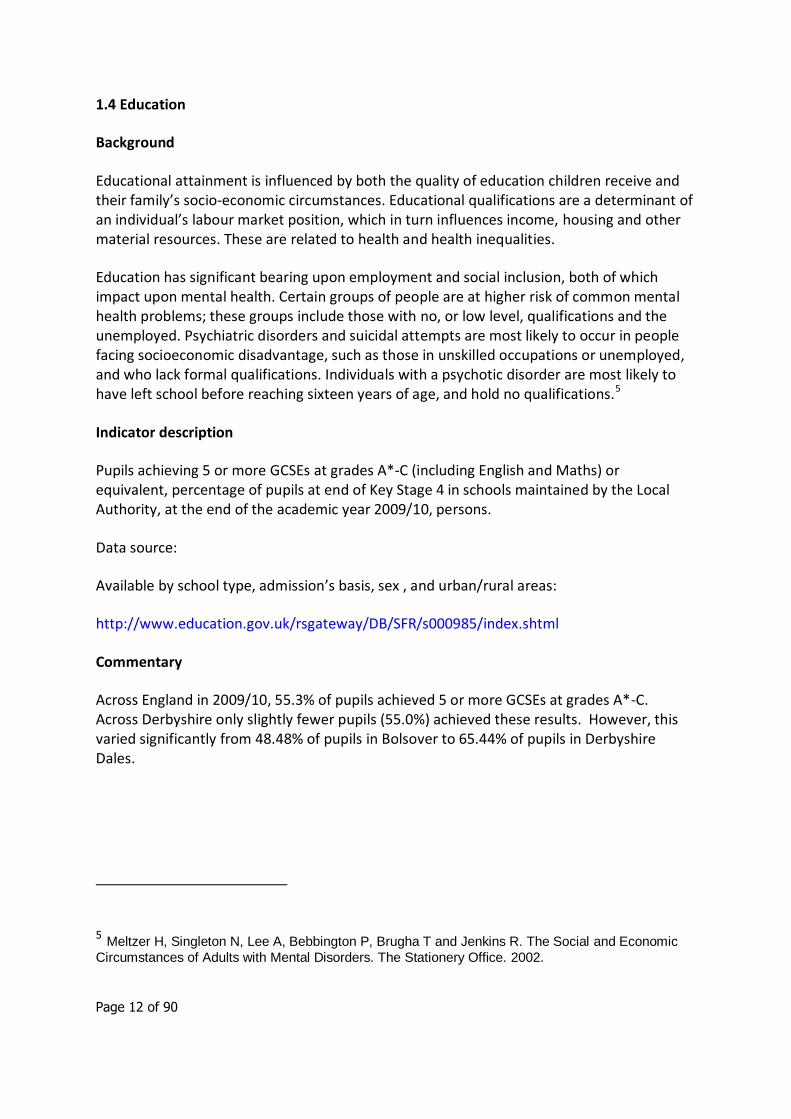
Table 3: Percentage of pupils achieving 5 or more GCSEs grades A*-C (2009/10)
Figure 3: Percentage of pupils achieving 5 or more GCSEs grades A*-C (2009/10)
1.5 Violent Crime 14
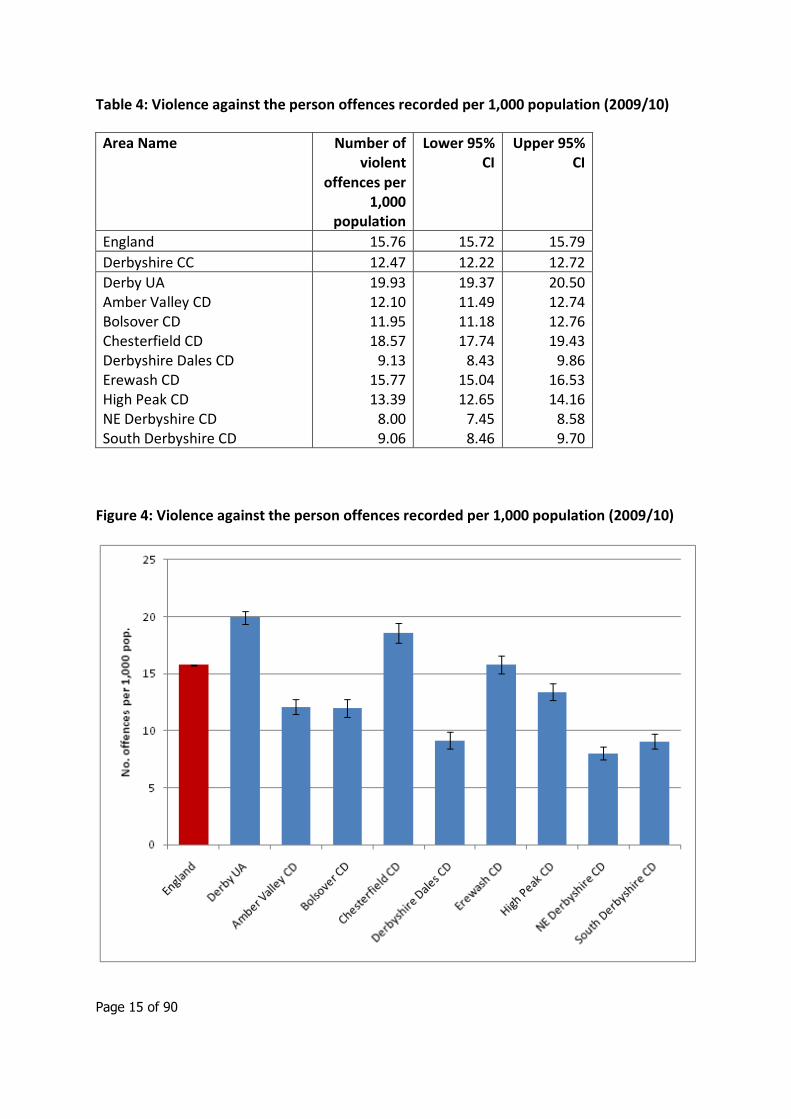
Table 4: Violence against the person offences recorded per 1,000 population (2009/10)
Figure 4: violence against the person offences recorded per 1,000 population (2009/10)
1.6 Alcohol 16
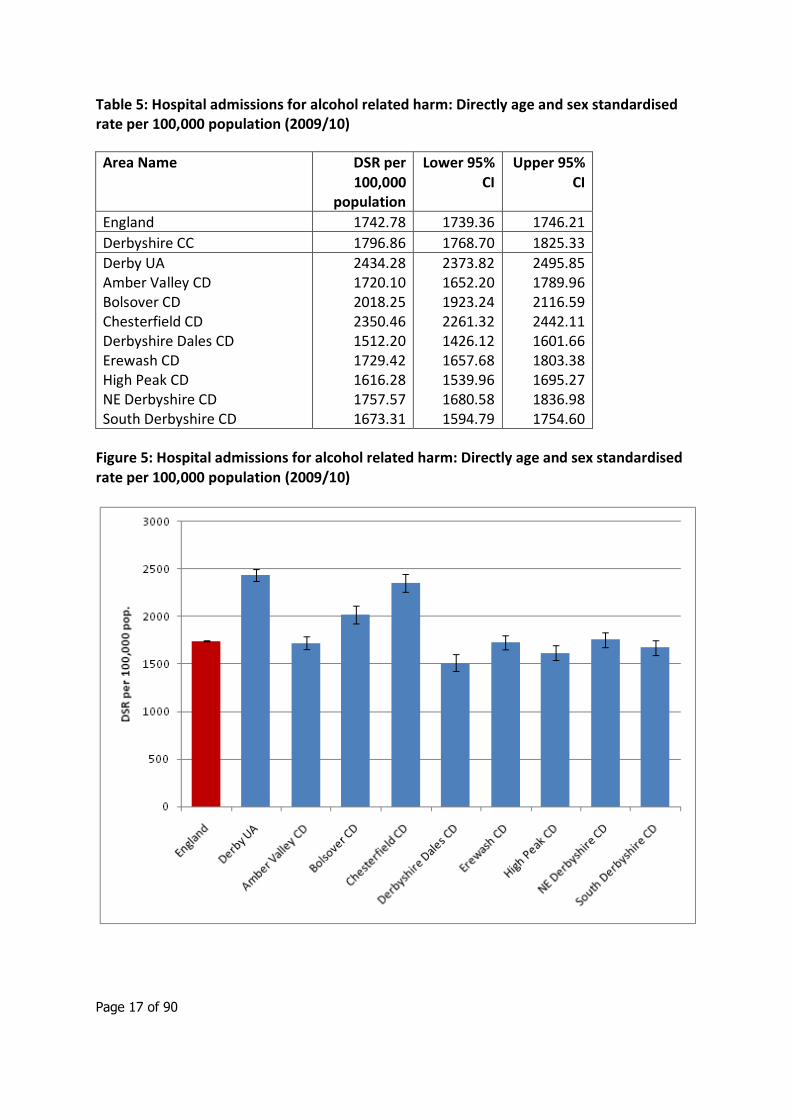
Table 5: Hospital admissions for alcohol related harm: Directly age and sex standardised rate per 100,000 population (2009/10)
Figure 5: Hospital admissions for alcohol related harm: Directly age and sex standardised rate per 100,000 population (2009/10)
2 Common mental health disorders 18 2.1 Adult Psychiatric Morbidity: national surveys 18
Table 6: Estimated CMD prevalence and number of cases: Derbyshire County and Derby City
Figure 6: Estimated CMD prevalence by type of disorder: Derbyshire County and Derby City
Figure 7: Estimated number of CMD cases by type of disorder: Derbyshire County and Derby City
Table 7: Estimated CMD prevalence and number of cases within Derbyshire County and Derby City by local authority
Figure 8: Estimated CMD prevalence by local authority
Figure 9: Estimated number of CMD cases by local authority
Table 8: Estimated CMD prevalence and number of cases within Derbyshire County and Derby City by age and sex
Figure 10: Estimated CMD prevalence within Derbyshire County and Derby City by age and sex
2.2 Quality and Outcomes Framework 26
Page 3 of 90
Table 9: QOF 2010/11 Number on depression register (age 18+ years) and prevalence rates
Figure 11: QOF 2010/11 Depression register (age 18+ years) prevalence rates by CCG
Figure 12: QOF 2010/11 Depression register (age 18+ years) prevalence rates - North Derbyshire CCG localities
Figure 13: QOF 2010/11 Depression register (age 18+ years) prevalence rates - Southern Derbyshire CCG localities
Figure 14: QOF 2010/11 depression prevalence – Derbyshire County and Derby City PCT practices
3 Severe and enduring mental illness 31 3.1 Introduction 31
3.2 Prevalence of psychotic disorder by age and sex 31
Table 10: Estimated prevalence of psychotic disorder in the past year, by age and sex (taken from the Psychiatric Morbidity Survey, 2007)
Table 11: Estimated number of males with a psychotic disorder by Clinical Commissioning Group in Derbyshire.
Table 12: Estimated number of females with a psychotic disorder by Clinical Commissioning Group in Derbyshire.
3.3 Admissions 33
Figure 15: DSR per 100,000 population aged between 18-64 with a diagnosis of mental illness, 2010/11.
Figure 16: DSR per 100,000 population aged over 65 with a diagnosis of mental illness, 2010/11.
Figure 17: DSR per 100,000 population, all ages with a diagnosis of mental illness, 2010/11.
Figure 18: DSR per 100,000 population, by age group with a diagnosis of mental illness, from 2006 to 2010.
Table 13: mental health admission rate (DSR per 100,000) for Derbyshire 2006-2011, by age group.
Figure 19: Percentage of admissions, aged 18-64 by ICD10 code in Derbyshire County (Including City) in 2011/11
Figure 20: Percentage of admissions, aged 18-64 by ICD10 code in Derby City in 2010/11
Figure 21: Percentage of admissions, aged 18-64 by ICD10 code in Amber Valley in 2010/11
Figure 22: Percentage of admissions, aged 18-64 by ICD10 code in Bolsover in 2010/11
Figure 23: Percentage of admissions, aged 18-64 by ICD10 code in Chesterfield in 2010/11
Figure 24: Percentage of admissions, aged 18-64 by ICD10 code in Derbyshire Dales in 2010/11
Figure 25: Percentage of admissions, aged 18-64 by ICD10 code in Erewash in 2010/11
Figure 26: Percentage of admissions, aged 18-64 by ICD10 code in High Peak in 2010/11
Figure 27: Percentage of admissions, aged 18-64 by ICD10 code in North East Derbyshire in 2010/11
Figure 28: Percentage of admissions, aged 18-64 by ICD10 code in South
Page 4 of 90
Derbyshire in 2010/11
Table 14: ICD10 definitions
3.4 Dual Diagnosis 41
Figure 29: rate of hospital admissions with a drug related primary diagnosis (ICD10: F10-F19), and another ‘F’ code as a secondary diagnosis, aged 18-64, Derbyshire, 2010/11.
3.5 Sectioning 43
Table 15: Mental health hospital admissions 2008-2011 and their status under the mental health act 1983
3.6 Quality and Outcomes Framework – Mental Health Register prevalence 44
Table 16: QOF 2010/11 Number on mental health register and prevalence rates
Figure 30: QOF 2010/11 Mental health register prevalence rates by CCG
Figure 31: QOF 2010/11 Mental health register prevalence rates - North Derbyshire CCG localities
Figure 32: QOF 2010/11 Mental health register prevalence rates - Southern Derbyshire CCG localities
Figure 33: QOF 2010/11 Mental health register prevalence – Derbyshire County and Derby City PCT practices
4 Co-morbidity mental and physical health issues 48 Table 17: Prevalence of longstanding physical complaints by presence of
neurotic disorder (National Survey of Adult Psychiatric Morbidity, 2000)
Figure 34: Prevalence of longstanding physical complaints by presence of neurotic disorder (National Survey of Adult Psychiatric Morbidity, 2000)
Table 18: Prevalence of longstanding physical complaints by presence of probable psychotic disorder (National Survey of Adult Psychiatric Morbidity, 2000)
Figure 35: Prevalence of longstanding physical complaints by presence of probable psychotic disorder (National Survey of Adult Psychiatric Morbidity, 2000)
5 Avoidable harm 53 5.1 Introduction 53
5.2 Prevalence of self harm 54
Table 19: Prevalence of lifetime suicide attempts by age and sex (National Psychiatric Morbidity Survey 2007)
Figure 36: Prevalence of lifetime suicide attempts by age and sex (National Psychiatric Morbidity Survey 2007)
Table 20: Prevalence of lifetime non-suicidal self harm by age and sex (National Psychiatric Morbidity Survey 2007)
Figure 37: Prevalence of lifetime non-suicidal self harm by age and sex (National Psychiatric Morbidity Survey 2007)
5.3 A&E attendances for self harm 58
5.4 Hospital admissions for self harm 59
Figure 38: Trends in numbers (thousands) of self-harm admissions, persons aged 15 and over, English regions, 2001/02 to 2008/09
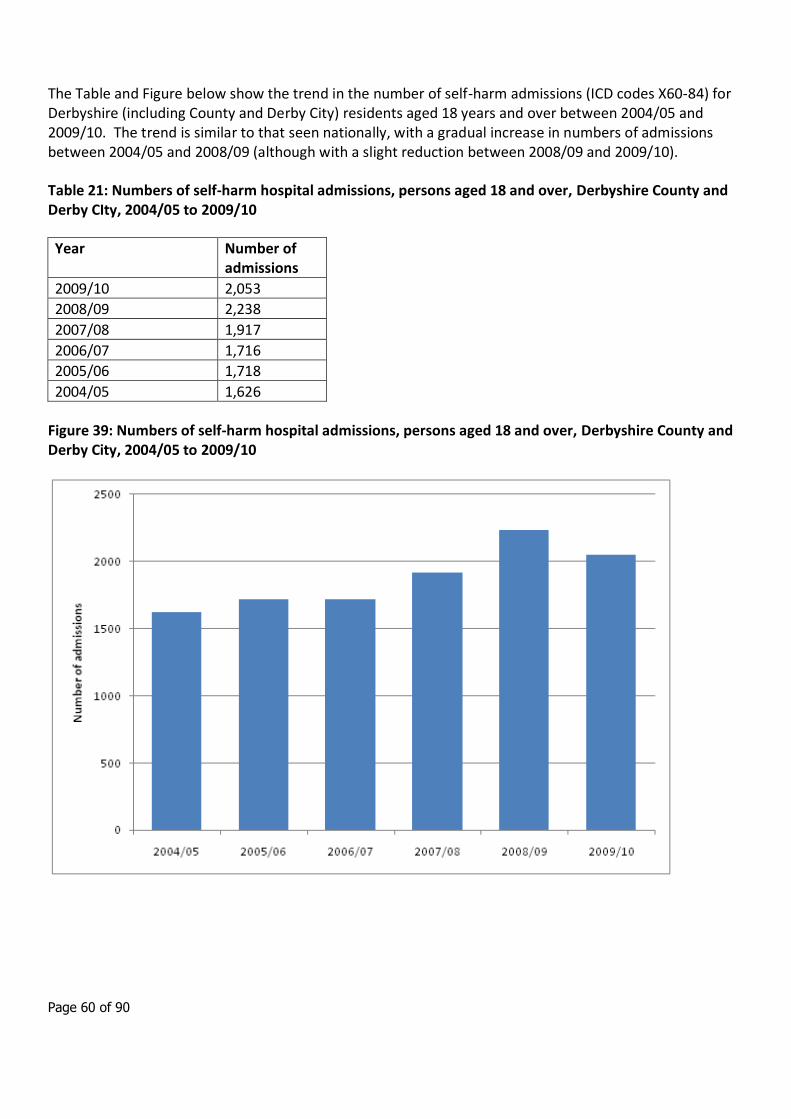
Table 21: Numbers of self-harm hospital admissions, persons aged 18 and over, Derbyshire County and Derby City, 2004/05 to 2009/10
Figure 39: Numbers of self-harm hospital admissions, persons aged 18 and over, Derbyshire County and Derby City, 2004/05 to 2009/10
Page 5 of 90
Table 22: Number and directly standardised rate of self-harm hospital admissions, persons aged 18 and over, by local authority 2009/10
Figure 40: Number and directly standardised rate of self-harm hospital admissions, persons aged 18 and over, by local authority 2009/10
Table 23: Self-harm hospital admissions by mechanism, persons aged 18 and over, Derbyshire County and Derby City 2009/10
5.5 Other information: use of Section 136 of the Mental Health Act 1983 64
Table 24: Section 136 detentions, custody populations and section 136 rates by police force 2005/06
6 Suicide 67 6.1 Introduction 67
6.2 Trends in suicide 68
Figure 41: Directly age standardized mortality rates for suicide and injury of undetermined intent in England 1993-2009.
Figure 42: Directly age standardized mortality rates for suicide and injury of undetermined intent in Derbyshire 2002-2009.
Figure 43: Directly age standardized mortality rates for suicide and injury of undetermined intent in Derby City PCT 1993-2009.
6.3 Rate of suicide in Derbyshire 70
Figure 44: Directly age standardised mortality rates from suicide and injury of undetermined intent in Derbyshire, 2007-2009 (pooled), by district.
Figure 45: Directly age standardised mortality rates from suicide and injury of undetermined intent in Derbyshire, 2007-2009 (pooled), by district. MALES
Figure 46: Directly age standardised mortality rates from suicide and injury of undetermined intent in Derbyshire, 2007-2009 (pooled), by district. FEMALES
Figure 47: Age and sex specific mortality rates from suicide and injury of undetermined intent in Derbyshire and England, 2007-2009 (pooled), by district.
6.4 High risk groups 72
6.5 Projections 74
Table 25: Number of people aged 18-64 projected to commit suicide within the East Midlands, projected to 2030
Table 26: Age Standardised Rates per 100,000 of people aged 18-64 projected to commit suicide within the East Midlands, projected to 2030
7 Public Health Outcomes 75 Table 27: Potential mental health indictors in the PHOF
8 Child and Adolescent Mental Health Services (CAMHS)
80
8.1 Introduction 80
Table 28: Estimated number of children with disorders in Derbyshire aged 5-16
Table 29: Estimated number of disorders by sex for children aged 11-16.
8.2 Estimated need for services at each tier 84
Table 30: Estimated number of children / young people who may experience mental health problems appropriate to a response from CAMHS.
8.3 Learning Disability 84

Page 6 of 90
Table 31: Estimated total number of children with a learning disability
8.4 Autistic Spectrum Disorder 85
8.5 Self harm and suicide in young people 86
8.6 Young Offenders 87
Table 32: Estimates of young offenders who have a mental health disorder
8.7 Looked After Children 87
8.8 Psychological and physical well-being 88
Table 33: National Indicators derived from the Tellus survey
8.9 Expenditure 89
Table 34: Total budget for CAMHS services
Table 35: Total budget per head of population (under 18) for CAMHS services
Page 7 of 90
1. Community risk factors for mental health
1.1 Introduction
The national surveys of adult psychiatric morbidity carried out in 19931, 20002 and 20073 included assessment and analysis of factors associated with increased risk of developing mental health problems. The 2000 survey report in particular contains detailed risk factor analysis including personal characteristics, education and employment, and housing and area of residence (see Chapter 4).
Factors associated with increased risk of common mental health disorder (CMD) were:
female sex
aged 35 to 54 years
separated or divorced
living as single person family unit or as a lone parent
economic inactivity (unemployment)
Factors associated with increased risk of probable psychotic disorder were:
separated or divorced
low educational qualifications
Social Class IV or V
economic inactivity
living in rented accommodation
living in urban area
living as single person family unit or as a lone parent
1 Meltzer, H et al (1995). The prevalence of psychiatric morbidity among adults living in private
households, in OPCS Surveys of Psychiatric Morbidity in Great Britain 1995. London: HMSO.
2 Singleton, N., Bumpstead, R., O'Brien, M., et al (2001) Psychiatric morbidity among adults living in
private households, 2000. London: The Stationery Office.
3 McManus, S et al (2009). Adult Psychiatric Morbidity in England 2007: Results of a household
survey. Leeds: The Information Centre.
Page 8 of 90
1.2 Deprivation
Background
The national psychiatric morbidity surveys found that those with a CMD are more likely to belong to socioeconomic class V and least likely to belong to socioeconomic class I. This distribution of prevalence was also observed when psychotic disorders were compared.
Given the evidence that adults and children from disadvantaged backgrounds are more likely to suffer mental health disorders, measures of deprivation can help to identify areas where the need for mental health services is likely to be greatest, thus ensuring that mental health service provision is targeted appropriately.
Indicator description
Index of Multiple Deprivation (IMD) 2007 is a model of measuring deprivation in an area. It is underpinned by separate dimensions of deprivation; these dimensions are weighted and an overall deprivation score is given.
This indicator measures the level of deprivation of a population in an area, by calculating the percentage of people in an area living in the most deprived fifth of areas in England.
Data source:
Department for Communities and Local Government (DCLG) (Now archived with the National Archives):
http://webarchive.nationalarchives.gov.uk/+/http://www.communities.gov.uk/communities/neighbourhoodrenewal/deprivation/deprivation07/
Commentary
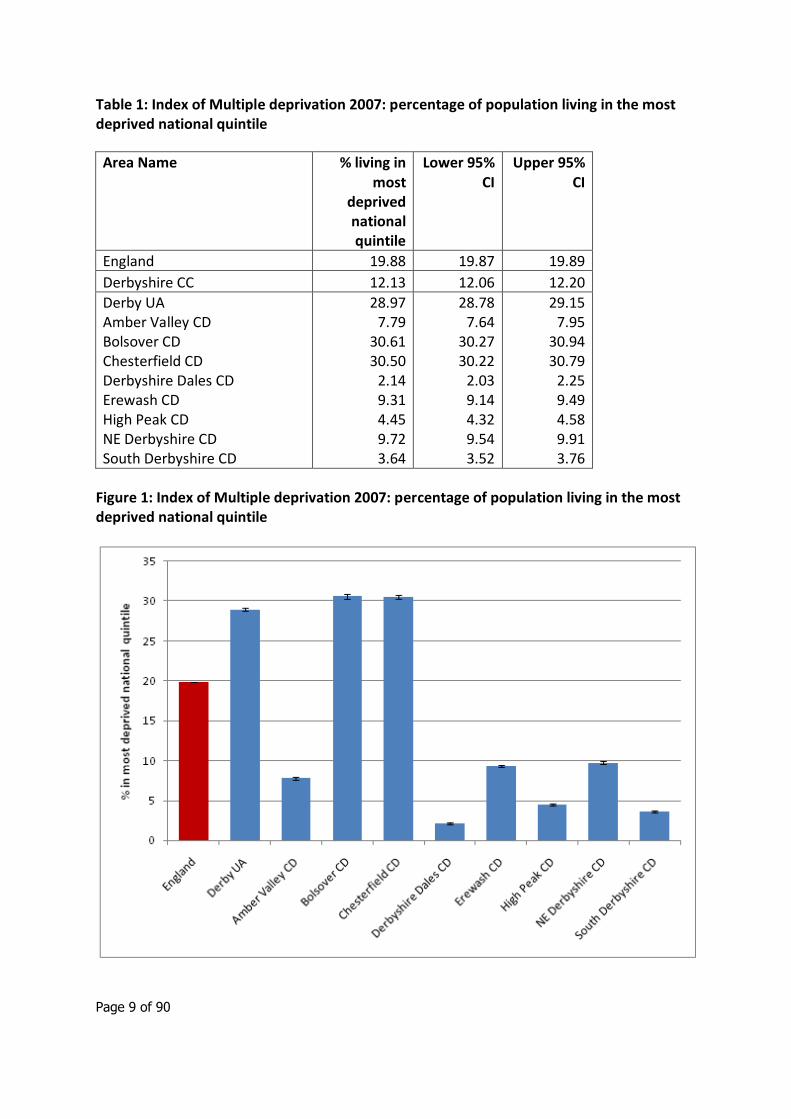
Across Derbyshire just over 12% of residents live in areas within the most deprived national quintile – indicating a more affluent than average population when compared with England. However, there is very wide variation from 2% of Derbyshire Dales to approximately 30% of Bolsover, Chesterfield and Derby City residents living within deprived quintile areas.
Page 9 of 90
Table 1: Index of Multiple deprivation 2007: percentage of population living in the most deprived national quintile
Area Name % living in most
deprived national quintile
Lower 95% CI
Upper 95% CI
England 19.88 19.87 19.89
Derbyshire CC 12.13 12.06 12.20
Derby UA Amber Valley CD Bolsover CD Chesterfield CD Derbyshire Dales CD Erewash CD High Peak CD NE Derbyshire CD South Derbyshire CD
28.97 7.79
30.61 30.50
2.14 9.31 4.45 9.72 3.64
28.78 7.64
30.27 30.22
2.03 9.14 4.32 9.54 3.52
29.15 7.95
30.94 30.79
2.25 9.49 4.58 9.91 3.76
Figure 1: Index of Multiple deprivation 2007: percentage of population living in the most deprived national quintile
Page 10 of 90
1.3 Employment
Background
There is strong evidence to suggest that work is generally good for physical and mental health and wellbeing, taking into account the nature and quality of work, and that worklessness is associated with poorer physical and mental health.
Unemployment is associated with social exclusion, which has a number of adverse effects, including reduced psychological wellbeing, and a greater incidence of self harm, depression and anxiety. Two-thirds of men under 35 who commit suicide are unemployed. There is considerable evidence to support the beneficial effects of employment on an individual’s mental health. Employment can protect a person’s mental health by boosting confidence and self-esteem; unemployment can be both a consequence and cause of mental health problems.4
Indicator description
Claimant Count: number of people claiming Jobseekers Allowance for over 12 months, aged 16 and over expressed as crude rate per 1000 resident population. Calendar year 2010.
Data source: https://www.nomisweb.co.uk/ using Advance Query for Claimant Count – Current – claimant count by age and duration
Commentary
Across England in 2010 6.16 people per 1,000 resident population were long term unemployed (i.e. claimed Jobseekers Allowance for over 12 months) the same number as across Derbyshire. However this varied significantly from 2.96 per 1,000 in Derbyshire Dales to 8.96 per 1,000 in Erewash.
4 Social Exclusion Unit. Mental Health and Social Exclusion, Social Exclusion Report. Office of the Deputy Prime Minister. 2004.
Page 11 of 90
Table 2: Claimant Count: number of people claiming jobseekers allowance for over 12 months aged 16-64 expressed as per 1000 resident population (2010)
Area Name Number of long term claimants per 1,000
population
Lower 95% CI
Upper 95% CI
England 6.16 6.13 6.18
Derbyshire CC 6.16 5.94 6.39
Derby UA Amber Valley CD Bolsover CD Chesterfield CD Derbyshire Dales CD Erewash CD High Peak CD NE Derbyshire CD South Derbyshire CD
7.49 6.12 7.46 7.93 2.96 8.96 5.04 6.21 3.31
7.07 5.58 6.70 7.26 2.47 8.28 4.48 5.60 2.86
7.92 6.70 8.28 8.65 3.52 9.68 5.63 6.86 3.80
Figure 2: Claimant Count: number of people claiming jobseekers allowance for over 12 months aged 16-64 expressed as per 1000 resident population (2010)
0
2
4
6
8
10
12
No
. cla
iman
ts p
er 1
,000
po
p
Page 12 of 90
1.4 Education
Background
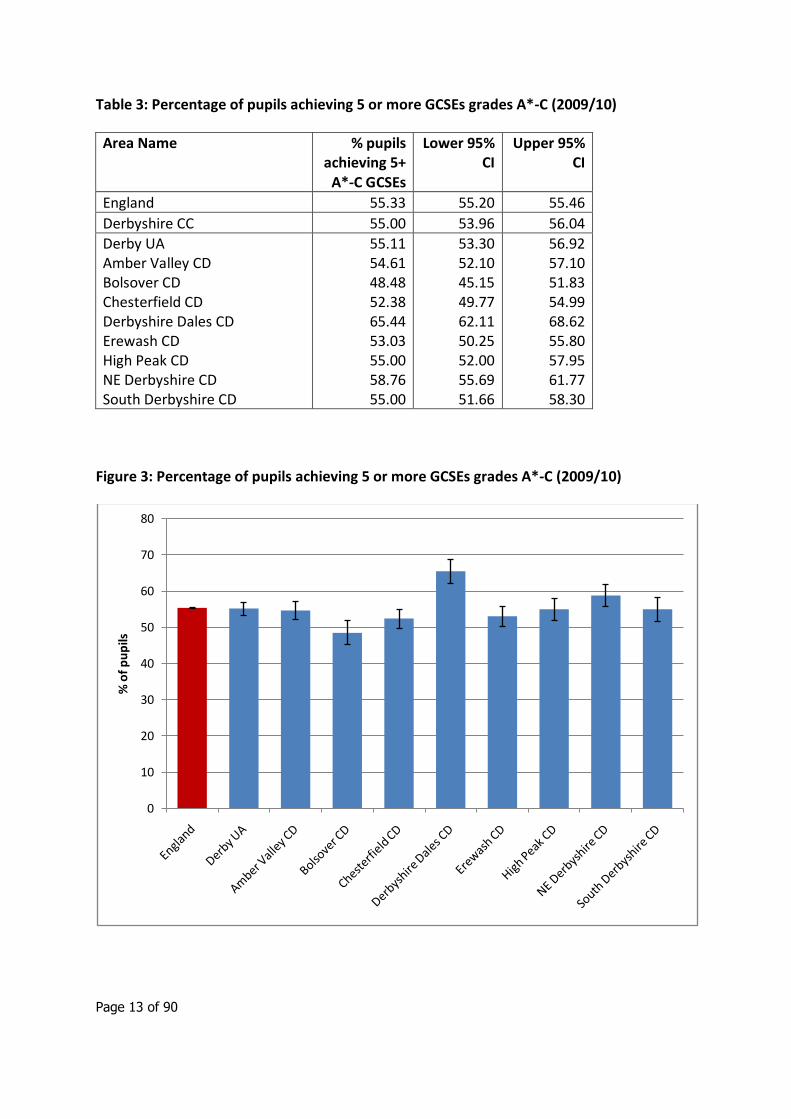
Educational attainment is influenced by both the quality of education children receive and their family’s socio-economic circumstances. Educational qualifications are a determinant of an individual’s labour market position, which in turn influences income, housing and other material resources. These are related to health and health inequalities.
Education has significant bearing upon employment and social inclusion, both of which impact upon mental health. Certain groups of people are at higher risk of common mental health problems; these groups include those with no, or low level, qualifications and the unemployed. Psychiatric disorders and suicidal attempts are most likely to occur in people facing socioeconomic disadvantage, such as those in unskilled occupations or unemployed, and who lack formal qualifications. Individuals with a psychotic disorder are most likely to have left school before reaching sixteen years of age, and hold no qualifications.5
Indicator description
Pupils achieving 5 or more GCSEs at grades A*-C (including English and Maths) or equivalent, percentage of pupils at end of Key Stage 4 in schools maintained by the Local Authority, at the end of the academic year 2009/10, persons.
Data source:
Available by school type, admission’s basis, sex , and urban/rural areas:
http://www.education.gov.uk/rsgateway/DB/SFR/s000985/index.shtml
Commentary
Across England in 2009/10, 55.3% of pupils achieved 5 or more GCSEs at grades A*-C. Across Derbyshire only slightly fewer pupils (55.0%) achieved these results. However, this varied significantly from 48.48% of pupils in Bolsover to 65.44% of pupils in Derbyshire Dales.
5 Meltzer H, Singleton N, Lee A, Bebbington P, Brugha T and Jenkins R. The Social and Economic
Circumstances of Adults with Mental Disorders. The Stationery Office. 2002.
Page 13 of 90
Table 3: Percentage of pupils achieving 5 or more GCSEs grades A*-C (2009/10)
Area Name % pupils achieving 5+
A*-C GCSEs
Lower 95% CI
Upper 95% CI
England 55.33 55.20 55.46
Derbyshire CC 55.00 53.96 56.04
Derby UA Amber Valley CD Bolsover CD Chesterfield CD Derbyshire Dales CD Erewash CD High Peak CD NE Derbyshire CD South Derbyshire CD
55.11 54.61 48.48 52.38 65.44 53.03 55.00 58.76 55.00
53.30 52.10 45.15 49.77 62.11 50.25 52.00 55.69 51.66
56.92 57.10 51.83 54.99 68.62 55.80 57.95 61.77 58.30
Figure 3: Percentage of pupils achieving 5 or more GCSEs grades A*-C (2009/10)
0
10
20
30
40
50
60
70
80
% o
f p
up
ils
Page 14 of 90
1.5 Violent crime
Background
The links between crime and health are complex (as outlined in the London Health Commission report http://www.londonshealth.gov.uk/pdf/lhs/crime.pdf and in the NACRO report “Better Health, Lower Crime” (http://www.nacro.org.uk/data/files/nacro-2004120264-425.pdf). Crime affects health as a determinant of illness and increases the burden of ill health on those communities least able to cope. Research undertaken by the Home Office and a number of other organisations suggests that there is a relationship between violent crime and alcohol http://webarchive.nationalarchives.gov.uk/20110218135832/rds.homeoffice.gov.uk/rds/pdfs05/r261.pdf
Crime, particularly violent crime, is linked to mental health in a number of ways. Firstly it may have similar determinants such as drugs, alcohol and deprivation. Secondly, victims of crime are more likely to suffer psychological distress and subsequent mental health problems. Crime and fear of crime can also alter people’s lifestyles and impact on their physical and psychological health. Those who suffer from mental illness are more likely to be victims of crime than to commit crime, although violent crimes committed by people with mental illnesses are more frequently reported. Areas with higher levels of violent crime could be expected to have higher levels of mental health problems. 6
Indicator description
Recorded violence against the person offences, crude rate per 1,000 population, all ages, 2009/10, persons. 'Violence against the person' is the largest component of total ‘violent crime’ (which also includes robbery and sexual offences).
Data source:
http://webarchive.nationalarchives.gov.uk/20110220105210/http:/rds.homeoffice.gov.uk/rds/crimeew0910.html
Commentary
Across England in 2009/10 there were 15.76 violent against the person offences per 1,000 population. The Derbyshire rate was significantly lower (12.47 per 1,000 population). However, the rate varied significantly from 8.00 per 1,000 in North East Derbyshire to 19.93 per 1,000 in Derby City.
6 Indications of Public Health in the English Regions 7: Mental Health. APHO, 2007 http://www.apho.org.uk/resource/item.aspx?RID=39303
Page 15 of 90
Table 4: Violence against the person offences recorded per 1,000 population (2009/10)
Area Name Number of violent
offences per 1,000
population
Lower 95% CI
Upper 95% CI
England 15.76 15.72 15.79
Derbyshire CC 12.47 12.22 12.72
Derby UA Amber Valley CD Bolsover CD Chesterfield CD Derbyshire Dales CD Erewash CD High Peak CD NE Derbyshire CD South Derbyshire CD
19.93 12.10 11.95 18.57
9.13 15.77 13.39
8.00 9.06
19.37 11.49 11.18 17.74
8.43 15.04 12.65
7.45 8.46
20.50 12.74 12.76 19.43
9.86 16.53 14.16
8.58 9.70
Figure 4: Violence against the person offences recorded per 1,000 population (2009/10)
Page 16 of 90
1.6 Alcohol
Background
Evidence suggests an association between increased alcohol consumption and mental ill health. Alcohol consumption can be a cause of mental ill health, or a resulting factor. Less than 1% of the general population were classified as being moderately or severely dependent on alcohol, this increased to 2% in people with neurotic disorders, 5% among those with phobias and 6% among those with two or more neurotic disorders. Alcohol dependence is often treated within mental health services.7
Indicator description
The number of hospital admissions for alcohol-attributable conditions is used as a proxy measure of the prevalence of problem or harmful drinking within an area. Hospital admissions for alcohol related harm are calculated using attributable fractions. This methodology uses published literature to identify the proportion of hospital admissions for any particular condition which is attributable to alcohol and applies these fractions to hospital episode statistics.
Full definition at:
http://www.nwph.net/alcohol/lape/downloads/Lape_guidance_and _methods.pdf
Commentary
The number of hospital admissions for alcohol-attributable conditions in Derbyshire was higher than that for England (1,796.86 and 1,742.78 admissions per 100,000 population respectively). However, within Derbyshire the admission rate varied significantly from 1,512.20 per 100,000 population in Derbyshire Dales to 2,434.28 per 100,000 population in Derby City.
7 Indications of Public Health in the English Regions 7: Mental Health. APHO, 2007 http://www.apho.org.uk/resource/item.aspx?RID=39303
Page 17 of 90
Table 5: Hospital admissions for alcohol related harm: Directly age and sex standardised rate per 100,000 population (2009/10)
Area Name DSR per 100,000
population
Lower 95% CI
Upper 95% CI
England 1742.78 1739.36 1746.21
Derbyshire CC 1796.86 1768.70 1825.33
Derby UA Amber Valley CD Bolsover CD Chesterfield CD Derbyshire Dales CD Erewash CD High Peak CD NE Derbyshire CD South Derbyshire CD
2434.28 1720.10 2018.25 2350.46 1512.20 1729.42 1616.28 1757.57 1673.31
2373.82 1652.20 1923.24 2261.32 1426.12 1657.68 1539.96 1680.58 1594.79
2495.85 1789.96 2116.59 2442.11 1601.66 1803.38 1695.27 1836.98 1754.60
Figure 5: Hospital admissions for alcohol related harm: Directly age and sex standardised rate per 100,000 population (2009/10)
Page 18 of 90
2. Common mental health disorders
2.1 Adult Psychiatric Morbidity: national surveys
National surveys of adult psychiatric morbidity were carried out in 19938, 20009 and 200710. Each of these surveys had a sample size around 10,000 and they were designed to produce results representative of the UK population at the level of NHS regions or quinary age groups.
The main aim of the surveys was to collect data on mental health among adults aged 16 and over living in private households. They are the primary source of information on the prevalence of both treated and untreated psychiatric disorders and their associations. All of the surveys used a two stage approach. In the first phase interviews included structured assessments serving diagnostic criteria and screening instruments for a range of mental disorders, as well as questions on topics such as general health, service use, risk factors and demographics. The second phase interviews, carried out on a sub sample of the survey population, were carried out by clinically trained interviewers.
All surveys included assessment of the prevalence of common mental disorders (CMDs). CMDs include different types of depression and anxiety; they cause appreciable emotional distress and can interfere with daily function, but do not usually affect insight or cognition. CMDs were assessed in the phase one interview using the revised Clinical Interview Schedule (CIS-R) which covers all non-psychotic symptoms in the past week. Responses were used to generate an overall score and to diagnose six types of CMD: depressive episode; generalised anxiety disorder; mixed anxiety and depressive disorder; phobia; panic disorder and obsessive compulsive disorder. A summary “any CMD” total was also calculated, to exclude double counting as some people suffered from more than one disorder.
Surveys on this scale provide good evidence about the variation in rates of mental disorders between the standard English regions. However their sample size is too small to provide direct evidence about the variations in prevalence within regions which are widely recognised to occur. Crude application of national prevalence rates to local populations are likely to under or over-represent the true number of cases depending on the socio-economic characteristics of the area in question.
8 Meltzer, H et al (1995). The prevalence of psychiatric morbidity among adults living in private
households, in OPCS Surveys of Psychiatric Morbidity in Great Britain 1995. London: HMSO.
9 Singleton, N., Bumpstead, R., O'Brien, M., et al (2001) Psychiatric morbidity among adults living in
private households, 2000. London: The Stationery Office.
10 McManus, S et al (2009). Adult Psychiatric Morbidity in England 2007: Results of a household
survey. Leeds: The Information Centre.
Page 19 of 90
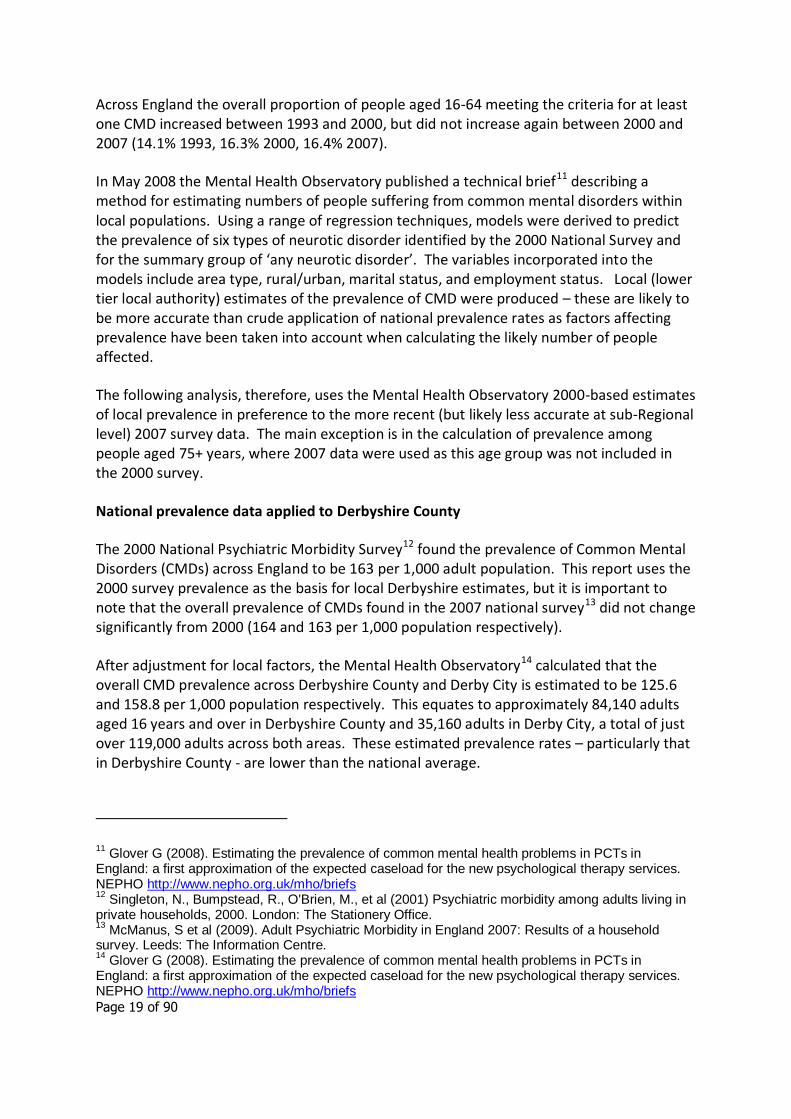
Across England the overall proportion of people aged 16-64 meeting the criteria for at least one CMD increased between 1993 and 2000, but did not increase again between 2000 and 2007 (14.1% 1993, 16.3% 2000, 16.4% 2007).
In May 2008 the Mental Health Observatory published a technical brief11 describing a method for estimating numbers of people suffering from common mental disorders within local populations. Using a range of regression techniques, models were derived to predict the prevalence of six types of neurotic disorder identified by the 2000 National Survey and for the summary group of ‘any neurotic disorder’. The variables incorporated into the models include area type, rural/urban, marital status, and employment status. Local (lower tier local authority) estimates of the prevalence of CMD were produced – these are likely to be more accurate than crude application of national prevalence rates as factors affecting prevalence have been taken into account when calculating the likely number of people affected.
The following analysis, therefore, uses the Mental Health Observatory 2000-based estimates of local prevalence in preference to the more recent (but likely less accurate at sub-Regional level) 2007 survey data. The main exception is in the calculation of prevalence among people aged 75+ years, where 2007 data were used as this age group was not included in the 2000 survey.
National prevalence data applied to Derbyshire County
The 2000 National Psychiatric Morbidity Survey12 found the prevalence of Common Mental Disorders (CMDs) across England to be 163 per 1,000 adult population. This report uses the 2000 survey prevalence as the basis for local Derbyshire estimates, but it is important to note that the overall prevalence of CMDs found in the 2007 national survey13 did not change significantly from 2000 (164 and 163 per 1,000 population respectively).
After adjustment for local factors, the Mental Health Observatory14 calculated that the overall CMD prevalence across Derbyshire County and Derby City is estimated to be 125.6 and 158.8 per 1,000 population respectively. This equates to approximately 84,140 adults aged 16 years and over in Derbyshire County and 35,160 adults in Derby City, a total of just over 119,000 adults across both areas. These estimated prevalence rates – particularly that in Derbyshire County - are lower than the national average.
11 Glover G (2008). Estimating the prevalence of common mental health problems in PCTs in
England: a first approximation of the expected caseload for the new psychological therapy services. NEPHO http://www.nepho.org.uk/mho/briefs 12
Singleton, N., Bumpstead, R., O'Brien, M., et al (2001) Psychiatric morbidity among adults living in private households, 2000. London: The Stationery Office. 13
McManus, S et al (2009). Adult Psychiatric Morbidity in England 2007: Results of a household survey. Leeds: The Information Centre. 14
Glover G (2008). Estimating the prevalence of common mental health problems in PCTs in England: a first approximation of the expected caseload for the new psychological therapy services. NEPHO http://www.nepho.org.uk/mho/briefs
Page 20 of 90
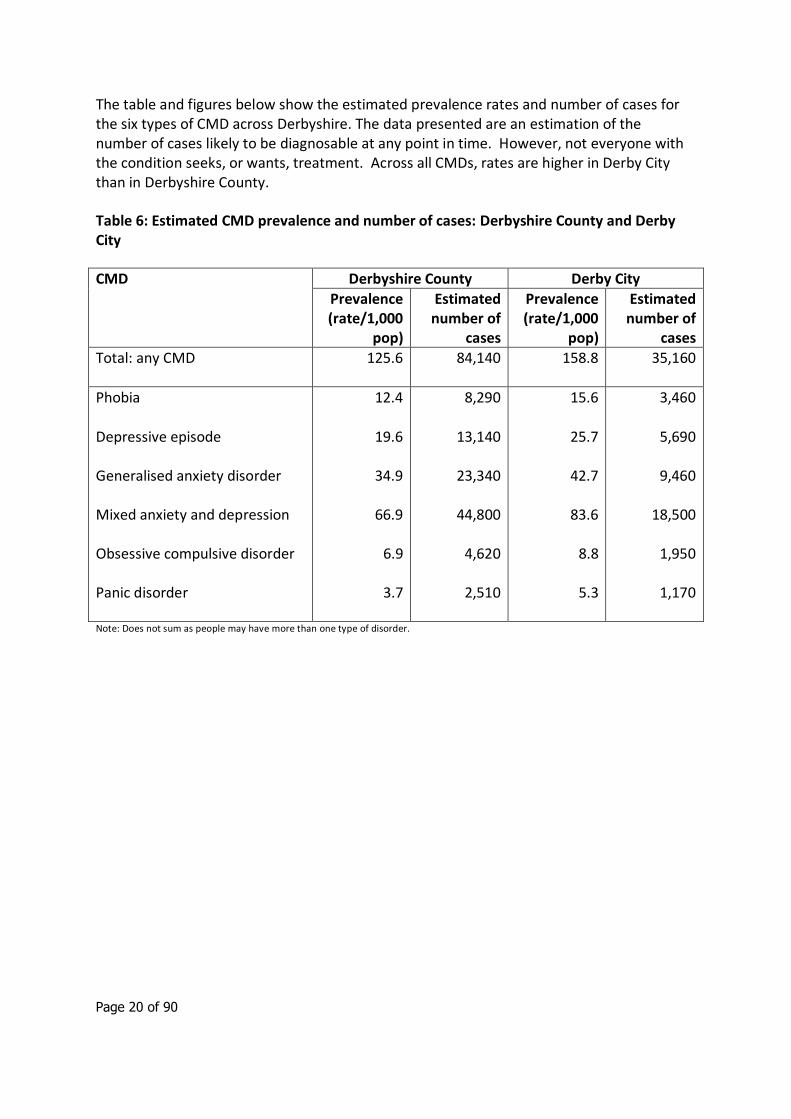
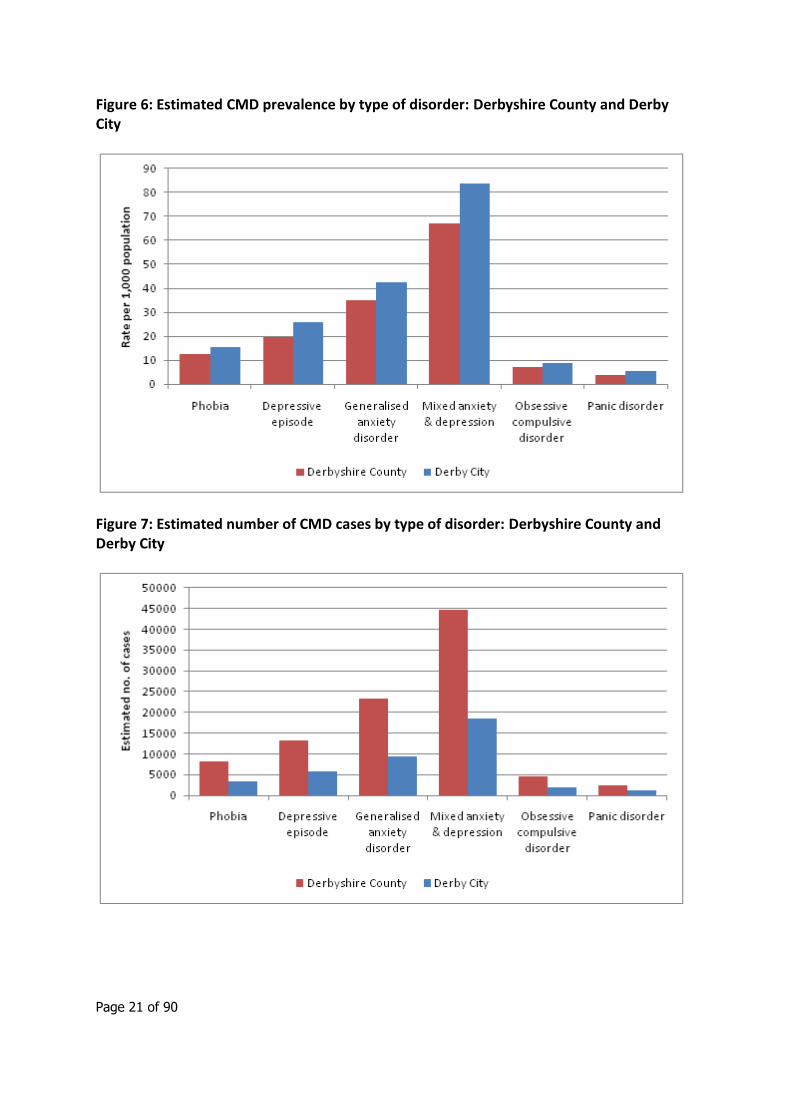
The table and figures below show the estimated prevalence rates and number of cases for the six types of CMD across Derbyshire. The data presented are an estimation of the number of cases likely to be diagnosable at any point in time. However, not everyone with the condition seeks, or wants, treatment. Across all CMDs, rates are higher in Derby City than in Derbyshire County.
Table 6: Estimated CMD prevalence and number of cases: Derbyshire County and Derby City
CMD Derbyshire County Derby City
Prevalence (rate/1,000
pop)
Estimated number of
cases
Prevalence (rate/1,000
pop)
Estimated number of
cases
Total: any CMD 125.6 84,140 158.8 35,160
Phobia
Depressive episode
Generalised anxiety disorder
Mixed anxiety and depression
Obsessive compulsive disorder
Panic disorder
12.4
19.6
34.9
66.9
6.9
3.7
8,290
13,140
23,340
44,800
4,620
2,510
15.6
25.7
42.7
83.6
8.8
5.3
3,460
5,690
9,460
18,500
1,950
1,170
Note: Does not sum as people may have more than one type of disorder.
Page 21 of 90
Figure 6: Estimated CMD prevalence by type of disorder: Derbyshire County and Derby City
Figure 7: Estimated number of CMD cases by type of disorder: Derbyshire County and Derby City
Page 22 of 90
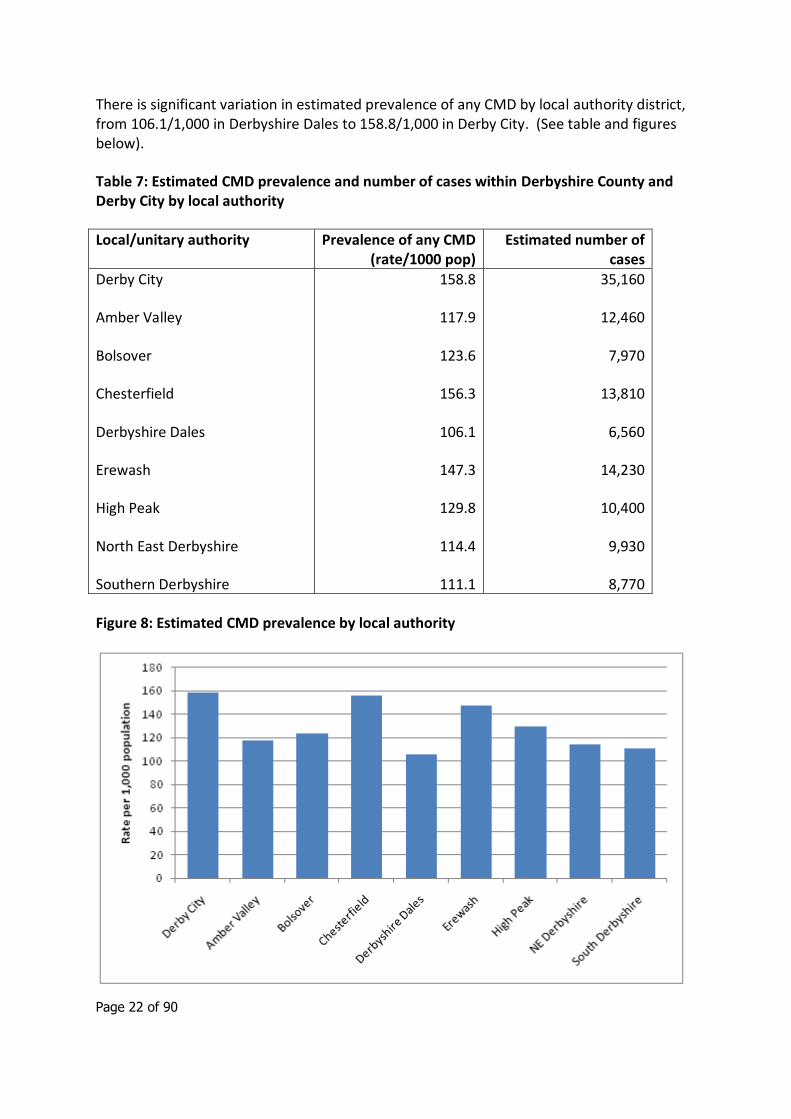
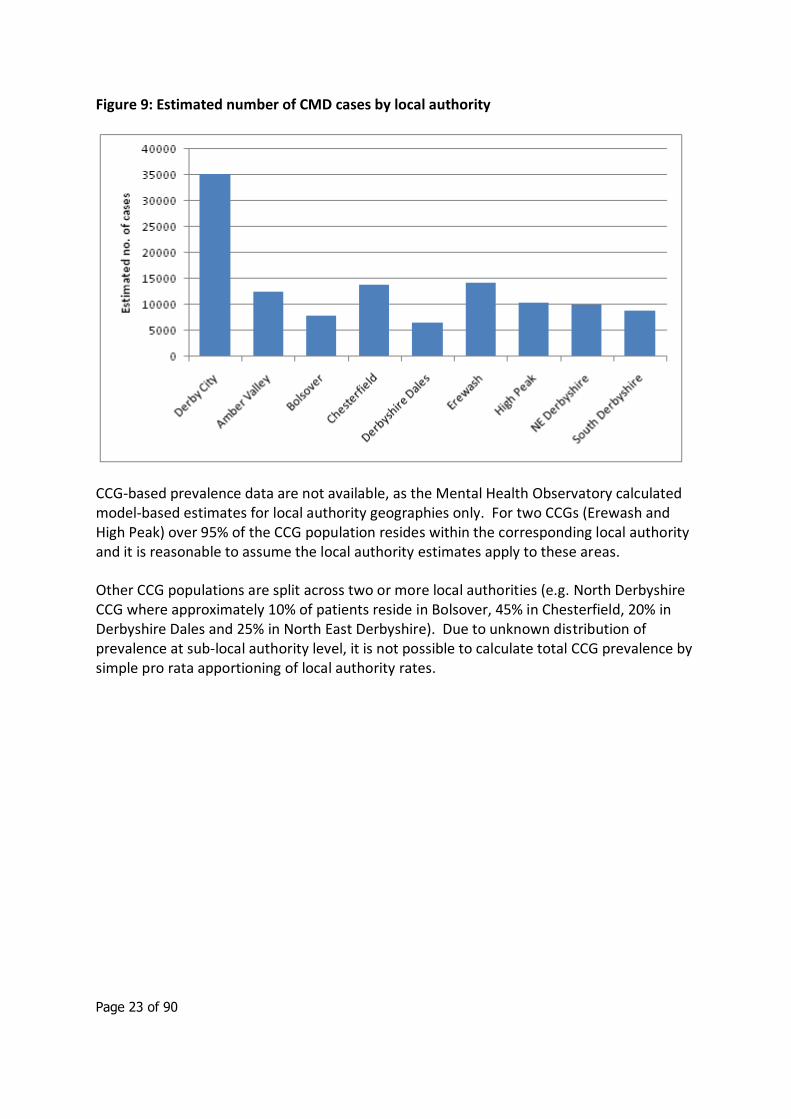
There is significant variation in estimated prevalence of any CMD by local authority district, from 106.1/1,000 in Derbyshire Dales to 158.8/1,000 in Derby City. (See table and figures below).
Table 7: Estimated CMD prevalence and number of cases within Derbyshire County and Derby City by local authority
Local/unitary authority Prevalence of any CMD (rate/1000 pop)
Estimated number of cases
Derby City
Amber Valley
Bolsover
Chesterfield
Derbyshire Dales
Erewash
High Peak
North East Derbyshire
Southern Derbyshire
158.8
117.9
123.6
156.3
106.1
147.3
129.8
114.4
111.1
35,160
12,460
7,970
13,810
6,560
14,230
10,400
9,930
8,770
Figure 8: Estimated CMD prevalence by local authority
Page 23 of 90
Figure 9: Estimated number of CMD cases by local authority
CCG-based prevalence data are not available, as the Mental Health Observatory calculated model-based estimates for local authority geographies only. For two CCGs (Erewash and High Peak) over 95% of the CCG population resides within the corresponding local authority and it is reasonable to assume the local authority estimates apply to these areas.
Other CCG populations are split across two or more local authorities (e.g. North Derbyshire CCG where approximately 10% of patients reside in Bolsover, 45% in Chesterfield, 20% in Derbyshire Dales and 25% in North East Derbyshire). Due to unknown distribution of prevalence at sub-local authority level, it is not possible to calculate total CCG prevalence by simple pro rata apportioning of local authority rates.
Page 24 of 90
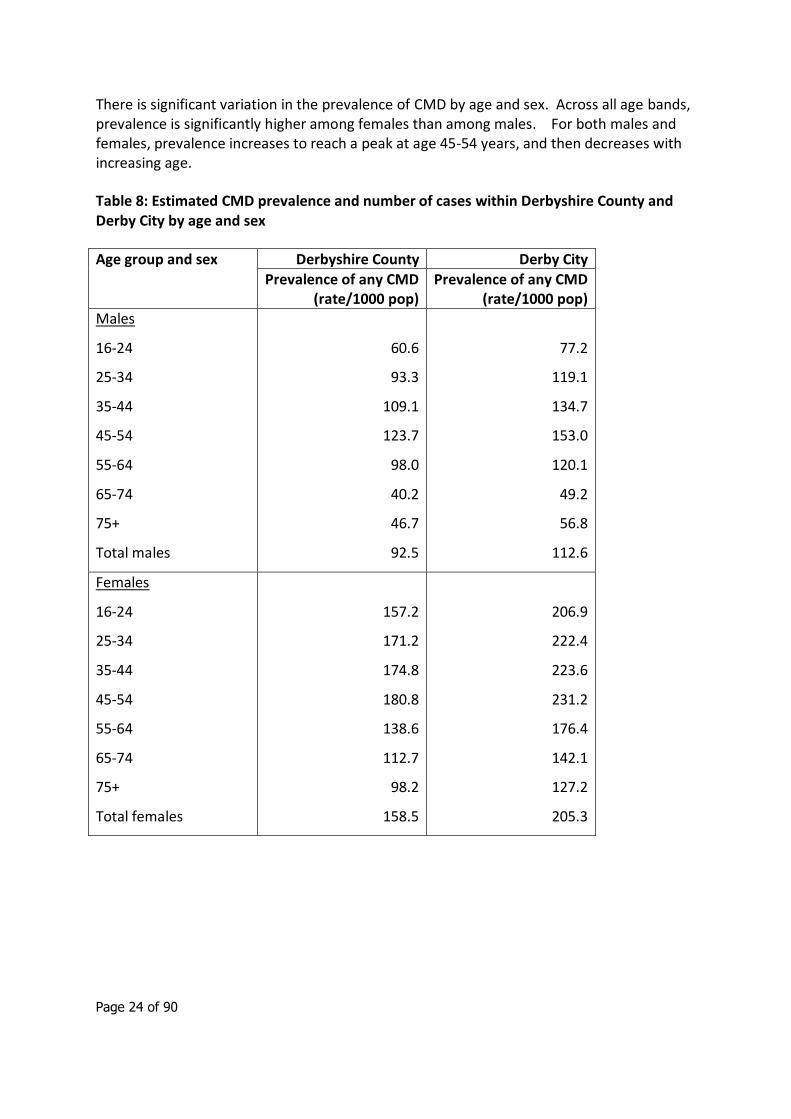
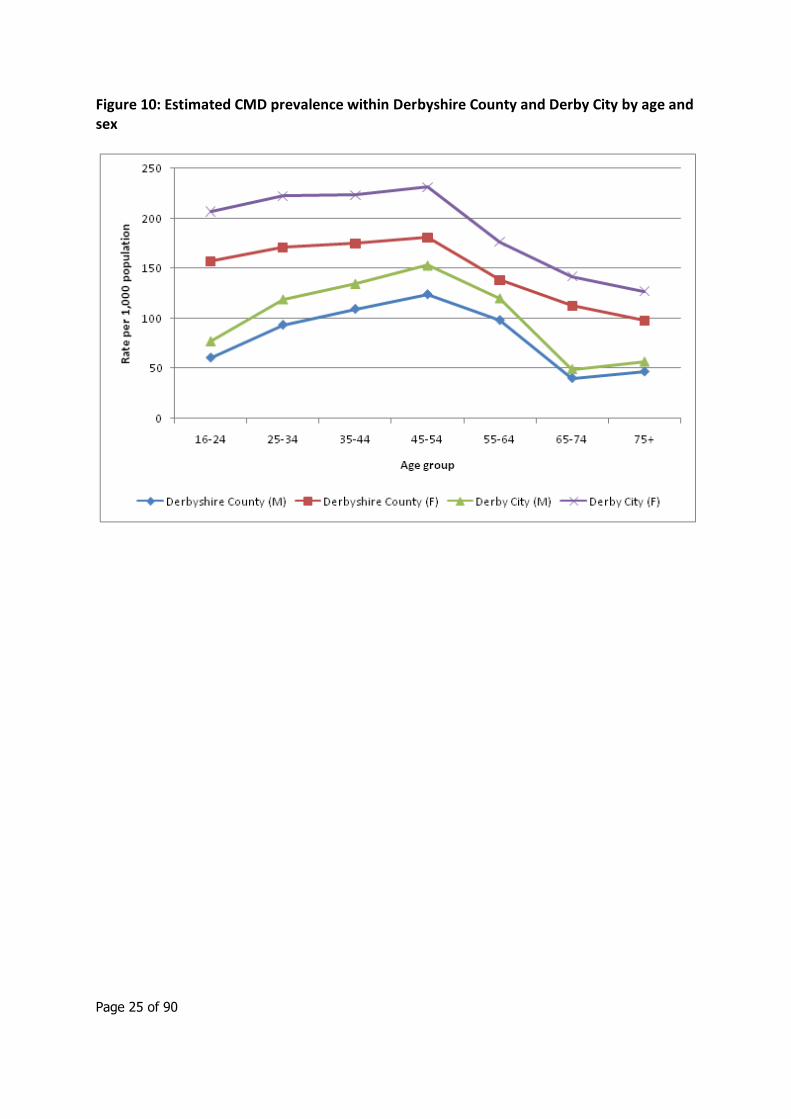
There is significant variation in the prevalence of CMD by age and sex. Across all age bands, prevalence is significantly higher among females than among males. For both males and females, prevalence increases to reach a peak at age 45-54 years, and then decreases with increasing age.
Table 8: Estimated CMD prevalence and number of cases within Derbyshire County and Derby City by age and sex
Age group and sex Derbyshire County Derby City
Prevalence of any CMD (rate/1000 pop)
Prevalence of any CMD (rate/1000 pop)
Males
16-24
25-34
35-44
45-54
55-64
65-74
75+
Total males
60.6
93.3
109.1
123.7
98.0
40.2
46.7
92.5
77.2
119.1
134.7
153.0
120.1
49.2
56.8
112.6
Females
16-24
25-34
35-44
45-54
55-64
65-74
75+
Total females
157.2
171.2
174.8
180.8
138.6
112.7
98.2
158.5
206.9
222.4
223.6
231.2
176.4
142.1
127.2
205.3
Page 25 of 90
Figure 10: Estimated CMD prevalence within Derbyshire County and Derby City by age and sex
Page 26 of 90
2.2 Quality and Outcomes Framework
The Quality and Outcomes Framework (QOF)15 is a voluntary annual reward and incentive programme for all GP surgeries in England. QOF contains four main domains - clinical, organisational, patient experience and additional services. Each domain consists of a set of achievement measures, against which practices score points according to their level of achievement.
In addition, annual estimates of the prevalence of certain conditions are calculated using practice disease registers.
It is important to emphasis that QOF disease prevalence registers are constructed to underpin indicators on quality of care and do not necessarily equate to prevalence as it is usually defined epidemiologically. Prevalence figures based on QOF registers may differ from figures from other sources because of coding or definitional issues. Case finding is also important, it is not possible to interpret apparent trends in the data as it is not possible to determine whether changes are due to true changes in underlying prevalence, or simply improved case finding and recording.
There are additional difficulties in interpreting QOF depression data, as the definition and calculation of prevalence has changed over time:
QOF 2010/11 and 2009/10 – prevalence defined as number of people on the practice depression register as a % of the practice population (patients aged 18+ only)
QOF 2008/09 - prevalence defined as number of people on the practice depression register as a % of the practice population (all ages)
QOF 2007/08 – proportion of patients on the CHD and/or diabetes disease registers who had been diagnosed with depression (so disease-specific, not population-based).
This report uses QOF 2010/11 depression prevalence data at practice level, aggregated to CCG and locality where appropriate.
QOF contains additional depression-related indicators but these relate to quality of care among specific sub groups rather than prevalence (e.g. indicator DEP1 the % of patients on the diabetes and/or CHD registers for whom case finding for depression has been undertaken).
Across England in 2010/11, 11.2% of patients aged 18+ years were recorded on the QOF depression register.16 The QOF depression prevalence across Derby City PCT and Derbyshire County PCT was 9.6% and 11.8% respectively.
15 http://www.qof.ic.nhs.uk/
16 http://www.qof.ic.nhs.uk/
Page 27 of 90
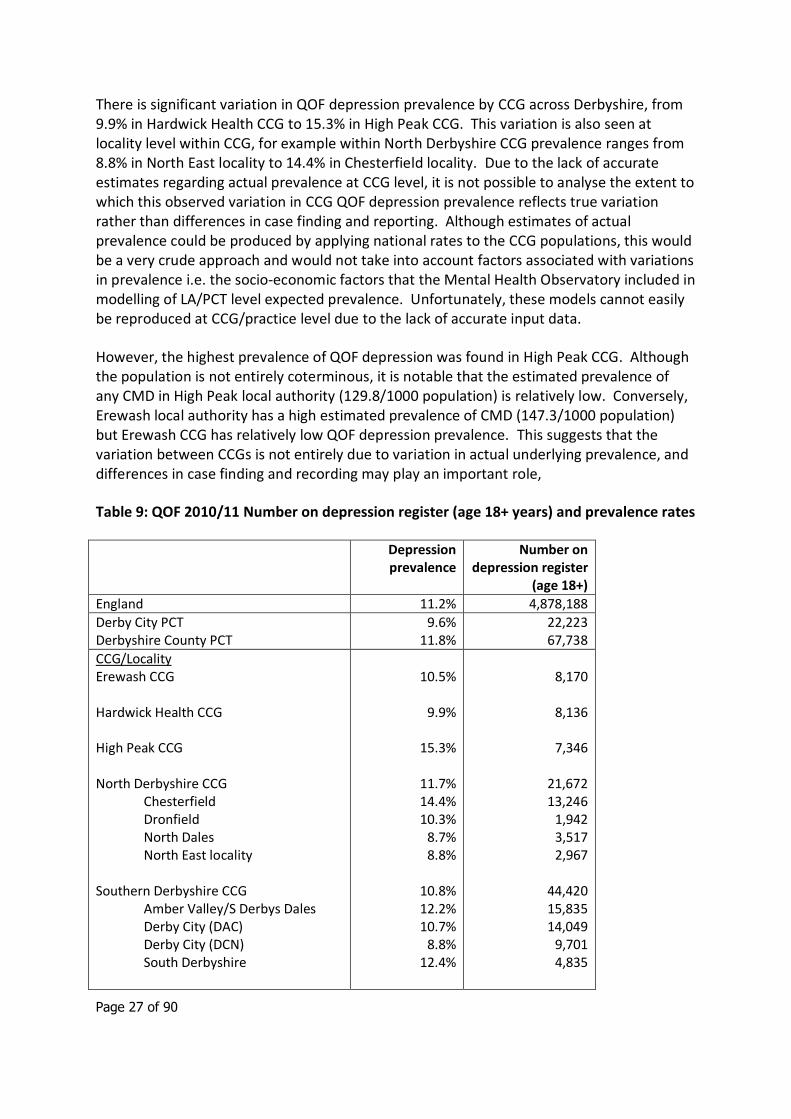
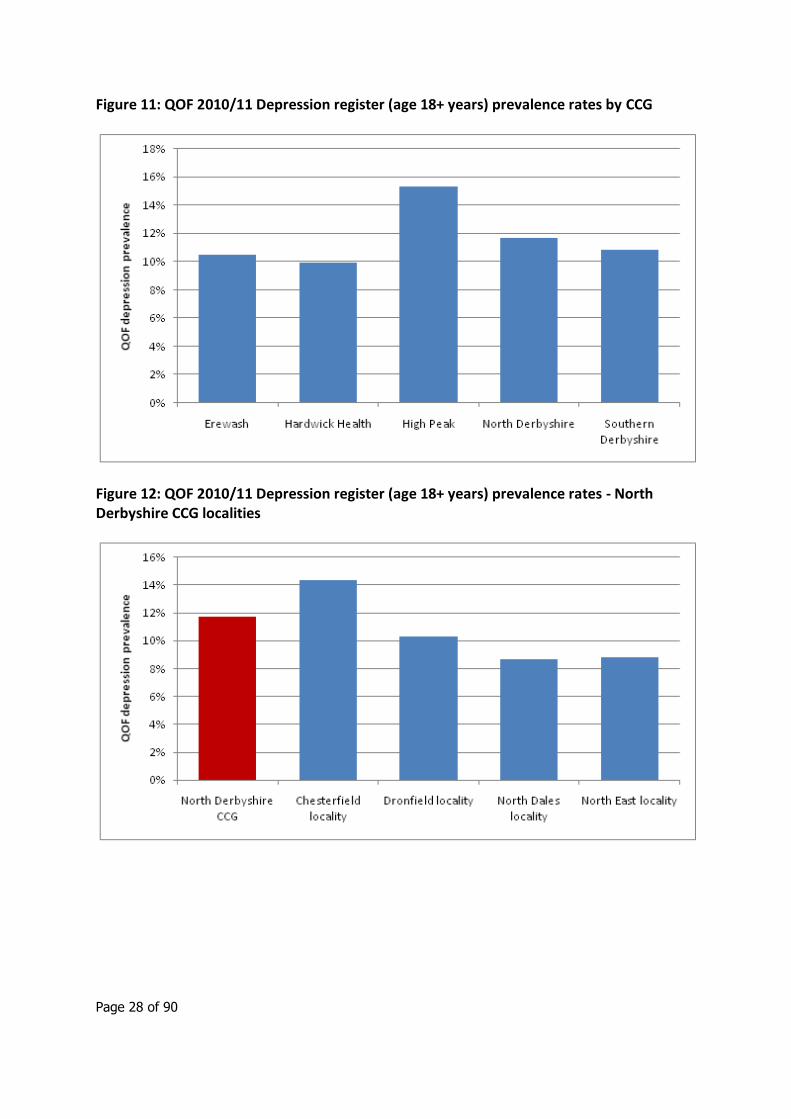
There is significant variation in QOF depression prevalence by CCG across Derbyshire, from 9.9% in Hardwick Health CCG to 15.3% in High Peak CCG. This variation is also seen at locality level within CCG, for example within North Derbyshire CCG prevalence ranges from 8.8% in North East locality to 14.4% in Chesterfield locality. Due to the lack of accurate estimates regarding actual prevalence at CCG level, it is not possible to analyse the extent to which this observed variation in CCG QOF depression prevalence reflects true variation rather than differences in case finding and reporting. Although estimates of actual prevalence could be produced by applying national rates to the CCG populations, this would be a very crude approach and would not take into account factors associated with variations in prevalence i.e. the socio-economic factors that the Mental Health Observatory included in modelling of LA/PCT level expected prevalence. Unfortunately, these models cannot easily be reproduced at CCG/practice level due to the lack of accurate input data.
However, the highest prevalence of QOF depression was found in High Peak CCG. Although the population is not entirely coterminous, it is notable that the estimated prevalence of any CMD in High Peak local authority (129.8/1000 population) is relatively low. Conversely, Erewash local authority has a high estimated prevalence of CMD (147.3/1000 population) but Erewash CCG has relatively low QOF depression prevalence. This suggests that the variation between CCGs is not entirely due to variation in actual underlying prevalence, and differences in case finding and recording may play an important role,
Table 9: QOF 2010/11 Number on depression register (age 18+ years) and prevalence rates
Depression prevalence
Number on depression register
(age 18+)
England 11.2% 4,878,188
Derby City PCT Derbyshire County PCT
9.6% 11.8%
22,223 67,738
CCG/Locality Erewash CCG Hardwick Health CCG High Peak CCG North Derbyshire CCG Chesterfield Dronfield North Dales North East locality Southern Derbyshire CCG Amber Valley/S Derbys Dales Derby City (DAC) Derby City (DCN) South Derbyshire
10.5%
9.9%
15.3%
11.7% 14.4% 10.3%
8.7% 8.8%
10.8% 12.2% 10.7%
8.8% 12.4%
8,170
8,136
7,346
21,672 13,246
1,942 3,517 2,967
44,420 15,835 14,049
9,701 4,835
Page 28 of 90
Figure 11: QOF 2010/11 Depression register (age 18+ years) prevalence rates by CCG
Figure 12: QOF 2010/11 Depression register (age 18+ years) prevalence rates - North Derbyshire CCG localities
Page 29 of 90
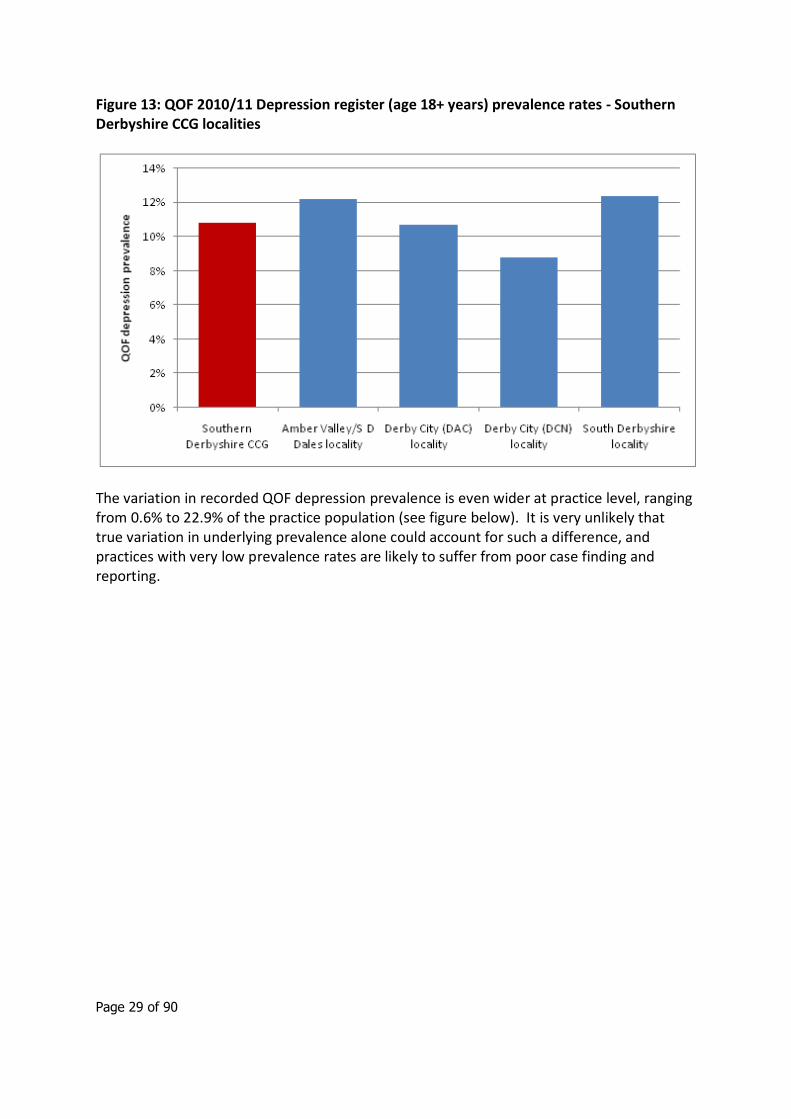
Figure 13: QOF 2010/11 Depression register (age 18+ years) prevalence rates - Southern Derbyshire CCG localities
The variation in recorded QOF depression prevalence is even wider at practice level, ranging from 0.6% to 22.9% of the practice population (see figure below). It is very unlikely that true variation in underlying prevalence alone could account for such a difference, and practices with very low prevalence rates are likely to suffer from poor case finding and reporting.
Page 30 of 90
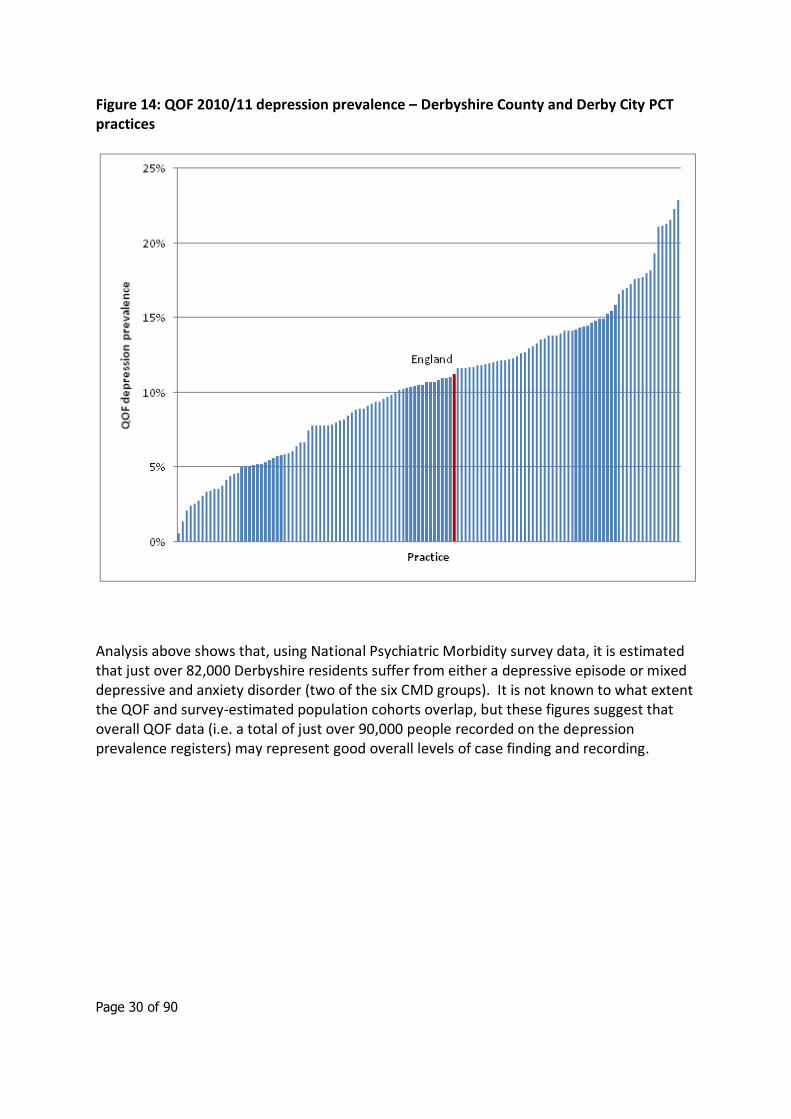
Figure 14: QOF 2010/11 depression prevalence – Derbyshire County and Derby City PCT practices
Analysis above shows that, using National Psychiatric Morbidity survey data, it is estimated that just over 82,000 Derbyshire residents suffer from either a depressive episode or mixed depressive and anxiety disorder (two of the six CMD groups). It is not known to what extent the QOF and survey-estimated population cohorts overlap, but these figures suggest that overall QOF data (i.e. a total of just over 90,000 people recorded on the depression prevalence registers) may represent good overall levels of case finding and recording.
Page 31 of 90
3. Severe and Enduring Mental Illness
3.1 Introduction
The adult psychiatric morbidity surveys carried out in 200017 and 200718 both measured functional psychosis by assessing the presence of disorders such as schizophrenia, bipolar disorder and manic depression.
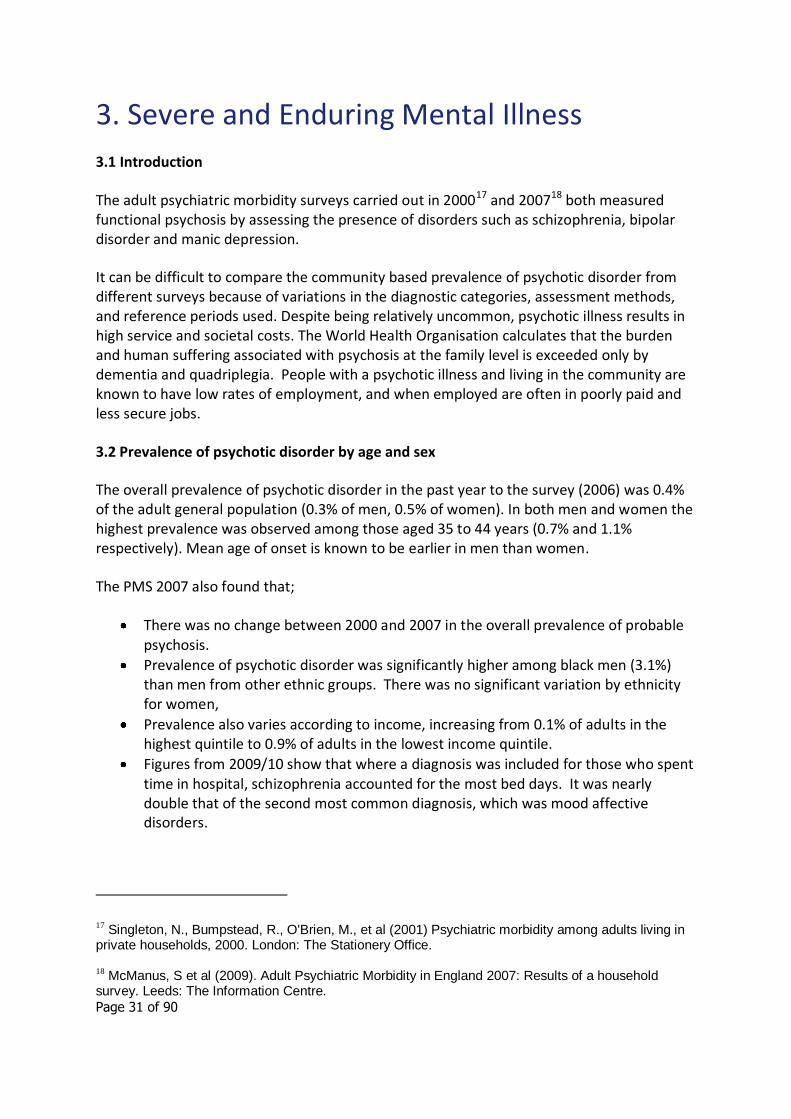
It can be difficult to compare the community based prevalence of psychotic disorder from different surveys because of variations in the diagnostic categories, assessment methods, and reference periods used. Despite being relatively uncommon, psychotic illness results in high service and societal costs. The World Health Organisation calculates that the burden and human suffering associated with psychosis at the family level is exceeded only by dementia and quadriplegia. People with a psychotic illness and living in the community are known to have low rates of employment, and when employed are often in poorly paid and less secure jobs.
3.2 Prevalence of psychotic disorder by age and sex
The overall prevalence of psychotic disorder in the past year to the survey (2006) was 0.4% of the adult general population (0.3% of men, 0.5% of women). In both men and women the highest prevalence was observed among those aged 35 to 44 years (0.7% and 1.1% respectively). Mean age of onset is known to be earlier in men than women.
The PMS 2007 also found that;
There was no change between 2000 and 2007 in the overall prevalence of probable psychosis.
Prevalence of psychotic disorder was significantly higher among black men (3.1%) than men from other ethnic groups. There was no significant variation by ethnicity for women,
Prevalence also varies according to income, increasing from 0.1% of adults in the highest quintile to 0.9% of adults in the lowest income quintile.
Figures from 2009/10 show that where a diagnosis was included for those who spent time in hospital, schizophrenia accounted for the most bed days. It was nearly double that of the second most common diagnosis, which was mood affective disorders.
17 Singleton, N., Bumpstead, R., O'Brien, M., et al (2001) Psychiatric morbidity among adults living in private households, 2000. London: The Stationery Office. 18 McManus, S et al (2009). Adult Psychiatric Morbidity in England 2007: Results of a household survey. Leeds: The Information Centre.
Page 32 of 90
Table 10: Estimated prevalence of psychotic disorder in the past year, by age and sex (taken from the Psychiatric Morbidity Survey, 2007)
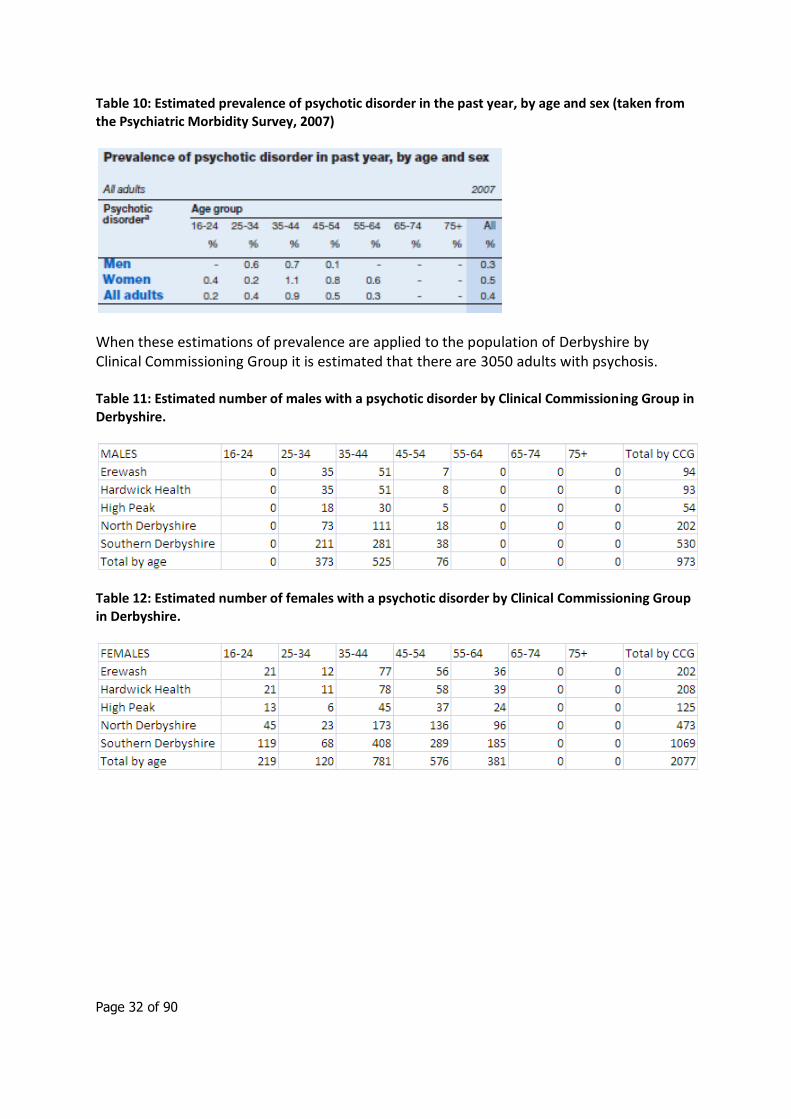
When these estimations of prevalence are applied to the population of Derbyshire by Clinical Commissioning Group it is estimated that there are 3050 adults with psychosis.
Table 11: Estimated number of males with a psychotic disorder by Clinical Commissioning Group in Derbyshire.
Table 12: Estimated number of females with a psychotic disorder by Clinical Commissioning Group in Derbyshire.
Page 33 of 90
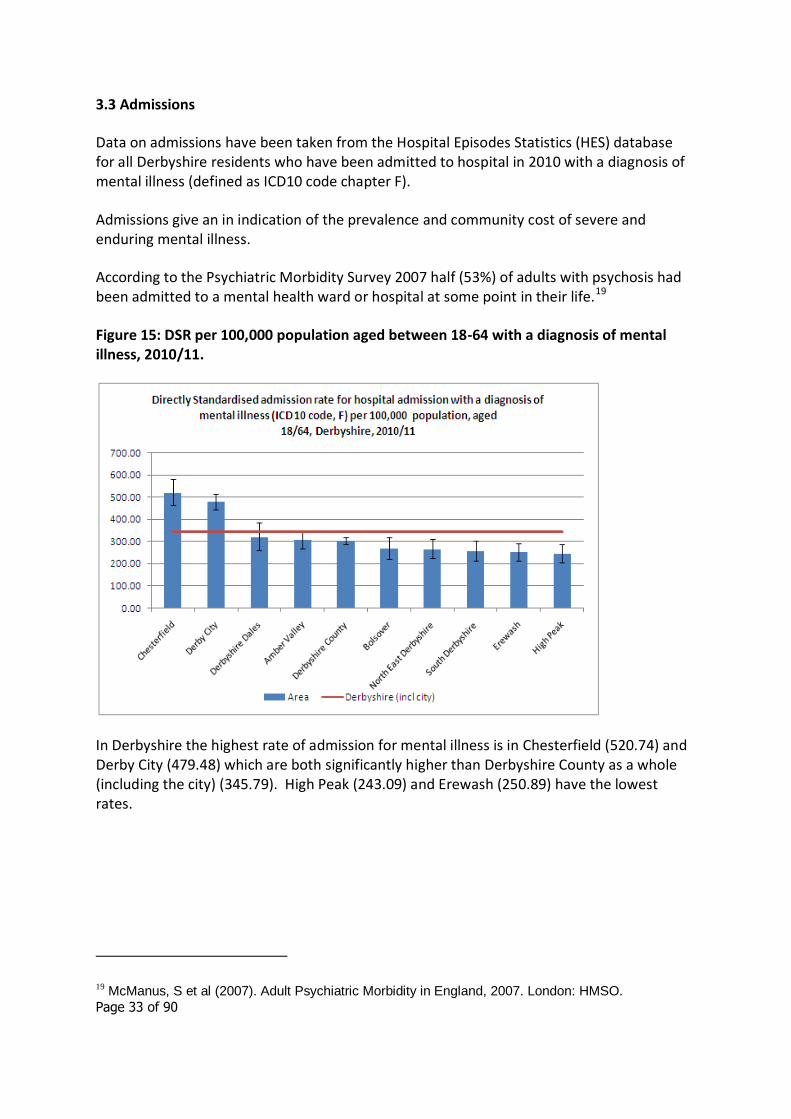
3.3 Admissions
Data on admissions have been taken from the Hospital Episodes Statistics (HES) database for all Derbyshire residents who have been admitted to hospital in 2010 with a diagnosis of mental illness (defined as ICD10 code chapter F).
Admissions give an in indication of the prevalence and community cost of severe and enduring mental illness.
According to the Psychiatric Morbidity Survey 2007 half (53%) of adults with psychosis had been admitted to a mental health ward or hospital at some point in their life.19
Figure 15: DSR per 100,000 population aged between 18-64 with a diagnosis of mental illness, 2010/11.
In Derbyshire the highest rate of admission for mental illness is in Chesterfield (520.74) and Derby City (479.48) which are both significantly higher than Derbyshire County as a whole (including the city) (345.79). High Peak (243.09) and Erewash (250.89) have the lowest rates.
19 McManus, S et al (2007). Adult Psychiatric Morbidity in England, 2007. London: HMSO.
Page 34 of 90
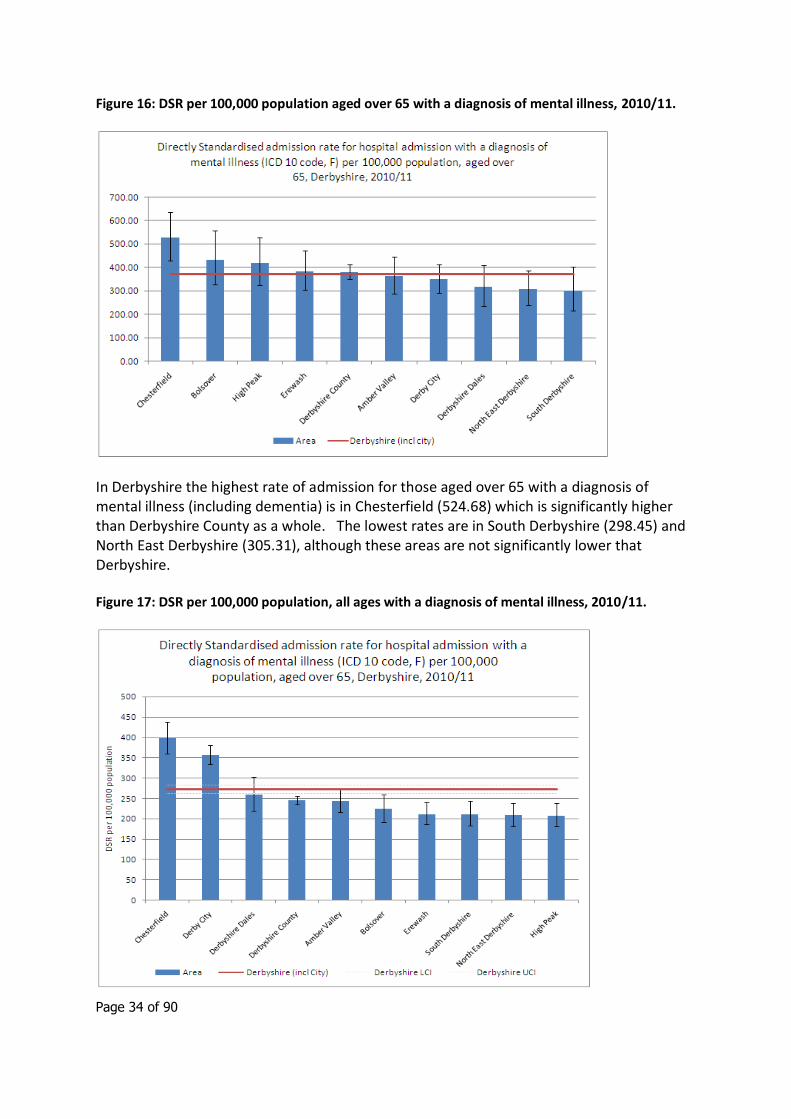
Figure 16: DSR per 100,000 population aged over 65 with a diagnosis of mental illness, 2010/11.
In Derbyshire the highest rate of admission for those aged over 65 with a diagnosis of mental illness (including dementia) is in Chesterfield (524.68) which is significantly higher than Derbyshire County as a whole. The lowest rates are in South Derbyshire (298.45) and North East Derbyshire (305.31), although these areas are not significantly lower that Derbyshire.
Figure 17: DSR per 100,000 population, all ages with a diagnosis of mental illness, 2010/11.
Page 35 of 90
In Derbyshire the highest rate of admission for all ages with a diagnosis of mental illness (including dementia) is in Chesterfield (398.18) and Derby City (356.94) which both have significantly higher rates than Derbyshire. The lowest rates are in High Peak (208.19) North East Derbyshire (208.68) and South Derbyshire (211.68).
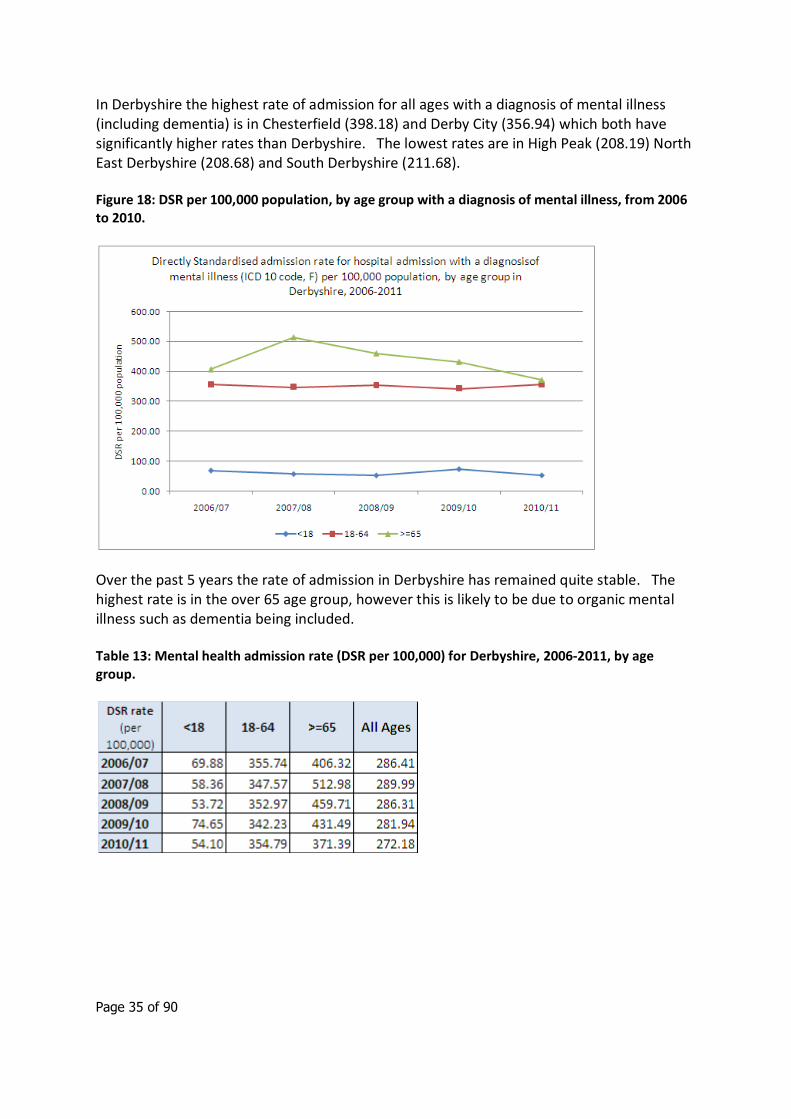
Figure 18: DSR per 100,000 population, by age group with a diagnosis of mental illness, from 2006 to 2010.
Over the past 5 years the rate of admission in Derbyshire has remained quite stable. The highest rate is in the over 65 age group, however this is likely to be due to organic mental illness such as dementia being included.
Table 13: Mental health admission rate (DSR per 100,000) for Derbyshire, 2006-2011, by age group.
Page 36 of 90
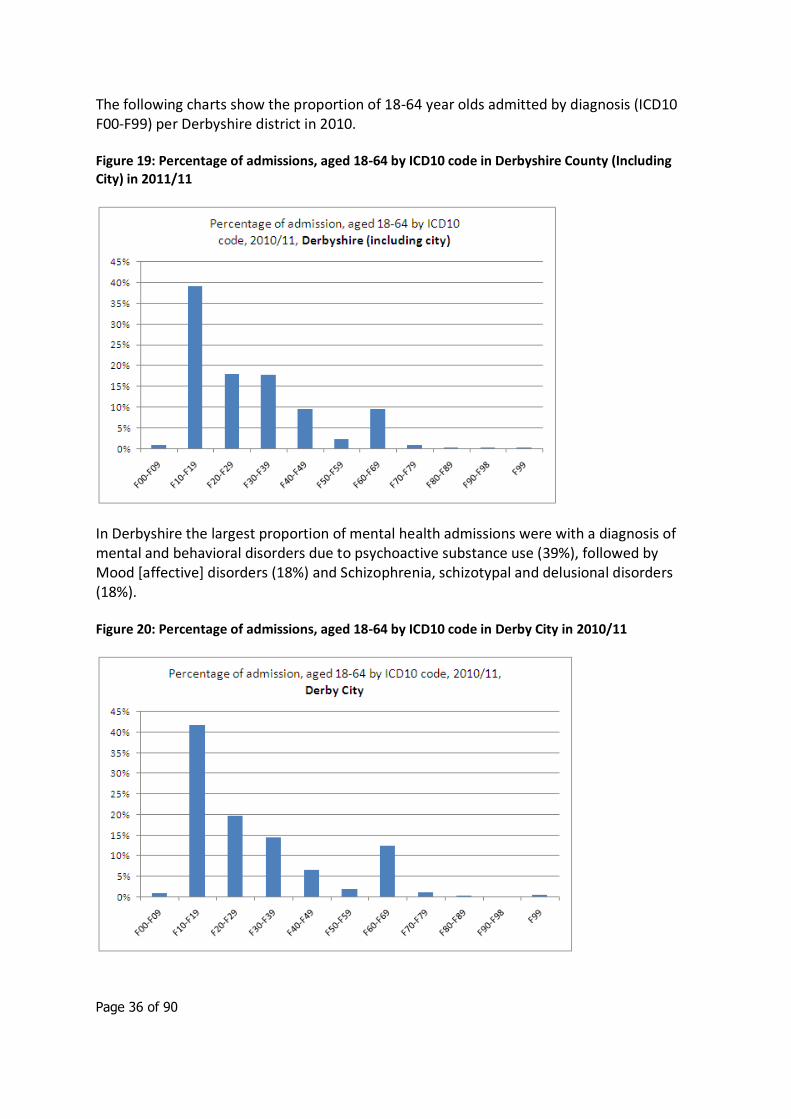
The following charts show the proportion of 18-64 year olds admitted by diagnosis (ICD10 F00-F99) per Derbyshire district in 2010.
Figure 19: Percentage of admissions, aged 18-64 by ICD10 code in Derbyshire County (Including City) in 2011/11
In Derbyshire the largest proportion of mental health admissions were with a diagnosis of mental and behavioral disorders due to psychoactive substance use (39%), followed by Mood [affective] disorders (18%) and Schizophrenia, schizotypal and delusional disorders (18%).
Figure 20: Percentage of admissions, aged 18-64 by ICD10 code in Derby City in 2010/11
Page 37 of 90
In Derby City the largest proportion of mental health admissions were with a diagnosis of mental and behavioral disorders due to psychoactive substance use (42%), followed by schizophrenia, schizotypal and delusional disorders (20%).
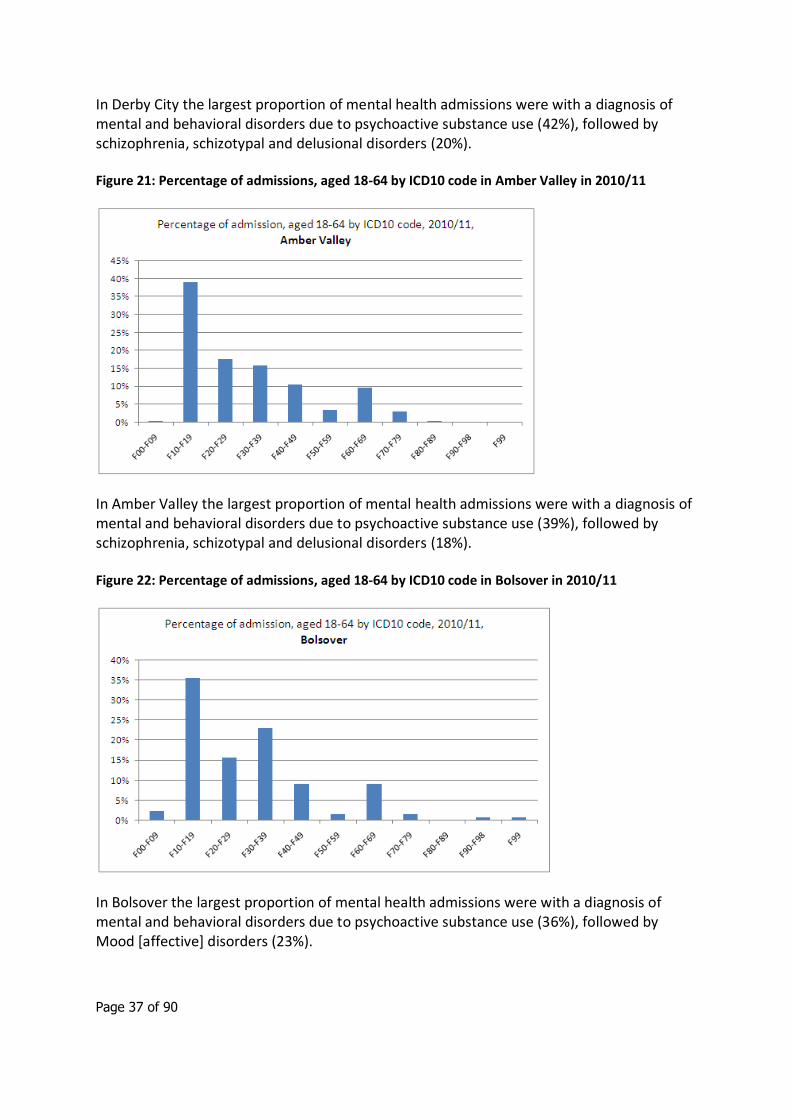
Figure 21: Percentage of admissions, aged 18-64 by ICD10 code in Amber Valley in 2010/11
In Amber Valley the largest proportion of mental health admissions were with a diagnosis of mental and behavioral disorders due to psychoactive substance use (39%), followed by schizophrenia, schizotypal and delusional disorders (18%).
Figure 22: Percentage of admissions, aged 18-64 by ICD10 code in Bolsover in 2010/11
In Bolsover the largest proportion of mental health admissions were with a diagnosis of mental and behavioral disorders due to psychoactive substance use (36%), followed by Mood [affective] disorders (23%).
Page 38 of 90
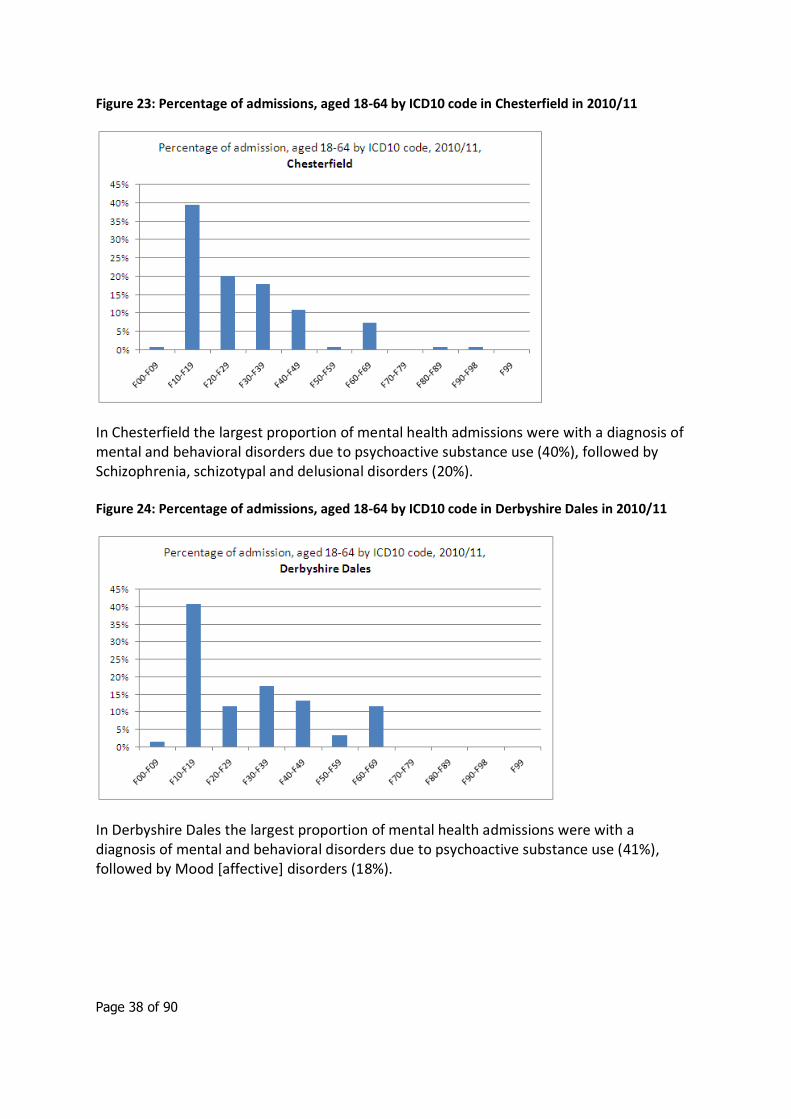
Figure 23: Percentage of admissions, aged 18-64 by ICD10 code in Chesterfield in 2010/11
In Chesterfield the largest proportion of mental health admissions were with a diagnosis of mental and behavioral disorders due to psychoactive substance use (40%), followed by Schizophrenia, schizotypal and delusional disorders (20%).
Figure 24: Percentage of admissions, aged 18-64 by ICD10 code in Derbyshire Dales in 2010/11
In Derbyshire Dales the largest proportion of mental health admissions were with a diagnosis of mental and behavioral disorders due to psychoactive substance use (41%), followed by Mood [affective] disorders (18%).
Page 39 of 90
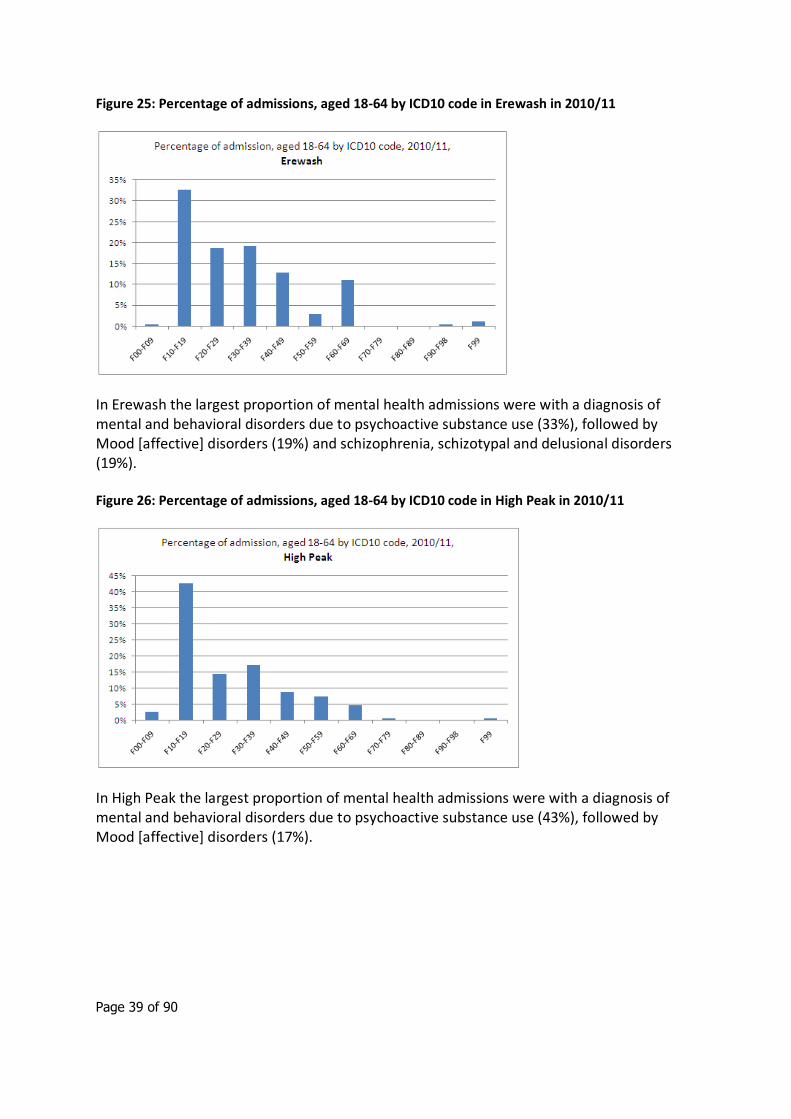
Figure 25: Percentage of admissions, aged 18-64 by ICD10 code in Erewash in 2010/11
In Erewash the largest proportion of mental health admissions were with a diagnosis of mental and behavioral disorders due to psychoactive substance use (33%), followed by Mood [affective] disorders (19%) and schizophrenia, schizotypal and delusional disorders (19%).
Figure 26: Percentage of admissions, aged 18-64 by ICD10 code in High Peak in 2010/11
In High Peak the largest proportion of mental health admissions were with a diagnosis of mental and behavioral disorders due to psychoactive substance use (43%), followed by Mood [affective] disorders (17%).
Page 40 of 90
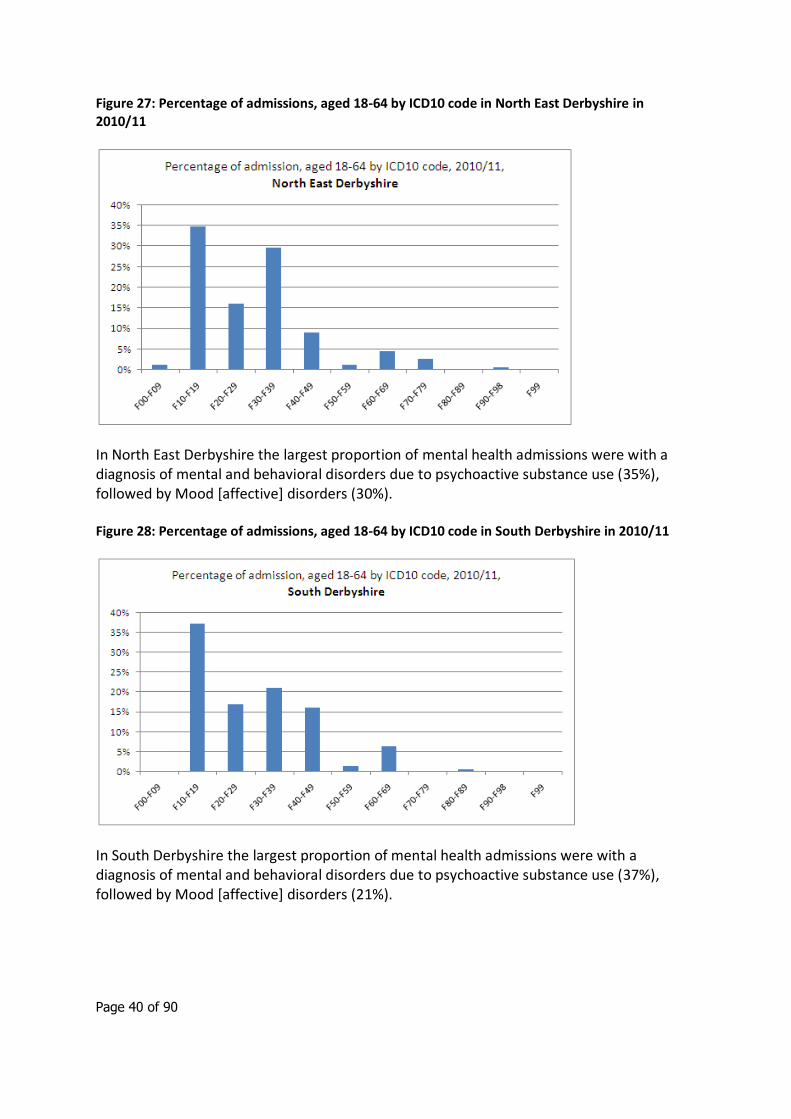
Figure 27: Percentage of admissions, aged 18-64 by ICD10 code in North East Derbyshire in 2010/11
In North East Derbyshire the largest proportion of mental health admissions were with a diagnosis of mental and behavioral disorders due to psychoactive substance use (35%), followed by Mood [affective] disorders (30%).
Figure 28: Percentage of admissions, aged 18-64 by ICD10 code in South Derbyshire in 2010/11
In South Derbyshire the largest proportion of mental health admissions were with a diagnosis of mental and behavioral disorders due to psychoactive substance use (37%), followed by Mood [affective] disorders (21%).
Page 41 of 90
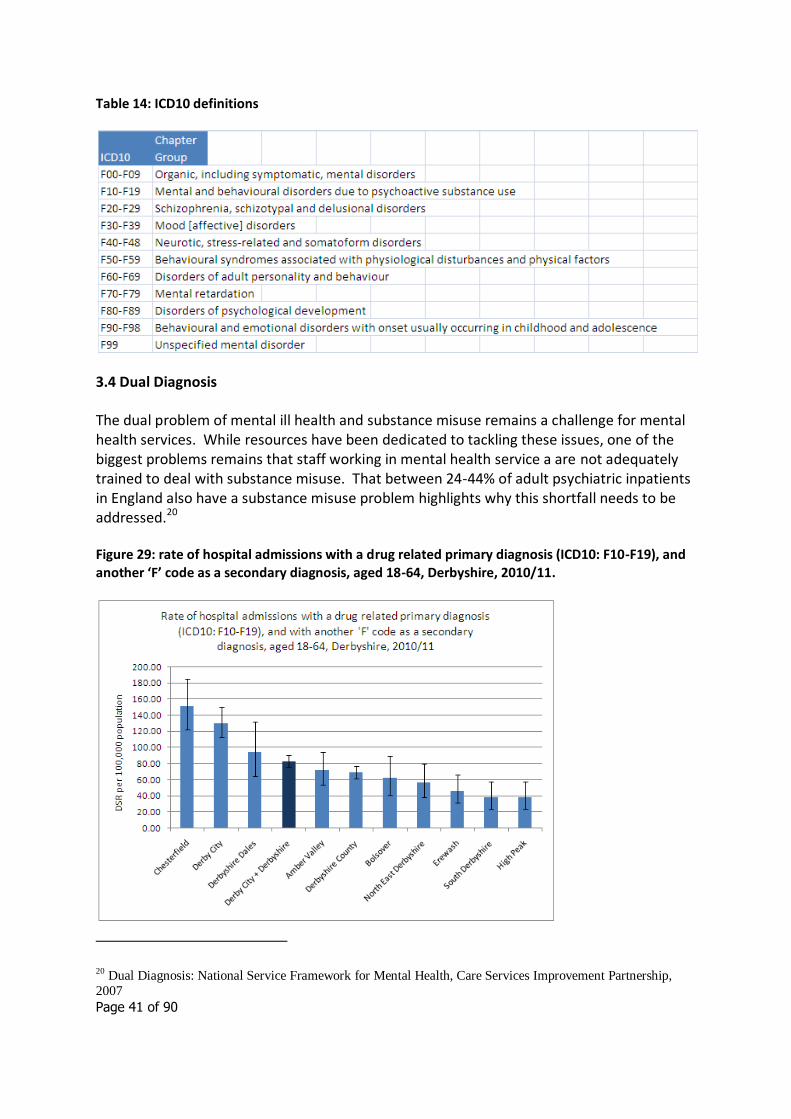
Table 14: ICD10 definitions
3.4 Dual Diagnosis
The dual problem of mental ill health and substance misuse remains a challenge for mental health services. While resources have been dedicated to tackling these issues, one of the biggest problems remains that staff working in mental health service a are not adequately trained to deal with substance misuse. That between 24-44% of adult psychiatric inpatients in England also have a substance misuse problem highlights why this shortfall needs to be addressed.20
Figure 29: rate of hospital admissions with a drug related primary diagnosis (ICD10: F10-F19), and another ‘F’ code as a secondary diagnosis, aged 18-64, Derbyshire, 2010/11.
20 Dual Diagnosis: National Service Framework for Mental Health, Care Services Improvement Partnership,
2007

Page 42 of 90
The rate of admission with a drug related primary diagnosis and another ‘F’ code (ICD 10) as secondary diagnosis shows that Chesterfield (150.99) has a significantly higher rate than Derbyshire (82.96) as does Derby City (130.07). High Peak (38.26) South Derbyshire (38.42) and Erewash (46.41) have the lowest rates, which are all significantly lower that Derbyshire County as a whole.
This data should be viewed with some caution as it only captures hospital admissions with a dual diagnosis with a drug related primary diagnosis (ICD10: F10-F19) and another ‘F’ code as a secondary diagnosis. The actual numbers are very also very small.
Page 43 of 90
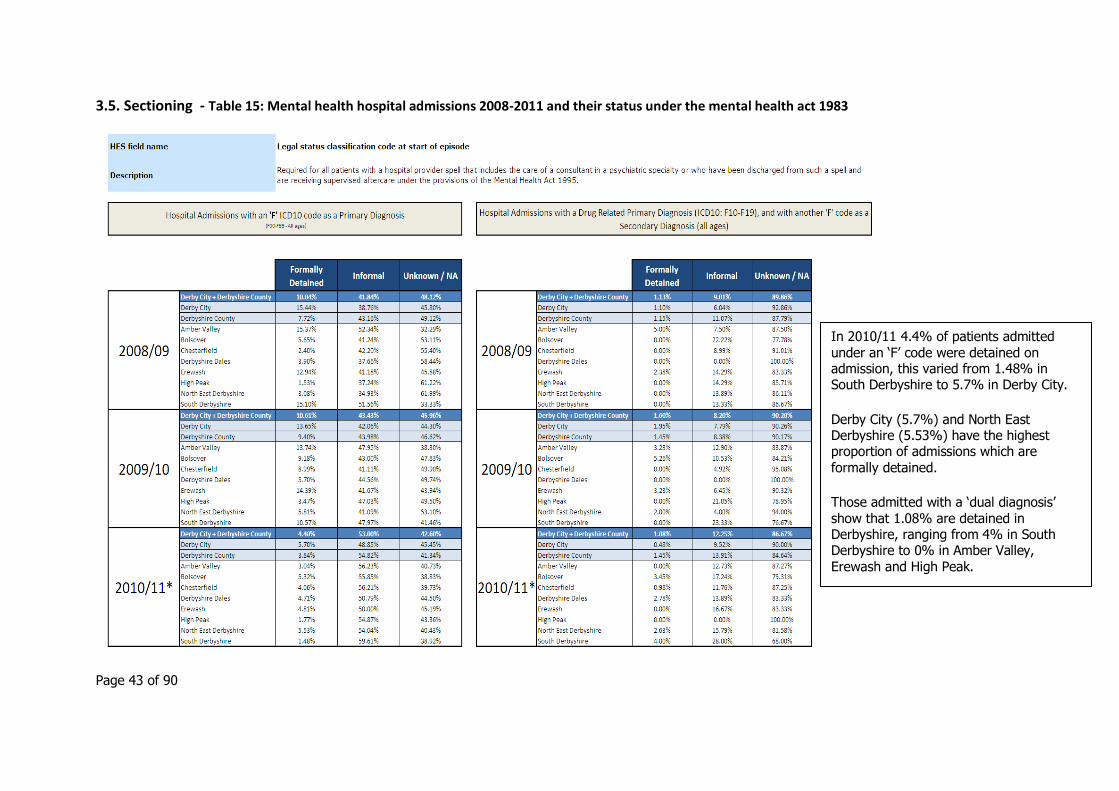
3.5. Sectioning - Table 15: Mental health hospital admissions 2008-2011 and their status under the mental health act 1983
In 2010/11 4.4% of patients admitted under an ‘F’ code were detained on admission, this varied from 1.48% in South Derbyshire to 5.7% in Derby City.
Derby City (5.7%) and North East Derbyshire (5.53%) have the highest proportion of admissions which are
formally detained.
Those admitted with a ‘dual diagnosis’ show that 1.08% are detained in Derbyshire, ranging from 4% in South Derbyshire to 0% in Amber Valley, Erewash and High Peak.
Page 44 of 90
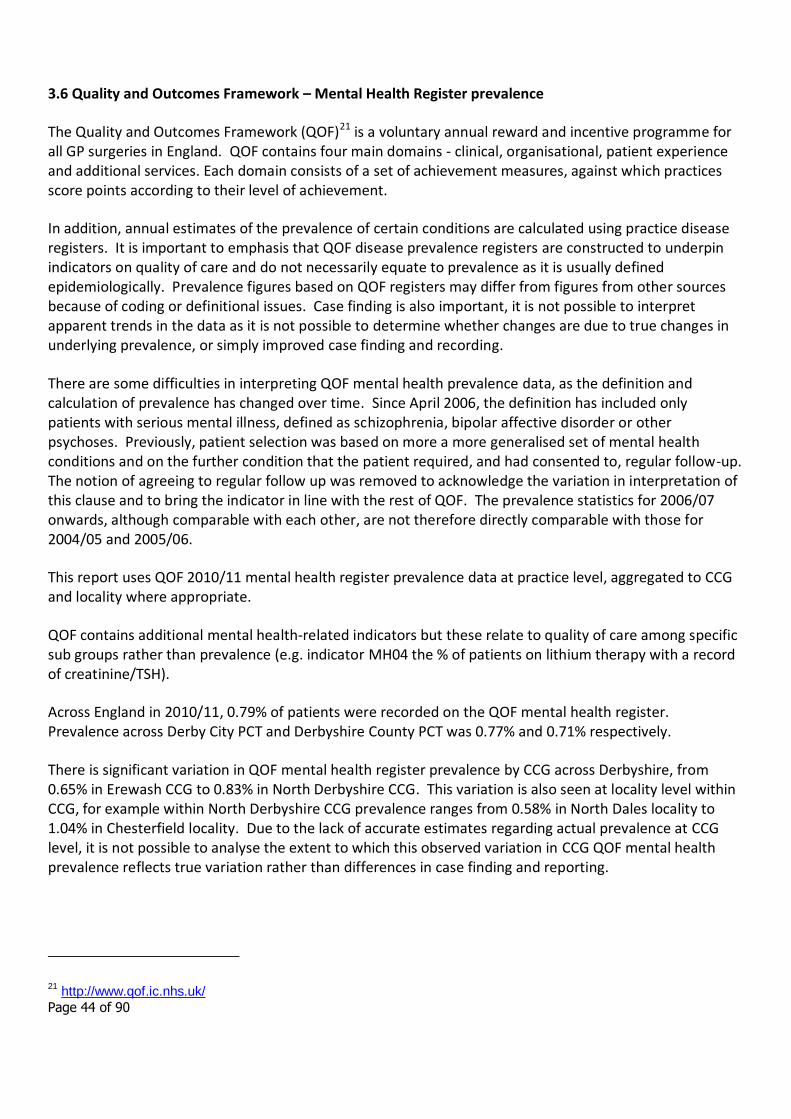
3.6 Quality and Outcomes Framework – Mental Health Register prevalence
The Quality and Outcomes Framework (QOF)21 is a voluntary annual reward and incentive programme for all GP surgeries in England. QOF contains four main domains - clinical, organisational, patient experience and additional services. Each domain consists of a set of achievement measures, against which practices score points according to their level of achievement.
In addition, annual estimates of the prevalence of certain conditions are calculated using practice disease registers. It is important to emphasis that QOF disease prevalence registers are constructed to underpin indicators on quality of care and do not necessarily equate to prevalence as it is usually defined epidemiologically. Prevalence figures based on QOF registers may differ from figures from other sources because of coding or definitional issues. Case finding is also important, it is not possible to interpret apparent trends in the data as it is not possible to determine whether changes are due to true changes in underlying prevalence, or simply improved case finding and recording.
There are some difficulties in interpreting QOF mental health prevalence data, as the definition and calculation of prevalence has changed over time. Since April 2006, the definition has included only patients with serious mental illness, defined as schizophrenia, bipolar affective disorder or other psychoses. Previously, patient selection was based on more a more generalised set of mental health conditions and on the further condition that the patient required, and had consented to, regular follow-up. The notion of agreeing to regular follow up was removed to acknowledge the variation in interpretation of this clause and to bring the indicator in line with the rest of QOF. The prevalence statistics for 2006/07 onwards, although comparable with each other, are not therefore directly comparable with those for 2004/05 and 2005/06.
This report uses QOF 2010/11 mental health register prevalence data at practice level, aggregated to CCG and locality where appropriate.
QOF contains additional mental health-related indicators but these relate to quality of care among specific sub groups rather than prevalence (e.g. indicator MH04 the % of patients on lithium therapy with a record of creatinine/TSH).
Across England in 2010/11, 0.79% of patients were recorded on the QOF mental health register. Prevalence across Derby City PCT and Derbyshire County PCT was 0.77% and 0.71% respectively.
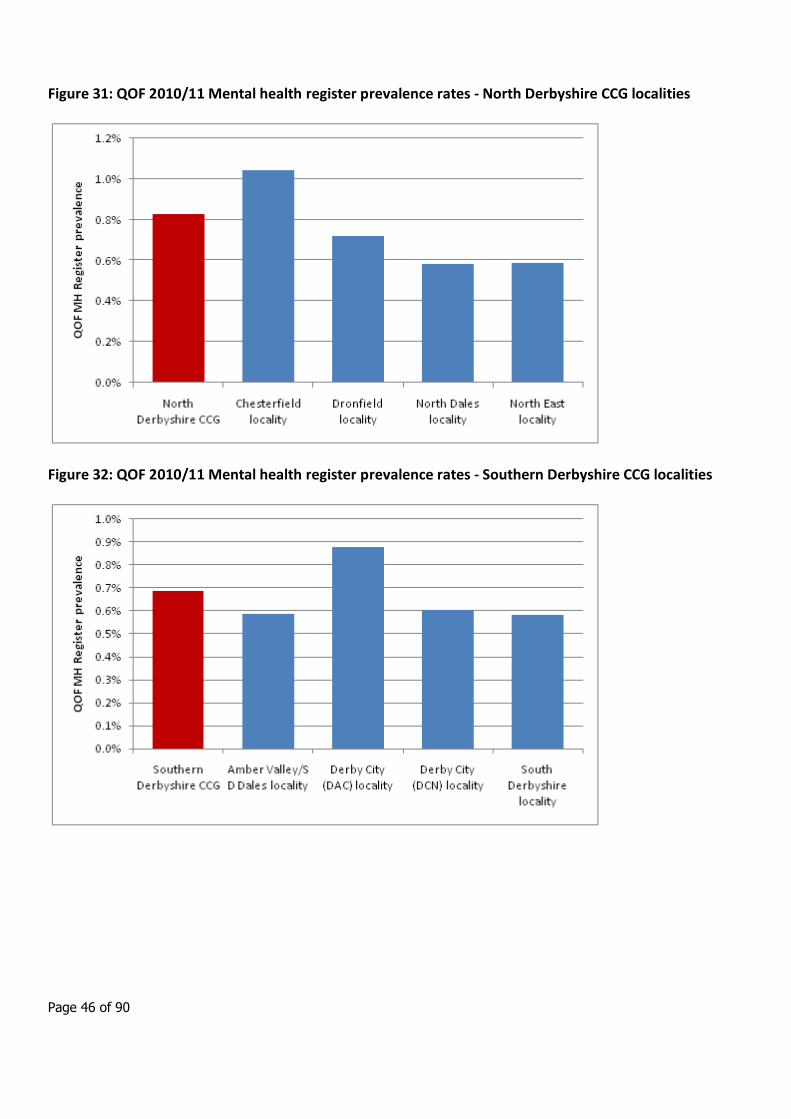
There is significant variation in QOF mental health register prevalence by CCG across Derbyshire, from 0.65% in Erewash CCG to 0.83% in North Derbyshire CCG. This variation is also seen at locality level within CCG, for example within North Derbyshire CCG prevalence ranges from 0.58% in North Dales locality to 1.04% in Chesterfield locality. Due to the lack of accurate estimates regarding actual prevalence at CCG level, it is not possible to analyse the extent to which this observed variation in CCG QOF mental health prevalence reflects true variation rather than differences in case finding and reporting.
21 http://www.qof.ic.nhs.uk/
Page 45 of 90
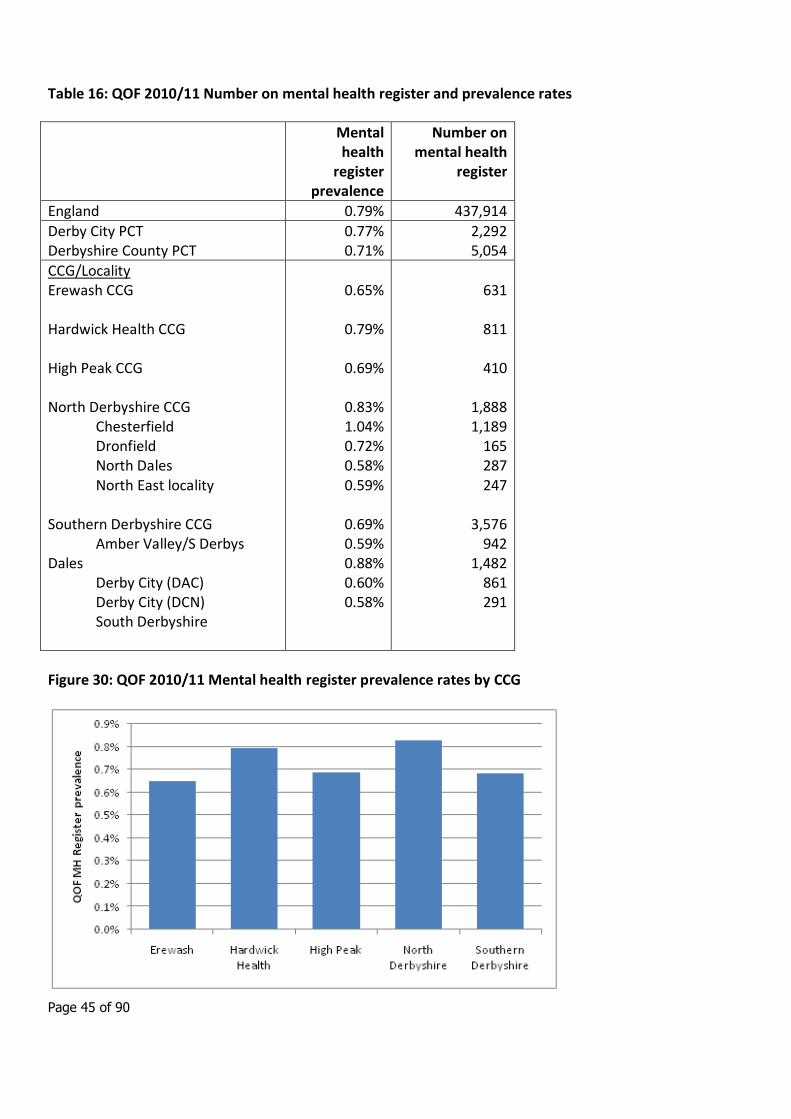
Table 16: QOF 2010/11 Number on mental health register and prevalence rates
Mental health
register prevalence
Number on mental health
register
England 0.79% 437,914
Derby City PCT Derbyshire County PCT
0.77% 0.71%
2,292 5,054
CCG/Locality Erewash CCG Hardwick Health CCG High Peak CCG North Derbyshire CCG Chesterfield Dronfield North Dales North East locality Southern Derbyshire CCG Amber Valley/S Derbys Dales Derby City (DAC) Derby City (DCN) South Derbyshire
0.65%
0.79%
0.69%
0.83% 1.04% 0.72% 0.58% 0.59%
0.69% 0.59% 0.88% 0.60% 0.58%
631
811
410
1,888 1,189
165 287 247
3,576
942 1,482
861 291
Figure 30: QOF 2010/11 Mental health register prevalence rates by CCG
Page 46 of 90
Figure 31: QOF 2010/11 Mental health register prevalence rates - North Derbyshire CCG localities
Figure 32: QOF 2010/11 Mental health register prevalence rates - Southern Derbyshire CCG localities
Page 47 of 90
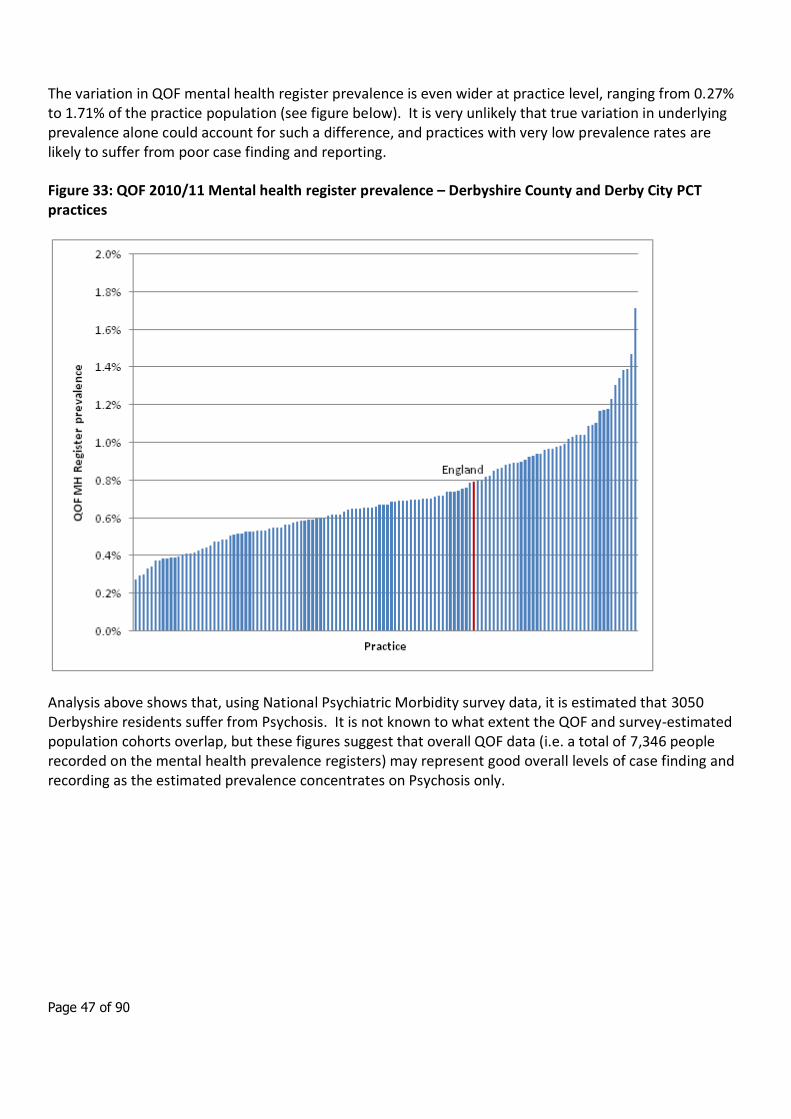
The variation in QOF mental health register prevalence is even wider at practice level, ranging from 0.27% to 1.71% of the practice population (see figure below). It is very unlikely that true variation in underlying prevalence alone could account for such a difference, and practices with very low prevalence rates are likely to suffer from poor case finding and reporting.
Figure 33: QOF 2010/11 Mental health register prevalence – Derbyshire County and Derby City PCT practices
Analysis above shows that, using National Psychiatric Morbidity survey data, it is estimated that 3050 Derbyshire residents suffer from Psychosis. It is not known to what extent the QOF and survey-estimated population cohorts overlap, but these figures suggest that overall QOF data (i.e. a total of 7,346 people recorded on the mental health prevalence registers) may represent good overall levels of case finding and recording as the estimated prevalence concentrates on Psychosis only.
Page 48 of 90
4. Co-morbidity mental and physical health issues
There is a strong association between mental and physical ill health. People with mental disorders and disabilities have a higher risk of poor physical health and premature mortality that the general population.22 23
A meta-analysis of 27 studies showed that the mean standardised mortality ratio for all forms of mental disorder was at least 1.5 and varied with the type and severity of the disorder.24
In relation to common mental health disorders:
Depression increases the risk of mortality by 50%.25
Depression has been associated with a four-fold increase in the risk of heart disease, even when other factors are controlled for.26
Untreated depression and anxiety disorders are associated with increased health care usage – not only ongoing consultations and treatment in relation to the specific mental health condition, but also increased health care usage more generally.27
Co-morbid mental health problems have a significant impact on the costs related to the management of long-term conditions. For example, the total cost to the health service of each person with diabetes and co-morbid depression is 4.5 times greater than the cost for a person with diabetes alone.28
In relation to severe and enduring mental illness:
For individuals with schizophrenia, life-expectancy is on average 10 years shorter that in the general population. They also experience high rates of obesity, diabetes, osteoporosis and cardiovascular conditions.29 30 31 32
22 Phelan, M., Stradins, L. & Morrison, S. (2001) Physical illness of people with severe mental illness can be improved
if primary care and mental health professionals pay attention to it. BMJ, 322, 443–444. 23
Cormac I. Physical health in mental health. Occasional Paper 67. Royal College of Psychiatrists, 2009. 24
Harris, E. C. & Barraclough, B. (1998) Excess mortality of mental disorder. British Journal of Psychiatry, 173, 11–53. 25
Mykletun A, Bjerkeset O, Overland S et al (2009) Levels of anxiety and depression as predictors of mortality: the HUNT study. British Journal of Psychiatry, 195, 118-125. 26
Osborn D, Levy G, Nazareth I (2007). „Relative risk of cardiovascular and cancer mortality in people with severe mental illness from the United Kingdom‟s General Practice Research Database‟. Archives of General Psychiatry, vol 64, pp 242–9. 27
Layard R et al (2007) Cost benefit analysis of psychological therapy. Centre for Economic Performance. CEP Discussion paper No 829, October 2007. 28 Egede LE, Zheng D, Simpson K (2002). „Comorbid depression is associated with increased health care use and expenditures in individuals with diabetes‟. Diabetes Care, vol 25, no 3, pp 464–70. 29 Leucht, S., Burkard, T., Henderson, J., et al (2007) Physical illness and schizophrenia: a review of the literature. Acta Psychiatria Scandinavica, 116, 317–333 30 Robson, D. & Gray, R. (2007) Serious mental illness and physical health problems: a discussion paper. International Journal of Nursing Studies, 44, 457–466 31 Mitchell, A. J. & Malone, D. (2006) Physical health and schizophrenia. Current Opinion in Psychiatry, 19, 432–437 32 Saha, S., Chant, D. & McGrath, J. (2007) A systematic review of mortality in schizophrenia. Archives of General Psychiatry, 64, 1123–1131
Page 49 of 90
In schizophrenia, standardised mortality ratios are increased 3–4 times compared with controls, with deaths mainly due to respiratory, circulatory, endocrine and digestive disorders.33 34 35
The risk of developing metabolic syndrome for those with schizophrenia is 2–4 times greater than for the general population.36 37
The risk of sudden death in schizophrenia increases incrementally with each additional psychotropic medication taken by a patient.38
UK National Survey of Adult Psychiatric Morbidity, 2000
In addition to the above evidence from the published literature, the UK National Survey of Adult Psychiatric Morbidity carried out in 2000 included detailed analysis of mental and physical health co-morbidity.39
Neurotic disorders
The 2000 National Survey report examined the characteristics of respondents with and without neurotic disorders. The disorders considered were based on ICD-10 categories of diagnosis and relate to symptoms experienced by respondents in the week before interview. They consist of depressive episodes and disorders (mild, moderate and severe), phobias, panic disorders, generalised anxiety disorder, mixed anxiety and depressive disorder and obsessive compulsive disorder. People could have more than one disorder, and hence many appear in more than one category.
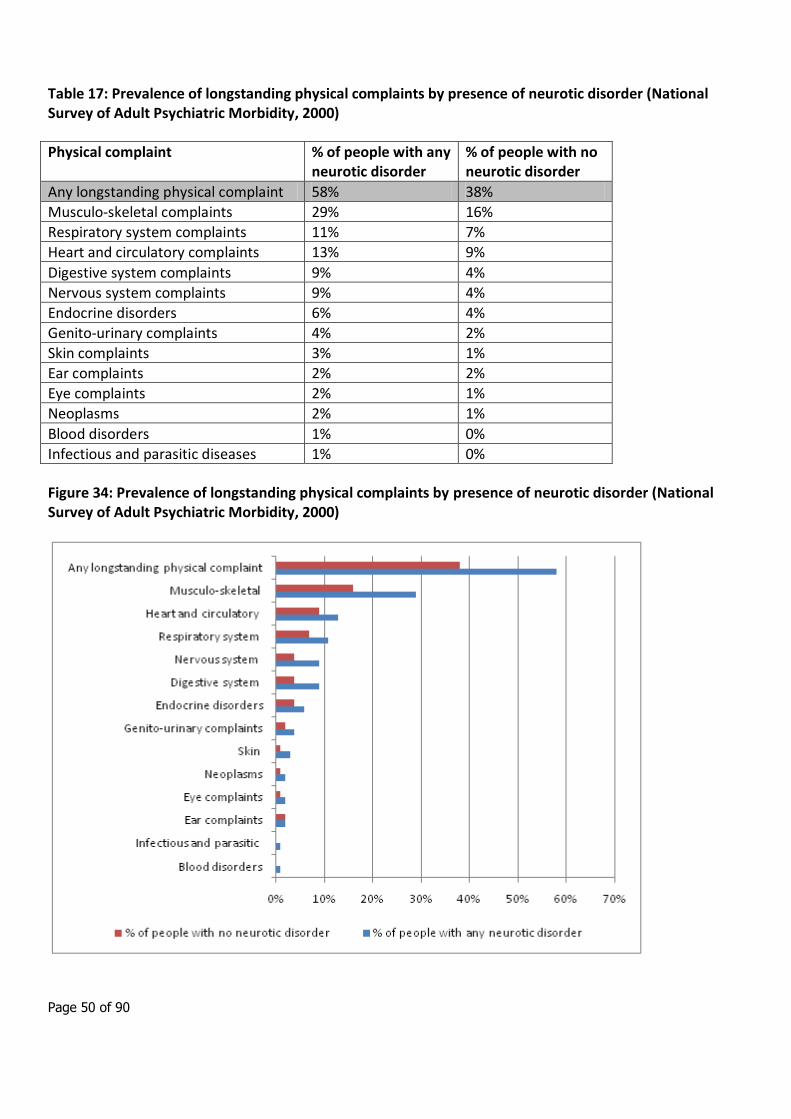
Overall, 42% of adults reported a physical complaint. Having a neurotic disorder substantially increased the likelihood of reporting one or more physical complaints. Fifty eight per cent of adults with a neurotic disorder reported a physical complaint, compared with 38% of adults with no neurotic disorder.
The prevalence of musculo-skeletal complaints was almost twice as high among those with a neurotic disorder than among those with no disorder, 29% compared with 16%. Also, having a neurotic disorder more than doubled the likelihood of reporting complaints of the digestive system and of the nervous system (both 9% compared with 4%), of the genito-urinary system (4% compared with 2%) and skin complaints (3% compared with 1%).
33 Brown, S., Barraclough, B. & Inskip, H. (2000) Causes of the excess mortality of schizophrenia. British Journal of
Psychiatry, 177, 212–217 34
Osby, U., Correla, N., Brandt, L., et al (2000) Mortality and causes of death in Stockholm county, Sweden. Schizophrenia Research, 45, 21–28. 35
Enger, C., Weatherby, L., Reynolds, R. F., et al (2004) Serious cardiovascular events and mortality among patients with schizophrenia. Journal of Nervous and Mental Disease, 192, 19–27. 36
Saari, K. M., Lindeman, S. M., Viilo, K. M., et al (2005) A 4-fold risk of metabolic syndrome in patients with schizophrenia. The Northern Finland 1966 Birth Cohort Study. Journal of Clinical Psychiatry, 66, 559–563. 37
Thakore, J. H. (2005) Metabolic syndrome and schizophrenia. British Journal of Psychiatry, 186, 455–456. 38
Joukamaa M., Heliövaara M., Knekt P., et al (2006) Schizophrenia, neuroleptic medication and mortality. British Journal of Psychiatry, 188, 122–127. 39
Singleton, N., Bumpstead, R., O'Brien, M., et al (2001) Psychiatric morbidity among adults living in private households, 2000. London: The Stationery Office.
Page 50 of 90
Table 17: Prevalence of longstanding physical complaints by presence of neurotic disorder (National Survey of Adult Psychiatric Morbidity, 2000)
Physical complaint % of people with any neurotic disorder
% of people with no neurotic disorder
Any longstanding physical complaint 58% 38%
Musculo-skeletal complaints 29% 16%
Respiratory system complaints 11% 7%
Heart and circulatory complaints 13% 9%
Digestive system complaints 9% 4%
Nervous system complaints 9% 4%
Endocrine disorders 6% 4%
Genito-urinary complaints 4% 2%
Skin complaints 3% 1%
Ear complaints 2% 2%
Eye complaints 2% 1%
Neoplasms 2% 1%
Blood disorders 1% 0%
Infectious and parasitic diseases 1% 0%
Figure 34: Prevalence of longstanding physical complaints by presence of neurotic disorder (National Survey of Adult Psychiatric Morbidity, 2000)
Page 51 of 90
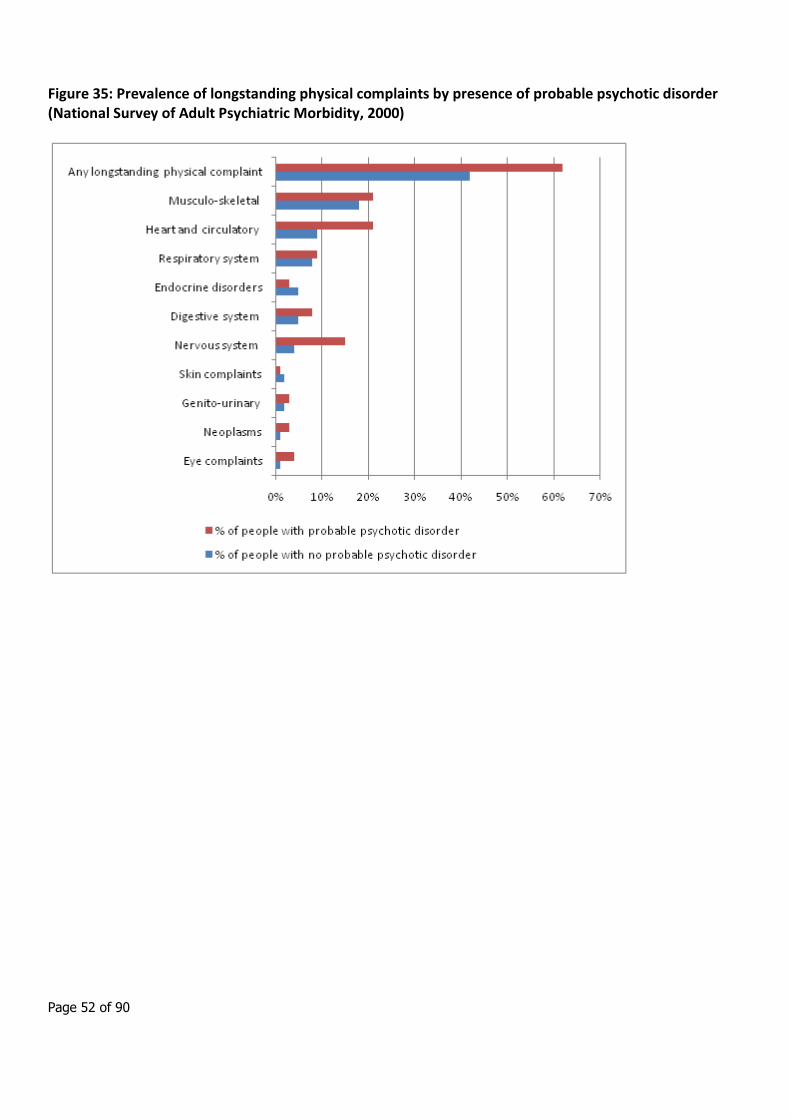
Psychotic disorders
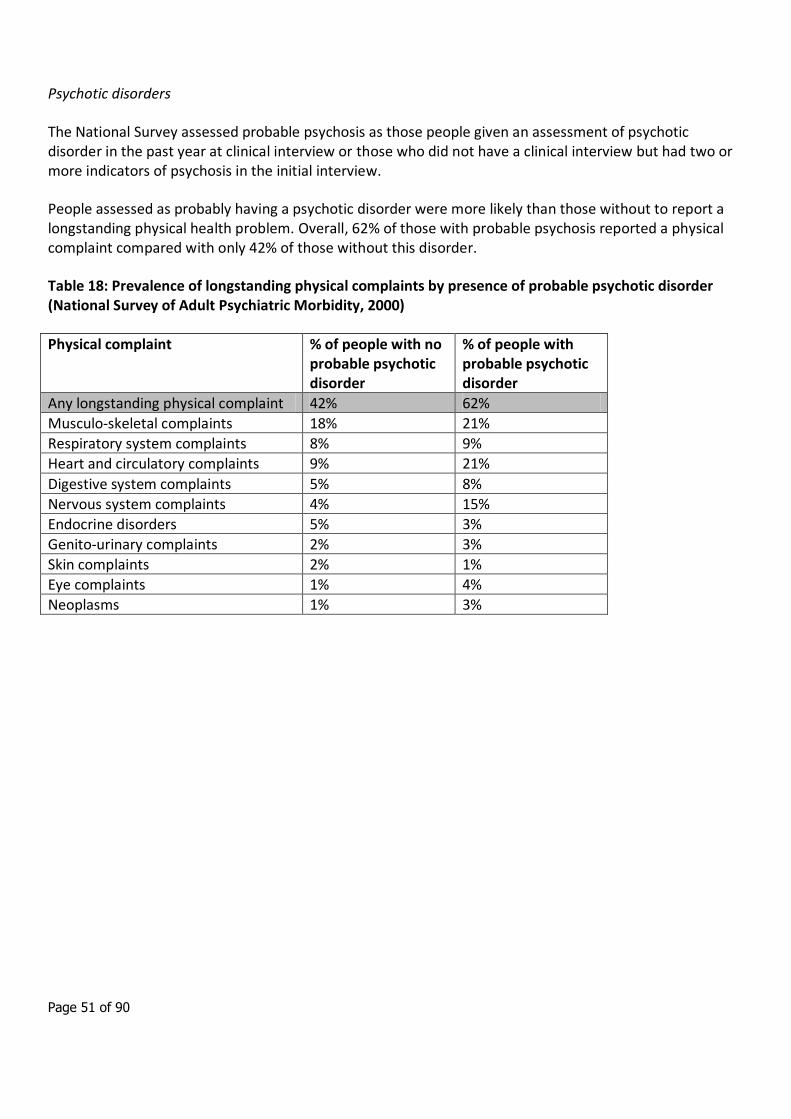
The National Survey assessed probable psychosis as those people given an assessment of psychotic disorder in the past year at clinical interview or those who did not have a clinical interview but had two or more indicators of psychosis in the initial interview.
People assessed as probably having a psychotic disorder were more likely than those without to report a longstanding physical health problem. Overall, 62% of those with probable psychosis reported a physical complaint compared with only 42% of those without this disorder.
Table 18: Prevalence of longstanding physical complaints by presence of probable psychotic disorder (National Survey of Adult Psychiatric Morbidity, 2000)
Physical complaint % of people with no probable psychotic disorder
% of people with probable psychotic disorder
Any longstanding physical complaint 42% 62%
Musculo-skeletal complaints 18% 21%
Respiratory system complaints 8% 9%
Heart and circulatory complaints 9% 21%
Digestive system complaints 5% 8%
Nervous system complaints 4% 15%
Endocrine disorders 5% 3%
Genito-urinary complaints 2% 3%
Skin complaints 2% 1%
Eye complaints 1% 4%
Neoplasms 1% 3%
Page 52 of 90
Figure 35: Prevalence of longstanding physical complaints by presence of probable psychotic disorder (National Survey of Adult Psychiatric Morbidity, 2000)
Page 53 of 90
5. Avoidable harm
5.1 Introduction
The term self-harm covers a wide range of behaviours, including habitual self cutting and poisoning. Self-harm involves differing degrees of risk to life and suicidal intent, and is often considered to be a coping mechanism for the management of distress.
Self-harm is of particular interest because of it’s power in predicting who is most likely to go on to commit suicide. 40 Self harm is also associated with high levels of distress, both for the people engaging in it and for those around them.
Despite its importance, relatively little is known about the occurrence and management of self-harm nationally. Epidemiological studies have mainly been confined to observations from single localities or restricted to hospital admissions. However, as only a small proportion of people who self-harm are ever admitted to hospital,41 studies based on admitted patients alone will give a distorted picture of the epidemiology and management of this problem. By it’s very nature, self harm is a secretive behaviour and so collection of population prevalence data is difficult and is likely to under estimate the scale of the problem.
This paper includes information on self harm from three different sources:
Population prevalence (from National Psychiatric Surveys)
A&E attendances
Hospital admissions
A section is also included on the Use of Section 136 of the Mental Health Act 1983 (removal of person suffering from mental disorder to a place of safety).
Information on suicide mortality has been provided separately.
40 Owens D, Horrocks J, House A. Fatal and non-fatal repetition of self-harm. Systematic review. Br J Psychiatry 2002; 181: 193–199.
41 Kapur N, House A, Creed F, Feldman E, Friedman T, Guthrie E. Management of deliberate self poisoning in adults
in four teaching hospitals: descriptive study. Br Med J 1998; 316: 831–832.
Page 54 of 90
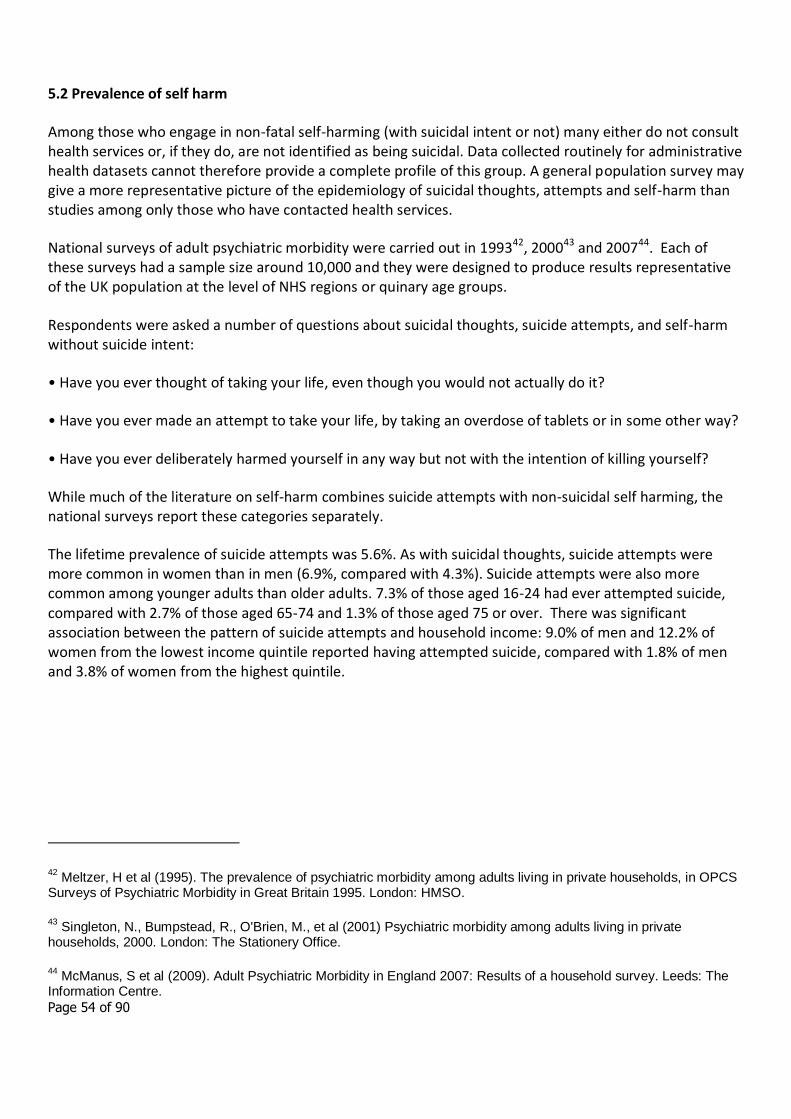
5.2 Prevalence of self harm
Among those who engage in non-fatal self-harming (with suicidal intent or not) many either do not consult health services or, if they do, are not identified as being suicidal. Data collected routinely for administrative health datasets cannot therefore provide a complete profile of this group. A general population survey may give a more representative picture of the epidemiology of suicidal thoughts, attempts and self-harm than studies among only those who have contacted health services.
National surveys of adult psychiatric morbidity were carried out in 199342, 200043 and 200744. Each of these surveys had a sample size around 10,000 and they were designed to produce results representative of the UK population at the level of NHS regions or quinary age groups.
Respondents were asked a number of questions about suicidal thoughts, suicide attempts, and self-harm without suicide intent:
• Have you ever thought of taking your life, even though you would not actually do it?
• Have you ever made an attempt to take your life, by taking an overdose of tablets or in some other way?
• Have you ever deliberately harmed yourself in any way but not with the intention of killing yourself?
While much of the literature on self-harm combines suicide attempts with non-suicidal self harming, the national surveys report these categories separately.
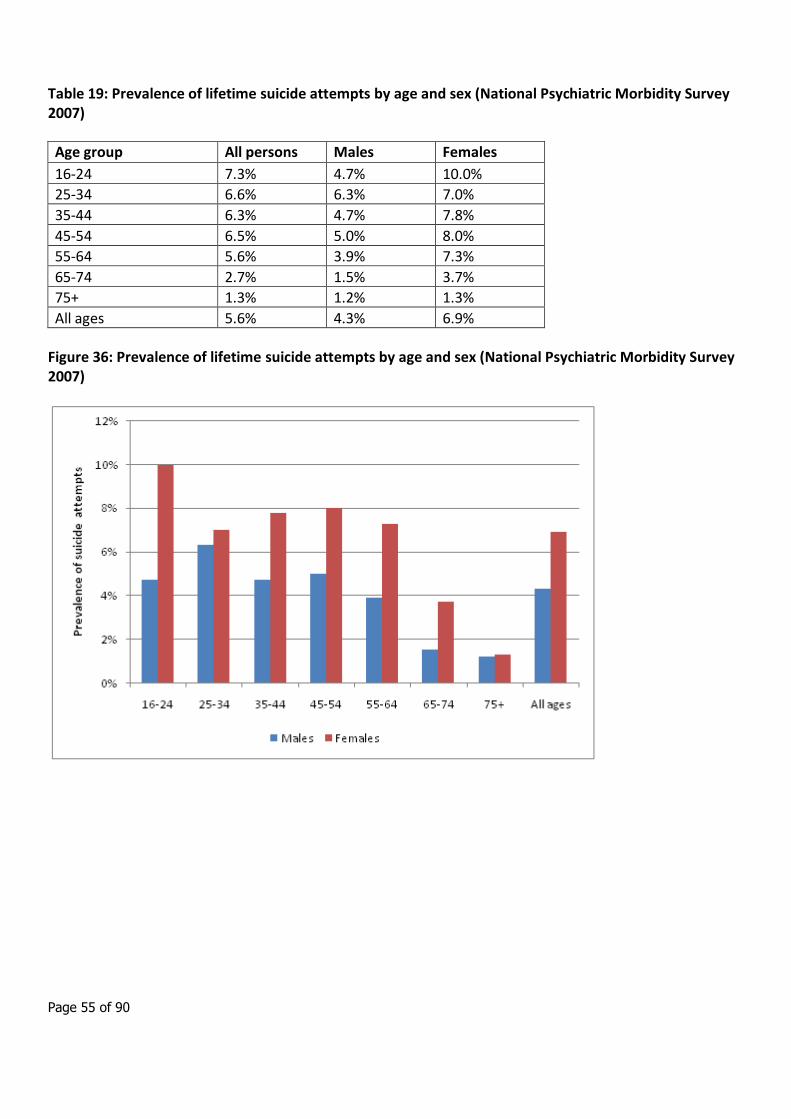
The lifetime prevalence of suicide attempts was 5.6%. As with suicidal thoughts, suicide attempts were more common in women than in men (6.9%, compared with 4.3%). Suicide attempts were also more common among younger adults than older adults. 7.3% of those aged 16-24 had ever attempted suicide, compared with 2.7% of those aged 65-74 and 1.3% of those aged 75 or over. There was significant association between the pattern of suicide attempts and household income: 9.0% of men and 12.2% of women from the lowest income quintile reported having attempted suicide, compared with 1.8% of men and 3.8% of women from the highest quintile.
42 Meltzer, H et al (1995). The prevalence of psychiatric morbidity among adults living in private households, in OPCS
Surveys of Psychiatric Morbidity in Great Britain 1995. London: HMSO.
43 Singleton, N., Bumpstead, R., O'Brien, M., et al (2001) Psychiatric morbidity among adults living in private
households, 2000. London: The Stationery Office.
44 McManus, S et al (2009). Adult Psychiatric Morbidity in England 2007: Results of a household survey. Leeds: The
Information Centre.
Page 55 of 90
Table 19: Prevalence of lifetime suicide attempts by age and sex (National Psychiatric Morbidity Survey 2007)
Age group All persons Males Females
16-24 7.3% 4.7% 10.0%
25-34 6.6% 6.3% 7.0%
35-44 6.3% 4.7% 7.8%
45-54 6.5% 5.0% 8.0%
55-64 5.6% 3.9% 7.3%
65-74 2.7% 1.5% 3.7%
75+ 1.3% 1.2% 1.3%
All ages 5.6% 4.3% 6.9%
Figure 36: Prevalence of lifetime suicide attempts by age and sex (National Psychiatric Morbidity Survey 2007)
Page 56 of 90
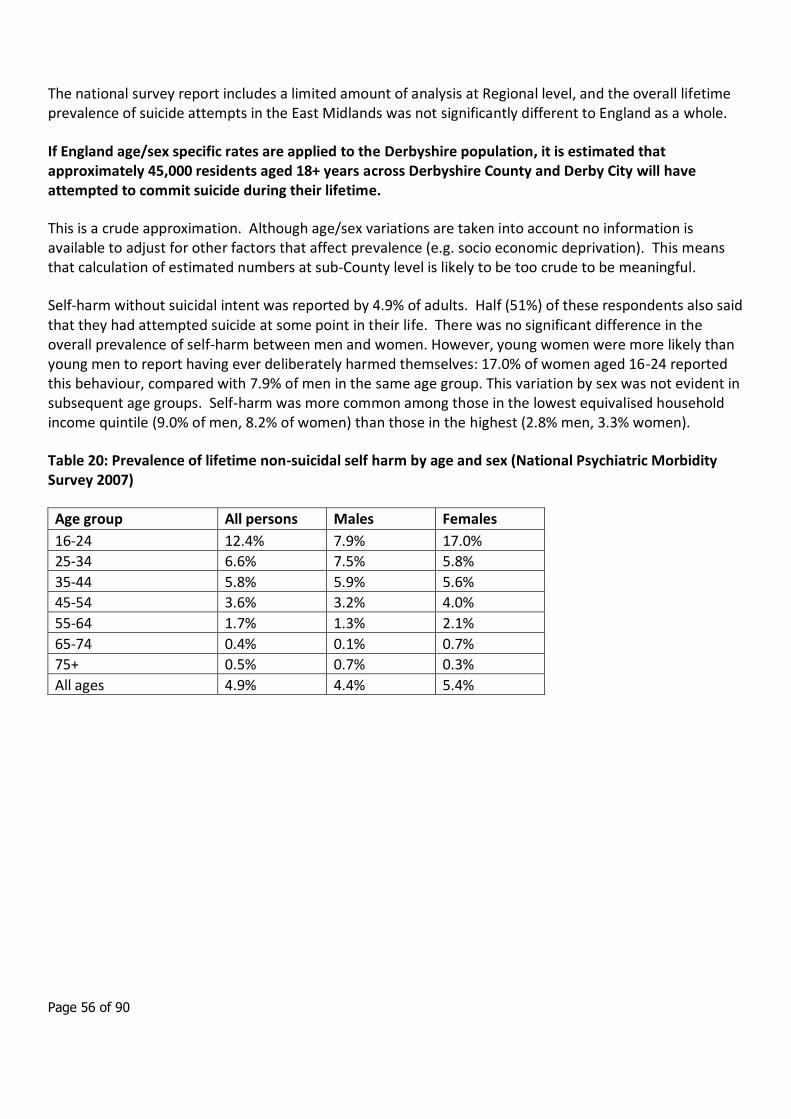
The national survey report includes a limited amount of analysis at Regional level, and the overall lifetime prevalence of suicide attempts in the East Midlands was not significantly different to England as a whole.
If England age/sex specific rates are applied to the Derbyshire population, it is estimated that approximately 45,000 residents aged 18+ years across Derbyshire County and Derby City will have attempted to commit suicide during their lifetime.
This is a crude approximation. Although age/sex variations are taken into account no information is available to adjust for other factors that affect prevalence (e.g. socio economic deprivation). This means that calculation of estimated numbers at sub-County level is likely to be too crude to be meaningful.
Self-harm without suicidal intent was reported by 4.9% of adults. Half (51%) of these respondents also said that they had attempted suicide at some point in their life. There was no significant difference in the overall prevalence of self-harm between men and women. However, young women were more likely than young men to report having ever deliberately harmed themselves: 17.0% of women aged 16-24 reported this behaviour, compared with 7.9% of men in the same age group. This variation by sex was not evident in subsequent age groups. Self-harm was more common among those in the lowest equivalised household income quintile (9.0% of men, 8.2% of women) than those in the highest (2.8% men, 3.3% women).
Table 20: Prevalence of lifetime non-suicidal self harm by age and sex (National Psychiatric Morbidity Survey 2007)
Age group All persons Males Females
16-24 12.4% 7.9% 17.0%
25-34 6.6% 7.5% 5.8%
35-44 5.8% 5.9% 5.6%
45-54 3.6% 3.2% 4.0%
55-64 1.7% 1.3% 2.1%
65-74 0.4% 0.1% 0.7%
75+ 0.5% 0.7% 0.3%
All ages 4.9% 4.4% 5.4%
Page 57 of 90
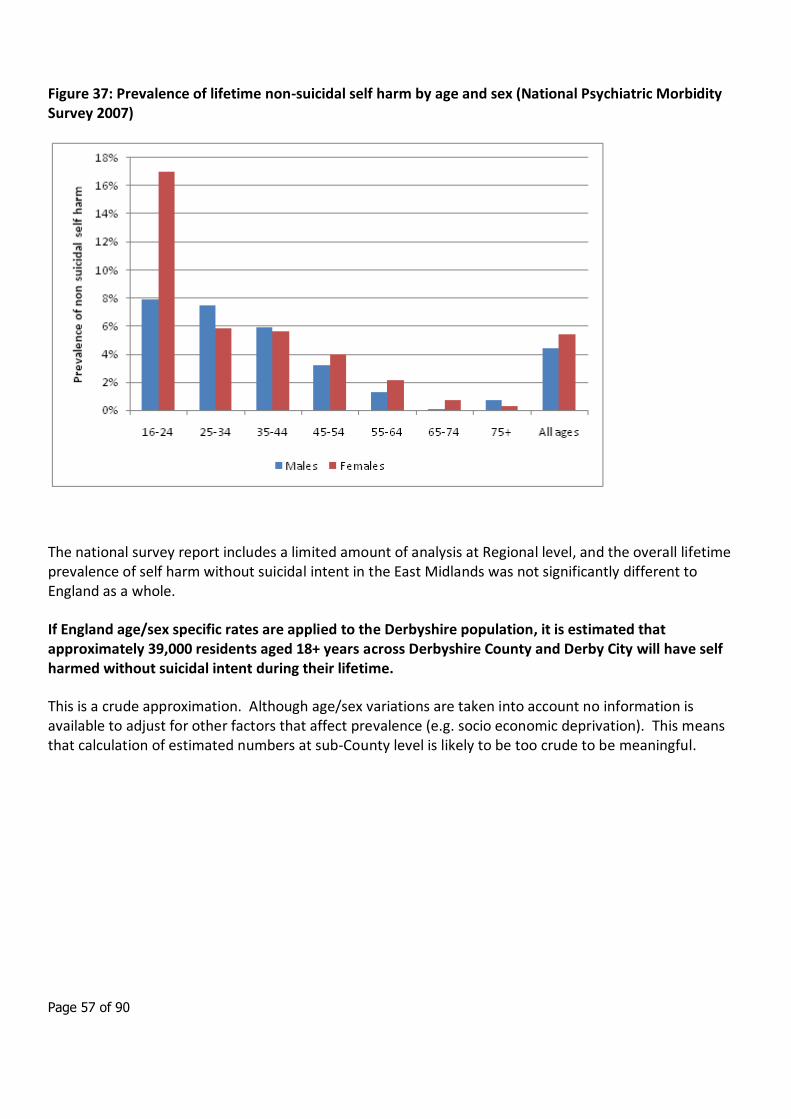
Figure 37: Prevalence of lifetime non-suicidal self harm by age and sex (National Psychiatric Morbidity Survey 2007)
The national survey report includes a limited amount of analysis at Regional level, and the overall lifetime prevalence of self harm without suicidal intent in the East Midlands was not significantly different to England as a whole.
If England age/sex specific rates are applied to the Derbyshire population, it is estimated that approximately 39,000 residents aged 18+ years across Derbyshire County and Derby City will have self harmed without suicidal intent during their lifetime.
This is a crude approximation. Although age/sex variations are taken into account no information is available to adjust for other factors that affect prevalence (e.g. socio economic deprivation). This means that calculation of estimated numbers at sub-County level is likely to be too crude to be meaningful.
Page 58 of 90
5.3 A&E attendances for self harm
Self-harm is one of the commonest reasons for A&E attendance in England, but detailed information on the number and pattern of such attendances is very sparse. HES A&E data (NHS Information Centre) record approximately 100,000 attendances with self-harm annually. However it has been estimated that the actual number could be almost double this with the shortfall being due to case recognition and data completeness and recording.45
A recent report scoping the usability of A&E attendance data in the East Midlands46 concluded that A&E data are potentially a rich source of information but data quality must improve before robust analyses can be undertaken to inform local work. Overall in the East Midlands in 2009/10 over half of A&E HES attendances did not include a diagnosis code.
The most complete data on A&E attendances tend to be those available as the result of specific audits carried out within specific trusts.
The only national data describes an audit carried out in 2001/2 and so is almost 10 years old. The audit described the characteristics and management of a nationally representative sample of self-harm episodes presenting to 31 hospitals in England.47
Over the 8-week audit 4,033 self-harm episodes occurred across the 31 trusts included in this analysis – an average of 2.3 episodes per trust per day. This equates to an average of approximately 840 A&E presentations per Trust per year. This is based on average figures and insufficient information is available to extrapolate this finding specifically to the Derbyshire population.
45 Hawton K, Fagg J, Simkin S, Bale E, Bond A. Trends in deliberate self-harm in Oxford, 1985–1995. Implications for clinical services and the prevention of suicide. Br J Psychiatry 1997; 171: 556–560. 46
Alcohol related A&E attendances: A scoping study. EMPHO, 2010. Available at http://www.empho.org.uk/viewResource.aspx?id=11910 47
Gunnell D, Bennewith O, Peters TJ, House A, Hawton K. The epidemiology and management of self harm amongst adults in England. J Public Health (Oxf). 2005 Mar;27(1):67-73
Page 59 of 90
5.4 Hospital admissions for self harm
This analysis covers only those patients whose self harm was sufficiently serious as to require admission as a hospital inpatient.
Data on hospital admissions have been obtained from the Hospital Episode Statistics (HES) database. The analysis includes only those who intend self harm (ICD-10 codes X60-X84) and excludes those in whom it is not clear whether the harm was accidental or intentional (Y codes). (In actual fact 97% of self harm codes indicate intentional self harm so the effect of excluding Y codes is very small).
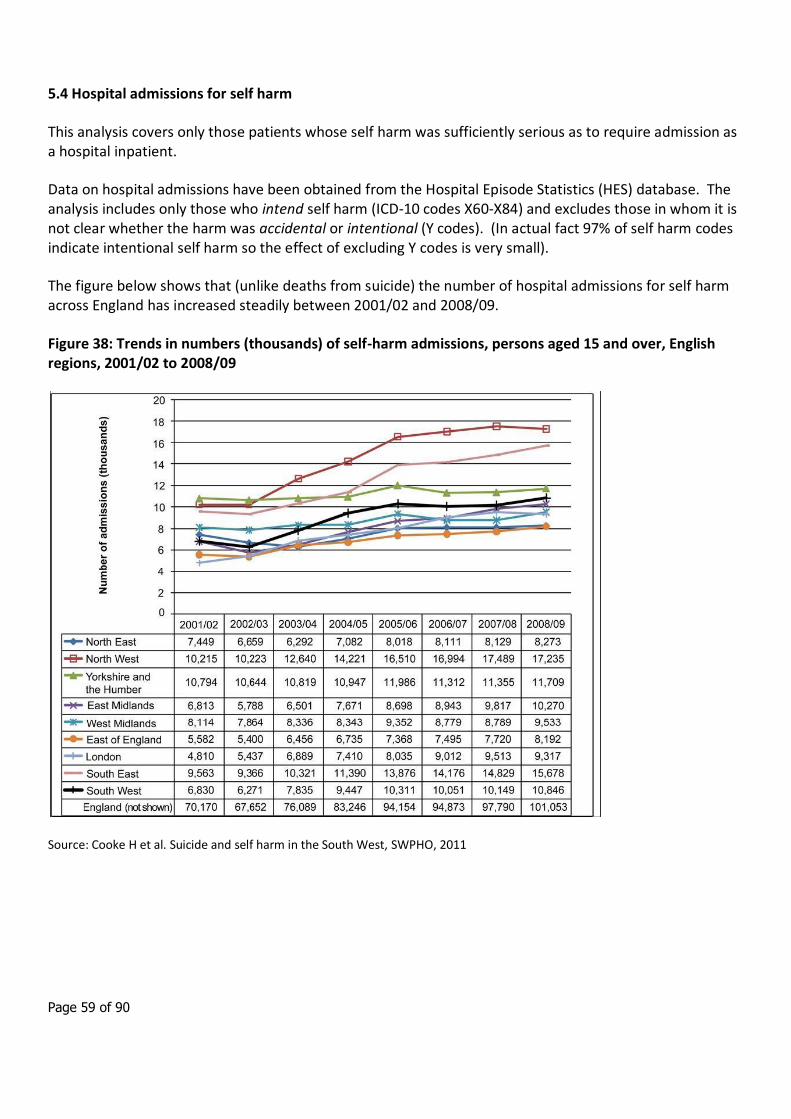
The figure below shows that (unlike deaths from suicide) the number of hospital admissions for self harm across England has increased steadily between 2001/02 and 2008/09.
Figure 38: Trends in numbers (thousands) of self-harm admissions, persons aged 15 and over, English regions, 2001/02 to 2008/09
Source: Cooke H et al. Suicide and self harm in the South West, SWPHO, 2011
Page 60 of 90
The Table and Figure below show the trend in the number of self-harm admissions (ICD codes X60-84) for Derbyshire (including County and Derby City) residents aged 18 years and over between 2004/05 and 2009/10. The trend is similar to that seen nationally, with a gradual increase in numbers of admissions between 2004/05 and 2008/09 (although with a slight reduction between 2008/09 and 2009/10).
Table 21: Numbers of self-harm hospital admissions, persons aged 18 and over, Derbyshire County and Derby CIty, 2004/05 to 2009/10
Year Number of admissions
2009/10 2,053
2008/09 2,238
2007/08 1,917
2006/07 1,716
2005/06 1,718
2004/05 1,626
Figure 39: Numbers of self-harm hospital admissions, persons aged 18 and over, Derbyshire County and Derby City, 2004/05 to 2009/10
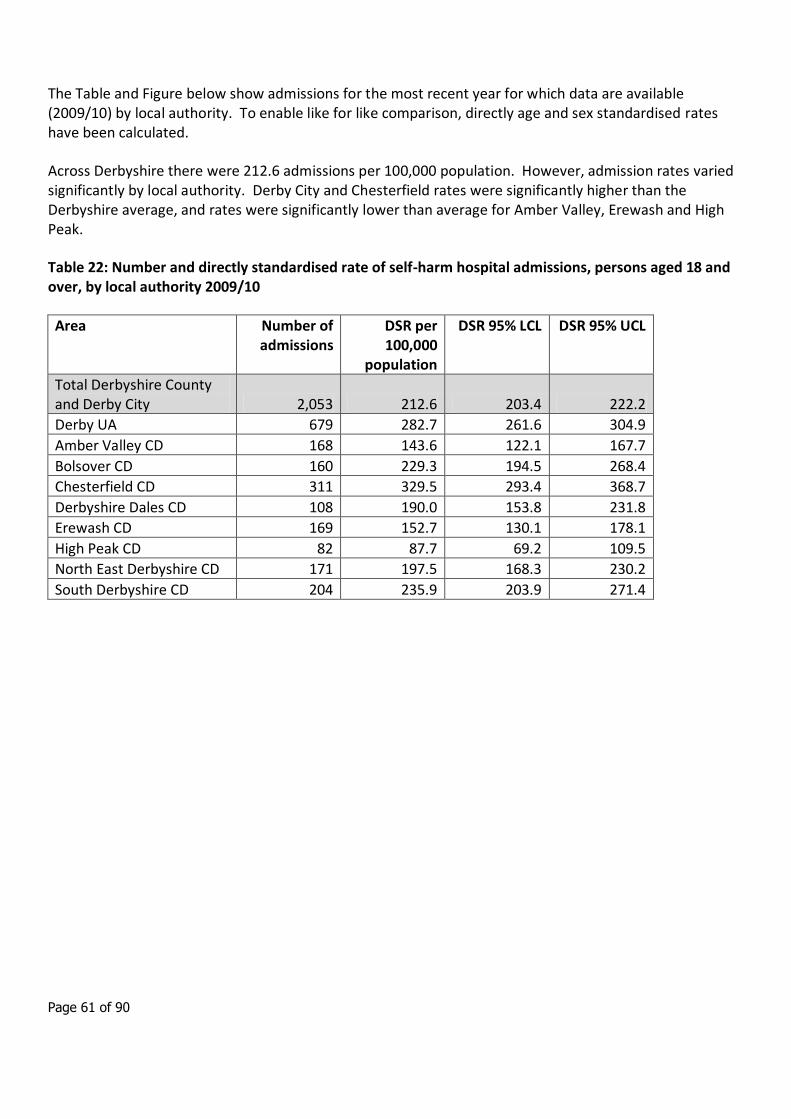
Page 61 of 90
The Table and Figure below show admissions for the most recent year for which data are available (2009/10) by local authority. To enable like for like comparison, directly age and sex standardised rates have been calculated.
Across Derbyshire there were 212.6 admissions per 100,000 population. However, admission rates varied significantly by local authority. Derby City and Chesterfield rates were significantly higher than the Derbyshire average, and rates were significantly lower than average for Amber Valley, Erewash and High Peak.
Table 22: Number and directly standardised rate of self-harm hospital admissions, persons aged 18 and over, by local authority 2009/10
Area Number of admissions
DSR per 100,000
population
DSR 95% LCL DSR 95% UCL
Total Derbyshire County and Derby City 2,053 212.6 203.4 222.2
Derby UA 679 282.7 261.6 304.9
Amber Valley CD 168 143.6 122.1 167.7
Bolsover CD 160 229.3 194.5 268.4
Chesterfield CD 311 329.5 293.4 368.7
Derbyshire Dales CD 108 190.0 153.8 231.8
Erewash CD 169 152.7 130.1 178.1
High Peak CD 82 87.7 69.2 109.5
North East Derbyshire CD 171 197.5 168.3 230.2
South Derbyshire CD 204 235.9 203.9 271.4
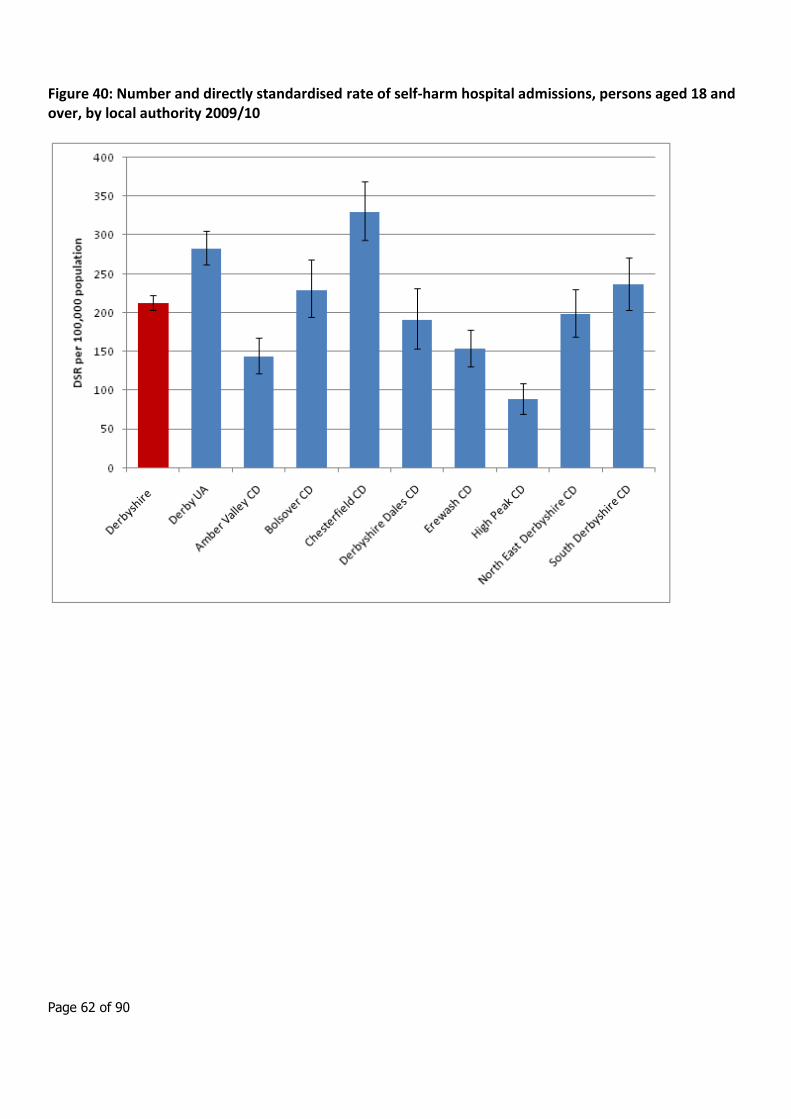
Page 62 of 90
Figure 40: Number and directly standardised rate of self-harm hospital admissions, persons aged 18 and over, by local authority 2009/10
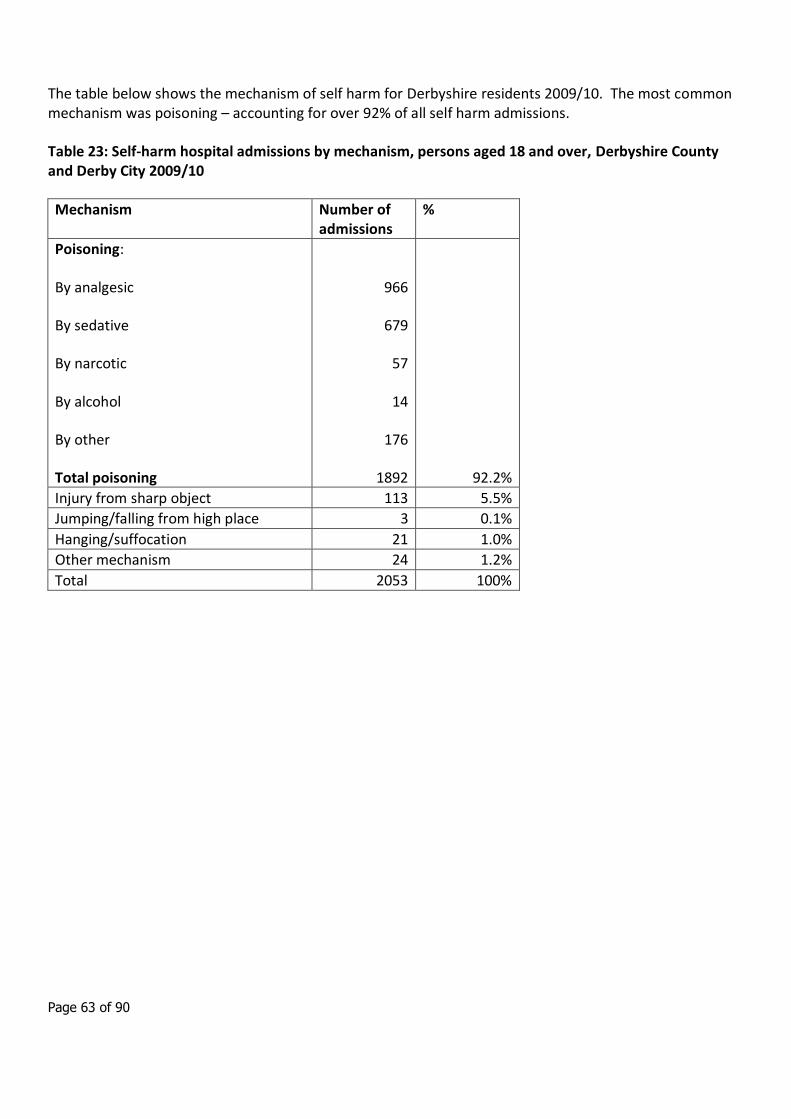
Page 63 of 90
The table below shows the mechanism of self harm for Derbyshire residents 2009/10. The most common mechanism was poisoning – accounting for over 92% of all self harm admissions.
Table 23: Self-harm hospital admissions by mechanism, persons aged 18 and over, Derbyshire County and Derby City 2009/10
Mechanism Number of admissions
%
Poisoning:
By analgesic
By sedative
By narcotic
By alcohol
By other
Total poisoning
966
679
57
14
176
1892
92.2%
Injury from sharp object 113 5.5%
Jumping/falling from high place 3 0.1%
Hanging/suffocation 21 1.0%
Other mechanism 24 1.2%
Total 2053 100%
Page 64 of 90
5.5 Other information: use of Section 136 of the Mental Health Act 1983
A significant number of people with mental health problems come into contact with the police each year. One way in which such people have contact with the police is when they are in a public place and are in need of “immediate care or control”. In such circumstances a person can be taken into police custody under section 136 of the Mental Health Act 1983. Under this power police custody is viewed as a ‘place of safety’, where a person can be held without harm until they are assessed by an approved doctor and an approved social worker (ASW).
Anecdotal evidence suggests that the number of people held under section 136 varies enormously depending on the resources of the local primary care trust/NHS commissioner, but no evidence exists to establish whether this is the case. The Mental Health Act Commission (2006) in its biennial report states that “there are no reliable statistics on the use of section 136. The limited statistical data that is available is of questionable value because of its incompleteness, and because of marked regional variations in practice which make generalisation difficult”. This is mainly due to section 136 being the only form of civil detention under the Mental Health Act 1983 for which no statutory form is required (The Royal College of Psychiatrists, 2008).
In 2007 a study was carried out to address this information gap.48 It presented figures on the use of police cells as a place of safety across England and Wales and sought to explain the reasons for variations across police forces.
Data were collected data from all 43 Home Office police forces in England and Wales. The results are shown in the table below. Overall a total of 11,517 people were detained under section 136 across the 43 police forces during 2005/06. In Derbyshire there were 184 such detentions. In order to compare like with like, the section 136 detention rate per 10,000 people in custody was calculated. The Derbyshire rate of 67 detentions per 10,000 people in custody is slightly above the England average, and is slightly above the median.
The table shows large differences in the number of detentions between forces that might be expected to have similar figures. Factors thought to explain variation in rates included:
Availability of alternative places of safety
Demographic and geographical features
Preventative work
Usage of different powers
Inconsistent and incomplete recording
48 Docking M, Grace K and Bucke T. Police Custody as a “Place of Safety”: Examining the Use of Section 136 of the Mental Health Act 1983. IPCC Research and Statistics Series: Paper 11
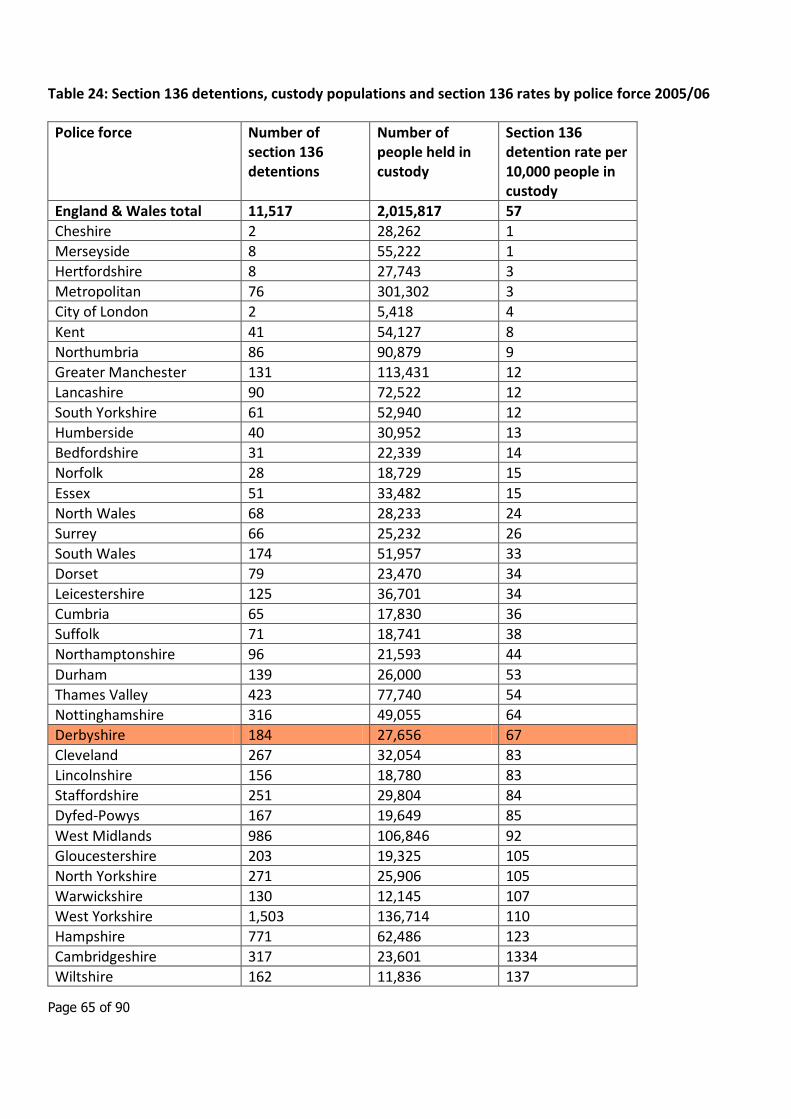
Page 65 of 90
Table 24: Section 136 detentions, custody populations and section 136 rates by police force 2005/06
Police force Number of section 136 detentions
Number of people held in custody
Section 136 detention rate per 10,000 people in custody
England & Wales total 11,517 2,015,817 57
Cheshire 2 28,262 1
Merseyside 8 55,222 1
Hertfordshire 8 27,743 3
Metropolitan 76 301,302 3
City of London 2 5,418 4
Kent 41 54,127 8
Northumbria 86 90,879 9
Greater Manchester 131 113,431 12
Lancashire 90 72,522 12
South Yorkshire 61 52,940 12
Humberside 40 30,952 13
Bedfordshire 31 22,339 14
Norfolk 28 18,729 15
Essex 51 33,482 15
North Wales 68 28,233 24
Surrey 66 25,232 26
South Wales 174 51,957 33
Dorset 79 23,470 34
Leicestershire 125 36,701 34
Cumbria 65 17,830 36
Suffolk 71 18,741 38
Northamptonshire 96 21,593 44
Durham 139 26,000 53
Thames Valley 423 77,740 54
Nottinghamshire 316 49,055 64
Derbyshire 184 27,656 67
Cleveland 267 32,054 83
Lincolnshire 156 18,780 83
Staffordshire 251 29,804 84
Dyfed-Powys 167 19,649 85
West Midlands 986 106,846 92
Gloucestershire 203 19,325 105
North Yorkshire 271 25,906 105
Warwickshire 130 12,145 107
West Yorkshire 1,503 136,714 110
Hampshire 771 62,486 123
Cambridgeshire 317 23,601 1334
Wiltshire 162 11,836 137

Page 66 of 90
West Mercia 477 33,684 142
Avon and Somerset 732 50,827 144
Devon & Cornwall 891 51,194 174
Gwent 380 19,490 195
Sussex 1,384 49,920 277
Page 67 of 90
6. Suicide
6.1 Introduction Suicide is a major public health issue; between 4,000 and 5,000 people take their own lives in England every year, there were 333 adult deaths from suicide and injury undetermined in the East Midlands in 2008. Suicide accounts for almost 1% of the total deaths in England and for men under the age of 35 suicide is the most common cause of death.
The first National Suicide Prevention Strategy for England49 was published by the Department of Health in 2002, The Strategy aimed to support the achievement of the target set in the 1999 White Paper Saving Lives: Our Healthier Nation50, and reinforced within the National Service Framework for Mental Health51 of the same year, to reduce the death rate from suicide and undetermined injury by at least 20% by the year 2010. The Strategy acknowledges that there is no single approach to reducing suicides and that a broad strategic inter-agency approach is required. The National Suicide Prevention Strategy for England sets out a programme of activity to reduce suicide based on six goals:
• To reduce risk in key high risk groups
• To promote mental well-being in the wider population
• To reduce the availability and lethality of suicide methods
• To improve reporting of suicidal behaviour in the media
• To promote research on suicide and suicide prevention
• To improve monitoring of progress towards targets for reducing suicide
This national target has been retained in the National Standards, Local Action: health and social care standards and planning framework for 2005/06 – 2007/0852. All PCTs are currently required to show trends in suicide rate trajectories, to provide action plans for delivery of interventions towards achieving the national target to reduce suicide rates by 20% by 2010 and to undertake suicide audit. The National Mental Health Development Unit, part of the Development Agency, is responsible for the implementation of the National Suicide Prevention Strategy for England in partnership with health and social care agencies,
49 Department of Health (2002) National Suicide Prevention Strategy for England. London, HMSO.
50 Department of Health (1999) Saving Lives: Our Healthier Nation. London, Department of Health.
51 Department of Health (1999) National Service Framework for Mental Health. London, Department of Health.
52
Department of Health (2002) National Standards, Local Action: Health and Social Care Standards and Planning Framework 2005/06- 2007/08 London,
Department of Health
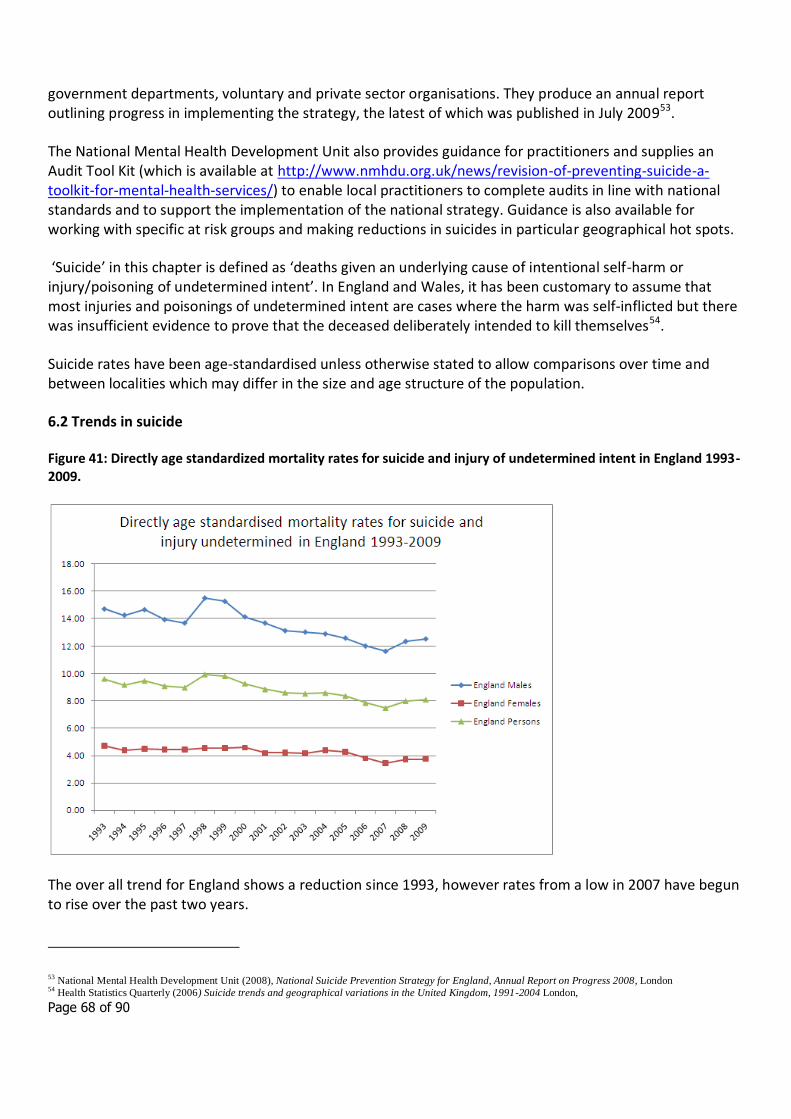
Page 68 of 90
government departments, voluntary and private sector organisations. They produce an annual report outlining progress in implementing the strategy, the latest of which was published in July 200953.
The National Mental Health Development Unit also provides guidance for practitioners and supplies an Audit Tool Kit (which is available at http://www.nmhdu.org.uk/news/revision-of-preventing-suicide-a-toolkit-for-mental-health-services/) to enable local practitioners to complete audits in line with national standards and to support the implementation of the national strategy. Guidance is also available for working with specific at risk groups and making reductions in suicides in particular geographical hot spots.
‘Suicide’ in this chapter is defined as ‘deaths given an underlying cause of intentional self-harm or injury/poisoning of undetermined intent’. In England and Wales, it has been customary to assume that most injuries and poisonings of undetermined intent are cases where the harm was self-inflicted but there was insufficient evidence to prove that the deceased deliberately intended to kill themselves54.
Suicide rates have been age-standardised unless otherwise stated to allow comparisons over time and between localities which may differ in the size and age structure of the population.
6.2 Trends in suicide
Figure 41: Directly age standardized mortality rates for suicide and injury of undetermined intent in England 1993-2009.
The over all trend for England shows a reduction since 1993, however rates from a low in 2007 have begun to rise over the past two years.
53 National Mental Health Development Unit (2008), National Suicide Prevention Strategy for England, Annual Report on Progress 2008, London
54 Health Statistics Quarterly (2006) Suicide trends and geographical variations in the United Kingdom, 1991-2004 London,
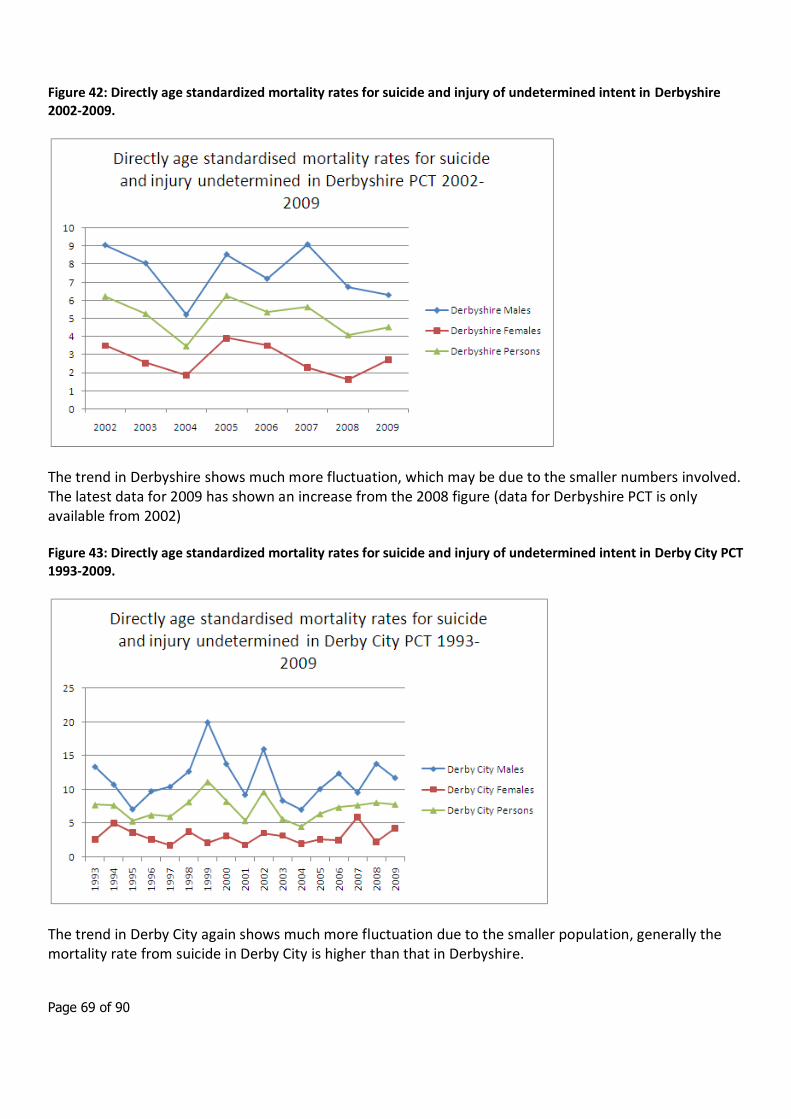
Page 69 of 90
Figure 42: Directly age standardized mortality rates for suicide and injury of undetermined intent in Derbyshire 2002-2009.
The trend in Derbyshire shows much more fluctuation, which may be due to the smaller numbers involved. The latest data for 2009 has shown an increase from the 2008 figure (data for Derbyshire PCT is only available from 2002)
Figure 43: Directly age standardized mortality rates for suicide and injury of undetermined intent in Derby City PCT 1993-2009.
The trend in Derby City again shows much more fluctuation due to the smaller population, generally the mortality rate from suicide in Derby City is higher than that in Derbyshire.
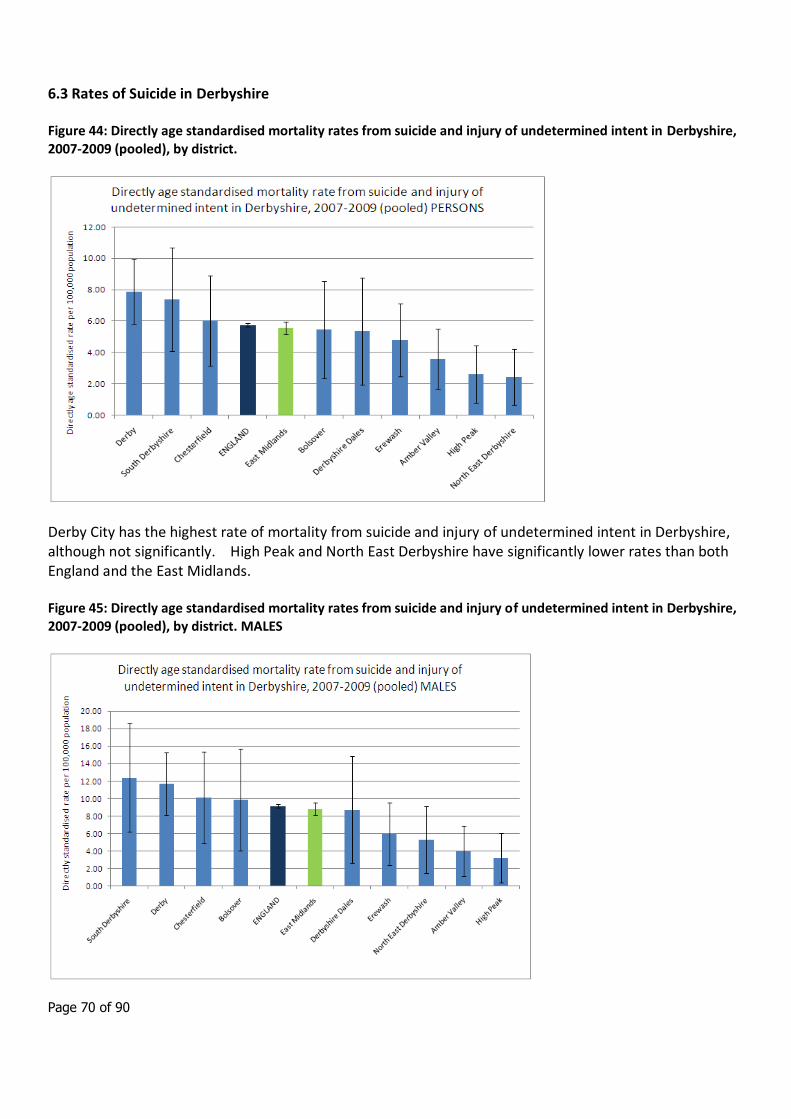
Page 70 of 90
6.3 Rates of Suicide in Derbyshire
Figure 44: Directly age standardised mortality rates from suicide and injury of undetermined intent in Derbyshire, 2007-2009 (pooled), by district.
Derby City has the highest rate of mortality from suicide and injury of undetermined intent in Derbyshire, although not significantly. High Peak and North East Derbyshire have significantly lower rates than both England and the East Midlands.
Figure 45: Directly age standardised mortality rates from suicide and injury of undetermined intent in Derbyshire, 2007-2009 (pooled), by district. MALES
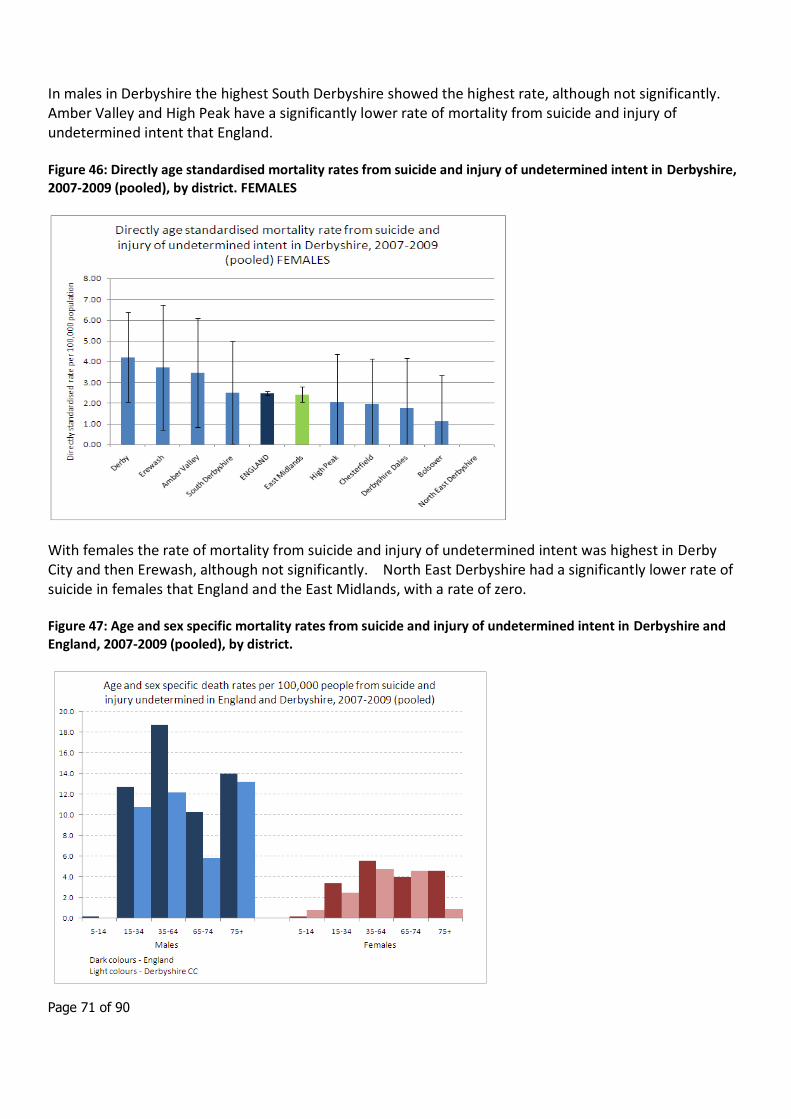
Page 71 of 90
In males in Derbyshire the highest South Derbyshire showed the highest rate, although not significantly. Amber Valley and High Peak have a significantly lower rate of mortality from suicide and injury of undetermined intent that England.
Figure 46: Directly age standardised mortality rates from suicide and injury of undetermined intent in Derbyshire, 2007-2009 (pooled), by district. FEMALES
With females the rate of mortality from suicide and injury of undetermined intent was highest in Derby City and then Erewash, although not significantly. North East Derbyshire had a significantly lower rate of suicide in females that England and the East Midlands, with a rate of zero.
Figure 47: Age and sex specific mortality rates from suicide and injury of undetermined intent in Derbyshire and England, 2007-2009 (pooled), by district.
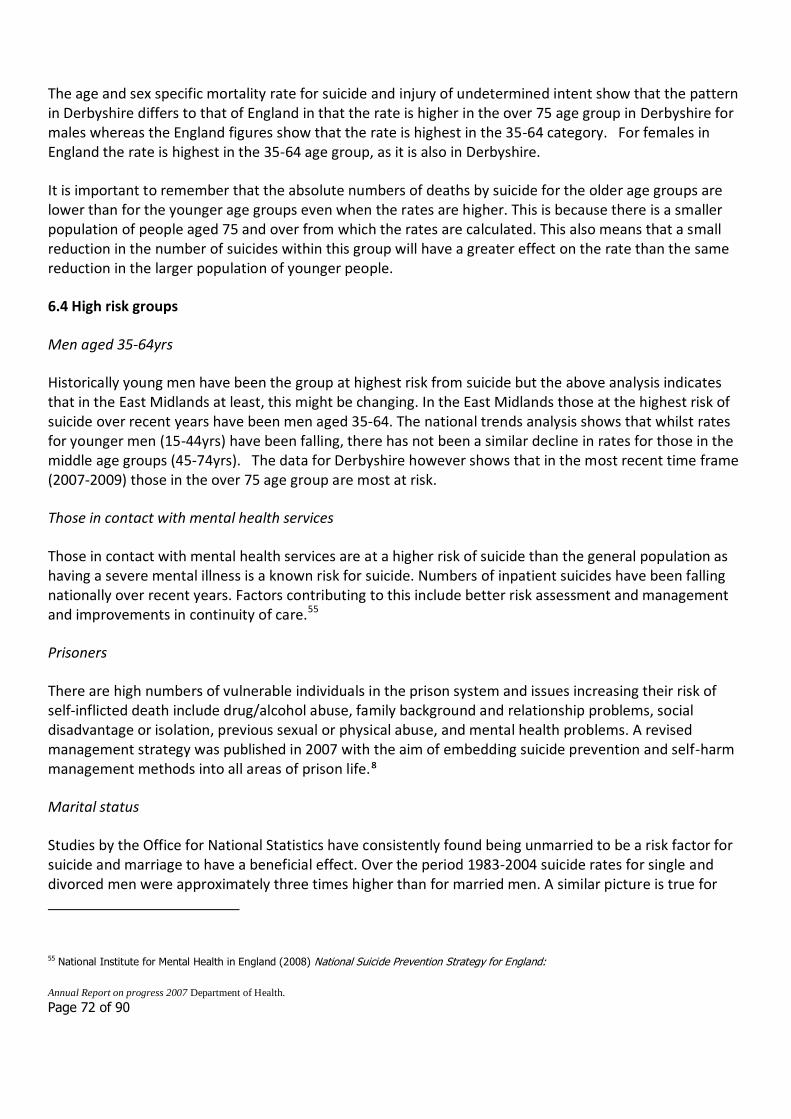
Page 72 of 90
The age and sex specific mortality rate for suicide and injury of undetermined intent show that the pattern in Derbyshire differs to that of England in that the rate is higher in the over 75 age group in Derbyshire for males whereas the England figures show that the rate is highest in the 35-64 category. For females in England the rate is highest in the 35-64 age group, as it is also in Derbyshire.
It is important to remember that the absolute numbers of deaths by suicide for the older age groups are lower than for the younger age groups even when the rates are higher. This is because there is a smaller population of people aged 75 and over from which the rates are calculated. This also means that a small reduction in the number of suicides within this group will have a greater effect on the rate than the same reduction in the larger population of younger people.
6.4 High risk groups
Men aged 35-64yrs
Historically young men have been the group at highest risk from suicide but the above analysis indicates that in the East Midlands at least, this might be changing. In the East Midlands those at the highest risk of suicide over recent years have been men aged 35-64. The national trends analysis shows that whilst rates for younger men (15-44yrs) have been falling, there has not been a similar decline in rates for those in the middle age groups (45-74yrs). The data for Derbyshire however shows that in the most recent time frame (2007-2009) those in the over 75 age group are most at risk.
Those in contact with mental health services
Those in contact with mental health services are at a higher risk of suicide than the general population as having a severe mental illness is a known risk for suicide. Numbers of inpatient suicides have been falling nationally over recent years. Factors contributing to this include better risk assessment and management and improvements in continuity of care.55
Prisoners
There are high numbers of vulnerable individuals in the prison system and issues increasing their risk of self-inflicted death include drug/alcohol abuse, family background and relationship problems, social disadvantage or isolation, previous sexual or physical abuse, and mental health problems. A revised management strategy was published in 2007 with the aim of embedding suicide prevention and self-harm management methods into all areas of prison life.⁸
Marital status
Studies by the Office for National Statistics have consistently found being unmarried to be a risk factor for suicide and marriage to have a beneficial effect. Over the period 1983-2004 suicide rates for single and divorced men were approximately three times higher than for married men. A similar picture is true for
55 National Institute for Mental Health in England (2008) National Suicide Prevention Strategy for England:
Annual Report on progress 2007 Department of Health.
Page 73 of 90
women in recent years with suicide rates three times higher for single and divorced women from 1993-2003 when compared to married women. Widowed men and women also have higher rates than those who are married. These differences remain apparent despite increases in cohabitation of unmarried couples over recent years.56
Social Factors
At an individual level social factors have been seen to influence suicide rates by a study using ONS longitudinal data from 1983-1992. The most important influences were unemployment, car access and tenure. This is reinforced by the fact that two thirds of men under 35yrs of age who commit suicide are unemployed.57 More recent studies from 2001-03 data in England and Wales show that, among the major causes of death, suicide has one of the largest ratios of death rates between the most and least disadvantaged groups. Using the National Statistics Socio-economic Classification (NS-SEC) and age-standardised suicide rates, the death rates were 3.6 times higher for those classified in the routine group as for those in the higher managerial and professional occupations. It is also of interest to note that for the cause of death ‘suicide and events of undetermined intent’ only 80% were classified into an occupational group as compared to 89% average for all other causes. This suggests that a higher percentage of those whose cause of death was suicide had never worked or were long-term unemployed than those who died of other causes.
Entering a new time period
Research done by the Office for National Statistics indicates that there is an effect of entering a new time period that increases the risk of suicide. This is seen in the data which show an increased proportion of suicides on Mondays (for males and females). The fact that this persists through all age groups including the over 75s suggests that this may not be employment related. There is also an increased number of suicides on January 1st, the highest number for any single day in the study from 1993-2002 being the 1st January 2000, which was a Saturday58. This may have implications for targeting suicide prevention efforts before the New Year period.
Prevention
The Implementation of the National Suicide Prevention Strategy for England is being taken forward by the National Mental Health Development Unit (NMHDU) in collaboration with a wide range of organisations and individuals. They produce an annual report outlining progress in implementing the strategy, the latest of which was published in July 2009. This report highlights the progress made since the strategy was introduced in 2002 and highlights key issues for 2009, these include highlighting the effect that the current economic conditions might have on the well-being of vulnerable individuals, ensuring the effective promotion and dissemination of the bereavement pack – Help is at Hand and to work with the media to highlight the need for journalists and editors to report suicide responsibly.
56 Griffiths C, Ladva G, Brock A and Baker, A (2008) Trends in suicide by marital status in England and Wales, 1982-2005. Health Statistics Quarterly 37, 8-14.
57 Mental Health and Social Exclusion, Social Exclusion Report. (2004) Office of the Deputy Prime Minister.
58 Johnson H, Brock A, Griffiths C and Rooney C (2005) Mortality from suicide and drug-related poisoning by day of the week in England and Wales, 1993-2002.
Health Statistics Quarterly 27, 13-16.
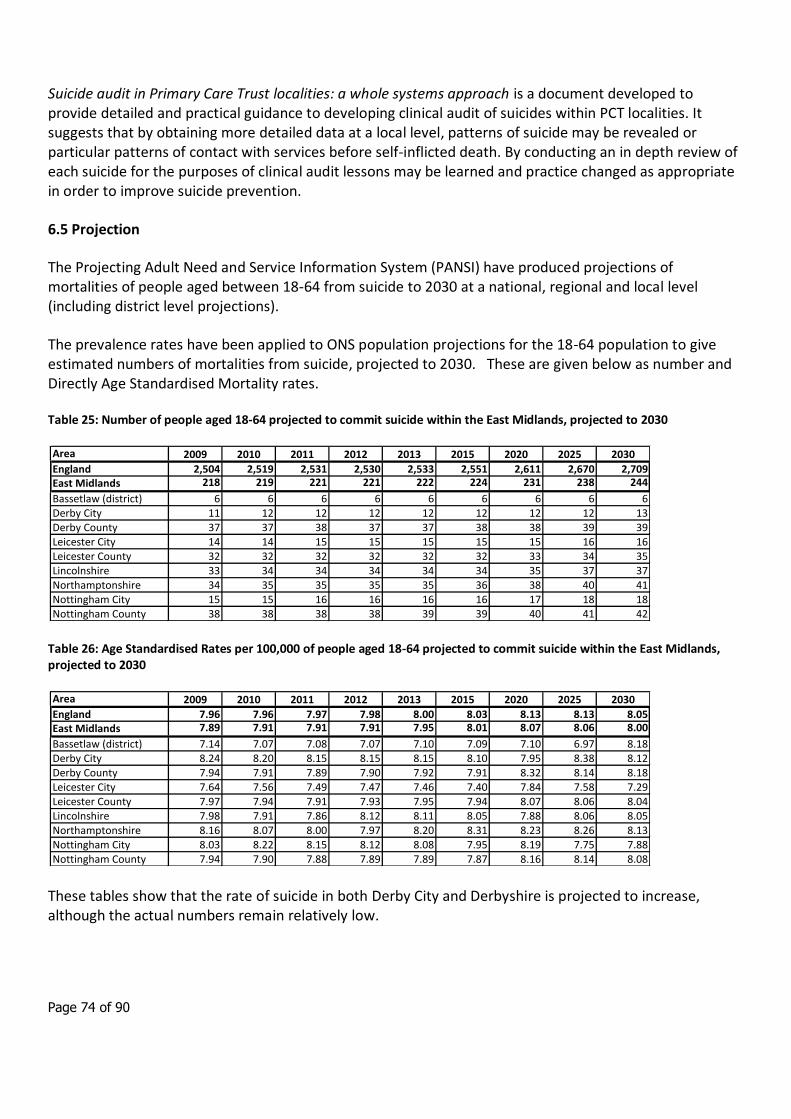
Page 74 of 90
Suicide audit in Primary Care Trust localities: a whole systems approach is a document developed to provide detailed and practical guidance to developing clinical audit of suicides within PCT localities. It suggests that by obtaining more detailed data at a local level, patterns of suicide may be revealed or particular patterns of contact with services before self-inflicted death. By conducting an in depth review of each suicide for the purposes of clinical audit lessons may be learned and practice changed as appropriate in order to improve suicide prevention.
6.5 Projection
The Projecting Adult Need and Service Information System (PANSI) have produced projections of mortalities of people aged between 18-64 from suicide to 2030 at a national, regional and local level (including district level projections).
The prevalence rates have been applied to ONS population projections for the 18-64 population to give estimated numbers of mortalities from suicide, projected to 2030. These are given below as number and Directly Age Standardised Mortality rates.
Table 25: Number of people aged 18-64 projected to commit suicide within the East Midlands, projected to 2030
Table 26: Age Standardised Rates per 100,000 of people aged 18-64 projected to commit suicide within the East Midlands, projected to 2030
These tables show that the rate of suicide in both Derby City and Derbyshire is projected to increase, although the actual numbers remain relatively low.
Area 2009 2010 2011 2012 2013 2015 2020 2025 2030
England 2,504 2,519 2,531 2,530 2,533 2,551 2,611 2,670 2,709East Midlands 218 219 221 221 222 224 231 238 244
Bassetlaw (district) 6 6 6 6 6 6 6 6 6Derby City 11 12 12 12 12 12 12 12 13Derby County 37 37 38 37 37 38 38 39 39Leicester City 14 14 15 15 15 15 15 16 16Leicester County 32 32 32 32 32 32 33 34 35Lincolnshire 33 34 34 34 34 34 35 37 37Northamptonshire 34 35 35 35 35 36 38 40 41Nottingham City 15 15 16 16 16 16 17 18 18Nottingham County 38 38 38 38 39 39 40 41 42
Area 2009 2010 2011 2012 2013 2015 2020 2025 2030
England 7.96 7.96 7.97 7.98 8.00 8.03 8.13 8.13 8.05East Midlands 7.89 7.91 7.91 7.91 7.95 8.01 8.07 8.06 8.00
Bassetlaw (district) 7.14 7.07 7.08 7.07 7.10 7.09 7.10 6.97 8.18Derby City 8.24 8.20 8.15 8.15 8.15 8.10 7.95 8.38 8.12Derby County 7.94 7.91 7.89 7.90 7.92 7.91 8.32 8.14 8.18Leicester City 7.64 7.56 7.49 7.47 7.46 7.40 7.84 7.58 7.29Leicester County 7.97 7.94 7.91 7.93 7.95 7.94 8.07 8.06 8.04Lincolnshire 7.98 7.91 7.86 8.12 8.11 8.05 7.88 8.06 8.05Northamptonshire 8.16 8.07 8.00 7.97 8.20 8.31 8.23 8.26 8.13Nottingham City 8.03 8.22 8.15 8.12 8.08 7.95 8.19 7.75 7.88Nottingham County 7.94 7.90 7.88 7.89 7.89 7.87 8.16 8.14 8.08
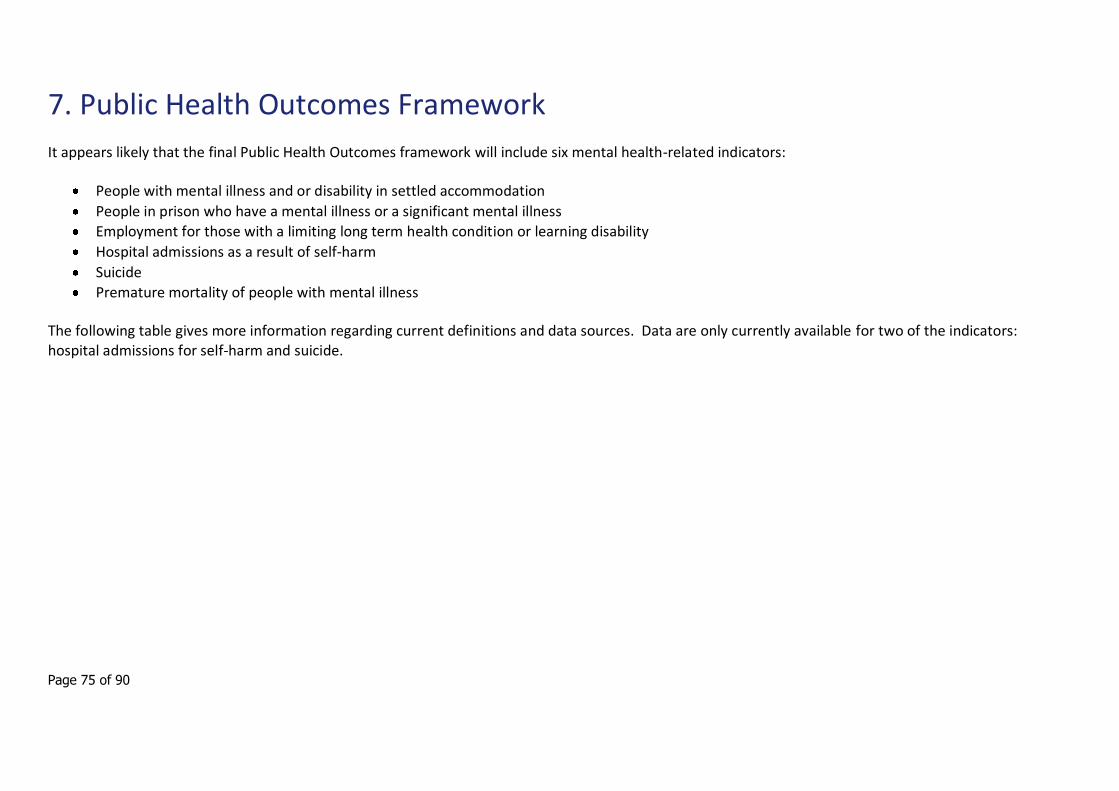
Page 75 of 90
7. Public Health Outcomes Framework
It appears likely that the final Public Health Outcomes framework will include six mental health-related indicators:
People with mental illness and or disability in settled accommodation
People in prison who have a mental illness or a significant mental illness
Employment for those with a limiting long term health condition or learning disability
Hospital admissions as a result of self-harm
Suicide
Premature mortality of people with mental illness
The following table gives more information regarding current definitions and data sources. Data are only currently available for two of the indicators: hospital admissions for self-harm and suicide.
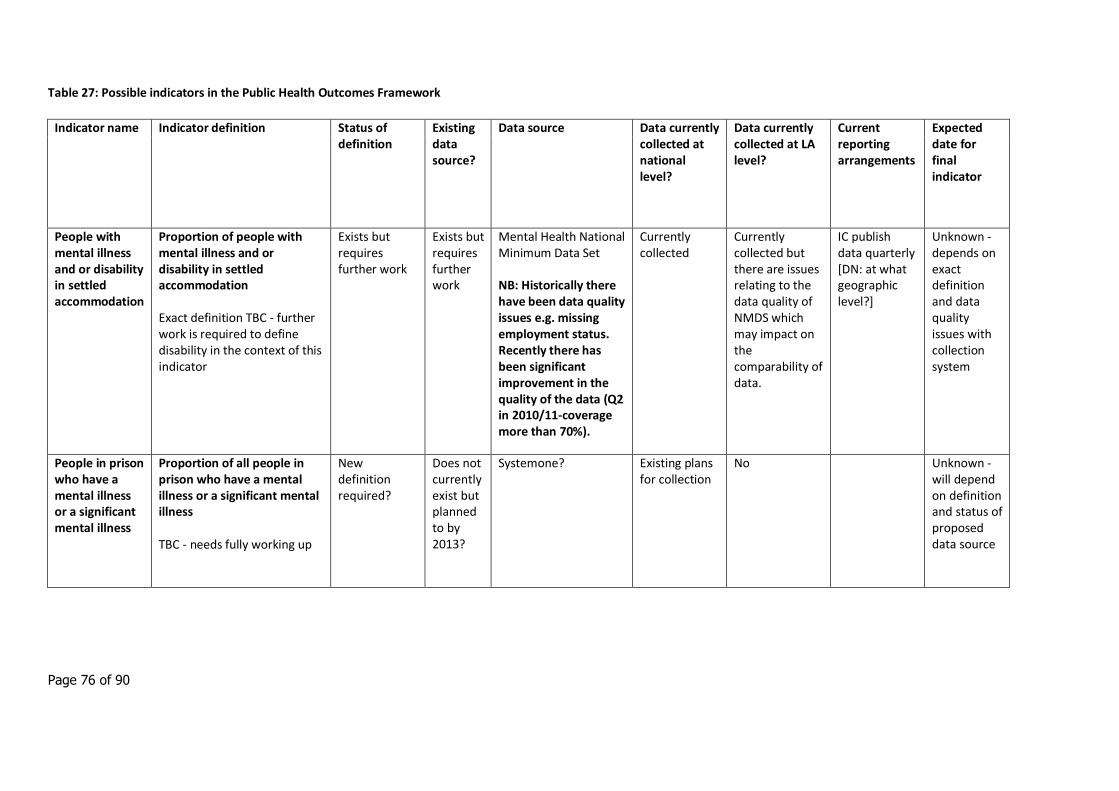
Page 76 of 90
Table 27: Possible indicators in the Public Health Outcomes Framework
Indicator name Indicator definition Status of definition
Existing data source?
Data source Data currently collected at national level?
Data currently collected at LA level?
Current reporting arrangements
Expected date for final indicator
People with mental illness and or disability in settled accommodation
Proportion of people with mental illness and or disability in settled accommodation Exact definition TBC - further work is required to define disability in the context of this indicator
Exists but requires further work
Exists but requires further work
Mental Health National Minimum Data Set NB: Historically there have been data quality issues e.g. missing employment status. Recently there has been significant improvement in the quality of the data (Q2 in 2010/11-coverage more than 70%).
Currently collected
Currently collected but there are issues relating to the data quality of NMDS which may impact on the comparability of data.
IC publish data quarterly [DN: at what geographic level?]
Unknown - depends on exact definition and data quality issues with collection system
People in prison who have a mental illness or a significant mental illness
Proportion of all people in prison who have a mental illness or a significant mental illness TBC - needs fully working up
New definition required?
Does not currently exist but planned to by 2013?
Systemone?
Existing plans for collection
No Unknown - will depend on definition and status of proposed data source
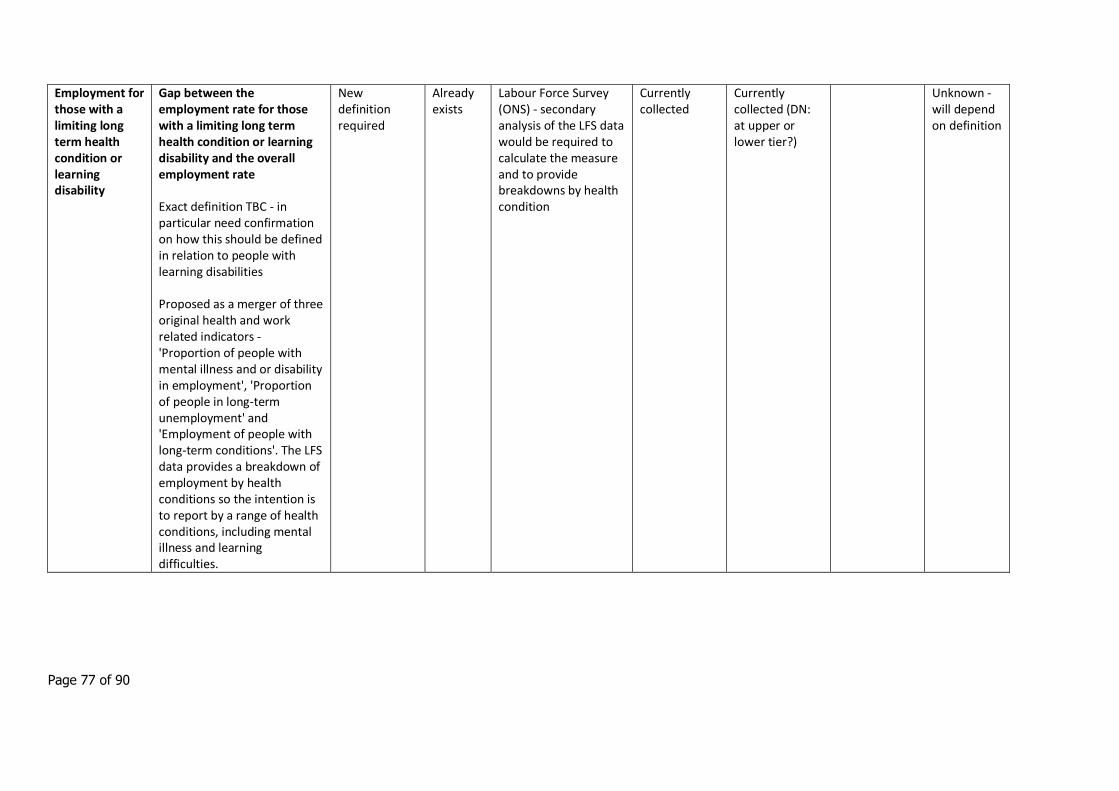
Page 77 of 90
Employment for those with a limiting long term health condition or learning disability
Gap between the employment rate for those with a limiting long term health condition or learning disability and the overall employment rate Exact definition TBC - in particular need confirmation on how this should be defined in relation to people with learning disabilities Proposed as a merger of three original health and work related indicators - 'Proportion of people with mental illness and or disability in employment', 'Proportion of people in long-term unemployment' and 'Employment of people with long-term conditions'. The LFS data provides a breakdown of employment by health conditions so the intention is to report by a range of health conditions, including mental illness and learning difficulties.
New definition required
Already exists
Labour Force Survey (ONS) - secondary analysis of the LFS data would be required to calculate the measure and to provide breakdowns by health condition
Currently collected
Currently collected (DN: at upper or lower tier?)
Unknown - will depend on definition
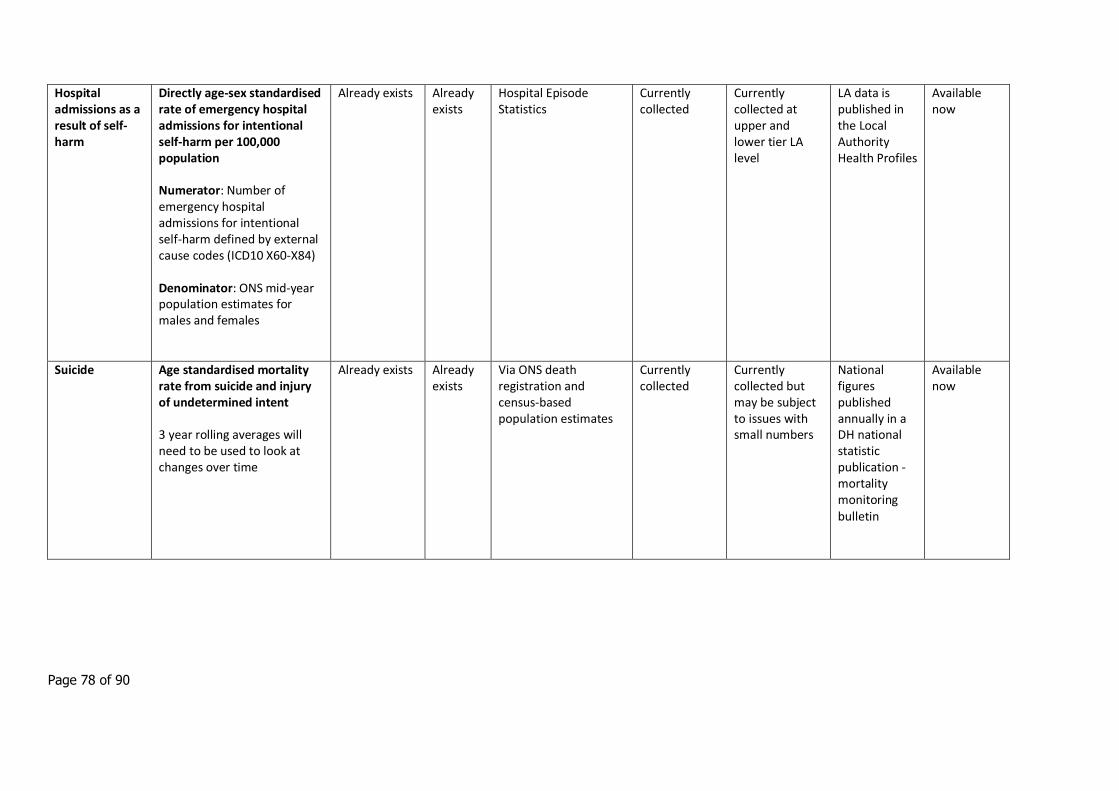
Page 78 of 90
Hospital admissions as a result of self-harm
Directly age-sex standardised rate of emergency hospital admissions for intentional self-harm per 100,000 population Numerator: Number of emergency hospital admissions for intentional self-harm defined by external cause codes (ICD10 X60-X84) Denominator: ONS mid-year population estimates for males and females
Already exists Already exists
Hospital Episode Statistics
Currently collected
Currently collected at upper and lower tier LA level
LA data is published in the Local Authority Health Profiles
Available now
Suicide Age standardised mortality rate from suicide and injury of undetermined intent 3 year rolling averages will need to be used to look at changes over time
Already exists Already exists
Via ONS death registration and census-based population estimates
Currently collected
Currently collected but may be subject to issues with small numbers
National figures published annually in a DH national statistic publication - mortality monitoring bulletin
Available now
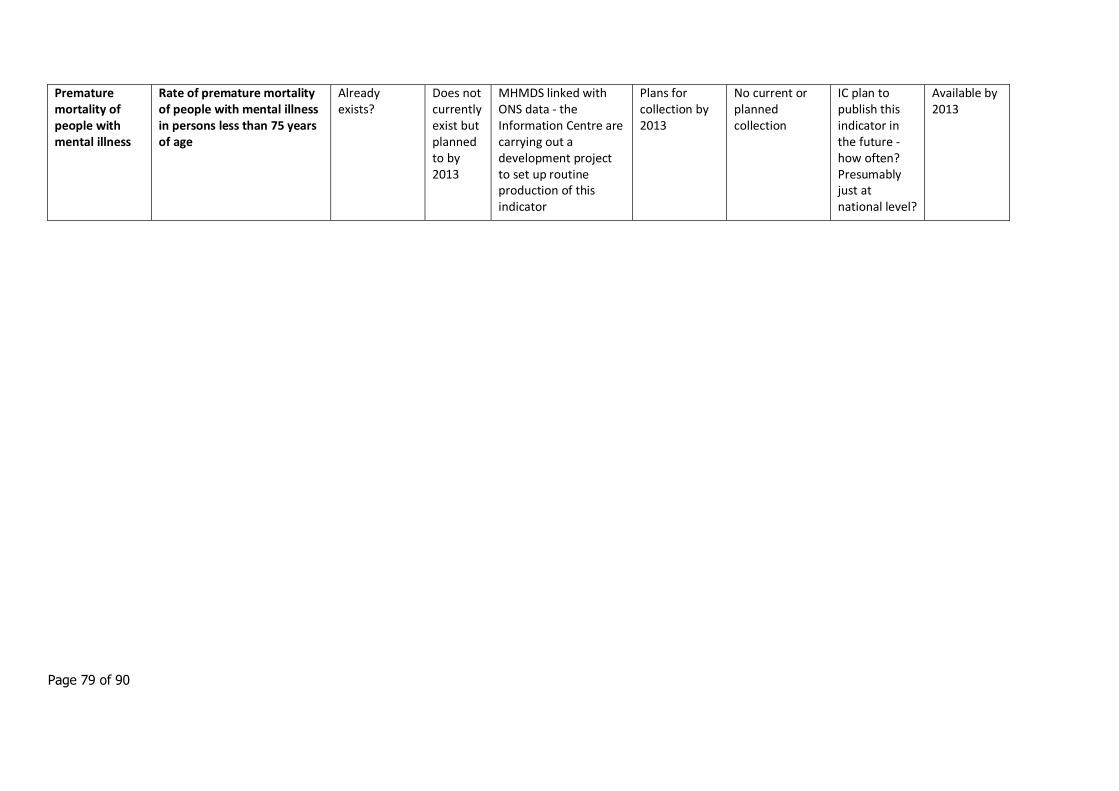
Page 79 of 90
Premature mortality of people with mental illness
Rate of premature mortality of people with mental illness in persons less than 75 years of age
Already exists?
Does not currently exist but planned to by 2013
MHMDS linked with ONS data - the Information Centre are carrying out a development project to set up routine production of this indicator
Plans for collection by 2013
No current or planned collection
IC plan to publish this indicator in the future - how often? Presumably just at national level?
Available by 2013
Page 80 of 90
8. Child and Adolescent Mental Health Services (CAMHS)
8.1 Introduction
The national CAMHS review provides comprehensive evidence of the often complex and mixed data on the well-being of children and young people in England compared with other industrialised countries (2009) In 2008 World Health Organization asked 11, 13 and 15 year olds in Europe how satisfied they were with their lives, as this measure is seen as an important aspect of well-being. In line with the trend in other European countries, girls in England showed a decline in levels of life satisfaction between the ages of 11 and 15, while the ratings for boys remained broadly the same. Overall, satisfaction levels among English children and young people were around the average for Europe as a whole. A more wide-ranging study by UNICEF (2007), which took into account economic, health and educational data as well as the responses of children and young people to questions about friendships, family, risk-taking behaviours, enjoyment of school and life satisfaction, found that child well-being in the UK was lower than in 20 other industrialised countries (most of them European, but also including the United States).
In general, there is a lack of consistent national data on the overall psychological well-being of children and young people in England, and also on the prevalence of ‘lower-level’ mental health problems that do not meet the criteria for a clinical diagnosis. However, there is data on the prevalence of diagnosable mental health problems and disorders, and this shows that overall prevalence has increased since the 1970s.( Collishaw et al 2004); between 1974 and 1999 there was evidence of a significant increase in conduct problems for both genders, with an increase in emotional problems between 1986 and 1999.
The most comprehensive statistical survey of the prevalence of mental disorders in Great Britain ( Green et al 2004) found that 10% of children and young people aged between five and 15 had a clinically diagnosable mental disorder that is associated with “considerable distress and substantial interference with personal functions”. This included challenges around family and social relationships, their capacity to cope with day-to-day stresses and life challenges, and their learning. Prevalence rates varied according to a number of characteristics, in particular:
in gender, with problems more common in boys than girls
in age, with problems more common among 11 to 15 year olds than five to 10 year olds
The majority of difficulties fell within the categories of emotional, conduct or hyperkinetic disorder. One per cent had a variety of less common disorders such as autistic spectrum disorder or an eating disorder.
A sample of the children from this survey was followed up over the three year period from 2004 to 2007 (Perry- Langdon 2008), to find out more about the factors likely to be associated with the onset or persistence of disorders:-
Children who face three or more stressful life events, such as family bereavement, divorce or serious illness, are three times more likely than other children to develop emotional and behavioural disorders.
Page 81 of 90
Some 3% of children who did not have an emotional or behavioural disorder in 2004 had developed one by 2007. The factors most commonly associated with emotional disorders were serious physical illness, stressful family situations and their mother’s mental health.
Nearly one third of children diagnosed as having emotional disorders in 2004 still had them in 2007, with family, household and social characteristics strongly linked to persistence. Children who lived in rented accommodation were more likely to have a persisting emotional disorder than those who did not.
Around 43% of children and young people who had been assessed with behavioural disorders in 2004 still had them in 2007, with persistence linked with household tenure, parents’ educational attainment and occupation, and number of children in the family.
Many children will have mental health problems that are less severe and more likely to be short-lived, but which may nonetheless affect their psychological well-being and be of concern to themselves, their families and their friends. Those who live in families with a low household income, with no parent working or with a lone parent are more prone to have a diagnosable disorder. It is important to emphasise that these are associations and not necessarily direct causes, as the majority of children and young people in these circumstances grow and develop without difficulties. There are similar associations between mental health outcomes and poor educational attainment, absence from school, exclusion from school and lack of friendship networks. In addition, there are some children and young people who are significantly more likely to experience mental health difficulties than the general population:-
Nearly 50% of children in local authority care have a clinically diagnosable mental health disorder, compared with 10% in the general population; this increases to nearly 70% among children living in residential care (Meltzer et al 2003)
Children in special schools for behavioural, emotional and social difficulties (BESD schools) or Pupil Referral Units (PRU) are significantly more likely to experience mental health difficulties than the general population.
Over a third of children and young people with an identified learning disability also have a diagnosable psychiatric disorder (Emerson and Hatton 2007)
A high proportion (approx 40%) of children and young people in contact with the youth justice system has a mental health problem. This rises to more than 90% for those in custody. These children and young people are vulnerable for many reasons. For example, they tend to be exposed to multiple risk factors; frequently have more than one disorder (including more ‘stigmatised’ disorders such as emerging personality disorder or inappropriate sexual behaviour); frequently miss out on universal promotion and preventive services; and engage with the system at a point that does not offer the most appropriate treatment and placement solutions for mental health problems (Healthcare commission 2006)
Children and young people with physical disabilities are twice as likely to develop psychological problems as those without, as are those who experience serious or chronic illness (Parry-Langdon 2008)
Teenage mothers are three times more likely than older mothers to suffer postnatal depression and mental health problems in the first three years of their baby’s life (Ermisch 2003)
Literature review shows that the data in relation to children from black and minority ethnic groups is inconsistent and at times contradictory, though there appear to be differences in prevalence rates
Page 82 of 90
between different minority ethnic groups. Factors such as discrimination, racism, stress, low self-esteem, socioeconomic disadvantage and the experience of seeking refuge or asylum may all exacerbate mental health problems (Malek 2005). Two risk factors relevant to some young people are academic failure and low self-esteem. For example, black young men are three times more likely to be excluded from schools than their white counterparts and are also five times less likely to be seen as gifted (DES 2006) Young people who are lesbian, gay or bisexual may be more vulnerable to self-harm, suicide and bullying, though there is currently a lack of robust evidence (Hawton and Rodham 2006)
The mental health needs of children and young people are different at different stages in the life cycle. As the Child Health Promotion programme (DH 2008) notes, pregnancy and the first years of life are a critical stage, when the foundations of future health and well-being are laid down. While it has been acknowledged for some time that this phase strongly influences outcomes in later life, new information from neurological research reinforces the importance of early intervention to reduce the impact of stress in pregnancy and to promote attachment. This is particularly true for children who are born into disadvantaged circumstances. At the other end of the age spectrum, adolescence – a distinct developmental stage in its own right – is characterised by dramatic physical and neurological changes.
Children and young people who contributed to the national CAMHS Review (2009) were asked to describe what ‘made them feel good inside’ or what things they thought were important for children and young people’s well-being. Three factors were consistently mentioned:
having good support networks – across family, friends and school
being able to do things they enjoy – ranging from sports and community-based activities, to having time with family and friends, and time to relax
building self-esteem – in particular by having their achievements recognised and by having goals to work towards.
Conversely, difficulties or lack of opportunity in these areas can negatively affect the way that children and young people feel about themselves and their lives. This gives useful information to families, service planners and providers about the type of protective factors that children and young people themselves say are important to them.
In addition, research provides some evidence of a range of factors that are statistically associated with poor mental health outcomes (‘risk factors’), as well as ‘protective’ factors that are associated with good outcomes. These risk factors increase the likelihood of poor mental health outcomes. They do not necessarily cause them. The relationship between factors and outcomes is complex, and the two may influence each other. As the number of risk factors increases, so the likelihood of a child experiencing mental health problems increases dramatically – they have a far more adverse effect when they are combined. (Newman 2002)
However, not all children facing the same risk factors will develop problems; some will be more resilient than others because of other, protective factors in their life. Using this considerable body of knowledge can help to reduce the likelihood of problems arising and to both recognise and accurately identify difficulties when they do occur.
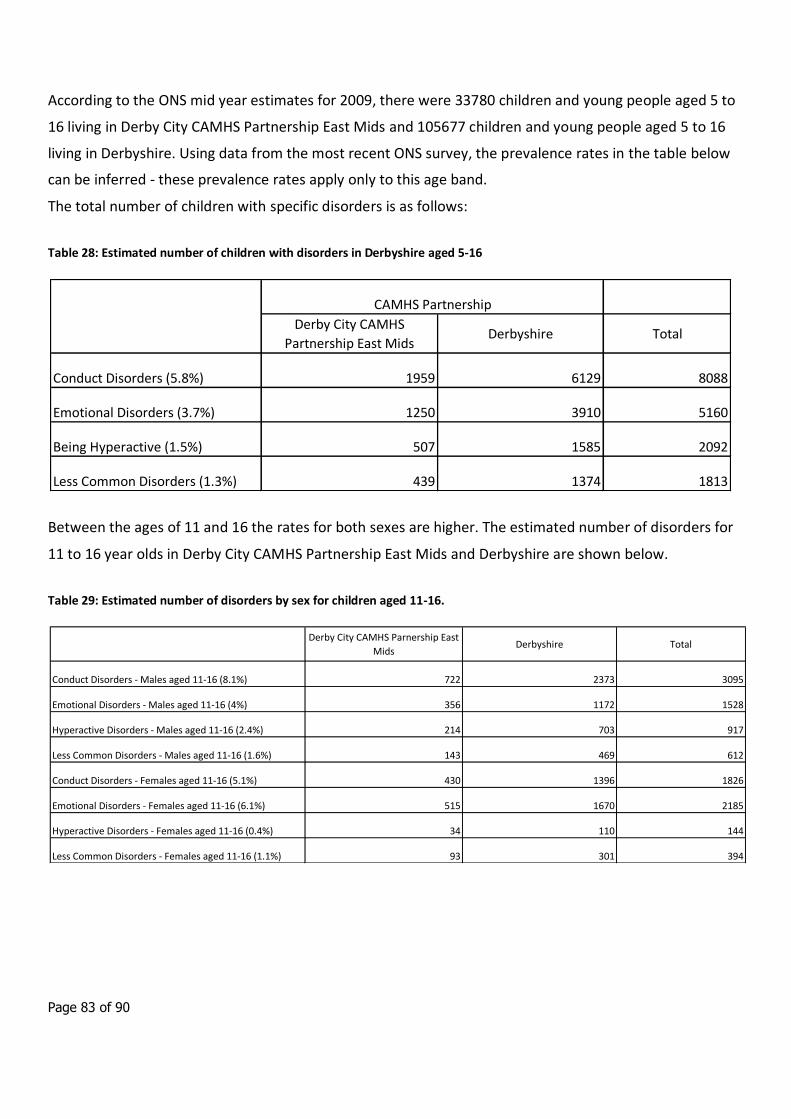
Page 83 of 90
According to the ONS mid year estimates for 2009, there were 33780 children and young people aged 5 to
16 living in Derby City CAMHS Partnership East Mids and 105677 children and young people aged 5 to 16
living in Derbyshire. Using data from the most recent ONS survey, the prevalence rates in the table below
can be inferred - these prevalence rates apply only to this age band.
The total number of children with specific disorders is as follows:
Table 28: Estimated number of children with disorders in Derbyshire aged 5-16
Between the ages of 11 and 16 the rates for both sexes are higher. The estimated number of disorders for
11 to 16 year olds in Derby City CAMHS Partnership East Mids and Derbyshire are shown below.
Table 29: Estimated number of disorders by sex for children aged 11-16.
Derby City CAMHS
Partnership East MidsDerbyshire Total
Conduct Disorders (5.8%) 1959 6129 8088
Emotional Disorders (3.7%) 1250 3910 5160
Being Hyperactive (1.5%) 507 1585 2092
Less Common Disorders (1.3%) 439 1374 1813
CAMHS Partnership
Derby City CAMHS Parnership East
MidsDerbyshire Total
Conduct Disorders - Males aged 11-16 (8.1%) 722 2373 3095
Emotional Disorders - Males aged 11-16 (4%) 356 1172 1528
Hyperactive Disorders - Males aged 11-16 (2.4%) 214 703 917
Less Common Disorders - Males aged 11-16 (1.6%) 143 469 612
Conduct Disorders - Females aged 11-16 (5.1%) 430 1396 1826
Emotional Disorders - Females aged 11-16 (6.1%) 515 1670 2185
Hyperactive Disorders - Females aged 11-16 (0.4%) 34 110 144
Less Common Disorders - Females aged 11-16 (1.1%) 93 301 394
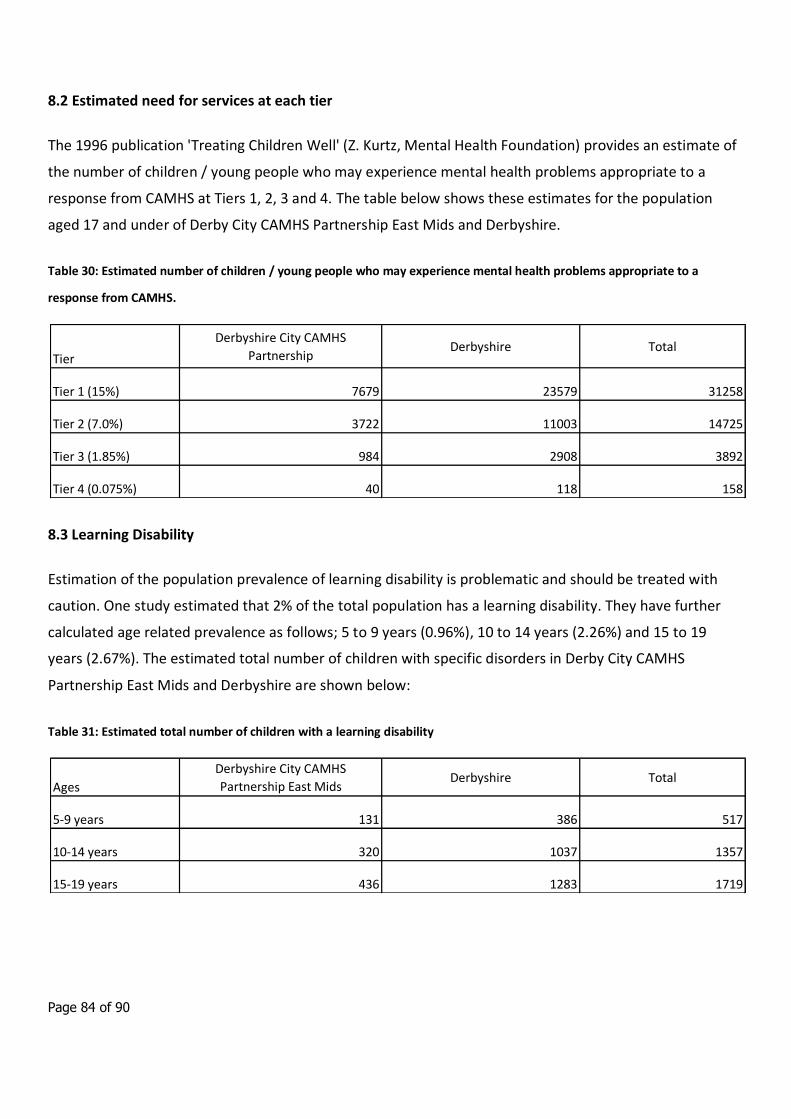
Page 84 of 90
8.2 Estimated need for services at each tier
The 1996 publication 'Treating Children Well' (Z. Kurtz, Mental Health Foundation) provides an estimate of
the number of children / young people who may experience mental health problems appropriate to a
response from CAMHS at Tiers 1, 2, 3 and 4. The table below shows these estimates for the population
aged 17 and under of Derby City CAMHS Partnership East Mids and Derbyshire.
Table 30: Estimated number of children / young people who may experience mental health problems appropriate to a
response from CAMHS.
8.3 Learning Disability
Estimation of the population prevalence of learning disability is problematic and should be treated with
caution. One study estimated that 2% of the total population has a learning disability. They have further
calculated age related prevalence as follows; 5 to 9 years (0.96%), 10 to 14 years (2.26%) and 15 to 19
years (2.67%). The estimated total number of children with specific disorders in Derby City CAMHS
Partnership East Mids and Derbyshire are shown below:
Table 31: Estimated total number of children with a learning disability
Tier
Derbyshire City CAMHS
PartnershipDerbyshire Total
Tier 1 (15%) 7679 23579 31258
Tier 2 (7.0%) 3722 11003 14725
Tier 3 (1.85%) 984 2908 3892
Tier 4 (0.075%) 40 118 158
Ages
Derbyshire City CAMHS
Partnership East MidsDerbyshire Total
5-9 years 131 386 517
10-14 years 320 1037 1357
15-19 years 436 1283 1719
Page 85 of 90
These age-specific rates reflect the increasing identification of children with mild learning disabilities with
age. On the basis of a 40% prevalence of mental health problems associated with learning disability, (this is
the rate quoted in the Foundation for People with Learning Disabilities publication "Count Us In", the
following number of children with mental health problems might be expected in Derby City CAMHS
Partnership East Mids ages 5 to 9 - 52, ages 10 to 14 - 130, ages 15 to 19 – 172, and in Derbyshire ages 5 to
9 - 157, ages 10 to 14 - 422, ages 15 to 19 - 522.
8.4 Autistic Spectrum Disorder (ASD)
A study in South East London, (Baird et al, Prevalence of disorders of the autism spectrum in a population
cohort of children in South Thames: the Special Needs and Autism Project (SNAP), The Lancet 2006;
368:210-215) estimated the prevalence of childhood autism at 38.9 per 10,000 and that of other ASDs at
77.2 per 10,000, making the total prevalence of all ASDs 116.1 per 10,000 or approximately 1%. This study
supersedes the Medial Research Council study which estimated the prevalence of ASD at 60 per 10,000
population aged less than 8 years
The European Union Commission highlights the problems associated with establishing prevalence rates for
Autistic Spectrum Disorders. These include the absence of a long-term study of psychiatric case registers
and inconsistencies of definition over time and between locations.
Nonetheless the Commission estimates that according to the existing information, the age-specific
prevalence rates for 'classical autism' in the EU could be estimated as varying from 3.3 to 16.0 per 10,000.
These rates could however increase to a range estimated between 30 and 63 per 10,000 when all forms of
autism spectrum disorders are included. Debate remains about the validity and usefulness of a broad
definition of autism. The EU definition of rare diseases still focuses on those diseases lower than 5 per 10
000. The Commission notes that ASD "... could be considered as a rare disease using the most restrictive
diagnosis criteria but it seems more appropriate to not refer more to ASD as a rare disease."
If the prevalence rate found by SNAP were applied to the population aged 5 to 16 years of Derby City
CAMHS Partnership East Mids this would estimate approximately 343 cases and 1076 in Derbyshire
CAMHS.
Page 86 of 90
8.5 Self harm and suicide in young people
A conservative estimate is that there are 24,000 cases of attempted suicide by adolescents (of 10-19 years)
each year in England and Wales, which is one attempt every 20 minutes (Hawton et al, 1999). A Samaritans
study found that four times more adolescent females self-harmed than adolescent males (Samaritans,
2003)
The following information is taken from Hawley & James:
- Common characteristics of adolescents who self harm are similar to the characteristics of those who
commit suicide.
- Young South Asian females in the United Kingdom seem to have a raised risk of self harm. Intercultural
stresses and consequent family conflicts may be relevant factors.
- As many as 30% of adolescents who self harm report previous episodes, many of which have not come to
medical attention. At least 10% repeat self harm during the following year, with repeats being especially
likely in the first two or three months.
- The risk of suicide after deliberate self harm varies between 0.24% and 4.30%. Our knowledge of risk
factors is limited and can be used only as an adjunct to careful clinical assessment when making decisions
about after care. However, the following factors seem to indicate a risk: being an older teenage male;
violent method of self harm; multiple previous episodes of self harm; apathy, hopelessness, and insomnia;
substance misuse; and previous admission to a psychiatric hospital.
Data from the Office for National Statistics (ONS) indicate that in 2005 there were 125 deaths of 15 to 19
year olds from suicide or undetermined injury in England and Wales. This is a rate of 3.6 deaths per
100,000 population aged 15 to 19 years (ONS Vital Statistics and 2005 ONS Mid Year Population Estimate).
If applied to the population of Derby City CAMHS Partnership East Mids this would equate to an estimate
of 1 death from suicide or undetermined injury per year. If applied to the population of Derbyshire this
would equate to an estimate of 2 deaths from suicide or undetermined injury per year.
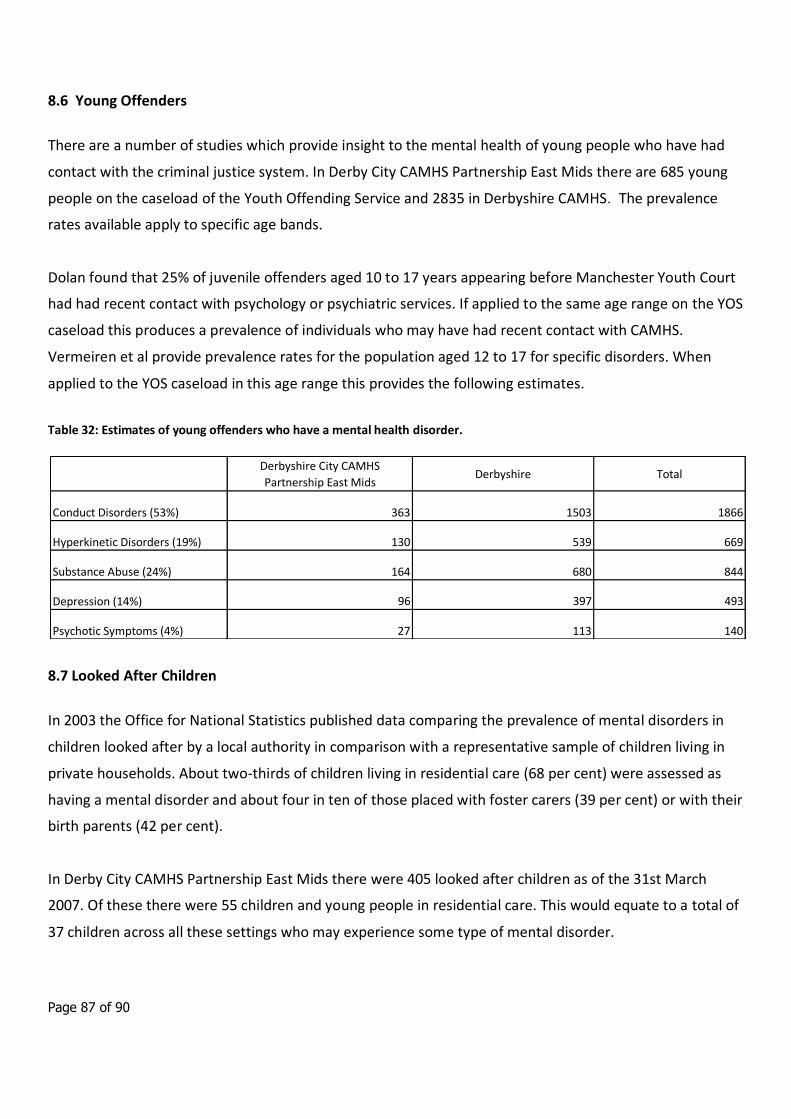
Page 87 of 90
8.6 Young Offenders
There are a number of studies which provide insight to the mental health of young people who have had
contact with the criminal justice system. In Derby City CAMHS Partnership East Mids there are 685 young
people on the caseload of the Youth Offending Service and 2835 in Derbyshire CAMHS. The prevalence
rates available apply to specific age bands.
Dolan found that 25% of juvenile offenders aged 10 to 17 years appearing before Manchester Youth Court
had had recent contact with psychology or psychiatric services. If applied to the same age range on the YOS
caseload this produces a prevalence of individuals who may have had recent contact with CAMHS.
Vermeiren et al provide prevalence rates for the population aged 12 to 17 for specific disorders. When
applied to the YOS caseload in this age range this provides the following estimates.
Table 32: Estimates of young offenders who have a mental health disorder.
8.7 Looked After Children
In 2003 the Office for National Statistics published data comparing the prevalence of mental disorders in
children looked after by a local authority in comparison with a representative sample of children living in
private households. About two-thirds of children living in residential care (68 per cent) were assessed as
having a mental disorder and about four in ten of those placed with foster carers (39 per cent) or with their
birth parents (42 per cent).
In Derby City CAMHS Partnership East Mids there were 405 looked after children as of the 31st March
2007. Of these there were 55 children and young people in residential care. This would equate to a total of
37 children across all these settings who may experience some type of mental disorder.
Derbyshire City CAMHS
Partnership East MidsDerbyshire Total
Conduct Disorders (53%) 363 1503 1866
Hyperkinetic Disorders (19%) 130 539 669
Substance Abuse (24%) 164 680 844
Depression (14%) 96 397 493
Psychotic Symptoms (4%) 27 113 140
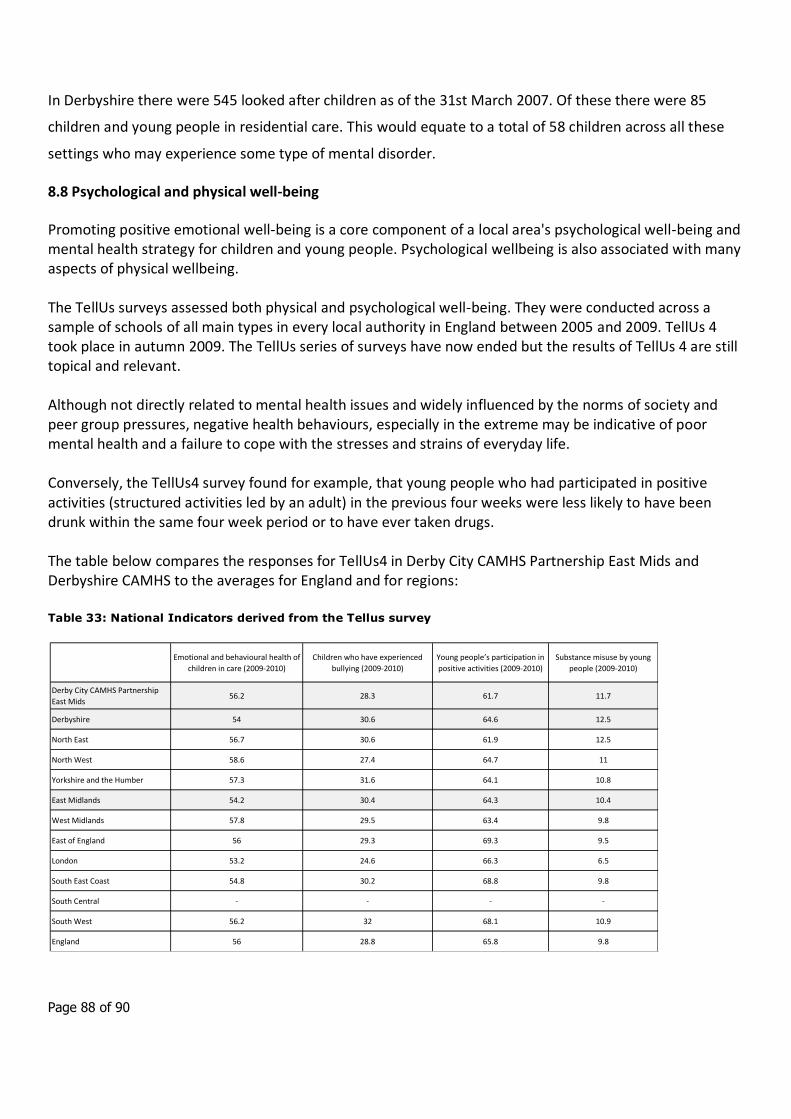
Page 88 of 90
In Derbyshire there were 545 looked after children as of the 31st March 2007. Of these there were 85
children and young people in residential care. This would equate to a total of 58 children across all these
settings who may experience some type of mental disorder.
8.8 Psychological and physical well-being
Promoting positive emotional well-being is a core component of a local area's psychological well-being and mental health strategy for children and young people. Psychological wellbeing is also associated with many aspects of physical wellbeing. The TellUs surveys assessed both physical and psychological well-being. They were conducted across a sample of schools of all main types in every local authority in England between 2005 and 2009. TellUs 4 took place in autumn 2009. The TellUs series of surveys have now ended but the results of TellUs 4 are still topical and relevant. Although not directly related to mental health issues and widely influenced by the norms of society and peer group pressures, negative health behaviours, especially in the extreme may be indicative of poor mental health and a failure to cope with the stresses and strains of everyday life. Conversely, the TellUs4 survey found for example, that young people who had participated in positive activities (structured activities led by an adult) in the previous four weeks were less likely to have been drunk within the same four week period or to have ever taken drugs. The table below compares the responses for TellUs4 in Derby City CAMHS Partnership East Mids and Derbyshire CAMHS to the averages for England and for regions:
Table 33: National Indicators derived from the Tellus survey
Emotional and behavioural health of
children in care (2009-2010)
Children who have experienced
bullying (2009-2010)
Young people’s participation in
positive activities (2009-2010)
Substance misuse by young
people (2009-2010)
Derby City CAMHS Partnership
East Mids56.2 28.3 61.7 11.7
Derbyshire 54 30.6 64.6 12.5
North East 56.7 30.6 61.9 12.5
North West 58.6 27.4 64.7 11
Yorkshire and the Humber 57.3 31.6 64.1 10.8
East Midlands 54.2 30.4 64.3 10.4
West Midlands 57.8 29.5 63.4 9.8
East of England 56 29.3 69.3 9.5
London 53.2 24.6 66.3 6.5
South East Coast 54.8 30.2 68.8 9.8
South Central - - - -
South West 56.2 32 68.1 10.9
England 56 28.8 65.8 9.8
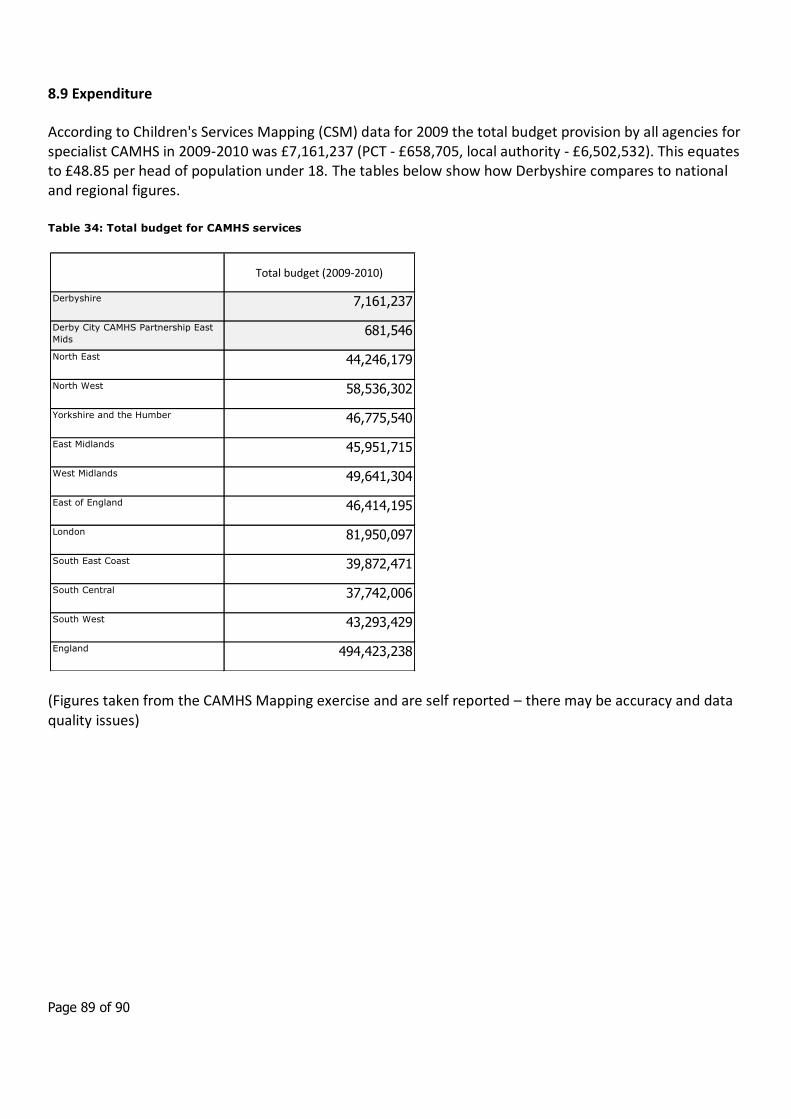
Page 89 of 90
8.9 Expenditure
According to Children's Services Mapping (CSM) data for 2009 the total budget provision by all agencies for specialist CAMHS in 2009-2010 was £7,161,237 (PCT - £658,705, local authority - £6,502,532). This equates to £48.85 per head of population under 18. The tables below show how Derbyshire compares to national and regional figures.
Table 34: Total budget for CAMHS services
(Figures taken from the CAMHS Mapping exercise and are self reported – there may be accuracy and data quality issues)
Total budget (2009-2010)
Derbyshire 7,161,237
Derby City CAMHS Partnership East
Mids681,546
North East 44,246,179
North West 58,536,302
Yorkshire and the Humber 46,775,540
East Midlands 45,951,715
West Midlands 49,641,304
East of England 46,414,195
London 81,950,097
South East Coast 39,872,471
South Central 37,742,006
South West 43,293,429
England 494,423,238
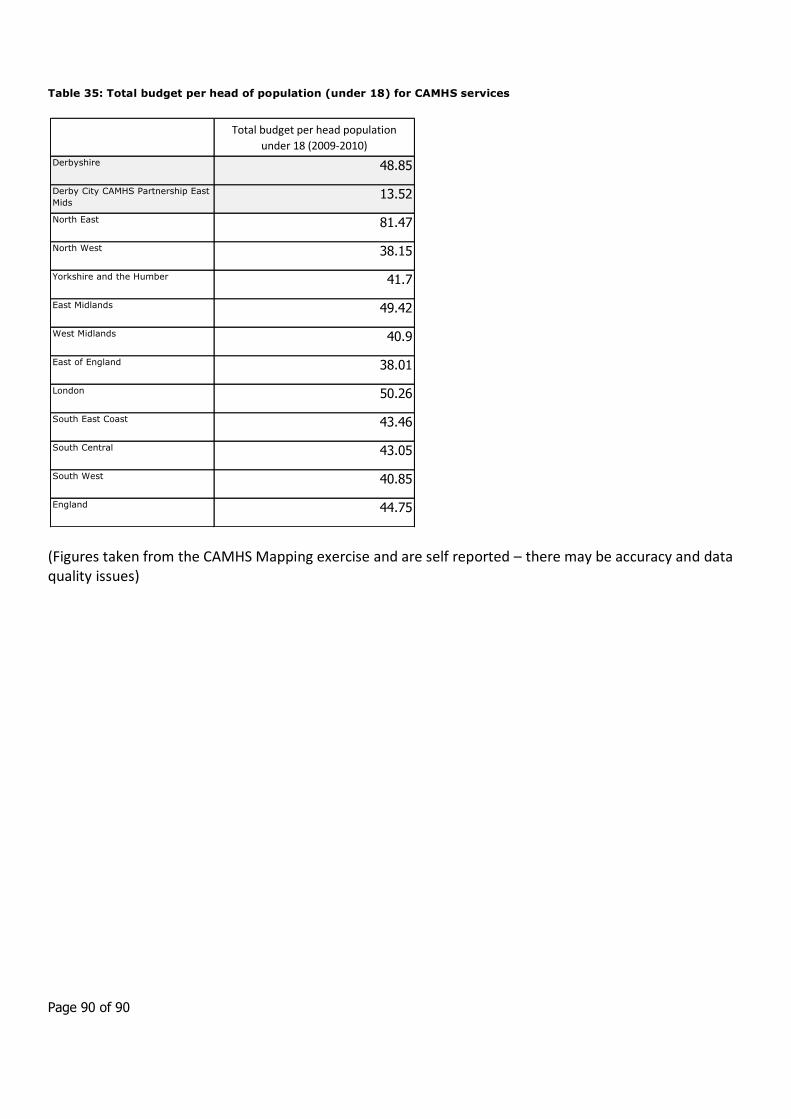
Page 90 of 90
Table 35: Total budget per head of population (under 18) for CAMHS services
(Figures taken from the CAMHS Mapping exercise and are self reported – there may be accuracy and data quality issues)
Total budget per head population
under 18 (2009-2010)
Derbyshire 48.85
Derby City CAMHS Partnership East
Mids13.52
North East 81.47
North West 38.15
Yorkshire and the Humber 41.7
East Midlands 49.42
West Midlands 40.9
East of England 38.01
London 50.26
South East Coast 43.46
South Central 43.05
South West 40.85
England 44.75