deployment and mobility for animal social life monitoring...
TRANSCRIPT
Deployment and Mobility for Animal Social LifeMonitoring Based on Preferential Attachment
Mustafa Ilhan Akbas∗, Matthias R. Brust∗, Carlos H.C. Ribeiro†, and Damla Turgut∗
∗Department of Electrical Engineering and Computer ScienceUniversity of Central Florida, Orlando FL
Email: {miakbas,mbrust,turgut}@eecs.ucf.edu
†Computer Science DivisionTechnological Institute of Aeronautics, Brazil
Email: [email protected]
Abstract—The effort and time spent in wild life monitoringincreases with the area and the number of objects to observe.Deployment of wireless sensor nodes enables a scalable samplingmethod and fine granularity of data collection. When we includeresource rich actor nodes the data collection and evaluation arefurther optimized. However realistic mobility data is missing forvarious animal species to develop prototypes of wireless networkbased monitoring systems.
In this paper, the problem of the absence of realistic data isconsidered from a social network perspective. Node deploymentand mobility algorithms are provided to model a complete systemof an animal swarm to be used for animal social life monitoring.A novel spatial cut-off preferential attachment model and centerof mass concept are used and extended for the models accordingto the characteristics of the animal swarms. In the applicationscenario of a gorilla swarm, each gorilla is equipped with a sensornode for the monitoring of the social system. The local interactionpatterns among the mobile nodes are also monitored throughoutthe network life time to observe the social interactions amonganimals and to determine the role of each animal in the society.The performance of the monitoring protocol and the applicabilityof the deployment and mobility models are presented throughextensive simulations.
I. INTRODUCTION
The continuous monitoring of animal groups in their naturalhabitat and captureing their distinctive behaviors involves tech-nically sophisticated planning, correct installation, successfulexecution, reliable data collection, and reasonable data inter-pretation. Due to the complexity of all these relevant processes,the conventional approaches for wild life monitoring have todeal with a number of challenges [1]. Most of the conventionalmethods used so far are highly invasive on the environmentand animals under study, which is difficult, in particular whenperiodical resampling is needed. In addition, it is crucial todecide on the correct sampling method that delivers the de-manded data for answering the research questions. Monitoringalso requires an appropriate design of the sampling processto guarantee accurate and precise measurements, which arechallenging especially when monitoring an animal populationchanging its habitat frequently. Additionally, the extra effort toplan and execute a monitoring project tremendously increases
with the area size and number of objects (animals) underinvestigation as well as the period of observation.
Making use of the most recent advances in wireless net-works can overcome many of these drawbacks and challenges.Wireless sensor and actor networks (WSANs) [2] consist oftiny sensor nodes sensing events in the environment, and alimited number of more powerful mobile actors, which canactively collect information from the sensor nodes, processthis information and react to the events.
A sensor node has limited data processing capability, trans-mission rate, energy, and memory. Actors, on the other hand,possess increased computation capabilities and wider commu-nication ranges while equipped with long lasting batteries andlarger memory compared to sensor nodes. Improvements insize, weight, energy and sensing capabilities of sensor nodesas well as the self-organizing aspects of the participating nodesmake WSANs suitable for wild life monitoring, in particularfor wild social life.
For various animal species, realistic movement data is miss-ing, yet needed for simulation studies to test such elaboratedwireless network based monitoring systems. Consequently, itis crucial to design a proper mobility model derived fromthe expected mobility patterns from the animal group underobservation.
In this paper, we describe data collection and evaluationalgorithms to provide a complete system of animal monitoringmodel for network deployment and mobility within a WSAN.More specifically, we consider the modelling and monitoringof the social life of animal swarms. We approach the problemof the absence of realistic data to model the movement patternsfrom a social network perspective. The preferential attachmentidea is used for node deployment and mobility. The existingpreferential attachment models do not have any limitation inthe node degree, which violets known attachment limitationsfor different members in a group. Therefore a contribution ofthis paper is to provide a cut-off preferential attachment modelbased on spatial relationship of the nodes.
We choose gorillas to model in this paper. Such animals
build and live in a hierarchal social network and a groupof gorillas belonging to the same social network is calleda “troop”. Many characteristics of the gorilla social life arealready known [3]. However, the lifespan of gorillas can varybetween 30 to 50 years with gorillas reproducing and leavingthe troop or constantly moving with the troop to new habitats,many more aspects of their social life remain unknown. Thegorilla troop has a strict social organization, and it remains achallenge for scientists to find out how they interact and howtheir affiliations might change without disturbing the troop dueto the presence of cameras or observers.
By equipping the gorillas with sensors, a WSAN can captureessential characteristics of each gorilla such as its interactionswith its environment or troop members, its movement, speed,and so on. The proposed protocols use the collection of thespatial-temporal relationships to decide on the role of eachanimal in the society automatically and locally.
This paper is an initial work and provides a base model fordeployment and mobility of gorilla troops. The approach pro-vides a model for the development of monitoring applications.The model is verified by known social features of the gorillasociety.
The remainder of this paper is organized as follows. Re-lated work is presented in Section 2. The system model ispresented in Section 3. The detailed descriptions of networkdeployment and node mobility are provided in Section 4. Thedata collection and directory formation are given in Section5. We present the simulation results in Section 6 and finallyconclude in Section 7.
II. RELATED WORK
A. Sensor deployment
There are various studies on the deployment of sensor nodesfor wild life animal monitoring and tracking. Environmentalscientists and zoologists have been increasingly using thesetechnologies to collect data from wild terrestrial areas andtransmit them to the remote databases [4]. In some of theseapplications, the sensor nodes are attached to the animals,forming an ad hoc wireless network of mobile nodes [5].
ZebraNet [6] is one of the initial examples of such studies,in which the animals carry custom tracking collars with GPScapability and form a mobile sensor network across a largearea. The collars include sensor nodes with global positioningsystem (GPS) capability, and they form a WSN to monitor thearea and record the data. Wark et al. [5] apply sensor networktechnology to farming and their approach also includes collarsworn by animals. This system utilizes both static and mobilenodes measuring the state of a complex, dynamic systemcomprising climate, soil, pasture, and animals. Naumowicz etal. [7] deployed a WSN on Skomer Island, Wales to improvethe investigation of the behavior and spatial ecology of theManx Shearwater seabirds. The system informs the scientistswith high resolution data about the arrival and departure of thebirds and the environmental parameters such as temperatureor humidity. Handcock et al. [8] uses a large cattle enterpriseto demonstrate the potential for combining GPS collars and
satellite images in a WSN. The implemented WSN is usedto monitor behavioral preferences and social behavior ofcattles in Northern Australia. There are also sensor networkapplications where the sensor nodes are implanted within theanimal body in order to monitor the functioning of the wholebody or a particular organ of the animal (see [9]).
B. Group and swarm mobility models
Gathering real field data is challenging for studies on ani-mal behavior. For instance, Fossey [10] conducted the initialstudies on the home ranges of the mountain gorillas and theirsocial interactions. Fossey’s observations include hand drawnmaps of mountain gorilla ranging paths that form the basis formovement patterns of the gorilla troops. The gorilla behaviorsand social interactions in troops are analyzed in a few studies[3], [11]. Due to the absence of public domain real data in thisarea, models for the generation of movement patterns must bedeveloped and used. A variety of mobility models have beenproposed for simulations of groups and swarms.
The Reference Point Group Mobility (RPGM) [12] by Honget al. describes mobility coherence in the movement of amobile host, i.e. hosts at different positions head towards thesame target. In RPGM each group has an own logical centerand similar to the concept of center of mass, the center’smotion defines the entire group’s motion behavior. The nodedeployment in RPGM is usually uniformly at random, but anynode deployment can be used to approach the reference point.Nodes in RPGM have their own random movement in additionto the group motion.
In the Virtual Track model (VT model) [13] by Zhou et al.,nodes follow so called “switch stations” that are deployed inthe map creating virtual tracks. Group nodes are distributedalong the virtual tracks and the individual nodes are deployedin the whole area. The switch stations have features allowingthe nodes to split into several groups after leaving the switchstation. These aspects can be often found in the mobility ofanimal swarms like birds or gorilla troops, which split whena new leader founds a new troop.
Musolesi et al. [14] approach the problem of the absenceof realistic data to model movement patterns from a socialperspective. Their model groups collection of nodes togetherbased on social relationships among the individuals. Thegroups are mapped to a topographical space, including thestrength of social ties. A node belonging to a group movesinside the corresponding group area towards a goal usingthe Random Waypoint model. Groups also move towardsrandomly chosen goals with random speeds. As in the modelof Hong et al. [12], Musolesi et al. [14] also permits changesin the group affiliation based on a particular parameter (socia-bility factor).
The deployment and mobility models introduced in thispaper use the “preferential attachment” concept, which isimplemented by Borrel et al. [15] for designing the mobilitymodel called Pragma. The preferential attachment was in-troduced by Barabasi and Albert [16] to explain a common
property of many large networks, according to which the ver-tex connectivities follow a scale-free power-law distribution.Pragma assumes preferential attachment to centers of interest,considering that “individuals” move towards “attractors”,which appear and disappear. Thus, the model describes inde-pendent nodes that exhibit a collective behavior. The authorsshow that Pragma achieves a scale-free spatial distribution inpopulation growth.
III. SYSTEM MODEL
A. Network model
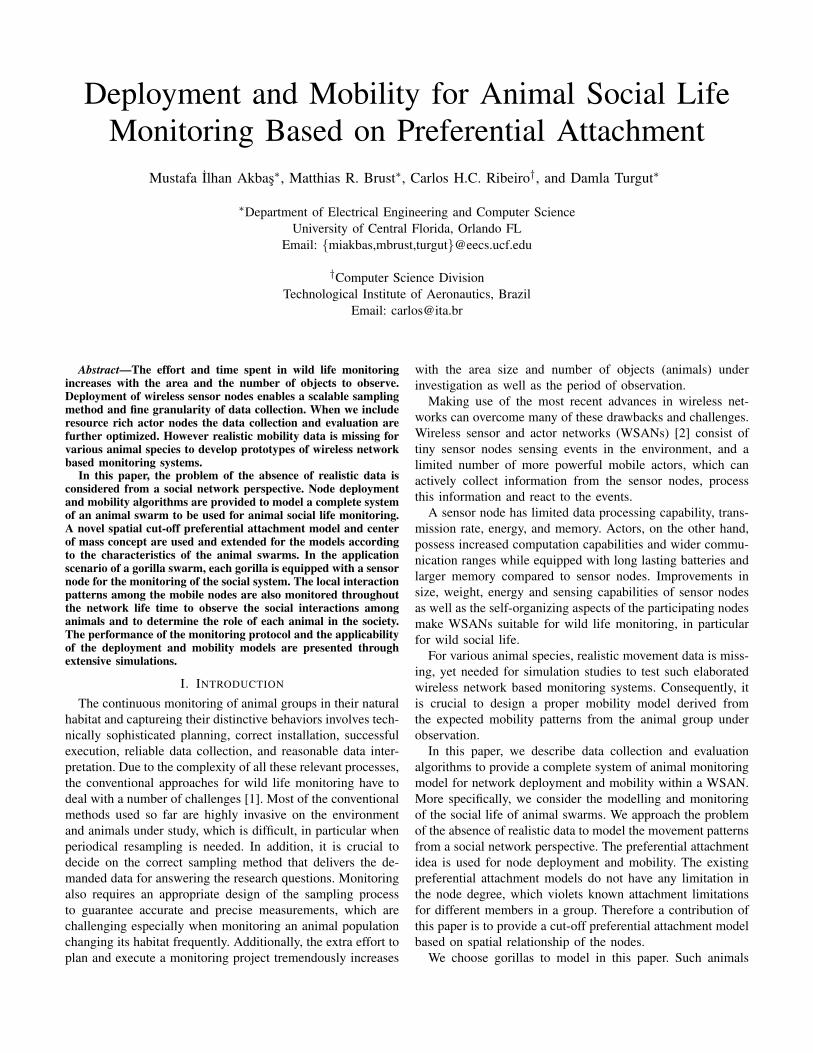
The animals in the network are equipped with sensor nodesexcept the troop leaders, which are equipped with the actors.On some rare points in the habitat, additional actors areinstalled at accessible points to collect data from the actornetwork when they are in transmission range. These actorsform the backbone of the network and work as the gatewaysfor the mobile network. Fig. 1 shows an example for such aWSAN implemented for a gorilla society.
Actor node Backbone connections
Ape sensor connections
Sink
Figure 1. Application scenario of gorillas.
All communication and packet exchange in the networkoccur only locally. When communicating with the sensornodes and creating the affiliation areas, the actors use thesame transmission range, rs, as the sensor nodes use whenthey exchange packets with their neighboring sensor nodes.Each actor encodes the transmitted packets with its ID andweight k to update the weight of the sensor nodes.
B. Gorilla social structure
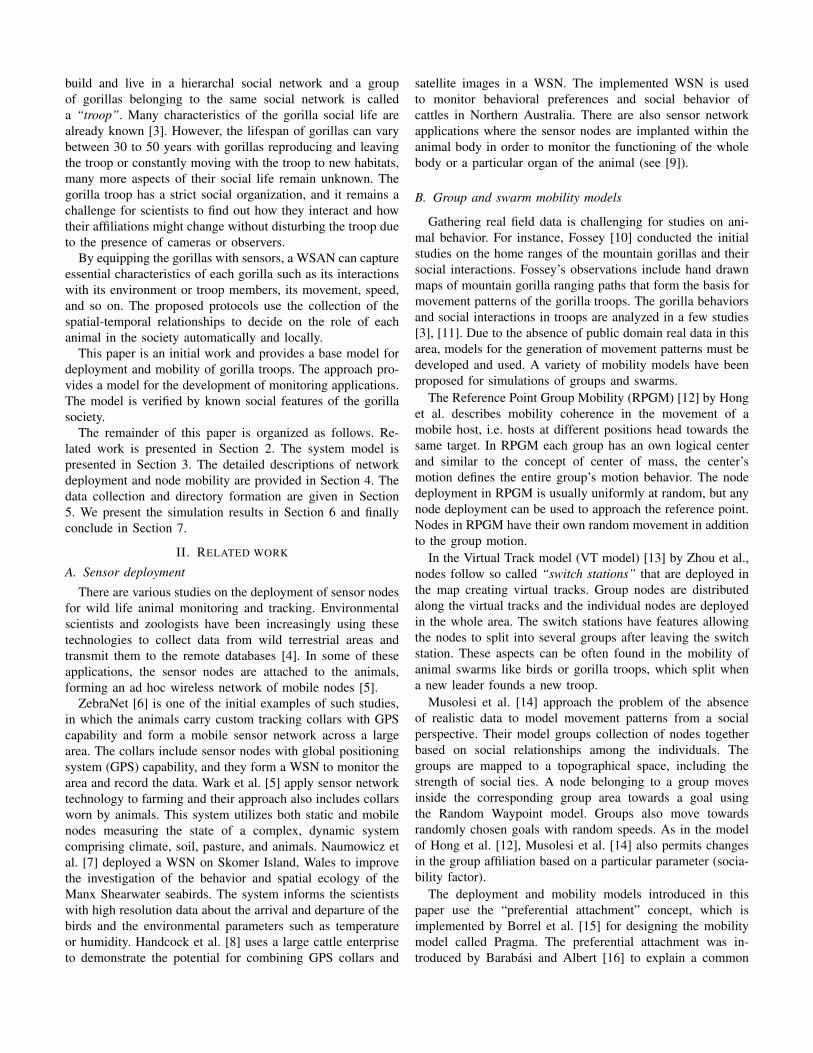
Gorillas live in socially organized troops. Animals in thetroop have different roles depending on the gender, age,strength and affinity. For instance the dominant, adult male,who leads the group in daily travels is called the silverbackand has exclusive breeding rights to the females. Generally,there is one leader silverback in each troop. Differently fromother primates, adult females do not interact with each otherand usually compete to groom and stay close to the silverback.There are three or four adult females in each troop in general.Blackbacks are the juvenile males and they usually do not
Troop
Solitary Male
Solitary Female
Bachelor Group of Males
Silverback Female
Female
Female
Blackback
Blackback
Offspring
Offspring
Offspring
Figure 2. Gorilla social structure.
get close to the silverback since the silverback can see themas threats to its authority. Maturing males usually leave theirfamily groups to establish either their own band or to joina bachelor group. Juvenile females stay closer to the troopcompared to blackbacks and may change family groups mul-tiple times until having an offspring. Newborns have strongrelationships with their mothers and stay very close for thenext three to four years. The roles of the individual animals inthe society build up a hierarchical structure, which is shownin Fig. 2 for our application scenario.
Gorillas have complex social lives with families, affections,and politics of their own. The behaviors of gorilla societiesand the social structure itself shows great variety. Thereforethe information and assumptions used in our approach followthe general guidelines, considering well known facts aboutgorillas. For instance they are not territorial, they form a newnest every night at the location where they reach by theirwalk during the day. These known properties are critical inputsfor the introduced deployment and mobility models. Differentanimal swarms can exhibit different social structures. Themodels presented in this paper provide a base model that canbe adapted accordingly.
IV. DEPLOYMENT AND MOBILITY
A. Network deployment
The distribution of nodes in the environment is one of thecritical factors attempting to model the structure of a society.In this paper, we introduce two approaches for initial networkdeployment. The first approach is based on the preferentialattachment method. The second approach uses the center ofmass concept combined with the information gathered fromthe literature on animal swarm.
1) Preferential attachment approach: The result of thedeployment of nodes according to this approach is a “scale-free” network. In scale-free networks, the distribution of thenumber of node connections follows a power law distribution.The frequency of an event has a power law distribution whenit varies as a power of some attribute of that event.
The network deployment is initialized by positioning twosensor nodes in the area such that they are in transmissionrange of each other. Let Gn be the resulting graph of the
network when the nth node (vn) is added to the existing nodesin the network. When obtaining Gn from Gn−1 according topreferential atatachment, the probability of adding a link fromvn to vi, P (i), is proportional to the degree (di) of vi.
The deployment model of our protocol extends the prefer-ential attachment to be used for animal societies. The socialstructure of most animals is clustered such that there are sub-groups in the entire animal group. For example the silverbackin a gorilla society is accompanied by one to four females,which are surrounded by their offspring almost all the timeand these youngsters generally do not exceed three. A newparameter, called “maximum degree” (dmax), is introduced toinclude these properties of the animal social structures.
The network is deployed according to the preferential at-tachment until one of the nodes has the “maximum degree”.When a node has a degree of dmax, it must not be eligible asa new deployed node for others to get connected. Therefore,the P (i) value of a node depends not only on its degree butalso on the dmax defined for the animal group. After the nodereaches dmax, the node’s P (i) is reduced to the value, Pc,which depends on the characteristics of the animal society.Hence the probability of adding a link from vn to vi is asfollows:
P (i) =
dn∑Ni=1 di
if di < dmax
Pc if di ≥ dmax
where di is the degree of the node i. The decision process onthe deployment of a new node joining the network is given inAlgorithm 1.
Algorithm 1 Deployment of a new node
1: S =∑N
1 di2: rs = Random number between 0 and S3: da = Degree of node a4: Nl = Number of leaders5: Nmax = Maximum number of leaders6: for Each node a in the area do7: if (da > rs) & (da = dmax − 1) then8: Connect the new node9: if Nl < Nmax then
10: Nl = Nl + 111: end if12: else if da > rs then13: Connect the new node14: end if15: rs = rs − da16: end for17: if The node not deployed then18: a is a solitary node19: end if
In our scenario, each gorilla in the network can be connectedto only one silverback and there cannot be a link between twosilverbacks. Hence the links against these rules are removed.
n=2 n=11 n=21
n=30 30 nodes with assigned roles
(a) (b) (c)
(d) (e)
Figure 3. Deployment of nodes by preferential attachment based method.
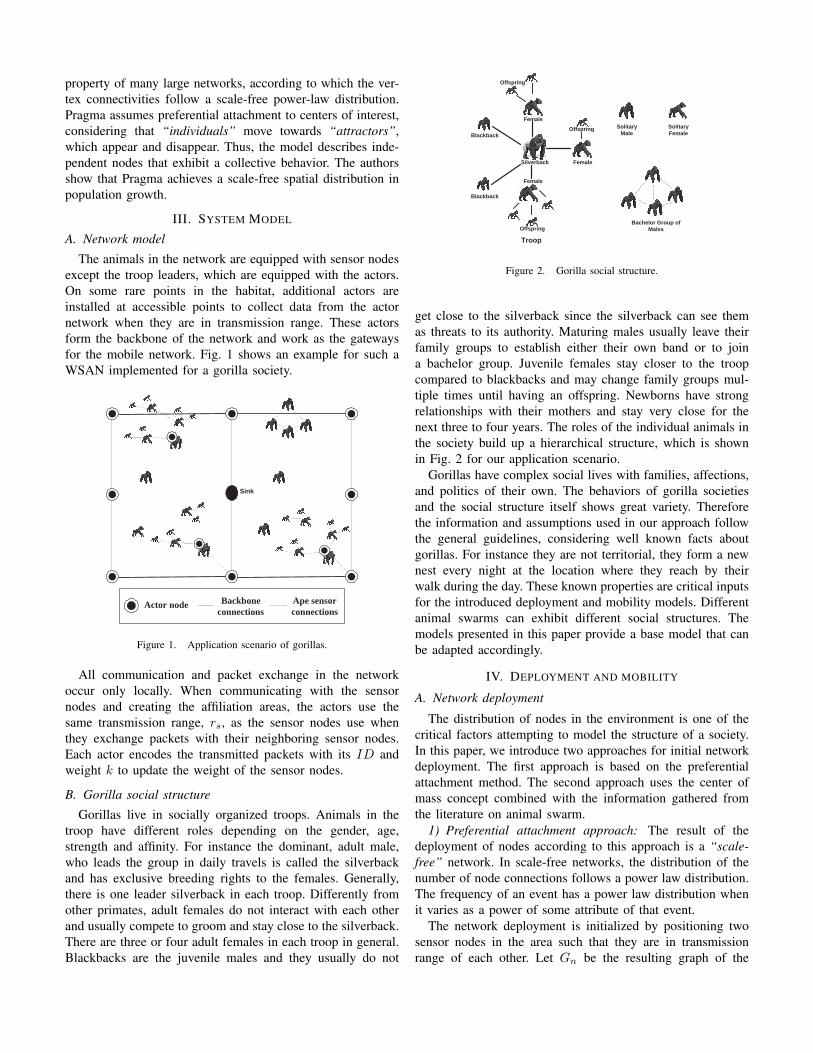
The preferential attachment based deployment method canbe extended by adding more species-specific features. Forinstance, as a gorilla troop moves in its environment, theleader of the troop avoids close encounters with other troops.Therefore some of the links are removed after the nodes aredeployed and the roles are assigned.
Fig. 3 shows an example sequence for network deployment.In this scenario, dmax and Pc are taken as five and zerorespectively. Hence the nodes having a degree of dmax duringdeployment are no longer candidates for new nodes to getconnected. In Fig. 3 (e), the roles assigned to the nodes areshown. There are two silverbacks in the society and it canbe seen in the previous frame that they are connected by alink (plotted thicker). This link is removed after the roles areassigned according to the gorilla-specific rule stating that therecannot be a link between two silverbacks.
2) Center of mass based approach: In this approach, thenodes are distributed in the area according to a predefinedstructure. This structure depends on the type of the speciesunder observation and it is defined by the ratio among thespecific roles in the society.
The center of mass concept of physics is used in accordancewith the hierarchy in the animal society. The animal societyis divided into subgroups such that each subgroup’s center ofmass is their leader from the higher level group. For instance,the breeding females form a group and their center of mass istaken as the silverback. Similarly, a mother gorilla is chosen asthe center of mass for its offspring. This method is applicableto and modifiable for any animal swarm. According to thecenter of mass approach, the coordinates of the nodes aroundthe leader must satisfy the following equations:
xs =N∑i=1
xi
Nys =
N∑i=1
yiN
where (xs, ys) is the position of the leader and N is the
number of nodes in that subgroup. This method is extendablefor different scenarios. For instance if a mother has fourinfants, the possible positions of these nodes can be limiteddepending on their ages so that two of them will be very closeto the mother whereas the others keep a larger distance fromher.
B. Mobility model
Levy walk is observed as the mobility model in most ofthe animal foraging patterns, such as jackals [17] or spidermonkeys [18] and it is recognized as an optimal way to findrandomly dispersed objects [19]. It is a random walk withstep-lengths distributed according to a heavy-tailed probabilitydistribution. Levy walks are Markov processes and after a largenumber of steps, the distance from the origin of the randomwalk tends to be reach stable distribution. Levy distribution isthe Fourier transformation of the moving distance of a singlerandom walk and Rhee et al. [20] gives its PDF as follows:
fz,α(x) =1
2π
∫ ∞
−∞e−iztϕ(t)dt
where ϕ(t) = e−|Ct|α and C is a constant.The distribution can be approximated by a power law of the
form y = x−α where 0 < α < 2. Each step in Levy walk canbe expressed by a tuple L = (1, θ,∆tf ,∆tp). ∆tf indicatesthe duration and it is chosen for each walk from a probabilitydistribution P (l). ∆tp specifies pause time at the end of awalk and θ is the random direction taken by a node. A Levywalk contains many short walks and a small number of longwalks. The resulting pattern of depends highly on the valueof α used in the system. As α becomes greater, the numberof short walks increases.
One of the most common behaviors observed in diversespecies is that they live in groups and follow the leaders oftheir groups. Scientists have various explanations such as theincreased safety or breeding opportunities in a group for thesebehaviors. In nature, the silverback makes the decisions for theselection of paths that the troop follows. The silverback role ina troop is assigned to a node in the network deployment phaseof our scenario. Similarly, the mobility model of the troopdepends on the movements of the silverback in both of themobility models introduced. The silverback moves accordingto Levy walk and the movements of other members of thetroop are directed mainly by the silverback’s path. This pathis used as the main input when positioning the nodes at eachtime instant. Two additional methods supplementary to Levywalk are used to determine the mobility of each node.
1) Preferential attachment based method: This methodcomplements the preferential attachment based deployment.After the nodes are deployed, based on the moves of the nodesleading their corresponding groups, the moving directions ofthe other nodes are probabilistically decided. The probabilityis defined according to the nodes’ roles and levels of proximityto their group leaders. Since the deployment attributes ofnodes such as their assigned degrees and roles determine theirinitial positions, these attributes and therefore the preferential
d 1
d 2
r
P m (1)
2 P m (2)
1
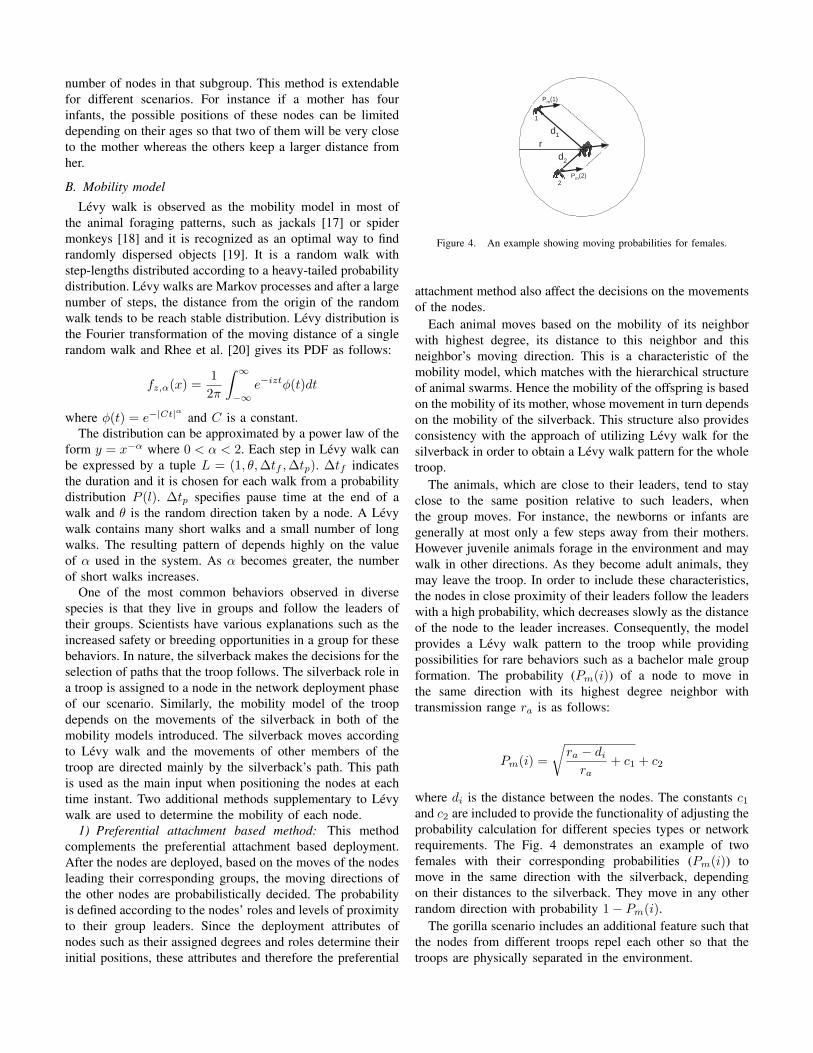
Figure 4. An example showing moving probabilities for females.
attachment method also affect the decisions on the movementsof the nodes.
Each animal moves based on the mobility of its neighborwith highest degree, its distance to this neighbor and thisneighbor’s moving direction. This is a characteristic of themobility model, which matches with the hierarchical structureof animal swarms. Hence the mobility of the offspring is basedon the mobility of its mother, whose movement in turn dependson the mobility of the silverback. This structure also providesconsistency with the approach of utilizing Levy walk for thesilverback in order to obtain a Levy walk pattern for the wholetroop.
The animals, which are close to their leaders, tend to stayclose to the same position relative to such leaders, whenthe group moves. For instance, the newborns or infants aregenerally at most only a few steps away from their mothers.However juvenile animals forage in the environment and maywalk in other directions. As they become adult animals, theymay leave the troop. In order to include these characteristics,the nodes in close proximity of their leaders follow the leaderswith a high probability, which decreases slowly as the distanceof the node to the leader increases. Consequently, the modelprovides a Levy walk pattern to the troop while providingpossibilities for rare behaviors such as a bachelor male groupformation. The probability (Pm(i)) of a node to move inthe same direction with its highest degree neighbor withtransmission range ra is as follows:
Pm(i) =
√ra − di
ra+ c1 + c2
where di is the distance between the nodes. The constants c1and c2 are included to provide the functionality of adjusting theprobability calculation for different species types or networkrequirements. The Fig. 4 demonstrates an example of twofemales with their corresponding probabilities (Pm(i)) tomove in the same direction with the silverback, dependingon their distances to the silverback. They move in any otherrandom direction with probability 1− Pm(i).
The gorilla scenario includes an additional feature such thatthe nodes from different troops repel each other so that thetroops are physically separated in the environment.
2) Center of mass based method: This method is used todetermine the positions of all animals at each time instantafter the deployment of the nodes according to center of massapproach and the determination of the main path of the troop.A node’s neighbors at hierarchically one lower level move in acoordinated fashion to have that node’s position as their centerof mass at all times.
This method allows a more controlled mobile networkcompared to the preferential attachment based method sincethe hierarchical structure of the system remains in its initialformat throughout the network lifetime.
V. DATA COLLECTION AND INTERPRETATION
The data collected from animal monitoring systems areutilized for the interpretation of the social behavior of animals.Therefore the animal social structure must be utilized inthe design of the data collection algorithms. The silverbacksbecome the natural clusterheads of their troops and the sensornodes are affiliated with stationary and mobile actors in thenetwork. According to a sensor node’s affiliation and thecluster structure, the weight value of each sensor node isupdated via local communication.
The network structure is formed and maintained by thestate-transition rules defined only by local information. Thenodes rapidly update their attributes as the network structurechanges. A sensor node keeps only the maximum weight foreach actor it receives packets from and it does not build a stateor history of the whole network. When a sensor node receivesa packet from an actor, the packet is retransmitted if its weightis less than the sensor node’s weight for that actor. Otherwise,the sensor node drops the packet to avoid unnecessary trafficand energy consumption in the network. The weight WA(s) ofeach affiliation corresponds to k-hop distance of a node to anactor. The condition, in which a sensor node does not receiveany weight updates, is defined as the loss of connection forthe sensor node, which may refer to a solitary animal. In thatcase, the sensor node sets its hop value to the minimum valuedefined for the network. Then it operates only in listeningmode and does not transmit any packets.
The spatial proximity is the main parameter to decide on theweights of the sensor nodes. The weight information for thenodes in a troop is collected at the corresponding mobile actorand transferred to the backbone whenever it is possible. Thetransmission range, time and cardinality are the parametersdefining the rules for role assignment of the animals. Thethresholds of these values can be generalized according tothe animal group under observation while the rules are veryspecific for the social network of gorillas. Algorithm 2 givesthe basic role determination process and the utilized rules.
VI. SIMULATION STUDY
A. Simulation environment
We conducted extensive simulation experiment in the OP-NET modeler [21]. The actors and sensor nodes are designedsuch that IEEE 802.11 is used as the underlying MAC layer.The transmission range of a sensor node is taken as 10 meters.
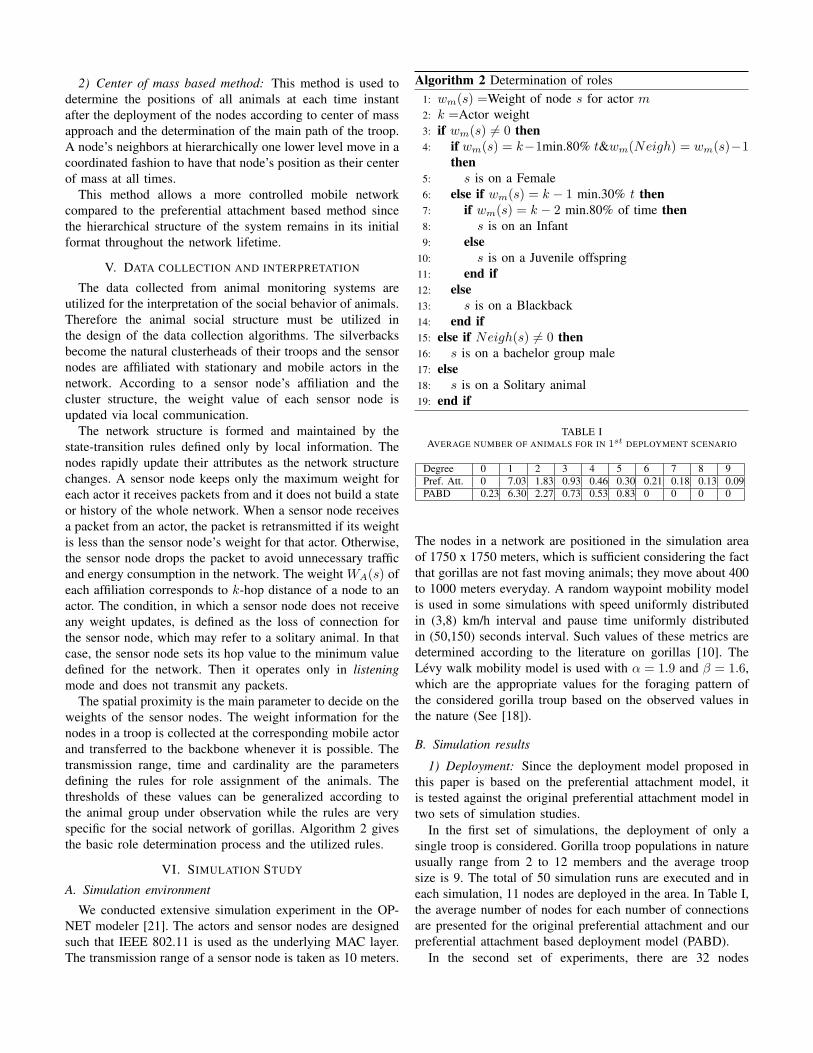
Algorithm 2 Determination of roles1: wm(s) =Weight of node s for actor m2: k =Actor weight3: if wm(s) = 0 then4: if wm(s) = k−1min.80% t&wm(Neigh) = wm(s)−1
then5: s is on a Female6: else if wm(s) = k − 1 min.30% t then7: if wm(s) = k − 2 min.80% of time then8: s is on an Infant9: else
10: s is on a Juvenile offspring11: end if12: else13: s is on a Blackback14: end if15: else if Neigh(s) = 0 then16: s is on a bachelor group male17: else18: s is on a Solitary animal19: end if
TABLE IAVERAGE NUMBER OF ANIMALS FOR IN 1st DEPLOYMENT SCENARIO
Degree 0 1 2 3 4 5 6 7 8 9Pref. Att. 0 7.03 1.83 0.93 0.46 0.30 0.21 0.18 0.13 0.09PABD 0.23 6.30 2.27 0.73 0.53 0.83 0 0 0 0
The nodes in a network are positioned in the simulation areaof 1750 x 1750 meters, which is sufficient considering the factthat gorillas are not fast moving animals; they move about 400to 1000 meters everyday. A random waypoint mobility modelis used in some simulations with speed uniformly distributedin (3,8) km/h interval and pause time uniformly distributedin (50,150) seconds interval. Such values of these metrics aredetermined according to the literature on gorillas [10]. TheLevy walk mobility model is used with α = 1.9 and β = 1.6,which are the appropriate values for the foraging pattern ofthe considered gorilla troup based on the observed values inthe nature (See [18]).
B. Simulation results
1) Deployment: Since the deployment model proposed inthis paper is based on the preferential attachment model, itis tested against the original preferential attachment model intwo sets of simulation studies.
In the first set of simulations, the deployment of only asingle troop is considered. Gorilla troop populations in natureusually range from 2 to 12 members and the average troopsize is 9. The total of 50 simulation runs are executed and ineach simulation, 11 nodes are deployed in the area. In Table I,the average number of nodes for each number of connectionsare presented for the original preferential attachment and ourpreferential attachment based deployment model (PABD).
In the second set of experiments, there are 32 nodes
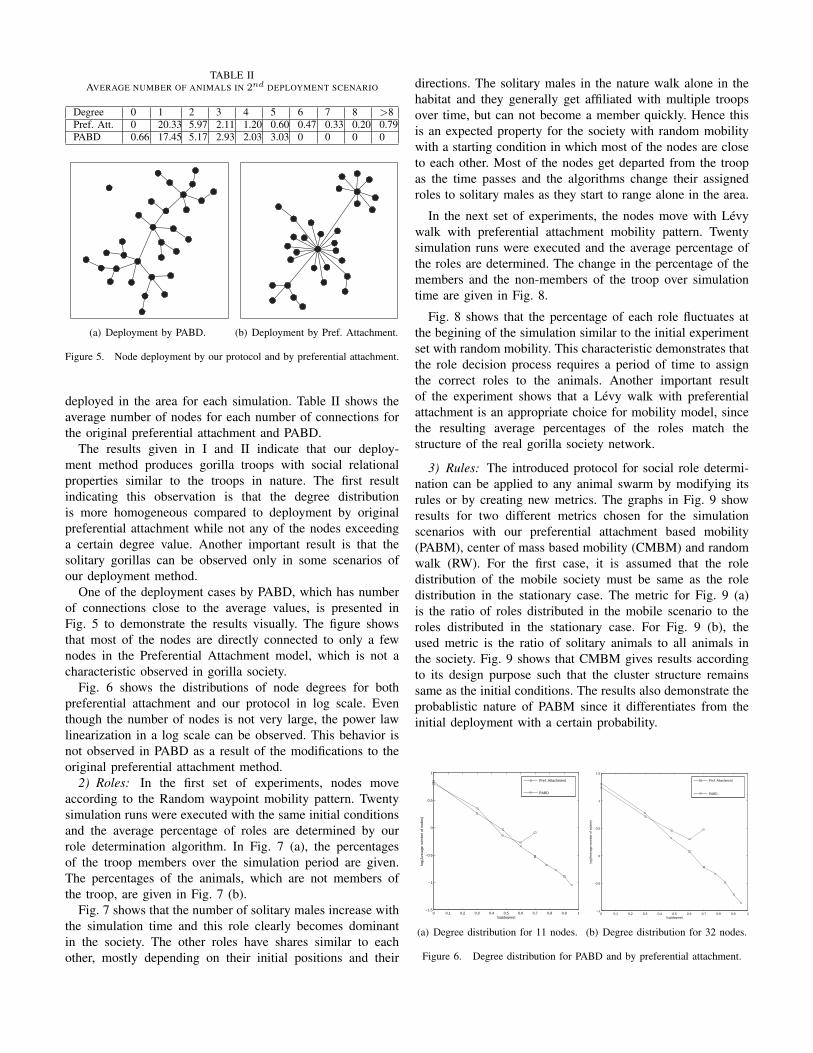
TABLE IIAVERAGE NUMBER OF ANIMALS IN 2nd DEPLOYMENT SCENARIO
Degree 0 1 2 3 4 5 6 7 8 >8Pref. Att. 0 20.33 5.97 2.11 1.20 0.60 0.47 0.33 0.20 0.79PABD 0.66 17.45 5.17 2.93 2.03 3.03 0 0 0 0
(a) Deployment by PABD. (b) Deployment by Pref. Attachment.
Figure 5. Node deployment by our protocol and by preferential attachment.
deployed in the area for each simulation. Table II shows theaverage number of nodes for each number of connections forthe original preferential attachment and PABD.
The results given in I and II indicate that our deploy-ment method produces gorilla troops with social relationalproperties similar to the troops in nature. The first resultindicating this observation is that the degree distributionis more homogeneous compared to deployment by originalpreferential attachment while not any of the nodes exceedinga certain degree value. Another important result is that thesolitary gorillas can be observed only in some scenarios ofour deployment method.
One of the deployment cases by PABD, which has numberof connections close to the average values, is presented inFig. 5 to demonstrate the results visually. The figure showsthat most of the nodes are directly connected to only a fewnodes in the Preferential Attachment model, which is not acharacteristic observed in gorilla society.
Fig. 6 shows the distributions of node degrees for bothpreferential attachment and our protocol in log scale. Eventhough the number of nodes is not very large, the power lawlinearization in a log scale can be observed. This behavior isnot observed in PABD as a result of the modifications to theoriginal preferential attachment method.
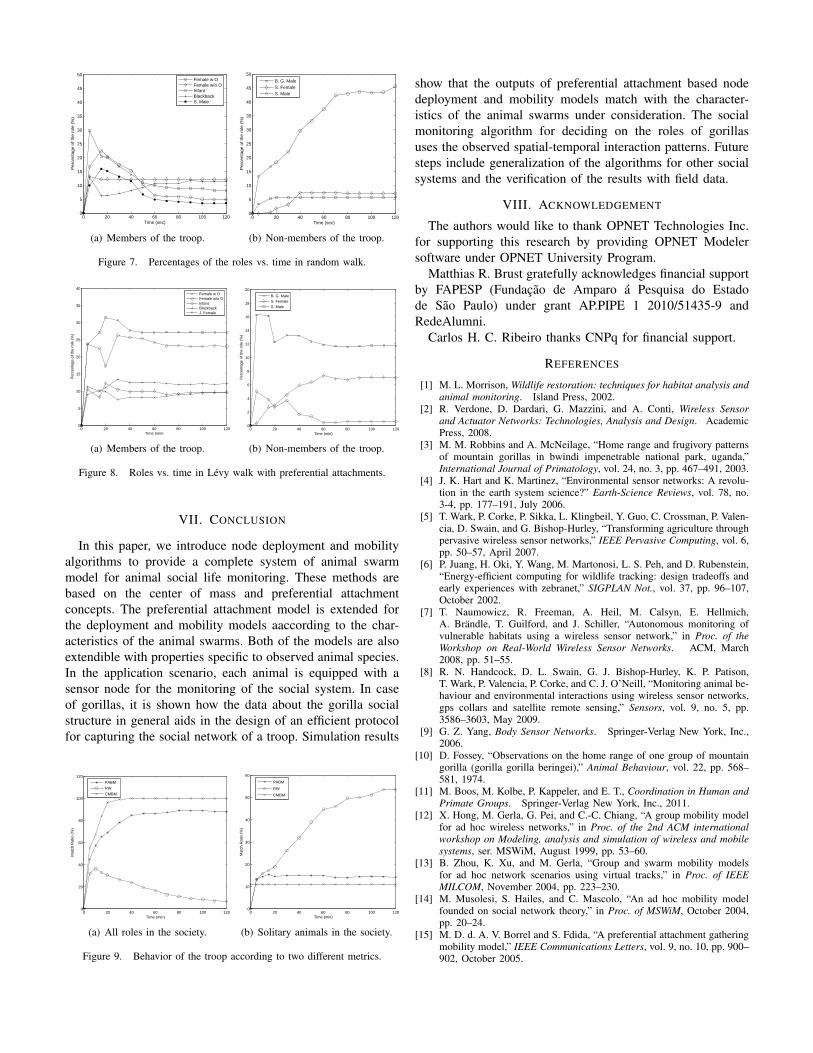
2) Roles: In the first set of experiments, nodes moveaccording to the Random waypoint mobility pattern. Twentysimulation runs were executed with the same initial conditionsand the average percentage of roles are determined by ourrole determination algorithm. In Fig. 7 (a), the percentagesof the troop members over the simulation period are given.The percentages of the animals, which are not members ofthe troop, are given in Fig. 7 (b).
Fig. 7 shows that the number of solitary males increase withthe simulation time and this role clearly becomes dominantin the society. The other roles have shares similar to eachother, mostly depending on their initial positions and their
directions. The solitary males in the nature walk alone in thehabitat and they generally get affiliated with multiple troopsover time, but can not become a member quickly. Hence thisis an expected property for the society with random mobilitywith a starting condition in which most of the nodes are closeto each other. Most of the nodes get departed from the troopas the time passes and the algorithms change their assignedroles to solitary males as they start to range alone in the area.
In the next set of experiments, the nodes move with Levywalk with preferential attachment mobility pattern. Twentysimulation runs were executed and the average percentage ofthe roles are determined. The change in the percentage of themembers and the non-members of the troop over simulationtime are given in Fig. 8.
Fig. 8 shows that the percentage of each role fluctuates atthe begining of the simulation similar to the initial experimentset with random mobility. This characteristic demonstrates thatthe role decision process requires a period of time to assignthe correct roles to the animals. Another important resultof the experiment shows that a Levy walk with preferentialattachment is an appropriate choice for mobility model, sincethe resulting average percentages of the roles match thestructure of the real gorilla society network.
3) Rules: The introduced protocol for social role determi-nation can be applied to any animal swarm by modifying itsrules or by creating new metrics. The graphs in Fig. 9 showresults for two different metrics chosen for the simulationscenarios with our preferential attachment based mobility(PABM), center of mass based mobility (CMBM) and randomwalk (RW). For the first case, it is assumed that the roledistribution of the mobile society must be same as the roledistribution in the stationary case. The metric for Fig. 9 (a)is the ratio of roles distributed in the mobile scenario to theroles distributed in the stationary case. For Fig. 9 (b), theused metric is the ratio of solitary animals to all animals inthe society. Fig. 9 shows that CMBM gives results accordingto its design purpose such that the cluster structure remainssame as the initial conditions. The results also demonstrate theprobablistic nature of PABM since it differentiates from theinitial deployment with a certain probability.
0 0.1 0.2 0.3 0.4 0.5 0.6 0.7 0.8 0.9 1−1.5
−1
−0.5
0
0.5
1
log(degree)
log(
Ave
rage
num
ber
of n
odes
)
Pref. Attachment
PABD
(a) Degree distribution for 11 nodes.
0 0.1 0.2 0.3 0.4 0.5 0.6 0.7 0.8 0.9 1−1
−0.5
0
0.5
1
1.5
log(degree)
log(
Ave
rage
num
ber
of n
odes
)
Pref. Attachment
PABD
(b) Degree distribution for 32 nodes.
Figure 6. Degree distribution for PABD and by preferential attachment.
0 20 40 60 80 100 1200
5
10
15
20
25
30
35
40
45
50
Time (sec)
Per
cent
age
of th
e ro
le (
%)
Female w OFemale w/o OInfantBlackbackS. Male
(a) Members of the troop.
0 20 40 60 80 100 1200
5
10
15
20
25
30
35
40
45
50
Time (sec)
Per
cent
age
of th
e ro
le (
%)
B. G. MaleS. FemaleS. Male
(b) Non-members of the troop.
Figure 7. Percentages of the roles vs. time in random walk.
0 20 40 60 80 100 1200
5
10
15
20
25
30
35
40
Time (min)
Per
cent
age
of th
e ro
le (
%)
Female w OFemale w/o OInfantBlackbackJ. Female
(a) Members of the troop.
0 20 40 60 80 100 1200
2
4
6
8
10
12
14
16
18
20
Time (min)
Per
cent
age
of th
e ro
le (
%)
B. G. MaleS. FemaleS. Male
(b) Non-members of the troop.
Figure 8. Roles vs. time in Levy walk with preferential attachments.
VII. CONCLUSION
In this paper, we introduce node deployment and mobilityalgorithms to provide a complete system of animal swarmmodel for animal social life monitoring. These methods arebased on the center of mass and preferential attachmentconcepts. The preferential attachment model is extended forthe deployment and mobility models aaccording to the char-acteristics of the animal swarms. Both of the models are alsoextendible with properties specific to observed animal species.In the application scenario, each animal is equipped with asensor node for the monitoring of the social system. In caseof gorillas, it is shown how the data about the gorilla socialstructure in general aids in the design of an efficient protocolfor capturing the social network of a troop. Simulation results
0 20 40 60 80 100 1200
20
40
60
80
100
120
Time (min)
Mat
ch R
atio
(%
)
PABM
RW
CMBM
(a) All roles in the society.
0 20 40 60 80 100 1200
10
20
30
40
50
60
Time (min)
Mat
ch R
atio
(%
)
PABM
RW
CMBM
(b) Solitary animals in the society.
Figure 9. Behavior of the troop according to two different metrics.
show that the outputs of preferential attachment based nodedeployment and mobility models match with the character-istics of the animal swarms under consideration. The socialmonitoring algorithm for deciding on the roles of gorillasuses the observed spatial-temporal interaction patterns. Futuresteps include generalization of the algorithms for other socialsystems and the verification of the results with field data.
VIII. ACKNOWLEDGEMENT
The authors would like to thank OPNET Technologies Inc.for supporting this research by providing OPNET Modelersoftware under OPNET University Program.
Matthias R. Brust gratefully acknowledges financial supportby FAPESP (Fundacao de Amparo a Pesquisa do Estadode Sao Paulo) under grant AP.PIPE 1 2010/51435-9 andRedeAlumni.
Carlos H. C. Ribeiro thanks CNPq for financial support.
REFERENCES
[1] M. L. Morrison, Wildlife restoration: techniques for habitat analysis andanimal monitoring. Island Press, 2002.
[2] R. Verdone, D. Dardari, G. Mazzini, and A. Conti, Wireless Sensorand Actuator Networks: Technologies, Analysis and Design. AcademicPress, 2008.
[3] M. M. Robbins and A. McNeilage, “Home range and frugivory patternsof mountain gorillas in bwindi impenetrable national park, uganda,”International Journal of Primatology, vol. 24, no. 3, pp. 467–491, 2003.
[4] J. K. Hart and K. Martinez, “Environmental sensor networks: A revolu-tion in the earth system science?” Earth-Science Reviews, vol. 78, no.3-4, pp. 177–191, July 2006.
[5] T. Wark, P. Corke, P. Sikka, L. Klingbeil, Y. Guo, C. Crossman, P. Valen-cia, D. Swain, and G. Bishop-Hurley, “Transforming agriculture throughpervasive wireless sensor networks,” IEEE Pervasive Computing, vol. 6,pp. 50–57, April 2007.
[6] P. Juang, H. Oki, Y. Wang, M. Martonosi, L. S. Peh, and D. Rubenstein,“Energy-efficient computing for wildlife tracking: design tradeoffs andearly experiences with zebranet,” SIGPLAN Not., vol. 37, pp. 96–107,October 2002.
[7] T. Naumowicz, R. Freeman, A. Heil, M. Calsyn, E. Hellmich,A. Brandle, T. Guilford, and J. Schiller, “Autonomous monitoring ofvulnerable habitats using a wireless sensor network,” in Proc. of theWorkshop on Real-World Wireless Sensor Networks. ACM, March2008, pp. 51–55.
[8] R. N. Handcock, D. L. Swain, G. J. Bishop-Hurley, K. P. Patison,T. Wark, P. Valencia, P. Corke, and C. J. O’Neill, “Monitoring animal be-haviour and environmental interactions using wireless sensor networks,gps collars and satellite remote sensing,” Sensors, vol. 9, no. 5, pp.3586–3603, May 2009.
[9] G. Z. Yang, Body Sensor Networks. Springer-Verlag New York, Inc.,2006.
[10] D. Fossey, “Observations on the home range of one group of mountaingorilla (gorilla gorilla beringei),” Animal Behaviour, vol. 22, pp. 568–581, 1974.
[11] M. Boos, M. Kolbe, P. Kappeler, and E. T., Coordination in Human andPrimate Groups. Springer-Verlag New York, Inc., 2011.
[12] X. Hong, M. Gerla, G. Pei, and C.-C. Chiang, “A group mobility modelfor ad hoc wireless networks,” in Proc. of the 2nd ACM internationalworkshop on Modeling, analysis and simulation of wireless and mobilesystems, ser. MSWiM, August 1999, pp. 53–60.
[13] B. Zhou, K. Xu, and M. Gerla, “Group and swarm mobility modelsfor ad hoc network scenarios using virtual tracks,” in Proc. of IEEEMILCOM, November 2004, pp. 223–230.
[14] M. Musolesi, S. Hailes, and C. Mascolo, “An ad hoc mobility modelfounded on social network theory,” in Proc. of MSWiM, October 2004,pp. 20–24.
[15] M. D. d. A. V. Borrel and S. Fdida, “A preferential attachment gatheringmobility model,” IEEE Communications Letters, vol. 9, no. 10, pp. 900–902, October 2005.
[16] A. L. Barabasi and R. Albert, “Emergence of scaling in randomnetworks,” Science, vol. 286, no. 5439, pp. 509–512, October 1999.
[17] R. P. D. Atkinson, C. J. Rhodes, D. W. Macdonald, and R. M. Anderson,“Scale-free dynamics in the movement patterns of jackals,” OIKOS,vol. 98, pp. 134–140, July 2002.
[18] J. Ramos-Fernandez, L. Morales, O. Miramontes, G. Cocho, H. Larralde,and B. Ayala-Orozco, “Levy walk patterns in the foraging movementsof spider monkeys (ateles geoffroyi),” Behavioural Ecology and Socio-biology, vol. 55, pp. 223–230, 2004.
[19] G. M. Viswanathan, S. V. Buldyrev, S. Havlin, M. da Luz, E. P. Raposo,and H. E. Stanley, “Optimizing the success of random searches,” Nature,vol. 401, pp. 911–914, October 1999.
[20] I. Rhee, M. Shin, S. Hong, K. Lee, and S. Chong, “On the Levy-walknature of human mobility,” in Proc. of IEEE INFOCOM, April 2008,pp. 924–932.
[21] “Opnet modeler,” http://www.opnet.com.