department of the interior bureau of indian … of the interior bureau of indian affairs choctaw...
TRANSCRIPT
DEPARTMENT OF THE INTERIORBureau of Indian Affairs
Choctaw Decision SchoolsContract Support Cost
FY 2010
APPENDIX B
1
A B C D E F G H I J K L M N O= (C) - (D) = (E) x (F) = J / I = > of H or I =IF(H>I, (H-I), 0) = M - (I + L)
No. Choctaw Decision (P.L. 100-297) SchoolsTotal FY10 BIE Direct Program
LESS (-) Other Exclusions and Pass-Through
FY10 Direct Cost Base
Most Current Approved IDC
Rate Applicable to
FY10 Basis of IDC RateFY10 Rate Based
IDC Need
FY10 Administrative
Cost Grant Need (100%)
FY10 Administrative Cost Grant Amount
PAID -
(Memo Only)
Percent of Administrative
Cost Grant Need Funded
- (Memo Only)
FY10 IDC PAID for BIA ISEP Formula Funded Program (Per Choctaw Decision) Linked to Column (W) in the BIA CSC
Spreadsheets for Non-School Programs
Greater of Column H or Column I
FY10 IDC Need for BIA ISEP Formula Funded Program (Per Choctaw Decision) Linked to Column (V) in the BIA CSC
Spreadsheets for Non-School Programs
FY10 IDC SHORTFALL for BIA ISEP Formula Funded Program
(Per Choctaw Decision) Linked to Column (X) in the BIA
CSC Spreadsheets for Non-School Programs
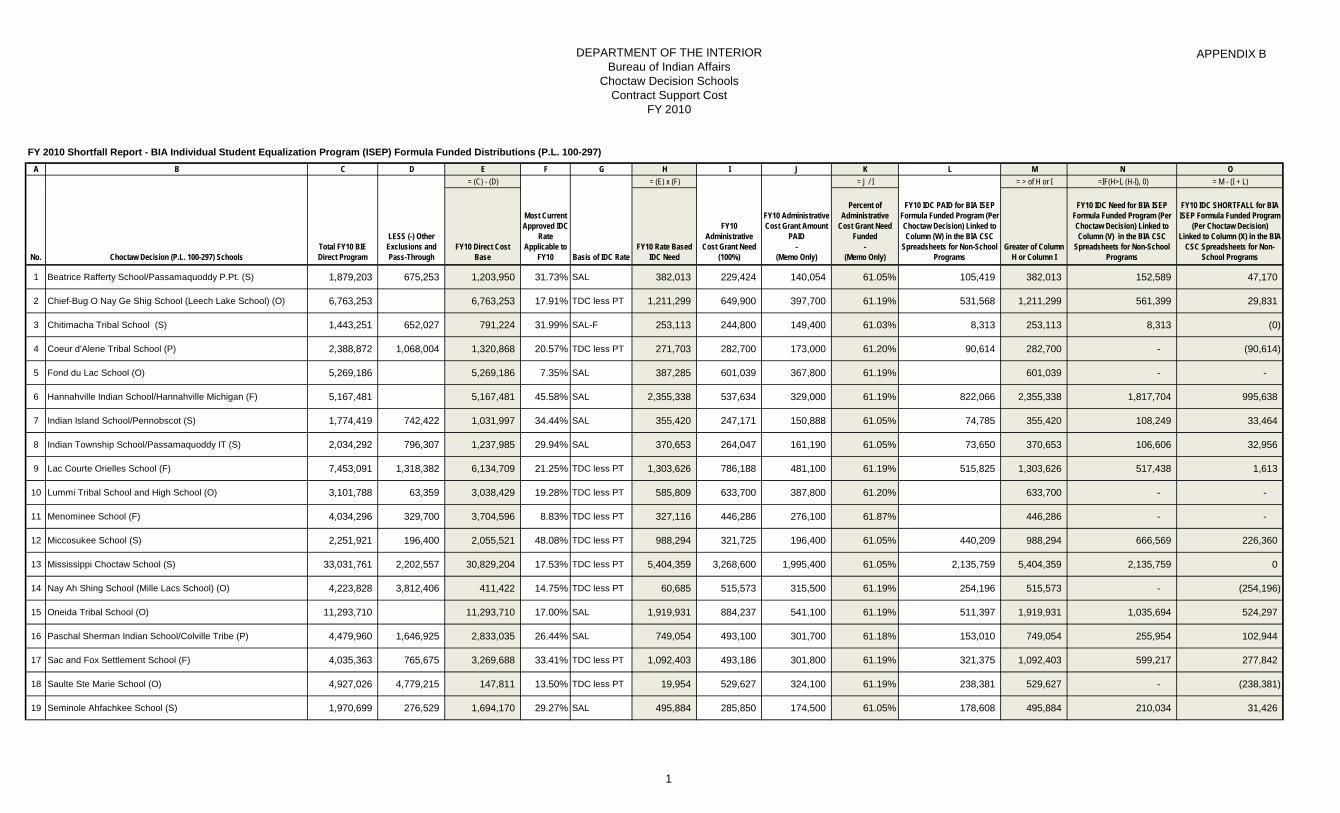
1 Beatrice Rafferty School/Passamaquoddy P.Pt. (S) 1,879,203 675,253 1,203,950 31.73% SAL 382,013 229,424 140,054 61.05% 105,419 382,013 152,589 47,170
2 Chief-Bug O Nay Ge Shig School (Leech Lake School) (O) 6,763,253 6,763,253 17.91% TDC less PT 1,211,299 649,900 397,700 61.19% 531,568 1,211,299 561,399 29,831
3 Chitimacha Tribal School (S) 1,443,251 652,027 791,224 31.99% SAL-F 253,113 244,800 149,400 61.03% 8,313 253,113 8,313 (0)
4 Coeur d'Alene Tribal School (P) 2,388,872 1,068,004 1,320,868 20.57% TDC less PT 271,703 282,700 173,000 61.20% 90,614 282,700 - (90,614)
5 Fond du Lac School (O) 5,269,186 5,269,186 7.35% SAL 387,285 601,039 367,800 61.19% 601,039 - -
6 Hannahville Indian School/Hannahville Michigan (F) 5,167,481 5,167,481 45.58% SAL 2,355,338 537,634 329,000 61.19% 822,066 2,355,338 1,817,704 995,638
7 Indian Island School/Pennobscot (S) 1,774,419 742,422 1,031,997 34.44% SAL 355,420 247,171 150,888 61.05% 74,785 355,420 108,249 33,464
8 Indian Township School/Passamaquoddy IT (S) 2,034,292 796,307 1,237,985 29.94% SAL 370,653 264,047 161,190 61.05% 73,650 370,653 106,606 32,956
9 Lac Courte Orielles School (F) 7,453,091 1,318,382 6,134,709 21.25% TDC less PT 1,303,626 786,188 481,100 61.19% 515,825 1,303,626 517,438 1,613
10 Lummi Tribal School and High School (O) 3,101,788 63,359 3,038,429 19.28% TDC less PT 585,809 633,700 387,800 61.20% 633,700 - -
11 Menominee School (F) 4,034,296 329,700 3,704,596 8.83% TDC less PT 327,116 446,286 276,100 61.87% 446,286 - -
12 Miccosukee School (S) 2,251,921 196,400 2,055,521 48.08% TDC less PT 988,294 321,725 196,400 61.05% 440,209 988,294 666,569 226,360
13 Mississippi Choctaw School (S) 33,031,761 2,202,557 30,829,204 17.53% TDC less PT 5,404,359 3,268,600 1,995,400 61.05% 2,135,759 5,404,359 2,135,759 0
14 Nay Ah Shing School (Mille Lacs School) (O) 4,223,828 3,812,406 411,422 14.75% TDC less PT 60,685 515,573 315,500 61.19% 254,196 515,573 - (254,196)
15 Oneida Tribal School (O) 11,293,710 11,293,710 17.00% SAL 1,919,931 884,237 541,100 61.19% 511,397 1,919,931 1,035,694 524,297
16 Paschal Sherman Indian School/Colville Tribe (P) 4,479,960 1,646,925 2,833,035 26.44% SAL 749,054 493,100 301,700 61.18% 153,010 749,054 255,954 102,944
17 Sac and Fox Settlement School (F) 4,035,363 765,675 3,269,688 33.41% TDC less PT 1,092,403 493,186 301,800 61.19% 321,375 1,092,403 599,217 277,842
18 Saulte Ste Marie School (O) 4,927,026 4,779,215 147,811 13.50% TDC less PT 19,954 529,627 324,100 61.19% 238,381 529,627 - (238,381)
19 Seminole Ahfachkee School (S) 1,970,699 276,529 1,694,170 29.27% SAL 495,884 285,850 174,500 61.05% 178,608 495,884 210,034 31,426
FY 2010 Shortfall Report - BIA Individual Student Equalization Program (ISEP) Formula Funded Distributions (P.L. 100-297)
DEPARTMENT OF THE INTERIORBureau of Indian Affairs
Choctaw Decision SchoolsContract Support Cost
FY 2010
APPENDIX B
2
A B C D E F G H I J K L M N O= (C) - (D) = (E) x (F) = J / I = > of H or I =IF(H>I, (H-I), 0) = M - (I + L)
No. Choctaw Decision (P.L. 100-297) SchoolsTotal FY10 BIE Direct Program
LESS (-) Other Exclusions and Pass-Through
FY10 Direct Cost Base
Most Current Approved IDC
Rate Applicable to
FY10 Basis of IDC RateFY10 Rate Based
IDC Need
FY10 Administrative
Cost Grant Need (100%)
FY10 Administrative Cost Grant Amount
PAID -
(Memo Only)
Percent of Administrative
Cost Grant Need Funded
- (Memo Only)
FY10 IDC PAID for BIA ISEP Formula Funded Program (Per Choctaw Decision) Linked to Column (W) in the BIA CSC
Spreadsheets for Non-School Programs
Greater of Column H or Column I
FY10 IDC Need for BIA ISEP Formula Funded Program (Per Choctaw Decision) Linked to Column (V) in the BIA CSC
Spreadsheets for Non-School Programs
FY10 IDC SHORTFALL for BIA ISEP Formula Funded Program
(Per Choctaw Decision) Linked to Column (X) in the BIA
CSC Spreadsheets for Non-School Programs
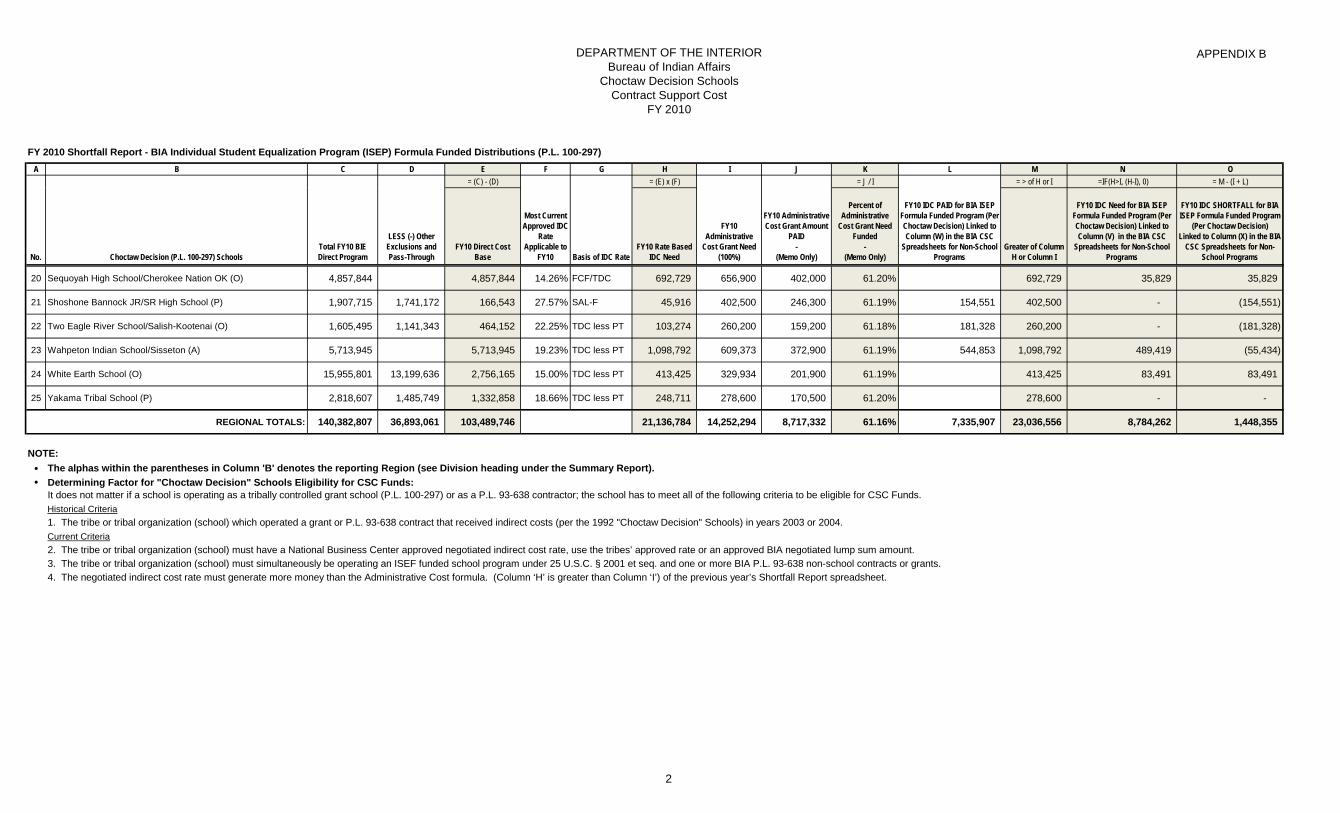
FY 2010 Shortfall Report - BIA Individual Student Equalization Program (ISEP) Formula Funded Distributions (P.L. 100-297)
20 Sequoyah High School/Cherokee Nation OK (O) 4,857,844 4,857,844 14.26% FCF/TDC 692,729 656,900 402,000 61.20% 692,729 35,829 35,829
21 Shoshone Bannock JR/SR High School (P) 1,907,715 1,741,172 166,543 27.57% SAL-F 45,916 402,500 246,300 61.19% 154,551 402,500 - (154,551)
22 Two Eagle River School/Salish-Kootenai (O) 1,605,495 1,141,343 464,152 22.25% TDC less PT 103,274 260,200 159,200 61.18% 181,328 260,200 - (181,328)
23 Wahpeton Indian School/Sisseton (A) 5,713,945 5,713,945 19.23% TDC less PT 1,098,792 609,373 372,900 61.19% 544,853 1,098,792 489,419 (55,434)
24 White Earth School (O) 15,955,801 13,199,636 2,756,165 15.00% TDC less PT 413,425 329,934 201,900 61.19% 413,425 83,491 83,491
25 Yakama Tribal School (P) 2,818,607 1,485,749 1,332,858 18.66% TDC less PT 248,711 278,600 170,500 61.20% 278,600 - -
REGIONAL TOTALS: 140,382,807 36,893,061 103,489,746 21,136,784 14,252,294 8,717,332 61.16% 7,335,907 23,036,556 8,784,262 1,448,355
NOTE:••
Historical Criteria
Current Criteria
The alphas within the parentheses in Column 'B' denotes the reporting Region (see Division heading under the Summary Report).Determining Factor for "Choctaw Decision" Schools Eligibility for CSC Funds:It does not matter if a school is operating as a tribally controlled grant school (P.L. 100-297) or as a P.L. 93-638 contractor; the school has to meet all of the following criteria to be eligible for CSC Funds.
4. The negotiated indirect cost rate must generate more money than the Administrative Cost formula. (Column ‘H’ is greater than Column ‘I’) of the previous year’s Shortfall Report spreadsheet.3. The tribe or tribal organization (school) must simultaneously be operating an ISEF funded school program under 25 U.S.C. § 2001 et seq. and one or more BIA P.L. 93-638 non-school contracts or grants.2. The tribe or tribal organization (school) must have a National Business Center approved negotiated indirect cost rate, use the tribes’ approved rate or an approved BIA negotiated lump sum amount.
1. The tribe or tribal organization (school) which operated a grant or P.L. 93-638 contract that received indirect costs (per the 1992 "Choctaw Decision" Schools) in years 2003 or 2004.
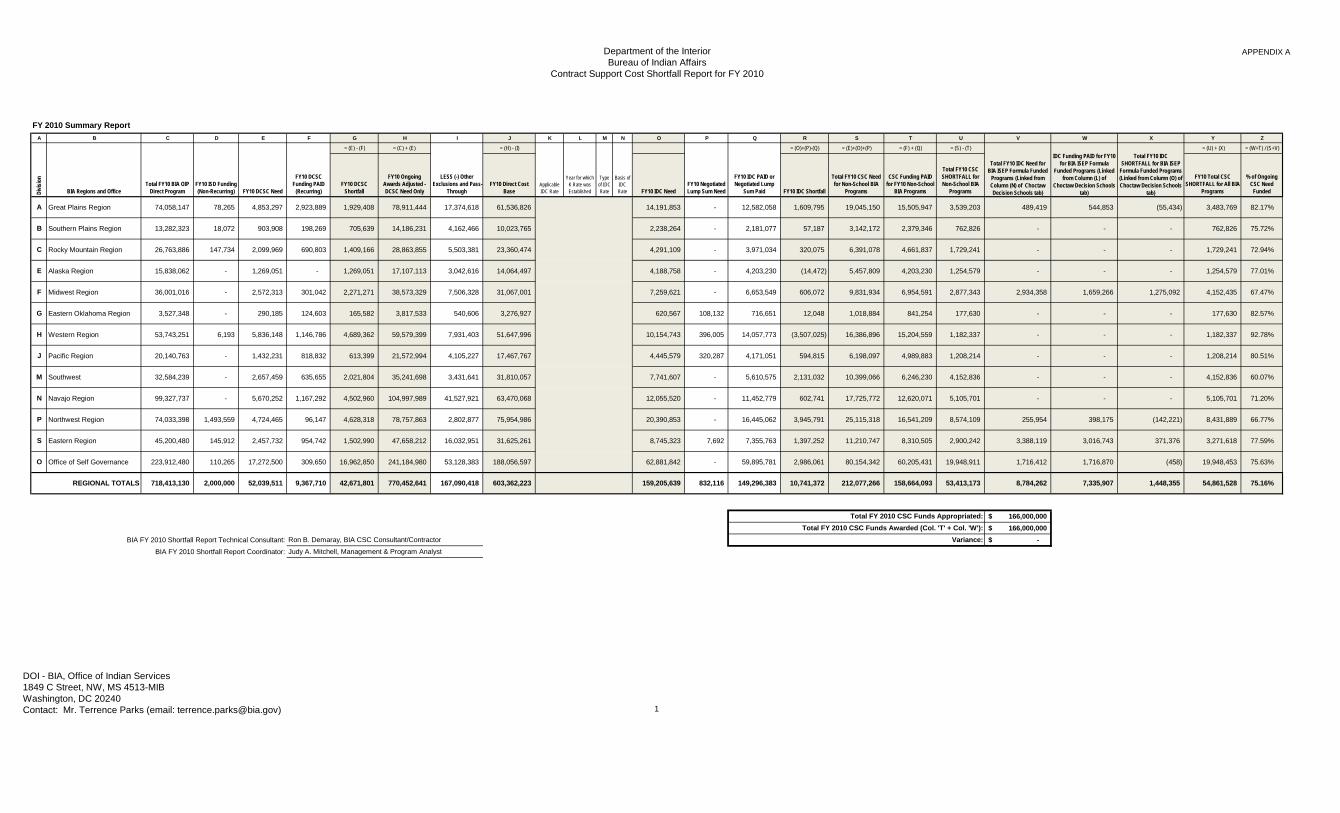
Department of the InteriorBureau of Indian Affairs
Contract Support Cost Shortfall Report for FY 2010
APPENDIX A
DOI - BIA, Office of Indian Services1849 C Street, NW, MS 4513-MIBWashington, DC 20240Contact: Mr. Terrence Parks (email: [email protected]) 1
A B C D E F G H I J K L M N O P Q R S T U V W X Y Z
= (E) - (F) = (C) + (E) = (H) - (I) = (O)+(P)-(Q) = (E)+(O)+(P) = (F) + (Q) = (S) - (T) = (U) + (X) = (W+T) / (S+V)
Divi
sion
BIA Regions and OfficeTotal FY10 BIA OIP
Direct ProgramFY10 ISD Funding (Non-Recurring) FY10 DCSC Need
FY10 DCSC Funding PAID
(Recurring)FY10 DCSC
Shortfall
FY10 Ongoing Awards Adjusted - DCSC Need Only
LESS (-) Other Exclusions and Pass-
ThroughFY10 Direct Cost
BaseApplicable IDC Rate
Year for which K Rate was Established
Type of IDC Rate
Basis of IDC Rate FY10 IDC Need
FY10 Negotiated Lump Sum Need
FY10 IDC PAID or Negotiated Lump
Sum Paid FY10 IDC Shortfall
Total FY10 CSC Need for Non-School BIA
Programs
CSC Funding PAID for FY10 Non-School
BIA Programs
Total FY10 CSC SHORTFALL for Non-School BIA
Programs
FY10 Total CSC SHORTFALL for All BIA
Programs
% of Ongoing CSC Need
Funded
A Great Plains Region 74,058,147 78,265 4,853,297 2,923,889 1,929,408 78,911,444 17,374,618 61,536,826 14,191,853 - 12,582,058 1,609,795 19,045,150 15,505,947 3,539,203 489,419 544,853 (55,434) 3,483,769 82.17%
B Southern Plains Region 13,282,323 18,072 903,908 198,269 705,639 14,186,231 4,162,466 10,023,765 2,238,264 - 2,181,077 57,187 3,142,172 2,379,346 762,826 - - - 762,826 75.72%
C Rocky Mountain Region 26,763,886 147,734 2,099,969 690,803 1,409,166 28,863,855 5,503,381 23,360,474 4,291,109 - 3,971,034 320,075 6,391,078 4,661,837 1,729,241 - - - 1,729,241 72.94%
E Alaska Region 15,838,062 - 1,269,051 - 1,269,051 17,107,113 3,042,616 14,064,497 4,188,758 - 4,203,230 (14,472) 5,457,809 4,203,230 1,254,579 - - - 1,254,579 77.01%
F Midwest Region 36,001,016 - 2,572,313 301,042 2,271,271 38,573,329 7,506,328 31,067,001 7,259,621 - 6,653,549 606,072 9,831,934 6,954,591 2,877,343 2,934,358 1,659,266 1,275,092 4,152,435 67.47%
G Eastern Oklahoma Region 3,527,348 - 290,185 124,603 165,582 3,817,533 540,606 3,276,927 620,567 108,132 716,651 12,048 1,018,884 841,254 177,630 - - - 177,630 82.57%
H Western Region 53,743,251 6,193 5,836,148 1,146,786 4,689,362 59,579,399 7,931,403 51,647,996 10,154,743 396,005 14,057,773 (3,507,025) 16,386,896 15,204,559 1,182,337 - - - 1,182,337 92.78%
J Pacific Region 20,140,763 - 1,432,231 818,832 613,399 21,572,994 4,105,227 17,467,767 4,445,579 320,287 4,171,051 594,815 6,198,097 4,989,883 1,208,214 - - - 1,208,214 80.51%
M Southwest 32,584,239 - 2,657,459 635,655 2,021,804 35,241,698 3,431,641 31,810,057 7,741,607 - 5,610,575 2,131,032 10,399,066 6,246,230 4,152,836 - - - 4,152,836 60.07%
N Navajo Region 99,327,737 - 5,670,252 1,167,292 4,502,960 104,997,989 41,527,921 63,470,068 12,055,520 - 11,452,779 602,741 17,725,772 12,620,071 5,105,701 - - - 5,105,701 71.20%
P Northwest Region 74,033,398 1,493,559 4,724,465 96,147 4,628,318 78,757,863 2,802,877 75,954,986 20,390,853 - 16,445,062 3,945,791 25,115,318 16,541,209 8,574,109 255,954 398,175 (142,221) 8,431,889 66.77%
S Eastern Region 45,200,480 145,912 2,457,732 954,742 1,502,990 47,658,212 16,032,951 31,625,261 8,745,323 7,692 7,355,763 1,397,252 11,210,747 8,310,505 2,900,242 3,388,119 3,016,743 371,376 3,271,618 77.59%
O Office of Self Governance 223,912,480 110,265 17,272,500 309,650 16,962,850 241,184,980 53,128,383 188,056,597 62,881,842 - 59,895,781 2,986,061 80,154,342 60,205,431 19,948,911 1,716,412 1,716,870 (458) 19,948,453 75.63%
REGIONAL TOTALS 718,413,130 2,000,000 52,039,511 9,367,710 42,671,801 770,452,641 167,090,418 603,362,223 159,205,639 832,116 149,296,383 10,741,372 212,077,266 158,664,093 53,413,173 8,784,262 7,335,907 1,448,355 54,861,528 75.16%
166,000,000$ 166,000,000$
BIA FY 2010 Shortfall Report Technical Consultant: -$ BIA FY 2010 Shortfall Report Coordinator:
FY 2010 Summary Report
Judy A. Mitchell, Management & Program Analyst
Ron B. Demaray, BIA CSC Consultant/Contractor
Total FY10 IDC Need for BIA ISEP Formula Funded
Programs (Linked from Column (N) of Choctaw Decision Schools tab)
IDC Funding PAID for FY10 for BIA ISEP Formula
Funded Programs (Linked from Column (L) of
Choctaw Decision Schools tab)
Total FY10 IDC SHORTFALL for BIA ISEP
Formula Funded Programs (Linked from Column (O) of Choctaw Decision Schools
tab)
Total FY 2010 CSC Funds Appropriated:Total FY 2010 CSC Funds Awarded (Col. 'T' + Col. 'W'):
Variance:
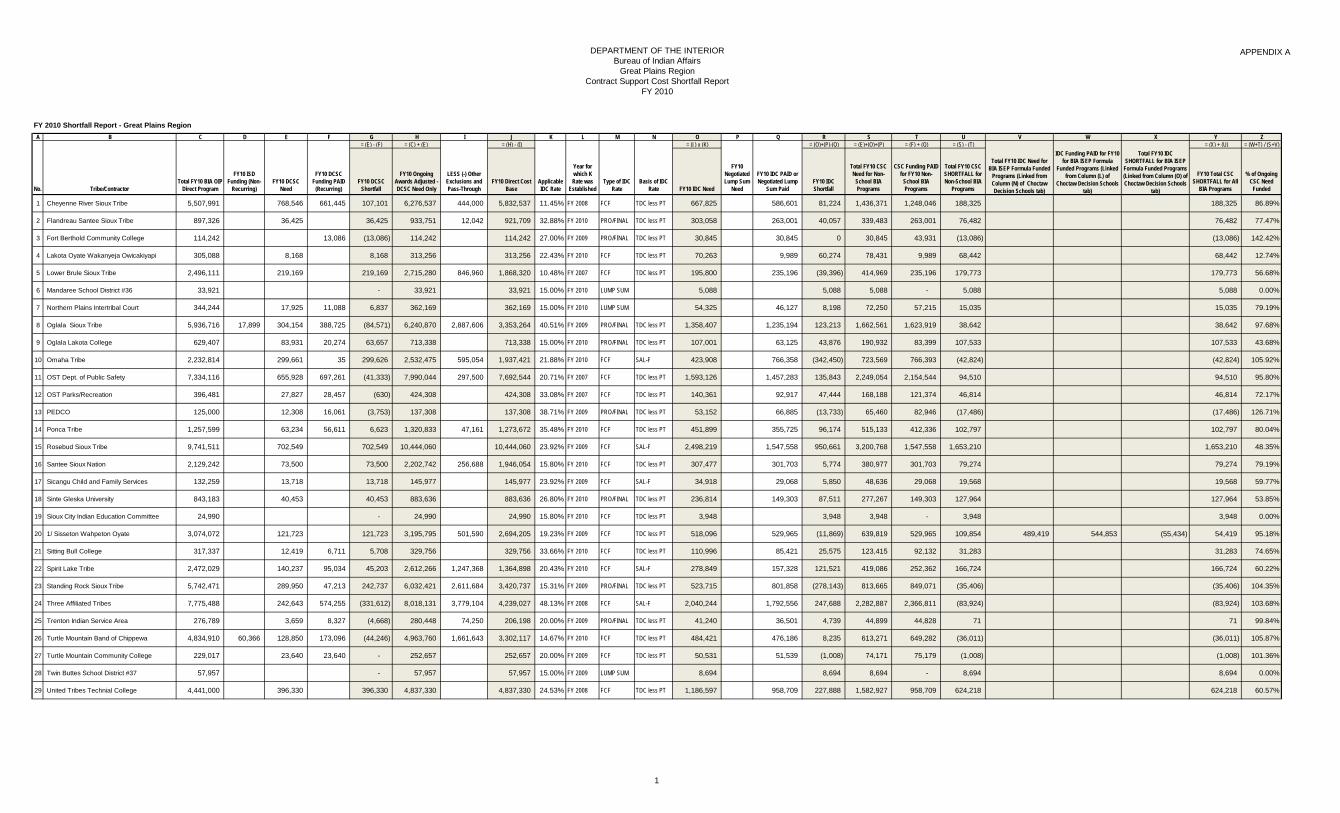
DEPARTMENT OF THE INTERIORBureau of Indian Affairs
Great Plains RegionContract Support Cost Shortfall Report
FY 2010
APPENDIX A
1
A B C D E F G H I J K L M N O P Q R S T U V W X Y Z= (E) - (F) = (C) + (E) = (H) - (I) = (J) x (K) = (O)+(P)-(Q) = (E)+(O)+(P) = (F) + (Q) = (S) - (T) = (X) + (U) = (W+T) / (S+V)
No. Tribe/ContractorTotal FY10 BIA OIP
Direct Program
FY10 ISD Funding (Non-
Recurring)FY10 DCSC
Need
FY10 DCSC Funding PAID
(Recurring)FY10 DCSC
Shortfall
FY10 Ongoing Awards Adjusted - DCSC Need Only
LESS (-) Other Exclusions and Pass-Through
FY10 Direct Cost Base
Applicable IDC Rate
Year for which K Rate was
EstablishedType of IDC
RateBasis of IDC
Rate FY10 IDC Need
FY10 Negotiated Lump Sum
Need
FY10 IDC PAID or Negotiated Lump
Sum PaidFY10 IDC Shortfall
Total FY10 CSC Need for Non-
School BIA Programs
CSC Funding PAID for FY10 Non-
School BIA Programs
Total FY10 CSC SHORTFALL for Non-School BIA
Programs
FY10 Total CSC SHORTFALL for All
BIA Programs
% of Ongoing CSC Need
Funded
1 Cheyenne River Sioux Tribe 5,507,991 768,546 661,445 107,101 6,276,537 444,000 5,832,537 11.45% FY 2008 FCF TDC less PT 667,825 586,601 81,224 1,436,371 1,248,046 188,325 188,325 86.89%
2 Flandreau Santee Sioux Tribe 897,326 36,425 36,425 933,751 12,042 921,709 32.88% FY 2010 PRO/FINAL TDC less PT 303,058 263,001 40,057 339,483 263,001 76,482 76,482 77.47%
3 Fort Berthold Community College 114,242 13,086 (13,086) 114,242 114,242 27.00% FY 2009 PRO/FINAL TDC less PT 30,845 30,845 0 30,845 43,931 (13,086) (13,086) 142.42%
4 Lakota Oyate Wakanyeja Owicakiyapi 305,088 8,168 8,168 313,256 313,256 22.43% FY 2010 FCF TDC less PT 70,263 9,989 60,274 78,431 9,989 68,442 68,442 12.74%
5 Lower Brule Sioux Tribe 2,496,111 219,169 219,169 2,715,280 846,960 1,868,320 10.48% FY 2007 FCF TDC less PT 195,800 235,196 (39,396) 414,969 235,196 179,773 179,773 56.68%
6 Mandaree School District #36 33,921 - 33,921 33,921 15.00% FY 2010 LUMP SUM 5,088 5,088 5,088 - 5,088 5,088 0.00%
7 Northern Plains Intertribal Court 344,244 17,925 11,088 6,837 362,169 362,169 15.00% FY 2010 LUMP SUM 54,325 46,127 8,198 72,250 57,215 15,035 15,035 79.19%
8 Oglala Sioux Tribe 5,936,716 17,899 304,154 388,725 (84,571) 6,240,870 2,887,606 3,353,264 40.51% FY 2009 PRO/FINAL TDC less PT 1,358,407 1,235,194 123,213 1,662,561 1,623,919 38,642 38,642 97.68%
9 Oglala Lakota College 629,407 83,931 20,274 63,657 713,338 713,338 15.00% FY 2010 PRO/FINAL TDC less PT 107,001 63,125 43,876 190,932 83,399 107,533 107,533 43.68%
10 Omaha Tribe 2,232,814 299,661 35 299,626 2,532,475 595,054 1,937,421 21.88% FY 2010 FCF SAL-F 423,908 766,358 (342,450) 723,569 766,393 (42,824) (42,824) 105.92%
11 OST Dept. of Public Safety 7,334,116 655,928 697,261 (41,333) 7,990,044 297,500 7,692,544 20.71% FY 2007 FCF TDC less PT 1,593,126 1,457,283 135,843 2,249,054 2,154,544 94,510 94,510 95.80%
12 OST Parks/Recreation 396,481 27,827 28,457 (630) 424,308 424,308 33.08% FY 2007 FCF TDC less PT 140,361 92,917 47,444 168,188 121,374 46,814 46,814 72.17%
13 PEDCO 125,000 12,308 16,061 (3,753) 137,308 137,308 38.71% FY 2009 PRO/FINAL TDC less PT 53,152 66,885 (13,733) 65,460 82,946 (17,486) (17,486) 126.71%
14 Ponca Tribe 1,257,599 63,234 56,611 6,623 1,320,833 47,161 1,273,672 35.48% FY 2010 FCF TDC less PT 451,899 355,725 96,174 515,133 412,336 102,797 102,797 80.04%
15 Rosebud Sioux Tribe 9,741,511 702,549 702,549 10,444,060 10,444,060 23.92% FY 2009 FCF SAL-F 2,498,219 1,547,558 950,661 3,200,768 1,547,558 1,653,210 1,653,210 48.35%
16 Santee Sioux Nation 2,129,242 73,500 73,500 2,202,742 256,688 1,946,054 15.80% FY 2010 FCF TDC less PT 307,477 301,703 5,774 380,977 301,703 79,274 79,274 79.19%
17 Sicangu Child and Family Services 132,259 13,718 13,718 145,977 145,977 23.92% FY 2009 FCF SAL-F 34,918 29,068 5,850 48,636 29,068 19,568 19,568 59.77%
18 Sinte Gleska University 843,183 40,453 40,453 883,636 883,636 26.80% FY 2010 PRO/FINAL TDC less PT 236,814 149,303 87,511 277,267 149,303 127,964 127,964 53.85%
19 Sioux City Indian Education Committee 24,990 - 24,990 24,990 15.80% FY 2010 FCF TDC less PT 3,948 3,948 3,948 - 3,948 3,948 0.00%
20 1/ Sisseton Wahpeton Oyate 3,074,072 121,723 121,723 3,195,795 501,590 2,694,205 19.23% FY 2009 FCF TDC less PT 518,096 529,965 (11,869) 639,819 529,965 109,854 489,419 544,853 (55,434) 54,419 95.18%
21 Sitting Bull College 317,337 12,419 6,711 5,708 329,756 329,756 33.66% FY 2010 FCF TDC less PT 110,996 85,421 25,575 123,415 92,132 31,283 31,283 74.65%
22 Spirit Lake Tribe 2,472,029 140,237 95,034 45,203 2,612,266 1,247,368 1,364,898 20.43% FY 2010 FCF SAL-F 278,849 157,328 121,521 419,086 252,362 166,724 166,724 60.22%
23 Standing Rock Sioux Tribe 5,742,471 289,950 47,213 242,737 6,032,421 2,611,684 3,420,737 15.31% FY 2009 PRO/FINAL TDC less PT 523,715 801,858 (278,143) 813,665 849,071 (35,406) (35,406) 104.35%
24 Three Affiliated Tribes 7,775,488 242,643 574,255 (331,612) 8,018,131 3,779,104 4,239,027 48.13% FY 2008 FCF SAL-F 2,040,244 1,792,556 247,688 2,282,887 2,366,811 (83,924) (83,924) 103.68%
25 Trenton Indian Service Area 276,789 3,659 8,327 (4,668) 280,448 74,250 206,198 20.00% FY 2009 PRO/FINAL TDC less PT 41,240 36,501 4,739 44,899 44,828 71 71 99.84%
26 Turtle Mountain Band of Chippewa 4,834,910 60,366 128,850 173,096 (44,246) 4,963,760 1,661,643 3,302,117 14.67% FY 2010 FCF TDC less PT 484,421 476,186 8,235 613,271 649,282 (36,011) (36,011) 105.87%
27 Turtle Mountain Community College 229,017 23,640 23,640 - 252,657 252,657 20.00% FY 2009 FCF TDC less PT 50,531 51,539 (1,008) 74,171 75,179 (1,008) (1,008) 101.36%
28 Twin Buttes School District #37 57,957 - 57,957 57,957 15.00% FY 2009 LUMP SUM 8,694 8,694 8,694 - 8,694 8,694 0.00%
29 United Tribes Technial College 4,441,000 396,330 396,330 4,837,330 4,837,330 24.53% FY 2008 FCF TDC less PT 1,186,597 958,709 227,888 1,582,927 958,709 624,218 624,218 60.57%
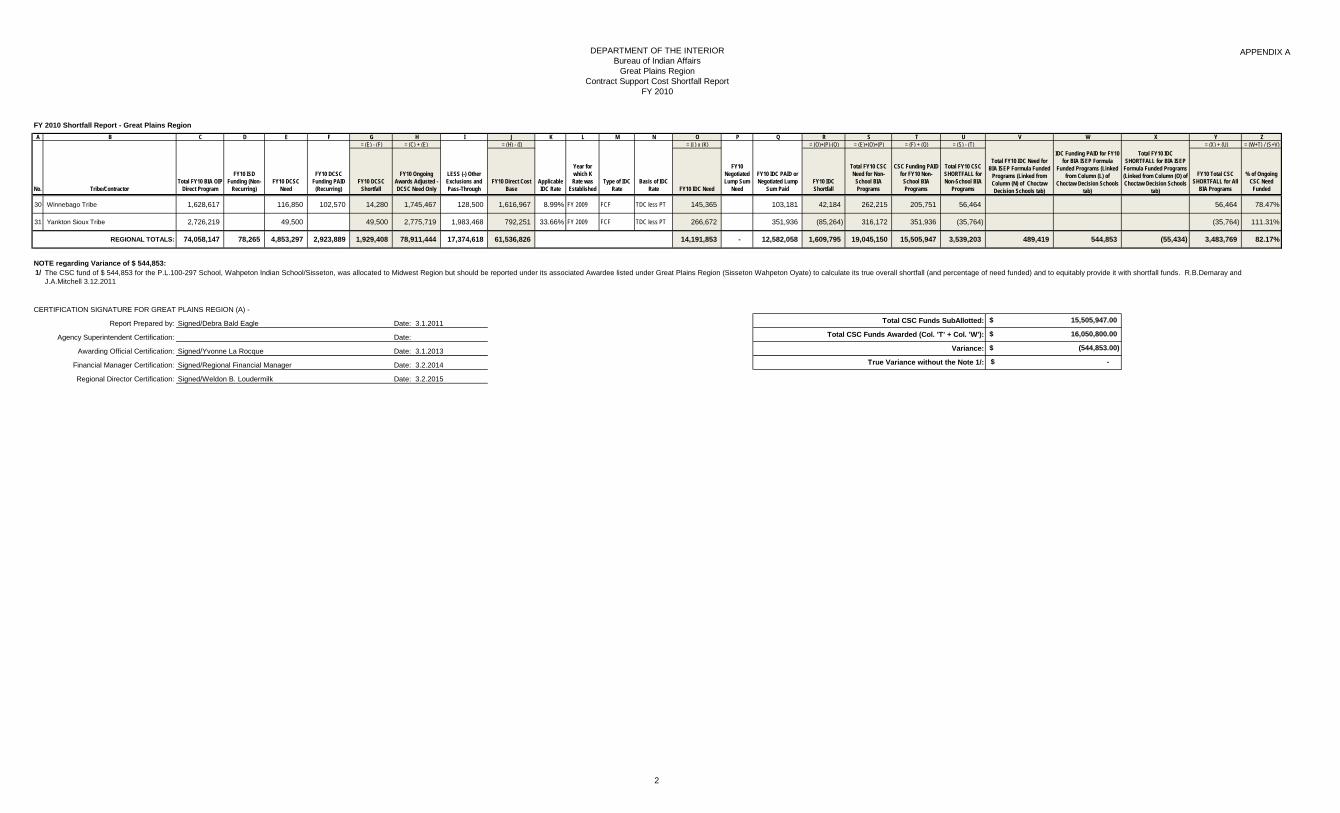
FY 2010 Shortfall Report - Great Plains Region
Total FY10 IDC Need for BIA ISEP Formula Funded
Programs (Linked from Column (N) of Choctaw Decision Schools tab)
IDC Funding PAID for FY10 for BIA ISEP Formula
Funded Programs (Linked from Column (L) of
Choctaw Decision Schools tab)
Total FY10 IDC SHORTFALL for BIA ISEP
Formula Funded Programs (Linked from Column (O) of Choctaw Decision Schools
tab)
DEPARTMENT OF THE INTERIORBureau of Indian Affairs
Great Plains RegionContract Support Cost Shortfall Report
FY 2010
APPENDIX A
2
A B C D E F G H I J K L M N O P Q R S T U V W X Y Z= (E) - (F) = (C) + (E) = (H) - (I) = (J) x (K) = (O)+(P)-(Q) = (E)+(O)+(P) = (F) + (Q) = (S) - (T) = (X) + (U) = (W+T) / (S+V)
No. Tribe/ContractorTotal FY10 BIA OIP
Direct Program
FY10 ISD Funding (Non-
Recurring)FY10 DCSC
Need
FY10 DCSC Funding PAID
(Recurring)FY10 DCSC
Shortfall
FY10 Ongoing Awards Adjusted - DCSC Need Only
LESS (-) Other Exclusions and Pass-Through
FY10 Direct Cost Base
Applicable IDC Rate
Year for which K Rate was
EstablishedType of IDC
RateBasis of IDC
Rate FY10 IDC Need
FY10 Negotiated Lump Sum
Need
FY10 IDC PAID or Negotiated Lump
Sum PaidFY10 IDC Shortfall
Total FY10 CSC Need for Non-
School BIA Programs
CSC Funding PAID for FY10 Non-
School BIA Programs
Total FY10 CSC SHORTFALL for Non-School BIA
Programs
FY10 Total CSC SHORTFALL for All
BIA Programs
% of Ongoing CSC Need
Funded
FY 2010 Shortfall Report - Great Plains Region
Total FY10 IDC Need for BIA ISEP Formula Funded
Programs (Linked from Column (N) of Choctaw Decision Schools tab)
IDC Funding PAID for FY10 for BIA ISEP Formula
Funded Programs (Linked from Column (L) of
Choctaw Decision Schools tab)
Total FY10 IDC SHORTFALL for BIA ISEP
Formula Funded Programs (Linked from Column (O) of Choctaw Decision Schools
tab)
30 Winnebago Tribe 1,628,617 116,850 102,570 14,280 1,745,467 128,500 1,616,967 8.99% FY 2009 FCF TDC less PT 145,365 103,181 42,184 262,215 205,751 56,464 56,464 78.47%
31 Yankton Sioux Tribe 2,726,219 49,500 49,500 2,775,719 1,983,468 792,251 33.66% FY 2009 FCF TDC less PT 266,672 351,936 (85,264) 316,172 351,936 (35,764) (35,764) 111.31%
REGIONAL TOTALS: 74,058,147 78,265 4,853,297 2,923,889 1,929,408 78,911,444 17,374,618 61,536,826 14,191,853 - 12,582,058 1,609,795 19,045,150 15,505,947 3,539,203 489,419 544,853 (55,434) 3,483,769 82.17%
NOTE regarding Variance of $ 544,853:1/
CERTIFICATION SIGNATURE FOR GREAT PLAINS REGION (A) -
Report Prepared by: Date: 3.1.2011
Agency Superintendent Certification: Date:
Awarding Official Certification: Date: 3.1.2013
Financial Manager Certification: Date: 3.2.2014
Regional Director Certification: Date: 3.2.2015
Signed/Debra Bald Eagle
Signed/Yvonne La Rocque
The CSC fund of $ 544,853 for the P.L.100-297 School, Wahpeton Indian School/Sisseton, was allocated to Midwest Region but should be reported under its associated Awardee listed under Great Plains Region (Sisseton Wahpeton Oyate) to calculate its true overall shortfall (and percentage of need funded) and to equitably provide it with shortfall funds. R.B.Demaray and J.A.Mitchell 3.12.2011
Total CSC Funds SubAllotted:
Total CSC Funds Awarded (Col. 'T' + Col. 'W'):
Variance:
Signed/Regional Financial Manager
Signed/Weldon B. Loudermilk
15,505,947.00$
16,050,800.00$
(544,853.00)$
True Variance without the Note 1/: -$
DEPARTMENT OF THE INTERIORBureau of Indian AffairsSouthern Plains Region
Contract Support Cost Shortfall ReportFY 2010
APPENDIX A
1
A B C D E F G H I J K L M N O P Q R S T U V W X Y Z= (E) - (F) = (C) + (E) = (H) - (I) = (J) x (K) = (O)+(P)-(Q) = (E)+(O)+(P) = (F) + (Q) = (S) - (T) = (X) + (U) = (W+T) / (S+V)
No. Tribe/Contractor
Total FY10 BIA OIP Direct Program
FY10 ISD Funding
(Non-Recurring)
FY10 DCSC Need
FY10 DCSC Funding
PAID (Recurring)
FY10 DCSC Shortfall
FY10 Ongoing Awards Adjusted
- DCSC Need Only
LESS (-) Other Exclusions and Pass-Through
FY10 Direct Cost Base
Applicable IDC Rate
Year for which K Rate
was Established
Type of IDC Rate
Basis of IDC Rate FY10 IDC Need
FY10 Negotiated Lump Sum
Need
FY10 IDC PAID or Negotiated Lump
Sum PaidFY10 IDC Shortfall
Total FY10 CSC Need for Non-
School BIA Programs
CSC Funding PAID for FY10
Non-School BIA Programs
Total FY10 CSC
SHORTFALL for Non-
School BIA Programs
FY10 Total CSC SHORTFALL for All
BIA Programs
% of Ongoing CSC Need
Funded
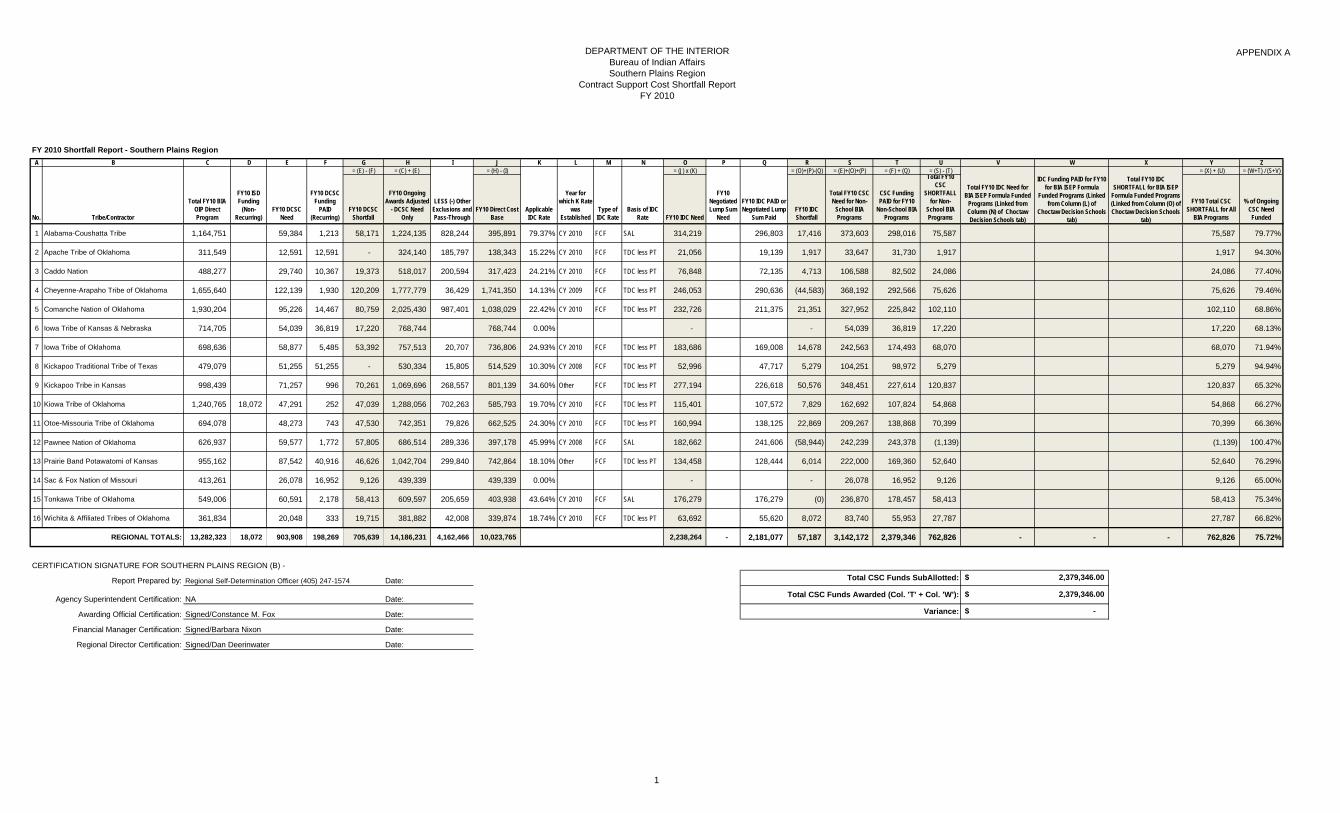
1 Alabama-Coushatta Tribe 1,164,751 59,384 1,213 58,171 1,224,135 828,244 395,891 79.37% CY 2010 FCF SAL 314,219 296,803 17,416 373,603 298,016 75,587 75,587 79.77%
2 Apache Tribe of Oklahoma 311,549 12,591 12,591 - 324,140 185,797 138,343 15.22% CY 2010 FCF TDC less PT 21,056 19,139 1,917 33,647 31,730 1,917 1,917 94.30%
3 Caddo Nation 488,277 29,740 10,367 19,373 518,017 200,594 317,423 24.21% CY 2010 FCF TDC less PT 76,848 72,135 4,713 106,588 82,502 24,086 24,086 77.40%
4 Cheyenne-Arapaho Tribe of Oklahoma 1,655,640 122,139 1,930 120,209 1,777,779 36,429 1,741,350 14.13% CY 2009 FCF TDC less PT 246,053 290,636 (44,583) 368,192 292,566 75,626 75,626 79.46%
5 Comanche Nation of Oklahoma 1,930,204 95,226 14,467 80,759 2,025,430 987,401 1,038,029 22.42% CY 2010 FCF TDC less PT 232,726 211,375 21,351 327,952 225,842 102,110 102,110 68.86%
6 Iowa Tribe of Kansas & Nebraska 714,705 54,039 36,819 17,220 768,744 768,744 0.00% - - 54,039 36,819 17,220 17,220 68.13%
7 Iowa Tribe of Oklahoma 698,636 58,877 5,485 53,392 757,513 20,707 736,806 24.93% CY 2010 FCF TDC less PT 183,686 169,008 14,678 242,563 174,493 68,070 68,070 71.94%
8 Kickapoo Traditional Tribe of Texas 479,079 51,255 51,255 - 530,334 15,805 514,529 10.30% CY 2008 FCF TDC less PT 52,996 47,717 5,279 104,251 98,972 5,279 5,279 94.94%
9 Kickapoo Tribe in Kansas 998,439 71,257 996 70,261 1,069,696 268,557 801,139 34.60% Other FCF TDC less PT 277,194 226,618 50,576 348,451 227,614 120,837 120,837 65.32%
10 Kiowa Tribe of Oklahoma 1,240,765 18,072 47,291 252 47,039 1,288,056 702,263 585,793 19.70% CY 2010 FCF TDC less PT 115,401 107,572 7,829 162,692 107,824 54,868 54,868 66.27%
11 Otoe-Missouria Tribe of Oklahoma 694,078 48,273 743 47,530 742,351 79,826 662,525 24.30% CY 2010 FCF TDC less PT 160,994 138,125 22,869 209,267 138,868 70,399 70,399 66.36%
12 Pawnee Nation of Oklahoma 626,937 59,577 1,772 57,805 686,514 289,336 397,178 45.99% CY 2008 FCF SAL 182,662 241,606 (58,944) 242,239 243,378 (1,139) (1,139) 100.47%
13 Prairie Band Potawatomi of Kansas 955,162 87,542 40,916 46,626 1,042,704 299,840 742,864 18.10% Other FCF TDC less PT 134,458 128,444 6,014 222,000 169,360 52,640 52,640 76.29%
14 Sac & Fox Nation of Missouri 413,261 26,078 16,952 9,126 439,339 439,339 0.00% - - 26,078 16,952 9,126 9,126 65.00%
15 Tonkawa Tribe of Oklahoma 549,006 60,591 2,178 58,413 609,597 205,659 403,938 43.64% CY 2010 FCF SAL 176,279 176,279 (0) 236,870 178,457 58,413 58,413 75.34%
16 Wichita & Affiliated Tribes of Oklahoma 361,834 20,048 333 19,715 381,882 42,008 339,874 18.74% CY 2010 FCF TDC less PT 63,692 55,620 8,072 83,740 55,953 27,787 27,787 66.82%
REGIONAL TOTALS: 13,282,323 18,072 903,908 198,269 705,639 14,186,231 4,162,466 10,023,765 2,238,264 - 2,181,077 57,187 3,142,172 2,379,346 762,826 - - - 762,826 75.72%
CERTIFICATION SIGNATURE FOR SOUTHERN PLAINS REGION (B) -
Report Prepared by: Date:
Agency Superintendent Certification: Date:
Awarding Official Certification: Date:
Financial Manager Certification: Date:
Regional Director Certification: Date:Signed/Dan Deerinwater
2,379,346.00$
NA 2,379,346.00$
Signed/Constance M. Fox -$
Signed/Barbara Nixon
Regional Self-Determination Officer (405) 247-1574
IDC Funding PAID for FY10 for BIA ISEP Formula
Funded Programs (Linked from Column (L) of
Choctaw Decision Schools tab)
Total FY10 IDC SHORTFALL for BIA ISEP
Formula Funded Programs (Linked from Column (O) of Choctaw Decision Schools
tab)
Total CSC Funds SubAllotted:
Total CSC Funds Awarded (Col. 'T' + Col. 'W'):
Variance:
FY 2010 Shortfall Report - Southern Plains Region
Total FY10 IDC Need for BIA ISEP Formula Funded
Programs (Linked from Column (N) of Choctaw Decision Schools tab)
DEPARTMENT OF THE INTERIORBureau of Indian AffairsRocky Mountain Region
Contract Support Cost Shortfall ReportFY 2010
APPENDIX A
1
A B C D E F G H I J K L M N O P Q R S T U V W X Y Z= (E) - (F) = (C) + (E) = (H) - (I) = (J) x (K) = (O)+(P)-(Q) = (E)+(O)+(P) = (F) + (Q) = (S) - (T) = (X) + (U) = (W+T) / (S+V)
No. Tribe/ContractorTotal FY10 BIA OIP
Direct Program
FY10 ISD Funding (Non-
Recurring) FY10 DCSC Need
FY10 DCSC Funding PAID
(Recurring)FY10 DCSC
Shortfall
FY10 Ongoing Awards Adjusted - DCSC Need Only
LESS (-) Other Exclusions and Pass-Through
FY10 Direct Cost Base
Applicable IDC Rate
Year for which K Rate
was Established
Type of IDC Rate
Basis of IDC Rate FY10 IDC Need
FY10 Negotiated Lump Sum
Need
FY10 IDC PAID or Negotiated Lump
Sum PaidFY10 IDC Shortfall
Total FY10 CSC Need for Non-
School BIA Programs
CSC Funding PAID for FY10
Non-School BIA Programs
Total FY10 CSC SHORTFALL for Non-School BIA
Programs
FY10 Total CSC SHORTFALL for All
BIA Programs
% of Ongoing CSC Need
Funded
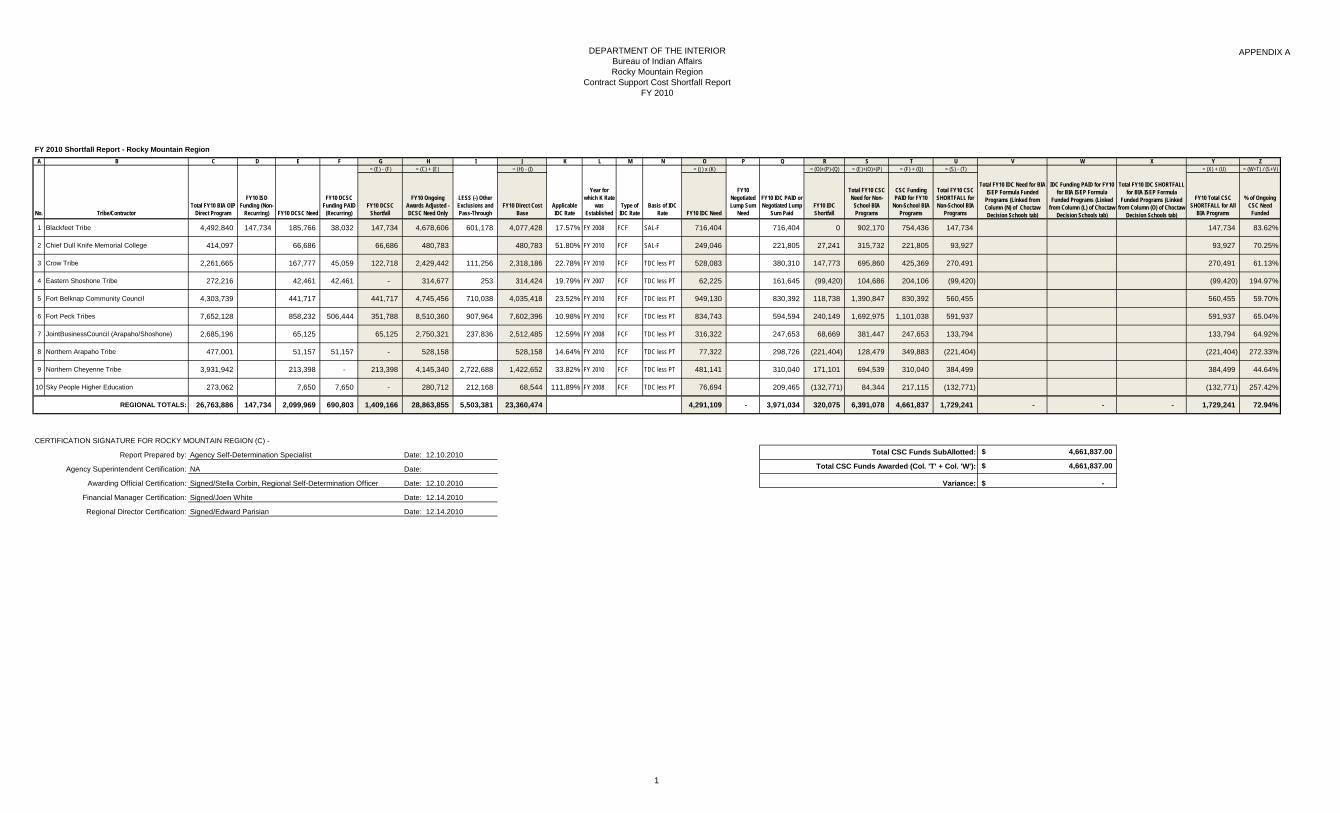
1 Blackfeet Tribe 4,492,840 147,734 185,766 38,032 147,734 4,678,606 601,178 4,077,428 17.57% FY 2008 FCF SAL-F 716,404 716,404 0 902,170 754,436 147,734 147,734 83.62%
2 Chief Dull Knife Memorial College 414,097 66,686 66,686 480,783 480,783 51.80% FY 2010 FCF SAL-F 249,046 221,805 27,241 315,732 221,805 93,927 93,927 70.25%
3 Crow Tribe 2,261,665 167,777 45,059 122,718 2,429,442 111,256 2,318,186 22.78% FY 2010 FCF TDC less PT 528,083 380,310 147,773 695,860 425,369 270,491 270,491 61.13%
4 Eastern Shoshone Tribe 272,216 42,461 42,461 - 314,677 253 314,424 19.79% FY 2007 FCF TDC less PT 62,225 161,645 (99,420) 104,686 204,106 (99,420) (99,420) 194.97%
5 Fort Belknap Community Council 4,303,739 441,717 441,717 4,745,456 710,038 4,035,418 23.52% FY 2010 FCF TDC less PT 949,130 830,392 118,738 1,390,847 830,392 560,455 560,455 59.70%
6 Fort Peck Tribes 7,652,128 858,232 506,444 351,788 8,510,360 907,964 7,602,396 10.98% FY 2010 FCF TDC less PT 834,743 594,594 240,149 1,692,975 1,101,038 591,937 591,937 65.04%
7 JointBusinessCouncil (Arapaho/Shoshone) 2,685,196 65,125 65,125 2,750,321 237,836 2,512,485 12.59% FY 2008 FCF TDC less PT 316,322 247,653 68,669 381,447 247,653 133,794 133,794 64.92%
8 Northern Arapaho Tribe 477,001 51,157 51,157 - 528,158 528,158 14.64% FY 2010 FCF TDC less PT 77,322 298,726 (221,404) 128,479 349,883 (221,404) (221,404) 272.33%
9 Northern Cheyenne Tribe 3,931,942 213,398 - 213,398 4,145,340 2,722,688 1,422,652 33.82% FY 2010 FCF TDC less PT 481,141 310,040 171,101 694,539 310,040 384,499 384,499 44.64%
10 Sky People Higher Education 273,062 7,650 7,650 - 280,712 212,168 68,544 111.89% FY 2008 FCF TDC less PT 76,694 209,465 (132,771) 84,344 217,115 (132,771) (132,771) 257.42%
REGIONAL TOTALS: 26,763,886 147,734 2,099,969 690,803 1,409,166 28,863,855 5,503,381 23,360,474 4,291,109 - 3,971,034 320,075 6,391,078 4,661,837 1,729,241 - - - 1,729,241 72.94%
CERTIFICATION SIGNATURE FOR ROCKY MOUNTAIN REGION (C) -
Report Prepared by: Date: 12.10.2010
Agency Superintendent Certification: Date:
Awarding Official Certification: Date: 12.10.2010
Financial Manager Certification: Date: 12.14.2010
Regional Director Certification: Date: 12.14.2010
IDC Funding PAID for FY10 for BIA ISEP Formula
Funded Programs (Linked from Column (L) of Choctaw
Decision Schools tab)
Total FY10 IDC SHORTFALL for BIA ISEP Formula
Funded Programs (Linked from Column (O) of Choctaw
Decision Schools tab)
Agency Self-Determination Specialist
NA
Signed/Stella Corbin, Regional Self-Determination Officer
FY 2010 Shortfall Report - Rocky Mountain Region
4,661,837.00$
4,661,837.00$
-$
Signed/Joen White
Signed/Edward Parisian
Total CSC Funds SubAllotted:
Total CSC Funds Awarded (Col. 'T' + Col. 'W'):
Variance:
Total FY10 IDC Need for BIA ISEP Formula Funded
Programs (Linked from Column (N) of Choctaw Decision Schools tab)
DEPARTMENT OF THE INTERIORBureau of Indian Affairs
Alaska RegionContract Support Cost Shortfall Report
FY 2010
APPENDIX A
1
A B C D E F G H I J K L M N O P Q R S T U V W X Y Z= (E) - (F) = (C) + (E) = (H) - (I) = (J) x (K) = (O)+(P)-(Q) = (E)+(O)+(P) = (F) + (Q) = (S) - (T) = (X) + (U) = (W+T) / (S+V)
No. Tribe/ContractorTotal FY10 BIA OIP
Direct Program
FY10 ISD Funding
(Non-Recurring) FY10 DCSC Need
FY10 DCSC Funding PAID
(Recurring)FY10 DCSC
Shortfall
FY10 Ongoing Awards Adjusted - DCSC Need Only
LESS (-) Other Exclusions and Pass-Through
FY10 Direct Cost Base
Applicable IDC Rate
Year for which K Rate was Established
Type of IDC Rate Basis of IDC Rate FY10 IDC Need
FY10 Negotiated Lump Sum
Need
FY10 IDC PAID or Negotiated Lump
Sum PaidFY10 IDC Shortfall
Total FY10 CSC Need for Non-
School BIA Programs
CSC Funding PAID for FY10
Non-School BIA Programs
Total FY10 CSC SHORTFALL for Non-School BIA
Programs
FY10 Total CSC SHORTFALL for All
BIA Programs
% of Ongoing CSC Need
Funded
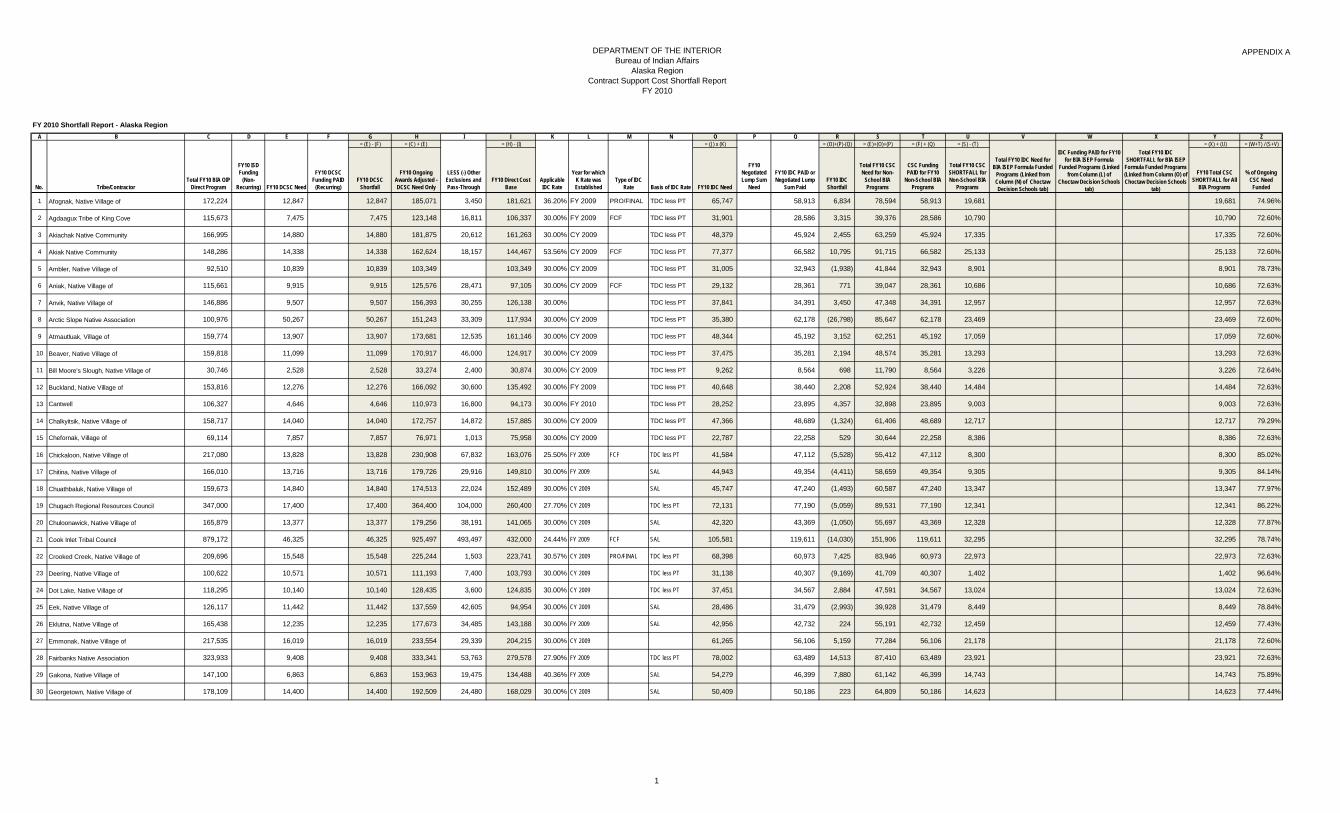
1 Afognak, Native Village of 172,224 12,847 12,847 185,071 3,450 181,621 36.20% FY 2009 PRO/FINAL TDC less PT 65,747 58,913 6,834 78,594 58,913 19,681 19,681 74.96%
2 Agdaagux Tribe of King Cove 115,673 7,475 7,475 123,148 16,811 106,337 30.00% FY 2009 FCF TDC less PT 31,901 28,586 3,315 39,376 28,586 10,790 10,790 72.60%
3 Akiachak Native Community 166,995 14,880 14,880 181,875 20,612 161,263 30.00% CY 2009 TDC less PT 48,379 45,924 2,455 63,259 45,924 17,335 17,335 72.60%
4 Akiak Native Community 148,286 14,338 14,338 162,624 18,157 144,467 53.56% CY 2009 FCF TDC less PT 77,377 66,582 10,795 91,715 66,582 25,133 25,133 72.60%
5 Ambler, Native Village of 92,510 10,839 10,839 103,349 103,349 30.00% CY 2009 TDC less PT 31,005 32,943 (1,938) 41,844 32,943 8,901 8,901 78.73%
6 Aniak, Native Village of 115,661 9,915 9,915 125,576 28,471 97,105 30.00% CY 2009 FCF TDC less PT 29,132 28,361 771 39,047 28,361 10,686 10,686 72.63%
7 Anvik, Native Village of 146,886 9,507 9,507 156,393 30,255 126,138 30.00% TDC less PT 37,841 34,391 3,450 47,348 34,391 12,957 12,957 72.63%
8 Arctic Slope Native Association 100,976 50,267 50,267 151,243 33,309 117,934 30.00% CY 2009 TDC less PT 35,380 62,178 (26,798) 85,647 62,178 23,469 23,469 72.60%
9 Atmautluak, Village of 159,774 13,907 13,907 173,681 12,535 161,146 30.00% CY 2009 TDC less PT 48,344 45,192 3,152 62,251 45,192 17,059 17,059 72.60%
10 Beaver, Native Village of 159,818 11,099 11,099 170,917 46,000 124,917 30.00% CY 2009 TDC less PT 37,475 35,281 2,194 48,574 35,281 13,293 13,293 72.63%
11 Bill Moore's Slough, Native Village of 30,746 2,528 2,528 33,274 2,400 30,874 30.00% CY 2009 TDC less PT 9,262 8,564 698 11,790 8,564 3,226 3,226 72.64%
12 Buckland, Native Village of 153,816 12,276 12,276 166,092 30,600 135,492 30.00% FY 2009 TDC less PT 40,648 38,440 2,208 52,924 38,440 14,484 14,484 72.63%
13 Cantwell 106,327 4,646 4,646 110,973 16,800 94,173 30.00% FY 2010 TDC less PT 28,252 23,895 4,357 32,898 23,895 9,003 9,003 72.63%
14 Chalkyitsik, Native Village of 158,717 14,040 14,040 172,757 14,872 157,885 30.00% CY 2009 TDC less PT 47,366 48,689 (1,324) 61,406 48,689 12,717 12,717 79.29%
15 Chefornak, Village of 69,114 7,857 7,857 76,971 1,013 75,958 30.00% CY 2009 TDC less PT 22,787 22,258 529 30,644 22,258 8,386 8,386 72.63%
16 Chickaloon, Native Village of 217,080 13,828 13,828 230,908 67,832 163,076 25.50% FY 2009 FCF TDC less PT 41,584 47,112 (5,528) 55,412 47,112 8,300 8,300 85.02%
17 Chitina, Native Village of 166,010 13,716 13,716 179,726 29,916 149,810 30.00% FY 2009 SAL 44,943 49,354 (4,411) 58,659 49,354 9,305 9,305 84.14%
18 Chuathbaluk, Native Village of 159,673 14,840 14,840 174,513 22,024 152,489 30.00% CY 2009 SAL 45,747 47,240 (1,493) 60,587 47,240 13,347 13,347 77.97%
19 Chugach Regional Resources Council 347,000 17,400 17,400 364,400 104,000 260,400 27.70% CY 2009 TDC less PT 72,131 77,190 (5,059) 89,531 77,190 12,341 12,341 86.22%
20 Chuloonawick, Native Village of 165,879 13,377 13,377 179,256 38,191 141,065 30.00% CY 2009 SAL 42,320 43,369 (1,050) 55,697 43,369 12,328 12,328 77.87%
21 Cook Inlet Tribal Council 879,172 46,325 46,325 925,497 493,497 432,000 24.44% FY 2009 FCF SAL 105,581 119,611 (14,030) 151,906 119,611 32,295 32,295 78.74%
22 Crooked Creek, Native Village of 209,696 15,548 15,548 225,244 1,503 223,741 30.57% CY 2009 PRO/FINAL TDC less PT 68,398 60,973 7,425 83,946 60,973 22,973 22,973 72.63%
23 Deering, Native Village of 100,622 10,571 10,571 111,193 7,400 103,793 30.00% CY 2009 TDC less PT 31,138 40,307 (9,169) 41,709 40,307 1,402 1,402 96.64%
24 Dot Lake, Native Village of 118,295 10,140 10,140 128,435 3,600 124,835 30.00% CY 2009 TDC less PT 37,451 34,567 2,884 47,591 34,567 13,024 13,024 72.63%
25 Eek, Native Village of 126,117 11,442 11,442 137,559 42,605 94,954 30.00% CY 2009 SAL 28,486 31,479 (2,993) 39,928 31,479 8,449 8,449 78.84%
26 Eklutna, Native Village of 165,438 12,235 12,235 177,673 34,485 143,188 30.00% FY 2009 SAL 42,956 42,732 224 55,191 42,732 12,459 12,459 77.43%
27 Emmonak, Native Village of 217,535 16,019 16,019 233,554 29,339 204,215 30.00% CY 2009 61,265 56,106 5,159 77,284 56,106 21,178 21,178 72.60%
28 Fairbanks Native Association 323,933 9,408 9,408 333,341 53,763 279,578 27.90% FY 2009 TDC less PT 78,002 63,489 14,513 87,410 63,489 23,921 23,921 72.63%
29 Gakona, Native Village of 147,100 6,863 6,863 153,963 19,475 134,488 40.36% FY 2009 SAL 54,279 46,399 7,880 61,142 46,399 14,743 14,743 75.89%
30 Georgetown, Native Village of 178,109 14,400 14,400 192,509 24,480 168,029 30.00% CY 2009 SAL 50,409 50,186 223 64,809 50,186 14,623 14,623 77.44%
FY 2010 Shortfall Report - Alaska Region
Total FY10 IDC Need for BIA ISEP Formula Funded
Programs (Linked from Column (N) of Choctaw Decision Schools tab)
IDC Funding PAID for FY10 for BIA ISEP Formula
Funded Programs (Linked from Column (L) of
Choctaw Decision Schools tab)
Total FY10 IDC SHORTFALL for BIA ISEP
Formula Funded Programs (Linked from Column (O) of Choctaw Decision Schools
tab)
DEPARTMENT OF THE INTERIORBureau of Indian Affairs
Alaska RegionContract Support Cost Shortfall Report
FY 2010
APPENDIX A
2
A B C D E F G H I J K L M N O P Q R S T U V W X Y Z= (E) - (F) = (C) + (E) = (H) - (I) = (J) x (K) = (O)+(P)-(Q) = (E)+(O)+(P) = (F) + (Q) = (S) - (T) = (X) + (U) = (W+T) / (S+V)
No. Tribe/ContractorTotal FY10 BIA OIP
Direct Program
FY10 ISD Funding
(Non-Recurring) FY10 DCSC Need
FY10 DCSC Funding PAID
(Recurring)FY10 DCSC
Shortfall
FY10 Ongoing Awards Adjusted - DCSC Need Only
LESS (-) Other Exclusions and Pass-Through
FY10 Direct Cost Base
Applicable IDC Rate
Year for which K Rate was Established
Type of IDC Rate Basis of IDC Rate FY10 IDC Need
FY10 Negotiated Lump Sum
Need
FY10 IDC PAID or Negotiated Lump
Sum PaidFY10 IDC Shortfall
Total FY10 CSC Need for Non-
School BIA Programs
CSC Funding PAID for FY10
Non-School BIA Programs
Total FY10 CSC SHORTFALL for Non-School BIA
Programs
FY10 Total CSC SHORTFALL for All
BIA Programs
% of Ongoing CSC Need
Funded
FY 2010 Shortfall Report - Alaska Region
Total FY10 IDC Need for BIA ISEP Formula Funded
Programs (Linked from Column (N) of Choctaw Decision Schools tab)
IDC Funding PAID for FY10 for BIA ISEP Formula
Funded Programs (Linked from Column (L) of
Choctaw Decision Schools tab)
Total FY10 IDC SHORTFALL for BIA ISEP
Formula Funded Programs (Linked from Column (O) of Choctaw Decision Schools
tab)
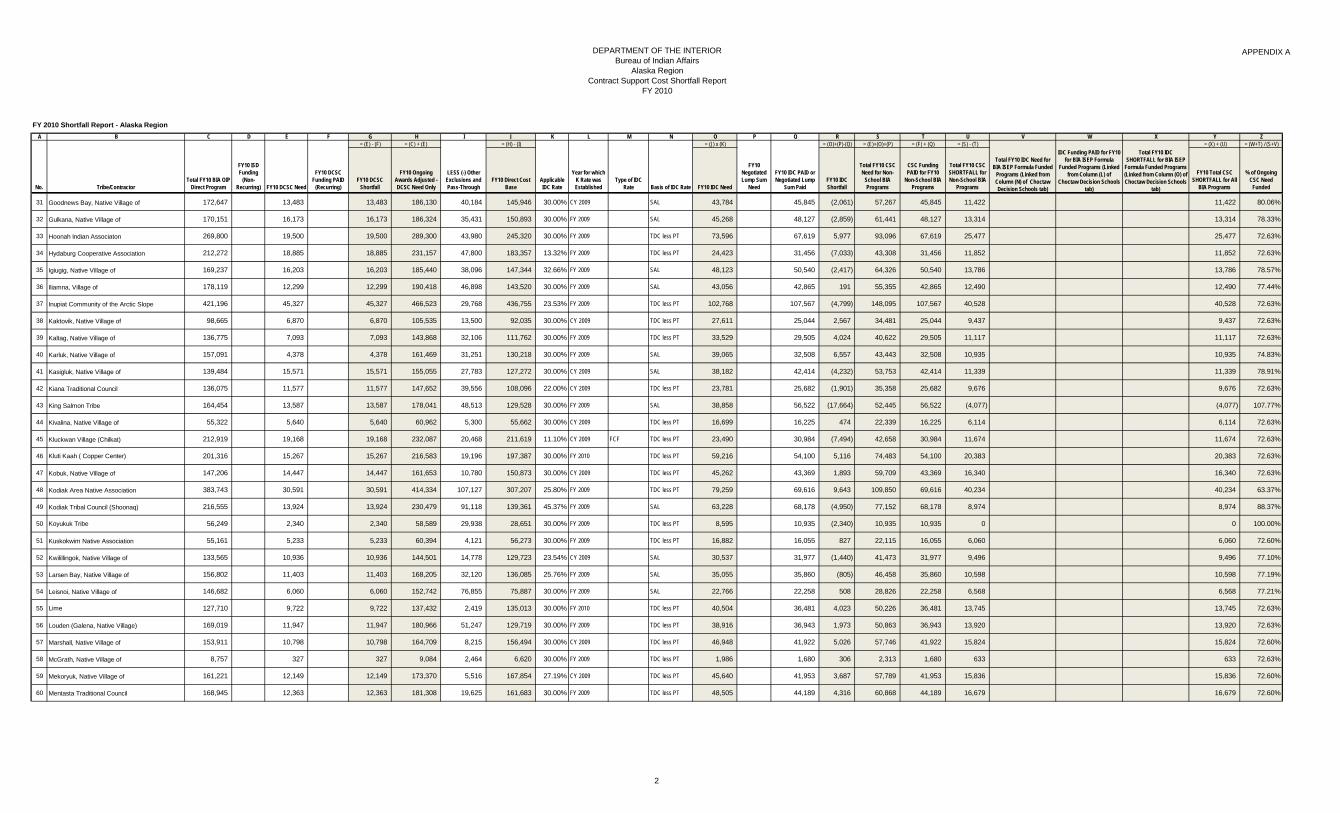
31 Goodnews Bay, Native Village of 172,647 13,483 13,483 186,130 40,184 145,946 30.00% CY 2009 SAL 43,784 45,845 (2,061) 57,267 45,845 11,422 11,422 80.06%
32 Gulkana, Native Village of 170,151 16,173 16,173 186,324 35,431 150,893 30.00% FY 2009 SAL 45,268 48,127 (2,859) 61,441 48,127 13,314 13,314 78.33%
33 Hoonah Indian Associaton 269,800 19,500 19,500 289,300 43,980 245,320 30.00% FY 2009 TDC less PT 73,596 67,619 5,977 93,096 67,619 25,477 25,477 72.63%
34 Hydaburg Cooperative Association 212,272 18,885 18,885 231,157 47,800 183,357 13.32% FY 2009 TDC less PT 24,423 31,456 (7,033) 43,308 31,456 11,852 11,852 72.63%
35 Igiugig, Native Village of 169,237 16,203 16,203 185,440 38,096 147,344 32.66% FY 2009 SAL 48,123 50,540 (2,417) 64,326 50,540 13,786 13,786 78.57%
36 Iliamna, Village of 178,119 12,299 12,299 190,418 46,898 143,520 30.00% FY 2009 SAL 43,056 42,865 191 55,355 42,865 12,490 12,490 77.44%
37 Inupiat Community of the Arctic Slope 421,196 45,327 45,327 466,523 29,768 436,755 23.53% FY 2009 TDC less PT 102,768 107,567 (4,799) 148,095 107,567 40,528 40,528 72.63%
38 Kaktovik, Native Village of 98,665 6,870 6,870 105,535 13,500 92,035 30.00% CY 2009 TDC less PT 27,611 25,044 2,567 34,481 25,044 9,437 9,437 72.63%
39 Kaltag, Native Village of 136,775 7,093 7,093 143,868 32,106 111,762 30.00% FY 2009 TDC less PT 33,529 29,505 4,024 40,622 29,505 11,117 11,117 72.63%
40 Karluk, Native Village of 157,091 4,378 4,378 161,469 31,251 130,218 30.00% FY 2009 SAL 39,065 32,508 6,557 43,443 32,508 10,935 10,935 74.83%
41 Kasigluk, Native Village of 139,484 15,571 15,571 155,055 27,783 127,272 30.00% CY 2009 SAL 38,182 42,414 (4,232) 53,753 42,414 11,339 11,339 78.91%
42 Kiana Traditional Council 136,075 11,577 11,577 147,652 39,556 108,096 22.00% CY 2009 TDC less PT 23,781 25,682 (1,901) 35,358 25,682 9,676 9,676 72.63%
43 King Salmon Tribe 164,454 13,587 13,587 178,041 48,513 129,528 30.00% FY 2009 SAL 38,858 56,522 (17,664) 52,445 56,522 (4,077) (4,077) 107.77%
44 Kivalina, Native Village of 55,322 5,640 5,640 60,962 5,300 55,662 30.00% CY 2009 TDC less PT 16,699 16,225 474 22,339 16,225 6,114 6,114 72.63%
45 Kluckwan Village (Chilkat) 212,919 19,168 19,168 232,087 20,468 211,619 11.10% CY 2009 FCF TDC less PT 23,490 30,984 (7,494) 42,658 30,984 11,674 11,674 72.63%
46 Kluti Kaah ( Copper Center) 201,316 15,267 15,267 216,583 19,196 197,387 30.00% FY 2010 TDC less PT 59,216 54,100 5,116 74,483 54,100 20,383 20,383 72.63%
47 Kobuk, Native Village of 147,206 14,447 14,447 161,653 10,780 150,873 30.00% CY 2009 TDC less PT 45,262 43,369 1,893 59,709 43,369 16,340 16,340 72.63%
48 Kodiak Area Native Association 383,743 30,591 30,591 414,334 107,127 307,207 25.80% FY 2009 TDC less PT 79,259 69,616 9,643 109,850 69,616 40,234 40,234 63.37%
49 Kodiak Tribal Council (Shoonaq) 216,555 13,924 13,924 230,479 91,118 139,361 45.37% FY 2009 SAL 63,228 68,178 (4,950) 77,152 68,178 8,974 8,974 88.37%
50 Koyukuk Tribe 56,249 2,340 2,340 58,589 29,938 28,651 30.00% FY 2009 TDC less PT 8,595 10,935 (2,340) 10,935 10,935 0 0 100.00%
51 Kuskokwim Native Association 55,161 5,233 5,233 60,394 4,121 56,273 30.00% FY 2009 TDC less PT 16,882 16,055 827 22,115 16,055 6,060 6,060 72.60%
52 Kwilillingok, Native Village of 133,565 10,936 10,936 144,501 14,778 129,723 23.54% CY 2009 SAL 30,537 31,977 (1,440) 41,473 31,977 9,496 9,496 77.10%
53 Larsen Bay, Native Village of 156,802 11,403 11,403 168,205 32,120 136,085 25.76% FY 2009 SAL 35,055 35,860 (805) 46,458 35,860 10,598 10,598 77.19%
54 Leisnoi, Native Village of 146,682 6,060 6,060 152,742 76,855 75,887 30.00% FY 2009 SAL 22,766 22,258 508 28,826 22,258 6,568 6,568 77.21%
55 Lime 127,710 9,722 9,722 137,432 2,419 135,013 30.00% FY 2010 TDC less PT 40,504 36,481 4,023 50,226 36,481 13,745 13,745 72.63%
56 Louden (Galena, Native Village) 169,019 11,947 11,947 180,966 51,247 129,719 30.00% FY 2009 TDC less PT 38,916 36,943 1,973 50,863 36,943 13,920 13,920 72.63%
57 Marshall, Native Village of 153,911 10,798 10,798 164,709 8,215 156,494 30.00% CY 2009 TDC less PT 46,948 41,922 5,026 57,746 41,922 15,824 15,824 72.60%
58 McGrath, Native Village of 8,757 327 327 9,084 2,464 6,620 30.00% FY 2009 TDC less PT 1,986 1,680 306 2,313 1,680 633 633 72.63%
59 Mekoryuk, Native Village of 161,221 12,149 12,149 173,370 5,516 167,854 27.19% CY 2009 TDC less PT 45,640 41,953 3,687 57,789 41,953 15,836 15,836 72.60%
60 Mentasta Traditional Council 168,945 12,363 12,363 181,308 19,625 161,683 30.00% FY 2009 TDC less PT 48,505 44,189 4,316 60,868 44,189 16,679 16,679 72.60%
DEPARTMENT OF THE INTERIORBureau of Indian Affairs
Alaska RegionContract Support Cost Shortfall Report
FY 2010
APPENDIX A
3
A B C D E F G H I J K L M N O P Q R S T U V W X Y Z= (E) - (F) = (C) + (E) = (H) - (I) = (J) x (K) = (O)+(P)-(Q) = (E)+(O)+(P) = (F) + (Q) = (S) - (T) = (X) + (U) = (W+T) / (S+V)
No. Tribe/ContractorTotal FY10 BIA OIP
Direct Program
FY10 ISD Funding
(Non-Recurring) FY10 DCSC Need
FY10 DCSC Funding PAID
(Recurring)FY10 DCSC
Shortfall
FY10 Ongoing Awards Adjusted - DCSC Need Only
LESS (-) Other Exclusions and Pass-Through
FY10 Direct Cost Base
Applicable IDC Rate
Year for which K Rate was Established
Type of IDC Rate Basis of IDC Rate FY10 IDC Need
FY10 Negotiated Lump Sum
Need
FY10 IDC PAID or Negotiated Lump
Sum PaidFY10 IDC Shortfall
Total FY10 CSC Need for Non-
School BIA Programs
CSC Funding PAID for FY10
Non-School BIA Programs
Total FY10 CSC SHORTFALL for Non-School BIA
Programs
FY10 Total CSC SHORTFALL for All
BIA Programs
% of Ongoing CSC Need
Funded
FY 2010 Shortfall Report - Alaska Region
Total FY10 IDC Need for BIA ISEP Formula Funded
Programs (Linked from Column (N) of Choctaw Decision Schools tab)
IDC Funding PAID for FY10 for BIA ISEP Formula
Funded Programs (Linked from Column (L) of
Choctaw Decision Schools tab)
Total FY10 IDC SHORTFALL for BIA ISEP
Formula Funded Programs (Linked from Column (O) of Choctaw Decision Schools
tab)
61 Naknek, Native Village of 139,494 7,461 7,461 146,955 12,865 134,090 30.00% FY 2009 TDC less PT 40,227 35,509 4,718 47,688 35,509 12,179 12,179 74.46%
62 Native Village of Russian Mission (Iqurmiut Traditional Council-Yukon)
91,939 8,736 8,736 100,675 12,120 88,555 30.00% CY 2009 SAL 26,567 27,531 (965) 35,303 27,531 7,772 7,772 77.99%
63 New Stuyahok, Native Village of 89,522 7,110 7,110 96,632 13,341 83,291 30.00% FY 2009 TDC less PT 24,987 23,302 1,685 32,097 23,302 8,795 8,795 72.60%
64 Newhalen, Native Village of 133,418 10,481 10,481 143,899 7,420 136,479 30.00% FY 2009 TDC less PT 40,944 37,352 3,592 51,425 37,352 14,073 14,073 72.63%
65 Newtok, Native Village of 167,368 17,569 17,569 184,937 25,789 159,148 30.00% CY 2009 SAL 47,744 51,242 (3,498) 65,313 51,242 14,071 14,071 78.46%
66 Nightmute, Native Village of 117,680 12,105 12,105 129,785 129,785 30.00% CY 2009 TDC less PT 38,936 37,054 1,882 51,041 37,054 13,987 13,987 72.60%
67 Ninilchik, Native Village of 168,699 16,234 16,234 184,933 40,001 144,932 68.01% CY 2009 SAL 98,568 91,405 7,163 114,802 91,405 23,397 23,397 79.62%
68 Noatak, Native Village of 141,766 11,259 11,259 153,025 32,917 120,108 30.00% CY 2009 TDC less PT 36,032 36,899 (867) 47,291 36,899 10,392 10,392 78.02%
69 Nondalton, Native Village of 186,004 11,204 11,204 197,208 63,305 133,903 30.00% FY 2009 TDC less PT 40,171 37,297 2,874 51,375 37,297 14,078 14,078 72.60%
70 Northway, Native Village of 181,067 16,995 16,995 198,062 10,953 187,109 30.00% FY 2009 TDC less PT 56,133 53,115 3,018 73,128 53,115 20,013 20,013 72.63%
71 Nuiqsut, Native Village of 79,075 4,851 4,851 83,926 28,160 55,766 30.00% FY 2009 TDC less PT 16,730 15,675 1,055 21,581 15,675 5,906 5,906 72.63%
72 Nunakauyarmiut Tribe (Toksook Bay) 125,248 12,441 12,441 137,689 17,270 120,419 30.00% CY 2009 SAL 36,126 42,138 (6,012) 48,567 42,138 6,429 6,429 86.76%
73 Nunapitchuk, Native Village of 139,819 12,186 12,186 152,005 27,394 124,611 30.00% CY 2009 SAL 37,383 38,640 (1,257) 49,569 38,640 10,929 10,929 77.95%
74 Old Harbor, Village of 98,785 9,397 9,397 108,182 11,597 96,585 10.68% FY 2009 SAL 10,315 15,039 (4,724) 19,712 15,039 4,673 4,673 76.29%
75 Organized Village of Kwethluk 175,127 19,377 19,377 194,504 30,783 163,721 30.00% CY 2009 SAL 49,116 53,971 (4,855) 68,493 53,971 14,522 14,522 78.80%
76 Ouzinkie, Native Village of 161,244 11,466 11,466 172,710 47,525 125,185 30.00% FY 2009 SAL 37,556 38,105 (550) 49,022 38,105 10,917 10,917 77.73%
77 Paimiut, Native Village of 168,836 14,850 14,850 183,686 16,850 166,836 30.00% CY 2009 SAL 50,051 50,350 (299) 64,901 50,350 14,551 14,551 77.58%
78 Pedro Bay, Native Village of 187,177 16,177 16,177 203,354 31,148 172,206 30.00% FY 2009 SAL 51,662 52,799 (1,137) 67,839 52,799 15,040 15,040 77.83%
79 Pitka's Point, Native Village of 186,658 12,044 12,044 198,702 20,419 178,283 30.00% CY 2009 SAL 53,485 50,195 3,290 65,529 50,195 15,334 15,334 76.60%
80 Point Hope, Native Village of 211,460 20,155 20,155 231,615 48,543 183,072 30.00% FY 2009 TDC less PT 54,922 75,077 (20,155) 75,077 75,077 (0) (0) 100.00%
81 Port Heiden, Native Village of 146,076 13,691 13,691 159,767 15,691 144,076 30.00% FY 2009 SAL 43,223 61,021 (17,798) 56,914 61,021 (4,107) (4,107) 107.22%
82 Port Lyons, Native Village of 141,188 11,222 11,222 152,410 11,222 141,188 30.00% FY 2009 SAL 42,356 55,961 (13,605) 53,578 55,961 (2,383) (2,383) 104.45%
83 Qagan Tayagungin Tribe (Sand Pt.) 14,945 1,229 1,229 16,174 4,142 12,032 30.00% FY 2009 SAL 3,610 3,782 (172) 4,839 3,782 1,057 1,057 78.16%
84 Qawalangin Tribe of Unalaska 138,578 8,905 8,905 147,483 40,160 107,323 30.00% FY 2009 SAL 32,197 31,794 403 41,102 31,794 9,308 9,308 77.35%
85 Ruby, Native Village of 141,689 6,031 6,031 147,720 31,966 115,754 31.01% FY 2009 TDC less PT 35,895 39,331 (3,436) 41,926 39,331 2,595 2,595 93.81%
86 Selawik, Native Village of 204,123 12,274 12,274 216,397 22,305 194,092 30.00% CY 2009 TDC less PT 58,228 51,208 7,020 70,502 51,208 19,294 19,294 72.63%
87 Sleetmute, Native Village of 167,095 17,672 17,672 184,767 17,672 167,095 30.00% CY 2009 SAL 50,129 53,070 (2,942) 67,801 53,070 14,731 14,731 78.27%
88 South Naknek, Native Village of 136,996 13,770 13,770 150,766 13,770 136,996 30.00% FY 2009 SAL 41,099 42,854 (1,755) 54,869 42,854 12,015 12,015 78.10%
89 Stevens, Native Village of 152,462 12,436 12,436 164,898 15,820 149,078 30.00% CY 2009 TDC less PT 44,723 41,517 3,206 57,159 41,517 15,642 15,642 72.63%
90 Tazlina, Native Village of 30,450 3,755 3,755 34,205 3,600 30,605 30.00% FY 2009 TDC less PT 9,182 9,396 (215) 12,937 9,396 3,541 3,541 72.63%
DEPARTMENT OF THE INTERIORBureau of Indian Affairs
Alaska RegionContract Support Cost Shortfall Report
FY 2010
APPENDIX A
4
A B C D E F G H I J K L M N O P Q R S T U V W X Y Z= (E) - (F) = (C) + (E) = (H) - (I) = (J) x (K) = (O)+(P)-(Q) = (E)+(O)+(P) = (F) + (Q) = (S) - (T) = (X) + (U) = (W+T) / (S+V)
No. Tribe/ContractorTotal FY10 BIA OIP
Direct Program
FY10 ISD Funding
(Non-Recurring) FY10 DCSC Need
FY10 DCSC Funding PAID
(Recurring)FY10 DCSC
Shortfall
FY10 Ongoing Awards Adjusted - DCSC Need Only
LESS (-) Other Exclusions and Pass-Through
FY10 Direct Cost Base
Applicable IDC Rate
Year for which K Rate was Established
Type of IDC Rate Basis of IDC Rate FY10 IDC Need
FY10 Negotiated Lump Sum
Need
FY10 IDC PAID or Negotiated Lump
Sum PaidFY10 IDC Shortfall
Total FY10 CSC Need for Non-
School BIA Programs
CSC Funding PAID for FY10
Non-School BIA Programs
Total FY10 CSC SHORTFALL for Non-School BIA
Programs
FY10 Total CSC SHORTFALL for All
BIA Programs
% of Ongoing CSC Need
Funded
FY 2010 Shortfall Report - Alaska Region
Total FY10 IDC Need for BIA ISEP Formula Funded
Programs (Linked from Column (N) of Choctaw Decision Schools tab)
IDC Funding PAID for FY10 for BIA ISEP Formula
Funded Programs (Linked from Column (L) of
Choctaw Decision Schools tab)
Total FY10 IDC SHORTFALL for BIA ISEP
Formula Funded Programs (Linked from Column (O) of Choctaw Decision Schools
tab)
91 Traditional Village of Togiak 132,264 7,766 7,766 140,030 15,650 124,380 56.06% FY 2009 TDC less PT 69,727 56,286 13,441 77,493 56,286 21,207 21,207 72.63%
92 Tuluksak, Native Village of 108,132 13,859 13,859 121,991 121,991 30.00% CY 2009 TDC less PT 36,597 36,630 (33) 50,456 36,630 13,826 13,826 72.60%
93 Tununak, Native Village of 96,201 12,249 12,249 108,450 108,450 30.00% CY 2009 TDC less PT 32,535 32,528 7 44,784 32,528 12,256 12,256 72.63%
94 Tyonek, Native Village of 160,296 10,277 10,277 170,573 55,279 115,294 21.14% FY 2009 TDC less PT 24,373 25,155 (782) 34,650 25,155 9,495 9,495 72.60%
95 Ugashik, Native Village of 307,905 19,206 19,206 327,111 56,191 270,920 30.00% FY 2009 TDC less PT 81,276 72,984 8,292 100,482 72,984 27,498 27,498 72.63%
96 Umkumiut, Native Village of 159,868 15,878 15,878 175,746 7,500 168,246 30.00% CY 2009 TDC less PT 50,474 48,194 2,280 66,352 48,194 18,158 18,158 72.63%
97 Valdez Native Tribe 78,779 5,939 5,939 84,718 6,700 78,018 38.00% FY 2009 TDC less PT 29,647 29,480 167 35,586 29,480 6,106 6,106 82.84%
98 Yupiit of Andreafski 170,398 15,000 15,000 185,398 3,000 182,398 30.00% CY 2009 TDC less PT 54,719 50,614 4,105 69,719 50,614 19,105 19,105 72.60%
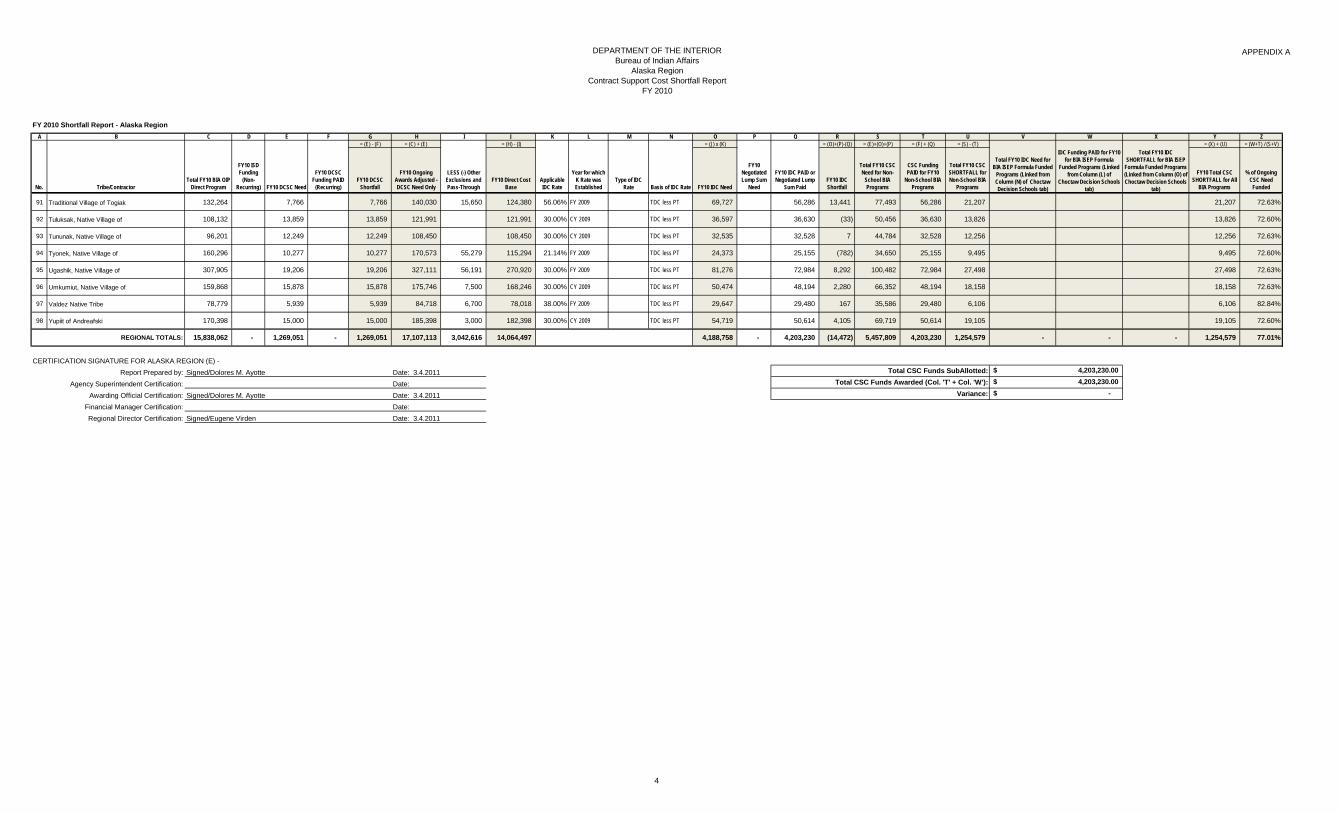
REGIONAL TOTALS: 15,838,062 - 1,269,051 - 1,269,051 17,107,113 3,042,616 14,064,497 4,188,758 - 4,203,230 (14,472) 5,457,809 4,203,230 1,254,579 - - - 1,254,579 77.01%
Report Prepared by: Date: 3.4.2011Agency Superintendent Certification: Date:
Awarding Official Certification: Date: 3.4.2011Financial Manager Certification: Date:Regional Director Certification: Date: 3.4.2011
CERTIFICATION SIGNATURE FOR ALASKA REGION (E) -Signed/Dolores M. Ayotte
Signed/Eugene Virden
4,203,230.00$ 4,203,230.00$
Signed/Dolores M. Ayotte -$
Total CSC Funds SubAllotted:Total CSC Funds Awarded (Col. 'T' + Col. 'W'):
Variance:
DEPARTMENT OF THE INTERIORBureau of Indian Affairs
Midwest RegionContract Support Cost Shortfall Report
FY 2010
APPENDIX A
1
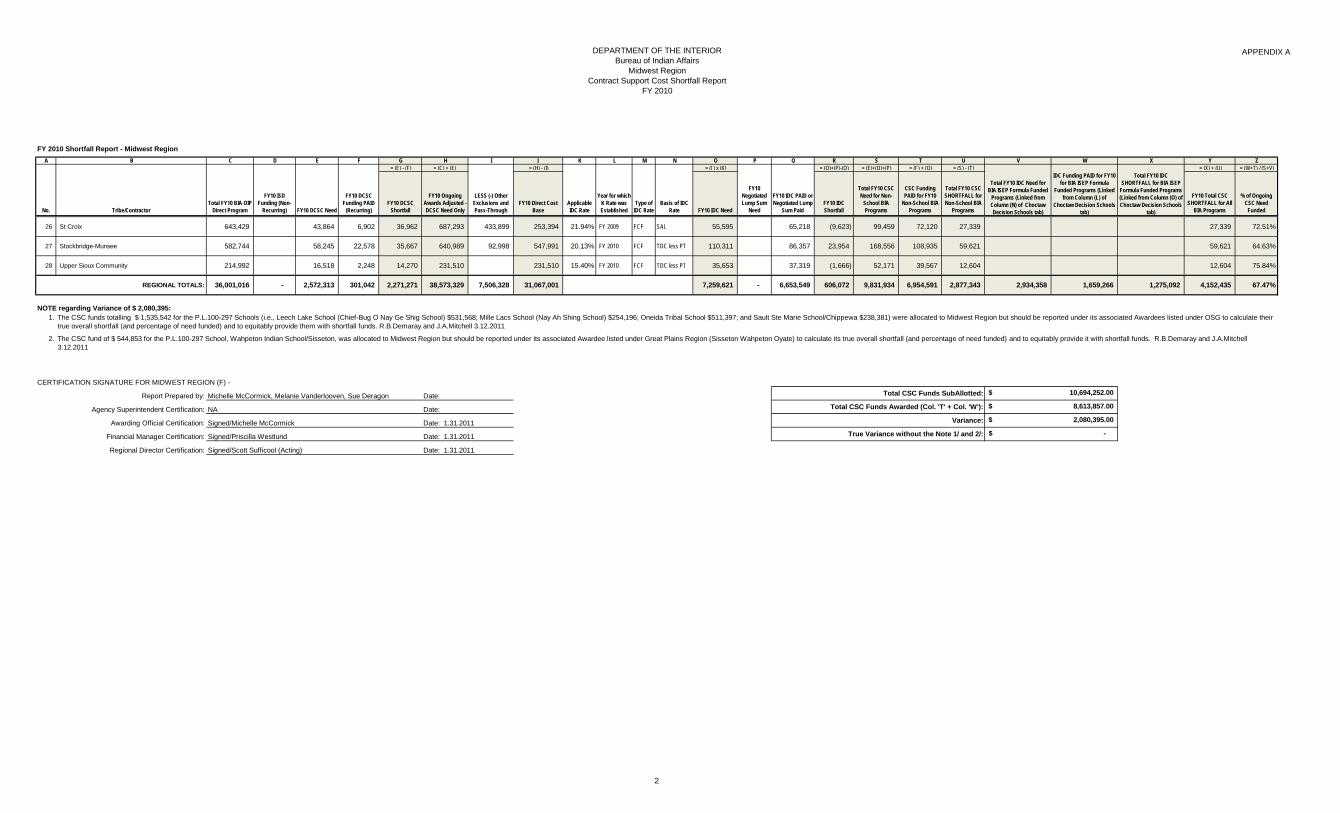
A B C D E F G H I J K L M N O P Q R S T U V W X Y Z= (E) - (F) = (C) + (E) = (H) - (I) = (J) x (K) = (O)+(P)-(Q) = (E)+(O)+(P) = (F) + (Q) = (S) - (T) = (X) + (U) = (W+T) / (S+V)
No. Tribe/ContractorTotal FY10 BIA OIP
Direct Program
FY10 ISD Funding (Non-
Recurring) FY10 DCSC Need
FY10 DCSC Funding PAID
(Recurring)FY10 DCSC
Shortfall
FY10 Ongoing Awards Adjusted - DCSC Need Only
LESS (-) Other Exclusions and Pass-Through
FY10 Direct Cost Base
Applicable IDC Rate
Year for which K Rate was Established
Type of IDC Rate
Basis of IDC Rate FY10 IDC Need
FY10 Negotiated Lump Sum
Need
FY10 IDC PAID or Negotiated Lump
Sum PaidFY10 IDC Shortfall
Total FY10 CSC Need for Non-
School BIA Programs
CSC Funding PAID for FY10
Non-School BIA Programs
Total FY10 CSC SHORTFALL for Non-School BIA
Programs
FY10 Total CSC SHORTFALL for All
BIA Programs
% of Ongoing CSC Need
Funded
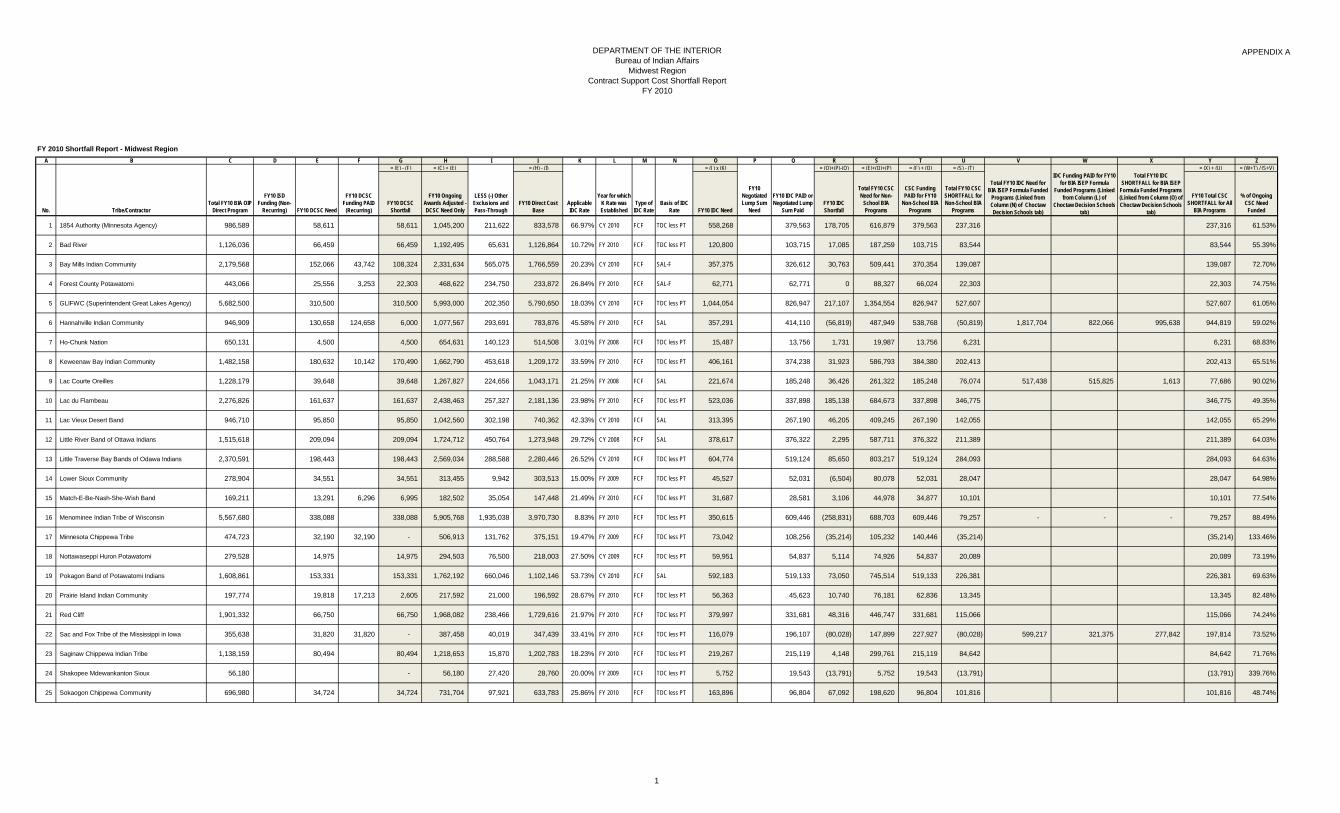
1 1854 Authority (Minnesota Agency) 986,589 58,611 58,611 1,045,200 211,622 833,578 66.97% CY 2010 FCF TDC less PT 558,268 379,563 178,705 616,879 379,563 237,316 237,316 61.53%
2 Bad River 1,126,036 66,459 66,459 1,192,495 65,631 1,126,864 10.72% FY 2010 FCF TDC less PT 120,800 103,715 17,085 187,259 103,715 83,544 83,544 55.39%
3 Bay Mills Indian Community 2,179,568 152,066 43,742 108,324 2,331,634 565,075 1,766,559 20.23% CY 2010 FCF SAL-F 357,375 326,612 30,763 509,441 370,354 139,087 139,087 72.70%
4 Forest County Potawatomi 443,066 25,556 3,253 22,303 468,622 234,750 233,872 26.84% FY 2010 FCF SAL-F 62,771 62,771 0 88,327 66,024 22,303 22,303 74.75%
5 GLIFWC (Superintendent Great Lakes Agency) 5,682,500 310,500 310,500 5,993,000 202,350 5,790,650 18.03% CY 2010 FCF TDC less PT 1,044,054 826,947 217,107 1,354,554 826,947 527,607 527,607 61.05%
6 Hannahville Indian Community 946,909 130,658 124,658 6,000 1,077,567 293,691 783,876 45.58% FY 2010 FCF SAL 357,291 414,110 (56,819) 487,949 538,768 (50,819) 1,817,704 822,066 995,638 944,819 59.02%
7 Ho-Chunk Nation 650,131 4,500 4,500 654,631 140,123 514,508 3.01% FY 2008 FCF TDC less PT 15,487 13,756 1,731 19,987 13,756 6,231 6,231 68.83%
8 Keweenaw Bay Indian Community 1,482,158 180,632 10,142 170,490 1,662,790 453,618 1,209,172 33.59% FY 2010 FCF TDC less PT 406,161 374,238 31,923 586,793 384,380 202,413 202,413 65.51%
9 Lac Courte Oreilles 1,228,179 39,648 39,648 1,267,827 224,656 1,043,171 21.25% FY 2008 FCF SAL 221,674 185,248 36,426 261,322 185,248 76,074 517,438 515,825 1,613 77,686 90.02%
10 Lac du Flambeau 2,276,826 161,637 161,637 2,438,463 257,327 2,181,136 23.98% FY 2010 FCF TDC less PT 523,036 337,898 185,138 684,673 337,898 346,775 346,775 49.35%
11 Lac Vieux Desert Band 946,710 95,850 95,850 1,042,560 302,198 740,362 42.33% CY 2010 FCF SAL 313,395 267,190 46,205 409,245 267,190 142,055 142,055 65.29%
12 Little River Band of Ottawa Indians 1,515,618 209,094 209,094 1,724,712 450,764 1,273,948 29.72% CY 2008 FCF SAL 378,617 376,322 2,295 587,711 376,322 211,389 211,389 64.03%
13 Little Traverse Bay Bands of Odawa Indians 2,370,591 198,443 198,443 2,569,034 288,588 2,280,446 26.52% CY 2010 FCF TDC less PT 604,774 519,124 85,650 803,217 519,124 284,093 284,093 64.63%
14 Lower Sioux Community 278,904 34,551 34,551 313,455 9,942 303,513 15.00% FY 2009 FCF TDC less PT 45,527 52,031 (6,504) 80,078 52,031 28,047 28,047 64.98%
15 Match-E-Be-Nash-She-Wish Band 169,211 13,291 6,296 6,995 182,502 35,054 147,448 21.49% FY 2010 FCF TDC less PT 31,687 28,581 3,106 44,978 34,877 10,101 10,101 77.54%
16 Menominee Indian Tribe of Wisconsin 5,567,680 338,088 338,088 5,905,768 1,935,038 3,970,730 8.83% FY 2010 FCF TDC less PT 350,615 609,446 (258,831) 688,703 609,446 79,257 - - - 79,257 88.49%
17 Minnesota Chippewa Tribe 474,723 32,190 32,190 - 506,913 131,762 375,151 19.47% FY 2009 FCF TDC less PT 73,042 108,256 (35,214) 105,232 140,446 (35,214) (35,214) 133.46%
18 Nottawaseppi Huron Potawatomi 279,528 14,975 14,975 294,503 76,500 218,003 27.50% CY 2009 FCF TDC less PT 59,951 54,837 5,114 74,926 54,837 20,089 20,089 73.19%
19 Pokagon Band of Potawatomi Indians 1,608,861 153,331 153,331 1,762,192 660,046 1,102,146 53.73% CY 2010 FCF SAL 592,183 519,133 73,050 745,514 519,133 226,381 226,381 69.63%
20 Prairie Island Indian Community 197,774 19,818 17,213 2,605 217,592 21,000 196,592 28.67% FY 2010 FCF TDC less PT 56,363 45,623 10,740 76,181 62,836 13,345 13,345 82.48%
21 Red Cliff 1,901,332 66,750 66,750 1,968,082 238,466 1,729,616 21.97% FY 2010 FCF TDC less PT 379,997 331,681 48,316 446,747 331,681 115,066 115,066 74.24%
22 Sac and Fox Tribe of the Mississippi in Iowa 355,638 31,820 31,820 - 387,458 40,019 347,439 33.41% FY 2010 FCF TDC less PT 116,079 196,107 (80,028) 147,899 227,927 (80,028) 599,217 321,375 277,842 197,814 73.52%
23 Saginaw Chippewa Indian Tribe 1,138,159 80,494 80,494 1,218,653 15,870 1,202,783 18.23% FY 2010 FCF TDC less PT 219,267 215,119 4,148 299,761 215,119 84,642 84,642 71.76%
24 Shakopee Mdewankanton Sioux 56,180 - 56,180 27,420 28,760 20.00% FY 2009 FCF TDC less PT 5,752 19,543 (13,791) 5,752 19,543 (13,791) (13,791) 339.76%
25 Sokaogon Chippewa Community 696,980 34,724 34,724 731,704 97,921 633,783 25.86% FY 2010 FCF TDC less PT 163,896 96,804 67,092 198,620 96,804 101,816 101,816 48.74%
FY 2010 Shortfall Report - Midwest Region
Total FY10 IDC SHORTFALL for BIA ISEP
Formula Funded Programs (Linked from Column (O) of Choctaw Decision Schools
tab)
Total FY10 IDC Need for BIA ISEP Formula Funded
Programs (Linked from Column (N) of Choctaw Decision Schools tab)
IDC Funding PAID for FY10 for BIA ISEP Formula
Funded Programs (Linked from Column (L) of
Choctaw Decision Schools tab)
DEPARTMENT OF THE INTERIORBureau of Indian Affairs
Midwest RegionContract Support Cost Shortfall Report
FY 2010
APPENDIX A
2
A B C D E F G H I J K L M N O P Q R S T U V W X Y Z= (E) - (F) = (C) + (E) = (H) - (I) = (J) x (K) = (O)+(P)-(Q) = (E)+(O)+(P) = (F) + (Q) = (S) - (T) = (X) + (U) = (W+T) / (S+V)
No. Tribe/ContractorTotal FY10 BIA OIP
Direct Program
FY10 ISD Funding (Non-
Recurring) FY10 DCSC Need
FY10 DCSC Funding PAID
(Recurring)FY10 DCSC
Shortfall
FY10 Ongoing Awards Adjusted - DCSC Need Only
LESS (-) Other Exclusions and Pass-Through
FY10 Direct Cost Base
Applicable IDC Rate
Year for which K Rate was Established
Type of IDC Rate
Basis of IDC Rate FY10 IDC Need
FY10 Negotiated Lump Sum
Need
FY10 IDC PAID or Negotiated Lump
Sum PaidFY10 IDC Shortfall
Total FY10 CSC Need for Non-
School BIA Programs
CSC Funding PAID for FY10
Non-School BIA Programs
Total FY10 CSC SHORTFALL for Non-School BIA
Programs
FY10 Total CSC SHORTFALL for All
BIA Programs
% of Ongoing CSC Need
Funded
FY 2010 Shortfall Report - Midwest Region
Total FY10 IDC SHORTFALL for BIA ISEP
Formula Funded Programs (Linked from Column (O) of Choctaw Decision Schools
tab)
Total FY10 IDC Need for BIA ISEP Formula Funded
Programs (Linked from Column (N) of Choctaw Decision Schools tab)
IDC Funding PAID for FY10 for BIA ISEP Formula
Funded Programs (Linked from Column (L) of
Choctaw Decision Schools tab)
26 St Croix 643,429 43,864 6,902 36,962 687,293 433,899 253,394 21.94% FY 2009 FCF SAL 55,595 65,218 (9,623) 99,459 72,120 27,339 27,339 72.51%
27 Stockbridge-Munsee 582,744 58,245 22,578 35,667 640,989 92,998 547,991 20.13% FY 2010 FCF TDC less PT 110,311 86,357 23,954 168,556 108,935 59,621 59,621 64.63%
28 Upper Sioux Community 214,992 16,518 2,248 14,270 231,510 231,510 15.40% FY 2010 FCF TDC less PT 35,653 37,319 (1,666) 52,171 39,567 12,604 12,604 75.84%
REGIONAL TOTALS: 36,001,016 - 2,572,313 301,042 2,271,271 38,573,329 7,506,328 31,067,001 7,259,621 - 6,653,549 606,072 9,831,934 6,954,591 2,877,343 2,934,358 1,659,266 1,275,092 4,152,435 67.47%
NOTE regarding Variance of $ 2,080,395:1.
2.
CERTIFICATION SIGNATURE FOR MIDWEST REGION (F) -
Report Prepared by: Date:
Agency Superintendent Certification: Date:
Awarding Official Certification: Date: 1.31.2011
Financial Manager Certification: Date: 1.31.2011
Regional Director Certification: Date: 1.31.2011
Michelle McCormick, Melanie Vanderlooven, Sue Deragon
NA
Signed/Michelle McCormick
Signed/Priscilla Westlund
10,694,252.00$
8,613,857.00$
2,080,395.00$
True Variance without the Note 1/ and 2/:
Signed/Scott Sufficool (Acting)
Total CSC Funds SubAllotted:
Total CSC Funds Awarded (Col. 'T' + Col. 'W'):
Variance:
-$
The CSC fund of $ 544,853 for the P.L.100-297 School, Wahpeton Indian School/Sisseton, was allocated to Midwest Region but should be reported under its associated Awardee listed under Great Plains Region (Sisseton Wahpeton Oyate) to calculate its true overall shortfall (and percentage of need funded) and to equitably provide it with shortfall funds. R.B.Demaray and J.A.Mitchell 3.12.2011
The CSC funds totalling $ 1,535,542 for the P.L.100-297 Schools (i.e., Leech Lake School (Chief-Bug O Nay Ge Shig School) $531,568; Mille Lacs School (Nay Ah Shing School) $254,196; Oneida Tribal School $511,397; and Sault Ste Marie School/Chippewa $238,381) were allocated to Midwest Region but should be reported under its associated Awardees listed under OSG to calculate their true overall shortfall (and percentage of need funded) and to equitably provide them with shortfall funds. R.B.Demaray and J.A.Mitchell 3.12.2011
DEPARTMENT OF THE INTERIORBureau of Indian Affairs
Eastern Oklahoma RegionContract Support Cost Shortfall Report
FY 2010
APPENDIX A
1
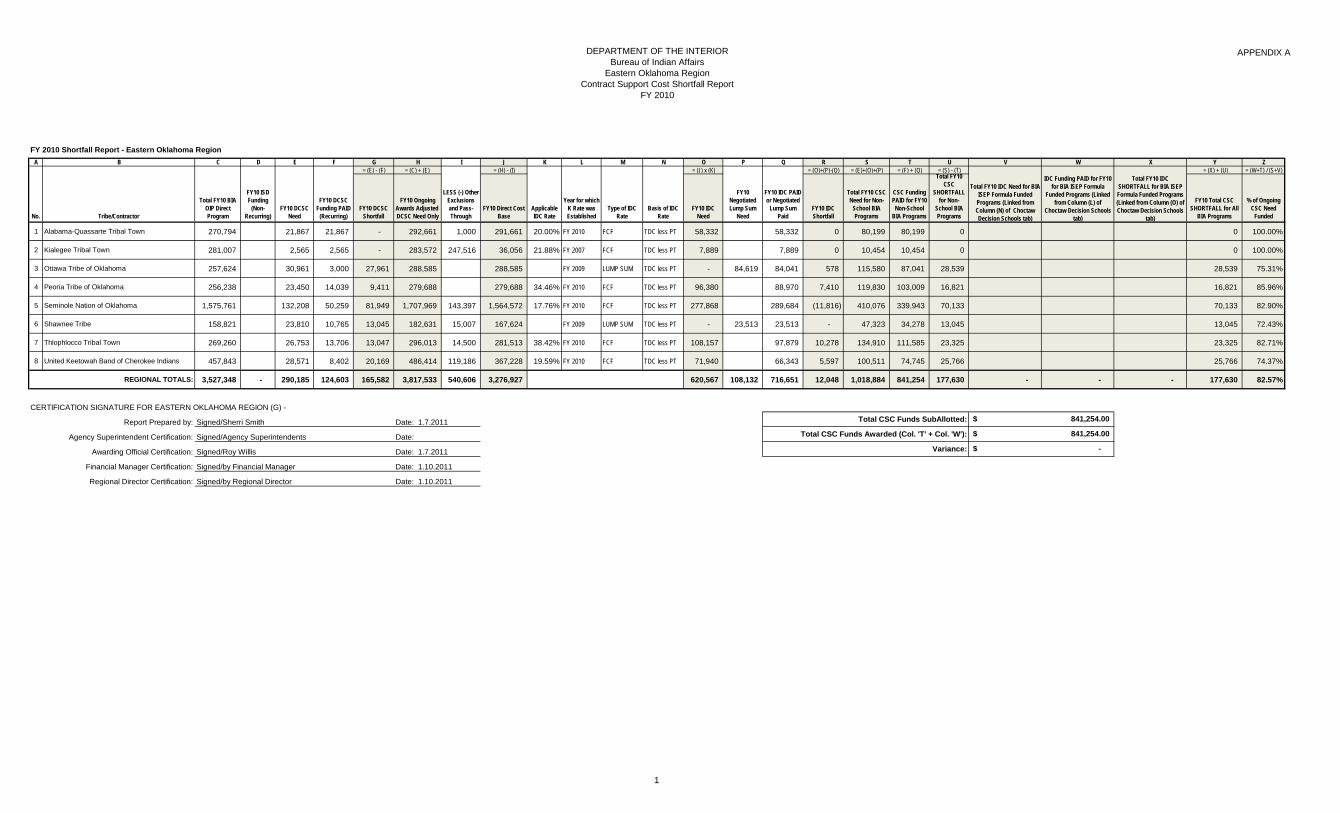
A B C D E F G H I J K L M N O P Q R S T U V W X Y Z= (E) - (F) = (C) + (E) = (H) - (I) = (J) x (K) = (O)+(P)-(Q) = (E)+(O)+(P) = (F) + (Q) = (S) - (T) = (X) + (U) = (W+T) / (S+V)
No. Tribe/Contractor
Total FY10 BIA OIP Direct Program
FY10 ISD Funding
(Non-Recurring)
FY10 DCSC Need
FY10 DCSC Funding PAID
(Recurring)FY10 DCSC
Shortfall
FY10 Ongoing Awards Adjusted - DCSC Need Only
LESS (-) Other Exclusions and Pass-Through
FY10 Direct Cost Base
Applicable IDC Rate
Year for which K Rate was Established
Type of IDC Rate
Basis of IDC Rate
FY10 IDC Need
FY10 Negotiated Lump Sum
Need
FY10 IDC PAID or Negotiated
Lump Sum Paid
FY10 IDC Shortfall
Total FY10 CSC Need for Non-
School BIA Programs
CSC Funding PAID for FY10 Non-School
BIA Programs
Total FY10 CSC
SHORTFALL for Non-
School BIA Programs
FY10 Total CSC SHORTFALL for All
BIA Programs
% of Ongoing CSC Need
Funded
1 Alabama-Quassarte Tribal Town 270,794 21,867 21,867 - 292,661 1,000 291,661 20.00% FY 2010 FCF TDC less PT 58,332 58,332 0 80,199 80,199 0 0 100.00%
2 Kialegee Tribal Town 281,007 2,565 2,565 - 283,572 247,516 36,056 21.88% FY 2007 FCF TDC less PT 7,889 7,889 0 10,454 10,454 0 0 100.00%
3 Ottawa Tribe of Oklahoma 257,624 30,961 3,000 27,961 288,585 288,585 FY 2009 LUMP SUM TDC less PT - 84,619 84,041 578 115,580 87,041 28,539 28,539 75.31%
4 Peoria Tribe of Oklahoma 256,238 23,450 14,039 9,411 279,688 279,688 34.46% FY 2010 FCF TDC less PT 96,380 88,970 7,410 119,830 103,009 16,821 16,821 85.96%
5 Seminole Nation of Oklahoma 1,575,761 132,208 50,259 81,949 1,707,969 143,397 1,564,572 17.76% FY 2010 FCF TDC less PT 277,868 289,684 (11,816) 410,076 339,943 70,133 70,133 82.90%
6 Shawnee Tribe 158,821 23,810 10,765 13,045 182,631 15,007 167,624 FY 2009 LUMP SUM TDC less PT - 23,513 23,513 - 47,323 34,278 13,045 13,045 72.43%
7 Thlophlocco Tribal Town 269,260 26,753 13,706 13,047 296,013 14,500 281,513 38.42% FY 2010 FCF TDC less PT 108,157 97,879 10,278 134,910 111,585 23,325 23,325 82.71%
8 United Keetowah Band of Cherokee Indians 457,843 28,571 8,402 20,169 486,414 119,186 367,228 19.59% FY 2010 FCF TDC less PT 71,940 66,343 5,597 100,511 74,745 25,766 25,766 74.37%
REGIONAL TOTALS: 3,527,348 - 290,185 124,603 165,582 3,817,533 540,606 3,276,927 620,567 108,132 716,651 12,048 1,018,884 841,254 177,630 - - - 177,630 82.57%
CERTIFICATION SIGNATURE FOR EASTERN OKLAHOMA REGION (G) -
Report Prepared by: Date: 1.7.2011
Agency Superintendent Certification: Date:
Awarding Official Certification: Date: 1.7.2011
Financial Manager Certification: Date: 1.10.2011
Regional Director Certification: Date: 1.10.2011
FY 2010 Shortfall Report - Eastern Oklahoma Region
841,254.00$
841,254.00$
-$
Total FY10 IDC Need for BIA ISEP Formula Funded
Programs (Linked from Column (N) of Choctaw Decision Schools tab)
IDC Funding PAID for FY10 for BIA ISEP Formula
Funded Programs (Linked from Column (L) of
Choctaw Decision Schools tab)
Total FY10 IDC SHORTFALL for BIA ISEP Formula Funded Programs (Linked from Column (O) of Choctaw Decision Schools
tab)
Total CSC Funds SubAllotted:
Total CSC Funds Awarded (Col. 'T' + Col. 'W'):
Variance:
Signed/by Financial Manager
Signed/by Regional Director
Signed/Sherri Smith
Signed/Agency Superintendents
Signed/Roy Willis
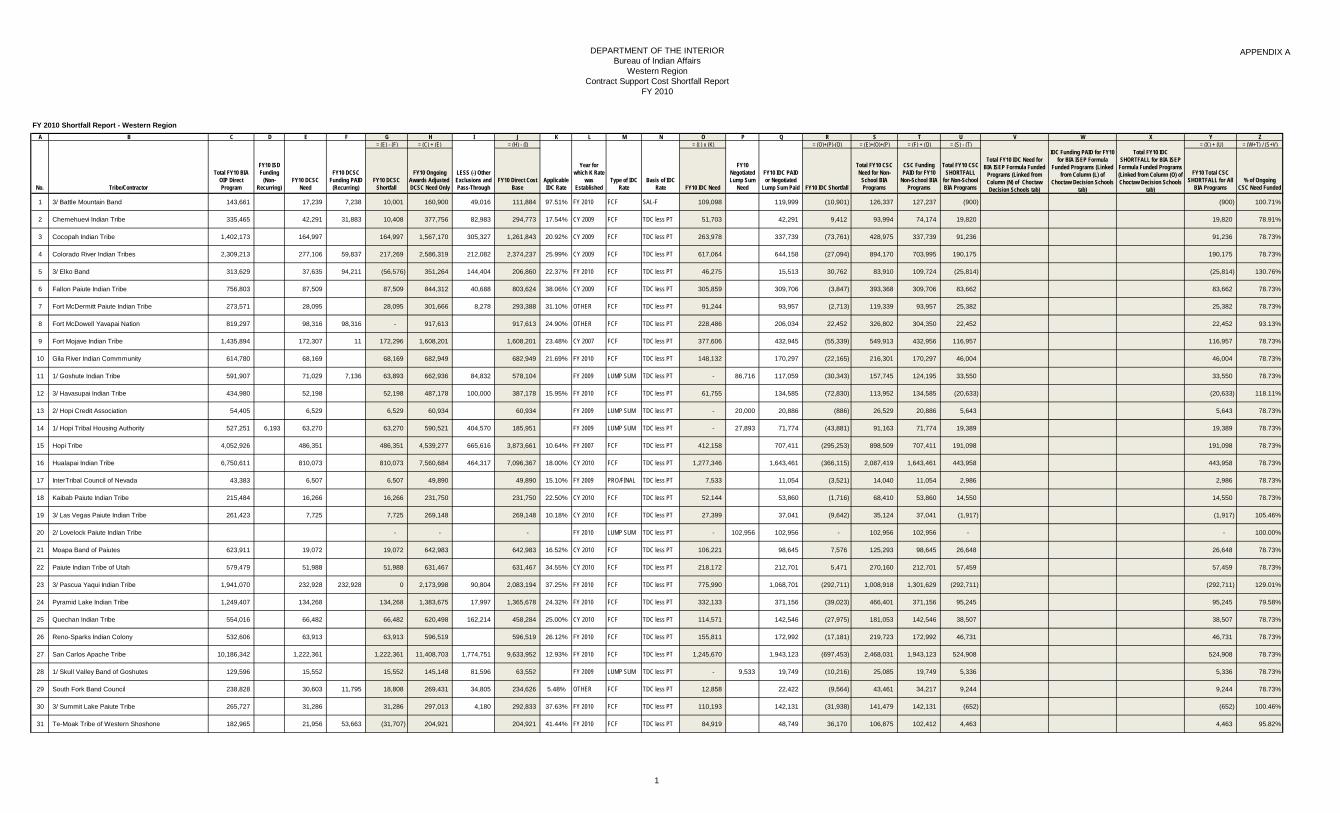
DEPARTMENT OF THE INTERIORBureau of Indian Affairs
Western RegionContract Support Cost Shortfall Report
FY 2010
APPENDIX A
1
A B C D E F G H I J K L M N O P Q R S T U V W X Y Z= (E) - (F) = (C) + (E) = (H) - (I) = (J) x (K) = (O)+(P)-(Q) = (E)+(O)+(P) = (F) + (Q) = (S) - (T) = (X) + (U) = (W+T) / (S+V)
No. Tribe/Contractor
Total FY10 BIA OIP Direct Program
FY10 ISD Funding
(Non-Recurring)
FY10 DCSC Need
FY10 DCSC Funding PAID
(Recurring)FY10 DCSC
Shortfall
FY10 Ongoing Awards Adjusted - DCSC Need Only
LESS (-) Other Exclusions and Pass-Through
FY10 Direct Cost Base
Applicable IDC Rate
Year for which K Rate
was Established
Type of IDC Rate
Basis of IDC Rate FY10 IDC Need
FY10 Negotiated Lump Sum
Need
FY10 IDC PAID or Negotiated
Lump Sum Paid FY10 IDC Shortfall
Total FY10 CSC Need for Non-
School BIA Programs
CSC Funding PAID for FY10
Non-School BIA Programs
Total FY10 CSC SHORTFALL
for Non-School BIA Programs
FY10 Total CSC SHORTFALL for All
BIA Programs% of Ongoing
CSC Need Funded
1 3/ Battle Mountain Band 143,661 17,239 7,238 10,001 160,900 49,016 111,884 97.51% FY 2010 FCF SAL-F 109,098 119,999 (10,901) 126,337 127,237 (900) (900) 100.71%
2 Chemehuevi Indian Tribe 335,465 42,291 31,883 10,408 377,756 82,983 294,773 17.54% CY 2009 FCF TDC less PT 51,703 42,291 9,412 93,994 74,174 19,820 19,820 78.91%
3 Cocopah Indian Tribe 1,402,173 164,997 164,997 1,567,170 305,327 1,261,843 20.92% CY 2009 FCF TDC less PT 263,978 337,739 (73,761) 428,975 337,739 91,236 91,236 78.73%
4 Colorado River Indian Tribes 2,309,213 277,106 59,837 217,269 2,586,319 212,082 2,374,237 25.99% CY 2009 FCF TDC less PT 617,064 644,158 (27,094) 894,170 703,995 190,175 190,175 78.73%
5 3/ Elko Band 313,629 37,635 94,211 (56,576) 351,264 144,404 206,860 22.37% FY 2010 FCF TDC less PT 46,275 15,513 30,762 83,910 109,724 (25,814) (25,814) 130.76%
6 Fallon Paiute Indian Tribe 756,803 87,509 87,509 844,312 40,688 803,624 38.06% CY 2009 FCF TDC less PT 305,859 309,706 (3,847) 393,368 309,706 83,662 83,662 78.73%
7 Fort McDermitt Paiute Indian Tribe 273,571 28,095 28,095 301,666 8,278 293,388 31.10% OTHER FCF TDC less PT 91,244 93,957 (2,713) 119,339 93,957 25,382 25,382 78.73%
8 Fort McDowell Yavapai Nation 819,297 98,316 98,316 - 917,613 917,613 24.90% OTHER FCF TDC less PT 228,486 206,034 22,452 326,802 304,350 22,452 22,452 93.13%
9 Fort Mojave Indian Tribe 1,435,894 172,307 11 172,296 1,608,201 1,608,201 23.48% CY 2007 FCF TDC less PT 377,606 432,945 (55,339) 549,913 432,956 116,957 116,957 78.73%
10 Gila River Indian Commmunity 614,780 68,169 68,169 682,949 682,949 21.69% FY 2010 FCF TDC less PT 148,132 170,297 (22,165) 216,301 170,297 46,004 46,004 78.73%
11 1/ Goshute Indian Tribe 591,907 71,029 7,136 63,893 662,936 84,832 578,104 FY 2009 LUMP SUM TDC less PT - 86,716 117,059 (30,343) 157,745 124,195 33,550 33,550 78.73%
12 3/ Havasupai Indian Tribe 434,980 52,198 52,198 487,178 100,000 387,178 15.95% FY 2010 FCF TDC less PT 61,755 134,585 (72,830) 113,952 134,585 (20,633) (20,633) 118.11%
13 2/ Hopi Credit Association 54,405 6,529 6,529 60,934 60,934 FY 2009 LUMP SUM TDC less PT - 20,000 20,886 (886) 26,529 20,886 5,643 5,643 78.73%
14 1/ Hopi Tribal Housing Authority 527,251 6,193 63,270 63,270 590,521 404,570 185,951 FY 2009 LUMP SUM TDC less PT - 27,893 71,774 (43,881) 91,163 71,774 19,389 19,389 78.73%
15 Hopi Tribe 4,052,926 486,351 486,351 4,539,277 665,616 3,873,661 10.64% FY 2007 FCF TDC less PT 412,158 707,411 (295,253) 898,509 707,411 191,098 191,098 78.73%
16 Hualapai Indian Tribe 6,750,611 810,073 810,073 7,560,684 464,317 7,096,367 18.00% CY 2010 FCF TDC less PT 1,277,346 1,643,461 (366,115) 2,087,419 1,643,461 443,958 443,958 78.73%
17 InterTribal Council of Nevada 43,383 6,507 6,507 49,890 49,890 15.10% FY 2009 PRO/FINAL TDC less PT 7,533 11,054 (3,521) 14,040 11,054 2,986 2,986 78.73%
18 Kaibab Paiute Indian Tribe 215,484 16,266 16,266 231,750 231,750 22.50% CY 2010 FCF TDC less PT 52,144 53,860 (1,716) 68,410 53,860 14,550 14,550 78.73%
19 3/ Las Vegas Paiute Indian Tribe 261,423 7,725 7,725 269,148 269,148 10.18% CY 2010 FCF TDC less PT 27,399 37,041 (9,642) 35,124 37,041 (1,917) (1,917) 105.46%
20 2/ Lovelock Paiute Indian Tribe - - - FY 2010 LUMP SUM TDC less PT - 102,956 102,956 - 102,956 102,956 - - 100.00%
21 Moapa Band of Paiutes 623,911 19,072 19,072 642,983 642,983 16.52% CY 2010 FCF TDC less PT 106,221 98,645 7,576 125,293 98,645 26,648 26,648 78.73%
22 Paiute Indian Tribe of Utah 579,479 51,988 51,988 631,467 631,467 34.55% CY 2010 FCF TDC less PT 218,172 212,701 5,471 270,160 212,701 57,459 57,459 78.73%
23 3/ Pascua Yaqui Indian Tribe 1,941,070 232,928 232,928 0 2,173,998 90,804 2,083,194 37.25% FY 2010 FCF TDC less PT 775,990 1,068,701 (292,711) 1,008,918 1,301,629 (292,711) (292,711) 129.01%
24 Pyramid Lake Indian Tribe 1,249,407 134,268 134,268 1,383,675 17,997 1,365,678 24.32% FY 2010 FCF TDC less PT 332,133 371,156 (39,023) 466,401 371,156 95,245 95,245 79.58%
25 Quechan Indian Tribe 554,016 66,482 66,482 620,498 162,214 458,284 25.00% CY 2010 FCF TDC less PT 114,571 142,546 (27,975) 181,053 142,546 38,507 38,507 78.73%
26 Reno-Sparks Indian Colony 532,606 63,913 63,913 596,519 596,519 26.12% FY 2010 FCF TDC less PT 155,811 172,992 (17,181) 219,723 172,992 46,731 46,731 78.73%
27 San Carlos Apache Tribe 10,186,342 1,222,361 1,222,361 11,408,703 1,774,751 9,633,952 12.93% FY 2010 FCF TDC less PT 1,245,670 1,943,123 (697,453) 2,468,031 1,943,123 524,908 524,908 78.73%
28 1/ Skull Valley Band of Goshutes 129,596 15,552 15,552 145,148 81,596 63,552 FY 2009 LUMP SUM TDC less PT - 9,533 19,749 (10,216) 25,085 19,749 5,336 5,336 78.73%
29 South Fork Band Council 238,828 30,603 11,795 18,808 269,431 34,805 234,626 5.48% OTHER FCF TDC less PT 12,858 22,422 (9,564) 43,461 34,217 9,244 9,244 78.73%
30 3/ Summit Lake Paiute Tribe 265,727 31,286 31,286 297,013 4,180 292,833 37.63% FY 2010 FCF TDC less PT 110,193 142,131 (31,938) 141,479 142,131 (652) (652) 100.46%
31 Te-Moak Tribe of Western Shoshone 182,965 21,956 53,663 (31,707) 204,921 204,921 41.44% FY 2010 FCF TDC less PT 84,919 48,749 36,170 106,875 102,412 4,463 4,463 95.82%
FY 2010 Shortfall Report - Western Region
Total FY10 IDC Need for BIA ISEP Formula Funded
Programs (Linked from Column (N) of Choctaw Decision Schools tab)
IDC Funding PAID for FY10 for BIA ISEP Formula
Funded Programs (Linked from Column (L) of
Choctaw Decision Schools tab)
Total FY10 IDC SHORTFALL for BIA ISEP
Formula Funded Programs (Linked from Column (O) of Choctaw Decision Schools
tab)
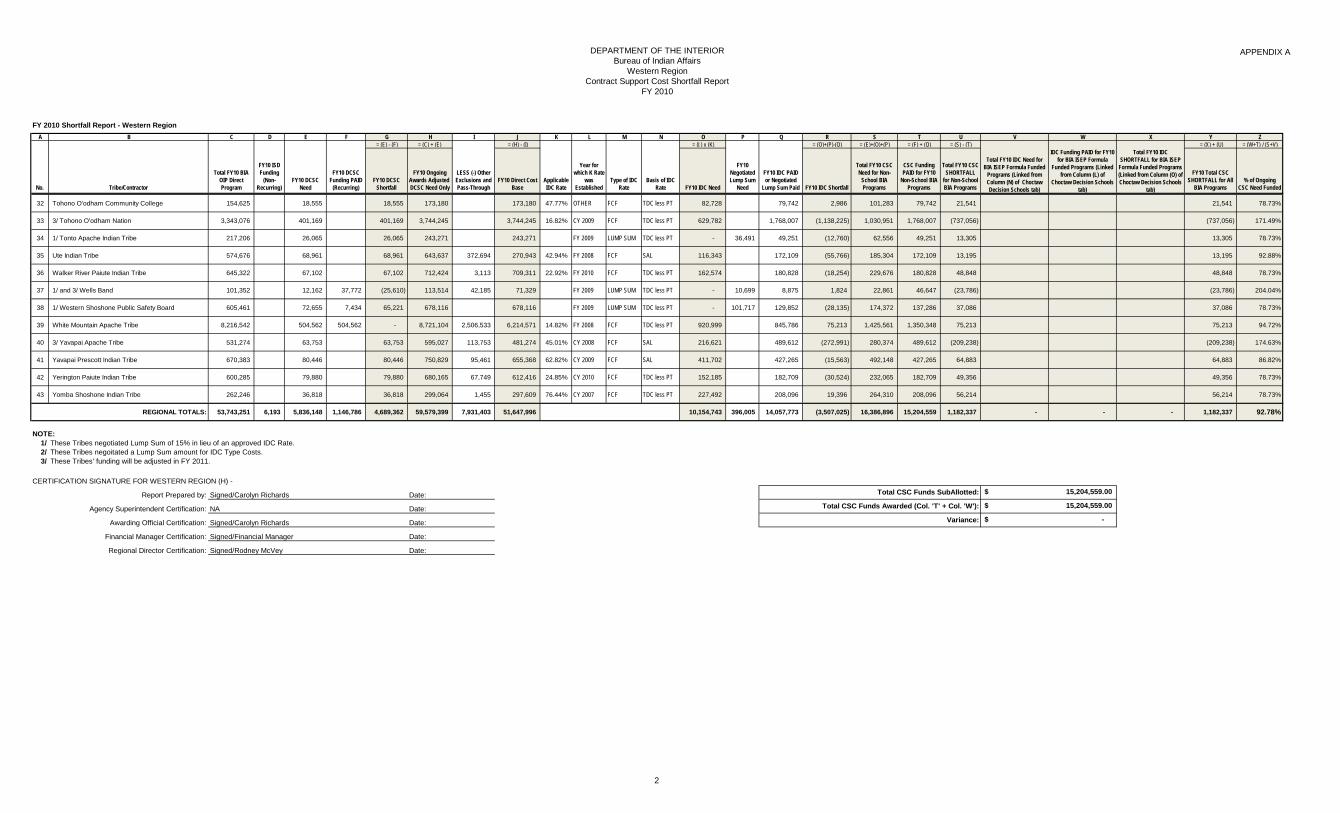
DEPARTMENT OF THE INTERIORBureau of Indian Affairs
Western RegionContract Support Cost Shortfall Report
FY 2010
APPENDIX A
2
A B C D E F G H I J K L M N O P Q R S T U V W X Y Z= (E) - (F) = (C) + (E) = (H) - (I) = (J) x (K) = (O)+(P)-(Q) = (E)+(O)+(P) = (F) + (Q) = (S) - (T) = (X) + (U) = (W+T) / (S+V)
No. Tribe/Contractor
Total FY10 BIA OIP Direct Program
FY10 ISD Funding
(Non-Recurring)
FY10 DCSC Need
FY10 DCSC Funding PAID
(Recurring)FY10 DCSC
Shortfall
FY10 Ongoing Awards Adjusted - DCSC Need Only
LESS (-) Other Exclusions and Pass-Through
FY10 Direct Cost Base
Applicable IDC Rate
Year for which K Rate
was Established
Type of IDC Rate
Basis of IDC Rate FY10 IDC Need
FY10 Negotiated Lump Sum
Need
FY10 IDC PAID or Negotiated
Lump Sum Paid FY10 IDC Shortfall
Total FY10 CSC Need for Non-
School BIA Programs
CSC Funding PAID for FY10
Non-School BIA Programs
Total FY10 CSC SHORTFALL
for Non-School BIA Programs
FY10 Total CSC SHORTFALL for All
BIA Programs% of Ongoing
CSC Need Funded
FY 2010 Shortfall Report - Western Region
Total FY10 IDC Need for BIA ISEP Formula Funded
Programs (Linked from Column (N) of Choctaw Decision Schools tab)
IDC Funding PAID for FY10 for BIA ISEP Formula
Funded Programs (Linked from Column (L) of
Choctaw Decision Schools tab)
Total FY10 IDC SHORTFALL for BIA ISEP
Formula Funded Programs (Linked from Column (O) of Choctaw Decision Schools
tab)
32 Tohono O'odham Community College 154,625 18,555 18,555 173,180 173,180 47.77% OTHER FCF TDC less PT 82,728 79,742 2,986 101,283 79,742 21,541 21,541 78.73%
33 3/ Tohono O'odham Nation 3,343,076 401,169 401,169 3,744,245 3,744,245 16.82% CY 2009 FCF TDC less PT 629,782 1,768,007 (1,138,225) 1,030,951 1,768,007 (737,056) (737,056) 171.49%
34 1/ Tonto Apache Indian Tribe 217,206 26,065 26,065 243,271 243,271 FY 2009 LUMP SUM TDC less PT - 36,491 49,251 (12,760) 62,556 49,251 13,305 13,305 78.73%
35 Ute Indian Tribe 574,676 68,961 68,961 643,637 372,694 270,943 42.94% FY 2008 FCF SAL 116,343 172,109 (55,766) 185,304 172,109 13,195 13,195 92.88%
36 Walker River Paiute Indian Tribe 645,322 67,102 67,102 712,424 3,113 709,311 22.92% FY 2010 FCF TDC less PT 162,574 180,828 (18,254) 229,676 180,828 48,848 48,848 78.73%
37 1/ and 3/ Wells Band 101,352 12,162 37,772 (25,610) 113,514 42,185 71,329 FY 2009 LUMP SUM TDC less PT - 10,699 8,875 1,824 22,861 46,647 (23,786) (23,786) 204.04%
38 1/ Western Shoshone Public Safety Board 605,461 72,655 7,434 65,221 678,116 678,116 FY 2009 LUMP SUM TDC less PT - 101,717 129,852 (28,135) 174,372 137,286 37,086 37,086 78.73%
39 White Mountain Apache Tribe 8,216,542 504,562 504,562 - 8,721,104 2,506,533 6,214,571 14.82% FY 2008 FCF TDC less PT 920,999 845,786 75,213 1,425,561 1,350,348 75,213 75,213 94.72%
40 3/ Yavapai Apache Tribe 531,274 63,753 63,753 595,027 113,753 481,274 45.01% CY 2008 FCF SAL 216,621 489,612 (272,991) 280,374 489,612 (209,238) (209,238) 174.63%
41 Yavapai Prescott Indian Tribe 670,383 80,446 80,446 750,829 95,461 655,368 62.82% CY 2009 FCF SAL 411,702 427,265 (15,563) 492,148 427,265 64,883 64,883 86.82%
42 Yerington Paiute Indian Tribe 600,285 79,880 79,880 680,165 67,749 612,416 24.85% CY 2010 FCF TDC less PT 152,185 182,709 (30,524) 232,065 182,709 49,356 49,356 78.73%
43 Yomba Shoshone Indian Tribe 262,246 36,818 36,818 299,064 1,455 297,609 76.44% CY 2007 FCF TDC less PT 227,492 208,096 19,396 264,310 208,096 56,214 56,214 78.73%
REGIONAL TOTALS: 53,743,251 6,193 5,836,148 1,146,786 4,689,362 59,579,399 7,931,403 51,647,996 10,154,743 396,005 14,057,773 (3,507,025) 16,386,896 15,204,559 1,182,337 - - - 1,182,337 92.78%
NOTE: 1/2/3/ These Tribes' funding will be adjusted in FY 2011.
CERTIFICATION SIGNATURE FOR WESTERN REGION (H) -
Report Prepared by: Date:
Agency Superintendent Certification: Date:
Awarding Official Certification: Date:
Financial Manager Certification: Date:
Regional Director Certification: Date:
Signed/Carolyn Richards
Signed/Rodney McVey
15,204,559.00$
NA 15,204,559.00$
Signed/Carolyn Richards -$
These Tribes negotiated Lump Sum of 15% in lieu of an approved IDC Rate.These Tribes negoitated a Lump Sum amount for IDC Type Costs.
Signed/Financial Manager
Total CSC Funds SubAllotted:
Total CSC Funds Awarded (Col. 'T' + Col. 'W'):
Variance:
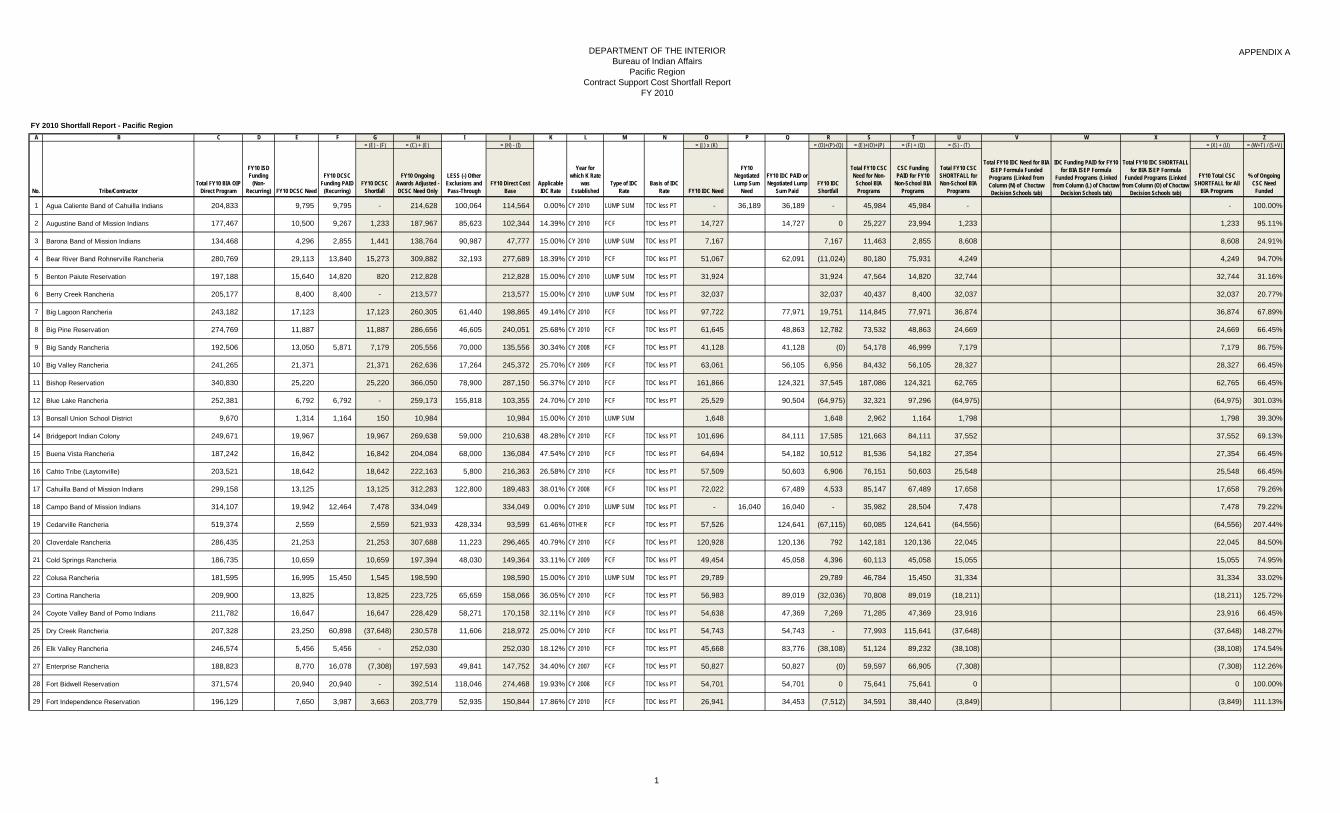
DEPARTMENT OF THE INTERIORBureau of Indian Affairs
Pacific RegionContract Support Cost Shortfall Report
FY 2010
APPENDIX A
1
A B C D E F G H I J K L M N O P Q R S T U V W X Y Z= (E) - (F) = (C) + (E) = (H) - (I) = (J) x (K) = (O)+(P)-(Q) = (E)+(O)+(P) = (F) + (Q) = (S) - (T) = (X) + (U) = (W+T) / (S+V)
No. Tribe/ContractorTotal FY10 BIA OIP
Direct Program
FY10 ISD Funding
(Non-Recurring) FY10 DCSC Need
FY10 DCSC Funding PAID
(Recurring)FY10 DCSC
Shortfall
FY10 Ongoing Awards Adjusted - DCSC Need Only
LESS (-) Other Exclusions and Pass-Through
FY10 Direct Cost Base
Applicable IDC Rate
Year for which K Rate
was Established
Type of IDC Rate
Basis of IDC Rate FY10 IDC Need
FY10 Negotiated Lump Sum
Need
FY10 IDC PAID or Negotiated Lump
Sum PaidFY10 IDC Shortfall
Total FY10 CSC Need for Non-
School BIA Programs
CSC Funding PAID for FY10
Non-School BIA Programs
Total FY10 CSC SHORTFALL for Non-School BIA
Programs
FY10 Total CSC SHORTFALL for All
BIA Programs
% of Ongoing CSC Need
Funded
1 Agua Caliente Band of Cahuilla Indians 204,833 9,795 9,795 - 214,628 100,064 114,564 0.00% CY 2010 LUMP SUM TDC less PT - 36,189 36,189 - 45,984 45,984 - - 100.00%
2 Augustine Band of Mission Indians 177,467 10,500 9,267 1,233 187,967 85,623 102,344 14.39% CY 2010 FCF TDC less PT 14,727 14,727 0 25,227 23,994 1,233 1,233 95.11%
3 Barona Band of Mission Indians 134,468 4,296 2,855 1,441 138,764 90,987 47,777 15.00% CY 2010 LUMP SUM TDC less PT 7,167 7,167 11,463 2,855 8,608 8,608 24.91%
4 Bear River Band Rohnerville Rancheria 280,769 29,113 13,840 15,273 309,882 32,193 277,689 18.39% CY 2010 FCF TDC less PT 51,067 62,091 (11,024) 80,180 75,931 4,249 4,249 94.70%
5 Benton Paiute Reservation 197,188 15,640 14,820 820 212,828 212,828 15.00% CY 2010 LUMP SUM TDC less PT 31,924 31,924 47,564 14,820 32,744 32,744 31.16%
6 Berry Creek Rancheria 205,177 8,400 8,400 - 213,577 213,577 15.00% CY 2010 LUMP SUM TDC less PT 32,037 32,037 40,437 8,400 32,037 32,037 20.77%
7 Big Lagoon Rancheria 243,182 17,123 17,123 260,305 61,440 198,865 49.14% CY 2010 FCF TDC less PT 97,722 77,971 19,751 114,845 77,971 36,874 36,874 67.89%
8 Big Pine Reservation 274,769 11,887 11,887 286,656 46,605 240,051 25.68% CY 2010 FCF TDC less PT 61,645 48,863 12,782 73,532 48,863 24,669 24,669 66.45%
9 Big Sandy Rancheria 192,506 13,050 5,871 7,179 205,556 70,000 135,556 30.34% CY 2008 FCF TDC less PT 41,128 41,128 (0) 54,178 46,999 7,179 7,179 86.75%
10 Big Valley Rancheria 241,265 21,371 21,371 262,636 17,264 245,372 25.70% CY 2009 FCF TDC less PT 63,061 56,105 6,956 84,432 56,105 28,327 28,327 66.45%
11 Bishop Reservation 340,830 25,220 25,220 366,050 78,900 287,150 56.37% CY 2010 FCF TDC less PT 161,866 124,321 37,545 187,086 124,321 62,765 62,765 66.45%
12 Blue Lake Rancheria 252,381 6,792 6,792 - 259,173 155,818 103,355 24.70% CY 2010 FCF TDC less PT 25,529 90,504 (64,975) 32,321 97,296 (64,975) (64,975) 301.03%
13 Bonsall Union School District 9,670 1,314 1,164 150 10,984 10,984 15.00% CY 2010 LUMP SUM 1,648 1,648 2,962 1,164 1,798 1,798 39.30%
14 Bridgeport Indian Colony 249,671 19,967 19,967 269,638 59,000 210,638 48.28% CY 2010 FCF TDC less PT 101,696 84,111 17,585 121,663 84,111 37,552 37,552 69.13%
15 Buena Vista Rancheria 187,242 16,842 16,842 204,084 68,000 136,084 47.54% CY 2010 FCF TDC less PT 64,694 54,182 10,512 81,536 54,182 27,354 27,354 66.45%
16 Cahto Tribe (Laytonville) 203,521 18,642 18,642 222,163 5,800 216,363 26.58% CY 2010 FCF TDC less PT 57,509 50,603 6,906 76,151 50,603 25,548 25,548 66.45%
17 Cahuilla Band of Mission Indians 299,158 13,125 13,125 312,283 122,800 189,483 38.01% CY 2008 FCF TDC less PT 72,022 67,489 4,533 85,147 67,489 17,658 17,658 79.26%
18 Campo Band of Mission Indians 314,107 19,942 12,464 7,478 334,049 334,049 0.00% CY 2010 LUMP SUM TDC less PT - 16,040 16,040 - 35,982 28,504 7,478 7,478 79.22%
19 Cedarville Rancheria 519,374 2,559 2,559 521,933 428,334 93,599 61.46% OTHER FCF TDC less PT 57,526 124,641 (67,115) 60,085 124,641 (64,556) (64,556) 207.44%
20 Cloverdale Rancheria 286,435 21,253 21,253 307,688 11,223 296,465 40.79% CY 2010 FCF TDC less PT 120,928 120,136 792 142,181 120,136 22,045 22,045 84.50%
21 Cold Springs Rancheria 186,735 10,659 10,659 197,394 48,030 149,364 33.11% CY 2009 FCF TDC less PT 49,454 45,058 4,396 60,113 45,058 15,055 15,055 74.95%
22 Colusa Rancheria 181,595 16,995 15,450 1,545 198,590 198,590 15.00% CY 2010 LUMP SUM TDC less PT 29,789 29,789 46,784 15,450 31,334 31,334 33.02%
23 Cortina Rancheria 209,900 13,825 13,825 223,725 65,659 158,066 36.05% CY 2010 FCF TDC less PT 56,983 89,019 (32,036) 70,808 89,019 (18,211) (18,211) 125.72%
24 Coyote Valley Band of Pomo Indians 211,782 16,647 16,647 228,429 58,271 170,158 32.11% CY 2010 FCF TDC less PT 54,638 47,369 7,269 71,285 47,369 23,916 23,916 66.45%
25 Dry Creek Rancheria 207,328 23,250 60,898 (37,648) 230,578 11,606 218,972 25.00% CY 2010 FCF TDC less PT 54,743 54,743 - 77,993 115,641 (37,648) (37,648) 148.27%
26 Elk Valley Rancheria 246,574 5,456 5,456 - 252,030 252,030 18.12% CY 2010 FCF TDC less PT 45,668 83,776 (38,108) 51,124 89,232 (38,108) (38,108) 174.54%
27 Enterprise Rancheria 188,823 8,770 16,078 (7,308) 197,593 49,841 147,752 34.40% CY 2007 FCF TDC less PT 50,827 50,827 (0) 59,597 66,905 (7,308) (7,308) 112.26%
28 Fort Bidwell Reservation 371,574 20,940 20,940 - 392,514 118,046 274,468 19.93% CY 2008 FCF TDC less PT 54,701 54,701 0 75,641 75,641 0 0 100.00%
29 Fort Independence Reservation 196,129 7,650 3,987 3,663 203,779 52,935 150,844 17.86% CY 2010 FCF TDC less PT 26,941 34,453 (7,512) 34,591 38,440 (3,849) (3,849) 111.13%
FY 2010 Shortfall Report - Pacific Region
Total FY10 IDC Need for BIA ISEP Formula Funded
Programs (Linked from Column (N) of Choctaw Decision Schools tab)
IDC Funding PAID for FY10 for BIA ISEP Formula
Funded Programs (Linked from Column (L) of Choctaw
Decision Schools tab)
Total FY10 IDC SHORTFALL for BIA ISEP Formula
Funded Programs (Linked from Column (O) of Choctaw
Decision Schools tab)
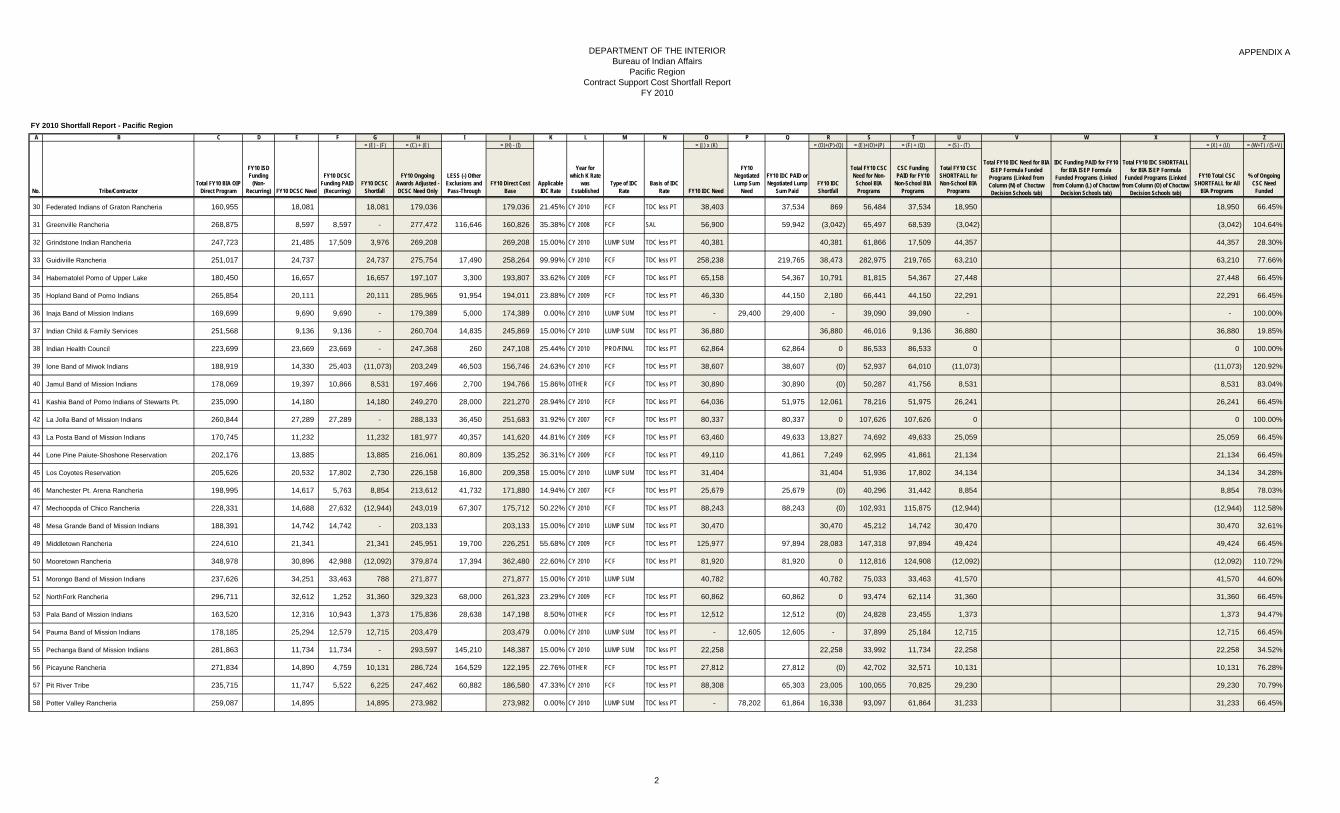
DEPARTMENT OF THE INTERIORBureau of Indian Affairs
Pacific RegionContract Support Cost Shortfall Report
FY 2010
APPENDIX A
2
A B C D E F G H I J K L M N O P Q R S T U V W X Y Z= (E) - (F) = (C) + (E) = (H) - (I) = (J) x (K) = (O)+(P)-(Q) = (E)+(O)+(P) = (F) + (Q) = (S) - (T) = (X) + (U) = (W+T) / (S+V)
No. Tribe/ContractorTotal FY10 BIA OIP
Direct Program
FY10 ISD Funding
(Non-Recurring) FY10 DCSC Need
FY10 DCSC Funding PAID
(Recurring)FY10 DCSC
Shortfall
FY10 Ongoing Awards Adjusted - DCSC Need Only
LESS (-) Other Exclusions and Pass-Through
FY10 Direct Cost Base
Applicable IDC Rate
Year for which K Rate
was Established
Type of IDC Rate
Basis of IDC Rate FY10 IDC Need
FY10 Negotiated Lump Sum
Need
FY10 IDC PAID or Negotiated Lump
Sum PaidFY10 IDC Shortfall
Total FY10 CSC Need for Non-
School BIA Programs
CSC Funding PAID for FY10
Non-School BIA Programs
Total FY10 CSC SHORTFALL for Non-School BIA
Programs
FY10 Total CSC SHORTFALL for All
BIA Programs
% of Ongoing CSC Need
Funded
FY 2010 Shortfall Report - Pacific Region
Total FY10 IDC Need for BIA ISEP Formula Funded
Programs (Linked from Column (N) of Choctaw Decision Schools tab)
IDC Funding PAID for FY10 for BIA ISEP Formula
Funded Programs (Linked from Column (L) of Choctaw
Decision Schools tab)
Total FY10 IDC SHORTFALL for BIA ISEP Formula
Funded Programs (Linked from Column (O) of Choctaw
Decision Schools tab)
30 Federated Indians of Graton Rancheria 160,955 18,081 18,081 179,036 179,036 21.45% CY 2010 FCF TDC less PT 38,403 37,534 869 56,484 37,534 18,950 18,950 66.45%
31 Greenville Rancheria 268,875 8,597 8,597 - 277,472 116,646 160,826 35.38% CY 2008 FCF SAL 56,900 59,942 (3,042) 65,497 68,539 (3,042) (3,042) 104.64%
32 Grindstone Indian Rancheria 247,723 21,485 17,509 3,976 269,208 269,208 15.00% CY 2010 LUMP SUM TDC less PT 40,381 40,381 61,866 17,509 44,357 44,357 28.30%
33 Guidiville Rancheria 251,017 24,737 24,737 275,754 17,490 258,264 99.99% CY 2010 FCF TDC less PT 258,238 219,765 38,473 282,975 219,765 63,210 63,210 77.66%
34 Habematolel Pomo of Upper Lake 180,450 16,657 16,657 197,107 3,300 193,807 33.62% CY 2009 FCF TDC less PT 65,158 54,367 10,791 81,815 54,367 27,448 27,448 66.45%
35 Hopland Band of Pomo Indians 265,854 20,111 20,111 285,965 91,954 194,011 23.88% CY 2009 FCF TDC less PT 46,330 44,150 2,180 66,441 44,150 22,291 22,291 66.45%
36 Inaja Band of Mission Indians 169,699 9,690 9,690 - 179,389 5,000 174,389 0.00% CY 2010 LUMP SUM TDC less PT - 29,400 29,400 - 39,090 39,090 - - 100.00%
37 Indian Child & Family Services 251,568 9,136 9,136 - 260,704 14,835 245,869 15.00% CY 2010 LUMP SUM TDC less PT 36,880 36,880 46,016 9,136 36,880 36,880 19.85%
38 Indian Health Council 223,699 23,669 23,669 - 247,368 260 247,108 25.44% CY 2010 PRO/FINAL TDC less PT 62,864 62,864 0 86,533 86,533 0 0 100.00%
39 Ione Band of Miwok Indians 188,919 14,330 25,403 (11,073) 203,249 46,503 156,746 24.63% CY 2010 FCF TDC less PT 38,607 38,607 (0) 52,937 64,010 (11,073) (11,073) 120.92%
40 Jamul Band of Mission Indians 178,069 19,397 10,866 8,531 197,466 2,700 194,766 15.86% OTHER FCF TDC less PT 30,890 30,890 (0) 50,287 41,756 8,531 8,531 83.04%
41 Kashia Band of Pomo Indians of Stewarts Pt. 235,090 14,180 14,180 249,270 28,000 221,270 28.94% CY 2010 FCF TDC less PT 64,036 51,975 12,061 78,216 51,975 26,241 26,241 66.45%
42 La Jolla Band of Mission Indians 260,844 27,289 27,289 - 288,133 36,450 251,683 31.92% CY 2007 FCF TDC less PT 80,337 80,337 0 107,626 107,626 0 0 100.00%
43 La Posta Band of Mission Indians 170,745 11,232 11,232 181,977 40,357 141,620 44.81% CY 2009 FCF TDC less PT 63,460 49,633 13,827 74,692 49,633 25,059 25,059 66.45%
44 Lone Pine Paiute-Shoshone Reservation 202,176 13,885 13,885 216,061 80,809 135,252 36.31% CY 2009 FCF TDC less PT 49,110 41,861 7,249 62,995 41,861 21,134 21,134 66.45%
45 Los Coyotes Reservation 205,626 20,532 17,802 2,730 226,158 16,800 209,358 15.00% CY 2010 LUMP SUM TDC less PT 31,404 31,404 51,936 17,802 34,134 34,134 34.28%
46 Manchester Pt. Arena Rancheria 198,995 14,617 5,763 8,854 213,612 41,732 171,880 14.94% CY 2007 FCF TDC less PT 25,679 25,679 (0) 40,296 31,442 8,854 8,854 78.03%
47 Mechoopda of Chico Rancheria 228,331 14,688 27,632 (12,944) 243,019 67,307 175,712 50.22% CY 2010 FCF TDC less PT 88,243 88,243 (0) 102,931 115,875 (12,944) (12,944) 112.58%
48 Mesa Grande Band of Mission Indians 188,391 14,742 14,742 - 203,133 203,133 15.00% CY 2010 LUMP SUM TDC less PT 30,470 30,470 45,212 14,742 30,470 30,470 32.61%
49 Middletown Rancheria 224,610 21,341 21,341 245,951 19,700 226,251 55.68% CY 2009 FCF TDC less PT 125,977 97,894 28,083 147,318 97,894 49,424 49,424 66.45%
50 Mooretown Rancheria 348,978 30,896 42,988 (12,092) 379,874 17,394 362,480 22.60% CY 2010 FCF TDC less PT 81,920 81,920 0 112,816 124,908 (12,092) (12,092) 110.72%
51 Morongo Band of Mission Indians 237,626 34,251 33,463 788 271,877 271,877 15.00% CY 2010 LUMP SUM 40,782 40,782 75,033 33,463 41,570 41,570 44.60%
52 NorthFork Rancheria 296,711 32,612 1,252 31,360 329,323 68,000 261,323 23.29% CY 2009 FCF TDC less PT 60,862 60,862 0 93,474 62,114 31,360 31,360 66.45%
53 Pala Band of Mission Indians 163,520 12,316 10,943 1,373 175,836 28,638 147,198 8.50% OTHER FCF TDC less PT 12,512 12,512 (0) 24,828 23,455 1,373 1,373 94.47%
54 Pauma Band of Mission Indians 178,185 25,294 12,579 12,715 203,479 203,479 0.00% CY 2010 LUMP SUM TDC less PT - 12,605 12,605 - 37,899 25,184 12,715 12,715 66.45%
55 Pechanga Band of Mission Indians 281,863 11,734 11,734 - 293,597 145,210 148,387 15.00% CY 2010 LUMP SUM TDC less PT 22,258 22,258 33,992 11,734 22,258 22,258 34.52%
56 Picayune Rancheria 271,834 14,890 4,759 10,131 286,724 164,529 122,195 22.76% OTHER FCF TDC less PT 27,812 27,812 (0) 42,702 32,571 10,131 10,131 76.28%
57 Pit River Tribe 235,715 11,747 5,522 6,225 247,462 60,882 186,580 47.33% CY 2010 FCF TDC less PT 88,308 65,303 23,005 100,055 70,825 29,230 29,230 70.79%
58 Potter Valley Rancheria 259,087 14,895 14,895 273,982 273,982 0.00% CY 2010 LUMP SUM TDC less PT - 78,202 61,864 16,338 93,097 61,864 31,233 31,233 66.45%
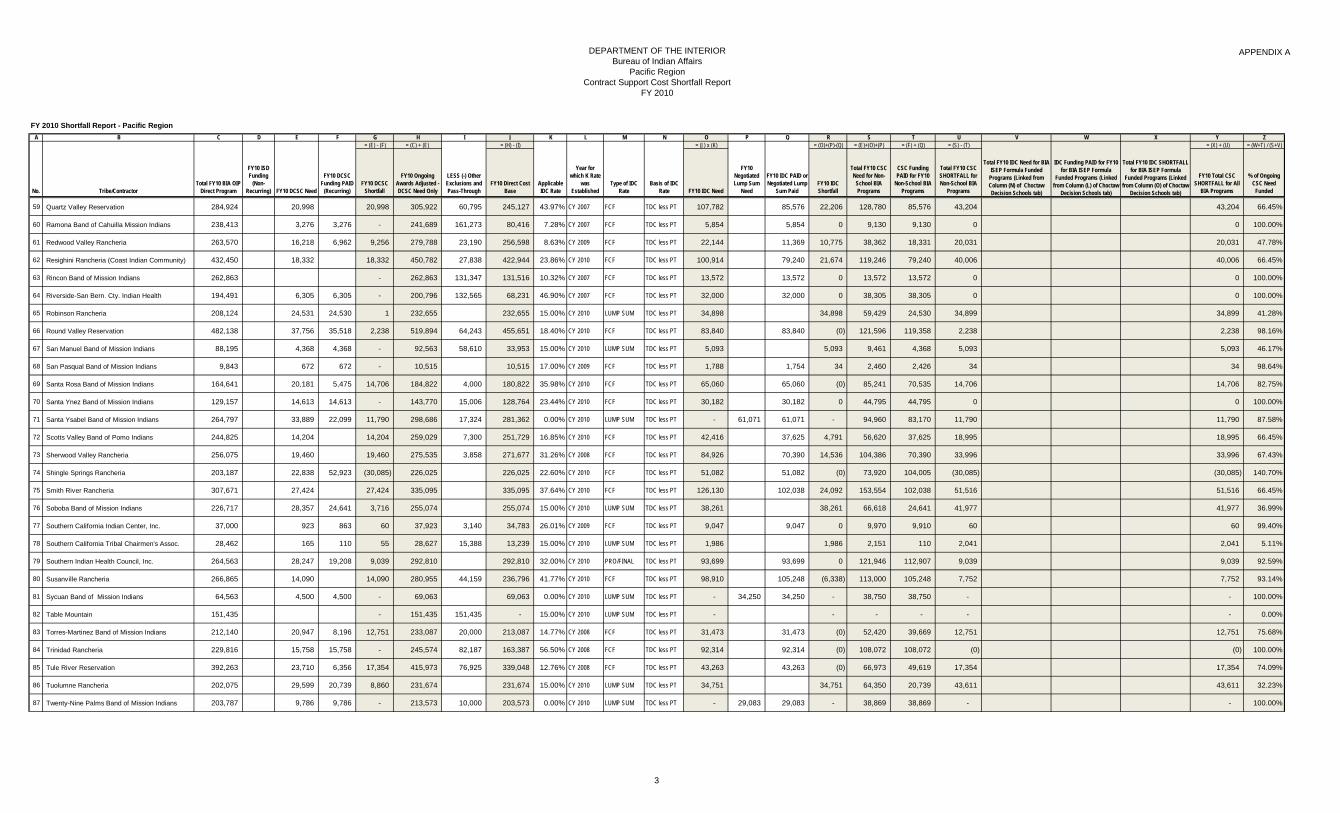
DEPARTMENT OF THE INTERIORBureau of Indian Affairs
Pacific RegionContract Support Cost Shortfall Report
FY 2010
APPENDIX A
3
A B C D E F G H I J K L M N O P Q R S T U V W X Y Z= (E) - (F) = (C) + (E) = (H) - (I) = (J) x (K) = (O)+(P)-(Q) = (E)+(O)+(P) = (F) + (Q) = (S) - (T) = (X) + (U) = (W+T) / (S+V)
No. Tribe/ContractorTotal FY10 BIA OIP
Direct Program
FY10 ISD Funding
(Non-Recurring) FY10 DCSC Need
FY10 DCSC Funding PAID
(Recurring)FY10 DCSC
Shortfall
FY10 Ongoing Awards Adjusted - DCSC Need Only
LESS (-) Other Exclusions and Pass-Through
FY10 Direct Cost Base
Applicable IDC Rate
Year for which K Rate
was Established
Type of IDC Rate
Basis of IDC Rate FY10 IDC Need
FY10 Negotiated Lump Sum
Need
FY10 IDC PAID or Negotiated Lump
Sum PaidFY10 IDC Shortfall
Total FY10 CSC Need for Non-
School BIA Programs
CSC Funding PAID for FY10
Non-School BIA Programs
Total FY10 CSC SHORTFALL for Non-School BIA
Programs
FY10 Total CSC SHORTFALL for All
BIA Programs
% of Ongoing CSC Need
Funded
FY 2010 Shortfall Report - Pacific Region
Total FY10 IDC Need for BIA ISEP Formula Funded
Programs (Linked from Column (N) of Choctaw Decision Schools tab)
IDC Funding PAID for FY10 for BIA ISEP Formula
Funded Programs (Linked from Column (L) of Choctaw
Decision Schools tab)
Total FY10 IDC SHORTFALL for BIA ISEP Formula
Funded Programs (Linked from Column (O) of Choctaw
Decision Schools tab)
59 Quartz Valley Reservation 284,924 20,998 20,998 305,922 60,795 245,127 43.97% CY 2007 FCF TDC less PT 107,782 85,576 22,206 128,780 85,576 43,204 43,204 66.45%
60 Ramona Band of Cahuilla Mission Indians 238,413 3,276 3,276 - 241,689 161,273 80,416 7.28% CY 2007 FCF TDC less PT 5,854 5,854 0 9,130 9,130 0 0 100.00%
61 Redwood Valley Rancheria 263,570 16,218 6,962 9,256 279,788 23,190 256,598 8.63% CY 2009 FCF TDC less PT 22,144 11,369 10,775 38,362 18,331 20,031 20,031 47.78%
62 Resighini Rancheria (Coast Indian Community) 432,450 18,332 18,332 450,782 27,838 422,944 23.86% CY 2010 FCF TDC less PT 100,914 79,240 21,674 119,246 79,240 40,006 40,006 66.45%
63 Rincon Band of Mission Indians 262,863 - 262,863 131,347 131,516 10.32% CY 2007 FCF TDC less PT 13,572 13,572 0 13,572 13,572 0 0 100.00%
64 Riverside-San Bern. Cty. Indian Health 194,491 6,305 6,305 - 200,796 132,565 68,231 46.90% CY 2007 FCF TDC less PT 32,000 32,000 0 38,305 38,305 0 0 100.00%
65 Robinson Rancheria 208,124 24,531 24,530 1 232,655 232,655 15.00% CY 2010 LUMP SUM TDC less PT 34,898 34,898 59,429 24,530 34,899 34,899 41.28%
66 Round Valley Reservation 482,138 37,756 35,518 2,238 519,894 64,243 455,651 18.40% CY 2010 FCF TDC less PT 83,840 83,840 (0) 121,596 119,358 2,238 2,238 98.16%
67 San Manuel Band of Mission Indians 88,195 4,368 4,368 - 92,563 58,610 33,953 15.00% CY 2010 LUMP SUM TDC less PT 5,093 5,093 9,461 4,368 5,093 5,093 46.17%
68 San Pasqual Band of Mission Indians 9,843 672 672 - 10,515 10,515 17.00% CY 2009 FCF TDC less PT 1,788 1,754 34 2,460 2,426 34 34 98.64%
69 Santa Rosa Band of Mission Indians 164,641 20,181 5,475 14,706 184,822 4,000 180,822 35.98% CY 2010 FCF TDC less PT 65,060 65,060 (0) 85,241 70,535 14,706 14,706 82.75%
70 Santa Ynez Band of Mission Indians 129,157 14,613 14,613 - 143,770 15,006 128,764 23.44% CY 2010 FCF TDC less PT 30,182 30,182 0 44,795 44,795 0 0 100.00%
71 Santa Ysabel Band of Mission Indians 264,797 33,889 22,099 11,790 298,686 17,324 281,362 0.00% CY 2010 LUMP SUM TDC less PT - 61,071 61,071 - 94,960 83,170 11,790 11,790 87.58%
72 Scotts Valley Band of Pomo Indians 244,825 14,204 14,204 259,029 7,300 251,729 16.85% CY 2010 FCF TDC less PT 42,416 37,625 4,791 56,620 37,625 18,995 18,995 66.45%
73 Sherwood Valley Rancheria 256,075 19,460 19,460 275,535 3,858 271,677 31.26% CY 2008 FCF TDC less PT 84,926 70,390 14,536 104,386 70,390 33,996 33,996 67.43%
74 Shingle Springs Rancheria 203,187 22,838 52,923 (30,085) 226,025 226,025 22.60% CY 2010 FCF TDC less PT 51,082 51,082 (0) 73,920 104,005 (30,085) (30,085) 140.70%
75 Smith River Rancheria 307,671 27,424 27,424 335,095 335,095 37.64% CY 2010 FCF TDC less PT 126,130 102,038 24,092 153,554 102,038 51,516 51,516 66.45%
76 Soboba Band of Mission Indians 226,717 28,357 24,641 3,716 255,074 255,074 15.00% CY 2010 LUMP SUM TDC less PT 38,261 38,261 66,618 24,641 41,977 41,977 36.99%
77 Southern California Indian Center, Inc. 37,000 923 863 60 37,923 3,140 34,783 26.01% CY 2009 FCF TDC less PT 9,047 9,047 0 9,970 9,910 60 60 99.40%
78 Southern California Tribal Chairmen's Assoc. 28,462 165 110 55 28,627 15,388 13,239 15.00% CY 2010 LUMP SUM TDC less PT 1,986 1,986 2,151 110 2,041 2,041 5.11%
79 Southern Indian Health Council, Inc. 264,563 28,247 19,208 9,039 292,810 292,810 32.00% CY 2010 PRO/FINAL TDC less PT 93,699 93,699 0 121,946 112,907 9,039 9,039 92.59%
80 Susanville Rancheria 266,865 14,090 14,090 280,955 44,159 236,796 41.77% CY 2010 FCF TDC less PT 98,910 105,248 (6,338) 113,000 105,248 7,752 7,752 93.14%
81 Sycuan Band of Mission Indians 64,563 4,500 4,500 - 69,063 69,063 0.00% CY 2010 LUMP SUM TDC less PT - 34,250 34,250 - 38,750 38,750 - - 100.00%
82 Table Mountain 151,435 - 151,435 151,435 - 15.00% CY 2010 LUMP SUM TDC less PT - - - - - - 0.00%
83 Torres-Martinez Band of Mission Indians 212,140 20,947 8,196 12,751 233,087 20,000 213,087 14.77% CY 2008 FCF TDC less PT 31,473 31,473 (0) 52,420 39,669 12,751 12,751 75.68%
84 Trinidad Rancheria 229,816 15,758 15,758 - 245,574 82,187 163,387 56.50% CY 2008 FCF TDC less PT 92,314 92,314 (0) 108,072 108,072 (0) (0) 100.00%
85 Tule River Reservation 392,263 23,710 6,356 17,354 415,973 76,925 339,048 12.76% CY 2008 FCF TDC less PT 43,263 43,263 (0) 66,973 49,619 17,354 17,354 74.09%
86 Tuolumne Rancheria 202,075 29,599 20,739 8,860 231,674 231,674 15.00% CY 2010 LUMP SUM TDC less PT 34,751 34,751 64,350 20,739 43,611 43,611 32.23%
87 Twenty-Nine Palms Band of Mission Indians 203,787 9,786 9,786 - 213,573 10,000 203,573 0.00% CY 2010 LUMP SUM TDC less PT - 29,083 29,083 - 38,869 38,869 - - 100.00%
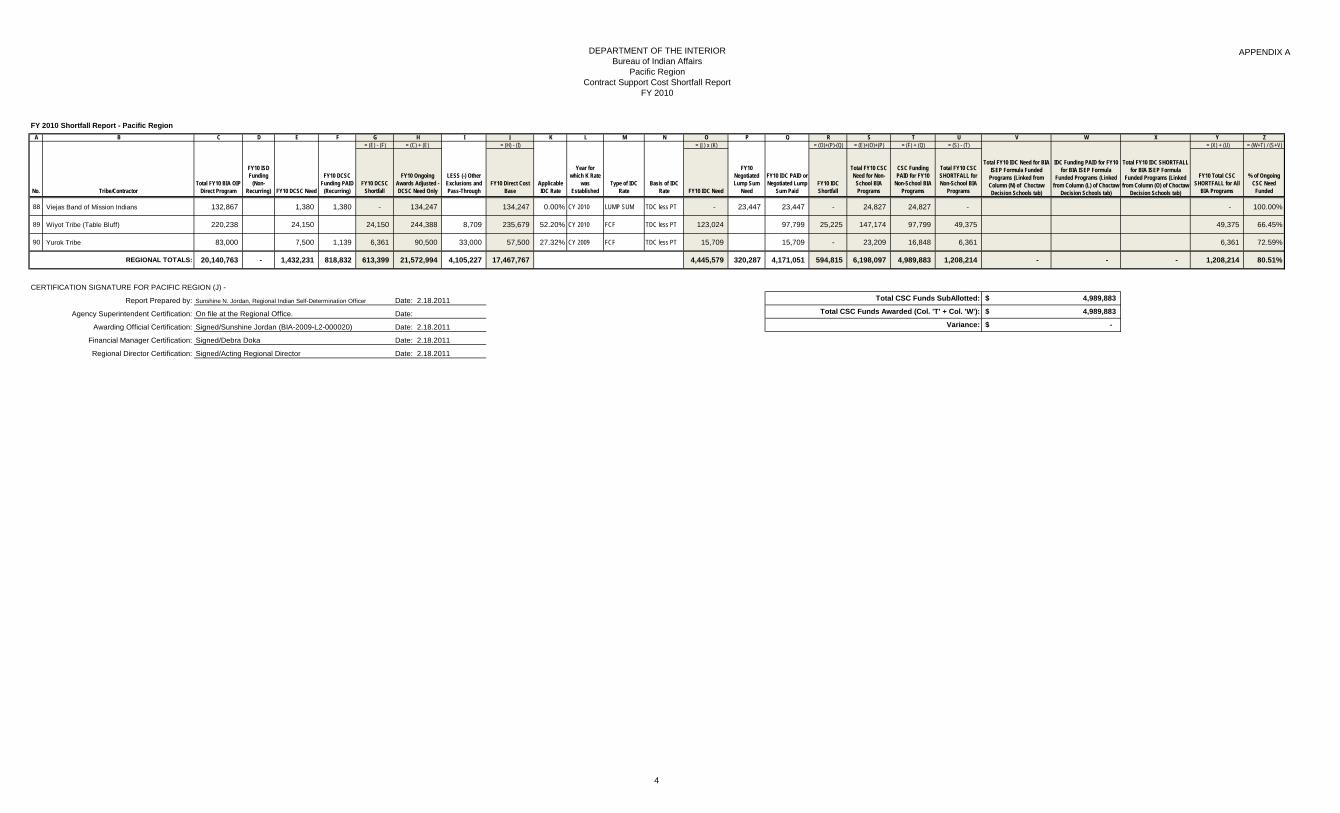
DEPARTMENT OF THE INTERIORBureau of Indian Affairs
Pacific RegionContract Support Cost Shortfall Report
FY 2010
APPENDIX A
4
A B C D E F G H I J K L M N O P Q R S T U V W X Y Z= (E) - (F) = (C) + (E) = (H) - (I) = (J) x (K) = (O)+(P)-(Q) = (E)+(O)+(P) = (F) + (Q) = (S) - (T) = (X) + (U) = (W+T) / (S+V)
No. Tribe/ContractorTotal FY10 BIA OIP
Direct Program
FY10 ISD Funding
(Non-Recurring) FY10 DCSC Need
FY10 DCSC Funding PAID
(Recurring)FY10 DCSC
Shortfall
FY10 Ongoing Awards Adjusted - DCSC Need Only
LESS (-) Other Exclusions and Pass-Through
FY10 Direct Cost Base
Applicable IDC Rate
Year for which K Rate
was Established
Type of IDC Rate
Basis of IDC Rate FY10 IDC Need
FY10 Negotiated Lump Sum
Need
FY10 IDC PAID or Negotiated Lump
Sum PaidFY10 IDC Shortfall
Total FY10 CSC Need for Non-
School BIA Programs
CSC Funding PAID for FY10
Non-School BIA Programs
Total FY10 CSC SHORTFALL for Non-School BIA
Programs
FY10 Total CSC SHORTFALL for All
BIA Programs
% of Ongoing CSC Need
Funded
FY 2010 Shortfall Report - Pacific Region
Total FY10 IDC Need for BIA ISEP Formula Funded
Programs (Linked from Column (N) of Choctaw Decision Schools tab)
IDC Funding PAID for FY10 for BIA ISEP Formula
Funded Programs (Linked from Column (L) of Choctaw
Decision Schools tab)
Total FY10 IDC SHORTFALL for BIA ISEP Formula
Funded Programs (Linked from Column (O) of Choctaw
Decision Schools tab)
88 Viejas Band of Mission Indians 132,867 1,380 1,380 - 134,247 134,247 0.00% CY 2010 LUMP SUM TDC less PT - 23,447 23,447 - 24,827 24,827 - - 100.00%
89 Wiyot Tribe (Table Bluff) 220,238 24,150 24,150 244,388 8,709 235,679 52.20% CY 2010 FCF TDC less PT 123,024 97,799 25,225 147,174 97,799 49,375 49,375 66.45%
90 Yurok Tribe 83,000 7,500 1,139 6,361 90,500 33,000 57,500 27.32% CY 2009 FCF TDC less PT 15,709 15,709 - 23,209 16,848 6,361 6,361 72.59%
REGIONAL TOTALS: 20,140,763 - 1,432,231 818,832 613,399 21,572,994 4,105,227 17,467,767 4,445,579 320,287 4,171,051 594,815 6,198,097 4,989,883 1,208,214 - - - 1,208,214 80.51%
CERTIFICATION SIGNATURE FOR PACIFIC REGION (J) -
Report Prepared by: Date: 2.18.2011
Agency Superintendent Certification: Date:
Awarding Official Certification: Date: 2.18.2011
Financial Manager Certification: Date: 2.18.2011
Regional Director Certification: Date: 2.18.2011Signed/Acting Regional Director
Sunshine N. Jordan, Regional Indian Self-Determination Officer
On file at the Regional Office.
Signed/Sunshine Jordan (BIA-2009-L2-000020)
Signed/Debra Doka
Total CSC Funds SubAllotted:
Total CSC Funds Awarded (Col. 'T' + Col. 'W'):
Variance:
$ 4,989,883
$ 4,989,883
$ -
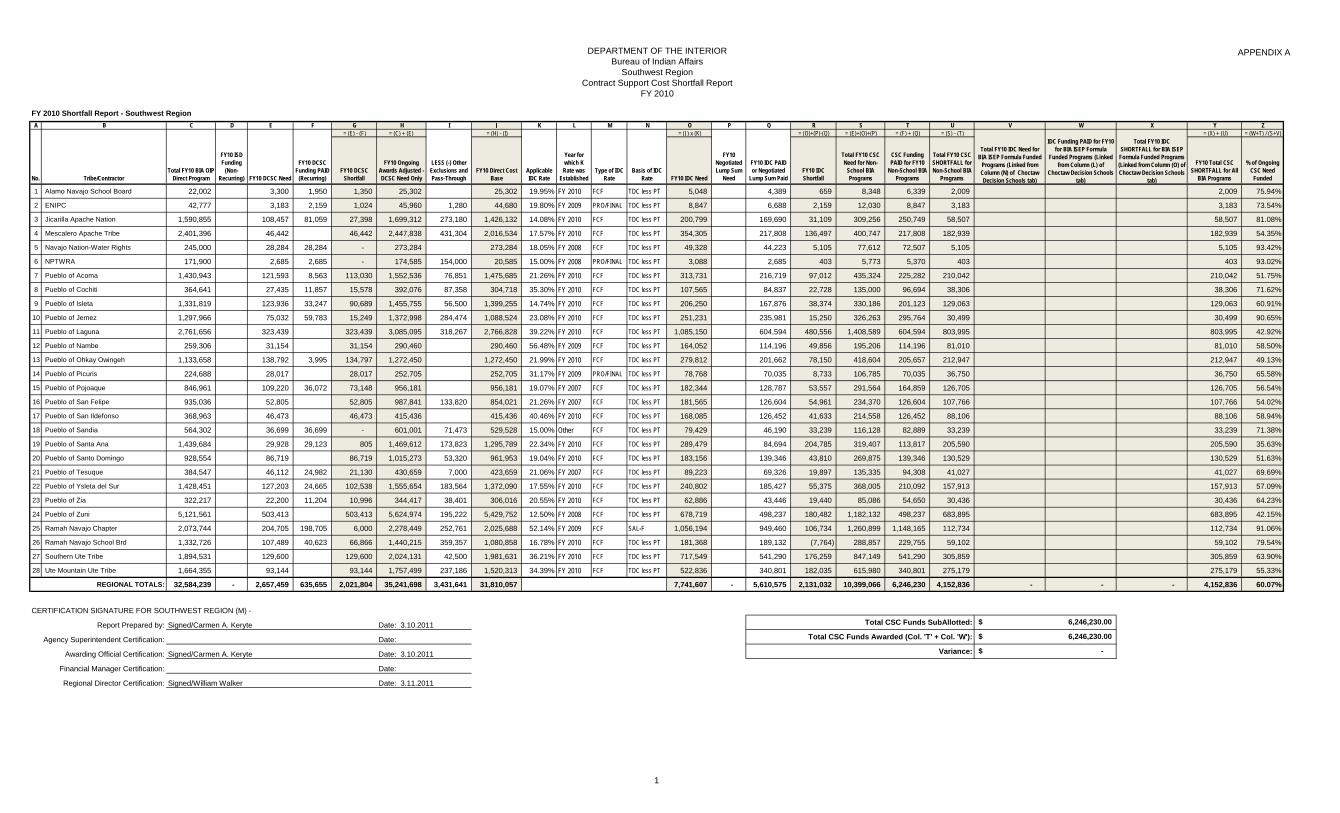
DEPARTMENT OF THE INTERIORBureau of Indian Affairs
Southwest RegionContract Support Cost Shortfall Report
FY 2010
APPENDIX A
1
A B C D E F G H I J K L M N O P Q R S T U V W X Y Z= (E) - (F) = (C) + (E) = (H) - (I) = (J) x (K) = (O)+(P)-(Q) = (E)+(O)+(P) = (F) + (Q) = (S) - (T) = (X) + (U) = (W+T) / (S+V)
No. Tribe/ContractorTotal FY10 BIA OIP
Direct Program
FY10 ISD Funding
(Non-Recurring) FY10 DCSC Need
FY10 DCSC Funding PAID
(Recurring)FY10 DCSC
Shortfall
FY10 Ongoing Awards Adjusted - DCSC Need Only
LESS (-) Other Exclusions and Pass-Through
FY10 Direct Cost Base
Applicable IDC Rate
Year for which K Rate was
EstablishedType of IDC
RateBasis of IDC
Rate FY10 IDC Need
FY10 Negotiated Lump Sum
Need
FY10 IDC PAID or Negotiated
Lump Sum PaidFY10 IDC Shortfall
Total FY10 CSC Need for Non-
School BIA Programs
CSC Funding PAID for FY10
Non-School BIA Programs
Total FY10 CSC SHORTFALL for Non-School BIA
Programs
FY10 Total CSC SHORTFALL for All
BIA Programs
% of Ongoing CSC Need
Funded
1 Alamo Navajo School Board 22,002 3,300 1,950 1,350 25,302 25,302 19.95% FY 2010 FCF TDC less PT 5,048 4,389 659 8,348 6,339 2,009 2,009 75.94%
2 ENIPC 42,777 3,183 2,159 1,024 45,960 1,280 44,680 19.80% FY 2009 PRO/FINAL TDC less PT 8,847 6,688 2,159 12,030 8,847 3,183 3,183 73.54%
3 Jicarilla Apache Nation 1,590,855 108,457 81,059 27,398 1,699,312 273,180 1,426,132 14.08% FY 2010 FCF TDC less PT 200,799 169,690 31,109 309,256 250,749 58,507 58,507 81.08%
4 Mescalero Apache Tribe 2,401,396 46,442 46,442 2,447,838 431,304 2,016,534 17.57% FY 2010 FCF TDC less PT 354,305 217,808 136,497 400,747 217,808 182,939 182,939 54.35%
5 Navajo Nation-Water Rights 245,000 28,284 28,284 - 273,284 273,284 18.05% FY 2008 FCF TDC less PT 49,328 44,223 5,105 77,612 72,507 5,105 5,105 93.42%
6 NPTWRA 171,900 2,685 2,685 - 174,585 154,000 20,585 15.00% FY 2008 PRO/FINAL TDC less PT 3,088 2,685 403 5,773 5,370 403 403 93.02%
7 Pueblo of Acoma 1,430,943 121,593 8,563 113,030 1,552,536 76,851 1,475,685 21.26% FY 2010 FCF TDC less PT 313,731 216,719 97,012 435,324 225,282 210,042 210,042 51.75%
8 Pueblo of Cochiti 364,641 27,435 11,857 15,578 392,076 87,358 304,718 35.30% FY 2010 FCF TDC less PT 107,565 84,837 22,728 135,000 96,694 38,306 38,306 71.62%
9 Pueblo of Isleta 1,331,819 123,936 33,247 90,689 1,455,755 56,500 1,399,255 14.74% FY 2010 FCF TDC less PT 206,250 167,876 38,374 330,186 201,123 129,063 129,063 60.91%
10 Pueblo of Jemez 1,297,966 75,032 59,783 15,249 1,372,998 284,474 1,088,524 23.08% FY 2010 FCF TDC less PT 251,231 235,981 15,250 326,263 295,764 30,499 30,499 90.65%
11 Pueblo of Laguna 2,761,656 323,439 323,439 3,085,095 318,267 2,766,828 39.22% FY 2010 FCF TDC less PT 1,085,150 604,594 480,556 1,408,589 604,594 803,995 803,995 42.92%
12 Pueblo of Nambe 259,306 31,154 31,154 290,460 290,460 56.48% FY 2009 FCF TDC less PT 164,052 114,196 49,856 195,206 114,196 81,010 81,010 58.50%
13 Pueblo of Ohkay Owingeh 1,133,658 138,792 3,995 134,797 1,272,450 1,272,450 21.99% FY 2010 FCF TDC less PT 279,812 201,662 78,150 418,604 205,657 212,947 212,947 49.13%
14 Pueblo of Picuris 224,688 28,017 28,017 252,705 252,705 31.17% FY 2009 PRO/FINAL TDC less PT 78,768 70,035 8,733 106,785 70,035 36,750 36,750 65.58%
15 Pueblo of Pojoaque 846,961 109,220 36,072 73,148 956,181 956,181 19.07% FY 2007 FCF TDC less PT 182,344 128,787 53,557 291,564 164,859 126,705 126,705 56.54%
16 Pueblo of San Felipe 935,036 52,805 52,805 987,841 133,820 854,021 21.26% FY 2007 FCF TDC less PT 181,565 126,604 54,961 234,370 126,604 107,766 107,766 54.02%
17 Pueblo of San Ildefonso 368,963 46,473 46,473 415,436 415,436 40.46% FY 2010 FCF TDC less PT 168,085 126,452 41,633 214,558 126,452 88,106 88,106 58.94%
18 Pueblo of Sandia 564,302 36,699 36,699 - 601,001 71,473 529,528 15.00% Other FCF TDC less PT 79,429 46,190 33,239 116,128 82,889 33,239 33,239 71.38%
19 Pueblo of Santa Ana 1,439,684 29,928 29,123 805 1,469,612 173,823 1,295,789 22.34% FY 2010 FCF TDC less PT 289,479 84,694 204,785 319,407 113,817 205,590 205,590 35.63%
20 Pueblo of Santo Domingo 928,554 86,719 86,719 1,015,273 53,320 961,953 19.04% FY 2010 FCF TDC less PT 183,156 139,346 43,810 269,875 139,346 130,529 130,529 51.63%
21 Pueblo of Tesuque 384,547 46,112 24,982 21,130 430,659 7,000 423,659 21.06% FY 2007 FCF TDC less PT 89,223 69,326 19,897 135,335 94,308 41,027 41,027 69.69%
22 Pueblo of Ysleta del Sur 1,428,451 127,203 24,665 102,538 1,555,654 183,564 1,372,090 17.55% FY 2010 FCF TDC less PT 240,802 185,427 55,375 368,005 210,092 157,913 157,913 57.09%
23 Pueblo of Zia 322,217 22,200 11,204 10,996 344,417 38,401 306,016 20.55% FY 2010 FCF TDC less PT 62,886 43,446 19,440 85,086 54,650 30,436 30,436 64.23%
24 Pueblo of Zuni 5,121,561 503,413 503,413 5,624,974 195,222 5,429,752 12.50% FY 2008 FCF TDC less PT 678,719 498,237 180,482 1,182,132 498,237 683,895 683,895 42.15%
25 Ramah Navajo Chapter 2,073,744 204,705 198,705 6,000 2,278,449 252,761 2,025,688 52.14% FY 2009 FCF SAL-F 1,056,194 949,460 106,734 1,260,899 1,148,165 112,734 112,734 91.06%
26 Ramah Navajo School Brd 1,332,726 107,489 40,623 66,866 1,440,215 359,357 1,080,858 16.78% FY 2010 FCF TDC less PT 181,368 189,132 (7,764) 288,857 229,755 59,102 59,102 79.54%
27 Southern Ute Tribe 1,894,531 129,600 129,600 2,024,131 42,500 1,981,631 36.21% FY 2010 FCF TDC less PT 717,549 541,290 176,259 847,149 541,290 305,859 305,859 63.90%
28 Ute Mountain Ute Tribe 1,664,355 93,144 93,144 1,757,499 237,186 1,520,313 34.39% FY 2010 FCF TDC less PT 522,836 340,801 182,035 615,980 340,801 275,179 275,179 55.33%
REGIONAL TOTALS: 32,584,239 - 2,657,459 635,655 2,021,804 35,241,698 3,431,641 31,810,057 7,741,607 - 5,610,575 2,131,032 10,399,066 6,246,230 4,152,836 - - - 4,152,836 60.07%
CERTIFICATION SIGNATURE FOR SOUTHWEST REGION (M) -
Report Prepared by: Date: 3.10.2011
Agency Superintendent Certification: Date:
Awarding Official Certification: Date: 3.10.2011
Financial Manager Certification: Date:
Regional Director Certification: Date: 3.11.2011Signed/William Walker
6,246,230.00$
6,246,230.00$
Signed/Carmen A. Keryte -$
Total CSC Funds Awarded (Col. 'T' + Col. 'W'):
Variance:
FY 2010 Shortfall Report - Southwest Region
Signed/Carmen A. Keryte
Total FY10 IDC Need for BIA ISEP Formula Funded
Programs (Linked from Column (N) of Choctaw Decision Schools tab)
IDC Funding PAID for FY10 for BIA ISEP Formula
Funded Programs (Linked from Column (L) of
Choctaw Decision Schools tab)
Total FY10 IDC SHORTFALL for BIA ISEP
Formula Funded Programs (Linked from Column (O) of Choctaw Decision Schools
tab)
Total CSC Funds SubAllotted:
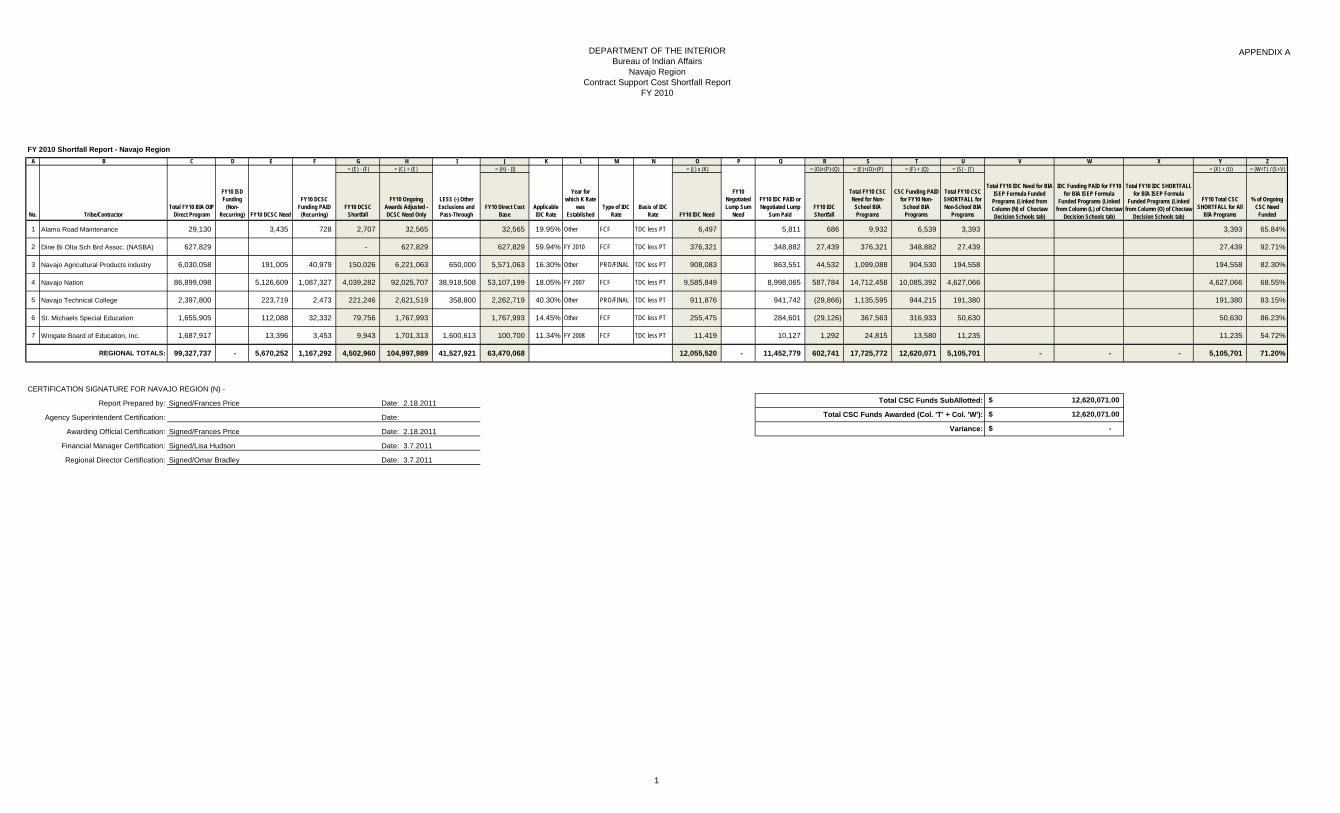
DEPARTMENT OF THE INTERIORBureau of Indian Affairs
Navajo RegionContract Support Cost Shortfall Report
FY 2010
APPENDIX A
1
A B C D E F G H I J K L M N O P Q R S T U V W X Y Z= (E) - (F) = (C) + (E) = (H) - (I) = (J) x (K) = (O)+(P)-(Q) = (E)+(O)+(P) = (F) + (Q) = (S) - (T) = (X) + (U) = (W+T) / (S+V)
No. Tribe/ContractorTotal FY10 BIA OIP
Direct Program
FY10 ISD Funding
(Non-Recurring) FY10 DCSC Need
FY10 DCSC Funding PAID
(Recurring)FY10 DCSC
Shortfall
FY10 Ongoing Awards Adjusted - DCSC Need Only
LESS (-) Other Exclusions and Pass-Through
FY10 Direct Cost Base
Applicable IDC Rate
Year for which K Rate
was Established
Type of IDC Rate
Basis of IDC Rate FY10 IDC Need
FY10 Negotiated Lump Sum
Need
FY10 IDC PAID or Negotiated Lump
Sum PaidFY10 IDC Shortfall
Total FY10 CSC Need for Non-
School BIA Programs
CSC Funding PAID for FY10 Non-
School BIA Programs
Total FY10 CSC SHORTFALL for Non-School BIA
Programs
FY10 Total CSC SHORTFALL for All
BIA Programs
% of Ongoing CSC Need
Funded
1 Alamo Road Maintenance 29,130 3,435 728 2,707 32,565 32,565 19.95% Other FCF TDC less PT 6,497 5,811 686 9,932 6,539 3,393 3,393 65.84%
2 Dine Bi Olta Sch Brd Assoc. (NASBA) 627,829 - 627,829 627,829 59.94% FY 2010 FCF TDC less PT 376,321 348,882 27,439 376,321 348,882 27,439 27,439 92.71%
3 Navajo Agricultural Products industry 6,030,058 191,005 40,979 150,026 6,221,063 650,000 5,571,063 16.30% Other PRO/FINAL TDC less PT 908,083 863,551 44,532 1,099,088 904,530 194,558 194,558 82.30%
4 Navajo Nation 86,899,098 5,126,609 1,087,327 4,039,282 92,025,707 38,918,508 53,107,199 18.05% FY 2007 FCF TDC less PT 9,585,849 8,998,065 587,784 14,712,458 10,085,392 4,627,066 4,627,066 68.55%
5 Navajo Technical College 2,397,800 223,719 2,473 221,246 2,621,519 358,800 2,262,719 40.30% Other PRO/FINAL TDC less PT 911,876 941,742 (29,866) 1,135,595 944,215 191,380 191,380 83.15%
6 St. Michaels Special Education 1,655,905 112,088 32,332 79,756 1,767,993 1,767,993 14.45% Other FCF TDC less PT 255,475 284,601 (29,126) 367,563 316,933 50,630 50,630 86.23%
7 Wingate Board of Education, Inc. 1,687,917 13,396 3,453 9,943 1,701,313 1,600,613 100,700 11.34% FY 2008 FCF TDC less PT 11,419 10,127 1,292 24,815 13,580 11,235 11,235 54.72%
REGIONAL TOTALS: 99,327,737 - 5,670,252 1,167,292 4,502,960 104,997,989 41,527,921 63,470,068 12,055,520 - 11,452,779 602,741 17,725,772 12,620,071 5,105,701 - - - 5,105,701 71.20%
CERTIFICATION SIGNATURE FOR NAVAJO REGION (N) -
Report Prepared by: Date: 2.18.2011
Agency Superintendent Certification: Date:
Awarding Official Certification: Date: 2.18.2011
Financial Manager Certification: Date: 3.7.2011
Regional Director Certification: Date: 3.7.2011Signed/Omar Bradley
12,620,071.00$
12,620,071.00$
Signed/Frances Price -$
Signed/Lisa Hudson
IDC Funding PAID for FY10 for BIA ISEP Formula
Funded Programs (Linked from Column (L) of Choctaw
Decision Schools tab)
Total FY10 IDC SHORTFALL for BIA ISEP Formula
Funded Programs (Linked from Column (O) of Choctaw
Decision Schools tab)
Total CSC Funds SubAllotted:
Total CSC Funds Awarded (Col. 'T' + Col. 'W'):
Variance:
FY 2010 Shortfall Report - Navajo Region
Signed/Frances Price
Total FY10 IDC Need for BIA ISEP Formula Funded
Programs (Linked from Column (N) of Choctaw Decision Schools tab)
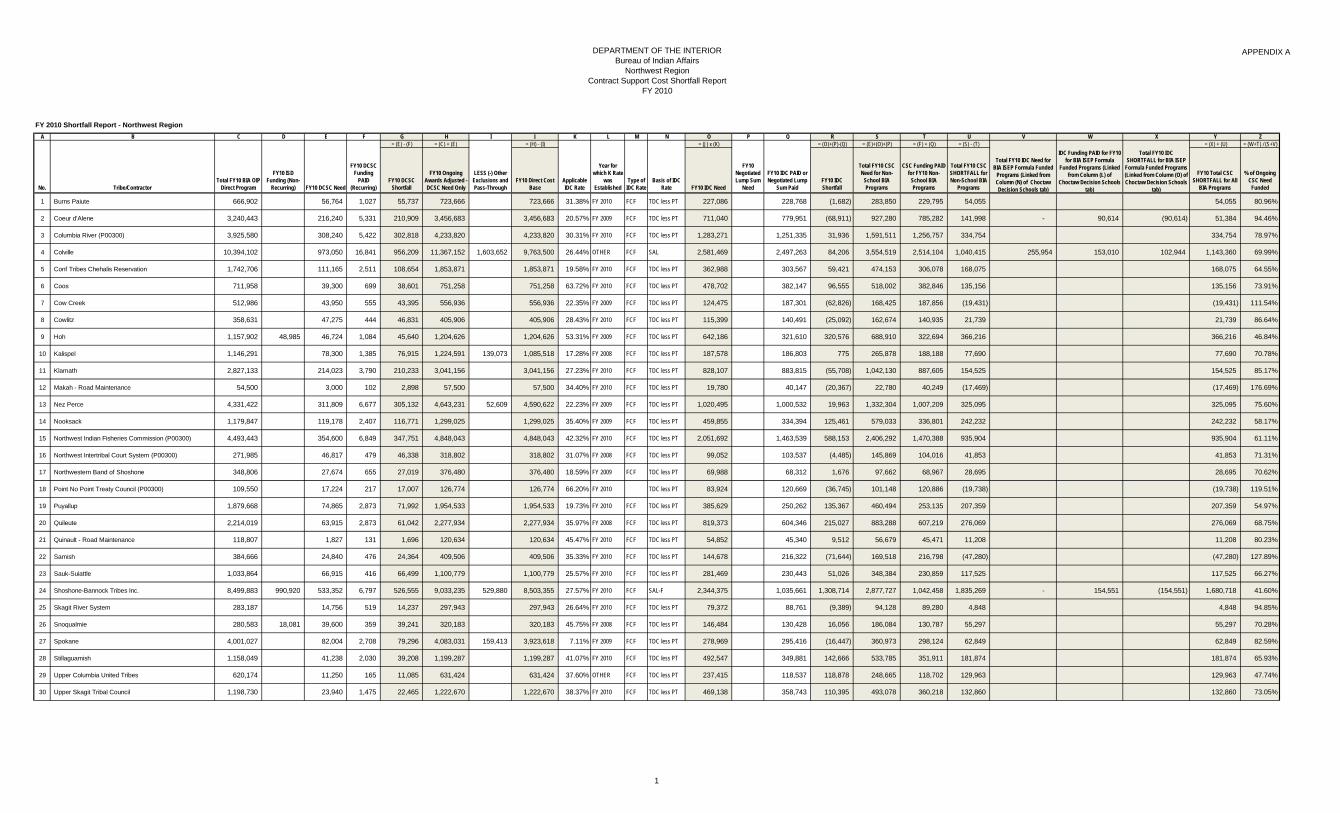
DEPARTMENT OF THE INTERIORBureau of Indian Affairs
Northwest RegionContract Support Cost Shortfall Report
FY 2010
APPENDIX A
1
A B C D E F G H I J K L M N O P Q R S T U V W X Y Z= (E) - (F) = (C) + (E) = (H) - (I) = (J) x (K) = (O)+(P)-(Q) = (E)+(O)+(P) = (F) + (Q) = (S) - (T) = (X) + (U) = (W+T) / (S+V)
No. Tribe/ContractorTotal FY10 BIA OIP
Direct Program
FY10 ISD Funding (Non-
Recurring) FY10 DCSC Need
FY10 DCSC Funding
PAID (Recurring)
FY10 DCSC Shortfall
FY10 Ongoing Awards Adjusted - DCSC Need Only
LESS (-) Other Exclusions and Pass-Through
FY10 Direct Cost Base
Applicable IDC Rate
Year for which K Rate
was Established
Type of IDC Rate
Basis of IDC Rate FY10 IDC Need
FY10 Negotiated Lump Sum
Need
FY10 IDC PAID or Negotiated Lump
Sum PaidFY10 IDC Shortfall
Total FY10 CSC Need for Non-
School BIA Programs
CSC Funding PAID for FY10 Non-
School BIA Programs
Total FY10 CSC SHORTFALL for Non-School BIA
Programs
FY10 Total CSC SHORTFALL for All
BIA Programs
% of Ongoing CSC Need
Funded
1 Burns Paiute 666,902 56,764 1,027 55,737 723,666 723,666 31.38% FY 2010 FCF TDC less PT 227,086 228,768 (1,682) 283,850 229,795 54,055 54,055 80.96%
2 Coeur d'Alene 3,240,443 216,240 5,331 210,909 3,456,683 3,456,683 20.57% FY 2009 FCF TDC less PT 711,040 779,951 (68,911) 927,280 785,282 141,998 - 90,614 (90,614) 51,384 94.46%
3 Columbia River (P00300) 3,925,580 308,240 5,422 302,818 4,233,820 4,233,820 30.31% FY 2010 FCF TDC less PT 1,283,271 1,251,335 31,936 1,591,511 1,256,757 334,754 334,754 78.97%
4 Colville 10,394,102 973,050 16,841 956,209 11,367,152 1,603,652 9,763,500 26.44% OTHER FCF SAL 2,581,469 2,497,263 84,206 3,554,519 2,514,104 1,040,415 255,954 153,010 102,944 1,143,360 69.99%
5 Conf Tribes Chehalis Reservation 1,742,706 111,165 2,511 108,654 1,853,871 1,853,871 19.58% FY 2010 FCF TDC less PT 362,988 303,567 59,421 474,153 306,078 168,075 168,075 64.55%
6 Coos 711,958 39,300 699 38,601 751,258 751,258 63.72% FY 2010 FCF TDC less PT 478,702 382,147 96,555 518,002 382,846 135,156 135,156 73.91%
7 Cow Creek 512,986 43,950 555 43,395 556,936 556,936 22.35% FY 2009 FCF TDC less PT 124,475 187,301 (62,826) 168,425 187,856 (19,431) (19,431) 111.54%
8 Cowlitz 358,631 47,275 444 46,831 405,906 405,906 28.43% FY 2010 FCF TDC less PT 115,399 140,491 (25,092) 162,674 140,935 21,739 21,739 86.64%
9 Hoh 1,157,902 48,985 46,724 1,084 45,640 1,204,626 1,204,626 53.31% FY 2009 FCF TDC less PT 642,186 321,610 320,576 688,910 322,694 366,216 366,216 46.84%
10 Kalispel 1,146,291 78,300 1,385 76,915 1,224,591 139,073 1,085,518 17.28% FY 2008 FCF TDC less PT 187,578 186,803 775 265,878 188,188 77,690 77,690 70.78%
11 Klamath 2,827,133 214,023 3,790 210,233 3,041,156 3,041,156 27.23% FY 2010 FCF TDC less PT 828,107 883,815 (55,708) 1,042,130 887,605 154,525 154,525 85.17%
12 Makah - Road Maintenance 54,500 3,000 102 2,898 57,500 57,500 34.40% FY 2010 FCF TDC less PT 19,780 40,147 (20,367) 22,780 40,249 (17,469) (17,469) 176.69%
13 Nez Perce 4,331,422 311,809 6,677 305,132 4,643,231 52,609 4,590,622 22.23% FY 2009 FCF TDC less PT 1,020,495 1,000,532 19,963 1,332,304 1,007,209 325,095 325,095 75.60%
14 Nooksack 1,179,847 119,178 2,407 116,771 1,299,025 1,299,025 35.40% FY 2009 FCF TDC less PT 459,855 334,394 125,461 579,033 336,801 242,232 242,232 58.17%
15 Northwest Indian Fisheries Commission (P00300) 4,493,443 354,600 6,849 347,751 4,848,043 4,848,043 42.32% FY 2010 FCF TDC less PT 2,051,692 1,463,539 588,153 2,406,292 1,470,388 935,904 935,904 61.11%
16 Northwest Intertribal Court System (P00300) 271,985 46,817 479 46,338 318,802 318,802 31.07% FY 2008 FCF TDC less PT 99,052 103,537 (4,485) 145,869 104,016 41,853 41,853 71.31%
17 Northwestern Band of Shoshone 348,806 27,674 655 27,019 376,480 376,480 18.59% FY 2009 FCF TDC less PT 69,988 68,312 1,676 97,662 68,967 28,695 28,695 70.62%
18 Point No Point Treaty Council (P00300) 109,550 17,224 217 17,007 126,774 126,774 66.20% FY 2010 TDC less PT 83,924 120,669 (36,745) 101,148 120,886 (19,738) (19,738) 119.51%
19 Puyallup 1,879,668 74,865 2,873 71,992 1,954,533 1,954,533 19.73% FY 2010 FCF TDC less PT 385,629 250,262 135,367 460,494 253,135 207,359 207,359 54.97%
20 Quileute 2,214,019 63,915 2,873 61,042 2,277,934 2,277,934 35.97% FY 2008 FCF TDC less PT 819,373 604,346 215,027 883,288 607,219 276,069 276,069 68.75%
21 Quinault - Road Maintenance 118,807 1,827 131 1,696 120,634 120,634 45.47% FY 2010 FCF TDC less PT 54,852 45,340 9,512 56,679 45,471 11,208 11,208 80.23%
22 Samish 384,666 24,840 476 24,364 409,506 409,506 35.33% FY 2010 FCF TDC less PT 144,678 216,322 (71,644) 169,518 216,798 (47,280) (47,280) 127.89%
23 Sauk-Suiattle 1,033,864 66,915 416 66,499 1,100,779 1,100,779 25.57% FY 2010 FCF TDC less PT 281,469 230,443 51,026 348,384 230,859 117,525 117,525 66.27%
24 Shoshone-Bannock Tribes Inc. 8,499,883 990,920 533,352 6,797 526,555 9,033,235 529,880 8,503,355 27.57% FY 2010 FCF SAL-F 2,344,375 1,035,661 1,308,714 2,877,727 1,042,458 1,835,269 - 154,551 (154,551) 1,680,718 41.60%
25 Skagit River System 283,187 14,756 519 14,237 297,943 297,943 26.64% FY 2010 FCF TDC less PT 79,372 88,761 (9,389) 94,128 89,280 4,848 4,848 94.85%
26 Snoqualmie 280,583 18,081 39,600 359 39,241 320,183 320,183 45.75% FY 2008 FCF TDC less PT 146,484 130,428 16,056 186,084 130,787 55,297 55,297 70.28%
27 Spokane 4,001,027 82,004 2,708 79,296 4,083,031 159,413 3,923,618 7.11% FY 2009 FCF TDC less PT 278,969 295,416 (16,447) 360,973 298,124 62,849 62,849 82.59%
28 Stillaguamish 1,158,049 41,238 2,030 39,208 1,199,287 1,199,287 41.07% FY 2010 FCF TDC less PT 492,547 349,881 142,666 533,785 351,911 181,874 181,874 65.93%
29 Upper Columbia United Tribes 620,174 11,250 165 11,085 631,424 631,424 37.60% OTHER FCF TDC less PT 237,415 118,537 118,878 248,665 118,702 129,963 129,963 47.74%
30 Upper Skagit Tribal Council 1,198,730 23,940 1,475 22,465 1,222,670 1,222,670 38.37% FY 2010 FCF TDC less PT 469,138 358,743 110,395 493,078 360,218 132,860 132,860 73.05%
FY 2010 Shortfall Report - Northwest Region
Total FY10 IDC Need for BIA ISEP Formula Funded
Programs (Linked from Column (N) of Choctaw Decision Schools tab)
IDC Funding PAID for FY10 for BIA ISEP Formula
Funded Programs (Linked from Column (L) of
Choctaw Decision Schools tab)
Total FY10 IDC SHORTFALL for BIA ISEP
Formula Funded Programs (Linked from Column (O) of Choctaw Decision Schools
tab)
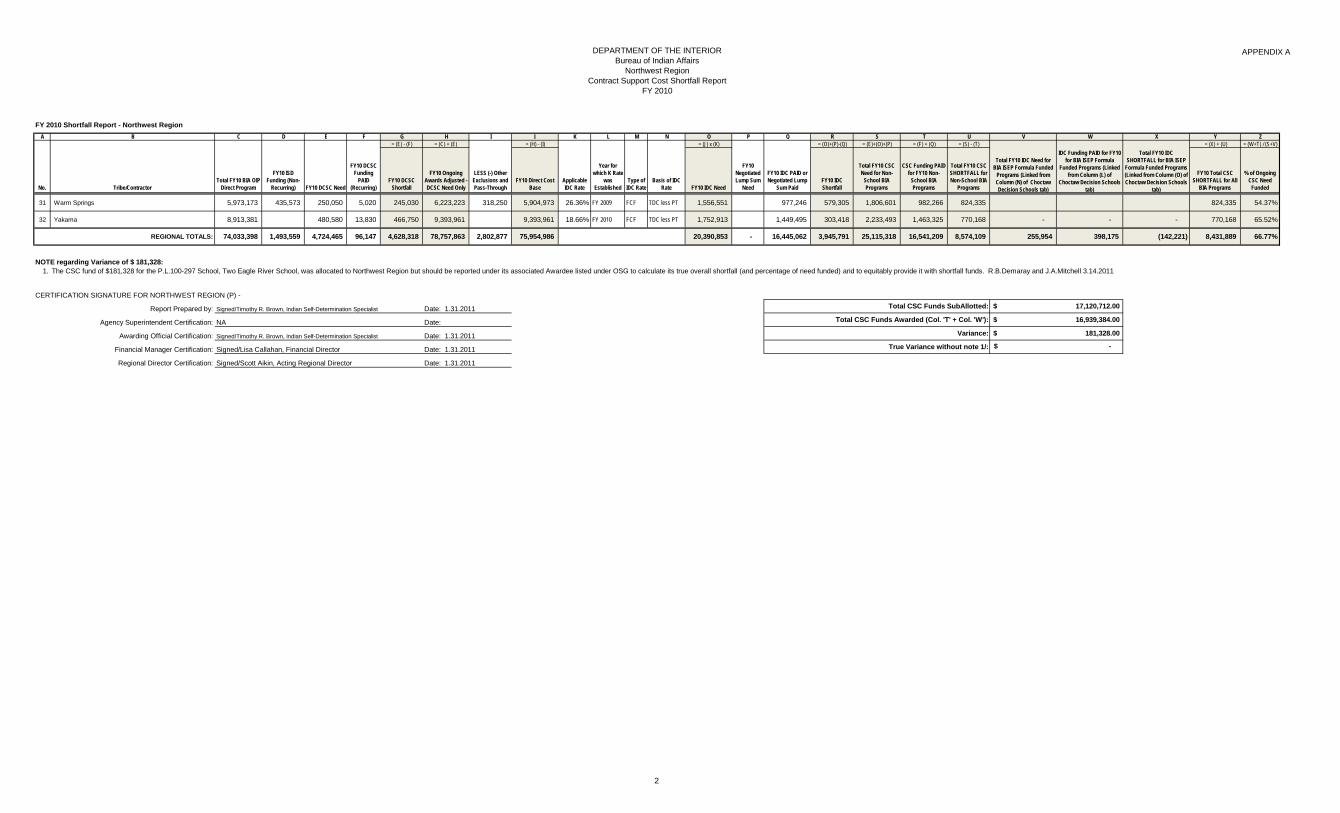
DEPARTMENT OF THE INTERIORBureau of Indian Affairs
Northwest RegionContract Support Cost Shortfall Report
FY 2010
APPENDIX A
2
A B C D E F G H I J K L M N O P Q R S T U V W X Y Z= (E) - (F) = (C) + (E) = (H) - (I) = (J) x (K) = (O)+(P)-(Q) = (E)+(O)+(P) = (F) + (Q) = (S) - (T) = (X) + (U) = (W+T) / (S+V)
No. Tribe/ContractorTotal FY10 BIA OIP
Direct Program
FY10 ISD Funding (Non-
Recurring) FY10 DCSC Need
FY10 DCSC Funding
PAID (Recurring)
FY10 DCSC Shortfall
FY10 Ongoing Awards Adjusted - DCSC Need Only
LESS (-) Other Exclusions and Pass-Through
FY10 Direct Cost Base
Applicable IDC Rate
Year for which K Rate
was Established
Type of IDC Rate
Basis of IDC Rate FY10 IDC Need
FY10 Negotiated Lump Sum
Need
FY10 IDC PAID or Negotiated Lump
Sum PaidFY10 IDC Shortfall
Total FY10 CSC Need for Non-
School BIA Programs
CSC Funding PAID for FY10 Non-
School BIA Programs
Total FY10 CSC SHORTFALL for Non-School BIA
Programs
FY10 Total CSC SHORTFALL for All
BIA Programs
% of Ongoing CSC Need
Funded
FY 2010 Shortfall Report - Northwest Region
Total FY10 IDC Need for BIA ISEP Formula Funded
Programs (Linked from Column (N) of Choctaw Decision Schools tab)
IDC Funding PAID for FY10 for BIA ISEP Formula
Funded Programs (Linked from Column (L) of
Choctaw Decision Schools tab)
Total FY10 IDC SHORTFALL for BIA ISEP
Formula Funded Programs (Linked from Column (O) of Choctaw Decision Schools
tab)
31 Warm Springs 5,973,173 435,573 250,050 5,020 245,030 6,223,223 318,250 5,904,973 26.36% FY 2009 FCF TDC less PT 1,556,551 977,246 579,305 1,806,601 982,266 824,335 824,335 54.37%
32 Yakama 8,913,381 480,580 13,830 466,750 9,393,961 9,393,961 18.66% FY 2010 FCF TDC less PT 1,752,913 1,449,495 303,418 2,233,493 1,463,325 770,168 - - - 770,168 65.52%
REGIONAL TOTALS: 74,033,398 1,493,559 4,724,465 96,147 4,628,318 78,757,863 2,802,877 75,954,986 20,390,853 - 16,445,062 3,945,791 25,115,318 16,541,209 8,574,109 255,954 398,175 (142,221) 8,431,889 66.77%
NOTE regarding Variance of $ 181,328:1.
CERTIFICATION SIGNATURE FOR NORTHWEST REGION (P) -
Report Prepared by: Date: 1.31.2011
Agency Superintendent Certification: Date:
Awarding Official Certification: Date: 1.31.2011
Financial Manager Certification: Date: 1.31.2011
Regional Director Certification: Date: 1.31.2011
Signed/Timothy R. Brown, Indian Self-Determination Specialist
NA
Signed/Timothy R. Brown, Indian Self-Determination Specialist
Signed/Lisa Callahan, Financial Director
Signed/Scott Aikin, Acting Regional Director
The CSC fund of $181,328 for the P.L.100-297 School, Two Eagle River School, was allocated to Northwest Region but should be reported under its associated Awardee listed under OSG to calculate its true overall shortfall (and percentage of need funded) and to equitably provide it with shortfall funds. R.B.Demaray and J.A.Mitchell 3.14.2011
True Variance without note 1/: -$
Total CSC Funds SubAllotted:
Total CSC Funds Awarded (Col. 'T' + Col. 'W'):
Variance:
$ 17,120,712.00
$ 16,939,384.00
$ 181,328.00
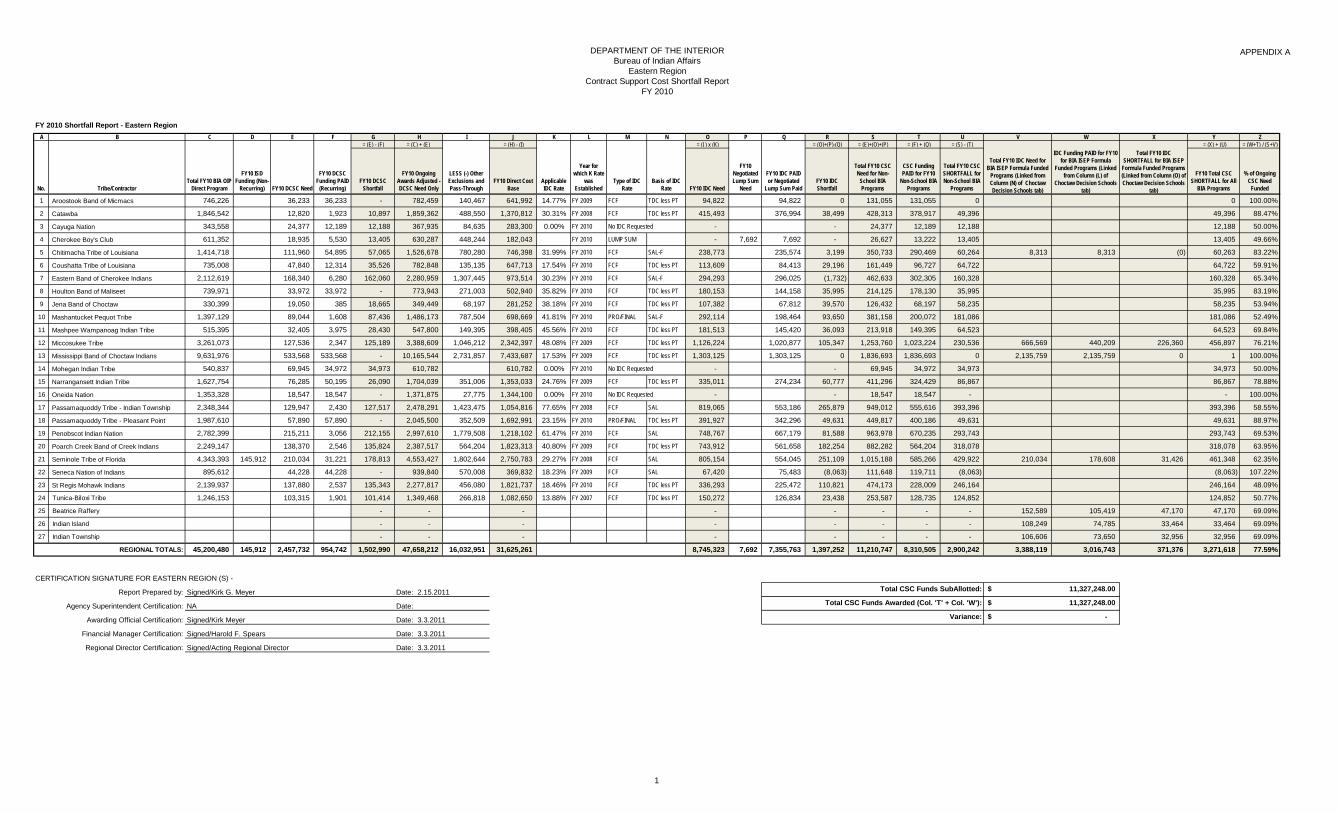
DEPARTMENT OF THE INTERIORBureau of Indian Affairs
Eastern RegionContract Support Cost Shortfall Report
FY 2010
APPENDIX A
1
A B C D E F G H I J K L M N O P Q R S T U V W X Y Z= (E) - (F) = (C) + (E) = (H) - (I) = (J) x (K) = (O)+(P)-(Q) = (E)+(O)+(P) = (F) + (Q) = (S) - (T) = (X) + (U) = (W+T) / (S+V)
No. Tribe/ContractorTotal FY10 BIA OIP
Direct Program
FY10 ISD Funding (Non-
Recurring) FY10 DCSC Need
FY10 DCSC Funding PAID
(Recurring)FY10 DCSC
Shortfall
FY10 Ongoing Awards Adjusted - DCSC Need Only
LESS (-) Other Exclusions and Pass-Through
FY10 Direct Cost Base
Applicable IDC Rate
Year for which K Rate
was Established
Type of IDC Rate
Basis of IDC Rate FY10 IDC Need
FY10 Negotiated Lump Sum
Need
FY10 IDC PAID or Negotiated
Lump Sum PaidFY10 IDC Shortfall
Total FY10 CSC Need for Non-
School BIA Programs
CSC Funding PAID for FY10
Non-School BIA Programs
Total FY10 CSC SHORTFALL for Non-School BIA
Programs
FY10 Total CSC SHORTFALL for All
BIA Programs
% of Ongoing CSC Need
Funded
1 Aroostook Band of Micmacs 746,226 36,233 36,233 - 782,459 140,467 641,992 14.77% FY 2009 FCF TDC less PT 94,822 94,822 0 131,055 131,055 0 0 100.00%
2 Catawba 1,846,542 12,820 1,923 10,897 1,859,362 488,550 1,370,812 30.31% FY 2008 FCF TDC less PT 415,493 376,994 38,499 428,313 378,917 49,396 49,396 88.47%
3 Cayuga Nation 343,558 24,377 12,189 12,188 367,935 84,635 283,300 0.00% FY 2010 No IDC Requested - - 24,377 12,189 12,188 12,188 50.00%
4 Cherokee Boy's Club 611,352 18,935 5,530 13,405 630,287 448,244 182,043 FY 2010 LUMP SUM - 7,692 7,692 - 26,627 13,222 13,405 13,405 49.66%
5 Chitimacha Tribe of Louisiana 1,414,718 111,960 54,895 57,065 1,526,678 780,280 746,398 31.99% FY 2010 FCF SAL-F 238,773 235,574 3,199 350,733 290,469 60,264 8,313 8,313 (0) 60,263 83.22%
6 Coushatta Tribe of Louisiana 735,008 47,840 12,314 35,526 782,848 135,135 647,713 17.54% FY 2010 FCF TDC less PT 113,609 84,413 29,196 161,449 96,727 64,722 64,722 59.91%
7 Eastern Band of Cherokee Indians 2,112,619 168,340 6,280 162,060 2,280,959 1,307,445 973,514 30.23% FY 2010 FCF SAL-F 294,293 296,025 (1,732) 462,633 302,305 160,328 160,328 65.34%
8 Houlton Band of Maliseet 739,971 33,972 33,972 - 773,943 271,003 502,940 35.82% FY 2010 FCF TDC less PT 180,153 144,158 35,995 214,125 178,130 35,995 35,995 83.19%
9 Jena Band of Choctaw 330,399 19,050 385 18,665 349,449 68,197 281,252 38.18% FY 2010 FCF TDC less PT 107,382 67,812 39,570 126,432 68,197 58,235 58,235 53.94%
10 Mashantucket Pequot Tribe 1,397,129 89,044 1,608 87,436 1,486,173 787,504 698,669 41.81% FY 2010 PRO/FINAL SAL-F 292,114 198,464 93,650 381,158 200,072 181,086 181,086 52.49%
11 Mashpee Wampanoag Indian Tribe 515,395 32,405 3,975 28,430 547,800 149,395 398,405 45.56% FY 2010 FCF TDC less PT 181,513 145,420 36,093 213,918 149,395 64,523 64,523 69.84%
12 Miccosukee Tribe 3,261,073 127,536 2,347 125,189 3,388,609 1,046,212 2,342,397 48.08% FY 2009 FCF TDC less PT 1,126,224 1,020,877 105,347 1,253,760 1,023,224 230,536 666,569 440,209 226,360 456,897 76.21%
13 Mississippi Band of Choctaw Indians 9,631,976 533,568 533,568 - 10,165,544 2,731,857 7,433,687 17.53% FY 2009 FCF TDC less PT 1,303,125 1,303,125 0 1,836,693 1,836,693 0 2,135,759 2,135,759 0 1 100.00%
14 Mohegan Indian Tribe 540,837 69,945 34,972 34,973 610,782 610,782 0.00% FY 2010 No IDC Requested - - 69,945 34,972 34,973 34,973 50.00%
15 Narrangansett Indian Tribe 1,627,754 76,285 50,195 26,090 1,704,039 351,006 1,353,033 24.76% FY 2009 FCF TDC less PT 335,011 274,234 60,777 411,296 324,429 86,867 86,867 78.88%
16 Oneida Nation 1,353,328 18,547 18,547 - 1,371,875 27,775 1,344,100 0.00% FY 2010 No IDC Requested - - 18,547 18,547 - - 100.00%
17 Passamaquoddy Tribe - Indian Township 2,348,344 129,947 2,430 127,517 2,478,291 1,423,475 1,054,816 77.65% FY 2008 FCF SAL 819,065 553,186 265,879 949,012 555,616 393,396 393,396 58.55%
18 Passamaquoddy Tribe - Pleasant Point 1,987,610 57,890 57,890 - 2,045,500 352,509 1,692,991 23.15% FY 2010 PRO/FINAL TDC less PT 391,927 342,296 49,631 449,817 400,186 49,631 49,631 88.97%
19 Penobscot Indian Nation 2,782,399 215,211 3,056 212,155 2,997,610 1,779,508 1,218,102 61.47% FY 2010 FCF SAL 748,767 667,179 81,588 963,978 670,235 293,743 293,743 69.53%
20 Poarch Creek Band of Creek Indians 2,249,147 138,370 2,546 135,824 2,387,517 564,204 1,823,313 40.80% FY 2009 FCF TDC less PT 743,912 561,658 182,254 882,282 564,204 318,078 318,078 63.95%
21 Seminole Tribe of Florida 4,343,393 145,912 210,034 31,221 178,813 4,553,427 1,802,644 2,750,783 29.27% FY 2008 FCF SAL 805,154 554,045 251,109 1,015,188 585,266 429,922 210,034 178,608 31,426 461,348 62.35%
22 Seneca Nation of Indians 895,612 44,228 44,228 - 939,840 570,008 369,832 18.23% FY 2009 FCF SAL 67,420 75,483 (8,063) 111,648 119,711 (8,063) (8,063) 107.22%
23 St Regis Mohawk Indians 2,139,937 137,880 2,537 135,343 2,277,817 456,080 1,821,737 18.46% FY 2010 FCF TDC less PT 336,293 225,472 110,821 474,173 228,009 246,164 246,164 48.09%
24 Tunica-Biloxi Tribe 1,246,153 103,315 1,901 101,414 1,349,468 266,818 1,082,650 13.88% FY 2007 FCF TDC less PT 150,272 126,834 23,438 253,587 128,735 124,852 124,852 50.77%
25 Beatrice Raffery - - - - - - - - 152,589 105,419 47,170 47,170 69.09%
26 Indian Island - - - - - - - - 108,249 74,785 33,464 33,464 69.09%
27 Indian Township - - - - - - - - 106,606 73,650 32,956 32,956 69.09%
REGIONAL TOTALS: 45,200,480 145,912 2,457,732 954,742 1,502,990 47,658,212 16,032,951 31,625,261 8,745,323 7,692 7,355,763 1,397,252 11,210,747 8,310,505 2,900,242 3,388,119 3,016,743 371,376 3,271,618 77.59%
CERTIFICATION SIGNATURE FOR EASTERN REGION (S) -
Report Prepared by: Date: 2.15.2011
Agency Superintendent Certification: Date:
Awarding Official Certification: Date: 3.3.2011
Financial Manager Certification: Date: 3.3.2011
Regional Director Certification: Date: 3.3.2011Signed/Acting Regional Director
11,327,248.00$
NA 11,327,248.00$
Signed/Kirk Meyer -$
Signed/Harold F. Spears
IDC Funding PAID for FY10 for BIA ISEP Formula
Funded Programs (Linked from Column (L) of
Choctaw Decision Schools tab)
Total FY10 IDC SHORTFALL for BIA ISEP
Formula Funded Programs (Linked from Column (O) of Choctaw Decision Schools
tab)
Total CSC Funds SubAllotted:
Total CSC Funds Awarded (Col. 'T' + Col. 'W'):
Variance:
FY 2010 Shortfall Report - Eastern Region
Signed/Kirk G. Meyer
Total FY10 IDC Need for BIA ISEP Formula Funded
Programs (Linked from Column (N) of Choctaw Decision Schools tab)
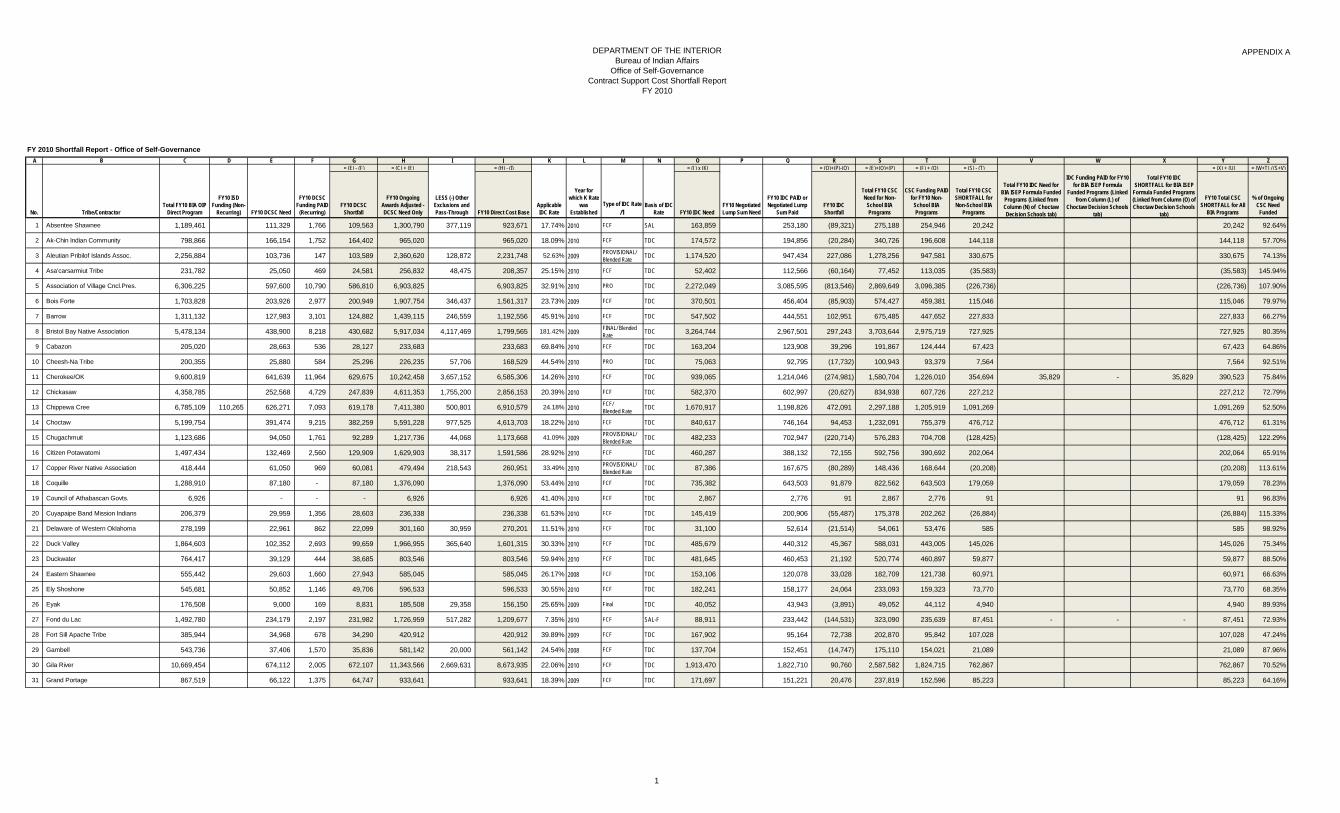
DEPARTMENT OF THE INTERIORBureau of Indian Affairs
Office of Self-GovernanceContract Support Cost Shortfall Report
FY 2010
APPENDIX A
1
FY 2010 Shortfall Report - Office of Self-GovernanceA B C D E F G H I J K L M N O P Q R S T U V W X Y Z
= (E) - (F) = (C) + (E) = (H) - (I) = (J) x (K) = (O)+(P)-(Q) = (E)+(O)+(P) = (F) + (Q) = (S) - (T) = (X) + (U) = (W+T) / (S+V)
No. Tribe/ContractorTotal FY10 BIA OIP
Direct Program
FY10 ISD Funding (Non-
Recurring) FY10 DCSC Need
FY10 DCSC Funding PAID
(Recurring)FY10 DCSC
Shortfall
FY10 Ongoing Awards Adjusted - DCSC Need Only
LESS (-) Other Exclusions and Pass-Through FY10 Direct Cost Base
Applicable IDC Rate
Year for which K Rate
was Established
Type of IDC Rate /1
Basis of IDC Rate FY10 IDC Need
FY10 Negotiated Lump Sum Need
FY10 IDC PAID or Negotiated Lump
Sum PaidFY10 IDC Shortfall
Total FY10 CSC Need for Non-
School BIA Programs
CSC Funding PAID for FY10 Non-
School BIA Programs
Total FY10 CSC SHORTFALL for Non-School BIA
Programs
FY10 Total CSC SHORTFALL for All
BIA Programs
% of Ongoing CSC Need
Funded
1 Absentee Shawnee 1,189,461 111,329 1,766 109,563 1,300,790 377,119 923,671 17.74% 2010 FCF SAL 163,859 253,180 (89,321) 275,188 254,946 20,242 20,242 92.64%
2 Ak-Chin Indian Community 798,866 166,154 1,752 164,402 965,020 965,020 18.09% 2010 FCF TDC 174,572 194,856 (20,284) 340,726 196,608 144,118 144,118 57.70%
3 Aleutian Pribilof Islands Assoc. 2,256,884 103,736 147 103,589 2,360,620 128,872 2,231,748 52.63% 2009 PROVISIONAL/ Blended Rate TDC 1,174,520 947,434 227,086 1,278,256 947,581 330,675 330,675 74.13%
4 Asa'carsarmiut Tribe 231,782 25,050 469 24,581 256,832 48,475 208,357 25.15% 2010 FCF TDC 52,402 112,566 (60,164) 77,452 113,035 (35,583) (35,583) 145.94%
5 Association of Village Cncl.Pres. 6,306,225 597,600 10,790 586,810 6,903,825 6,903,825 32.91% 2010 PRO TDC 2,272,049 3,085,595 (813,546) 2,869,649 3,096,385 (226,736) (226,736) 107.90%
6 Bois Forte 1,703,828 203,926 2,977 200,949 1,907,754 346,437 1,561,317 23.73% 2009 FCF TDC 370,501 456,404 (85,903) 574,427 459,381 115,046 115,046 79.97%
7 Barrow 1,311,132 127,983 3,101 124,882 1,439,115 246,559 1,192,556 45.91% 2010 FCF TDC 547,502 444,551 102,951 675,485 447,652 227,833 227,833 66.27%
8 Bristol Bay Native Association 5,478,134 438,900 8,218 430,682 5,917,034 4,117,469 1,799,565 181.42% 2009 FINAL/ Blended Rate TDC 3,264,744 2,967,501 297,243 3,703,644 2,975,719 727,925 727,925 80.35%
9 Cabazon 205,020 28,663 536 28,127 233,683 233,683 69.84% 2010 FCF TDC 163,204 123,908 39,296 191,867 124,444 67,423 67,423 64.86%
10 Cheesh-Na Tribe 200,355 25,880 584 25,296 226,235 57,706 168,529 44.54% 2010 PRO TDC 75,063 92,795 (17,732) 100,943 93,379 7,564 7,564 92.51%
11 Cherokee/OK 9,600,819 641,639 11,964 629,675 10,242,458 3,657,152 6,585,306 14.26% 2010 FCF TDC 939,065 1,214,046 (274,981) 1,580,704 1,226,010 354,694 35,829 - 35,829 390,523 75.84%
12 Chickasaw 4,358,785 252,568 4,729 247,839 4,611,353 1,755,200 2,856,153 20.39% 2010 FCF TDC 582,370 602,997 (20,627) 834,938 607,726 227,212 227,212 72.79%
13 Chippewa Cree 6,785,109 110,265 626,271 7,093 619,178 7,411,380 500,801 6,910,579 24.18% 2010 FCF/ Blended Rate TDC 1,670,917 1,198,826 472,091 2,297,188 1,205,919 1,091,269 1,091,269 52.50%
14 Choctaw 5,199,754 391,474 9,215 382,259 5,591,228 977,525 4,613,703 18.22% 2010 FCF TDC 840,617 746,164 94,453 1,232,091 755,379 476,712 476,712 61.31%
15 Chugachmuit 1,123,686 94,050 1,761 92,289 1,217,736 44,068 1,173,668 41.09% 2009 PROVISIONAL/ Blended Rate TDC 482,233 702,947 (220,714) 576,283 704,708 (128,425) (128,425) 122.29%
16 Citizen Potawatomi 1,497,434 132,469 2,560 129,909 1,629,903 38,317 1,591,586 28.92% 2010 FCF TDC 460,287 388,132 72,155 592,756 390,692 202,064 202,064 65.91%
17 Copper River Native Association 418,444 61,050 969 60,081 479,494 218,543 260,951 33.49% 2010 PROVISIONAL/ Blended Rate TDC 87,386 167,675 (80,289) 148,436 168,644 (20,208) (20,208) 113.61%
18 Coquille 1,288,910 87,180 - 87,180 1,376,090 1,376,090 53.44% 2010 FCF TDC 735,382 643,503 91,879 822,562 643,503 179,059 179,059 78.23%
19 Council of Athabascan Govts. 6,926 - - - 6,926 6,926 41.40% 2010 FCF TDC 2,867 2,776 91 2,867 2,776 91 91 96.83%
20 Cuyapaipe Band Mission Indians 206,379 29,959 1,356 28,603 236,338 236,338 61.53% 2010 FCF TDC 145,419 200,906 (55,487) 175,378 202,262 (26,884) (26,884) 115.33%
21 Delaware of Western Oklahoma 278,199 22,961 862 22,099 301,160 30,959 270,201 11.51% 2010 FCF TDC 31,100 52,614 (21,514) 54,061 53,476 585 585 98.92%
22 Duck Valley 1,864,603 102,352 2,693 99,659 1,966,955 365,640 1,601,315 30.33% 2010 FCF TDC 485,679 440,312 45,367 588,031 443,005 145,026 145,026 75.34%
23 Duckwater 764,417 39,129 444 38,685 803,546 803,546 59.94% 2010 FCF TDC 481,645 460,453 21,192 520,774 460,897 59,877 59,877 88.50%
24 Eastern Shawnee 555,442 29,603 1,660 27,943 585,045 585,045 26.17% 2008 FCF TDC 153,106 120,078 33,028 182,709 121,738 60,971 60,971 66.63%
25 Ely Shoshone 545,681 50,852 1,146 49,706 596,533 596,533 30.55% 2010 FCF TDC 182,241 158,177 24,064 233,093 159,323 73,770 73,770 68.35%
26 Eyak 176,508 9,000 169 8,831 185,508 29,358 156,150 25.65% 2009 Final TDC 40,052 43,943 (3,891) 49,052 44,112 4,940 4,940 89.93%
27 Fond du Lac 1,492,780 234,179 2,197 231,982 1,726,959 517,282 1,209,677 7.35% 2010 FCF SAL-F 88,911 233,442 (144,531) 323,090 235,639 87,451 - - - 87,451 72.93%
28 Fort Sill Apache Tribe 385,944 34,968 678 34,290 420,912 420,912 39.89% 2009 FCF TDC 167,902 95,164 72,738 202,870 95,842 107,028 107,028 47.24%
29 Gambell 543,736 37,406 1,570 35,836 581,142 20,000 561,142 24.54% 2008 FCF TDC 137,704 152,451 (14,747) 175,110 154,021 21,089 21,089 87.96%
30 Gila River 10,669,454 674,112 2,005 672,107 11,343,566 2,669,631 8,673,935 22.06% 2010 FCF TDC 1,913,470 1,822,710 90,760 2,587,582 1,824,715 762,867 762,867 70.52%
31 Grand Portage 867,519 66,122 1,375 64,747 933,641 933,641 18.39% 2009 FCF TDC 171,697 151,221 20,476 237,819 152,596 85,223 85,223 64.16%
Total FY10 IDC SHORTFALL for BIA ISEP
Formula Funded Programs (Linked from Column (O) of Choctaw Decision Schools
tab)
IDC Funding PAID for FY10 for BIA ISEP Formula
Funded Programs (Linked from Column (L) of
Choctaw Decision Schools tab)
Total FY10 IDC Need for BIA ISEP Formula Funded
Programs (Linked from Column (N) of Choctaw Decision Schools tab)
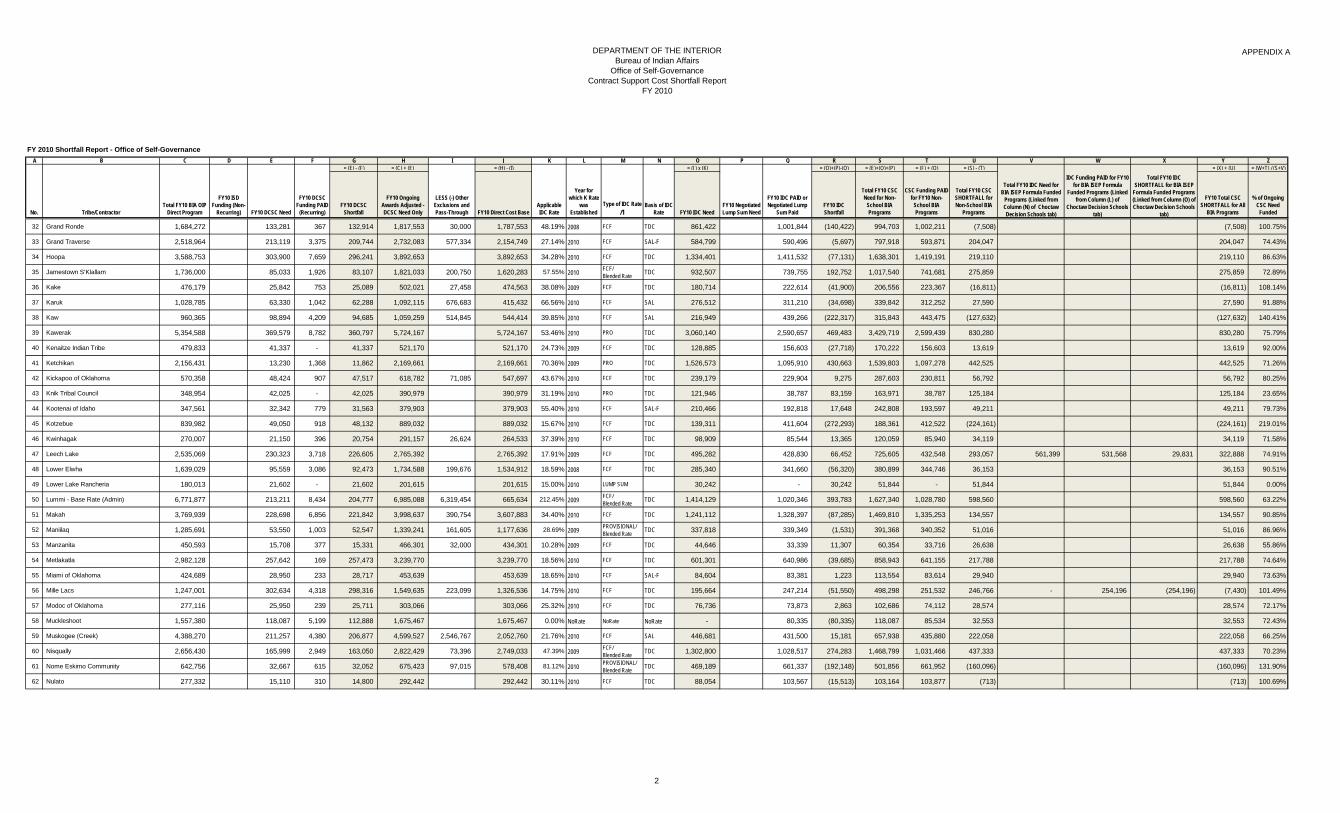
DEPARTMENT OF THE INTERIORBureau of Indian Affairs
Office of Self-GovernanceContract Support Cost Shortfall Report
FY 2010
APPENDIX A
2
FY 2010 Shortfall Report - Office of Self-GovernanceA B C D E F G H I J K L M N O P Q R S T U V W X Y Z
= (E) - (F) = (C) + (E) = (H) - (I) = (J) x (K) = (O)+(P)-(Q) = (E)+(O)+(P) = (F) + (Q) = (S) - (T) = (X) + (U) = (W+T) / (S+V)
No. Tribe/ContractorTotal FY10 BIA OIP
Direct Program
FY10 ISD Funding (Non-
Recurring) FY10 DCSC Need
FY10 DCSC Funding PAID
(Recurring)FY10 DCSC
Shortfall
FY10 Ongoing Awards Adjusted - DCSC Need Only
LESS (-) Other Exclusions and Pass-Through FY10 Direct Cost Base
Applicable IDC Rate
Year for which K Rate
was Established
Type of IDC Rate /1
Basis of IDC Rate FY10 IDC Need
FY10 Negotiated Lump Sum Need
FY10 IDC PAID or Negotiated Lump
Sum PaidFY10 IDC Shortfall
Total FY10 CSC Need for Non-
School BIA Programs
CSC Funding PAID for FY10 Non-
School BIA Programs
Total FY10 CSC SHORTFALL for Non-School BIA
Programs
FY10 Total CSC SHORTFALL for All
BIA Programs
% of Ongoing CSC Need
Funded
Total FY10 IDC SHORTFALL for BIA ISEP
Formula Funded Programs (Linked from Column (O) of Choctaw Decision Schools
tab)
IDC Funding PAID for FY10 for BIA ISEP Formula
Funded Programs (Linked from Column (L) of
Choctaw Decision Schools tab)
Total FY10 IDC Need for BIA ISEP Formula Funded
Programs (Linked from Column (N) of Choctaw Decision Schools tab)
32 Grand Ronde 1,684,272 133,281 367 132,914 1,817,553 30,000 1,787,553 48.19% 2008 FCF TDC 861,422 1,001,844 (140,422) 994,703 1,002,211 (7,508) (7,508) 100.75%
33 Grand Traverse 2,518,964 213,119 3,375 209,744 2,732,083 577,334 2,154,749 27.14% 2010 FCF SAL-F 584,799 590,496 (5,697) 797,918 593,871 204,047 204,047 74.43%
34 Hoopa 3,588,753 303,900 7,659 296,241 3,892,653 3,892,653 34.28% 2010 FCF TDC 1,334,401 1,411,532 (77,131) 1,638,301 1,419,191 219,110 219,110 86.63%
35 Jamestown S'Klallam 1,736,000 85,033 1,926 83,107 1,821,033 200,750 1,620,283 57.55% 2010 FCF/ Blended Rate TDC 932,507 739,755 192,752 1,017,540 741,681 275,859 275,859 72.89%
36 Kake 476,179 25,842 753 25,089 502,021 27,458 474,563 38.08% 2009 FCF TDC 180,714 222,614 (41,900) 206,556 223,367 (16,811) (16,811) 108.14%
37 Karuk 1,028,785 63,330 1,042 62,288 1,092,115 676,683 415,432 66.56% 2010 FCF SAL 276,512 311,210 (34,698) 339,842 312,252 27,590 27,590 91.88%
38 Kaw 960,365 98,894 4,209 94,685 1,059,259 514,845 544,414 39.85% 2010 FCF SAL 216,949 439,266 (222,317) 315,843 443,475 (127,632) (127,632) 140.41%
39 Kawerak 5,354,588 369,579 8,782 360,797 5,724,167 5,724,167 53.46% 2010 PRO TDC 3,060,140 2,590,657 469,483 3,429,719 2,599,439 830,280 830,280 75.79%
40 Kenaitze Indian Tribe 479,833 41,337 - 41,337 521,170 521,170 24.73% 2009 FCF TDC 128,885 156,603 (27,718) 170,222 156,603 13,619 13,619 92.00%
41 Ketchikan 2,156,431 13,230 1,368 11,862 2,169,661 2,169,661 70.36% 2009 PRO TDC 1,526,573 1,095,910 430,663 1,539,803 1,097,278 442,525 442,525 71.26%
42 Kickapoo of Oklahoma 570,358 48,424 907 47,517 618,782 71,085 547,697 43.67% 2010 FCF TDC 239,179 229,904 9,275 287,603 230,811 56,792 56,792 80.25%
43 Knik Tribal Council 348,954 42,025 - 42,025 390,979 390,979 31.19% 2010 PRO TDC 121,946 38,787 83,159 163,971 38,787 125,184 125,184 23.65%
44 Kootenai of Idaho 347,561 32,342 779 31,563 379,903 379,903 55.40% 2010 FCF SAL-F 210,466 192,818 17,648 242,808 193,597 49,211 49,211 79.73%
45 Kotzebue 839,982 49,050 918 48,132 889,032 889,032 15.67% 2010 FCF TDC 139,311 411,604 (272,293) 188,361 412,522 (224,161) (224,161) 219.01%
46 Kwinhagak 270,007 21,150 396 20,754 291,157 26,624 264,533 37.39% 2010 FCF TDC 98,909 85,544 13,365 120,059 85,940 34,119 34,119 71.58%
47 Leech Lake 2,535,069 230,323 3,718 226,605 2,765,392 2,765,392 17.91% 2009 FCF TDC 495,282 428,830 66,452 725,605 432,548 293,057 561,399 531,568 29,831 322,888 74.91%
48 Lower Elwha 1,639,029 95,559 3,086 92,473 1,734,588 199,676 1,534,912 18.59% 2008 FCF TDC 285,340 341,660 (56,320) 380,899 344,746 36,153 36,153 90.51%
49 Lower Lake Rancheria 180,013 21,602 - 21,602 201,615 201,615 15.00% 2010 LUMP SUM 30,242 - 30,242 51,844 - 51,844 51,844 0.00%
50 Lummi - Base Rate (Admin) 6,771,877 213,211 8,434 204,777 6,985,088 6,319,454 665,634 212.45% 2009 FCF/ Blended Rate TDC 1,414,129 1,020,346 393,783 1,627,340 1,028,780 598,560 598,560 63.22%
51 Makah 3,769,939 228,698 6,856 221,842 3,998,637 390,754 3,607,883 34.40% 2010 FCF TDC 1,241,112 1,328,397 (87,285) 1,469,810 1,335,253 134,557 134,557 90.85%
52 Maniilaq 1,285,691 53,550 1,003 52,547 1,339,241 161,605 1,177,636 28.69% 2009 PROVISIONAL/ Blended Rate TDC 337,818 339,349 (1,531) 391,368 340,352 51,016 51,016 86.96%
53 Manzanita 450,593 15,708 377 15,331 466,301 32,000 434,301 10.28% 2009 FCF TDC 44,646 33,339 11,307 60,354 33,716 26,638 26,638 55.86%
54 Metlakatla 2,982,128 257,642 169 257,473 3,239,770 3,239,770 18.56% 2010 FCF TDC 601,301 640,986 (39,685) 858,943 641,155 217,788 217,788 74.64%
55 Miami of Oklahoma 424,689 28,950 233 28,717 453,639 453,639 18.65% 2010 FCF SAL-F 84,604 83,381 1,223 113,554 83,614 29,940 29,940 73.63%
56 Mille Lacs 1,247,001 302,634 4,318 298,316 1,549,635 223,099 1,326,536 14.75% 2010 FCF TDC 195,664 247,214 (51,550) 498,298 251,532 246,766 - 254,196 (254,196) (7,430) 101.49%
57 Modoc of Oklahoma 277,116 25,950 239 25,711 303,066 303,066 25.32% 2010 FCF TDC 76,736 73,873 2,863 102,686 74,112 28,574 28,574 72.17%
58 Muckleshoot 1,557,380 118,087 5,199 112,888 1,675,467 1,675,467 0.00% NoRate NoRate NoRate - 80,335 (80,335) 118,087 85,534 32,553 32,553 72.43%
59 Muskogee (Creek) 4,388,270 211,257 4,380 206,877 4,599,527 2,546,767 2,052,760 21.76% 2010 FCF SAL 446,681 431,500 15,181 657,938 435,880 222,058 222,058 66.25%
60 Nisqually 2,656,430 165,999 2,949 163,050 2,822,429 73,396 2,749,033 47.39% 2009 FCF/ Blended Rate TDC 1,302,800 1,028,517 274,283 1,468,799 1,031,466 437,333 437,333 70.23%
61 Nome Eskimo Community 642,756 32,667 615 32,052 675,423 97,015 578,408 81.12% 2010 PROVISIONAL/ Blended Rate TDC 469,189 661,337 (192,148) 501,856 661,952 (160,096) (160,096) 131.90%
62 Nulato 277,332 15,110 310 14,800 292,442 292,442 30.11% 2010 FCF TDC 88,054 103,567 (15,513) 103,164 103,877 (713) (713) 100.69%
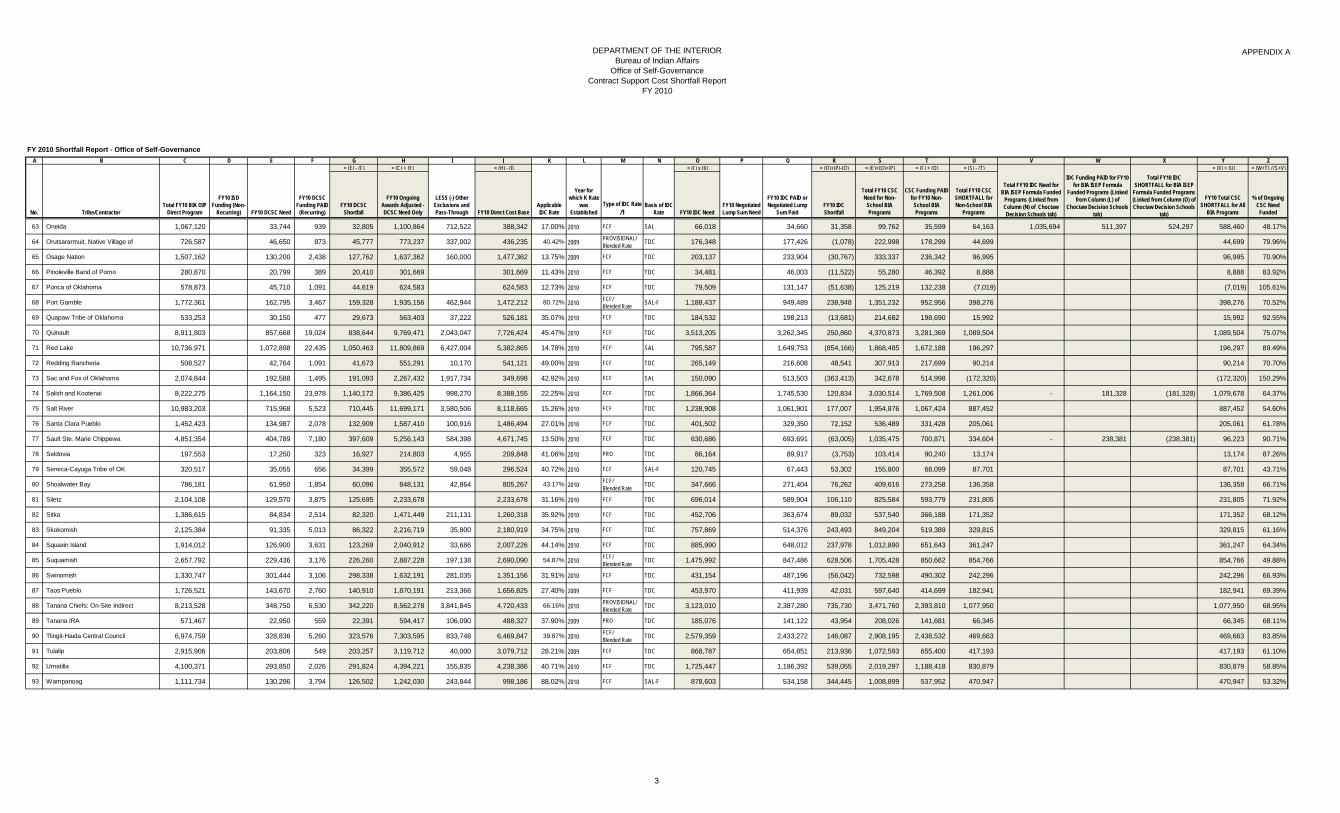
DEPARTMENT OF THE INTERIORBureau of Indian Affairs
Office of Self-GovernanceContract Support Cost Shortfall Report
FY 2010
APPENDIX A
3
FY 2010 Shortfall Report - Office of Self-GovernanceA B C D E F G H I J K L M N O P Q R S T U V W X Y Z
= (E) - (F) = (C) + (E) = (H) - (I) = (J) x (K) = (O)+(P)-(Q) = (E)+(O)+(P) = (F) + (Q) = (S) - (T) = (X) + (U) = (W+T) / (S+V)
No. Tribe/ContractorTotal FY10 BIA OIP
Direct Program
FY10 ISD Funding (Non-
Recurring) FY10 DCSC Need
FY10 DCSC Funding PAID
(Recurring)FY10 DCSC
Shortfall
FY10 Ongoing Awards Adjusted - DCSC Need Only
LESS (-) Other Exclusions and Pass-Through FY10 Direct Cost Base
Applicable IDC Rate
Year for which K Rate
was Established
Type of IDC Rate /1
Basis of IDC Rate FY10 IDC Need
FY10 Negotiated Lump Sum Need
FY10 IDC PAID or Negotiated Lump
Sum PaidFY10 IDC Shortfall
Total FY10 CSC Need for Non-
School BIA Programs
CSC Funding PAID for FY10 Non-
School BIA Programs
Total FY10 CSC SHORTFALL for Non-School BIA
Programs
FY10 Total CSC SHORTFALL for All
BIA Programs
% of Ongoing CSC Need
Funded
Total FY10 IDC SHORTFALL for BIA ISEP
Formula Funded Programs (Linked from Column (O) of Choctaw Decision Schools
tab)
IDC Funding PAID for FY10 for BIA ISEP Formula
Funded Programs (Linked from Column (L) of
Choctaw Decision Schools tab)
Total FY10 IDC Need for BIA ISEP Formula Funded
Programs (Linked from Column (N) of Choctaw Decision Schools tab)
63 Oneida 1,067,120 33,744 939 32,805 1,100,864 712,522 388,342 17.00% 2010 FCF SAL 66,018 34,660 31,358 99,762 35,599 64,163 1,035,694 511,397 524,297 588,460 48.17%
64 Orutsararmuit, Native Village of 726,587 46,650 873 45,777 773,237 337,002 436,235 40.42% 2009 PROVISIONAL/ Blended Rate TDC 176,348 177,426 (1,078) 222,998 178,299 44,699 44,699 79.96%
65 Osage Nation 1,507,162 130,200 2,438 127,762 1,637,362 160,000 1,477,362 13.75% 2009 FCF TDC 203,137 233,904 (30,767) 333,337 236,342 96,995 96,995 70.90%
66 Pinoleville Band of Pomo 280,870 20,799 389 20,410 301,669 301,669 11.43% 2010 FCF TDC 34,481 46,003 (11,522) 55,280 46,392 8,888 8,888 83.92%
67 Ponca of Oklahoma 578,873 45,710 1,091 44,619 624,583 624,583 12.73% 2010 FCF TDC 79,509 131,147 (51,638) 125,219 132,238 (7,019) (7,019) 105.61%
68 Port Gamble 1,772,361 162,795 3,467 159,328 1,935,156 462,944 1,472,212 80.72% 2010 FCF/ Blended Rate SAL-F 1,188,437 949,489 238,948 1,351,232 952,956 398,276 398,276 70.52%
69 Quapaw Tribe of Oklahoma 533,253 30,150 477 29,673 563,403 37,222 526,181 35.07% 2010 FCF TDC 184,532 198,213 (13,681) 214,682 198,690 15,992 15,992 92.55%
70 Quinault 8,911,803 857,668 19,024 838,644 9,769,471 2,043,047 7,726,424 45.47% 2010 FCF TDC 3,513,205 3,262,345 250,860 4,370,873 3,281,369 1,089,504 1,089,504 75.07%
71 Red Lake 10,736,971 1,072,898 22,435 1,050,463 11,809,869 6,427,004 5,382,865 14.78% 2010 FCF SAL 795,587 1,649,753 (854,166) 1,868,485 1,672,188 196,297 196,297 89.49%
72 Redding Rancheria 508,527 42,764 1,091 41,673 551,291 10,170 541,121 49.00% 2010 FCF TDC 265,149 216,608 48,541 307,913 217,699 90,214 90,214 70.70%
73 Sac and Fox of Oklahoma 2,074,844 192,588 1,495 191,093 2,267,432 1,917,734 349,698 42.92% 2010 FCF SAL 150,090 513,503 (363,413) 342,678 514,998 (172,320) (172,320) 150.29%
74 Salish and Kootenai 8,222,275 1,164,150 23,978 1,140,172 9,386,425 998,270 8,388,155 22.25% 2010 FCF TDC 1,866,364 1,745,530 120,834 3,030,514 1,769,508 1,261,006 - 181,328 (181,328) 1,079,678 64.37%
75 Salt River 10,983,203 715,968 5,523 710,445 11,699,171 3,580,506 8,118,665 15.26% 2010 FCF TDC 1,238,908 1,061,901 177,007 1,954,876 1,067,424 887,452 887,452 54.60%
76 Santa Clara Pueblo 1,452,423 134,987 2,078 132,909 1,587,410 100,916 1,486,494 27.01% 2010 FCF TDC 401,502 329,350 72,152 536,489 331,428 205,061 205,061 61.78%
77 Sault Ste. Marie Chippewa 4,851,354 404,789 7,180 397,609 5,256,143 584,398 4,671,745 13.50% 2010 FCF TDC 630,686 693,691 (63,005) 1,035,475 700,871 334,604 - 238,381 (238,381) 96,223 90.71%
78 Seldovia 197,553 17,250 323 16,927 214,803 4,955 209,848 41.06% 2010 PRO TDC 86,164 89,917 (3,753) 103,414 90,240 13,174 13,174 87.26%
79 Seneca-Cayuga Tribe of OK 320,517 35,055 656 34,399 355,572 59,048 296,524 40.72% 2010 FCF SAL-F 120,745 67,443 53,302 155,800 68,099 87,701 87,701 43.71%
80 Shoalwater Bay 786,181 61,950 1,854 60,096 848,131 42,864 805,267 43.17% 2010 FCF/ Blended Rate TDC 347,666 271,404 76,262 409,616 273,258 136,358 136,358 66.71%
81 Siletz 2,104,108 129,570 3,875 125,695 2,233,678 2,233,678 31.16% 2010 FCF TDC 696,014 589,904 106,110 825,584 593,779 231,805 231,805 71.92%
82 Sitka 1,386,615 84,834 2,514 82,320 1,471,449 211,131 1,260,318 35.92% 2010 FCF TDC 452,706 363,674 89,032 537,540 366,188 171,352 171,352 68.12%
83 Skokomish 2,125,384 91,335 5,013 86,322 2,216,719 35,800 2,180,919 34.75% 2010 FCF TDC 757,869 514,376 243,493 849,204 519,389 329,815 329,815 61.16%
84 Squaxin Island 1,914,012 126,900 3,631 123,269 2,040,912 33,686 2,007,226 44.14% 2010 FCF TDC 885,990 648,012 237,978 1,012,890 651,643 361,247 361,247 64.34%
85 Suquamish 2,657,792 229,436 3,176 226,260 2,887,228 197,138 2,690,090 54.87% 2010 FCF/ Blended Rate TDC 1,475,992 847,486 628,506 1,705,428 850,662 854,766 854,766 49.88%
86 Swinomish 1,330,747 301,444 3,106 298,338 1,632,191 281,035 1,351,156 31.91% 2010 FCF TDC 431,154 487,196 (56,042) 732,598 490,302 242,296 242,296 66.93%
87 Taos Pueblo 1,726,521 143,670 2,760 140,910 1,870,191 213,366 1,656,825 27.40% 2009 FCF TDC 453,970 411,939 42,031 597,640 414,699 182,941 182,941 69.39%
88 Tanana Chiefs: On-Site Indirect 8,213,528 348,750 6,530 342,220 8,562,278 3,841,845 4,720,433 66.16% 2010 PROVISIONAL/ Blended Rate TDC 3,123,010 2,387,280 735,730 3,471,760 2,393,810 1,077,950 1,077,950 68.95%
89 Tanana IRA 571,467 22,950 559 22,391 594,417 106,090 488,327 37.90% 2009 PRO TDC 185,076 141,122 43,954 208,026 141,681 66,345 66,345 68.11%
90 Tlingit-Haida Central Council 6,974,759 328,836 5,260 323,576 7,303,595 833,748 6,469,847 39.87% 2010 FCF/ Blended Rate TDC 2,579,359 2,433,272 146,087 2,908,195 2,438,532 469,663 469,663 83.85%
91 Tulalip 2,915,906 203,806 549 203,257 3,119,712 40,000 3,079,712 28.21% 2009 FCF TDC 868,787 654,851 213,936 1,072,593 655,400 417,193 417,193 61.10%
92 Umatilla 4,100,371 293,850 2,026 291,824 4,394,221 155,835 4,238,386 40.71% 2010 FCF TDC 1,725,447 1,186,392 539,055 2,019,297 1,188,418 830,879 830,879 58.85%
93 Wampanoag 1,111,734 130,296 3,794 126,502 1,242,030 243,844 998,186 88.02% 2010 FCF SAL-F 878,603 534,158 344,445 1,008,899 537,952 470,947 470,947 53.32%
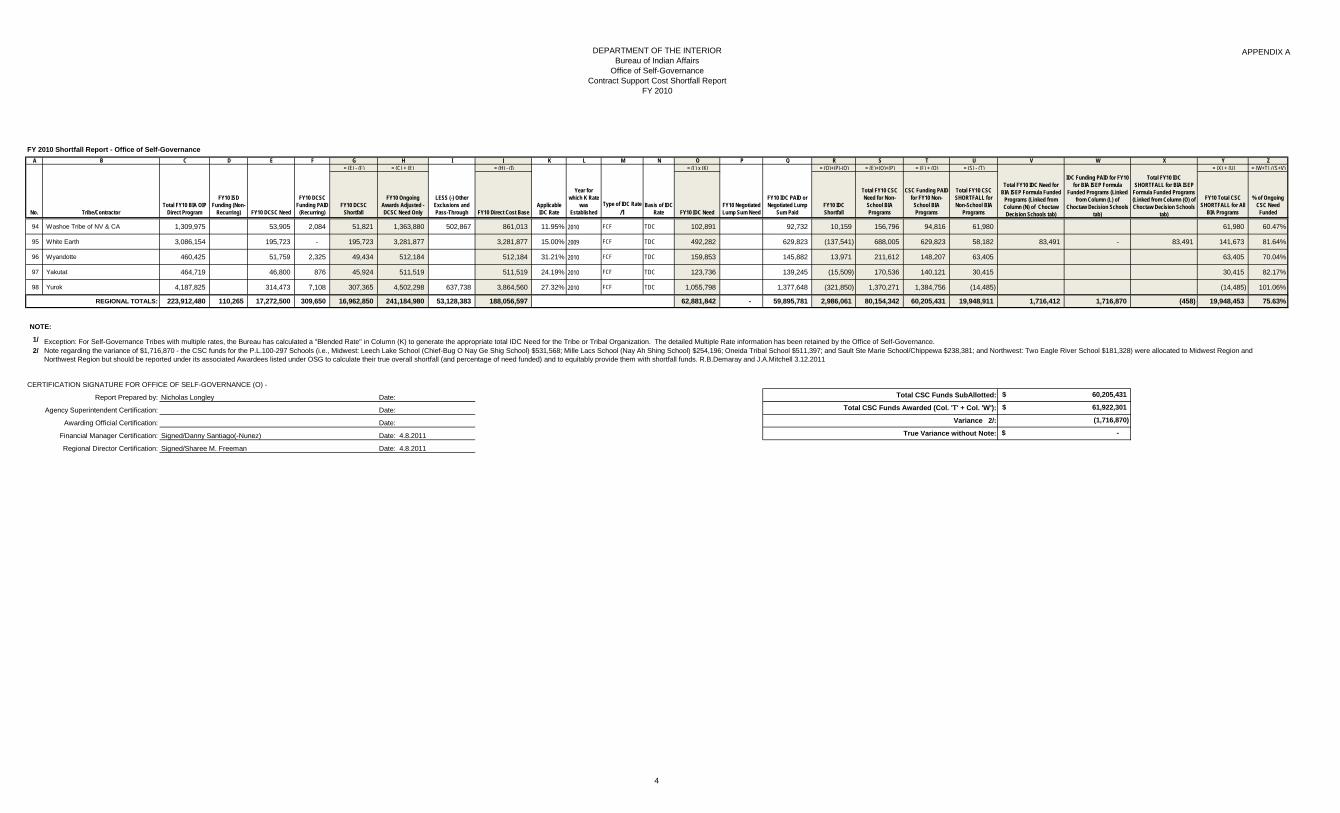
DEPARTMENT OF THE INTERIORBureau of Indian Affairs
Office of Self-GovernanceContract Support Cost Shortfall Report
FY 2010
APPENDIX A
4
FY 2010 Shortfall Report - Office of Self-GovernanceA B C D E F G H I J K L M N O P Q R S T U V W X Y Z
= (E) - (F) = (C) + (E) = (H) - (I) = (J) x (K) = (O)+(P)-(Q) = (E)+(O)+(P) = (F) + (Q) = (S) - (T) = (X) + (U) = (W+T) / (S+V)
No. Tribe/ContractorTotal FY10 BIA OIP
Direct Program
FY10 ISD Funding (Non-
Recurring) FY10 DCSC Need
FY10 DCSC Funding PAID
(Recurring)FY10 DCSC
Shortfall
FY10 Ongoing Awards Adjusted - DCSC Need Only
LESS (-) Other Exclusions and Pass-Through FY10 Direct Cost Base
Applicable IDC Rate
Year for which K Rate
was Established
Type of IDC Rate /1
Basis of IDC Rate FY10 IDC Need
FY10 Negotiated Lump Sum Need
FY10 IDC PAID or Negotiated Lump
Sum PaidFY10 IDC Shortfall
Total FY10 CSC Need for Non-
School BIA Programs
CSC Funding PAID for FY10 Non-
School BIA Programs
Total FY10 CSC SHORTFALL for Non-School BIA
Programs
FY10 Total CSC SHORTFALL for All
BIA Programs
% of Ongoing CSC Need
Funded
Total FY10 IDC SHORTFALL for BIA ISEP
Formula Funded Programs (Linked from Column (O) of Choctaw Decision Schools
tab)
IDC Funding PAID for FY10 for BIA ISEP Formula
Funded Programs (Linked from Column (L) of
Choctaw Decision Schools tab)
Total FY10 IDC Need for BIA ISEP Formula Funded
Programs (Linked from Column (N) of Choctaw Decision Schools tab)
94 Washoe Tribe of NV & CA 1,309,975 53,905 2,084 51,821 1,363,880 502,867 861,013 11.95% 2010 FCF TDC 102,891 92,732 10,159 156,796 94,816 61,980 61,980 60.47%
95 White Earth 3,086,154 195,723 - 195,723 3,281,877 3,281,877 15.00% 2009 FCF TDC 492,282 629,823 (137,541) 688,005 629,823 58,182 83,491 - 83,491 141,673 81.64%
96 Wyandotte 460,425 51,759 2,325 49,434 512,184 512,184 31.21% 2010 FCF TDC 159,853 145,882 13,971 211,612 148,207 63,405 63,405 70.04%
97 Yakutat 464,719 46,800 876 45,924 511,519 511,519 24.19% 2010 FCF TDC 123,736 139,245 (15,509) 170,536 140,121 30,415 30,415 82.17%
98 Yurok 4,187,825 314,473 7,108 307,365 4,502,298 637,738 3,864,560 27.32% 2010 FCF TDC 1,055,798 1,377,648 (321,850) 1,370,271 1,384,756 (14,485) (14,485) 101.06%
REGIONAL TOTALS: 223,912,480 110,265 17,272,500 309,650 16,962,850 241,184,980 53,128,383 188,056,597 62,881,842 - 59,895,781 2,986,061 80,154,342 60,205,431 19,948,911 1,716,412 1,716,870 (458) 19,948,453 75.63%
NOTE:
1/ Exception: For Self-Governance Tribes with multiple rates, the Bureau has calculated a "Blended Rate" in Column (K) to generate the appropriate total IDC Need for the Tribe or Tribal Organization. The detailed Multiple Rate information has been retained by the Office of Self-Governance.2/
CERTIFICATION SIGNATURE FOR OFFICE OF SELF-GOVERNANCE (O) -
Report Prepared by: Date:
Agency Superintendent Certification: Date:
Awarding Official Certification: Date:
Financial Manager Certification: Date: 4.8.2011
Regional Director Certification: Date: 4.8.2011
Total CSC Funds Awarded (Col. 'T' + Col. 'W'):
Signed/Sharee M. Freeman
Nicholas Longley 60,205,431$
61,922,301$
(1,716,870)
Note regarding the variance of $1,716,870 - the CSC funds for the P.L.100-297 Schools (i.e., Midwest: Leech Lake School (Chief-Bug O Nay Ge Shig School) $531,568; Mille Lacs School (Nay Ah Shing School) $254,196; Oneida Tribal School $511,397; and Sault Ste Marie School/Chippewa $238,381; and Northwest: Two Eagle River School $181,328) were allocated to Midwest Region and Northwest Region but should be reported under its associated Awardees listed under OSG to calculate their true overall shortfall (and percentage of need funded) and to equitably provide them with shortfall funds. R.B.Demaray and J.A.Mitchell 3.12.2011
Signed/Danny Santiago(-Nunez) True Variance without Note: -$
Total CSC Funds SubAllotted:
Variance 2/:
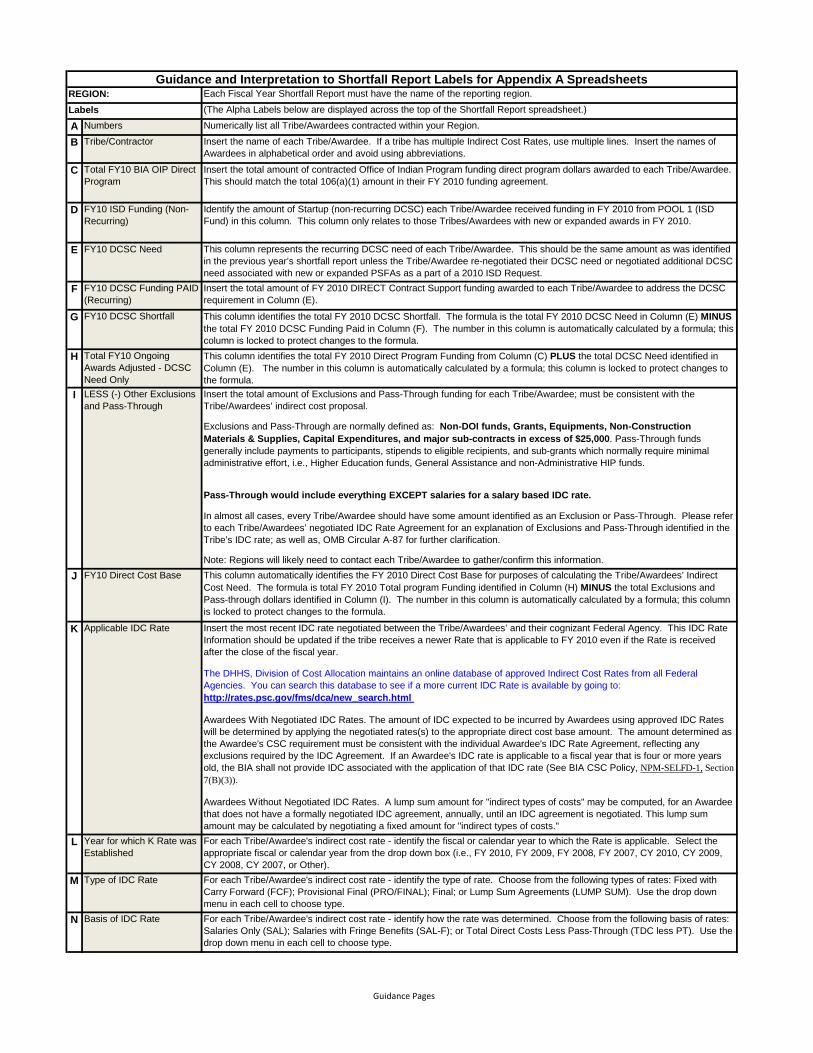
Guidance Pages
A Numbers
B Tribe/Contractor
C Total FY10 BIA OIP Direct Program
D FY10 ISD Funding (Non-Recurring)
FY10 DCSC Need
F FY10 DCSC Funding PAID (Recurring)
G FY10 DCSC Shortfall
H Total FY10 Ongoing Awards Adjusted - DCSC Need Only
I
J FY10 Direct Cost Base
Applicable IDC Rate
L Year for which K Rate was Established
M Type of IDC Rate
N Basis of IDC Rate
Insert the most recent IDC rate negotiated between the Tribe/Awardees’ and their cognizant Federal Agency. This IDC Rate Information should be updated if the tribe receives a newer Rate that is applicable to FY 2010 even if the Rate is received after the close of the fiscal year.
For each Tribe/Awardee's indirect cost rate - identify how the rate was determined. Choose from the following basis of rates: Salaries Only (SAL); Salaries with Fringe Benefits (SAL-F); or Total Direct Costs Less Pass-Through (TDC less PT). Use the drop down menu in each cell to choose type.
Awardees Without Negotiated IDC Rates. A lump sum amount for "indirect types of costs" may be computed, for an Awardee that does not have a formally negotiated IDC agreement, annually, until an IDC agreement is negotiated. This lump sum amount may be calculated by negotiating a fixed amount for "indirect types of costs."
For each Tribe/Awardee's indirect cost rate - identify the type of rate. Choose from the following types of rates: Fixed with Carry Forward (FCF); Provisional Final (PRO/FINAL); Final; or Lump Sum Agreements (LUMP SUM). Use the drop down menu in each cell to choose type.
For each Tribe/Awardee's indirect cost rate - identify the fiscal or calendar year to which the Rate is applicable. Select the appropriate fiscal or calendar year from the drop down box (i.e., FY 2010, FY 2009, FY 2008, FY 2007, CY 2010, CY 2009, CY 2008, CY 2007, or Other).
The DHHS, Division of Cost Allocation maintains an online database of approved Indirect Cost Rates from all Federal Agencies. You can search this database to see if a more current IDC Rate is available by going to: http://rates.psc.gov/fms/dca/new_search.html
K
Awardees With Negotiated IDC Rates. The amount of IDC expected to be incurred by Awardees using approved IDC Rates will be determined by applying the negotiated rates(s) to the appropriate direct cost base amount. The amount determined as the Awardee's CSC requirement must be consistent with the individual Awardee's IDC Rate Agreement, reflecting any exclusions required by the IDC Agreement. If an Awardee's IDC rate is applicable to a fiscal year that is four or more years old, the BIA shall not provide IDC associated with the application of that IDC rate (See BIA CSC Policy, NPM-SELFD-1, Section 7(B)(3)).
Insert the total amount of contracted Office of Indian Program funding direct program dollars awarded to each Tribe/Awardee. This should match the total 106(a)(1) amount in their FY 2010 funding agreement.
Identify the amount of Startup (non-recurring DCSC) each Tribe/Awardee received funding in FY 2010 from POOL 1 (ISD Fund) in this column. This column only relates to those Tribes/Awardees with new or expanded awards in FY 2010.
E This column represents the recurring DCSC need of each Tribe/Awardee. This should be the same amount as was identified in the previous year’s shortfall report unless the Tribe/Awardee re-negotiated their DCSC need or negotiated additional DCSC need associated with new or expanded PSFAs as a part of a 2010 ISD Request.Insert the total amount of FY 2010 DIRECT Contract Support funding awarded to each Tribe/Awardee to address the DCSC requirement in Column (E).
This column automatically identifies the FY 2010 Direct Cost Base for purposes of calculating the Tribe/Awardees’ Indirect Cost Need. The formula is total FY 2010 Total program Funding identified in Column (H) MINUS the total Exclusions and Pass-through dollars identified in Column (I). The number in this column is automatically calculated by a formula; this column is locked to protect changes to the formula.
Insert the total amount of Exclusions and Pass-Through funding for each Tribe/Awardee; must be consistent with the Tribe/Awardees’ indirect cost proposal.
Exclusions and Pass-Through are normally defined as: Non-DOI funds, Grants, Equipments, Non-Construction Materials & Supplies, Capital Expenditures, and major sub-contracts in excess of $25,000. Pass-Through funds generally include payments to participants, stipends to eligible recipients, and sub-grants which normally require minimal administrative effort, i.e., Higher Education funds, General Assistance and non-Administrative HIP funds.
Pass-Through would include everything EXCEPT salaries for a salary based IDC rate.
In almost all cases, every Tribe/Awardee should have some amount identified as an Exclusion or Pass-Through. Please refer to each Tribe/Awardees’ negotiated IDC Rate Agreement for an explanation of Exclusions and Pass-Through identified in the Tribe’s IDC rate; as well as, OMB Circular A-87 for further clarification.
This column identifies the total FY 2010 DCSC Shortfall. The formula is the total FY 2010 DCSC Need in Column (E) MINUS the total FY 2010 DCSC Funding Paid in Column (F). The number in this column is automatically calculated by a formula; this column is locked to protect changes to the formula.This column identifies the total FY 2010 Direct Program Funding from Column (C) PLUS the total DCSC Need identified in Column (E). The number in this column is automatically calculated by a formula; this column is locked to protect changes to the formula.
LESS (-) Other Exclusions and Pass-Through
Note: Regions will likely need to contact each Tribe/Awardee to gather/confirm this information.
Insert the name of each Tribe/Awardee. If a tribe has multiple Indirect Cost Rates, use multiple lines. Insert the names of Awardees in alphabetical order and avoid using abbreviations.
Guidance and Interpretation to Shortfall Report Labels for Appendix A Spreadsheets REGION: Each Fiscal Year Shortfall Report must have the name of the reporting region.
Labels (The Alpha Labels below are displayed across the top of the Shortfall Report spreadsheet.)
Numerically list all Tribe/Awardees contracted within your Region.
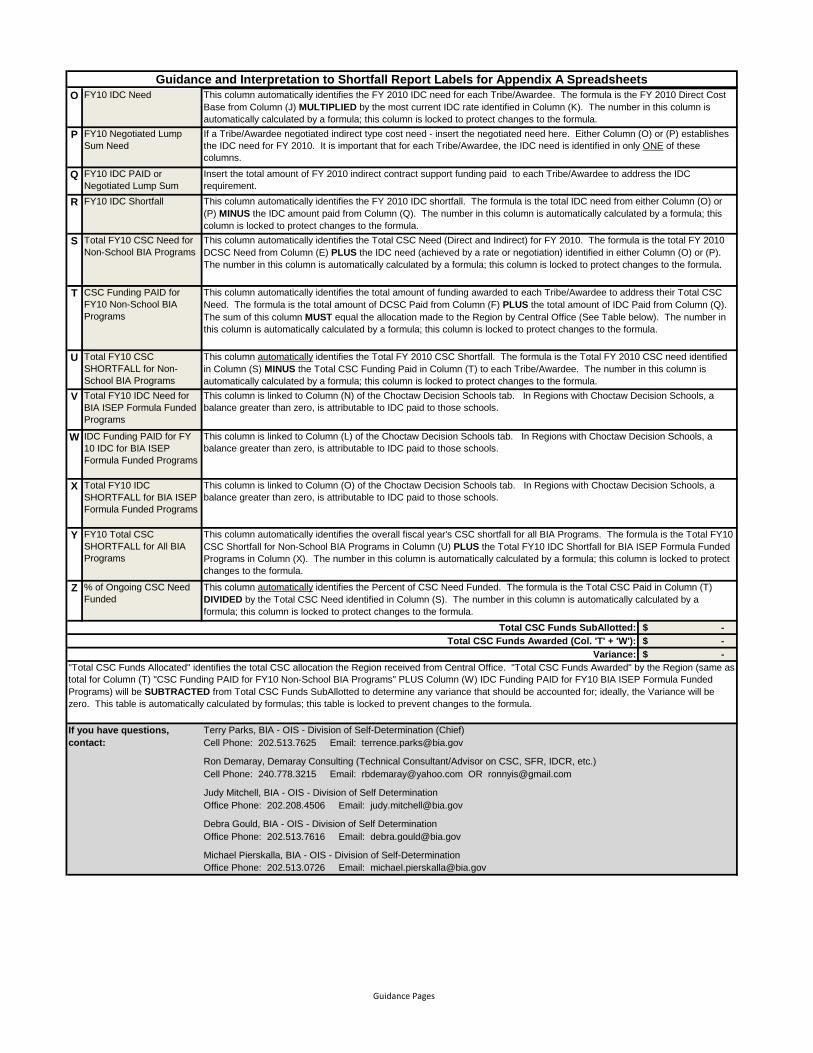
Guidance Pages
Guidance and Interpretation to Shortfall Report Labels for Appendix A Spreadsheets O FY10 IDC Need
P FY10 Negotiated Lump Sum Need
Q FY10 IDC PAID or Negotiated Lump Sum
R FY10 IDC Shortfall
S Total FY10 CSC Need for Non-School BIA Programs
T CSC Funding PAID for FY10 Non-School BIA Programs
U Total FY10 CSC SHORTFALL for Non-School BIA Programs
V Total FY10 IDC Need for BIA ISEP Formula Funded Programs
W IDC Funding PAID for FY 10 IDC for BIA ISEP Formula Funded Programs
X Total FY10 IDC SHORTFALL for BIA ISEP Formula Funded Programs
Y FY10 Total CSC SHORTFALL for All BIA Programs
Z % of Ongoing CSC Need Funded
$ - $ - $ -
Terry Parks, BIA - OIS - Division of Self-Determination (Chief)
Ron Demaray, Demaray Consulting (Technical Consultant/Advisor on CSC, SFR, IDCR, etc.)
Judy Mitchell, BIA - OIS - Division of Self DeterminationOffice Phone: 202.208.4506 Email: [email protected]
Debra Gould, BIA - OIS - Division of Self DeterminationOffice Phone: 202.513.7616 Email: [email protected]
Michael Pierskalla, BIA - OIS - Division of Self-Determination Office Phone: 202.513.0726 Email: [email protected]
If a Tribe/Awardee negotiated indirect type cost need - insert the negotiated need here. Either Column (O) or (P) establishes the IDC need for FY 2010. It is important that for each Tribe/Awardee, the IDC need is identified in only ONE of these columns.
This column automatically identifies the FY 2010 IDC need for each Tribe/Awardee. The formula is the FY 2010 Direct Cost Base from Column (J) MULTIPLIED by the most current IDC rate identified in Column (K). The number in this column is automatically calculated by a formula; this column is locked to protect changes to the formula.
Total CSC Funds Awarded (Col. 'T' + 'W'):Variance:
This column automatically identifies the Total FY 2010 CSC Shortfall. The formula is the Total FY 2010 CSC need identified in Column (S) MINUS the Total CSC Funding Paid in Column (T) to each Tribe/Awardee. The number in this column is automatically calculated by a formula; this column is locked to protect changes to the formula.
Cell Phone: 202.513.7625 Email: [email protected]
Insert the total amount of FY 2010 indirect contract support funding paid to each Tribe/Awardee to address the IDC requirement.This column automatically identifies the FY 2010 IDC shortfall. The formula is the total IDC need from either Column (O) or (P) MINUS the IDC amount paid from Column (Q). The number in this column is automatically calculated by a formula; this column is locked to protect changes to the formula.
This column is linked to Column (L) of the Choctaw Decision Schools tab. In Regions with Choctaw Decision Schools, a balance greater than zero, is attributable to IDC paid to those schools.
This column is linked to Column (O) of the Choctaw Decision Schools tab. In Regions with Choctaw Decision Schools, a balance greater than zero, is attributable to IDC paid to those schools.
This column automatically identifies the Total CSC Need (Direct and Indirect) for FY 2010. The formula is the total FY 2010 DCSC Need from Column (E) PLUS the IDC need (achieved by a rate or negotiation) identified in either Column (O) or (P). The number in this column is automatically calculated by a formula; this column is locked to protect changes to the formula.
Cell Phone: 240.778.3215 Email: [email protected] OR [email protected]
If you have questions, contact:
"Total CSC Funds Allocated" identifies the total CSC allocation the Region received from Central Office. "Total CSC Funds Awarded" by the Region (same as total for Column (T) "CSC Funding PAID for FY10 Non-School BIA Programs" PLUS Column (W) IDC Funding PAID for FY10 BIA ISEP Formula Funded Programs) will be SUBTRACTED from Total CSC Funds SubAllotted to determine any variance that should be accounted for; ideally, the Variance will be zero. This table is automatically calculated by formulas; this table is locked to prevent changes to the formula.
This column automatically identifies the overall fiscal year's CSC shortfall for all BIA Programs. The formula is the Total FY10 CSC Shortfall for Non-School BIA Programs in Column (U) PLUS the Total FY10 IDC Shortfall for BIA ISEP Formula Funded Programs in Column (X). The number in this column is automatically calculated by a formula; this column is locked to protect changes to the formula.
This column is linked to Column (N) of the Choctaw Decision Schools tab. In Regions with Choctaw Decision Schools, a balance greater than zero, is attributable to IDC paid to those schools.
This column automatically identifies the total amount of funding awarded to each Tribe/Awardee to address their Total CSC Need. The formula is the total amount of DCSC Paid from Column (F) PLUS the total amount of IDC Paid from Column (Q). The sum of this column MUST equal the allocation made to the Region by Central Office (See Table below). The number in this column is automatically calculated by a formula; this column is locked to protect changes to the formula.
This column automatically identifies the Percent of CSC Need Funded. The formula is the Total CSC Paid in Column (T) DIVIDED by the Total CSC Need identified in Column (S). The number in this column is automatically calculated by a formula; this column is locked to protect changes to the formula.
Total CSC Funds SubAllotted: