department of statistics bermuda digest of...
TRANSCRIPT
20
14BERMUDA DIGEST OF STATISTICS
GOVERNMENT OF BERMUDACabinet OfficeDepartment of Statistics
BERMUDA DIGEST
OF STATISTICS
2014
No. 37 (figures up to and including 2013 when available)
Cedar Park Centre 48 Cedar Avenue Hamilton HM 11 Bermuda
P.O. Box HM 3015 Hamilton HM MX Bermuda Phone: (441) 297-7761 Fax: (441) 295-8390
Email: [email protected] Website: www.statistics.gov.bm
PREFACE
The Bermuda Digest of Statistics was first produced in 1973. The publication provides an annual summary of various
socioeconomic statistics designed for convenient reference. The tables are grouped by theme to form a total of 10
sections. Unless otherwise stated, the statistics are for Bermuda.
Tables have been modified in this edition to enhance the variety of data provided. Some tables from the previous edition
have been removed because the data is no longer collected or is now in a different format. Also, in an effort to
streamline processes and avoid duplication of data across Government, some tables that were previously available in the
Bermuda Digest of Statistics have been removed. We encourage readers to contact directly the respective Government
Department or organization to obtain this data. In some cases, the data is available and accessible from the stakeholder’s
website.
As was the case with the 2013 Digest of Statistics, this edition contains analyses and graphs in each section. The aim is to
supplement each section of tables by providing background information on the topic and identifying significant trends in
the data that go beyond what is shown solely by the tables. The graphs serve as a quick way to determine key trends in a
visually appealing way.
The name of the department or organization whose reports or published statements were used is noted under each
table. The assistance provided by these departments or organizations is acknowledged gratefully.
The figures in the Digest are mainly annual totals and totals for calendar months. Wherever possible, and space
permitting, series have been provided for the period 2003 to 2013. Figures for earlier years may be found in previous
editions of the Digest.
Melinda Williams
Acting Director of Statistics
Department of Statistics
January 2015
Symbols:
.. not available
― zero or less than ½%
( ) negative figure
e estimated figure
p provisional figure
r revised figure
Note: In some tables, figures may not add to totals due to rounding.
i
CONTENTS
Page
I POPULATION 1 1.1 Civilian Population ................................................................................................................................ 6 1.2 Population by Parish, Sex and Race .................................................................................................. 7 1.3 Population by Sex and Selected Age Groups ................................................................................. 8 1.4 Population by Nativity and Race........................................................................................................ 9 1.5 Foreign-Born Population by Country/Region of Birth and Race ............................................ 10 1.6 Registered Births, Marriages, Divorces and Deaths ................................................................... 11 1.7 Live Births by Age of Mother and Natal Status ........................................................................... 12 1.8 Persons Marrying by Previous Marital Status of Bride and Groom ....................................... 13 1.9 Persons Marrying by Sex and Age of Bride and Groom ........................................................... 14 1.10 Marriages by Age of Bride and Groom ......................................................................................... 15 1.11 Persons Marrying by Previous Marital Status, Sex and Age ..................................................... 16 1.12 Persons Granted Divorces by Age and Marital Status at Marriage ........................................ 17 1.13 Persons Granted Divorces by Age at Marriage and Duration of Marriage .......................... 18 1.14 Persons Granted Divorces by Age at Marriage and Reasons for Divorce ........................... 19 1.15 Deaths by Selected Age Groups ..................................................................................................... 20 II EDUCATION 21
2.1 School Enrolment by Type of School and Sex of Student ........................................................ 25 2.2 Primary School Enrolment by Type of School, Sex of Student and Class Year .................. 26 2.3 Middle School Enrolment by Type of School, Sex of Student and Class Year .................... 27 2.4 Secondary School Enrolment by Type of School, Sex of Student and Class Year ............. 28 2.5 Other Government School Enrolment by Type of School and Sex of Student .................. 29
2.6 Bermuda College Enrolment by Department and Sex of Student ......................................... 30 III HEALTH 31 3.1 Causes of Deaths by Selected Age Groups and Sex .................................................................. 36
3.2 Reported Sexually Transmitted Infections by Age Group and Proportion of Patients Male ....................................................................................................................................................... 37
3.3 Immunizations for Travel Purposes – Selected Diseases .......................................................... 38 IV LABOUR 39
4.1 Summary Analysis of Occupied Jobs by Major Occupational Group and Age of Job Holder .................................................................................................................................................... 42 4.2 Summary Analysis of Occupied Jobs by Major Occupational Group and Major Economic
Activity ................................................................................................................................................... 43 4.3 Foreign-Born Workers by Industrial Group for Census Years – 1991, 2000 and 2010 .. 44
4.4 Estimated Number of Work Permits Issued for Private Sector Employees ........................ 45 4.5 Employment Placements by Month ................................................................................................ 46 4.6 Registered Unemployed at Month-end ......................................................................................... 47 V PRICES AND WAGES 48 5.1 Expenditure Group Weights Used in the CPI ............................................................................. 52 5.2 Selected Average Retail Prices ......................................................................................................... 53 5.3 Basic Weekly Pay Rates – Industrial Workers ............................................................................ 55
ii
VI HOME FINANCE 58
6.1 Central Government: Revenue and Expenditure ....................................................................... 62 6.2 Bermuda Monetary Authority Balance Sheet .............................................................................. 63 6.3 Corporation of Hamilton: Revenue and Expenditure................................................................ 64 6.4 Corporation of St. George: Revenue and Expenditure ............................................................. 65 VII EXTERNAL TRADE 66
7.1 Imports by Commodity Groups ...................................................................................................... 70
7.2 Imports by Country ............................................................................................................................ 71 7.3 Value of Goods Exported ................................................................................................................. 72 VIII TRANSPORT 73
8.1 Registered Road Vehicles .................................................................................................................. 76 8.2 Public Passenger Road Transport ................................................................................................... 77 8.3 Number of Reported Accidents and Vehicles Involved by Type ............................................ 78 8.4 Main Causes of Road Traffic Accidents ......................................................................................... 79 8.5 Road Casualties ................................................................................................................................... 80 8.6 Analysis of Traffic Fatalities ............................................................................................................... 81
8.7 Arrival of Overseas Shipping ............................................................................................................ 82 8.8 Airline Services – Passenger, Cargo and Mail Carried .............................................................. 83 IX VISITOR ARRIVALS 84
9.1 Visitor Arrivals ..................................................................................................................................... 88 9.2 Origin of Visitors by Air and Country ........................................................................................... 89 9.3 Canada – Air Visitors by Province of Residence......................................................................... 91 9.4 U.S.A. – Air Visitors by State of Residence .................................................................................. 92 9.5 Visitor Arrivals by Month .................................................................................................................. 94 X MISCELLANEOUS 95
10.1 Value of Domestic Agricultural Output ........................................................................................ 99
10.2 Bermuda Plan 2008 Zonings .......................................................................................................... 100 10.3 Telephone Subscribers by Type ................................................................................................... 101 10.4 Gross Receipts from Telephone Traffic ..................................................................................... 102 10.5 Completed Dwelling Units ............................................................................................................ 103 10.6 Disposition of Applications for Planning Permission ............................................................... 104 10.7 Bermuda Fire & Rescue Service Statistics .................................................................................. 105 10.8 Number of Fires by Type of Fire ................................................................................................. 106
iii
Section I
Population
2013 Quick Facts Total births: 648
Total deaths: 471
Total marriages: 471
Total divorces: 165
1
Vital Statistics: An Overview
A vital statistics system can be defined as including the legal registration, collection, compilation,
analysis, presentation and distribution of statistics pertaining to “vital events”, which for these purposes include live births, deaths, marriages and divorces.1
Vital Statistics: Summary of Past Two Years Figure 1 shows the number of births, deaths, marriages and divorces for 2012 and 2013. The
number of births remained constant for these years at a record low of 648. However, the
amount of births decreased by 22% over the past decade. The number of deaths rose by 12%
between 2012 and 2013, with female deaths increasing by 24%. In contrast, the amount of
marriages performed in Bermuda decreased by 22% over the past year to 471, recording the
lowest number since 1977 when there were 460 marriages. Between 2012 and 2013, the
amount of divorces granted increased by 14%.
Sex Ratio at Birth Shifting The sex ratio at birth is typically about 105 males per 100 females worldwide.2 However, in the
past four years, there have been more females born than males in Bermuda (Table 1.6). The
result was a sex ratio at birth of 95 males per 100 females for this period. This is an unusual
trend given that historically (from 1940 to 2013), 68% of the time there have been more males
than females born. According to the U.S.A. Centers for Disease Control and Prevention,
factors that may lower a population's sex ratio include: increased age of the father, lower
maternal weight, stress and environmental toxins (e.g. cigarette smoking).3 The factors that may
have contributed to this recent local trend could be determined through further study.
Seniors Represent Three of Every Four Deaths In 2013, almost a third of deaths were to persons 85 years or older, the joint highest
proportion of the period. The majority (75%) of deaths occurred at age 65 years and over. In
comparison, only 16% of the population was expected to be 65 years and older in 2013. This
highlights that the risk of dying is much higher for seniors than the rest of the population. As
the population continues to age, it is projected that the share of the population 65 years and
older will increase to 20% in 2020. As a result, it is likely that the proportion of deaths that are
seniors will rise over time (Figure 2 and Table 1.15).
Number of Marriages Nearly Halves in Past Decade The number of marriages from 2003 to 2013 has decreased by 46%, from 861 to 471 (Figure 3 and Table 1.6). A possible reason for the exceptionally low number of marriages in 2013 may be superstition; there may be a preference to avoid being married in a year ending in ‘13’. This may be determined by whether the number of marriages rebounds in 2014. Other factors which may explain the significant drop in marriages since 2003 include: couples delaying marriage until their education is complete/ careers are built, affordability or couples preferring cohabitation.
1 United Nations (1953), Principles for a Vital Statistics System, New York, USA. 2 Haupt, A., Kane, T., and Haub, C., (2011), Population Reference Bureau’s Population Handbook (6th Edition), USA. 2 Haupt, A., Kane, T., and Haub, C., (2011), Population Reference Bureau’s Population Handbook (6th Edition), USA. 3 Centers for Disease Control and Prevention, Retrieved December 11, 2014 from http://www.cdc.gov/nchs/data/nvsr/nvsr53/nvsr53_20.pdf
2
In 2013, one-third of divorcees had marriage durations of 5-9 years (Figure 4 and Table 1.13). Marriage durations of less than 5 years and 10-14 years were the next most common, each representing 22% of the total. As 78% of marriages that ended in divorce lasted under 15 years, this is evidence that the shorter a couple are married the more likely the marriage will end in divorce.
3
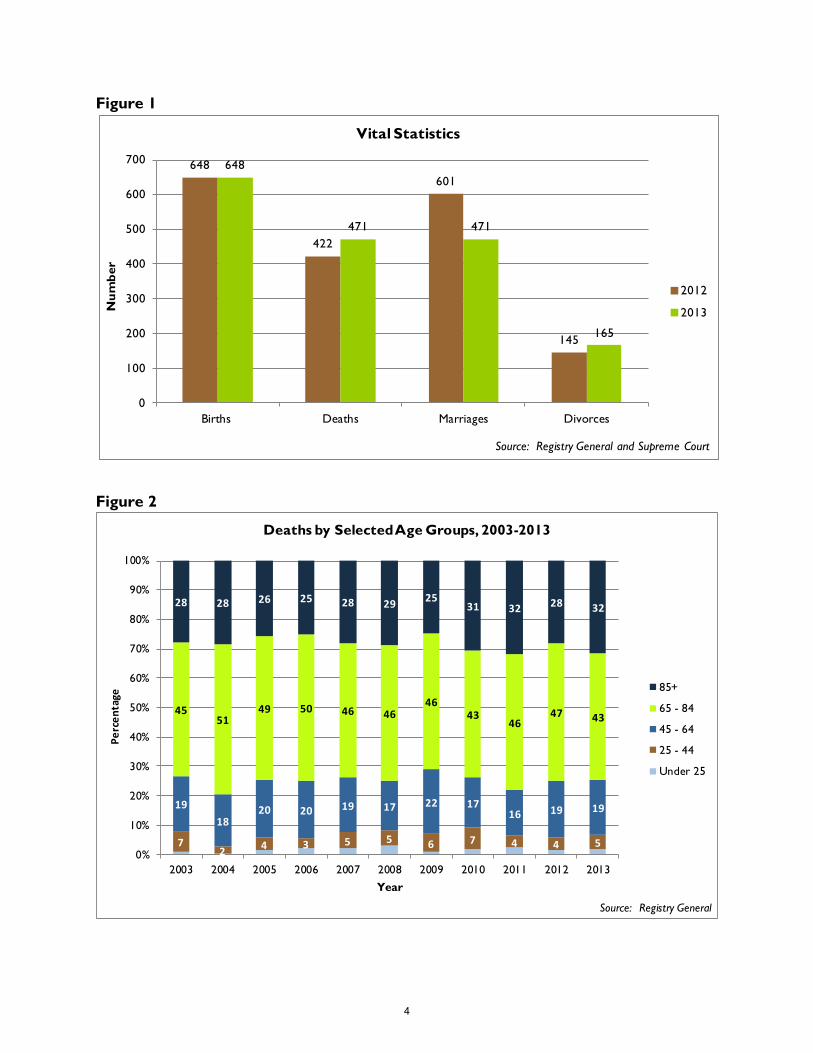
Figure 1
Figure 2
648
422
601
145
648
471 471
165
0
100
200
300
400
500
600
700
Births Deaths Marriages Divorces
Nu
mb
er
Vital Statistics
2012
2013
Source: Registry General and Supreme Court
72
4 3 5 5 6 7 4 4 5
19
1820 20 19 17 22 17
16 19 19
4551
49 50 46 4646
4346
47 43
28 28 26 25 28 2925
31 32 28 32
0%
10%
20%
30%
40%
50%
60%
70%
80%
90%
100%
2003 2004 2005 2006 2007 2008 2009 2010 2011 2012 2013
Pe
rce
nta
ge
Year
Deaths by Selected Age Groups, 2003-2013
85+
65 - 84
45 - 64
25 - 44
Under 25
Source: Registry General
4
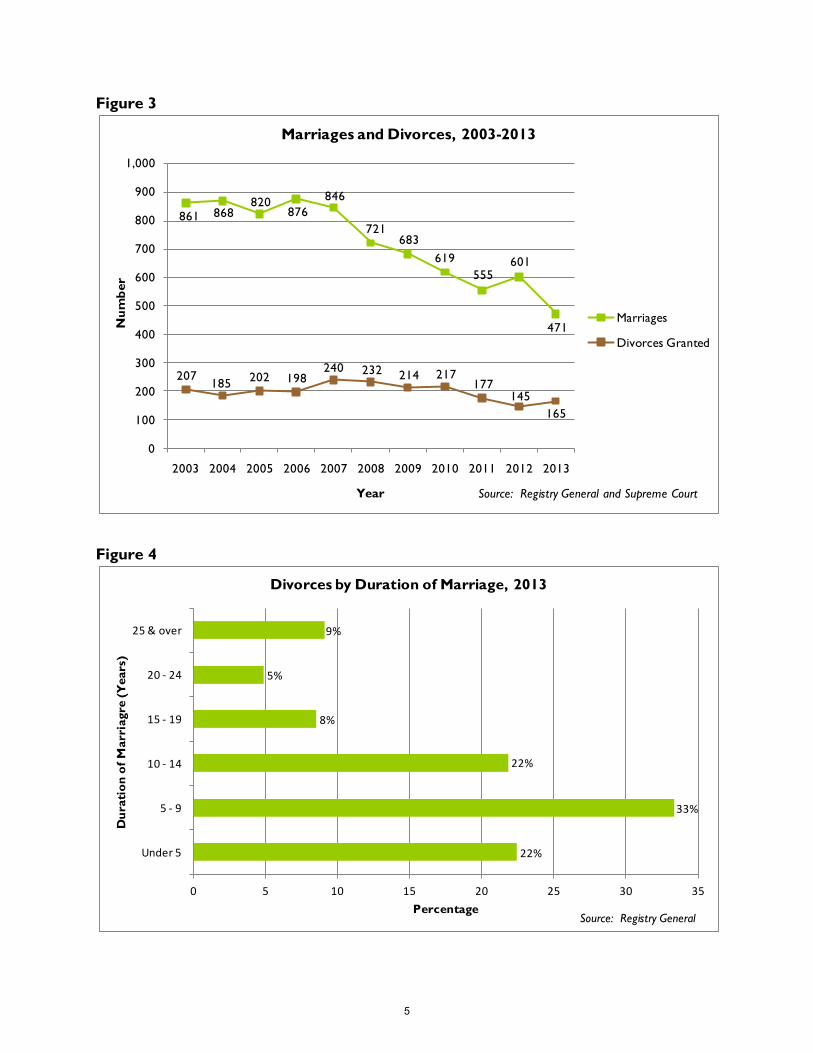
Figure 3
Figure 4
861 868820
876
846
721683
619
555601
471
207185
202 198240 232 214 217
177145
165
0
100
200
300
400
500
600
700
800
900
1,000
2003 2004 2005 2006 2007 2008 2009 2010 2011 2012 2013
Nu
mb
er
Year
Marriages and Divorces, 2003-2013
Marriages
Divorces Granted
Source: Registry General and Supreme Court
22%
33%
22%
8%
5%
9%
0 5 10 15 20 25 30 35
Under 5
5 - 9
10 - 14
15 - 19
20 - 24
25 & over
Percentage
Du
rati
on
of
Marria
gre (
Years)
Divorces by Duration of Marriage, 2013
Source: Registry General
5
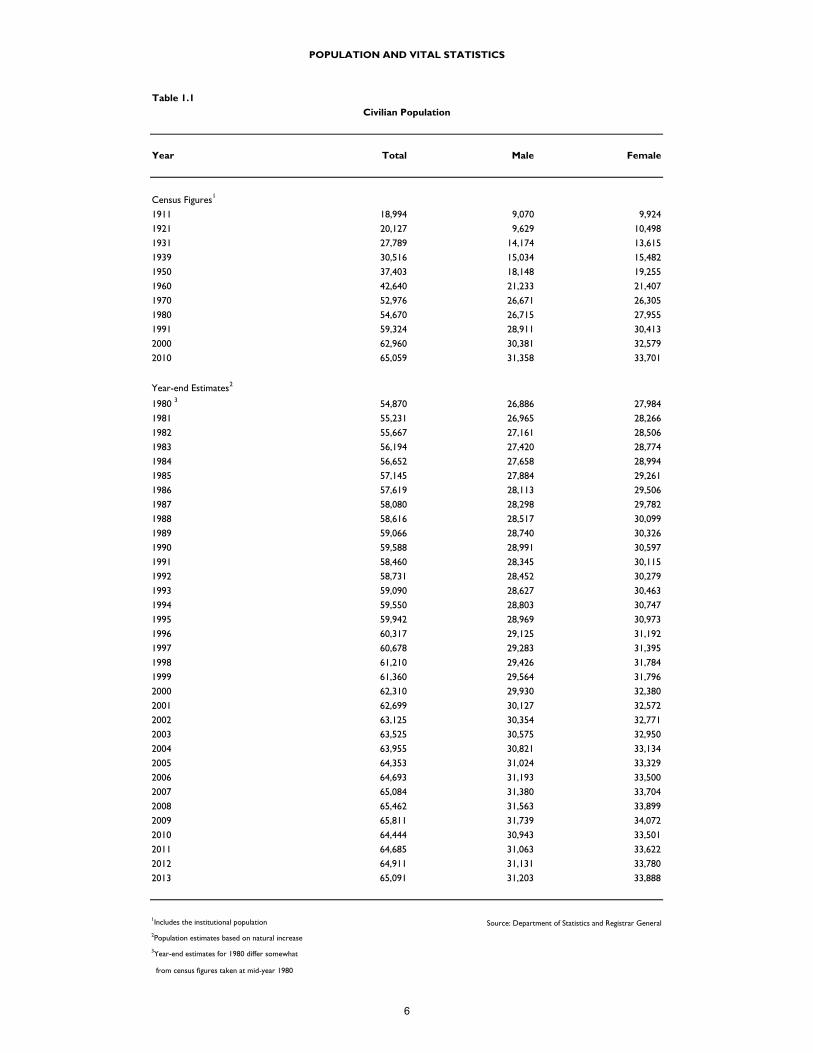
Table 1.1
Year Total Male Female
Census Figures1
1911 18,994 9,070 9,924
1921 20,127 9,629 10,498
1931 27,789 14,174 13,615
1939 30,516 15,034 15,482
1950 37,403 18,148 19,255
1960 42,640 21,233 21,407
1970 52,976 26,671 26,305
1980 54,670 26,715 27,955
1991 59,324 28,911 30,413
2000 62,960 30,381 32,579
2010 65,059 31,358 33,701
Year-end Estimates2
1980 3 54,870 26,886 27,984
1981 55,231 26,965 28,266
1982 55,667 27,161 28,506
1983 56,194 27,420 28,774
1984 56,652 27,658 28,994
1985 57,145 27,884 29,261
1986 57,619 28,113 29,506
1987 58,080 28,298 29,782
1988 58,616 28,517 30,099
1989 59,066 28,740 30,326
1990 59,588 28,991 30,597
1991 58,460 28,345 30,115
1992 58,731 28,452 30,279
1993 59,090 28,627 30,463
1994 59,550 28,803 30,747
1995 59,942 28,969 30,973
1996 60,317 29,125 31,192
1997 60,678 29,283 31,395
1998 61,210 29,426 31,784
1999 61,360 29,564 31,796
2000 62,310 29,930 32,380
2001 62,699 30,127 32,572
2002 63,125 30,354 32,771
2003 63,525 30,575 32,950
2004 63,955 30,821 33,134
2005 64,353 31,024 33,329
2006 64,693 31,193 33,500
2007 65,084 31,380 33,704
2008 65,462 31,563 33,899
2009 65,811 31,739 34,072
2010 64,444 30,943 33,501
2011 64,685 31,063 33,622
2012 64,911 31,131 33,780
2013 65,091 31,203 33,888
1Includes the institutional population Source: Department of Statistics and Registrar General2Population estimates based on natural increase
3Year-end estimates for 1980 differ somewhat
from census figures taken at mid-year 1980
POPULATION AND VITAL STATISTICS
Civilian Population
6
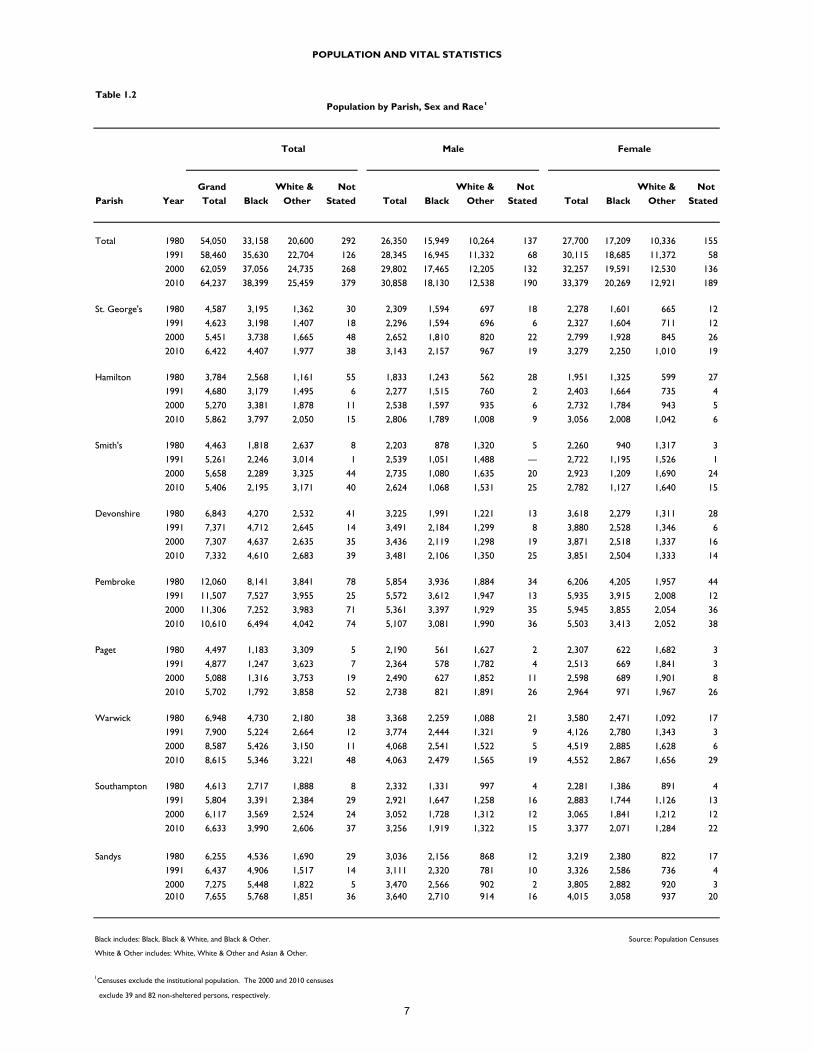
Table 1.2
Grand White & Not White & Not White & Not
Parish Year Total Black Other Stated Total Black Other Stated Total Black Other Stated
Total 1980 54,050 33,158 20,600 292 26,350 15,949 10,264 137 27,700 17,209 10,336 155
1991 58,460 35,630 22,704 126 28,345 16,945 11,332 68 30,115 18,685 11,372 58
2000 62,059 37,056 24,735 268 29,802 17,465 12,205 132 32,257 19,591 12,530 136
2010 64,237 38,399 25,459 379 30,858 18,130 12,538 190 33,379 20,269 12,921 189
St. George's 1980 4,587 3,195 1,362 30 2,309 1,594 697 18 2,278 1,601 665 12
1991 4,623 3,198 1,407 18 2,296 1,594 696 6 2,327 1,604 711 12
2000 5,451 3,738 1,665 48 2,652 1,810 820 22 2,799 1,928 845 26
2010 6,422 4,407 1,977 38 3,143 2,157 967 19 3,279 2,250 1,010 19
Hamilton 1980 3,784 2,568 1,161 55 1,833 1,243 562 28 1,951 1,325 599 27
1991 4,680 3,179 1,495 6 2,277 1,515 760 2 2,403 1,664 735 4
2000 5,270 3,381 1,878 11 2,538 1,597 935 6 2,732 1,784 943 5
2010 5,862 3,797 2,050 15 2,806 1,789 1,008 9 3,056 2,008 1,042 6
Smith's 1980 4,463 1,818 2,637 8 2,203 878 1,320 5 2,260 940 1,317 3
1991 5,261 2,246 3,014 1 2,539 1,051 1,488 ― 2,722 1,195 1,526 1
2000 5,658 2,289 3,325 44 2,735 1,080 1,635 20 2,923 1,209 1,690 24
2010 5,406 2,195 3,171 40 2,624 1,068 1,531 25 2,782 1,127 1,640 15
Devonshire 1980 6,843 4,270 2,532 41 3,225 1,991 1,221 13 3,618 2,279 1,311 28
1991 7,371 4,712 2,645 14 3,491 2,184 1,299 8 3,880 2,528 1,346 6
2000 7,307 4,637 2,635 35 3,436 2,119 1,298 19 3,871 2,518 1,337 16
2010 7,332 4,610 2,683 39 3,481 2,106 1,350 25 3,851 2,504 1,333 14
Pembroke 1980 12,060 8,141 3,841 78 5,854 3,936 1,884 34 6,206 4,205 1,957 44
1991 11,507 7,527 3,955 25 5,572 3,612 1,947 13 5,935 3,915 2,008 12
2000 11,306 7,252 3,983 71 5,361 3,397 1,929 35 5,945 3,855 2,054 36
2010 10,610 6,494 4,042 74 5,107 3,081 1,990 36 5,503 3,413 2,052 38
Paget 1980 4,497 1,183 3,309 5 2,190 561 1,627 2 2,307 622 1,682 3
1991 4,877 1,247 3,623 7 2,364 578 1,782 4 2,513 669 1,841 3
2000 5,088 1,316 3,753 19 2,490 627 1,852 11 2,598 689 1,901 8
2010 5,702 1,792 3,858 52 2,738 821 1,891 26 2,964 971 1,967 26
Warwick 1980 6,948 4,730 2,180 38 3,368 2,259 1,088 21 3,580 2,471 1,092 17
1991 7,900 5,224 2,664 12 3,774 2,444 1,321 9 4,126 2,780 1,343 3
2000 8,587 5,426 3,150 11 4,068 2,541 1,522 5 4,519 2,885 1,628 6
2010 8,615 5,346 3,221 48 4,063 2,479 1,565 19 4,552 2,867 1,656 29
Southampton 1980 4,613 2,717 1,888 8 2,332 1,331 997 4 2,281 1,386 891 4
1991 5,804 3,391 2,384 29 2,921 1,647 1,258 16 2,883 1,744 1,126 13
2000 6,117 3,569 2,524 24 3,052 1,728 1,312 12 3,065 1,841 1,212 12
2010 6,633 3,990 2,606 37 3,256 1,919 1,322 15 3,377 2,071 1,284 22
Sandys 1980 6,255 4,536 1,690 29 3,036 2,156 868 12 3,219 2,380 822 17
1991 6,437 4,906 1,517 14 3,111 2,320 781 10 3,326 2,586 736 4
2000 7,275 5,448 1,822 5 3,470 2,566 902 2 3,805 2,882 920 32010 7,655 5,768 1,851 36 3,640 2,710 914 16 4,015 3,058 937 20
Black includes: Black, Black & White, and Black & Other. Source: Population Censuses
White & Other includes: White, White & Other and Asian & Other.
1Censuses exclude the institutional population. The 2000 and 2010 censuses
exclude 39 and 82 non-sheltered persons, respectively.
POPULATION AND VITAL STATISTICS
Population by Parish, Sex and Race1
Total Male Female
7
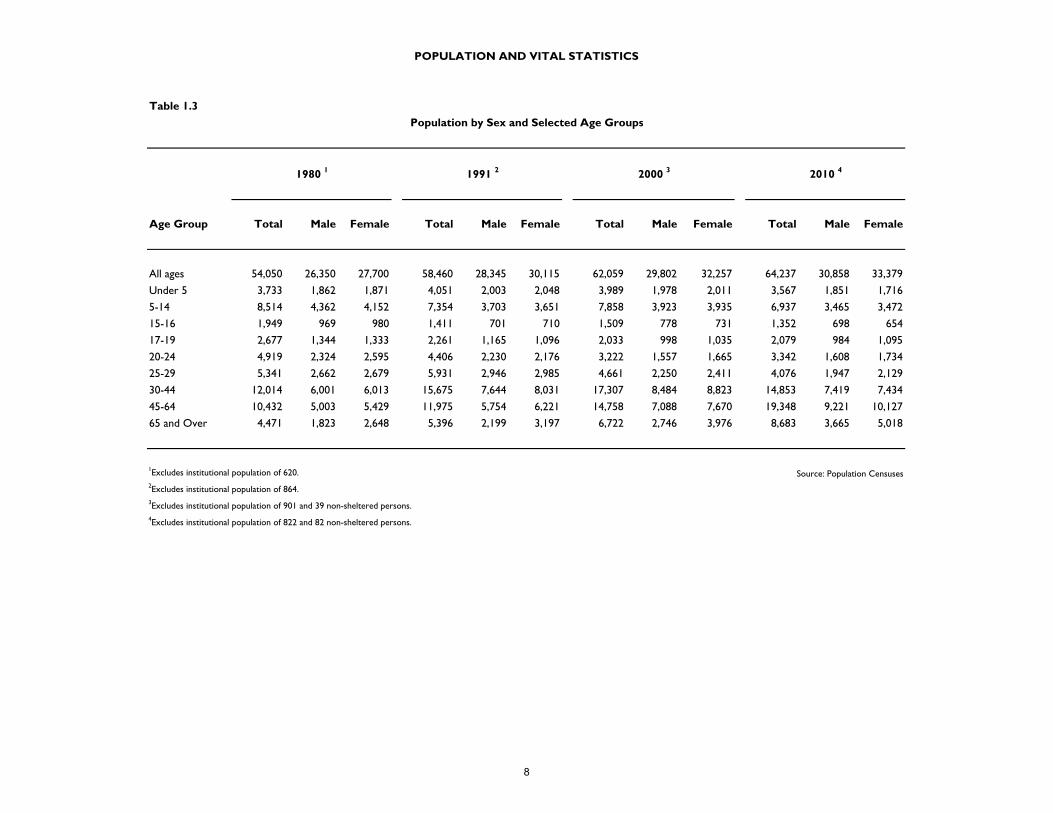
Table 1.3
Age Group Total Male Female Total Male Female Total Male Female Total Male Female
All ages 54,050 26,350 27,700 58,460 28,345 30,115 62,059 29,802 32,257 64,237 30,858 33,379
Under 5 3,733 1,862 1,871 4,051 2,003 2,048 3,989 1,978 2,011 3,567 1,851 1,716
5-14 8,514 4,362 4,152 7,354 3,703 3,651 7,858 3,923 3,935 6,937 3,465 3,472
15-16 1,949 969 980 1,411 701 710 1,509 778 731 1,352 698 654
17-19 2,677 1,344 1,333 2,261 1,165 1,096 2,033 998 1,035 2,079 984 1,095
20-24 4,919 2,324 2,595 4,406 2,230 2,176 3,222 1,557 1,665 3,342 1,608 1,734
25-29 5,341 2,662 2,679 5,931 2,946 2,985 4,661 2,250 2,411 4,076 1,947 2,129
30-44 12,014 6,001 6,013 15,675 7,644 8,031 17,307 8,484 8,823 14,853 7,419 7,434
45-64 10,432 5,003 5,429 11,975 5,754 6,221 14,758 7,088 7,670 19,348 9,221 10,127
65 and Over 4,471 1,823 2,648 5,396 2,199 3,197 6,722 2,746 3,976 8,683 3,665 5,018
1Excludes institutional population of 620. Source: Population Censuses2Excludes institutional population of 864.3Excludes institutional population of 901 and 39 non-sheltered persons.4Excludes institutional population of 822 and 82 non-sheltered persons.
POPULATION AND VITAL STATISTICS
Population by Sex and Selected Age Groups
1980 1 1991 2 2000 3 2010 4
8
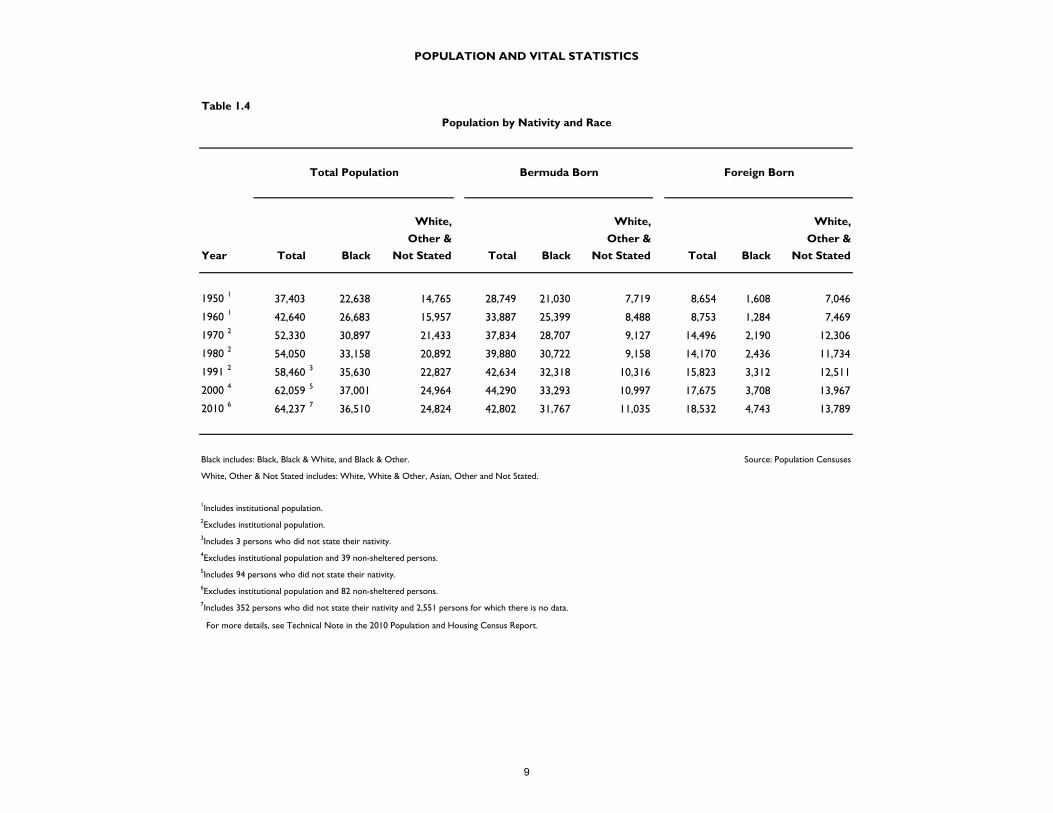
Table 1.4
White,
Other &
White,
Other &
White,
Other &
Year Total Black Not Stated Total Black Not Stated Total Black Not Stated
1950 1 37,403 22,638 14,765 28,749 21,030 7,719 8,654 1,608 7,046
1960 1 42,640 26,683 15,957 33,887 25,399 8,488 8,753 1,284 7,469
1970 2 52,330 30,897 21,433 37,834 28,707 9,127 14,496 2,190 12,306
1980 2 54,050 33,158 20,892 39,880 30,722 9,158 14,170 2,436 11,734
1991 2 58,460 3 35,630 22,827 42,634 32,318 10,316 15,823 3,312 12,511
2000 4 62,059 5 37,001 24,964 44,290 33,293 10,997 17,675 3,708 13,967
2010 6 64,237 7 36,510 24,824 42,802 31,767 11,035 18,532 4,743 13,789
Black includes: Black, Black & White, and Black & Other. Source: Population Censuses
White, Other & Not Stated includes: White, White & Other, Asian, Other and Not Stated.
1Includes institutional population.2Excludes institutional population.3Includes 3 persons who did not state their nativity.4Excludes institutional population and 39 non-sheltered persons.5Includes 94 persons who did not state their nativity.6Excludes institutional population and 82 non-sheltered persons.7Includes 352 persons who did not state their nativity and 2,551 persons for which there is no data.
For more details, see Technical Note in the 2010 Population and Housing Census Report.
POPULATION AND VITAL STATISTICS
Population by Nativity and Race
Total Population Bermuda Born Foreign Born
9
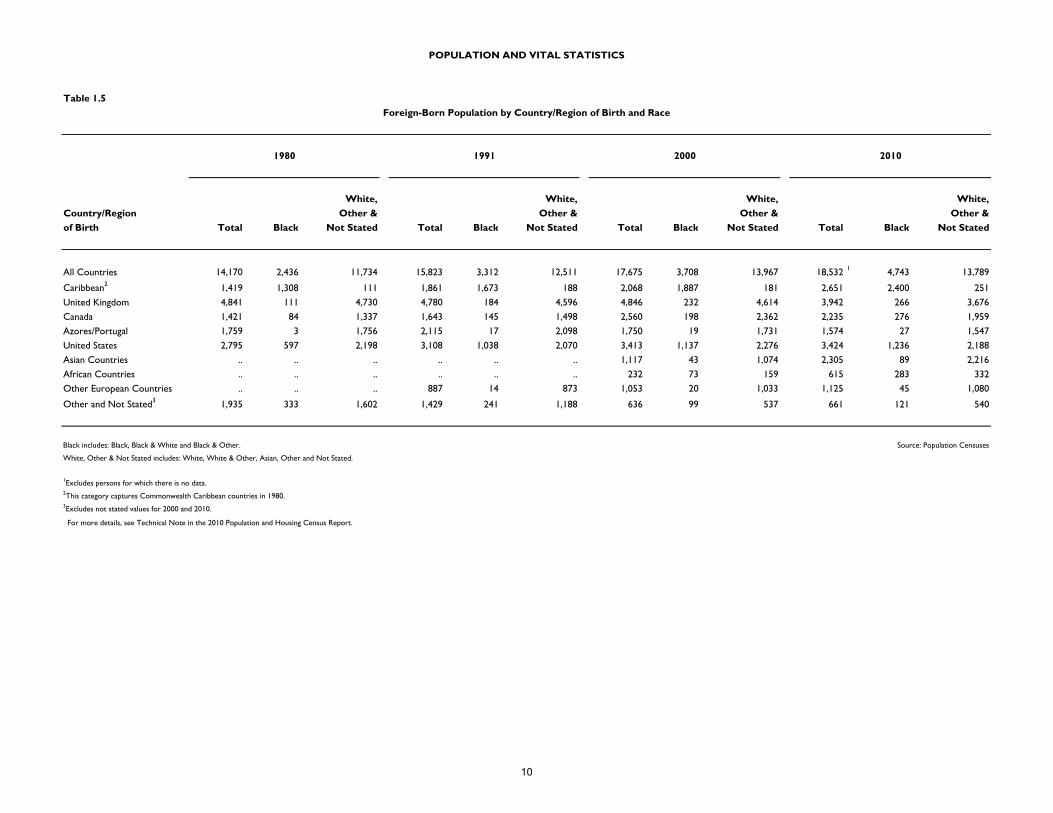
Table 1.5
White, White, White, White,
Country/Region Other & Other & Other & Other &
of Birth Total Black Not Stated Total Black Not Stated Total Black Not Stated Total Black Not Stated
All Countries 14,170 2,436 11,734 15,823 3,312 12,511 17,675 3,708 13,967 18,532 1 4,743 13,789
Caribbean2 1,419 1,308 111 1,861 1,673 188 2,068 1,887 181 2,651 2,400 251
United Kingdom 4,841 111 4,730 4,780 184 4,596 4,846 232 4,614 3,942 266 3,676
Canada 1,421 84 1,337 1,643 145 1,498 2,560 198 2,362 2,235 276 1,959
Azores/Portugal 1,759 3 1,756 2,115 17 2,098 1,750 19 1,731 1,574 27 1,547
United States 2,795 597 2,198 3,108 1,038 2,070 3,413 1,137 2,276 3,424 1,236 2,188
Asian Countries .. .. .. .. .. .. 1,117 43 1,074 2,305 89 2,216
African Countries .. .. .. .. .. .. 232 73 159 615 283 332
Other European Countries .. .. .. 887 14 873 1,053 20 1,033 1,125 45 1,080
Other and Not Stated3 1,935 333 1,602 1,429 241 1,188 636 99 537 661 121 540
Black includes: Black, Black & White and Black & Other. Source: Population Censuses
White, Other & Not Stated includes: White, White & Other, Asian, Other and Not Stated.
1Excludes persons for which there is no data.2This category captures Commonwealth Caribbean countries in 1980.3Excludes not stated values for 2000 and 2010.
For more details, see Technical Note in the 2010 Population and Housing Census Report.
POPULATION AND VITAL STATISTICS
Foreign-Born Population by Country/Region of Birth and Race
1980 1991 2000 2010
10
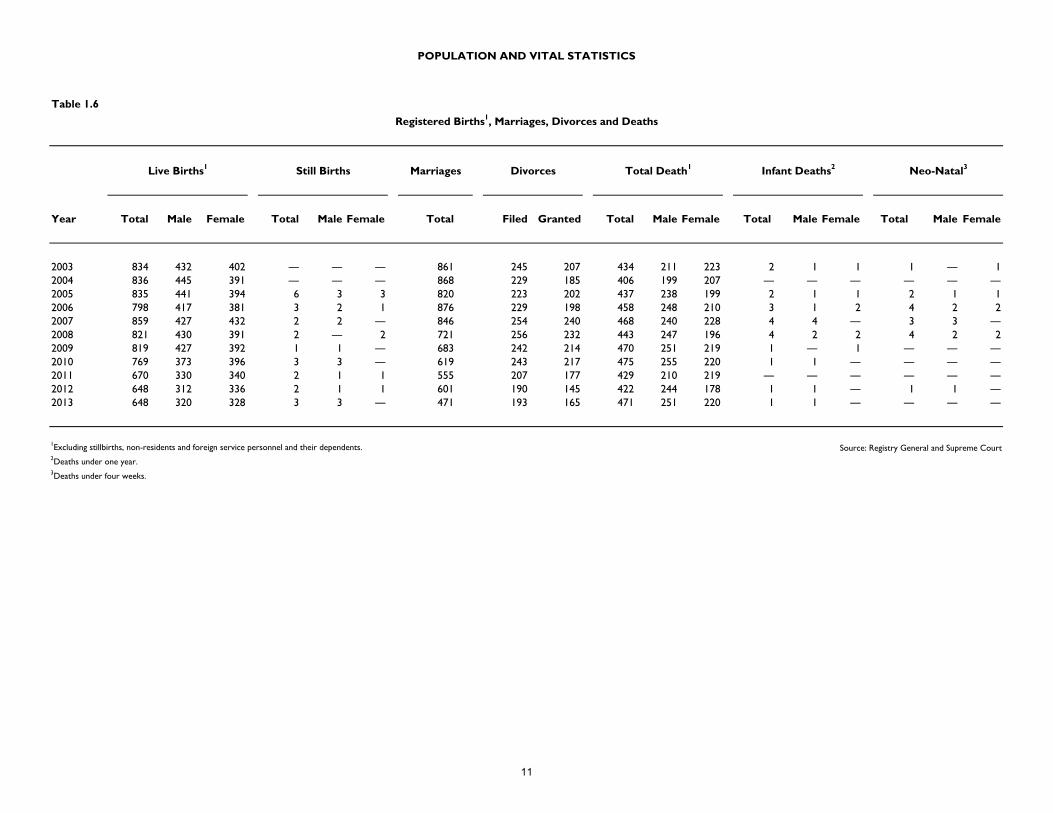
Table 1.6
Year Total Male Female Total Male Female Total Filed Granted Total Male Female Total Male Female Total Male Female
2003 834 432 402 ― ― ― 861 245 207 434 211 223 2 1 1 1 ― 12004 836 445 391 ― ― ― 868 229 185 406 199 207 ― ― ― ― ― ―2005 835 441 394 6 3 3 820 223 202 437 238 199 2 1 1 2 1 12006 798 417 381 3 2 1 876 229 198 458 248 210 3 1 2 4 2 22007 859 427 432 2 2 ― 846 254 240 468 240 228 4 4 ― 3 3 ―2008 821 430 391 2 ― 2 721 256 232 443 247 196 4 2 2 4 2 22009 819 427 392 1 1 ― 683 242 214 470 251 219 1 ― 1 ― ― ―2010 769 373 396 3 3 ― 619 243 217 475 255 220 1 1 ― ― ― ―2011 670 330 340 2 1 1 555 207 177 429 210 219 ― ― ― ― ― ―2012 648 312 336 2 1 1 601 190 145 422 244 178 1 1 ― 1 1 ―2013 648 320 328 3 3 ― 471 193 165 471 251 220 1 1 ― ― ― ―
1Excluding stillbirths, non-residents and foreign service personnel and their dependents. Source: Registry General and Supreme Court2Deaths under one year.3Deaths under four weeks.
POPULATION AND VITAL STATISTICS
Registered Births1, Marriages, Divorces and Deaths
Live Births1 Still Births Marriages Divorces Total Death1 Infant Deaths2 Neo-Natal3
11
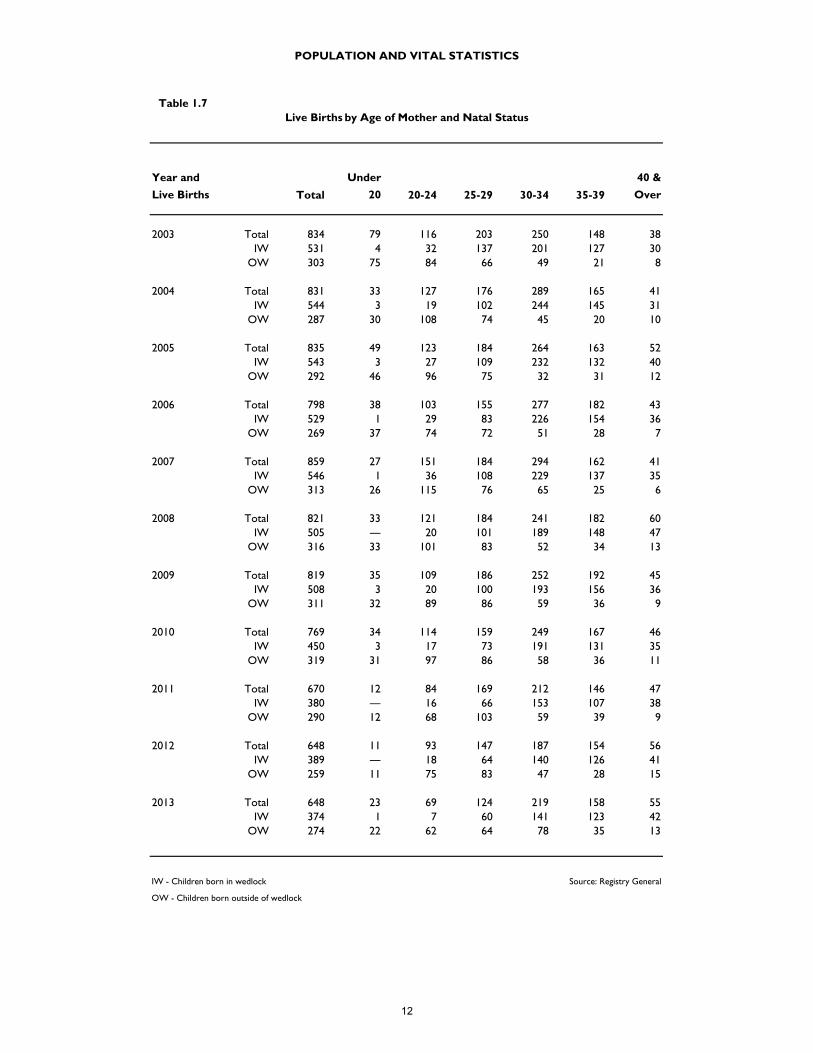
Table 1.7
Year and
Live Births Total
Under
20 20-24 25-29 30-34 35-39
40 &
Over
2003 Total 834 79 116 203 250 148 38IW 531 4 32 137 201 127 30
OW 303 75 84 66 49 21 8
2004 Total 831 33 127 176 289 165 41IW 544 3 19 102 244 145 31
OW 287 30 108 74 45 20 10
2005 Total 835 49 123 184 264 163 52IW 543 3 27 109 232 132 40
OW 292 46 96 75 32 31 12
2006 Total 798 38 103 155 277 182 43IW 529 1 29 83 226 154 36
OW 269 37 74 72 51 28 7
2007 Total 859 27 151 184 294 162 41IW 546 1 36 108 229 137 35
OW 313 26 115 76 65 25 6
2008 Total 821 33 121 184 241 182 60IW 505 ― 20 101 189 148 47
OW 316 33 101 83 52 34 13
2009 Total 819 35 109 186 252 192 45IW 508 3 20 100 193 156 36
OW 311 32 89 86 59 36 9
2010 Total 769 34 114 159 249 167 46IW 450 3 17 73 191 131 35
OW 319 31 97 86 58 36 11
2011 Total 670 12 84 169 212 146 47IW 380 ― 16 66 153 107 38
OW 290 12 68 103 59 39 9
2012 Total 648 11 93 147 187 154 56IW 389 ― 18 64 140 126 41
OW 259 11 75 83 47 28 15
2013 Total 648 23 69 124 219 158 55IW 374 1 7 60 141 123 42
OW 274 22 62 64 78 35 13
IW - Children born in wedlock Source: Registry General
OW - Children born outside of wedlock
POPULATION AND VITAL STATISTICS
Live Births by Age of Mother and Natal Status
12
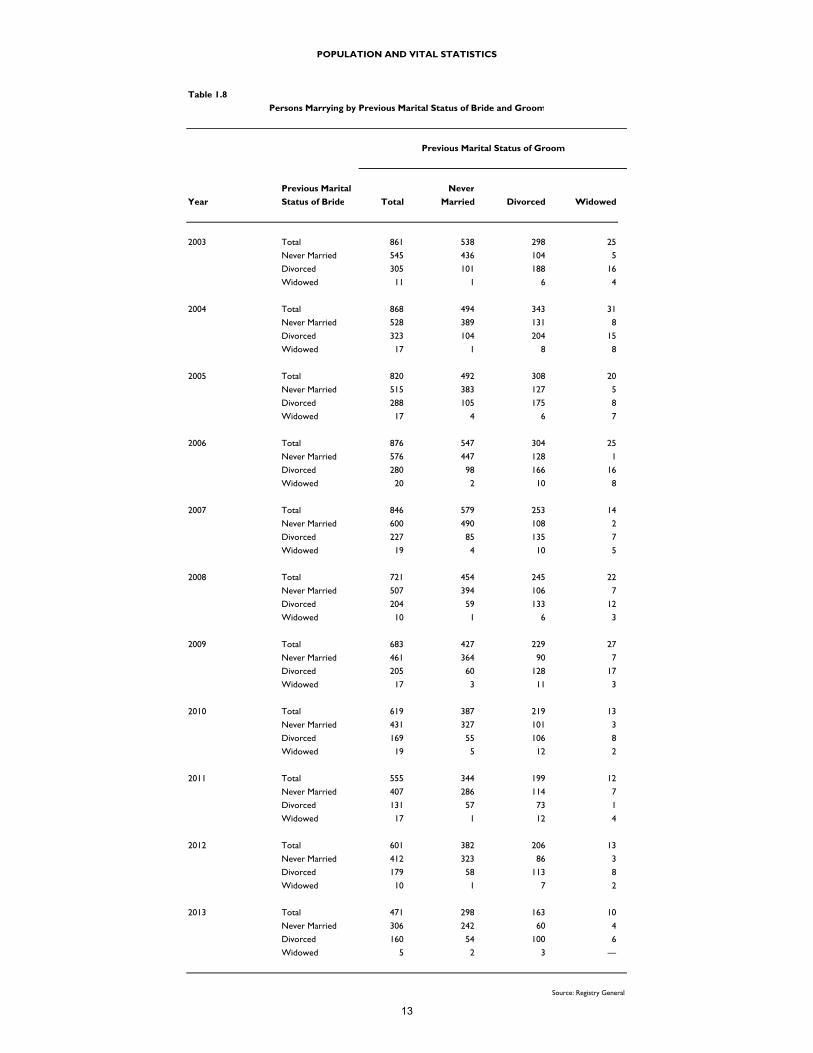
Table 1.8
Previous Marital Never
Year Status of Bride Total Married Divorced Widowed
2003 Total 861 538 298 25
Never Married 545 436 104 5
Divorced 305 101 188 16
Widowed 11 1 6 4
2004 Total 868 494 343 31
Never Married 528 389 131 8
Divorced 323 104 204 15
Widowed 17 1 8 8
2005 Total 820 492 308 20
Never Married 515 383 127 5
Divorced 288 105 175 8
Widowed 17 4 6 7
2006 Total 876 547 304 25
Never Married 576 447 128 1
Divorced 280 98 166 16
Widowed 20 2 10 8
2007 Total 846 579 253 14
Never Married 600 490 108 2
Divorced 227 85 135 7
Widowed 19 4 10 5
2008 Total 721 454 245 22
Never Married 507 394 106 7
Divorced 204 59 133 12
Widowed 10 1 6 3
2009 Total 683 427 229 27
Never Married 461 364 90 7
Divorced 205 60 128 17
Widowed 17 3 11 3
2010 Total 619 387 219 13
Never Married 431 327 101 3
Divorced 169 55 106 8
Widowed 19 5 12 2
2011 Total 555 344 199 12
Never Married 407 286 114 7
Divorced 131 57 73 1
Widowed 17 1 12 4
2012 Total 601 382 206 13
Never Married 412 323 86 3
Divorced 179 58 113 8
Widowed 10 1 7 2
2013 Total 471 298 163 10
Never Married 306 242 60 4
Divorced 160 54 100 6
Widowed 5 2 3 ―
Source: Registry General
POPULATION AND VITAL STATISTICS
Persons Marrying by Previous Marital Status of Bride and Groom
Previous Marital Status of Groom
13
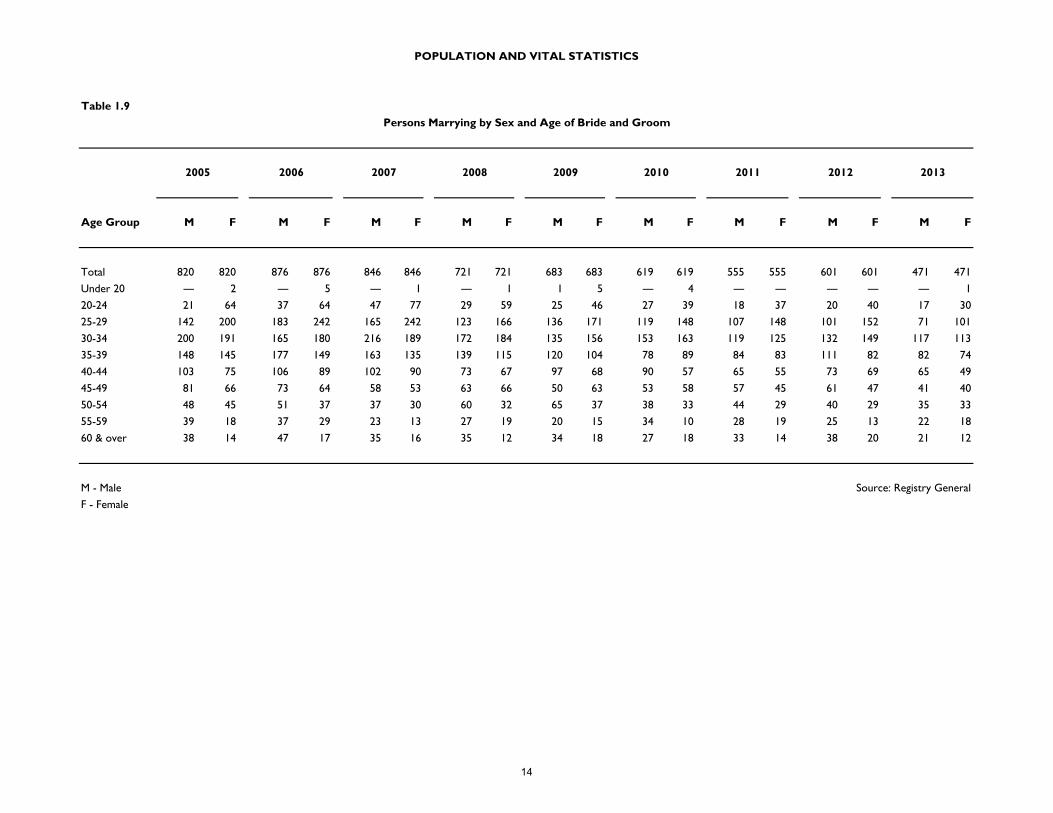
Table 1.9
Age Group M F M F M F M F M F M F M F M F M F
Total 820 820 876 876 846 846 721 721 683 683 619 619 555 555 601 601 471 471
Under 20 ― 2 ― 5 ― 1 ― 1 1 5 ― 4 ― ― ― ― ― 1
20-24 21 64 37 64 47 77 29 59 25 46 27 39 18 37 20 40 17 30
25-29 142 200 183 242 165 242 123 166 136 171 119 148 107 148 101 152 71 101
30-34 200 191 165 180 216 189 172 184 135 156 153 163 119 125 132 149 117 113
35-39 148 145 177 149 163 135 139 115 120 104 78 89 84 83 111 82 82 74
40-44 103 75 106 89 102 90 73 67 97 68 90 57 65 55 73 69 65 49
45-49 81 66 73 64 58 53 63 66 50 63 53 58 57 45 61 47 41 40
50-54 48 45 51 37 37 30 60 32 65 37 38 33 44 29 40 29 35 33
55-59 39 18 37 29 23 13 27 19 20 15 34 10 28 19 25 13 22 18
60 & over 38 14 47 17 35 16 35 12 34 18 27 18 33 14 38 20 21 12
M - Male Source: Registry General
F - Female
2010 2011
POPULATION AND VITAL STATISTICS
Persons Marrying by Sex and Age of Bride and Groom
2005 2012 20132006 2007 2008 2009
14
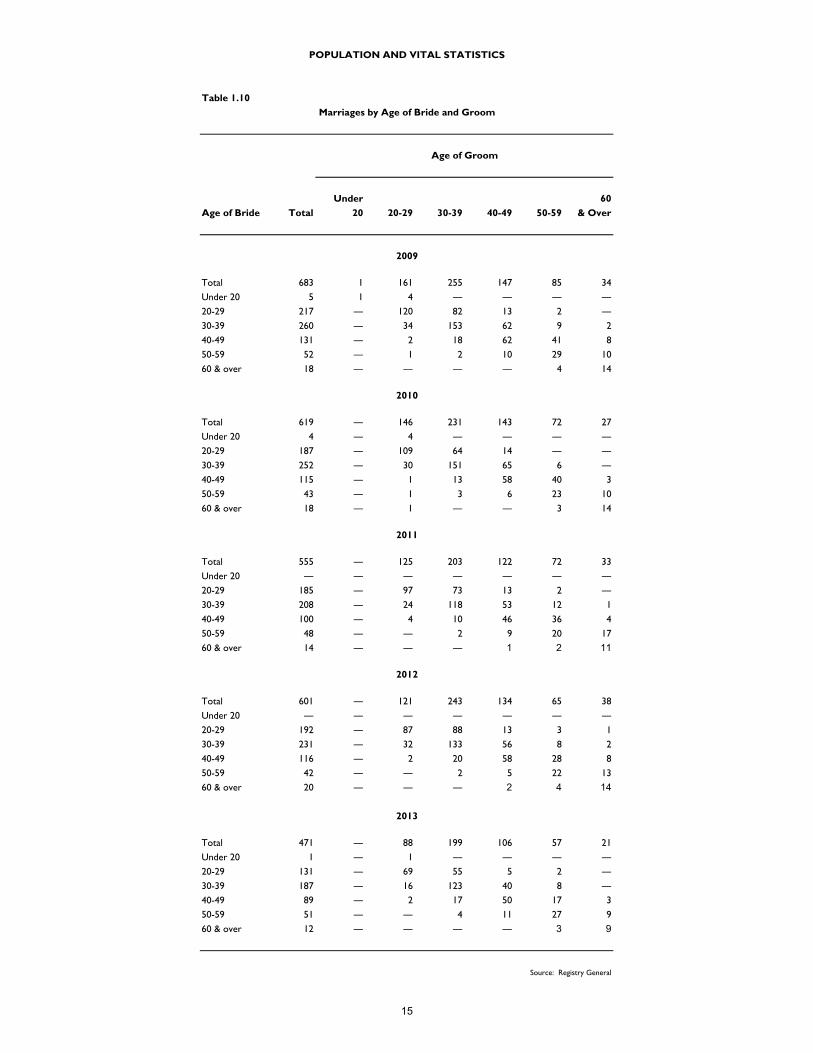
Table 1.10
Under 60
Age of Bride Total 20 20-29 30-39 40-49 50-59 & Over
Total 683 1 161 255 147 85 34
Under 20 5 1 4 ― ― ― ―
20-29 217 ― 120 82 13 2 ―
30-39 260 ― 34 153 62 9 2
40-49 131 ― 2 18 62 41 8
50-59 52 ― 1 2 10 29 10
60 & over 18 ― ― ― ― 4 14
Total 619 ― 146 231 143 72 27
Under 20 4 ― 4 ― ― ― ―
20-29 187 ― 109 64 14 ― ―
30-39 252 ― 30 151 65 6 ―
40-49 115 ― 1 13 58 40 3
50-59 43 ― 1 3 6 23 10
60 & over 18 ― 1 ― ― 3 14
Total 555 ― 125 203 122 72 33
Under 20 ― ― ― ― ― ― ―
20-29 185 ― 97 73 13 2 ―
30-39 208 ― 24 118 53 12 1
40-49 100 ― 4 10 46 36 4
50-59 48 ― ― 2 9 20 17
60 & over 14 ― ― ― 1 2 11
Total 601 ― 121 243 134 65 38
Under 20 ― ― ― ― ― ― ―
20-29 192 ― 87 88 13 3 1
30-39 231 ― 32 133 56 8 2
40-49 116 ― 2 20 58 28 8
50-59 42 ― ― 2 5 22 13
60 & over 20 ― ― ― 2 4 14
Total 471 ― 88 199 106 57 21
Under 20 1 ― 1 ― ― ― ―
20-29 131 ― 69 55 5 2 ―
30-39 187 ― 16 123 40 8 ―
40-49 89 ― 2 17 50 17 3
50-59 51 ― ― 4 11 27 9
60 & over 12 ― ― ― ― 3 9
Source: Registry General
2012
2013
2009
2010
2011
POPULATION AND VITAL STATISTICS
Marriages by Age of Bride and Groom
Age of Groom
15
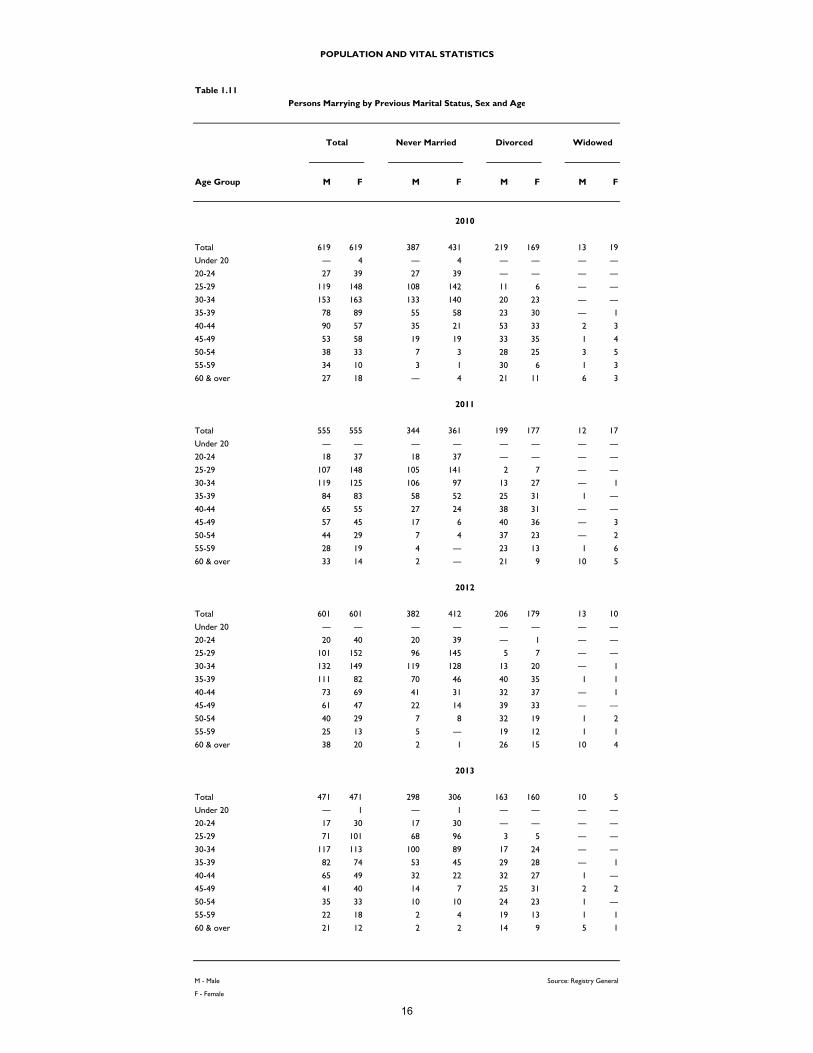
Table 1.11
Age Group M F M F M F M F
Total 619 619 387 431 219 169 13 19
Under 20 ― 4 ― 4 ― ― ― ―
20-24 27 39 27 39 ― ― ― ―
25-29 119 148 108 142 11 6 ― ―
30-34 153 163 133 140 20 23 ― ―
35-39 78 89 55 58 23 30 ― 1
40-44 90 57 35 21 53 33 2 3
45-49 53 58 19 19 33 35 1 4
50-54 38 33 7 3 28 25 3 5
55-59 34 10 3 1 30 6 1 3
60 & over 27 18 ― 4 21 11 6 3
Total 555 555 344 361 199 177 12 17
Under 20 ― ― ― ― ― ― ― ―
20-24 18 37 18 37 ― ― ― ―
25-29 107 148 105 141 2 7 ― ―
30-34 119 125 106 97 13 27 ― 1
35-39 84 83 58 52 25 31 1 ―
40-44 65 55 27 24 38 31 ― ―
45-49 57 45 17 6 40 36 ― 3
50-54 44 29 7 4 37 23 ― 2
55-59 28 19 4 ― 23 13 1 6
60 & over 33 14 2 ― 21 9 10 5
Total 601 601 382 412 206 179 13 10
Under 20 ― ― ― ― ― ― ― ―
20-24 20 40 20 39 ― 1 ― ―
25-29 101 152 96 145 5 7 ― ―
30-34 132 149 119 128 13 20 ― 1
35-39 111 82 70 46 40 35 1 1
40-44 73 69 41 31 32 37 ― 1
45-49 61 47 22 14 39 33 ― ―
50-54 40 29 7 8 32 19 1 2
55-59 25 13 5 ― 19 12 1 1
60 & over 38 20 2 1 26 15 10 4
Total 471 471 298 306 163 160 10 5
Under 20 ― 1 ― 1 ― ― ― ―
20-24 17 30 17 30 ― ― ― ―
25-29 71 101 68 96 3 5 ― ―
30-34 117 113 100 89 17 24 ― ―
35-39 82 74 53 45 29 28 ― 1
40-44 65 49 32 22 32 27 1 ―
45-49 41 40 14 7 25 31 2 2
50-54 35 33 10 10 24 23 1 ―
55-59 22 18 2 4 19 13 1 1
60 & over 21 12 2 2 14 9 5 1
M - Male Source: Registry General
F - Female
2011
2012
2013
2010
POPULATION AND VITAL STATISTICS
Persons Marrying by Previous Marital Status, Sex and Age
Total Never Married Divorced Widowed
16
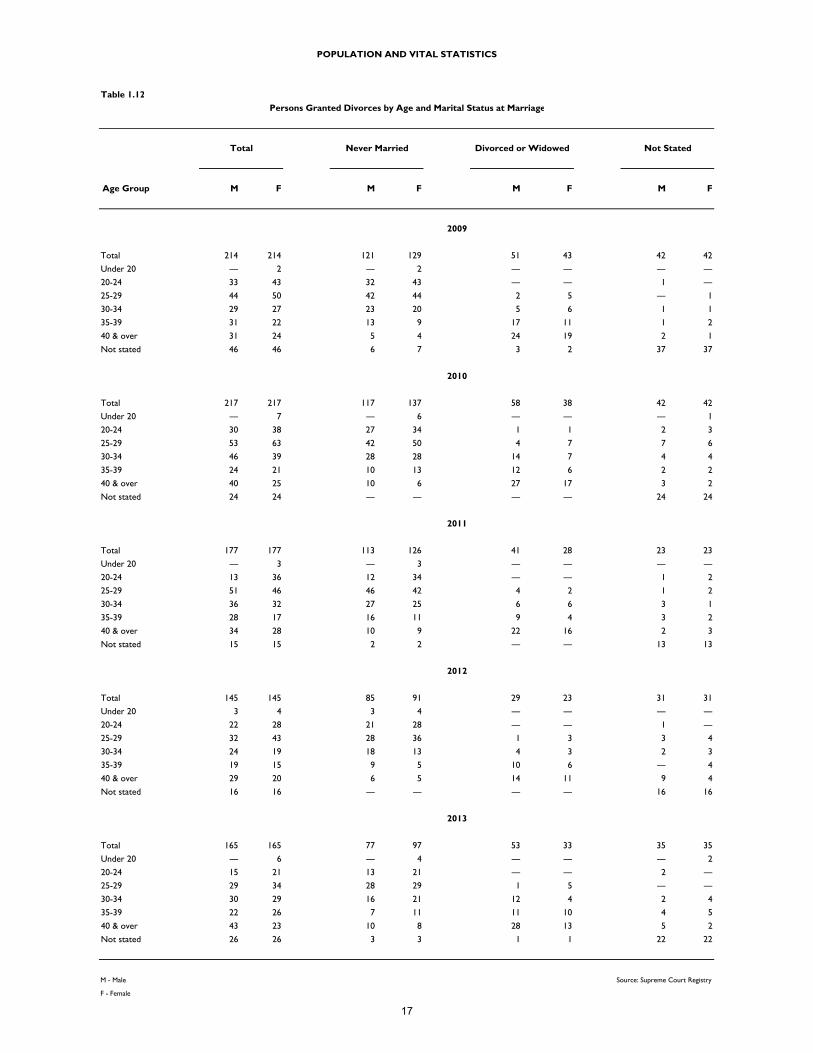
Table 1.12
Age Group M F M F M F M F
Total 214 214 121 129 51 43 42 42
Under 20 ― 2 ― 2 ― ― ― ―
20-24 33 43 32 43 ― ― 1 ―
25-29 44 50 42 44 2 5 ― 1
30-34 29 27 23 20 5 6 1 1
35-39 31 22 13 9 17 11 1 2
40 & over 31 24 5 4 24 19 2 1
Not stated 46 46 6 7 3 2 37 37
Total 217 217 117 137 58 38 42 42
Under 20 ― 7 ― 6 ― ― ― 1
20-24 30 38 27 34 1 1 2 3
25-29 53 63 42 50 4 7 7 6
30-34 46 39 28 28 14 7 4 4
35-39 24 21 10 13 12 6 2 2
40 & over 40 25 10 6 27 17 3 2
Not stated 24 24 ― ― ― ― 24 24
Total 177 177 113 126 41 28 23 23
Under 20 ― 3 ― 3 ― ― ― ―
20-24 13 36 12 34 ― ― 1 2
25-29 51 46 46 42 4 2 1 2
30-34 36 32 27 25 6 6 3 1
35-39 28 17 16 11 9 4 3 2
40 & over 34 28 10 9 22 16 2 3
Not stated 15 15 2 2 ― ― 13 13
Total 145 145 85 91 29 23 31 31
Under 20 3 4 3 4 ― ― ― ―
20-24 22 28 21 28 ― ― 1 ―
25-29 32 43 28 36 1 3 3 4
30-34 24 19 18 13 4 3 2 3
35-39 19 15 9 5 10 6 ― 4
40 & over 29 20 6 5 14 11 9 4
Not stated 16 16 ― ― ― ― 16 16
Total 165 165 77 97 53 33 35 35
Under 20 ― 6 ― 4 ― ― ― 2
20-24 15 21 13 21 ― ― 2 ―
25-29 29 34 28 29 1 5 ― ―
30-34 30 29 16 21 12 4 2 4
35-39 22 26 7 11 11 10 4 5
40 & over 43 23 10 8 28 13 5 2
Not stated 26 26 3 3 1 1 22 22
M - Male Source: Supreme Court Registry
F - Female
2009
2010
2011
2012
2013
POPULATION AND VITAL STATISTICS
Persons Granted Divorces by Age and Marital Status at Marriage
Total Never Married Divorced or Widowed Not Stated
17
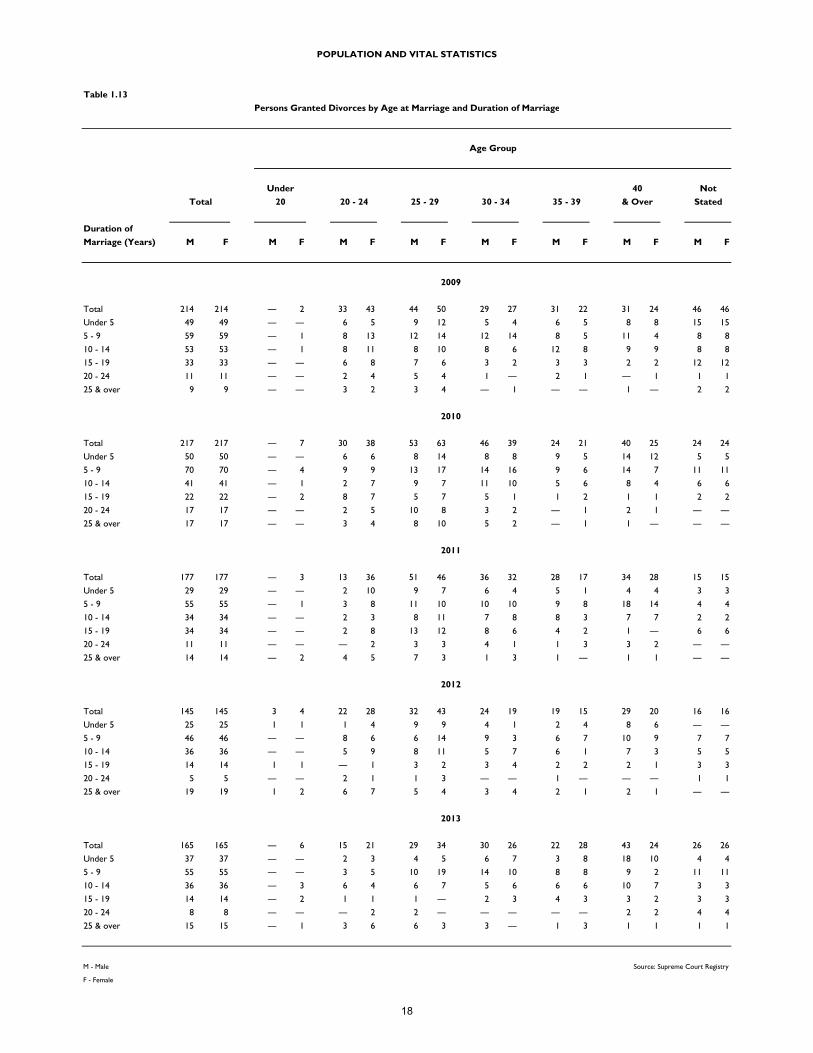
Table 1.13
Not
Total Stated
Duration of
Marriage (Years) M F M F M F M F M F M F M F M F
Total 214 214 ― 2 33 43 44 50 29 27 31 22 31 24 46 46
Under 5 49 49 ― ― 6 5 9 12 5 4 6 5 8 8 15 15
5 - 9 59 59 ― 1 8 13 12 14 12 14 8 5 11 4 8 8
10 - 14 53 53 ― 1 8 11 8 10 8 6 12 8 9 9 8 8
15 - 19 33 33 ― ― 6 8 7 6 3 2 3 3 2 2 12 12
20 - 24 11 11 ― ― 2 4 5 4 1 ― 2 1 ― 1 1 1
25 & over 9 9 ― ― 3 2 3 4 ― 1 ― ― 1 ― 2 2
Total 217 217 ― 7 30 38 53 63 46 39 24 21 40 25 24 24
Under 5 50 50 ― ― 6 6 8 14 8 8 9 5 14 12 5 5
5 - 9 70 70 ― 4 9 9 13 17 14 16 9 6 14 7 11 11
10 - 14 41 41 ― 1 2 7 9 7 11 10 5 6 8 4 6 6
15 - 19 22 22 ― 2 8 7 5 7 5 1 1 2 1 1 2 2
20 - 24 17 17 ― ― 2 5 10 8 3 2 ― 1 2 1 ― ―
25 & over 17 17 ― ― 3 4 8 10 5 2 ― 1 1 ― ― ―
Total 177 177 ― 3 13 36 51 46 36 32 28 17 34 28 15 15
Under 5 29 29 ― ― 2 10 9 7 6 4 5 1 4 4 3 3
5 - 9 55 55 ― 1 3 8 11 10 10 10 9 8 18 14 4 4
10 - 14 34 34 ― ― 2 3 8 11 7 8 8 3 7 7 2 2
15 - 19 34 34 ― ― 2 8 13 12 8 6 4 2 1 ― 6 6
20 - 24 11 11 ― ― ― 2 3 3 4 1 1 3 3 2 ― ―
25 & over 14 14 ― 2 4 5 7 3 1 3 1 ― 1 1 ― ―
Total 145 145 3 4 22 28 32 43 24 19 19 15 29 20 16 16
Under 5 25 25 1 1 1 4 9 9 4 1 2 4 8 6 ― ―
5 - 9 46 46 ― ― 8 6 6 14 9 3 6 7 10 9 7 7
10 - 14 36 36 ― ― 5 9 8 11 5 7 6 1 7 3 5 5
15 - 19 14 14 1 1 ― 1 3 2 3 4 2 2 2 1 3 3
20 - 24 5 5 ― ― 2 1 1 3 ― ― 1 ― ― ― 1 1
25 & over 19 19 1 2 6 7 5 4 3 4 2 1 2 1 ― ―
Total 165 165 ― 6 15 21 29 34 30 26 22 28 43 24 26 26
Under 5 37 37 ― ― 2 3 4 5 6 7 3 8 18 10 4 4
5 - 9 55 55 ― ― 3 5 10 19 14 10 8 8 9 2 11 11
10 - 14 36 36 ― 3 6 4 6 7 5 6 6 6 10 7 3 3
15 - 19 14 14 ― 2 1 1 1 ― 2 3 4 3 3 2 3 3
20 - 24 8 8 ― ― ― 2 2 ― ― ― ― ― 2 2 4 4
25 & over 15 15 ― 1 3 6 6 3 3 ― 1 3 1 1 1 1
M - Male Source: Supreme Court Registry
F - Female
2012
2013
& Over20 20 - 24 25 - 29 30 - 34 35 - 39
2009
2010
2011
POPULATION AND VITAL STATISTICS
Persons Granted Divorces by Age at Marriage and Duration of Marriage
Age Group
Under 40
18
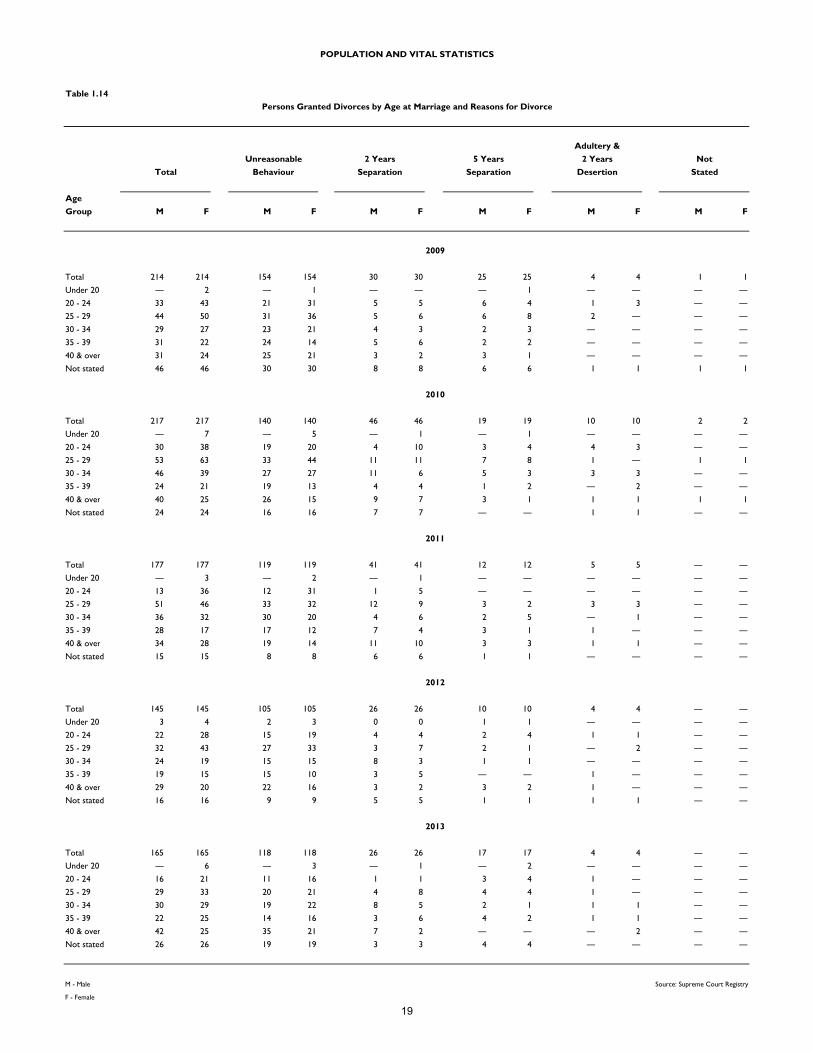
Table 1.14
Age
Group M F M F M F M F M F M F
Total 214 214 154 154 30 30 25 25 4 4 1 1
Under 20 ― 2 ― 1 ― ― ― 1 ― ― ― ―
20 - 24 33 43 21 31 5 5 6 4 1 3 ― ―
25 - 29 44 50 31 36 5 6 6 8 2 ― ― ―
30 - 34 29 27 23 21 4 3 2 3 ― ― ― ―
35 - 39 31 22 24 14 5 6 2 2 ― ― ― ―
40 & over 31 24 25 21 3 2 3 1 ― ― ― ―
Not stated 46 46 30 30 8 8 6 6 1 1 1 1
Total 217 217 140 140 46 46 19 19 10 10 2 2
Under 20 ― 7 ― 5 ― 1 ― 1 ― ― ― ―
20 - 24 30 38 19 20 4 10 3 4 4 3 ― ―
25 - 29 53 63 33 44 11 11 7 8 1 ― 1 1
30 - 34 46 39 27 27 11 6 5 3 3 3 ― ―
35 - 39 24 21 19 13 4 4 1 2 ― 2 ― ―
40 & over 40 25 26 15 9 7 3 1 1 1 1 1
Not stated 24 24 16 16 7 7 ― ― 1 1 ― ―
Total 177 177 119 119 41 41 12 12 5 5 ― ―
Under 20 ― 3 ― 2 ― 1 ― ― ― ― ― ―
20 - 24 13 36 12 31 1 5 ― ― ― ― ― ―
25 - 29 51 46 33 32 12 9 3 2 3 3 ― ―
30 - 34 36 32 30 20 4 6 2 5 ― 1 ― ―
35 - 39 28 17 17 12 7 4 3 1 1 ― ― ―
40 & over 34 28 19 14 11 10 3 3 1 1 ― ―
Not stated 15 15 8 8 6 6 1 1 ― ― ― ―
Total 145 145 105 105 26 26 10 10 4 4 ― ―
Under 20 3 4 2 3 0 0 1 1 ― ― ― ―
20 - 24 22 28 15 19 4 4 2 4 1 1 ― ―
25 - 29 32 43 27 33 3 7 2 1 ― 2 ― ―
30 - 34 24 19 15 15 8 3 1 1 ― ― ― ―
35 - 39 19 15 15 10 3 5 ― ― 1 ― ― ―
40 & over 29 20 22 16 3 2 3 2 1 ― ― ―
Not stated 16 16 9 9 5 5 1 1 1 1 ― ―
Total 165 165 118 118 26 26 17 17 4 4 ― ―
Under 20 ― 6 ― 3 ― 1 ― 2 ― ― ― ―
20 - 24 16 21 11 16 1 1 3 4 1 ― ― ―
25 - 29 29 33 20 21 4 8 4 4 1 ― ― ―
30 - 34 30 29 19 22 8 5 2 1 1 1 ― ―
35 - 39 22 25 14 16 3 6 4 2 1 1 ― ―
40 & over 42 25 35 21 7 2 ― ― ― 2 ― ―
Not stated 26 26 19 19 3 3 4 4 ― ― ― ―
M - Male Source: Supreme Court Registry
F - Female
2009
2010
2011
2012
2013
Total Behaviour Separation Separation Desertion Stated
POPULATION AND VITAL STATISTICS
Persons Granted Divorces by Age at Marriage and Reasons for Divorce
Adultery &
Unreasonable 2 Years 5 Years 2 Years Not
19
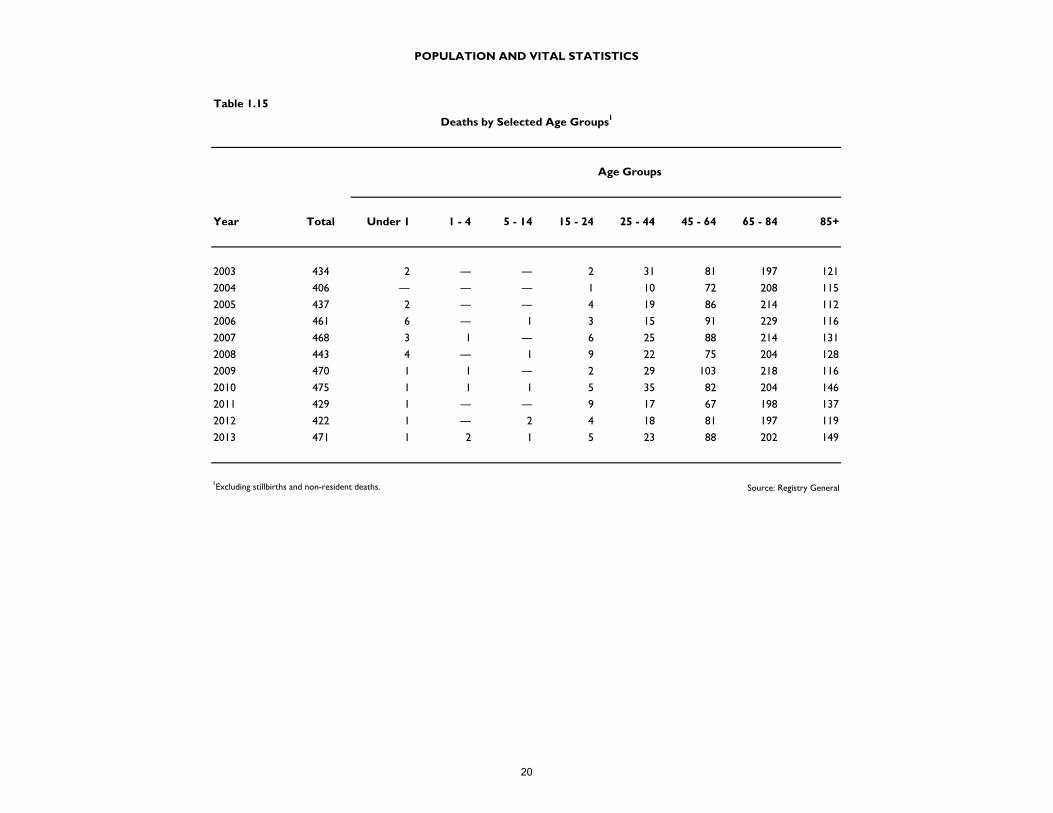
Table 1.15
Age Groups
Year Total Under 1 1 - 4 5 - 14 15 - 24 25 - 44 45 - 64 65 - 84 85+
2003 434 2 ― ― 2 31 81 197 121
2004 406 ― ― ― 1 10 72 208 115
2005 437 2 ― ― 4 19 86 214 112
2006 461 6 ― 1 3 15 91 229 116
2007 468 3 1 ― 6 25 88 214 131
2008 443 4 ― 1 9 22 75 204 128
2009 470 1 1 ― 2 29 103 218 116
2010 475 1 1 1 5 35 82 204 146
2011 429 1 ― ― 9 17 67 198 137
2012 422 1 ― 2 4 18 81 197 119
2013 471 1 2 1 5 23 88 202 149
1Excluding stillbirths and non-resident deaths. Source: Registry General
POPULATION AND VITAL STATISTICS
Deaths by Selected Age Groups1
20
Section II
Education
2013 Quick Facts
Total school enrolment: 9,831
Government schools: 5,384
Private schools: 3,275
Bermuda College: 1,172
21

Bermuda’s Strides to Improve Public Education
Since the review of Bermuda’s public schools in 20071, Bermuda’s public school system has
identified seven strategic priorities to be implemented between 2010 and 2015 to improve the
quality of public education and achieve strategic student outcomes. 2 In order to position
students to compete academically both locally and globally, the Department of Education
adopted the Cambridge International Examinations Curriculum in 2010.2
School Enrolment at Record Low
Total school enrolment in Bermuda stood at 9,831 students in 2013 (Table 2.1), the lowest
since data was captured in the first edition of the Digest of Statistics released in 1973. A long
trend of declining birth rates, a recent increase in emigration and a shift towards pre-tertiary
students studying overseas are all potential contributory factors that has led to this record
low.3 As students enroled at tutorial sites (e.g. home schools) and General Education Diploma
(GED) programmes are excluded from the enrolment tables, it is possible that an increase in
enrolment in alternative learning programmes could also be a factor for declining enrolment.
Proportion Enroled in Private Schools Increases
For students enroled below the tertiary level, 64% attended Government schools in 2003
compared to 62% in 2013, indicating a 2 percentage point increase in the proportion of private
school enrolment over the period (Figure 1). Proportional increases in private school
enrolment occurred at each of the primary, middle and secondary school levels.
Enrolment within public schools declined by 1,069 students (17%) between 2003 and 2013
(Table 2.1). Private school enrolment also declined (338 students or 9%) but not by the same
extent. In comparison to the eleven-year average, Government school enrolment in 2013 was
lower by 431 students and private school enrolment was lower by 251 students.
Primary, Middle and Secondary School Enrolment on the Decline
The decrease in primary school enrolment from 2003 to 2013 was 716 students (15%), as
shown by Figure 2. Government primary school enrolment represented 71% (509 students) of
this overall decline. The fall in Government primary school enrolment over the period
outpaced the decline in private primary school enrolment by 4 percentage points, at 16% and
12%, respectively.
Middle school enrolment declined by 365 students (16%) over the eleven-year period (Figure
3). Government middle school enrolment contributed towards 77% (281 students) of this
overall decline. The drop in Government middle school enrolment over the period exceeded
the decline in private middle school enrolment by 11 percentage points, at 20% and 9%,
respectively.
Secondary school enrolment declined by 292 students (12%) between 2003 and 2013 (Figure
4). Government secondary school enrolment represented 84% (245 students) of this overall
decline. The reduction in public secondary school enrolment over the period surpassed the
decline in private secondary school enrolment by 11 percentage points, at 16% and 5%,
respectively.
1 Hopkins et al., Review of Public Education in Bermuda, 2007
2 Ministry of Education, Blueprint for Reform in Education: Bermuda Public School System Strategic Plan 2010-2015
3 Based on data contained within the Department of Statistics’ Facts & Figures, Emigration: Bermuda’s Qualified
Human Capital Departs and 2000 & 2010 Census data.
22
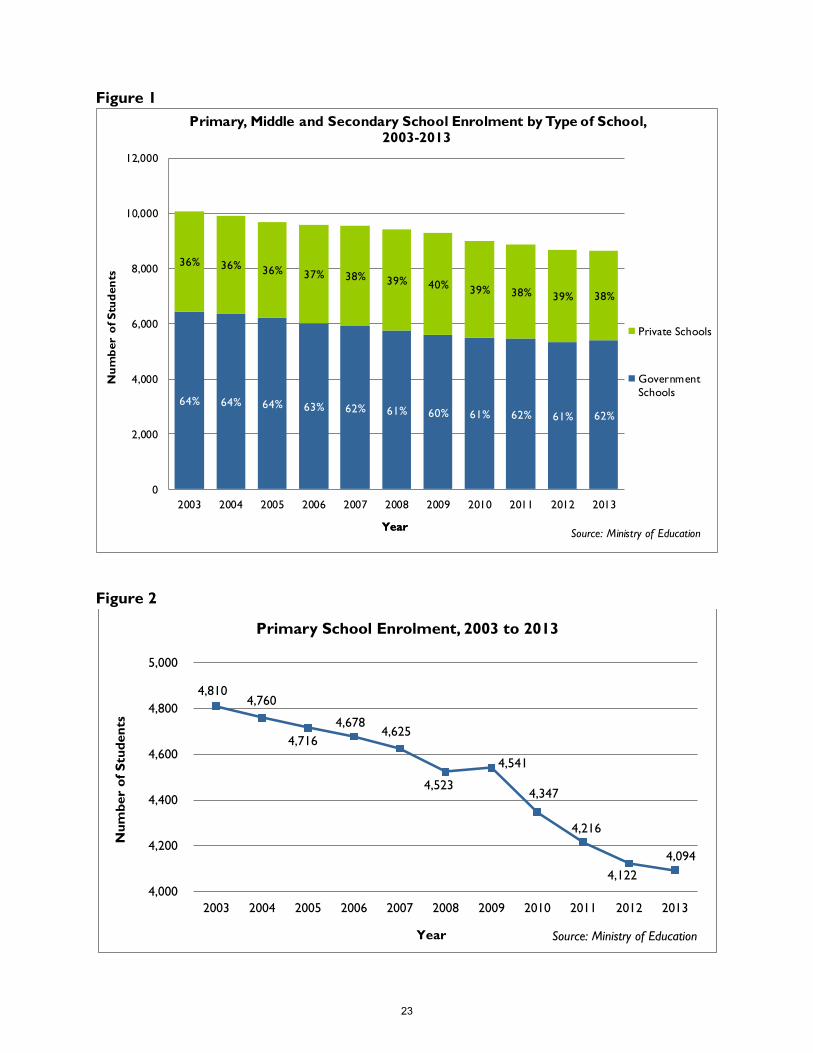
Figure 1
Figure 2
64% 64% 64% 63% 62% 61% 60% 61% 62% 61% 62%
36% 36% 36% 37% 38% 39% 40% 39% 38% 39% 38%
0
2,000
4,000
6,000
8,000
10,000
12,000
2003 2004 2005 2006 2007 2008 2009 2010 2011 2012 2013
Primary, Middle and Secondary School Enrolment by Type of School, 2003-2013
Private Schools
Government
Schools
YearSource: Ministry of Education
Year
Nu
mb
er o
f S
tud
en
ts
4,810 4,760
4,716
4,678 4,625
4,523
4,541
4,347
4,216
4,122
4,094
4,000
4,200
4,400
4,600
4,800
5,000
2003 2004 2005 2006 2007 2008 2009 2010 2011 2012 2013
Primary School Enrolment, 2003 to 2013
Year
Nu
mb
er
of
Stu
den
ts
Source: Ministry of Education
23
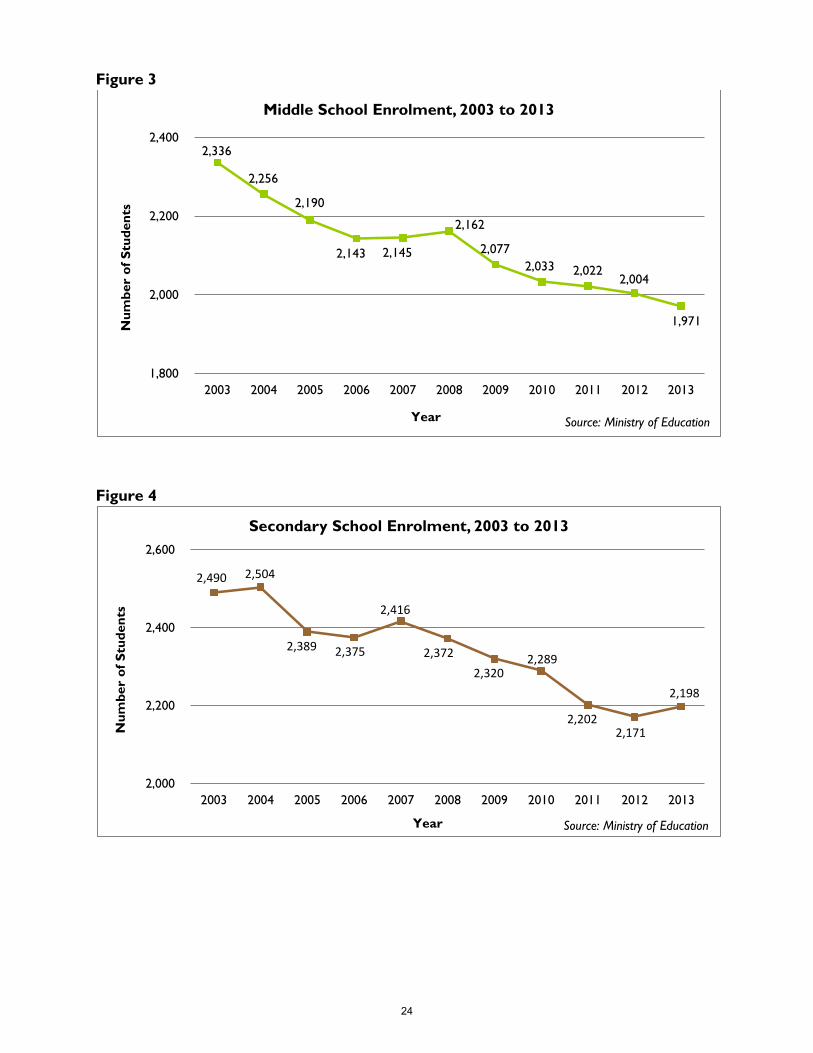
Figure 3
Figure 4
2,336
2,256
2,190
2,143 2,145
2,162
2,077
2,033 2,022 2,004
1,971
1,800
2,000
2,200
2,400
2003 2004 2005 2006 2007 2008 2009 2010 2011 2012 2013
Middle School Enrolment, 2003 to 2013 N
um
ber
of
Stu
den
ts
Year Source: Ministry of Education
2,490 2,504
2,389 2,375
2,416
2,372
2,320 2,289
2,202 2,171
2,198
2,000
2,200
2,400
2,600
2003 2004 2005 2006 2007 2008 2009 2010 2011 2012 2013
Secondary School Enrolment, 2003 to 2013
Nu
mb
er
of
Stu
den
ts
Year Source: Ministry of Education
24
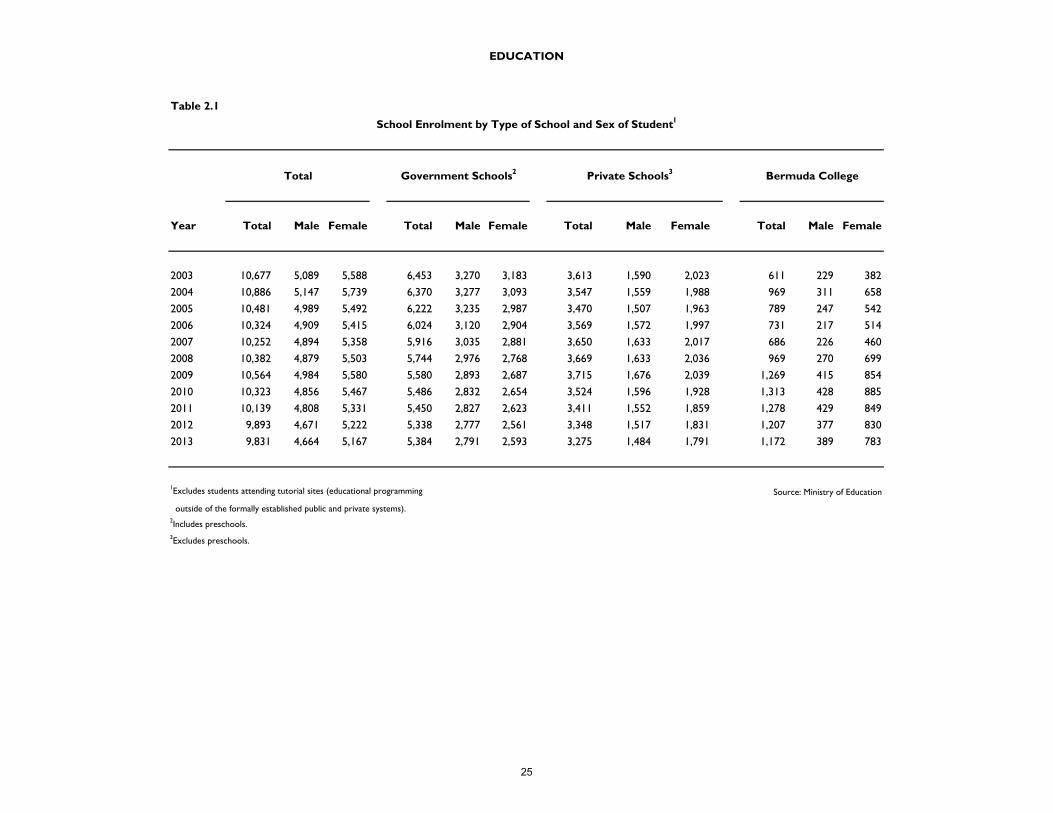
Table 2.1
Year Total Male Female Total Male Female Total Male Female Total Male Female
2003 10,677 5,089 5,588 6,453 3,270 3,183 3,613 1,590 2,023 611 229 382
2004 10,886 5,147 5,739 6,370 3,277 3,093 3,547 1,559 1,988 969 311 658
2005 10,481 4,989 5,492 6,222 3,235 2,987 3,470 1,507 1,963 789 247 542
2006 10,324 4,909 5,415 6,024 3,120 2,904 3,569 1,572 1,997 731 217 514
2007 10,252 4,894 5,358 5,916 3,035 2,881 3,650 1,633 2,017 686 226 460
2008 10,382 4,879 5,503 5,744 2,976 2,768 3,669 1,633 2,036 969 270 699
2009 10,564 4,984 5,580 5,580 2,893 2,687 3,715 1,676 2,039 1,269 415 854
2010 10,323 4,856 5,467 5,486 2,832 2,654 3,524 1,596 1,928 1,313 428 885
2011 10,139 4,808 5,331 5,450 2,827 2,623 3,411 1,552 1,859 1,278 429 849
2012 9,893 4,671 5,222 5,338 2,777 2,561 3,348 1,517 1,831 1,207 377 830
2013 9,831 4,664 5,167 5,384 2,791 2,593 3,275 1,484 1,791 1,172 389 783
1Excludes students attending tutorial sites (educational programming Source: Ministry of Education
outside of the formally established public and private systems).2Includes preschools.3Excludes preschools.
EDUCATION
School Enrolment by Type of School and Sex of Student1
Total Government Schools2 Private Schools3 Bermuda College
25
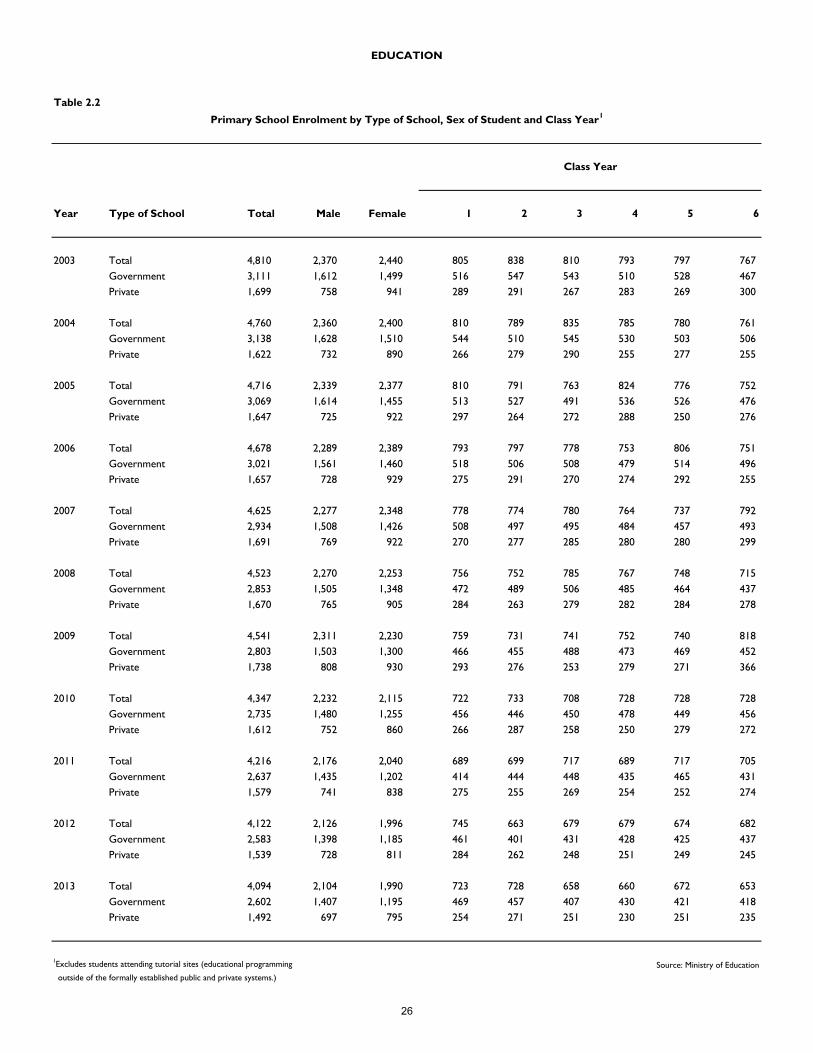
Table 2.2
Year Type of School Total Male Female 1 2 3 4 5 6
2003 Total 4,810 2,370 2,440 805 838 810 793 797 767 Government 3,111 1,612 1,499 516 547 543 510 528 467 Private 1,699 758 941 289 291 267 283 269 300
2004 Total 4,760 2,360 2,400 810 789 835 785 780 761 Government 3,138 1,628 1,510 544 510 545 530 503 506 Private 1,622 732 890 266 279 290 255 277 255
2005 Total 4,716 2,339 2,377 810 791 763 824 776 752 Government 3,069 1,614 1,455 513 527 491 536 526 476 Private 1,647 725 922 297 264 272 288 250 276
2006 Total 4,678 2,289 2,389 793 797 778 753 806 751 Government 3,021 1,561 1,460 518 506 508 479 514 496 Private 1,657 728 929 275 291 270 274 292 255
2007 Total 4,625 2,277 2,348 778 774 780 764 737 792 Government 2,934 1,508 1,426 508 497 495 484 457 493 Private 1,691 769 922 270 277 285 280 280 299
2008 Total 4,523 2,270 2,253 756 752 785 767 748 715 Government 2,853 1,505 1,348 472 489 506 485 464 437 Private 1,670 765 905 284 263 279 282 284 278
2009 Total 4,541 2,311 2,230 759 731 741 752 740 818 Government 2,803 1,503 1,300 466 455 488 473 469 452 Private 1,738 808 930 293 276 253 279 271 366
2010 Total 4,347 2,232 2,115 722 733 708 728 728 728 Government 2,735 1,480 1,255 456 446 450 478 449 456 Private 1,612 752 860 266 287 258 250 279 272
2011 Total 4,216 2,176 2,040 689 699 717 689 717 705 Government 2,637 1,435 1,202 414 444 448 435 465 431 Private 1,579 741 838 275 255 269 254 252 274
2012 Total 4,122 2,126 1,996 745 663 679 679 674 682Government 2,583 1,398 1,185 461 401 431 428 425 437Private 1,539 728 811 284 262 248 251 249 245
2013 Total 4,094 2,104 1,990 723 728 658 660 672 653Government 2,602 1,407 1,195 469 457 407 430 421 418Private 1,492 697 795 254 271 251 230 251 235
1Excludes students attending tutorial sites (educational programming Source: Ministry of Education
outside of the formally established public and private systems.)
EDUCATION
Primary School Enrolment by Type of School, Sex of Student and Class Year1
Class Year
26
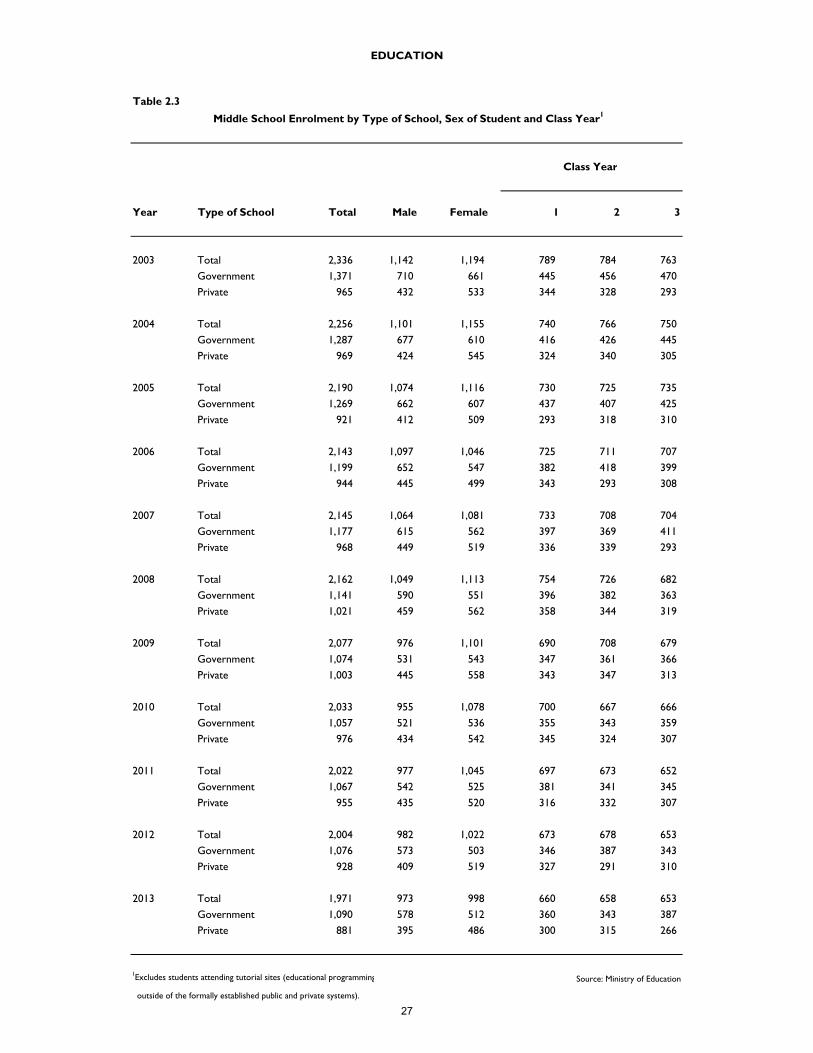
Table 2.3
Class Year
Year Type of School Total Male Female 1 2 3
2003 Total 2,336 1,142 1,194 789 784 763
Government 1,371 710 661 445 456 470
Private 965 432 533 344 328 293
2004 Total 2,256 1,101 1,155 740 766 750
Government 1,287 677 610 416 426 445
Private 969 424 545 324 340 305
2005 Total 2,190 1,074 1,116 730 725 735
Government 1,269 662 607 437 407 425
Private 921 412 509 293 318 310
2006 Total 2,143 1,097 1,046 725 711 707
Government 1,199 652 547 382 418 399
Private 944 445 499 343 293 308
2007 Total 2,145 1,064 1,081 733 708 704
Government 1,177 615 562 397 369 411
Private 968 449 519 336 339 293
2008 Total 2,162 1,049 1,113 754 726 682
Government 1,141 590 551 396 382 363
Private 1,021 459 562 358 344 319
2009 Total 2,077 976 1,101 690 708 679
Government 1,074 531 543 347 361 366
Private 1,003 445 558 343 347 313
2010 Total 2,033 955 1,078 700 667 666
Government 1,057 521 536 355 343 359
Private 976 434 542 345 324 307
2011 Total 2,022 977 1,045 697 673 652
Government 1,067 542 525 381 341 345
Private 955 435 520 316 332 307
2012 Total 2,004 982 1,022 673 678 653
Government 1,076 573 503 346 387 343
Private 928 409 519 327 291 310
2013 Total 1,971 973 998 660 658 653
Government 1,090 578 512 360 343 387
Private 881 395 486 300 315 266
1Excludes students attending tutorial sites (educational programming Source: Ministry of Education
outside of the formally established public and private systems).
EDUCATION
Middle School Enrolment by Type of School, Sex of Student and Class Year1
27
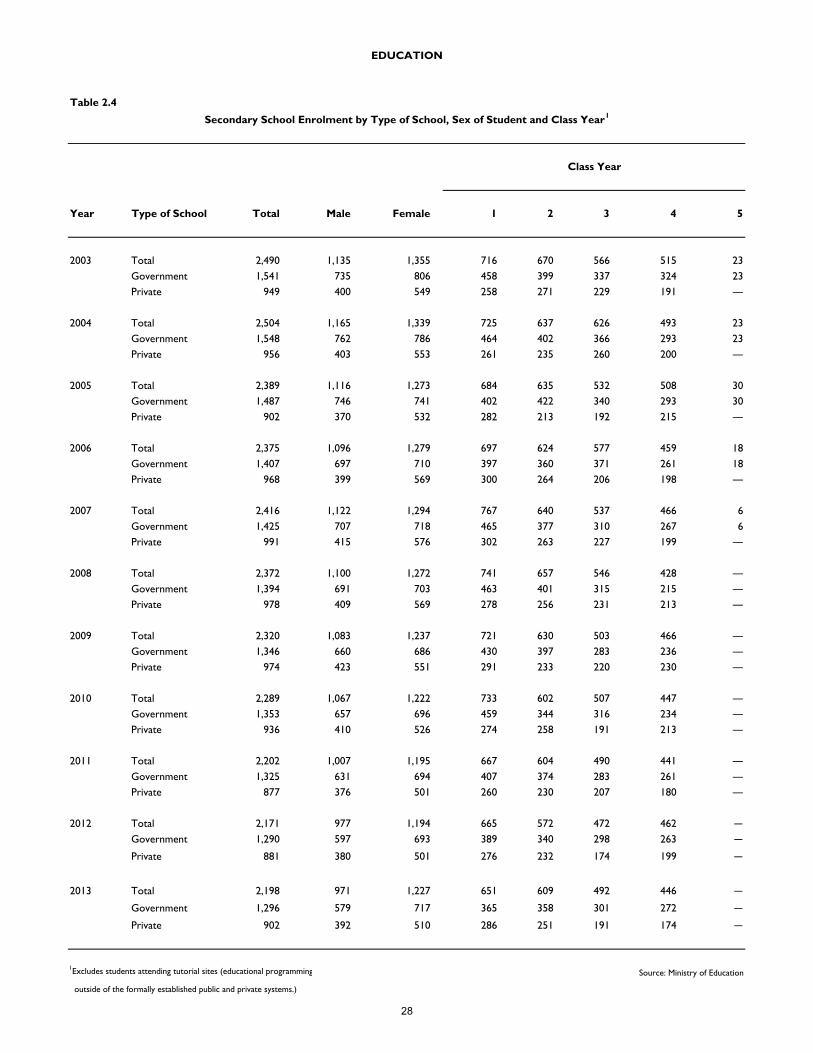
Table 2.4
Year Type of School Total Male Female 1 2 3 4 5
2003 Total 2,490 1,135 1,355 716 670 566 515 23Government 1,541 735 806 458 399 337 324 23Private 949 400 549 258 271 229 191 ―
2004 Total 2,504 1,165 1,339 725 637 626 493 23Government 1,548 762 786 464 402 366 293 23Private 956 403 553 261 235 260 200 ―
2005 Total 2,389 1,116 1,273 684 635 532 508 30Government 1,487 746 741 402 422 340 293 30Private 902 370 532 282 213 192 215 ―
2006 Total 2,375 1,096 1,279 697 624 577 459 18Government 1,407 697 710 397 360 371 261 18Private 968 399 569 300 264 206 198 ―
2007 Total 2,416 1,122 1,294 767 640 537 466 6Government 1,425 707 718 465 377 310 267 6Private 991 415 576 302 263 227 199 ―
2008 Total 2,372 1,100 1,272 741 657 546 428 ―
Government 1,394 691 703 463 401 315 215 ―
Private 978 409 569 278 256 231 213 ―
2009 Total 2,320 1,083 1,237 721 630 503 466 ―
Government 1,346 660 686 430 397 283 236 ―
Private 974 423 551 291 233 220 230 ―
2010 Total 2,289 1,067 1,222 733 602 507 447 ―
Government 1,353 657 696 459 344 316 234 ―
Private 936 410 526 274 258 191 213 ―
2011 Total 2,202 1,007 1,195 667 604 490 441 ―
Government 1,325 631 694 407 374 283 261 ―
Private 877 376 501 260 230 207 180 ―
2012 Total 2,171 977 1,194 665 572 472 462 ―
Government 1,290 597 693 389 340 298 263 ―
Private 881 380 501 276 232 174 199 ―
2013 Total 2,198 971 1,227 651 609 492 446 ―
Government 1,296 579 717 365 358 301 272 ―
Private 902 392 510 286 251 191 174 ―
1Excludes students attending tutorial sites (educational programming Source: Ministry of Education
outside of the formally established public and private systems.)
EDUCATION
Secondary School Enrolment by Type of School, Sex of Student and Class Year1
Class Year
28
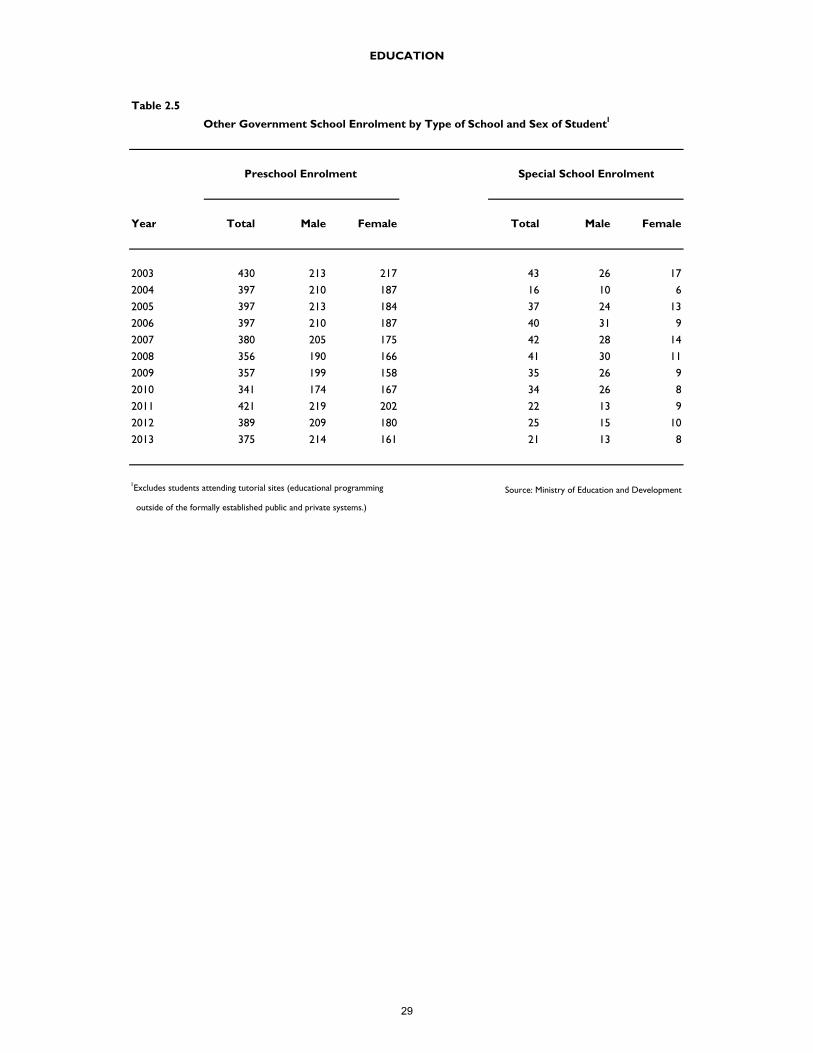
Table 2.5
Year Total Male Female Total Male Female
2003 430 213 217 43 26 17
2004 397 210 187 16 10 6
2005 397 213 184 37 24 13
2006 397 210 187 40 31 9
2007 380 205 175 42 28 14
2008 356 190 166 41 30 11
2009 357 199 158 35 26 9
2010 341 174 167 34 26 8
2011 421 219 202 22 13 9
2012 389 209 180 25 15 10
2013 375 214 161 21 13 8
1Excludes students attending tutorial sites (educational programming Source: Ministry of Education and Development
outside of the formally established public and private systems.)
EDUCATION
Other Government School Enrolment by Type of School and Sex of Student1
Preschool Enrolment Special School Enrolment
29
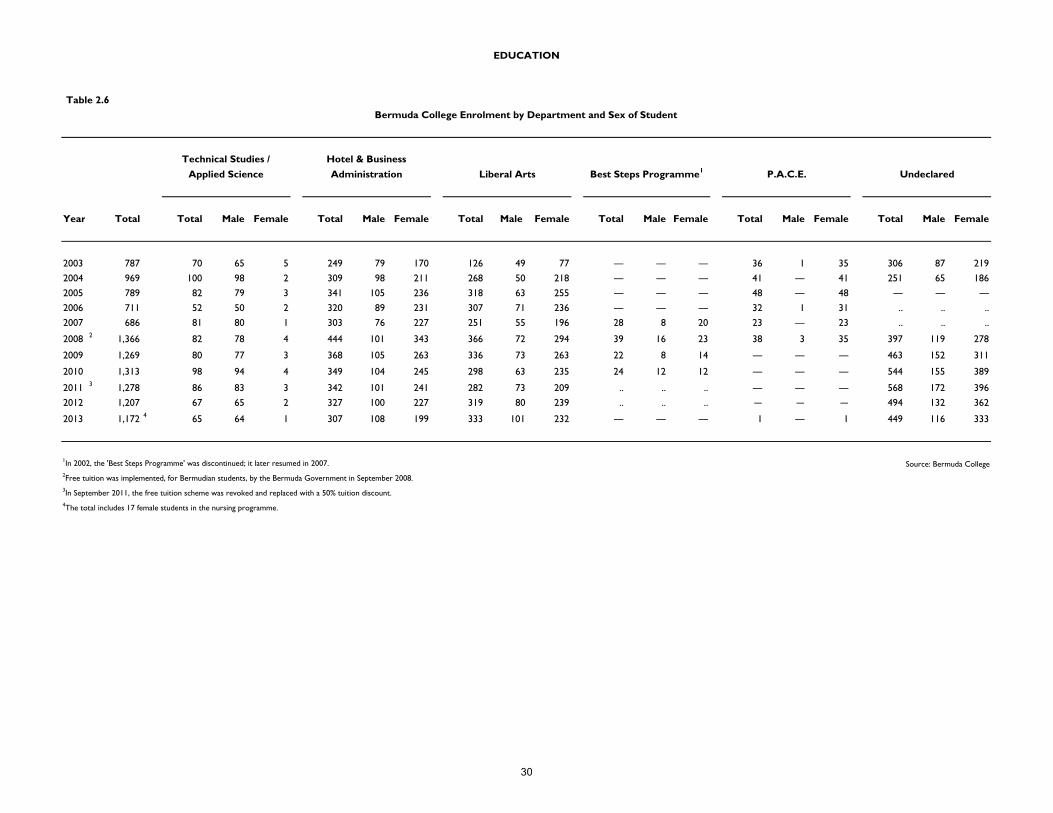
Table 2.6
Year Total Total Male Female Total Male Female Total Male Female Total Male Female Total Male Female Total Male Female
2003 787 70 65 5 249 79 170 126 49 77 ― ― ― 36 1 35 306 87 219
2004 969 100 98 2 309 98 211 268 50 218 ― ― ― 41 ― 41 251 65 186
2005 789 82 79 3 341 105 236 318 63 255 ― ― ― 48 ― 48 ― ― ―
2006 711 52 50 2 320 89 231 307 71 236 ― ― ― 32 1 31 .. .. ..
2007 686 81 80 1 303 76 227 251 55 196 28 8 20 23 ― 23 .. .. ..
2008 2 1,366 82 78 4 444 101 343 366 72 294 39 16 23 38 3 35 397 119 278
2009 1,269 80 77 3 368 105 263 336 73 263 22 8 14 ― ― ― 463 152 311
2010 1,313 98 94 4 349 104 245 298 63 235 24 12 12 ― ― ― 544 155 389
2011 3 1,278 86 83 3 342 101 241 282 73 209 .. .. .. ― ― ― 568 172 396
2012 1,207 67 65 2 327 100 227 319 80 239 .. .. .. ― ― ― 494 132 362
2013 1,172 4 65 64 1 307 108 199 333 101 232 ― ― ― 1 ― 1 449 116 333
1In 2002, the 'Best Steps Programme' was discontinued; it later resumed in 2007. Source: Bermuda College2Free tuition was implemented, for Bermudian students, by the Bermuda Government in September 2008.3In September 2011, the free tuition scheme was revoked and replaced with a 50% tuition discount.4The total includes 17 female students in the nursing programme.
EDUCATION
Bermuda College Enrolment by Department and Sex of Student
Technical Studies /
Applied Science
Hotel & Business
Administration Liberal Arts Best Steps Programme1 P.A.C.E. Undeclared
30
Section III
Health
2013 Quick Facts
Reported Sexually Transmitted
Infections (STI): 449
Persons Aged 20 to 29 infected
with STI: 177 (39%)
Persons Infected with Chlamydia:
322 (72%)
31
Sexually Transmitted Infections Down Since 2006 As reported by the World Health Organization, worldwide “more than 1 million people
acquire a sexually transmitted infection (STI) every day.” 1 The total number of sexually
transmitted infections (STI’s) reported in Bermuda in 2013 declined by 180 persons (29%) since
2006 (Figure 1). When analyzing the total number of cases by age group, persons between the
ages of 20 to 29 years old comprised 53% of the total in 2006 in comparison to 39% in 2013, a
decline of 14 percentage points. This was offset by an increase of 14 percentage points during
the same period for persons aged 30 years and older with an STI (Table 3.2).
Proportion of Herpes Infections Quadruples
Worldwide, approximately 500 million people contract chlamydia, gonorrhea, syphilis or
trichomoniasis annually.1 Figure 2 displays a comparison between the proportions of each
sexually transmitted infection contracted in 2006 and 2013 for the island. The only categories
that had an increase in their proportions over the period were herpes and syphilis, which
increased by twelve percentage points and one percentage point, respectively. Nearly seven out
of ten persons infected with herpes in 2013 were female. In contrast, more than seven out of
every ten persons infected with syphilis in 2013 were male (Table 3.2).
Chlamydia Remains the Most Reported Sexually Transmitted Infection in 2013
According to the Centers for Disease Control and Prevention, “chlamydia is the most
commonly reported STD in the United States.”2 In Bermuda, chlamydia has been the leading
reported sexually transmitted infection since 2006. However, the proportion of total STI cases
that were chlamydia has declined by 10 percentage points over the 8-year period, from 82% in
2006 to 72% in 2013. The year 2013 had the lowest number of reported cases (322) with the
second lowest number (380) reported in 2012. As with herpes, women were
disproportionately impacted as seven out of ten of those infected by chlamydia in 2013 were
female (Table 3.2).
Number of Immunizations Fluctuates
Table 3.3 shows that the number of immunizations for travel purposes fluctuated significantly
year-to-year for many diseases such as hepatitis A, meningococcal meningitis, polio, etc. Instances of unusually high numbers of immunizations for diseases could be attributable to
group travel. Conversely, occurrences of comparatively low numbers of immunizations may be
partially due to a shortage of certain vaccines, as was the case with polio, meningitis and
diphtheria vaccinations for children in 2013.3
Immunizations for Hepatitis A on the Decline
There have been more travel-related immunizations for hepatitis A in each of the past ten years
than for any other disease (Table 3.3). Hepatitis A immunizations for travel purposes have
declined by 36% between 2010 and 2013, from a peak of 1,342 in 2010 to 863 in 2013. The
lowest number of hepatitis A vaccines recorded was 760 in 2004 (Figure 3).
1 World Health Organization, Retrieved November 18, 2014 from http://www.who.int/mediacentre/factsheets/fs110/en/ 2Centers for Disease Control and Prevention, Retrieved November 18, 2014 from http://www.cdc.gov/std/chlamydia/default.htm 3The Royal Gazette, Island has a shortage of vaccines for children, Retrieved October 31, 2014, from
http://www.royalgazette.com/article/20140227/NEWS06/140229748
32
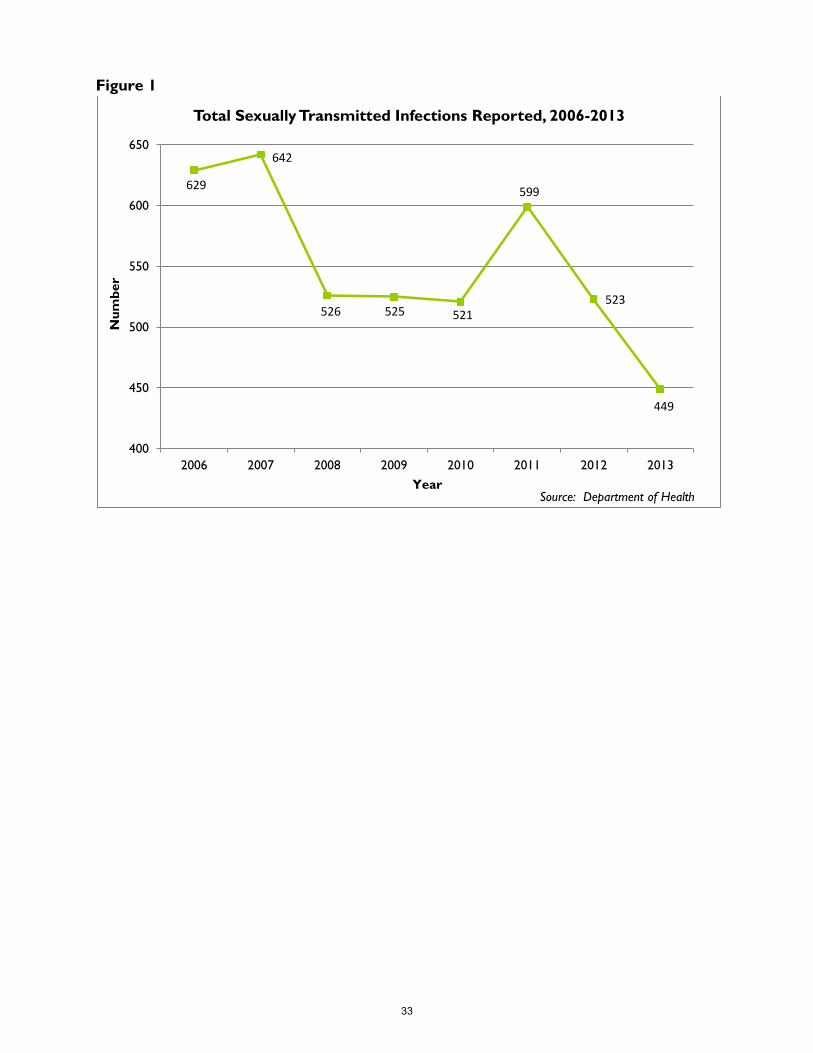
Figure 1
629
642
526 525 521
599
523
449
400
450
500
550
600
650
2006 2007 2008 2009 2010 2011 2012 2013
Nu
mb
er
Year
Total Sexually Transmitted Infections Reported, 2006-2013
Source: Department of Health
33
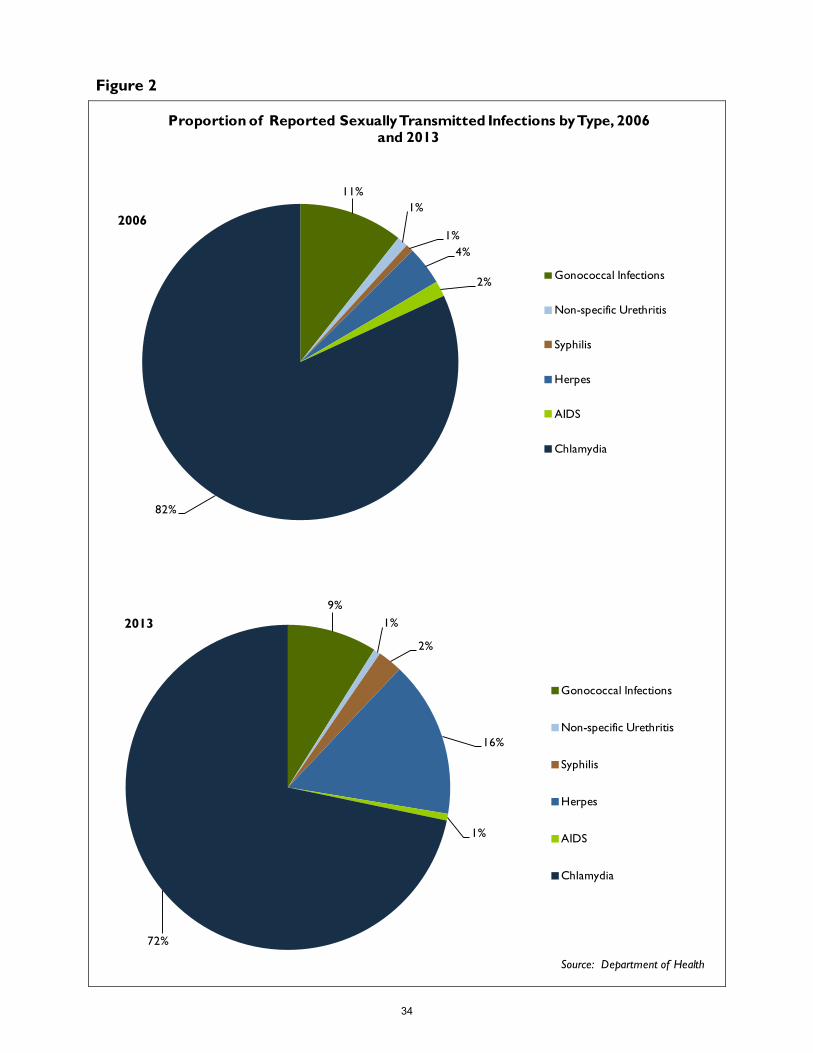
Figure 2
11%
1%
1%
4%
2%
82%
Proportion of Reported Sexually Transmitted Infections by Type, 2006 and 2013
Gonococcal Infections
Non-specific Urethritis
Syphilis
Herpes
AIDS
Chlamydia
9%
1%
2%
16%
1%
72%
Gonococcal Infections
Non-specific Urethritis
Syphilis
Herpes
AIDS
Chlamydia
Source: Department of Health
2013
2006
34
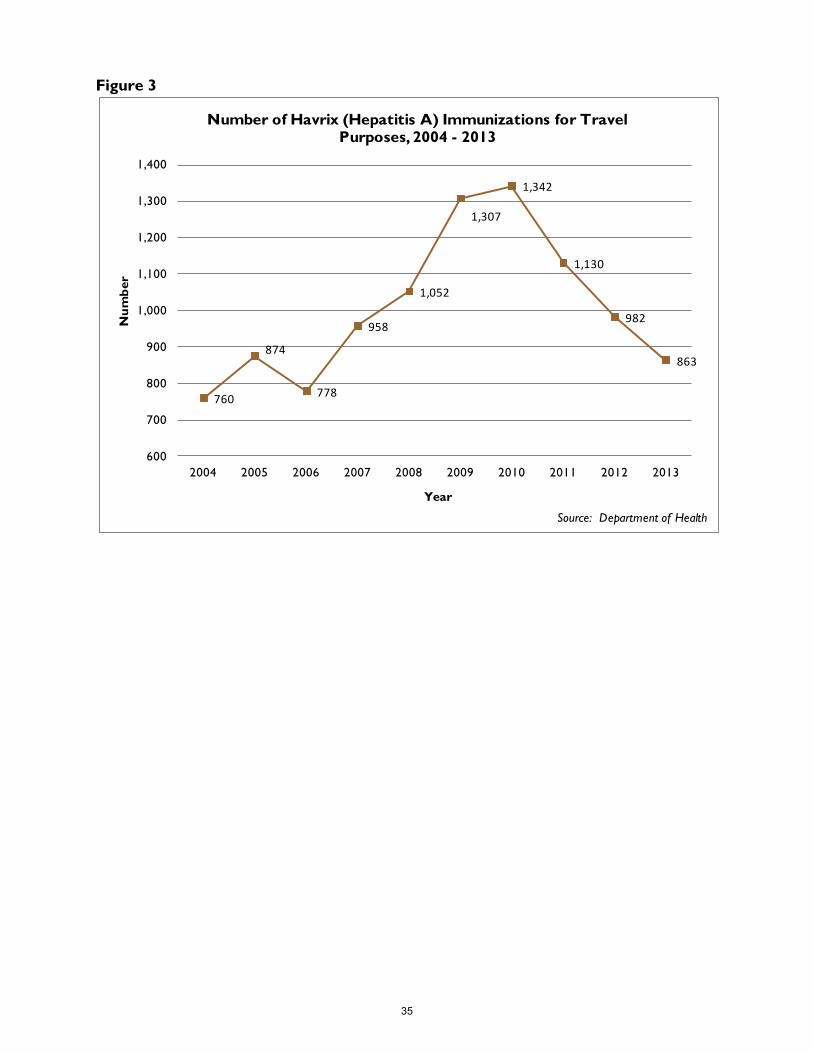
Figure 3
760
874
778
958
1,052
1,307
1,342
1,130
982
863
600
700
800
900
1,000
1,100
1,200
1,300
1,400
2004 2005 2006 2007 2008 2009 2010 2011 2012 2013
Year
Nu
mb
er
Source: Department of Health
Number of Havrix (Hepatitis A) Immunizations for Travel Purposes, 2004 - 2013
35
Table 3.1
85 &
Cause of Death Total Under 1 1-14 15-24 25-44 45-64 65-84 over
All Causes 483 2 2 5 32 87 222 133
Male 264 2 2 5 28 54 129 44
Female 219 ― ― ― 4 33 93 89
Circulatory Illnesses 142 ― ― ― 9 12 68 53
Male 70 ― ― ― 9 6 38 17
Female 72 ― ― ― ― 6 30 36
Respiratory Illnesses 56 ― ― ― 1 6 23 26
Male 29 ― ― ― 1 4 16 8
Female 27 ― ― ― ― 2 7 18
All Communicable
Diseases 10 ― ― ― ― 1 7 2
Male 6 ― ― ― ― 1 4 1
Female 4 ― ― ― ― ― 3 1
Neoplasms 137 ― ― ― 4 36 75 22
Male 76 ― ― ― 1 21 45 9
Female 61 ― ― ― 3 15 30 13
External Causes,
Accidents & Violence1 31 ― 1 3 14 9 3 1
Male 27 ― 1 3 13 8 2 ―
Female 4 ― ― ― 1 1 1 1
All Other Diseases 107 2 1 2 4 22 47 29
Male 56 2 1 2 4 14 24 9
Female 51 ― ― ― ― 8 23 20
All Causes 378 1 1 5 17 61 175 118
Male 181 1 1 5 13 31 90 40
Female 197 ― ― ― 4 30 85 78
Circulatory Illnesses 140 ― ― ― 1 21 58 60
Male 63 ― ― ― 1 13 31 18
Female 77 ― ― ― ― 8 27 42
Respiratory Illnesses 21 ― ― ― 3 4 5 9
Male 9 ― ― ― 1 1 4 3
Female 12 ― ― ― 2 3 1 6
All Communicable
Diseases 9 ― ― ― ― 2 2 5
Male 5 ― ― ― ― 1 1 3
Female 4 ― ― ― ― 1 1 2
Neoplasms 97 ― ― ― 3 19 60 15
Male 51 ― ― ― 3 10 30 8
Female 46 ― ― ― ― 9 30 7
External Causes,
Accidents & Violence1 22 ― 1 5 8 4 4 ―
Male 17 ― 1 5 8 2 1 ―
Female 5 ― ― ― ― 2 3 ―
All Other Diseases 89 1 ― ― 2 11 46 29
Male 36 1 ― ― ― 4 23 8
Female 53 ― ― ― 2 7 23 21
1Includes injury and poisoning category. Source: Department of Health
2010r
2011
HEALTH
Causes of Death by Selected Age Groups and Sex
Age
36
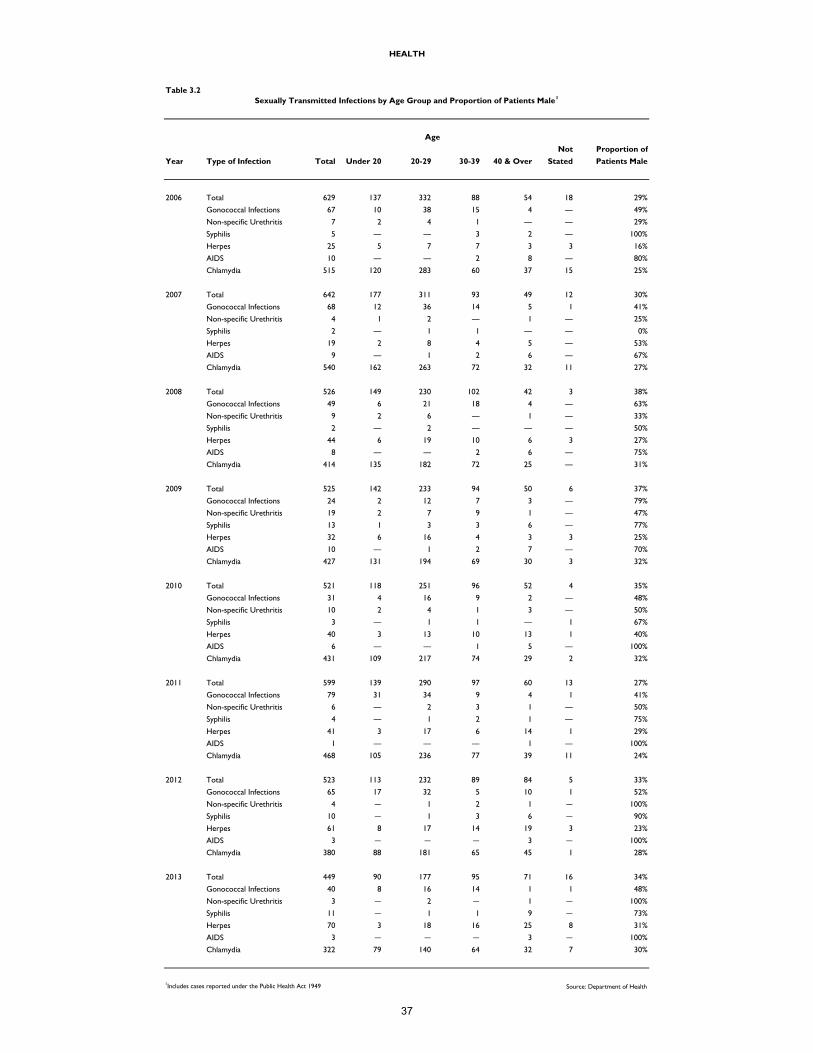
Table 3.2
Not Proportion of
Year Type of Infection Total Under 20 20-29 30-39 40 & Over Stated Patients Male
2006 Total 629 137 332 88 54 18 29%
Gonococcal Infections 67 10 38 15 4 ― 49%
Non-specific Urethritis 7 2 4 1 ― ― 29%
Syphilis 5 ― ― 3 2 ― 100%
Herpes 25 5 7 7 3 3 16%
AIDS 10 ― ― 2 8 ― 80%
Chlamydia 515 120 283 60 37 15 25%
2007 Total 642 177 311 93 49 12 30%
Gonococcal Infections 68 12 36 14 5 1 41%
Non-specific Urethritis 4 1 2 ― 1 ― 25%
Syphilis 2 ― 1 1 ― ― 0%
Herpes 19 2 8 4 5 ― 53%
AIDS 9 ― 1 2 6 ― 67%
Chlamydia 540 162 263 72 32 11 27%
2008 Total 526 149 230 102 42 3 38%
Gonococcal Infections 49 6 21 18 4 ― 63%
Non-specific Urethritis 9 2 6 ― 1 ― 33%
Syphilis 2 ― 2 ― ― ― 50%
Herpes 44 6 19 10 6 3 27%
AIDS 8 ― ― 2 6 ― 75%
Chlamydia 414 135 182 72 25 ― 31%
2009 Total 525 142 233 94 50 6 37%
Gonococcal Infections 24 2 12 7 3 ― 79%
Non-specific Urethritis 19 2 7 9 1 ― 47%
Syphilis 13 1 3 3 6 ― 77%
Herpes 32 6 16 4 3 3 25%
AIDS 10 ― 1 2 7 ― 70%
Chlamydia 427 131 194 69 30 3 32%
2010 Total 521 118 251 96 52 4 35%
Gonococcal Infections 31 4 16 9 2 ― 48%
Non-specific Urethritis 10 2 4 1 3 ― 50%
Syphilis 3 ― 1 1 ― 1 67%
Herpes 40 3 13 10 13 1 40%
AIDS 6 ― ― 1 5 ― 100%
Chlamydia 431 109 217 74 29 2 32%
2011 Total 599 139 290 97 60 13 27%
Gonococcal Infections 79 31 34 9 4 1 41%
Non-specific Urethritis 6 ― 2 3 1 ― 50%
Syphilis 4 ― 1 2 1 ― 75%
Herpes 41 3 17 6 14 1 29%
AIDS 1 ― ― ― 1 ― 100%
Chlamydia 468 105 236 77 39 11 24%
2012 Total 523 113 232 89 84 5 33%
Gonococcal Infections 65 17 32 5 10 1 52%
Non-specific Urethritis 4 ― 1 2 1 ― 100%
Syphilis 10 ― 1 3 6 ― 90%
Herpes 61 8 17 14 19 3 23%
AIDS 3 ― ― ― 3 ― 100%
Chlamydia 380 88 181 65 45 1 28%
2013 Total 449 90 177 95 71 16 34%
Gonococcal Infections 40 8 16 14 1 1 48%
Non-specific Urethritis 3 ― 2 ― 1 ― 100%
Syphilis 11 ― 1 1 9 ― 73%
Herpes 70 3 18 16 25 8 31%
AIDS 3 ― ― ― 3 ― 100%
Chlamydia 322 79 140 64 32 7 30%
1Includes cases reported under the Public Health Act 1949 Source: Department of Health
HEALTH
Sexually Transmitted Infections by Age Group and Proportion of Patients Male1
Age
37
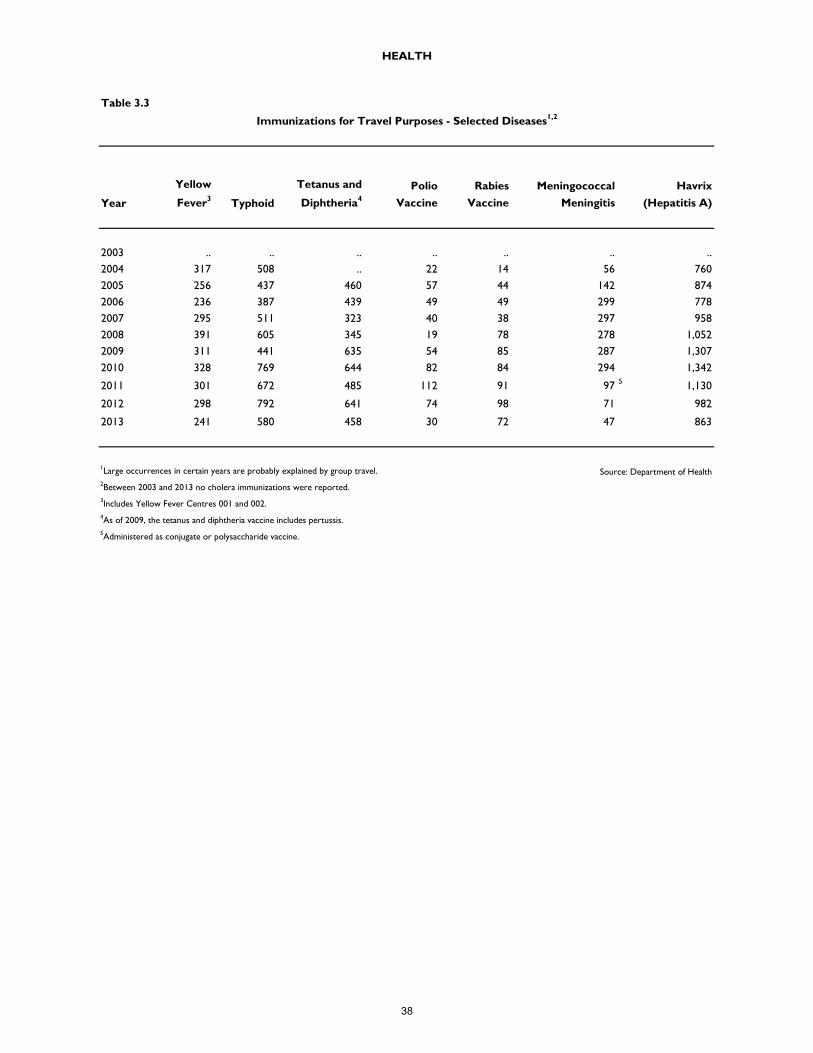
Table 3.3
Year
Yellow
Fever3
Typhoid
Tetanus and
Diphtheria4
Polio
Vaccine
Rabies
Vaccine
Meningococcal
Meningitis
Havrix
(Hepatitis A)
2003 .. .. .. .. .. .. ..
2004 317 508 .. 22 14 56 760
2005 256 437 460 57 44 142 874
2006 236 387 439 49 49 299 778
2007 295 511 323 40 38 297 958
2008 391 605 345 19 78 278 1,052
2009 311 441 635 54 85 287 1,307
2010 328 769 644 82 84 294 1,342
2011 301 672 485 112 91 975
1,130
2012 298 792 641 74 98 71 982
2013 241 580 458 30 72 47 863
1Large occurrences in certain years are probably explained by group travel. Source: Department of Health
2Between 2003 and 2013 no cholera immunizations were reported.
3Includes Yellow Fever Centres 001 and 002.
4As of 2009, the tetanus and diphtheria vaccine includes pertussis.
5Administered as conjugate or polysaccharide vaccine.
HEALTH
Immunizations for Travel Purposes - Selected Diseases1,2
38
Section IV
Labour
2013 Quick Facts
Total Occupied Jobs: 34,277
Leading Occupations: Service
Workers, Shop and Market Sales
Workers
Number of Private Sector Work
Permits: 11,330
39
Decline in Jobs for the Fifth Consecutive Year
The Employment Survey has recorded a steady decline in the job market since 2008. The
number of occupied jobs fell by 5,936 (15%) from 40,213 in 2008 to 34,277 in 2013 (Figure 1).
This is the lowest number of filled jobs since 1995. The decline in the past year amounted to
1,116 jobs (3%).
More Plant and Machine Operators and Assemblers are Seniors
In 2012, one-fifth of all occupations held were that of Service Workers, Shop and Market Sales
Workers1, followed by Professionals2 at 19%. This fact held true in 2013. The highest
proportion of Service Workers, Shop and Market Sales Workers (12%) were between the ages
of 50 to 54 whereas 16% of Professionals fell into the 30 to 34 age bracket in 2013. Plant and
Machine Operators and Assemblers3 were the only occupational group which had seniors as
the leading age group, representing 16% of the total. Of the seniors in this occupational
category, more than half (58%) were motor-car drivers which includes taxis and chauffeur-
driven cars. The implication of this is that a significant proportion of job holders in this
occupational group are of retirement age and will need to be replaced in the near future (Table 4.1).
Leading Economic Activity: Wholesale/Retail Trade and Restaurants/Hotels
As was the case in 2012, the leading divisions for economic activity were Wholesale/Retail
Trade and Restaurants/Hotels (24%); Public Administration, Education, Health and Social Work
(23%) and Financing, Insurance, Real Estate and Business Services (19%). These three divisions
accounted for nearly two-thirds of all economic activity in Bermuda in 2013 (Table 4.2).
Fewest Number of Private Sector Work Permits Issued Since Turn of the Century
Between 2002 and 2007, there was a steady rise in the number of work permits issued for
private sector employees (Figure 2). In 2008, after the onset of the economic recession, there
was a shift in this trend and total work permits declined until 2010 and rebounded the following
year. This fluctuating trend was influenced primarily by the issuance of 3 month work permits
and 2 to 5 year work permits. Between 2012 and 2013, the total number of work permits
issued have dropped by 2,799 (20%) to 11,330, the lowest number since 2000. Three month
work permits accounted for 43% of the total for 2013 (Table 4.4).
1 “Includes occupations whose main tasks consist of providing services related to travel, housekeeping, catering,
personal care, protection of individuals and property, and to maintaining law and order, or selling in shops or at
markets.” 2 “Includes occupations whose main tasks consist of increasing the existing stock of knowledge, applying scientific
and artistic concepts and theories to the solution of problems, and teaching about the foregoing in a systematic
manner.” 3 “Includes occupations whose main tasks consist of operating and monitoring mining, processing and production
machinery and equipment, as well as driving vehicles and driving and operating mobile plant, or assembling
products from component parts.”
Source: Department of Statistics, Bermuda Standard Classification of Occupations, 2014.
40
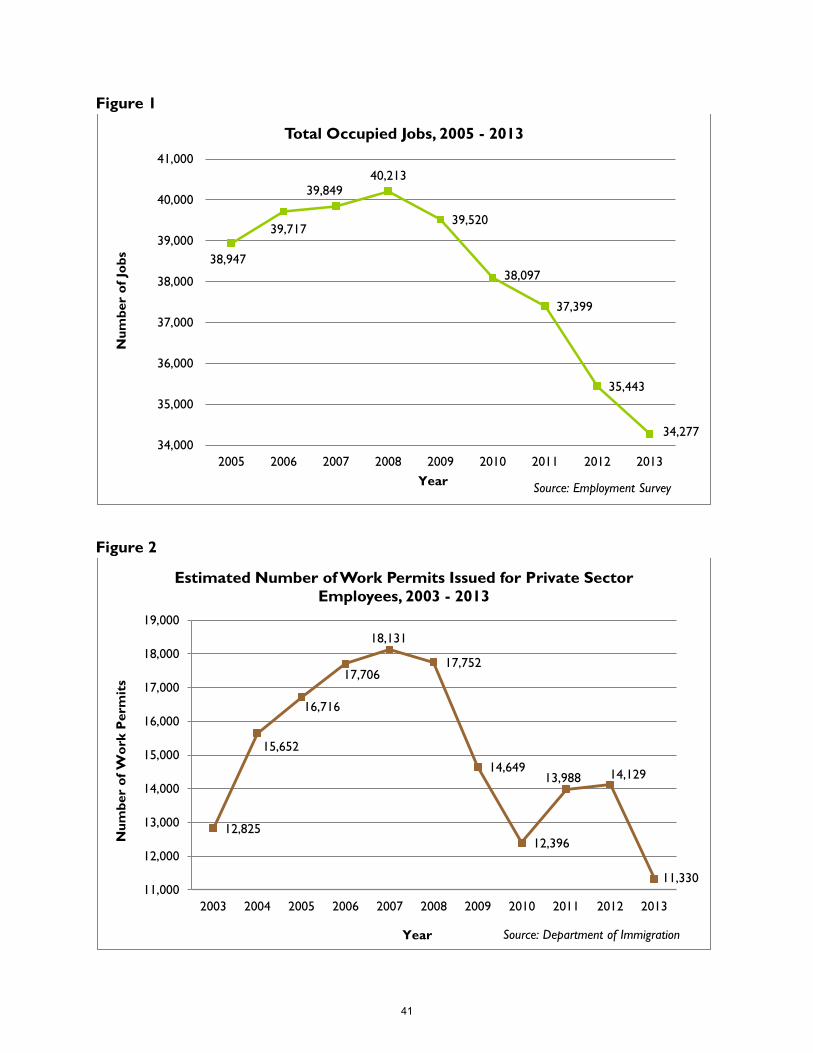
Figure 1
Figure 2
38,947
39,717
39,849 40,213
39,520
38,097
37,399
35,443
34,277 34,000
35,000
36,000
37,000
38,000
39,000
40,000
41,000
2005 2006 2007 2008 2009 2010 2011 2012 2013
Nu
mb
er
of
Job
s
Year
Total Occupied Jobs, 2005 - 2013
Source: Employment Survey
12,825
15,652
16,716
17,706
18,131
17,752
14,649
12,396
13,988 14,129
11,330 11,000
12,000
13,000
14,000
15,000
16,000
17,000
18,000
19,000
2003 2004 2005 2006 2007 2008 2009 2010 2011 2012 2013
Nu
mb
er
of
Wo
rk P
erm
its
Year
Estimated Number of Work Permits Issued for Private Sector
Employees, 2003 - 2013
Source: Department of Immigration
41
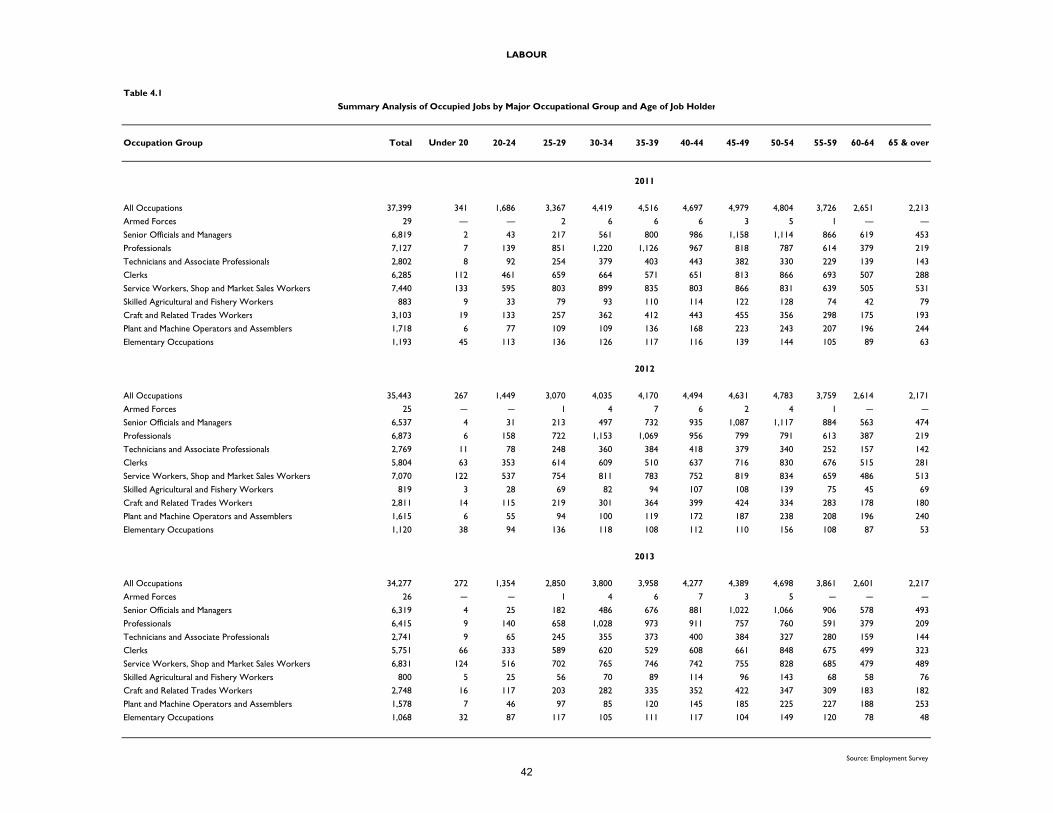
Table 4.1
Occupation Group Total Under 20 20-24 25-29 30-34 35-39 40-44 45-49 50-54 55-59 60-64 65 & over
All Occupations 37,399 341 1,686 3,367 4,419 4,516 4,697 4,979 4,804 3,726 2,651 2,213
Armed Forces 29 ― ― 2 6 6 6 3 5 1 ― ―
Senior Officials and Managers 6,819 2 43 217 561 800 986 1,158 1,114 866 619 453
Professionals 7,127 7 139 851 1,220 1,126 967 818 787 614 379 219
Technicians and Associate Professionals 2,802 8 92 254 379 403 443 382 330 229 139 143
Clerks 6,285 112 461 659 664 571 651 813 866 693 507 288
Service Workers, Shop and Market Sales Workers 7,440 133 595 803 899 835 803 866 831 639 505 531
Skilled Agricultural and Fishery Workers 883 9 33 79 93 110 114 122 128 74 42 79
Craft and Related Trades Workers 3,103 19 133 257 362 412 443 455 356 298 175 193
Plant and Machine Operators and Assemblers 1,718 6 77 109 109 136 168 223 243 207 196 244
Elementary Occupations 1,193 45 113 136 126 117 116 139 144 105 89 63
All Occupations 35,443 267 1,449 3,070 4,035 4,170 4,494 4,631 4,783 3,759 2,614 2,171
Armed Forces 25 ― ― 1 4 7 6 2 4 1 ― ―
Senior Officials and Managers 6,537 4 31 213 497 732 935 1,087 1,117 884 563 474
Professionals 6,873 6 158 722 1,153 1,069 956 799 791 613 387 219
Technicians and Associate Professionals 2,769 11 78 248 360 384 418 379 340 252 157 142
Clerks 5,804 63 353 614 609 510 637 716 830 676 515 281
Service Workers, Shop and Market Sales Workers 7,070 122 537 754 811 783 752 819 834 659 486 513
Skilled Agricultural and Fishery Workers 819 3 28 69 82 94 107 108 139 75 45 69
Craft and Related Trades Workers 2,811 14 115 219 301 364 399 424 334 283 178 180
Plant and Machine Operators and Assemblers 1,615 6 55 94 100 119 172 187 238 208 196 240
Elementary Occupations 1,120 38 94 136 118 108 112 110 156 108 87 53
All Occupations 34,277 272 1,354 2,850 3,800 3,958 4,277 4,389 4,698 3,861 2,601 2,217
Armed Forces 26 ― ― 1 4 6 7 3 5 ― ― ―
Senior Officials and Managers 6,319 4 25 182 486 676 881 1,022 1,066 906 578 493
Professionals 6,415 9 140 658 1,028 973 911 757 760 591 379 209
Technicians and Associate Professionals 2,741 9 65 245 355 373 400 384 327 280 159 144
Clerks 5,751 66 333 589 620 529 608 661 848 675 499 323
Service Workers, Shop and Market Sales Workers 6,831 124 516 702 765 746 742 755 828 685 479 489
Skilled Agricultural and Fishery Workers 800 5 25 56 70 89 114 96 143 68 58 76
Craft and Related Trades Workers 2,748 16 117 203 282 335 352 422 347 309 183 182
Plant and Machine Operators and Assemblers 1,578 7 46 97 85 120 145 185 225 227 188 253
Elementary Occupations 1,068 32 87 117 105 111 117 104 149 120 78 48
Source: Employment Survey
2012
2013
LABOUR
Summary Analysis of Occupied Jobs by Major Occupational Group and Age of Job Holder
2011
42
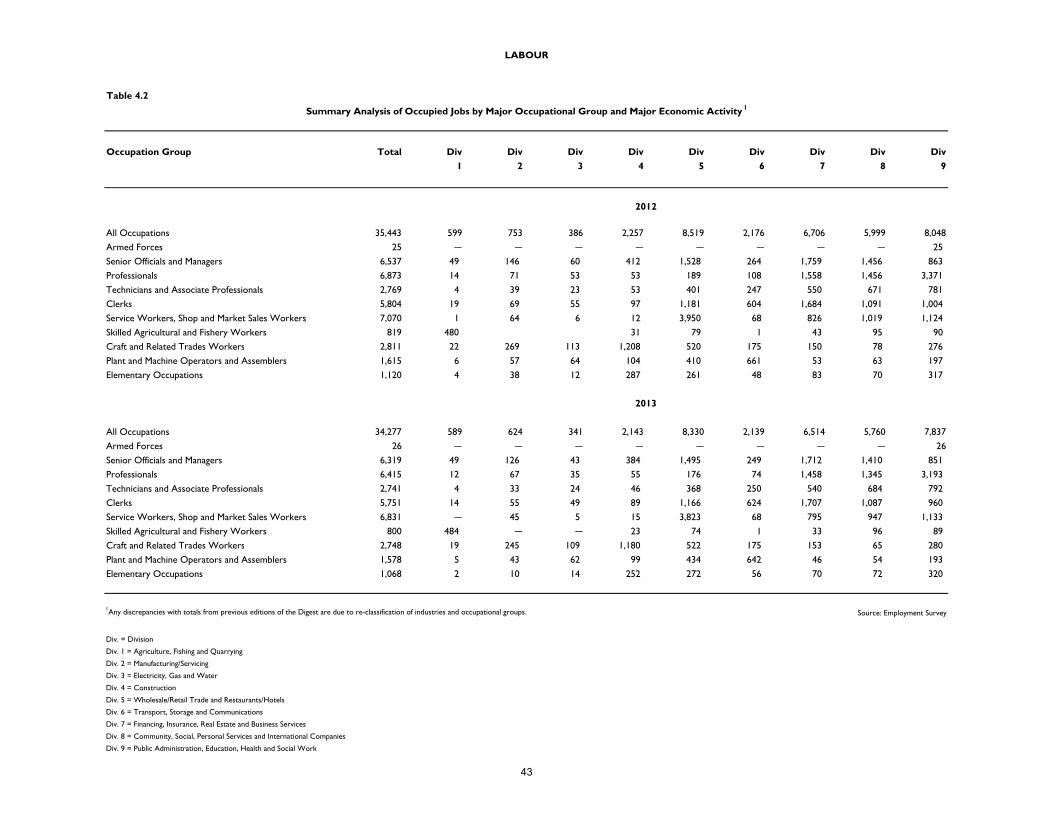
Table 4.2
Occupation Group Total Div Div Div Div Div Div Div Div Div
1 2 3 4 5 6 7 8 9
All Occupations 35,443 599 753 386 2,257 8,519 2,176 6,706 5,999 8,048
Armed Forces 25 ― ― ― ― ― ― ― ― 25
Senior Officials and Managers 6,537 49 146 60 412 1,528 264 1,759 1,456 863
Professionals 6,873 14 71 53 53 189 108 1,558 1,456 3,371
Technicians and Associate Professionals 2,769 4 39 23 53 401 247 550 671 781
Clerks 5,804 19 69 55 97 1,181 604 1,684 1,091 1,004
Service Workers, Shop and Market Sales Workers 7,070 1 64 6 12 3,950 68 826 1,019 1,124
Skilled Agricultural and Fishery Workers 819 480 31 79 1 43 95 90
Craft and Related Trades Workers 2,811 22 269 113 1,208 520 175 150 78 276
Plant and Machine Operators and Assemblers 1,615 6 57 64 104 410 661 53 63 197
Elementary Occupations 1,120 4 38 12 287 261 48 83 70 317
All Occupations 34,277 589 624 341 2,143 8,330 2,139 6,514 5,760 7,837
Armed Forces 26 ― ― ― ― ― ― ― ― 26
Senior Officials and Managers 6,319 49 126 43 384 1,495 249 1,712 1,410 851
Professionals 6,415 12 67 35 55 176 74 1,458 1,345 3,193
Technicians and Associate Professionals 2,741 4 33 24 46 368 250 540 684 792
Clerks 5,751 14 55 49 89 1,166 624 1,707 1,087 960
Service Workers, Shop and Market Sales Workers 6,831 ― 45 5 15 3,823 68 795 947 1,133
Skilled Agricultural and Fishery Workers 800 484 ― ― 23 74 1 33 96 89
Craft and Related Trades Workers 2,748 19 245 109 1,180 522 175 153 65 280
Plant and Machine Operators and Assemblers 1,578 5 43 62 99 434 642 46 54 193
Elementary Occupations 1,068 2 10 14 252 272 56 70 72 320
1Any discrepancies with totals from previous editions of the Digest are due to re-classification of industries and occupational groups. Source: Employment Survey
Div. = Division
Div. 1 = Agriculture, Fishing and Quarrying
Div. 2 = Manufacturing/Servicing
Div. 3 = Electricity, Gas and Water
Div. 4 = Construction
Div. 5 = Wholesale/Retail Trade and Restaurants/Hotels
Div. 6 = Transport, Storage and Communications
Div. 7 = Financing, Insurance, Real Estate and Business Services
Div. 8 = Community, Social, Personal Services and International Companies
Div. 9 = Public Administration, Education, Health and Social Work
2013
LABOUR
Summary Analysis of Occupied Jobs by Major Occupational Group and Major Economic Activity 1
2012
43
Table 4.3
Industry Group Total Male Female Total Male Female Total Male Female
All Industries 10,391 5,899 4,492 12,091 6,750 5,341 13,110 7,195 5,915
Agriculture, Fishing & Quarrying 256 243 13 259 244 15 262 242 20
Manufacturing 255 182 73 370 270 100 295 208 87
Electricity, Gas & Water 62 55 7 64 53 11 62 44 18
Construction 574 527 47 709 677 32 1,128 1,064 64
Wholesale & Retail Trade 1,150 528 622 1,243 665 578 1,200 729 471
Hotels, Restaurants & Clubs 1,848 1,395 453 1,792 1,362 430 1,576 1,106 470
Transport & Communication 299 202 97 395 252 143 341 235 106
Financial Intermediation 777 326 451 835 387 448 881 408 473
Real Estate 95 45 50 130 78 52 222 129 93
Business Services 856 416 440 1,548 777 771 1,595 787 808
Public Administration & Defence 747 549 198 478 324 154 707 448 259
Education, Health & Social Work 1,261 358 903 1,436 321 1,115 1,621 338 1,283
Other Community Services 1,238 482 756 1,153 326 827 1,158 281 877
International Companies 889 540 349 1,659 1,003 656 1,950 1,122 828
Not Elsewhere Classified 2 2 ― ― ― ― ― ― ―
Not Stated 82 49 33 20 11 9 112 54 58
1In 1998, Bermuda's industrial classifications were updated according to the Source: Population Censuses
United Nations International Standard Industrial Classification of Economic Activity, Revision 3.2Excludes persons for which there is no data. For more details see Technical Note in the 2010 Population and Housing Census Report.
LABOUR
Foreign-Born Workers by Industrial Group for Census Years - 1991, 2000 and 20101
1991 2000 20102
44
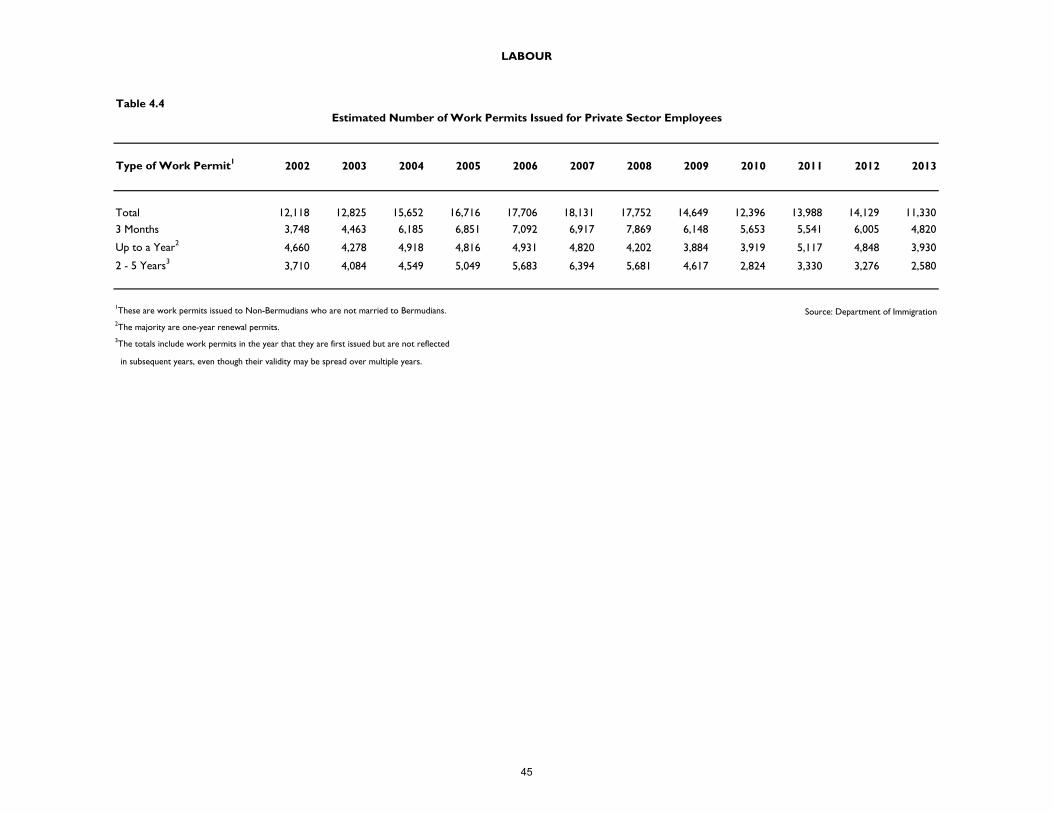
Table 4.4
Type of Work Permit1 2002 2003 2004 2005 2006 2007 2008 2009 2010 2011 2012 2013
Total 12,118 12,825 15,652 16,716 17,706 18,131 17,752 14,649 12,396 13,988 14,129 11,330
3 Months 3,748 4,463 6,185 6,851 7,092 6,917 7,869 6,148 5,653 5,541 6,005 4,820
Up to a Year2 4,660 4,278 4,918 4,816 4,931 4,820 4,202 3,884 3,919 5,117 4,848 3,930
2 - 5 Years3 3,710 4,084 4,549 5,049 5,683 6,394 5,681 4,617 2,824 3,330 3,276 2,580
1These are work permits issued to Non-Bermudians who are not married to Bermudians. Source: Department of Immigration2The majority are one-year renewal permits.3The totals include work permits in the year that they are first issued but are not reflected
in subsequent years, even though their validity may be spread over multiple years.
LABOUR
Estimated Number of Work Permits Issued for Private Sector Employees
45
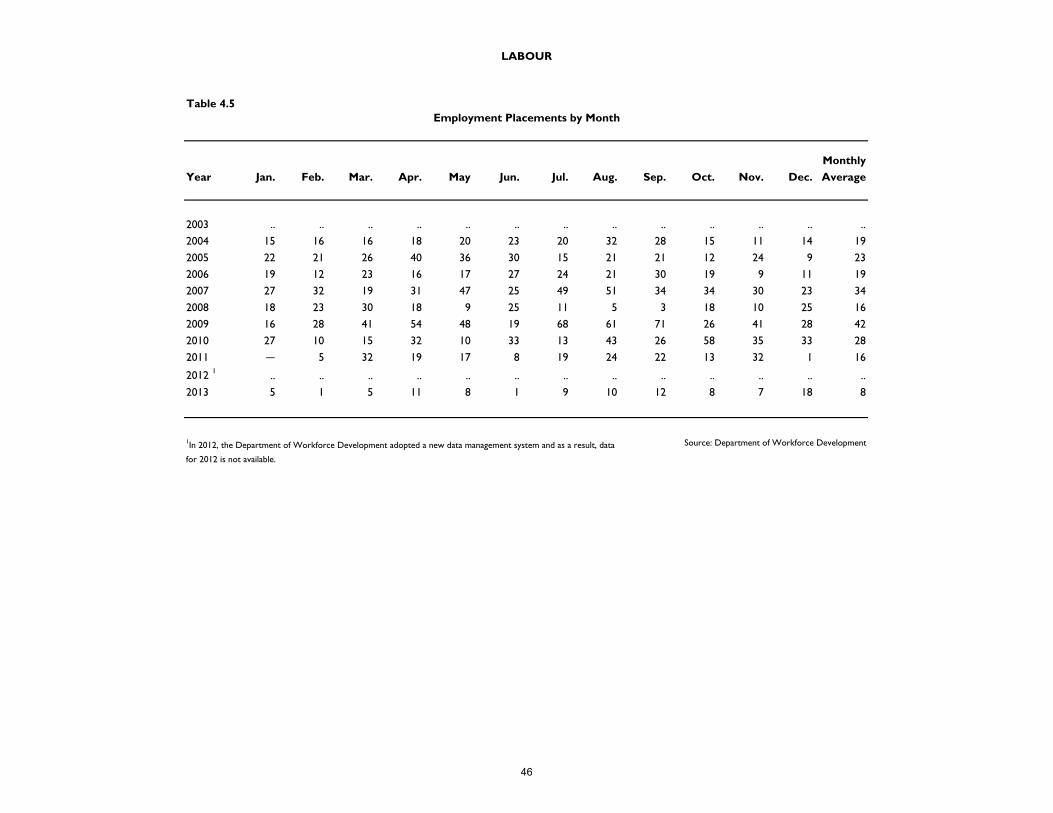
Table 4.5
Monthly
Year Jan. Feb. Mar. Apr. May Jun. Jul. Aug. Sep. Oct. Nov. Dec. Average
2003 .. .. .. .. .. .. .. .. .. .. .. .. ..
2004 15 16 16 18 20 23 20 32 28 15 11 14 19
2005 22 21 26 40 36 30 15 21 21 12 24 9 23
2006 19 12 23 16 17 27 24 21 30 19 9 11 19
2007 27 32 19 31 47 25 49 51 34 34 30 23 34
2008 18 23 30 18 9 25 11 5 3 18 10 25 16
2009 16 28 41 54 48 19 68 61 71 26 41 28 42
2010 27 10 15 32 10 33 13 43 26 58 35 33 28
2011 ― 5 32 19 17 8 19 24 22 13 32 1 16
2012 1 .. .. .. .. .. .. .. .. .. .. .. .. ..
2013 5 1 5 11 8 1 9 10 12 8 7 18 8
Source: Department of Workforce Development
LABOUR
Employment Placements by Month
1In 2012, the Department of Workforce Development adopted a new data management system and as a result, data
for 2012 is not available.
46
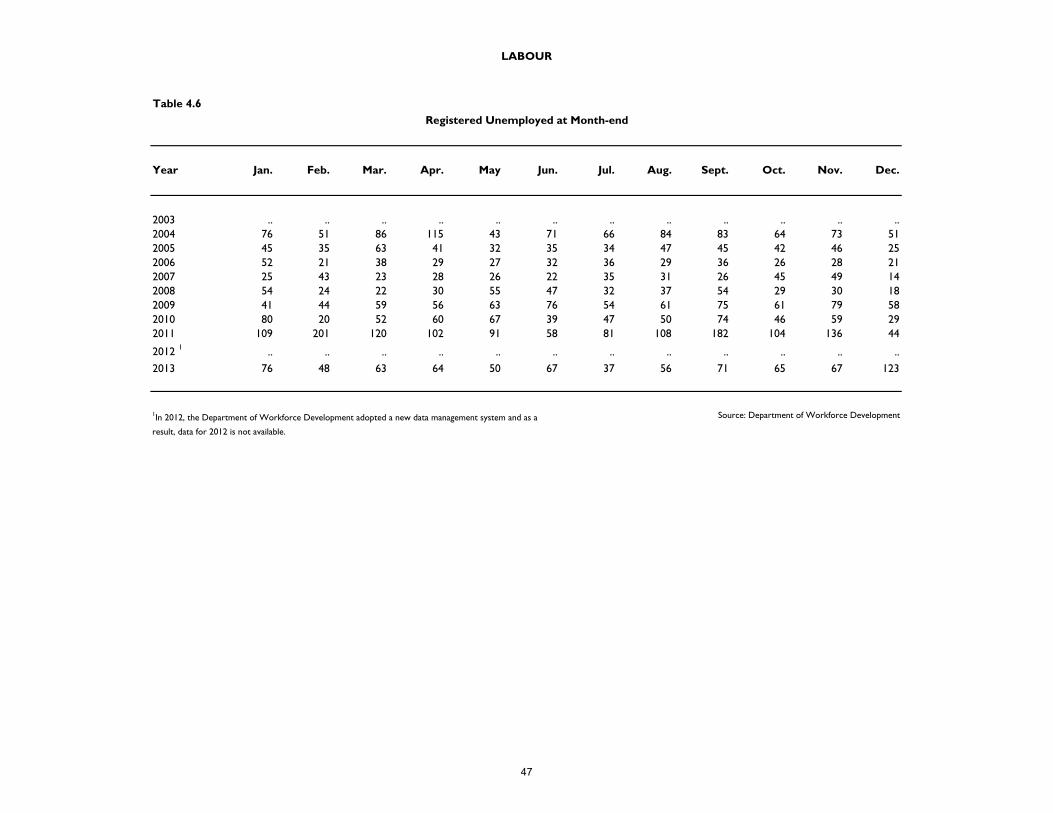
Table 4.6
Year Jan. Feb. Mar. Apr. May Jun. Jul. Aug. Sept. Oct. Nov. Dec.
2003 .. .. .. .. .. .. .. .. .. .. .. ..2004 76 51 86 115 43 71 66 84 83 64 73 512005 45 35 63 41 32 35 34 47 45 42 46 252006 52 21 38 29 27 32 36 29 36 26 28 212007 25 43 23 28 26 22 35 31 26 45 49 142008 54 24 22 30 55 47 32 37 54 29 30 182009 41 44 59 56 63 76 54 61 75 61 79 582010 80 20 52 60 67 39 47 50 74 46 59 292011 109 201 120 102 91 58 81 108 182 104 136 44
2012 1 .. .. .. .. .. .. .. .. .. .. .. ..
2013 76 48 63 64 50 67 37 56 71 65 67 123
Source: Department of Workforce Development
LABOUR
Registered Unemployed at Month-end
1In 2012, the Department of Workforce Development adopted a new data management system and as a
result, data for 2012 is not available.
47
Section V
Prices and Wages
2013 Quick Facts
Annual Change in Selected Average Retail Prices
Apples (3 lb bag, Macintosh)
$7.24 (+15.7%)
Butter (1 lb package)
$4.59 (-5.0%)
Electricity (monthly per 700 KW hrs)
$293.88 (-1.2%)
48
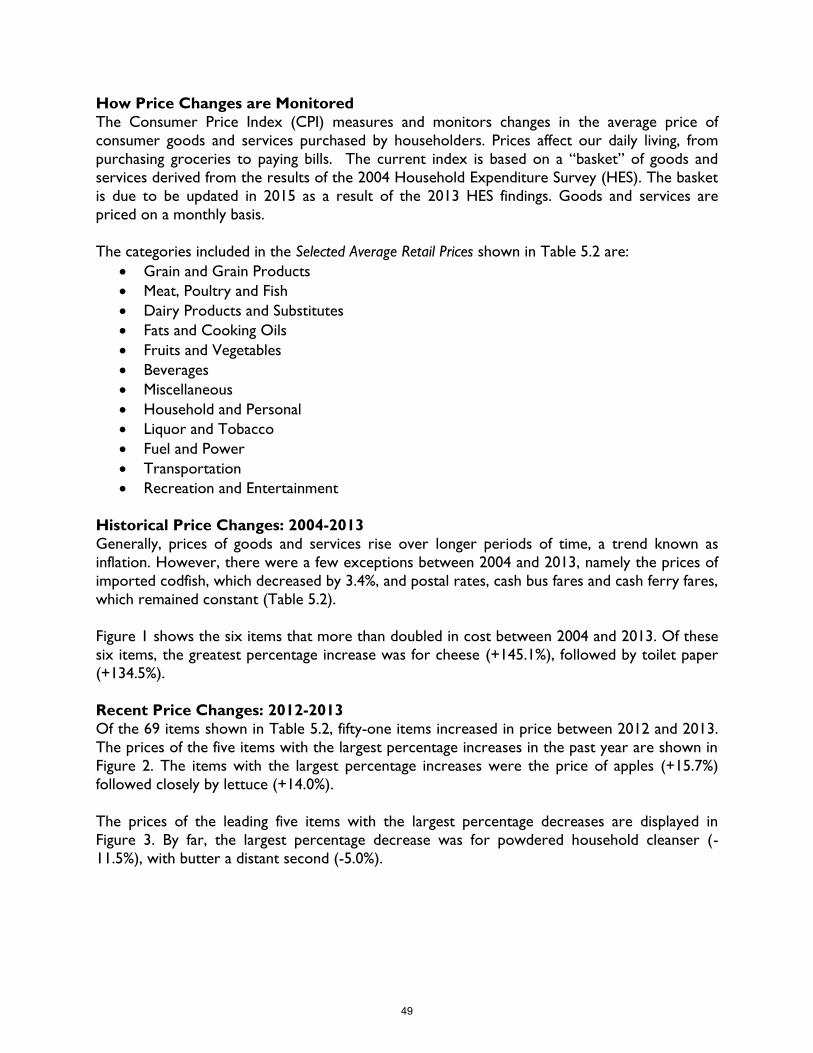
How Price Changes are Monitored
The Consumer Price Index (CPI) measures and monitors changes in the average price of
consumer goods and services purchased by householders. Prices affect our daily living, from
purchasing groceries to paying bills. The current index is based on a “basket” of goods and
services derived from the results of the 2004 Household Expenditure Survey (HES). The basket
is due to be updated in 2015 as a result of the 2013 HES findings. Goods and services are
priced on a monthly basis.
The categories included in the Selected Average Retail Prices shown in Table 5.2 are:
Grain and Grain Products
Meat, Poultry and Fish
Dairy Products and Substitutes
Fats and Cooking Oils
Fruits and Vegetables
Beverages
Miscellaneous
Household and Personal
Liquor and Tobacco
Fuel and Power
Transportation
Recreation and Entertainment
Historical Price Changes: 2004-2013
Generally, prices of goods and services rise over longer periods of time, a trend known as
inflation. However, there were a few exceptions between 2004 and 2013, namely the prices of
imported codfish, which decreased by 3.4%, and postal rates, cash bus fares and cash ferry fares,
which remained constant (Table 5.2).
Figure 1 shows the six items that more than doubled in cost between 2004 and 2013. Of these
six items, the greatest percentage increase was for cheese (+145.1%), followed by toilet paper
(+134.5%).
Recent Price Changes: 2012-2013
Of the 69 items shown in Table 5.2, fifty-one items increased in price between 2012 and 2013.
The prices of the five items with the largest percentage increases in the past year are shown in
Figure 2. The items with the largest percentage increases were the price of apples (+15.7%)
followed closely by lettuce (+14.0%).
The prices of the leading five items with the largest percentage decreases are displayed in
Figure 3. By far, the largest percentage decrease was for powdered household cleanser (-
11.5%), with butter a distant second (-5.0%).
49
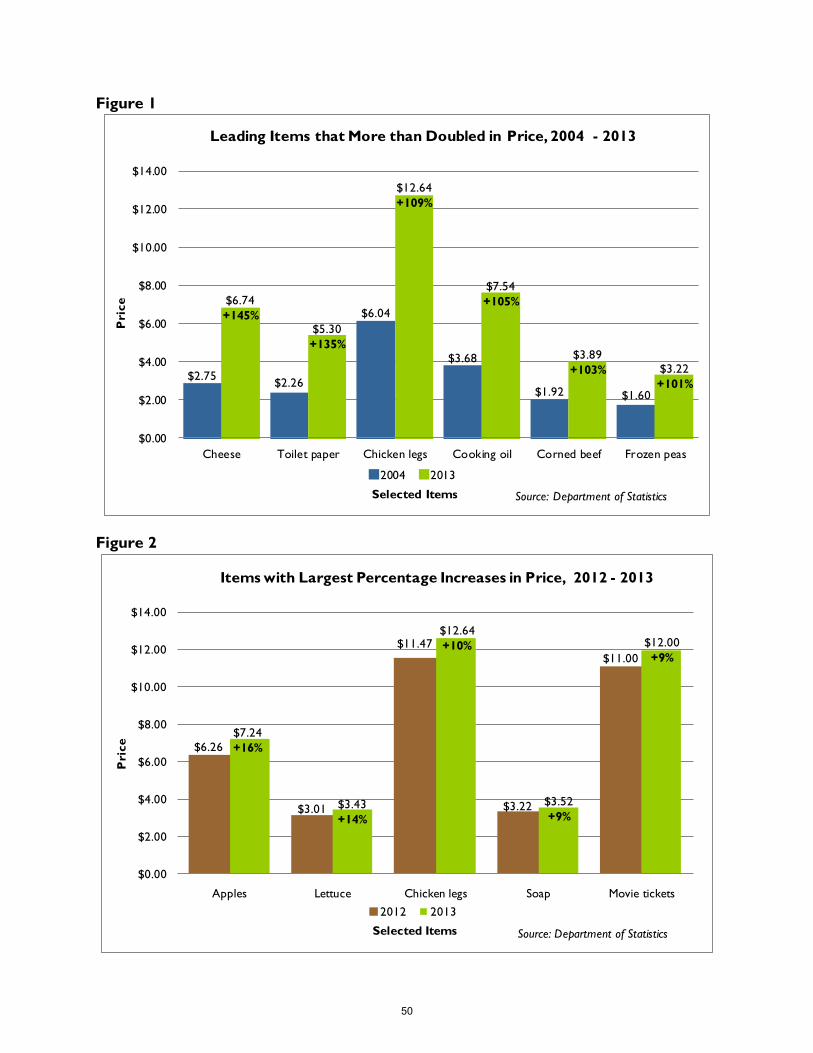
Figure 1
$2.75$2.26
$6.04
$3.68
$1.92 $1.60
$6.74
+145%$5.30
+135%
$12.64
+109%
$7.54
+105%
$3.89
+103% $3.22
+101%
$0.00
$2.00
$4.00
$6.00
$8.00
$10.00
$12.00
$14.00
Cheese Toilet paper Chicken legs Cooking oil Corned beef Frozen peas
Leading Items that More than Doubled in Price, 2004 - 2013
2004 2013
Pri
ce
Selected Items Source: Department of Statistics
Figure 2
$6.26
$3.01
$11.47
$3.22
$11.00
$7.24
+16%
$3.43
+14%
$12.64
+10%
$3.52
+9%
$12.00
+9%
$0.00
$2.00
$4.00
$6.00
$8.00
$10.00
$12.00
$14.00
Apples Lettuce Chicken legs Soap Movie tickets
Items with Largest Percentage Increases in Price, 2012 - 2013
2012 2013
Pric
e
Selected Items Source: Department of Statistics
50
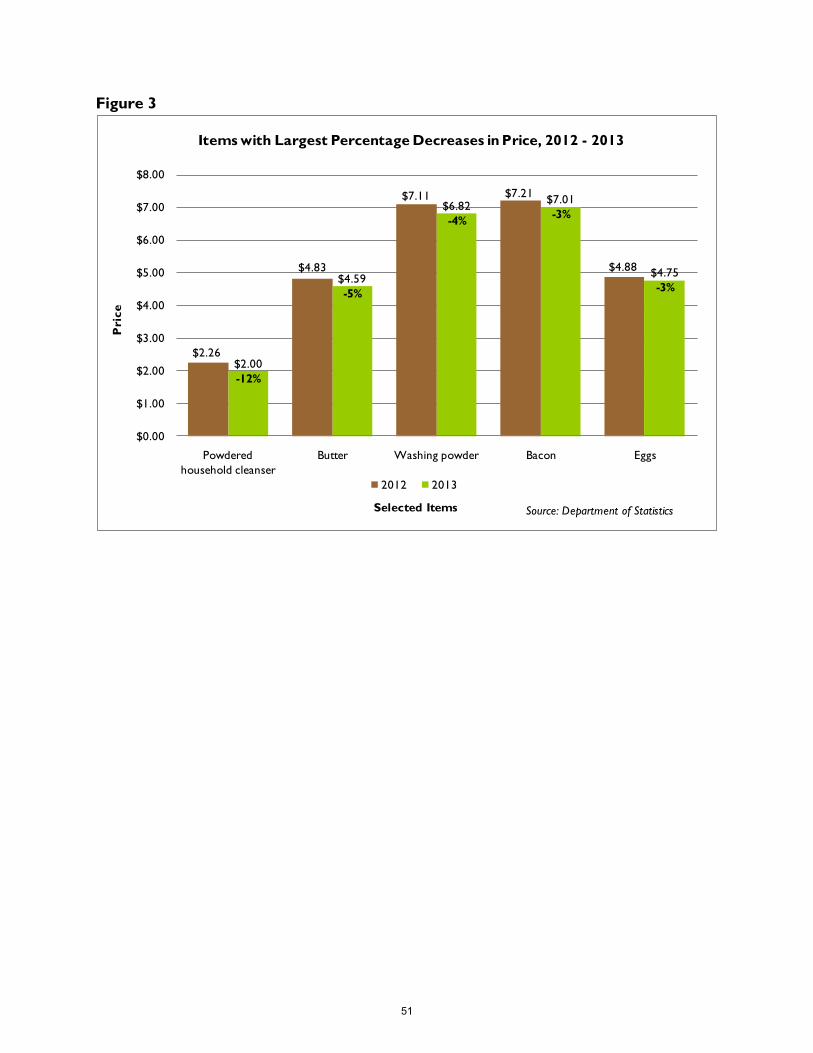
Figure 3
$2.26
$4.83
$7.11 $7.21
$4.88
$2.00
-12%
$4.59
-5%
$6.82
-4%
$7.01
-3%
$4.75
-3%
$0.00
$1.00
$2.00
$3.00
$4.00
$5.00
$6.00
$7.00
$8.00
Powdered
household cleanser
Butter Washing powder Bacon Eggs
Items with Largest Percentage Decreases in Price, 2012 - 2013
2012 2013
Pric
e
Selected Items Source: Department of Statistics
51
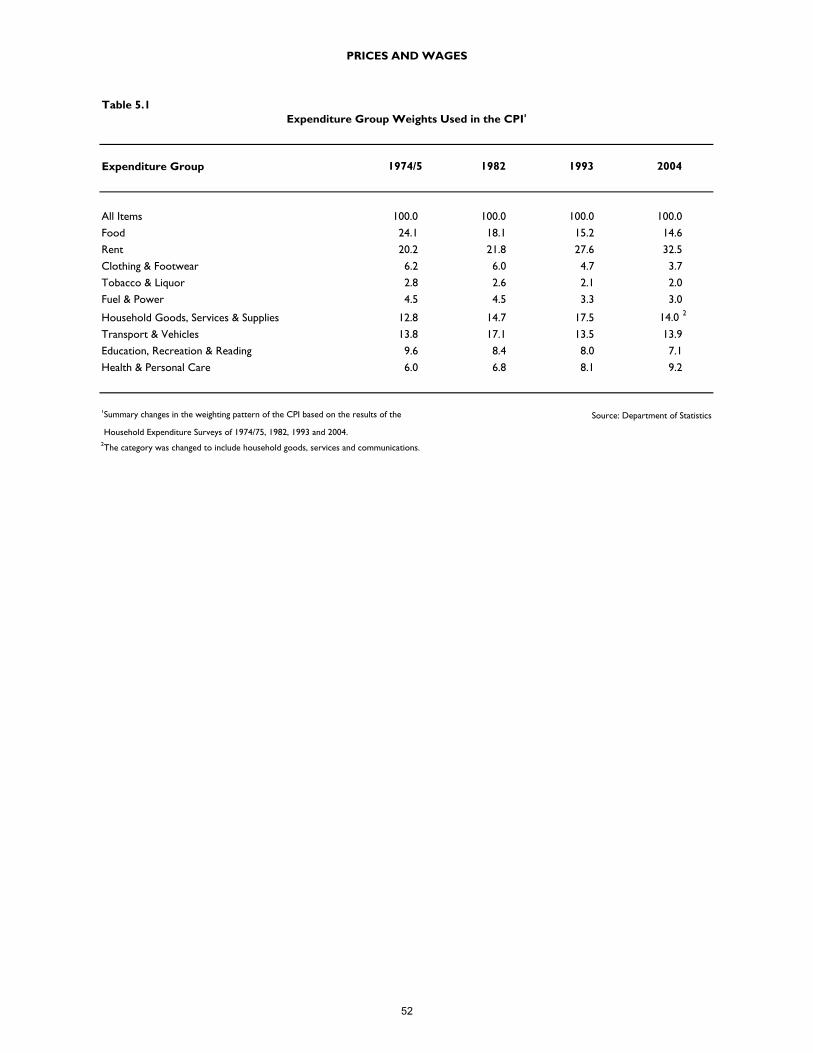
Table 5.1
Expenditure Group 1974/5 1982 1993 2004
All Items 100.0 100.0 100.0 100.0
Food 24.1 18.1 15.2 14.6
Rent 20.2 21.8 27.6 32.5
Clothing & Footwear 6.2 6.0 4.7 3.7
Tobacco & Liquor 2.8 2.6 2.1 2.0
Fuel & Power 4.5 4.5 3.3 3.0
Household Goods, Services & Supplies 12.8 14.7 17.5 14.0 2
Transport & Vehicles 13.8 17.1 13.5 13.9
Education, Recreation & Reading 9.6 8.4 8.0 7.1
Health & Personal Care 6.0 6.8 8.1 9.2
1Summary changes in the weighting pattern of the CPI based on the results of the Source: Department of Statistics
Household Expenditure Surveys of 1974/75, 1982, 1993 and 2004.2The category was changed to include household goods, services and communications.
PRICES AND WAGES
Expenditure Group Weights Used in the CPI1
52
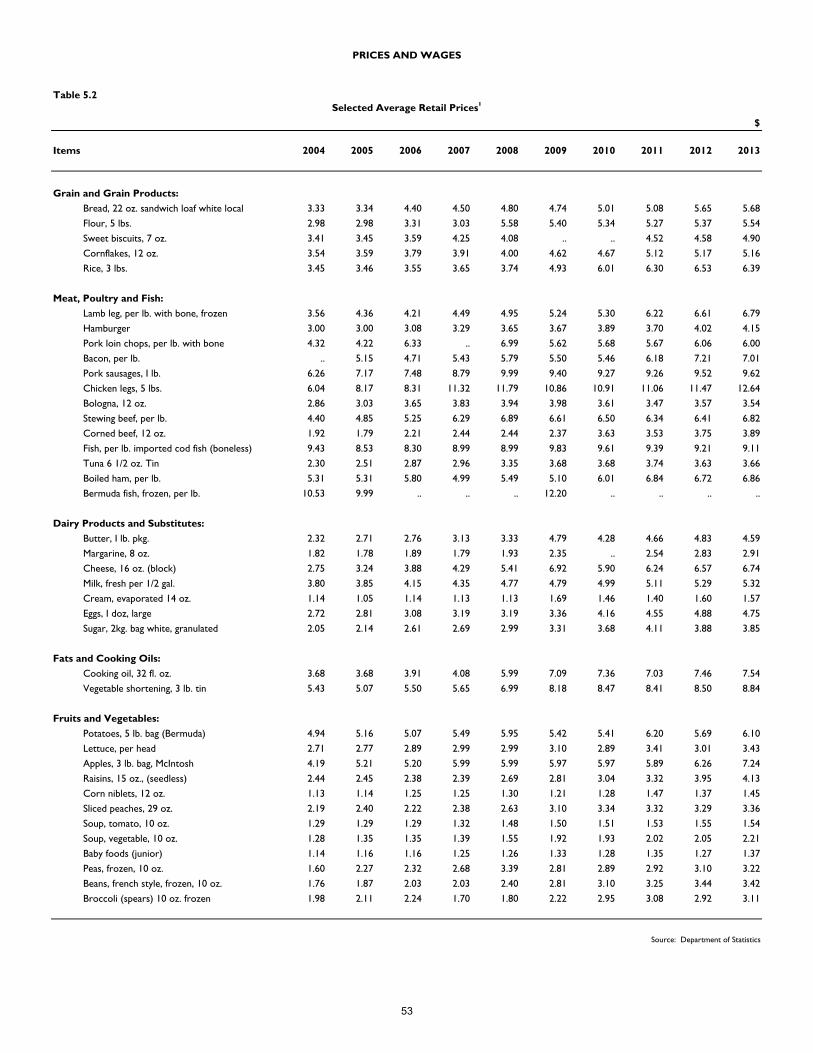
Table 5.2
$
Items 2004 2005 2006 2007 2008 2009 2010 2011 2012 2013
Grain and Grain Products:
Bread, 22 oz. sandwich loaf white local 3.33 3.34 4.40 4.50 4.80 4.74 5.01 5.08 5.65 5.68
Flour, 5 lbs. 2.98 2.98 3.31 3.03 5.58 5.40 5.34 5.27 5.37 5.54
Sweet biscuits, 7 oz. 3.41 3.45 3.59 4.25 4.08 .. .. 4.52 4.58 4.90
Cornflakes, 12 oz. 3.54 3.59 3.79 3.91 4.00 4.62 4.67 5.12 5.17 5.16
Rice, 3 lbs. 3.45 3.46 3.55 3.65 3.74 4.93 6.01 6.30 6.53 6.39
Meat, Poultry and Fish:
Lamb leg, per lb. with bone, frozen 3.56 4.36 4.21 4.49 4.95 5.24 5.30 6.22 6.61 6.79
Hamburger 3.00 3.00 3.08 3.29 3.65 3.67 3.89 3.70 4.02 4.15
Pork loin chops, per lb. with bone 4.32 4.22 6.33 .. 6.99 5.62 5.68 5.67 6.06 6.00
Bacon, per lb. .. 5.15 4.71 5.43 5.79 5.50 5.46 6.18 7.21 7.01
Pork sausages, I lb. 6.26 7.17 7.48 8.79 9.99 9.40 9.27 9.26 9.52 9.62
Chicken legs, 5 lbs. 6.04 8.17 8.31 11.32 11.79 10.86 10.91 11.06 11.47 12.64
Bologna, 12 oz. 2.86 3.03 3.65 3.83 3.94 3.98 3.61 3.47 3.57 3.54
Stewing beef, per lb. 4.40 4.85 5.25 6.29 6.89 6.61 6.50 6.34 6.41 6.82
Corned beef, 12 oz. 1.92 1.79 2.21 2.44 2.44 2.37 3.63 3.53 3.75 3.89
Fish, per lb. imported cod fish (boneless) 9.43 8.53 8.30 8.99 8.99 9.83 9.61 9.39 9.21 9.11
Tuna 6 1/2 oz. Tin 2.30 2.51 2.87 2.96 3.35 3.68 3.68 3.74 3.63 3.66
Boiled ham, per lb. 5.31 5.31 5.80 4.99 5.49 5.10 6.01 6.84 6.72 6.86
Bermuda fish, frozen, per lb. 10.53 9.99 .. .. .. 12.20 .. .. .. ..
Dairy Products and Substitutes:
Butter, I lb. pkg. 2.32 2.71 2.76 3.13 3.33 4.79 4.28 4.66 4.83 4.59
Margarine, 8 oz. 1.82 1.78 1.89 1.79 1.93 2.35 .. 2.54 2.83 2.91
Cheese, 16 oz. (block) 2.75 3.24 3.88 4.29 5.41 6.92 5.90 6.24 6.57 6.74
Milk, fresh per 1/2 gal. 3.80 3.85 4.15 4.35 4.77 4.79 4.99 5.11 5.29 5.32
Cream, evaporated 14 oz. 1.14 1.05 1.14 1.13 1.13 1.69 1.46 1.40 1.60 1.57
Eggs, I doz, large 2.72 2.81 3.08 3.19 3.19 3.36 4.16 4.55 4.88 4.75
Sugar, 2kg. bag white, granulated 2.05 2.14 2.61 2.69 2.99 3.31 3.68 4.11 3.88 3.85
Fats and Cooking Oils:
Cooking oil, 32 fl. oz. 3.68 3.68 3.91 4.08 5.99 7.09 7.36 7.03 7.46 7.54
Vegetable shortening, 3 lb. tin 5.43 5.07 5.50 5.65 6.99 8.18 8.47 8.41 8.50 8.84
Fruits and Vegetables:
Potatoes, 5 lb. bag (Bermuda) 4.94 5.16 5.07 5.49 5.95 5.42 5.41 6.20 5.69 6.10
Lettuce, per head 2.71 2.77 2.89 2.99 2.99 3.10 2.89 3.41 3.01 3.43
Apples, 3 lb. bag, McIntosh 4.19 5.21 5.20 5.99 5.99 5.97 5.97 5.89 6.26 7.24
Raisins, 15 oz., (seedless) 2.44 2.45 2.38 2.39 2.69 2.81 3.04 3.32 3.95 4.13
Corn niblets, 12 oz. 1.13 1.14 1.25 1.25 1.30 1.21 1.28 1.47 1.37 1.45
Sliced peaches, 29 oz. 2.19 2.40 2.22 2.38 2.63 3.10 3.34 3.32 3.29 3.36
Soup, tomato, 10 oz. 1.29 1.29 1.29 1.32 1.48 1.50 1.51 1.53 1.55 1.54
Soup, vegetable, 10 oz. 1.28 1.35 1.35 1.39 1.55 1.92 1.93 2.02 2.05 2.21
Baby foods (junior) 1.14 1.16 1.16 1.25 1.26 1.33 1.28 1.35 1.27 1.37
Peas, frozen, 10 oz. 1.60 2.27 2.32 2.68 3.39 2.81 2.89 2.92 3.10 3.22
Beans, french style, frozen, 10 oz. 1.76 1.87 2.03 2.03 2.40 2.81 3.10 3.25 3.44 3.42
Broccoli (spears) 10 oz. frozen 1.98 2.11 2.24 1.70 1.80 2.22 2.95 3.08 2.92 3.11
Source: Department of Statistics
PRICES AND WAGES
Selected Average Retail Prices1
53
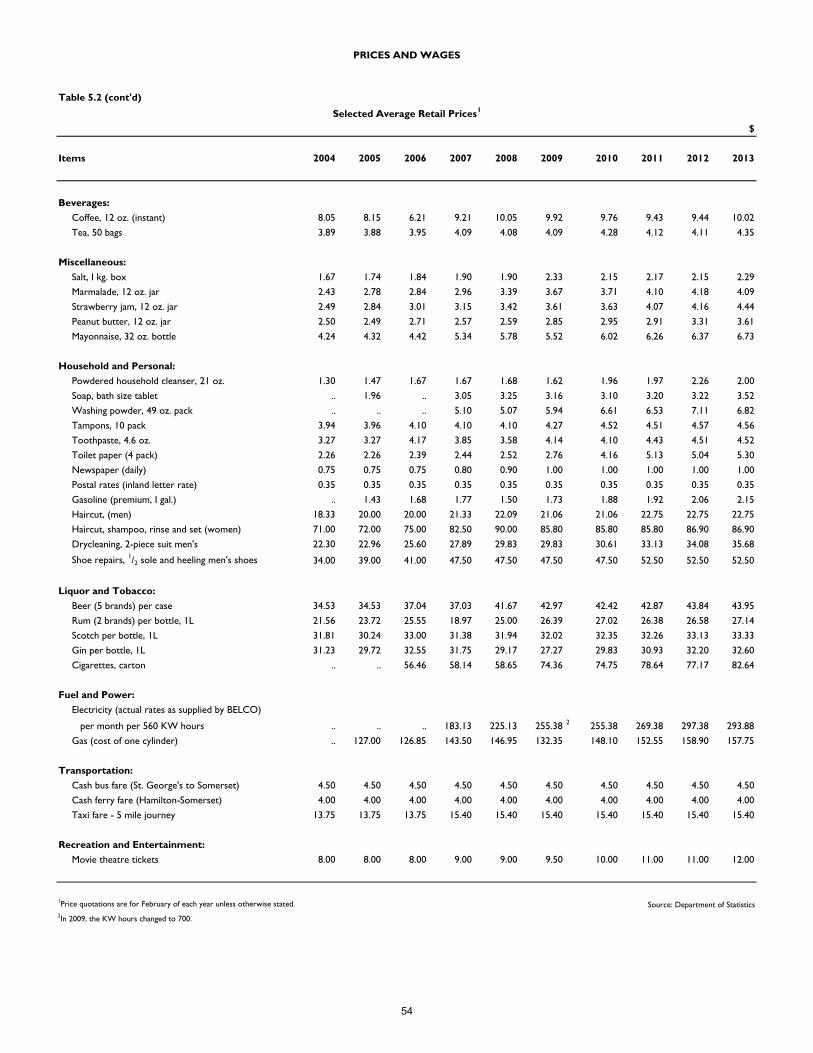
Table 5.2 (cont'd)
$
Items 2004 2005 2006 2007 2008 2009 2010 2011 2012 2013
Beverages:
Coffee, 12 oz. (instant) 8.05 8.15 6.21 9.21 10.05 9.92 9.76 9.43 9.44 10.02
Tea, 50 bags 3.89 3.88 3.95 4.09 4.08 4.09 4.28 4.12 4.11 4.35
Miscellaneous:
Salt, I kg. box 1.67 1.74 1.84 1.90 1.90 2.33 2.15 2.17 2.15 2.29
Marmalade, 12 oz. jar 2.43 2.78 2.84 2.96 3.39 3.67 3.71 4.10 4.18 4.09
Strawberry jam, 12 oz. jar 2.49 2.84 3.01 3.15 3.42 3.61 3.63 4.07 4.16 4.44
Peanut butter, 12 oz. jar 2.50 2.49 2.71 2.57 2.59 2.85 2.95 2.91 3.31 3.61
Mayonnaise, 32 oz. bottle 4.24 4.32 4.42 5.34 5.78 5.52 6.02 6.26 6.37 6.73
Household and Personal:
Powdered household cleanser, 21 oz. 1.30 1.47 1.67 1.67 1.68 1.62 1.96 1.97 2.26 2.00
Soap, bath size tablet .. 1.96 .. 3.05 3.25 3.16 3.10 3.20 3.22 3.52
Washing powder, 49 oz. pack .. .. .. 5.10 5.07 5.94 6.61 6.53 7.11 6.82
Tampons, 10 pack 3.94 3.96 4.10 4.10 4.10 4.27 4.52 4.51 4.57 4.56
Toothpaste, 4.6 oz. 3.27 3.27 4.17 3.85 3.58 4.14 4.10 4.43 4.51 4.52
Toilet paper (4 pack) 2.26 2.26 2.39 2.44 2.52 2.76 4.16 5.13 5.04 5.30
Newspaper (daily) 0.75 0.75 0.75 0.80 0.90 1.00 1.00 1.00 1.00 1.00
Postal rates (inland letter rate) 0.35 0.35 0.35 0.35 0.35 0.35 0.35 0.35 0.35 0.35
Gasoline (premium, I gal.) .. 1.43 1.68 1.77 1.50 1.73 1.88 1.92 2.06 2.15
Haircut, (men) 18.33 20.00 20.00 21.33 22.09 21.06 21.06 22.75 22.75 22.75
Haircut, shampoo, rinse and set (women) 71.00 72.00 75.00 82.50 90.00 85.80 85.80 85.80 86.90 86.90
Drycleaning, 2-piece suit men's 22.30 22.96 25.60 27.89 29.83 29.83 30.61 33.13 34.08 35.68
Shoe repairs, 1/2 sole and heeling men's shoes 34.00 39.00 41.00 47.50 47.50 47.50 47.50 52.50 52.50 52.50
Liquor and Tobacco:
Beer (5 brands) per case 34.53 34.53 37.04 37.03 41.67 42.97 42.42 42.87 43.84 43.95
Rum (2 brands) per bottle, 1L 21.56 23.72 25.55 18.97 25.00 26.39 27.02 26.38 26.58 27.14
Scotch per bottle, 1L 31.81 30.24 33.00 31.38 31.94 32.02 32.35 32.26 33.13 33.33
Gin per bottle, 1L 31.23 29.72 32.55 31.75 29.17 27.27 29.83 30.93 32.20 32.60
Cigarettes, carton .. .. 56.46 58.14 58.65 74.36 74.75 78.64 77.17 82.64
Fuel and Power:
Electricity (actual rates as supplied by BELCO)
per month per 560 KW hours .. .. .. 183.13 225.13 255.38 2 255.38 269.38 297.38 293.88
Gas (cost of one cylinder) .. 127.00 126.85 143.50 146.95 132.35 148.10 152.55 158.90 157.75
Transportation:
Cash bus fare (St. George's to Somerset) 4.50 4.50 4.50 4.50 4.50 4.50 4.50 4.50 4.50 4.50
Cash ferry fare (Hamilton-Somerset) 4.00 4.00 4.00 4.00 4.00 4.00 4.00 4.00 4.00 4.00
Taxi fare - 5 mile journey 13.75 13.75 13.75 15.40 15.40 15.40 15.40 15.40 15.40 15.40
Recreation and Entertainment:
Movie theatre tickets 8.00 8.00 8.00 9.00 9.00 9.50 10.00 11.00 11.00 12.00
1Price quotations are for February of each year unless otherwise stated. Source: Department of Statistics2In 2009, the KW hours changed to 700.
PRICES AND WAGES
Selected Average Retail Prices1
54
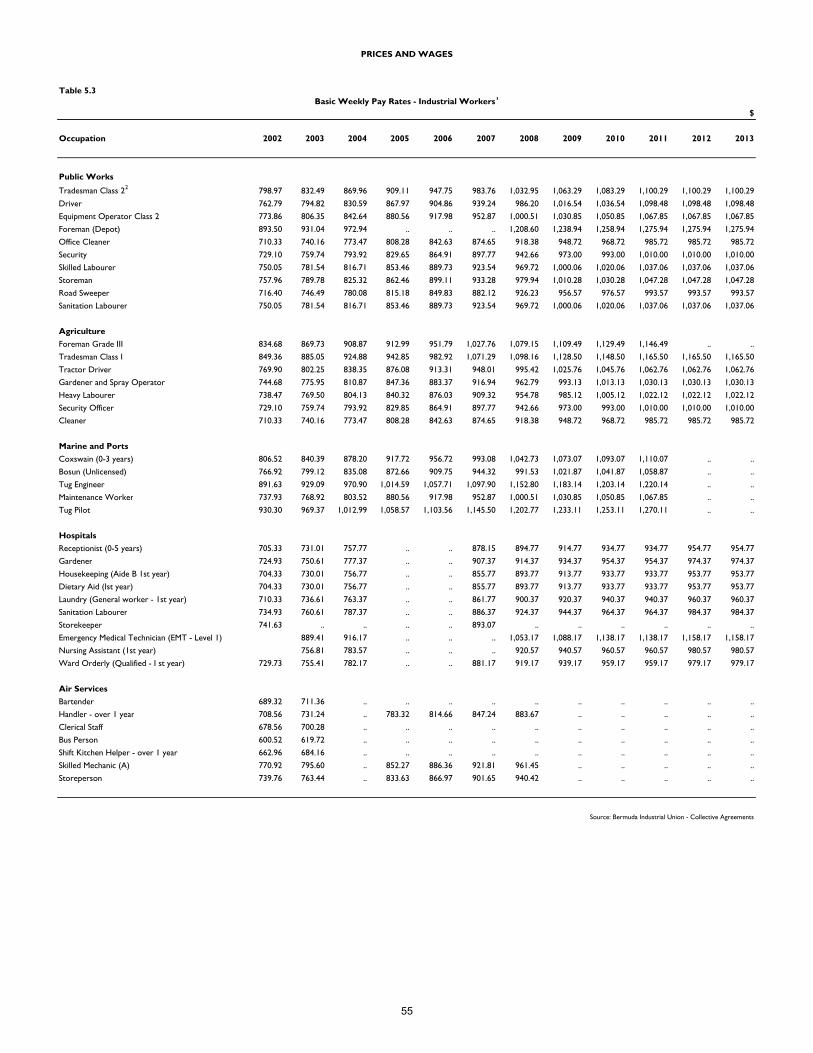
Table 5.3
$
Occupation 2002 2003 2004 2005 2006 2007 2008 2009 2010 2011 2012 2013
Public Works
Tradesman Class 22 798.97 832.49 869.96 909.11 947.75 983.76 1,032.95 1,063.29 1,083.29 1,100.29 1,100.29 1,100.29
Driver 762.79 794.82 830.59 867.97 904.86 939.24 986.20 1,016.54 1,036.54 1,098.48 1,098.48 1,098.48
Equipment Operator Class 2 773.86 806.35 842.64 880.56 917.98 952.87 1,000.51 1,030.85 1,050.85 1,067.85 1,067.85 1,067.85
Foreman (Depot) 893.50 931.04 972.94 .. .. .. 1,208.60 1,238.94 1,258.94 1,275.94 1,275.94 1,275.94
Office Cleaner 710.33 740.16 773.47 808.28 842.63 874.65 918.38 948.72 968.72 985.72 985.72 985.72
Security 729.10 759.74 793.92 829.65 864.91 897.77 942.66 973.00 993.00 1,010.00 1,010.00 1,010.00
Skilled Labourer 750.05 781.54 816.71 853.46 889.73 923.54 969.72 1,000.06 1,020.06 1,037.06 1,037.06 1,037.06
Storeman 757.96 789.78 825.32 862.46 899.11 933.28 979.94 1,010.28 1,030.28 1,047.28 1,047.28 1,047.28
Road Sweeper 716.40 746.49 780.08 815.18 849.83 882.12 926.23 956.57 976.57 993.57 993.57 993.57
Sanitation Labourer 750.05 781.54 816.71 853.46 889.73 923.54 969.72 1,000.06 1,020.06 1,037.06 1,037.06 1,037.06
Agriculture
Foreman Grade III 834.68 869.73 908.87 912.99 951.79 1,027.76 1,079.15 1,109.49 1,129.49 1,146.49 .. ..
Tradesman Class I 849.36 885.05 924.88 942.85 982.92 1,071.29 1,098.16 1,128.50 1,148.50 1,165.50 1,165.50 1,165.50
Tractor Driver 769.90 802.25 838.35 876.08 913.31 948.01 995.42 1,025.76 1,045.76 1,062.76 1,062.76 1,062.76
Gardener and Spray Operator 744.68 775.95 810.87 847.36 883.37 916.94 962.79 993.13 1,013.13 1,030.13 1,030.13 1,030.13
Heavy Labourer 738.47 769.50 804.13 840.32 876.03 909.32 954.78 985.12 1,005.12 1,022.12 1,022.12 1,022.12
Security Officer 729.10 759.74 793.92 829.85 864.91 897.77 942.66 973.00 993.00 1,010.00 1,010.00 1,010.00
Cleaner 710.33 740.16 773.47 808.28 842.63 874.65 918.38 948.72 968.72 985.72 985.72 985.72
Marine and Ports
Coxswain (0-3 years) 806.52 840.39 878.20 917.72 956.72 993.08 1,042.73 1,073.07 1,093.07 1,110.07 .. ..
Bosun (Unlicensed) 766.92 799.12 835.08 872.66 909.75 944.32 991.53 1,021.87 1,041.87 1,058.87 .. ..
Tug Engineer 891.63 929.09 970.90 1,014.59 1,057.71 1,097.90 1,152.80 1,183.14 1,203.14 1,220.14 .. ..
Maintenance Worker 737.93 768.92 803.52 880.56 917.98 952.87 1,000.51 1,030.85 1,050.85 1,067.85 .. ..
Tug Pilot 930.30 969.37 1,012.99 1,058.57 1,103.56 1,145.50 1,202.77 1,233.11 1,253.11 1,270.11 .. ..
Hospitals
Receptionist (0-5 years) 705.33 731.01 757.77 .. .. 878.15 894.77 914.77 934.77 934.77 954.77 954.77
Gardener 724.93 750.61 777.37 .. .. 907.37 914.37 934.37 954.37 954.37 974.37 974.37
Housekeeping (Aide B 1st year) 704.33 730.01 756.77 .. .. 855.77 893.77 913.77 933.77 933.77 953.77 953.77
Dietary Aid (Ist year) 704.33 730.01 756.77 .. .. 855.77 893.77 913.77 933.77 933.77 953.77 953.77
Laundry (General worker - 1st year) 710.33 736.61 763.37 .. .. 861.77 900.37 920.37 940.37 940.37 960.37 960.37
Sanitation Labourer 734.93 760.61 787.37 .. .. 886.37 924.37 944.37 964.37 964.37 984.37 984.37
Storekeeper 741.63 .. .. .. .. 893.07 .. .. .. .. .. ..
Emergency Medical Technician (EMT - Level 1) 889.41 916.17 .. .. .. 1,053.17 1,088.17 1,138.17 1,138.17 1,158.17 1,158.17
Nursing Assistant (1st year) 756.81 783.57 .. .. .. 920.57 940.57 960.57 960.57 980.57 980.57
Ward Orderly (Qualified - I st year) 729.73 755.41 782.17 .. .. 881.17 919.17 939.17 959.17 959.17 979.17 979.17
Air Services
Bartender 689.32 711.36 .. .. .. .. .. .. .. .. .. ..
Handler - over 1 year 708.56 731.24 .. 783.32 814.66 847.24 883.67 .. .. .. .. ..
Clerical Staff 678.56 700.28 .. .. .. .. .. .. .. .. .. ..
Bus Person 600.52 619.72 .. .. .. .. .. .. .. .. .. ..
Shift Kitchen Helper - over 1 year 662.96 684.16 .. .. .. .. .. .. .. .. .. ..
Skilled Mechanic (A) 770.92 795.60 .. 852.27 886.36 921.81 961.45 .. .. .. .. ..
Storeperson 739.76 763.44 .. 833.63 866.97 901.65 940.42 .. .. .. .. ..
Source: Bermuda Industrial Union - Collective Agreements
PRICES AND WAGES
Basic Weekly Pay Rates - Industrial Workers1
55
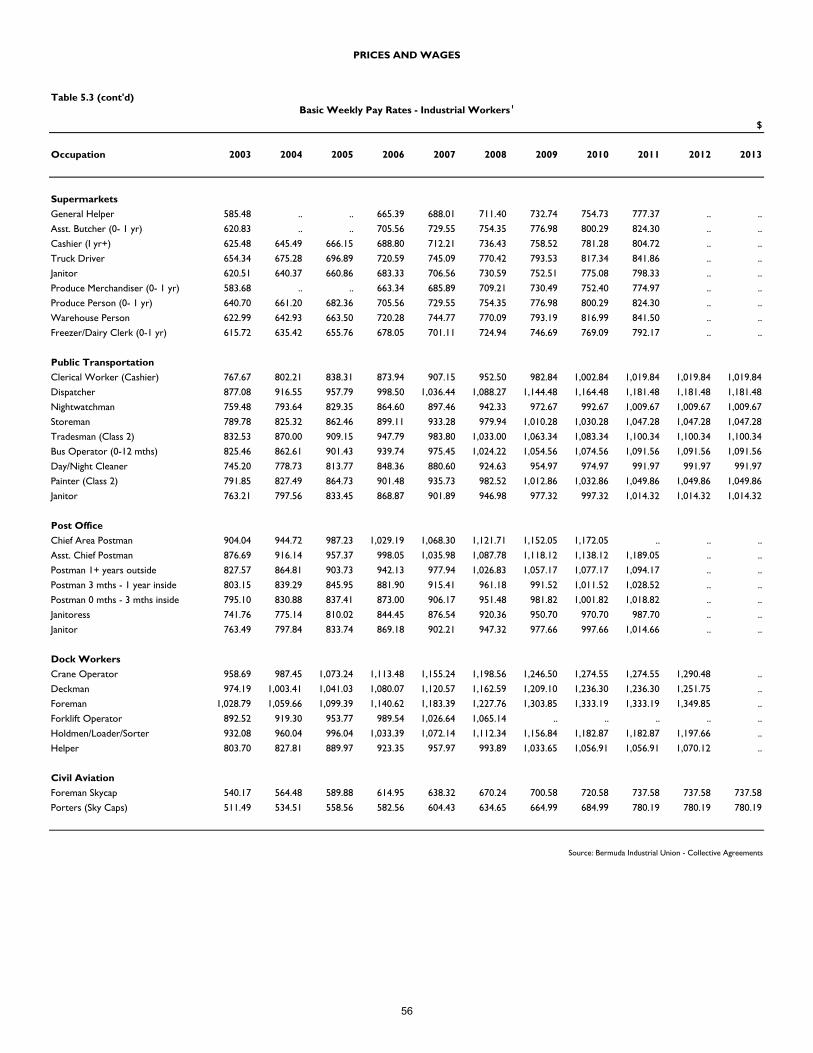
Table 5.3 (cont'd)
$
Occupation 2003 2004 2005 2006 2007 2008 2009 2010 2011 2012 2013
Supermarkets
General Helper 585.48 .. .. 665.39 688.01 711.40 732.74 754.73 777.37 .. ..
Asst. Butcher (0- 1 yr) 620.83 .. .. 705.56 729.55 754.35 776.98 800.29 824.30 .. ..
Cashier (I yr+) 625.48 645.49 666.15 688.80 712.21 736.43 758.52 781.28 804.72 .. ..
Truck Driver 654.34 675.28 696.89 720.59 745.09 770.42 793.53 817.34 841.86 .. ..
Janitor 620.51 640.37 660.86 683.33 706.56 730.59 752.51 775.08 798.33 .. ..
Produce Merchandiser (0- 1 yr) 583.68 .. .. 663.34 685.89 709.21 730.49 752.40 774.97 .. ..
Produce Person (0- 1 yr) 640.70 661.20 682.36 705.56 729.55 754.35 776.98 800.29 824.30 .. ..
Warehouse Person 622.99 642.93 663.50 720.28 744.77 770.09 793.19 816.99 841.50 .. ..
Freezer/Dairy Clerk (0-1 yr) 615.72 635.42 655.76 678.05 701.11 724.94 746.69 769.09 792.17 .. ..
Public Transportation
Clerical Worker (Cashier) 767.67 802.21 838.31 873.94 907.15 952.50 982.84 1,002.84 1,019.84 1,019.84 1,019.84
Dispatcher 877.08 916.55 957.79 998.50 1,036.44 1,088.27 1,144.48 1,164.48 1,181.48 1,181.48 1,181.48
Nightwatchman 759.48 793.64 829.35 864.60 897.46 942.33 972.67 992.67 1,009.67 1,009.67 1,009.67
Storeman 789.78 825.32 862.46 899.11 933.28 979.94 1,010.28 1,030.28 1,047.28 1,047.28 1,047.28
Tradesman (Class 2) 832.53 870.00 909.15 947.79 983.80 1,033.00 1,063.34 1,083.34 1,100.34 1,100.34 1,100.34
Bus Operator (0-12 mths) 825.46 862.61 901.43 939.74 975.45 1,024.22 1,054.56 1,074.56 1,091.56 1,091.56 1,091.56
Day/Night Cleaner 745.20 778.73 813.77 848.36 880.60 924.63 954.97 974.97 991.97 991.97 991.97
Painter (Class 2) 791.85 827.49 864.73 901.48 935.73 982.52 1,012.86 1,032.86 1,049.86 1,049.86 1,049.86
Janitor 763.21 797.56 833.45 868.87 901.89 946.98 977.32 997.32 1,014.32 1,014.32 1,014.32
Post Office
Chief Area Postman 904.04 944.72 987.23 1,029.19 1,068.30 1,121.71 1,152.05 1,172.05 .. .. ..
Asst. Chief Postman 876.69 916.14 957.37 998.05 1,035.98 1,087.78 1,118.12 1,138.12 1,189.05 .. ..
Postman 1+ years outside 827.57 864.81 903.73 942.13 977.94 1,026.83 1,057.17 1,077.17 1,094.17 .. ..
Postman 3 mths - 1 year inside 803.15 839.29 845.95 881.90 915.41 961.18 991.52 1,011.52 1,028.52 .. ..
Postman 0 mths - 3 mths inside 795.10 830.88 837.41 873.00 906.17 951.48 981.82 1,001.82 1,018.82 .. ..
Janitoress 741.76 775.14 810.02 844.45 876.54 920.36 950.70 970.70 987.70 .. ..
Janitor 763.49 797.84 833.74 869.18 902.21 947.32 977.66 997.66 1,014.66 .. ..
Dock Workers
Crane Operator 958.69 987.45 1,073.24 1,113.48 1,155.24 1,198.56 1,246.50 1,274.55 1,274.55 1,290.48 ..
Deckman 974.19 1,003.41 1,041.03 1,080.07 1,120.57 1,162.59 1,209.10 1,236.30 1,236.30 1,251.75 ..
Foreman 1,028.79 1,059.66 1,099.39 1,140.62 1,183.39 1,227.76 1,303.85 1,333.19 1,333.19 1,349.85 ..
Forklift Operator 892.52 919.30 953.77 989.54 1,026.64 1,065.14 .. .. .. .. ..
Holdmen/Loader/Sorter 932.08 960.04 996.04 1,033.39 1,072.14 1,112.34 1,156.84 1,182.87 1,182.87 1,197.66 ..
Helper 803.70 827.81 889.97 923.35 957.97 993.89 1,033.65 1,056.91 1,056.91 1,070.12 ..
Civil Aviation
Foreman Skycap 540.17 564.48 589.88 614.95 638.32 670.24 700.58 720.58 737.58 737.58 737.58
Porters (Sky Caps) 511.49 534.51 558.56 582.56 604.43 634.65 664.99 684.99 780.19 780.19 780.19
Source: Bermuda Industrial Union - Collective Agreements
PRICES AND WAGES
Basic Weekly Pay Rates - Industrial Workers1
56

Table 5.3 (cont'd)
$
Occupation 2003 2004 2005 2006 2007 2008 2009 2010 2011 2012 2013
Construction
Foreman 1,173.03 1,210.40 1,249.20 1,299.20 1,351.20 1,402.40 1,429.20 1,500.80 .. .. ..
Foreman (Labour) 923.56 953.20 983.60 1,022.80 1,063.60 1,104.00 1,125.20 1,181.60 .. .. ..
Operator B 932.51 962.40 993.20 1,032.80 1,074.00 1,114.80 1,136.00 1,192.80 .. .. ..
Mechanic (Top Grade) 1,045.63 1,078.80 1,113.60 1,158.00 1,204.40 1,250.00 1,273.60 1,337.20 .. .. ..
Mechanic 968.42 1,040.80 1,074.00 1,116.80 1,161.60 1,205.60 1,228.40 1,289.60 .. .. ..
Mixer Operator 794.27 819.60 846.00 880.00 915.20 950.00 968.00 1,016.40 .. .. ..
Paint Applier 765.12 789.60 814.80 847.20 881.20 914.48 932.00 978.40 .. .. ..
Mechanic Steel Fixer 950.69 1,040.80 1,074.00 1,116.80 1,161.60 1,205.60 1,228.40 1,289.60 .. .. ..
Skilled Labourer 800.20 825.60 852.00 886.00 921.60 956.80 974.40 1,023.20 .. .. ..
Storeman 968.38 999.20 1,031.20 1,072.40 1,115.20 1,157.60 1,179.60 1,238.40 .. .. ..
Truck Driver 812.45 838.40 865.20 900.00 936.00 971.60 990.00 1,039.60 .. .. ..
Welder . . 978.00 1,011.60 1,052.00 1,094.00 1,135.60 1,157.20 1,215.20 .. .. ..
Form Carpenter 968.38 1,040.80 1,074.00 1,116.80 1,161.60 1,205.60 1,228.40 1,289.60 .. .. ..
Hammerman 800.20 826.00 852.40 886.40 922.00 957.20 975.20 1,024.00 .. .. ..
Hotels (Tipped Live-Out Workers)
Bell Staff-Doorman/Starter 241.56 248.43 256.19 264.64 273.38 281.58 290.03 298.73 .. 287.21 ..
Waiter/Waitress 221.10 227.95 235.71 243.49 251.52 259.07 266.84 274.84 .. 264.25 ..
Night Housekeeper 265.08 271.93 294.69 304.41 314.46 323.89 333.61 343.62 .. 330.37 ..
Cottage/Apartment Attendant 228.10 234.95 242.71 250.72 258.99 266.76 274.76 283.01 .. 272.09 ..
On Call Room Attendant 221.10 227.95 235.71 243.49 251.52 259.07 271.99 285.30 .. 264.25 ..
Hotels (Non-Tipped Workers)
Chauffer 565.17 582.50 605.12 626.30 648.22 674.15 701.11 729.16 .. 684.26 ..
Linen Controller 586.71 604.04 626.66 648.59 671.29 698.14 726.07 755.11 .. 708.61 ..
Head Controlman/Mechanic 600.71 618.04 640.66 663.08 686.29 724.14 760.39 796.00 .. 735.00 ..
Chef Gourmet 614.31 631.64 644.26 666.81 690.15 717.76 r 746.47 776.32 .. 728.52 ..
Towel Folder 557.91 575.24 597.86 618.79 640.44 666.06 r 692.70 720.41 .. 676.05 ..
Shampoo Supervisor 602.16 619.49 642.11 664.58 687.84 715.35 r 743.97 773.73 .. 726.08 ..
Social Desk Hostess 565.71 583.04 605.66 626.86 648.80 685.15 r 719.84 753.83 .. 695.43 ..
Garages
Tradesman (Junior) 614.23 632.66 .. 644.96 694.88 726.51 r 726.51 726.51 .. .. ..
New Car Preparer 513.82 529.23 585.58 611.93 639.46 668.23 r 668.23 668.23 .. .. ..
Storeman (Junior) 486.28 500.87 537.67 561.86 587.14 613.56 r 613.56 613.56 .. .. ..
Working Foreman 828.76 853.62 858.59 897.22 937.59 979.78 r 979.78 979.78 .. .. ..
Mechanic (Grade A1) 773.31 796.31 800.97 837.01 874.67 909.67 r 909.67 909.67 .. .. ..
1For the present edition the minimum weekly rate is shown for selected Source: Bermuda Industrial Union - Collective Agreements
workers or a group of workers with roughly equivalent levels of pay.2Includes: electricians, fitters, masons, painters, panel beaters,
plumbers, mechanics and welders.
PRICES AND WAGES
Basic Weekly Pay Rates - Industrial Workers1
57
Section VI
Home Finance
2013 Quick Facts
Government Deficit (Fiscal year 13/14):
$332 million
Corporation of Hamilton Deficit:
$3.4 million
Corporation of St. George Deficit:
$180,000
58
Government’s Deficit Gap Widens
For the eleventh consecutive year, Bermuda Government’s revenue has fallen short of its
expenditure (Figure 1). The last time revenue exceeded expenditure was in the 2002/03 fiscal
year. In the 2013/14 fiscal year, expenditure was 38% (or $332 million) higher than revenue, the
largest deficit of the eleven-year period. The primary component of total revenue during the
past fiscal year was payroll tax at 37% whilst wages and salaries were the single largest item of
expenditure, comprising 35% of the total (Table 6.1).
Bermuda Monetary Authority’s Balance Increases Over Decade
From 2004 to 2013, total assets, liabilities, capital and reserves increased by 45%, balancing at
$190.7 million. In 2013, securities contributed the most to total assets at 55% of the total. On
the liabilities, capital and reserves section of the balance sheet, notes and coins in circulation
comprised the majority of the total at 76% (Table 6.2).
Corporation of Hamilton’s Expenditure Exceeds Revenue for 6th Consecutive Year
The Corporation of Hamilton’s revenue exceeded expenditure from 2003 to 2007 but fell short of expenditures between 2008 and 2013 (Figure 2). Over the eleven-year period, revenue
increased by 17% and expenditure by 66%. In 2013, expenditure was 16% higher than revenue,
resulting in a deficit of $3.4 million. One of the factors contributing to the shortfall of revenue
in 2012 was the cessation of collecting wharfage fees, which remained in effect in 2013. The
most significant contributor to total revenue in 2013 was taxes at 40%. Staff costs were the
largest item of expenditure, comprising 32% of the total (Table 6.3).
Corporation of St. George’s Revenue and Expenditure Increases in 2013
Figure 3 shows a trend of decreasing revenue and expenditure since 2005 for the Corporation
of St. George. Revenue declined by 35% and expenditure by 24% over the nine-year period.
However, expenditure increased by $136,000 from 2012 to 2013, the first increase since 2006.
Revenue also increased between 2012 and 2013 by a total of $168,000. The net result was a
reduction in the deficit over the past year by 15% to $180,000 (Table 6.4).
The Corporation of St. George was no longer able to collect wharfage in 2012 due to the
introduction of the Municipalities Reform Bill 2010. As a result, the Bermuda Government
increased significantly the grants provided to the Corporation in 2012 in an attempt to lessen
this impact. Government transfers (grants) increased further in 2013 to $1.6 million, an
increase of 23% over the previous year. A heavy reliance on Government transfers as a revenue
source is evidenced by the fact that 86% of the Corporation of St. George’s total revenues
were from Government transfers in 2013 (Table 6.4).
For the years 2005 to 2007, significant capital outlays were made relating to damage sustained
from Hurricane Fabian. These capital outlays stopped in 2008 and contributed to a reduction in
total expenditure up to 2012. Staff and office expenses were the largest expense items in 2013
at 70% of total expenditure (Table 6.4).
59
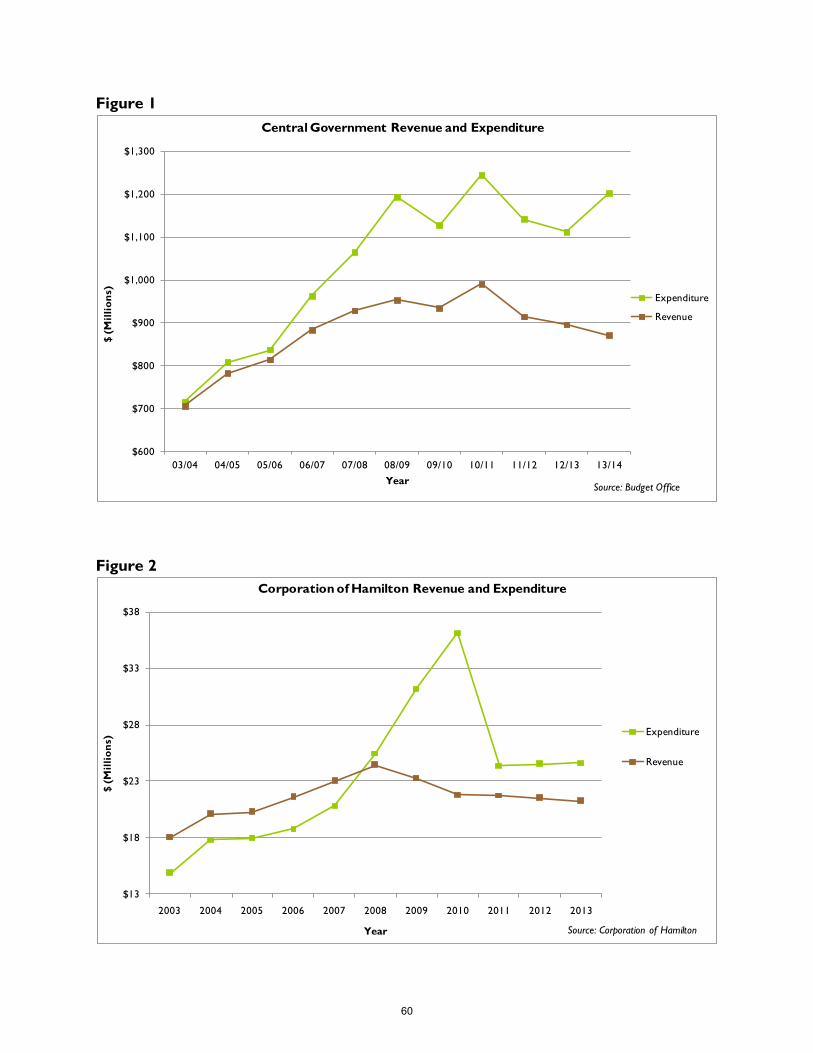
Figure 1
$600
$700
$800
$900
$1,000
$1,100
$1,200
$1,300
03/04 04/05 05/06 06/07 07/08 08/09 09/10 10/11 11/12 12/13 13/14
$ (
Mil
lio
ns)
Year
Central Government Revenue and Expenditure
Expenditure
Revenue
Source: Budget Office
Figure 2
$13
$18
$23
$28
$33
$38
2003 2004 2005 2006 2007 2008 2009 2010 2011 2012 2013
$ (
Mil
lio
ns)
Year
Corporation of Hamilton Revenue and Expenditure
Expenditure
Revenue
Source: Corporation of Hamilton
60
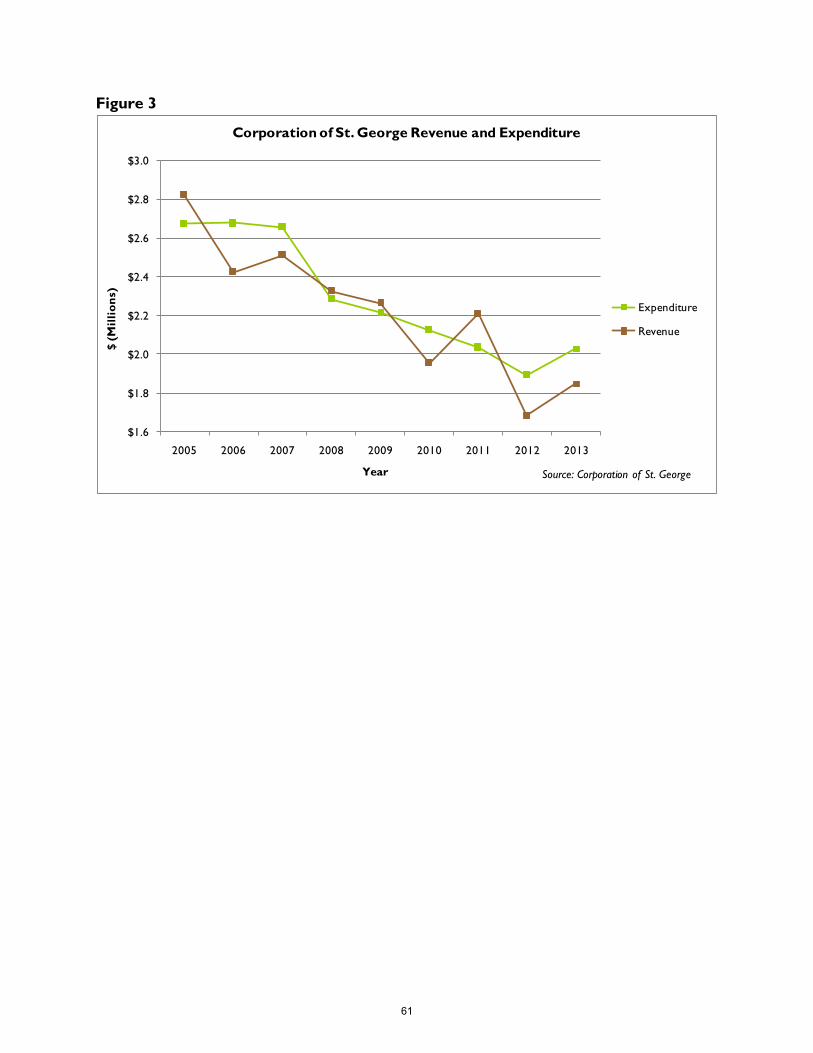
Figure 3
$1.6
$1.8
$2.0
$2.2
$2.4
$2.6
$2.8
$3.0
2005 2006 2007 2008 2009 2010 2011 2012 2013
$ (
Mil
lio
ns)
Year
Corporation of St. George Revenue and Expenditure
Expenditure
Revenue
Source: Corporation of St. George
61
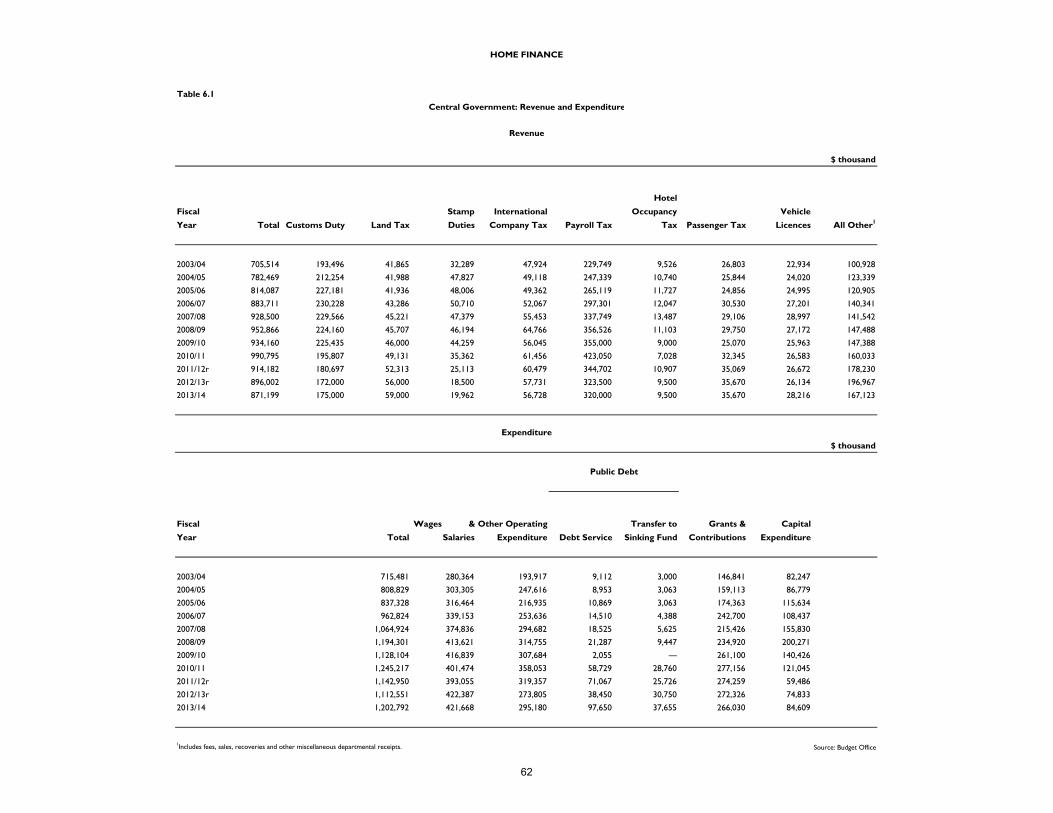
Table 6.1
$ thousand
Fiscal
Year Total Customs Duty Land Tax
Stamp
Duties
International
Company Tax Payroll Tax
Hotel
Occupancy
Tax Passenger Tax
Vehicle
Licences All Other1
2003/04 705,514 193,496 41,865 32,289 47,924 229,749 9,526 26,803 22,934 100,928
2004/05 782,469 212,254 41,988 47,827 49,118 247,339 10,740 25,844 24,020 123,339
2005/06 814,087 227,181 41,936 48,006 49,362 265,119 11,727 24,856 24,995 120,905
2006/07 883,711 230,228 43,286 50,710 52,067 297,301 12,047 30,530 27,201 140,341
2007/08 928,500 229,566 45,221 47,379 55,453 337,749 13,487 29,106 28,997 141,542
2008/09 952,866 224,160 45,707 46,194 64,766 356,526 11,103 29,750 27,172 147,488
2009/10 934,160 225,435 46,000 44,259 56,045 355,000 9,000 25,070 25,963 147,388
2010/11 990,795 195,807 49,131 35,362 61,456 423,050 7,028 32,345 26,583 160,033
2011/12r 914,182 180,697 52,313 25,113 60,479 344,702 10,907 35,069 26,672 178,230
2012/13r 896,002 172,000 56,000 18,500 57,731 323,500 9,500 35,670 26,134 196,967
2013/14 871,199 175,000 59,000 19,962 56,728 320,000 9,500 35,670 28,216 167,123
$ thousand
Fiscal
Year Total
Wages &
Salaries
Other Operating
Expenditure Debt Service
Transfer to
Sinking Fund
Grants &
Contributions
Capital
Expenditure
2003/04 715,481 280,364 193,917 9,112 3,000 146,841 82,247
2004/05 808,829 303,305 247,616 8,953 3,063 159,113 86,779
2005/06 837,328 316,464 216,935 10,869 3,063 174,363 115,634
2006/07 962,824 339,153 253,636 14,510 4,388 242,700 108,437
2007/08 1,064,924 374,836 294,682 18,525 5,625 215,426 155,830
2008/09 1,194,301 413,621 314,755 21,287 9,447 234,920 200,271
2009/10 1,128,104 416,839 307,684 2,055 ― 261,100 140,426
2010/11 1,245,217 401,474 358,053 58,729 28,760 277,156 121,045
2011/12r 1,142,950 393,055 319,357 71,067 25,726 274,259 59,486
2012/13r 1,112,551 422,387 273,805 38,450 30,750 272,326 74,833
2013/14 1,202,792 421,668 295,180 97,650 37,655 266,030 84,609
1Includes fees, sales, recoveries and other miscellaneous departmental receipts. Source: Budget Office
HOME FINANCE
Central Government: Revenue and Expenditure
Revenue
Expenditure
Public Debt
62
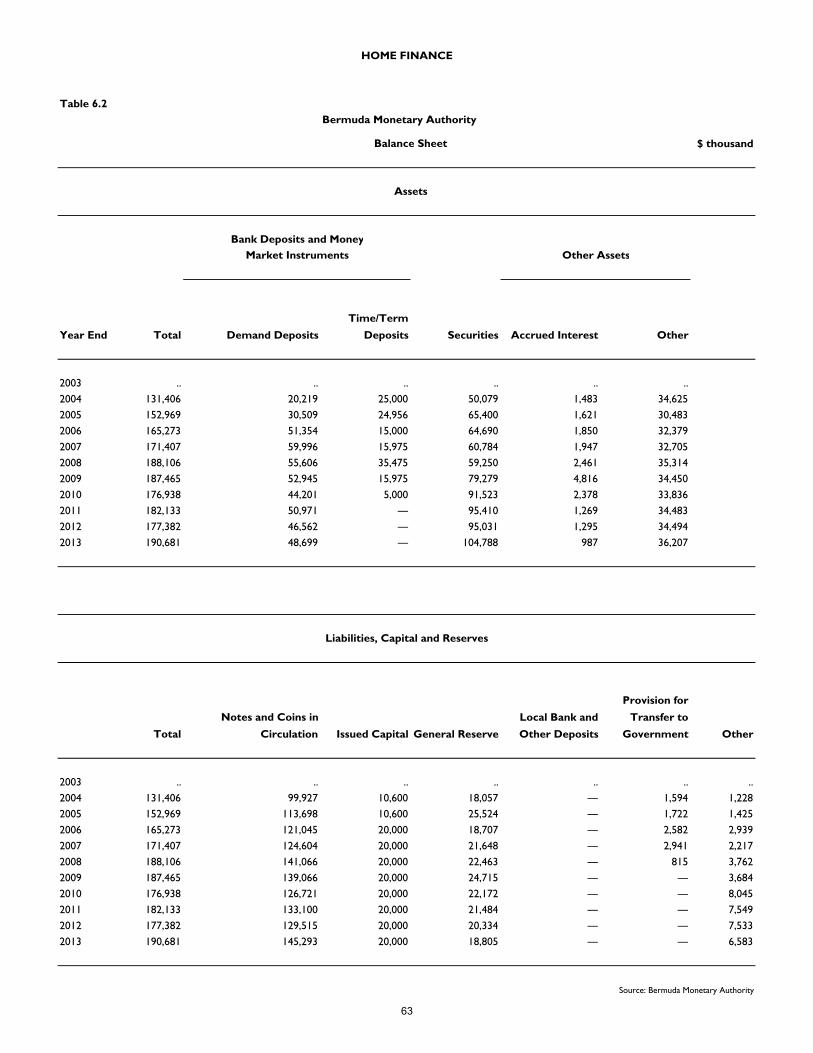
Table 6.2
Bermuda Monetary Authority
$ thousand
Year End Total Demand Deposits
Time/Term
Deposits Securities Accrued Interest Other
2003 .. .. .. .. .. ..
2004 131,406 20,219 25,000 50,079 1,483 34,625
2005 152,969 30,509 24,956 65,400 1,621 30,483
2006 165,273 51,354 15,000 64,690 1,850 32,379
2007 171,407 59,996 15,975 60,784 1,947 32,705
2008 188,106 55,606 35,475 59,250 2,461 35,314
2009 187,465 52,945 15,975 79,279 4,816 34,450
2010 176,938 44,201 5,000 91,523 2,378 33,836
2011 182,133 50,971 ― 95,410 1,269 34,483
2012 177,382 46,562 ― 95,031 1,295 34,494
2013 190,681 48,699 ― 104,788 987 36,207
Total
Notes and Coins in
Circulation Issued Capital General Reserve
Local Bank and
Other Deposits
Provision for
Transfer to
Government Other
2003 .. .. .. .. .. .. ..
2004 131,406 99,927 10,600 18,057 ― 1,594 1,228
2005 152,969 113,698 10,600 25,524 ― 1,722 1,425
2006 165,273 121,045 20,000 18,707 ― 2,582 2,939
2007 171,407 124,604 20,000 21,648 ― 2,941 2,217
2008 188,106 141,066 20,000 22,463 ― 815 3,762
2009 187,465 139,066 20,000 24,715 ― ― 3,684
2010 176,938 126,721 20,000 22,172 ― ― 8,045
2011 182,133 133,100 20,000 21,484 ― ― 7,549
2012 177,382 129,515 20,000 20,334 ― ― 7,533
2013 190,681 145,293 20,000 18,805 ― ― 6,583
Source: Bermuda Monetary Authority
Liabilities, Capital and Reserves
HOME FINANCE
Balance Sheet
Assets
Bank Deposits and Money
Market Instruments Other Assets
63
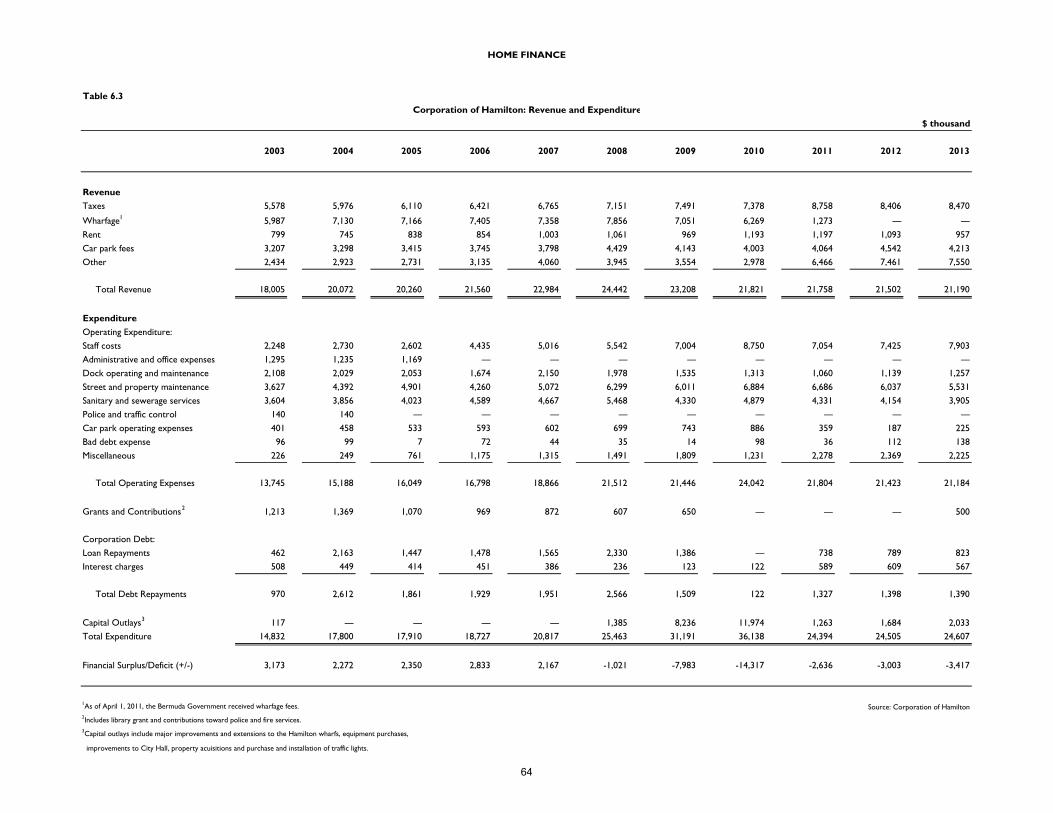
Table 6.3
$ thousand
2003 2004 2005 2006 2007 2008 2009 2010 2011 2012 2013
Revenue
Taxes 5,578 5,976 6,110 6,421 6,765 7,151 7,491 7,378 8,758 8,406 8,470
Wharfage1 5,987 7,130 7,166 7,405 7,358 7,856 7,051 6,269 1,273 ― ―
Rent 799 745 838 854 1,003 1,061 969 1,193 1,197 1,093 957
Car park fees 3,207 3,298 3,415 3,745 3,798 4,429 4,143 4,003 4,064 4,542 4,213
Other 2,434 2,923 2,731 3,135 4,060 3,945 3,554 2,978 6,466 7,461 7,550
Total Revenue 18,005 20,072 20,260 21,560 22,984 24,442 23,208 21,821 21,758 21,502 21,190
Expenditure
Operating Expenditure:
Staff costs 2,248 2,730 2,602 4,435 5,016 5,542 7,004 8,750 7,054 7,425 7,903
Administrative and office expenses 1,295 1,235 1,169 ― ― ― ― ― ― ― ―
Dock operating and maintenance 2,108 2,029 2,053 1,674 2,150 1,978 1,535 1,313 1,060 1,139 1,257
Street and property maintenance 3,627 4,392 4,901 4,260 5,072 6,299 6,011 6,884 6,686 6,037 5,531
Sanitary and sewerage services 3,604 3,856 4,023 4,589 4,667 5,468 4,330 4,879 4,331 4,154 3,905
Police and traffic control 140 140 ― ― ― ― ― ― ― ― ―
Car park operating expenses 401 458 533 593 602 699 743 886 359 187 225
Bad debt expense 96 99 7 72 44 35 14 98 36 112 138
Miscellaneous 226 249 761 1,175 1,315 1,491 1,809 1,231 2,278 2,369 2,225
Total Operating Expenses 13,745 15,188 16,049 16,798 18,866 21,512 21,446 24,042 21,804 21,423 21,184
Grants and Contributions2 1,213 1,369 1,070 969 872 607 650 ― ― ― 500
Corporation Debt:
Loan Repayments 462 2,163 1,447 1,478 1,565 2,330 1,386 ― 738 789 823
Interest charges 508 449 414 451 386 236 123 122 589 609 567
Total Debt Repayments 970 2,612 1,861 1,929 1,951 2,566 1,509 122 1,327 1,398 1,390
Capital Outlays3 117 ― ― ― ― 1,385 8,236 11,974 1,263 1,684 2,033Total Expenditure 14,832 17,800 17,910 18,727 20,817 25,463 31,191 36,138 24,394 24,505 24,607
Financial Surplus/Deficit (+/-) 3,173 2,272 2,350 2,833 2,167 -1,021 -7,983 -14,317 -2,636 -3,003 -3,417
1As of April 1, 2011, the Bermuda Government received wharfage fees. Source: Corporation of Hamilton2Includes library grant and contributions toward police and fire services.3Capital outlays include major improvements and extensions to the Hamilton wharfs, equipment purchases,
improvements to City Hall, property acuisitions and purchase and installation of traffic lights.
HOME FINANCE
Corporation of Hamilton: Revenue and Expenditure
64

Table 6.4
$ thousand
2005 2006 2007 2008 2009 2010 2011 2012 2013
Revenue
Taxes 1 336 ― ― ― ― ― ― ― ―
Wharfage (net) 1,109 1,115 1,140 1,053 1,101 1,064 1,114 ― ―
Port dues 323 336 346 447 330 166 69 65 34
Rent 225 240 212 209 271 234 222 252 203
Government Transfer 1 148 464 538 420 410 423 748 1,291 1,583
Other 683 273 280 198 154 70 60 73 29
Total Revenue 2,824 2,428 2,516 2,327 2,266 1,957 2,213 1,681 1,849
Expenditure
Operating Expenditure:
Staff and office expenses 1,446 1,499 1,513 1,405 1,481 1,445 1,453 1,408 1,429
Wharf operations and maintenance 21 80 11 35 35 4 2 2 20
Street and property maintenance 480 431 388 427 395 363 364 262 294
Fire Service 31 42 32 1 ― ― ― ― ―
Bad debt expense 4 10 9 -1 7 9 33 33 57
Sanitary and sewerage services 116 163 230 161 184 147 181 174 183
Total Operating Expenses 2,098 2,225 2,183 2,028 2,102 1,968 2,033 1,879 1,983
Corporation Debt:
Interest charges 22 20 15 7 2 2 3 4 ―
Loan Repayments 42 44 107 114 ― ― ― ― ―
Total Debt Repayments 64 64 122 121 2 2 3 4 ―
Capital Outlays 512 389 353 135 114 157 ― 10 46
Total Expenditure 2,674 2,678 2,658 2,284 2,218 2,127 2,036 1,893 2,029
Financial Surplus/Deficit 150 -250 -142 43 48 -170 177 -212 -180
1 The Corporation of St. George receives semi-annual grants from the Government in lieu of the Corporation charging property taxes since 2006. Source: Corporation of St. George
HOME FINANCE
Corporation of St. George: Revenue and Expenditure
65
Section VII
External Trade
2013 Quick Facts Total Imports: $1.00 billion
Primary Imports: Food, Beverages &
Tobacco (20%)
Total Exports: $21.71 million
66

Value of Imports Continues to Rebound
Few goods are manufactured on the island therefore Bermuda relies heavily on imported
products. Figure 1 shows that the value of imports exceeded $1 billion in 2013 for the first time
since 2009. Between 2012 and 2013, the value of imports increased by 14%.
Leading Commodity Group Imported is Food, Beverages & Tobacco
Food, Beverages & Tobacco held the highest share of the total value of imports in 2013 at 20%,
followed by Finished Equipment (e.g. furniture, books, toys, etc.) at 17% and Fuel at 16% (Figure
2 and Table 7.1). This is the first time since 1982 that Fuel has been one of the leading three
commodity groups imported.
Most Imports from the United States
The United States is the main source of Bermuda’s imports. In 2013, the United States
contributed 68% of the total imported products followed by Canada (12%) and the United
Kingdom (3%) (Figure 3). As the United States’ share decreased from 80% of total imports in
2003 to 68% in 2013, the Caribbean and Canada gained in their share from 4% in 2003 to 7% and 12% in 2013, respectively.
Exports Continue Upwards Trend
Exports consist of goods that are manufactured in Bermuda and goods that have been imported
and then re-exported. In 2013, the value of Bermuda’s exports stood at $21.71 million, slightly
above the 2006 to 2013 average of $21.26 million (Table 7.3). According to data derived from
H.M. Customs Bermuda, the value of Bermuda’s exports increased by 28% from 2012 to 2013.
The leading three categories exported in 2013 were:
1. musical instruments;
2. electrical machinery equipment and parts; and
3. aircraft, spacecraft and parts.
67
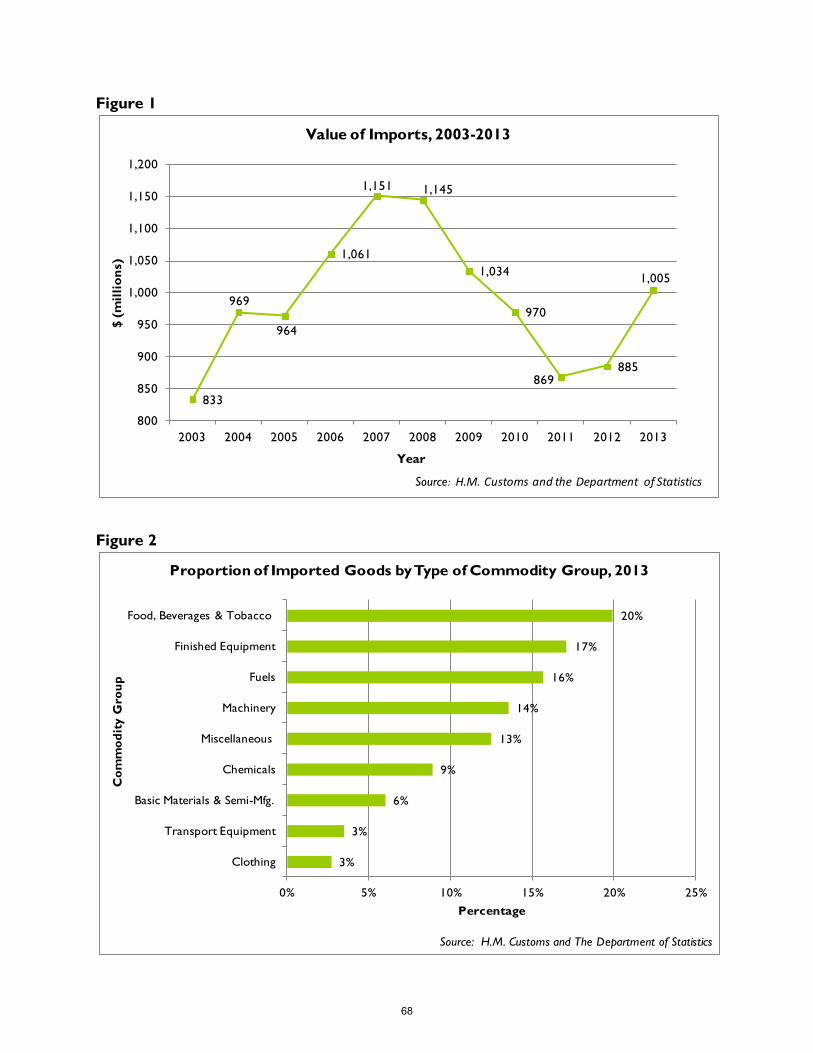
Figure 1
Figure 2
833
969
964
1,061
1,151 1,145
1,034
970
869885
1,005
800
850
900
950
1,000
1,050
1,100
1,150
1,200
2003 2004 2005 2006 2007 2008 2009 2010 2011 2012 2013
$ (
mil
lio
ns)
Year
Value of Imports, 2003-2013
Source: H.M. Customs and the Department of Statistics
3%
3%
6%
9%
13%
14%
16%
17%
20%
0% 5% 10% 15% 20% 25%
Clothing
Transport Equipment
Basic Materials & Semi-Mfg.
Chemicals
Miscellaneous
Machinery
Fuels
Finished Equipment
Food, Beverages & Tobacco
Percentage
Co
mm
od
ity G
rou
p
Proportion of Imported Goods by Type of Commodity Group, 2013
Source: H.M. Customs and The Department of Statistics
68
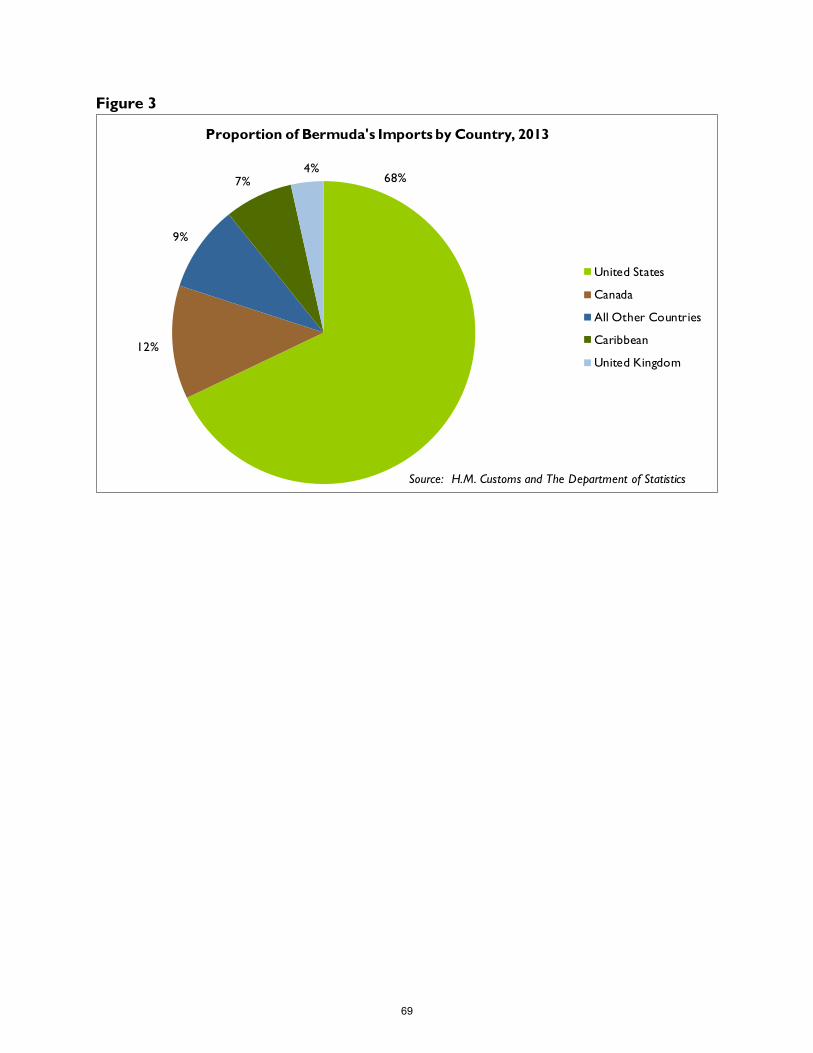
Figure 3
68%
12%
9%
7%4%
Proportion of Bermuda's Imports by Country, 2013
United States
Canada
All Other Countries
Caribbean
United Kingdom
Source: H.M. Customs and The Department of Statistics
69
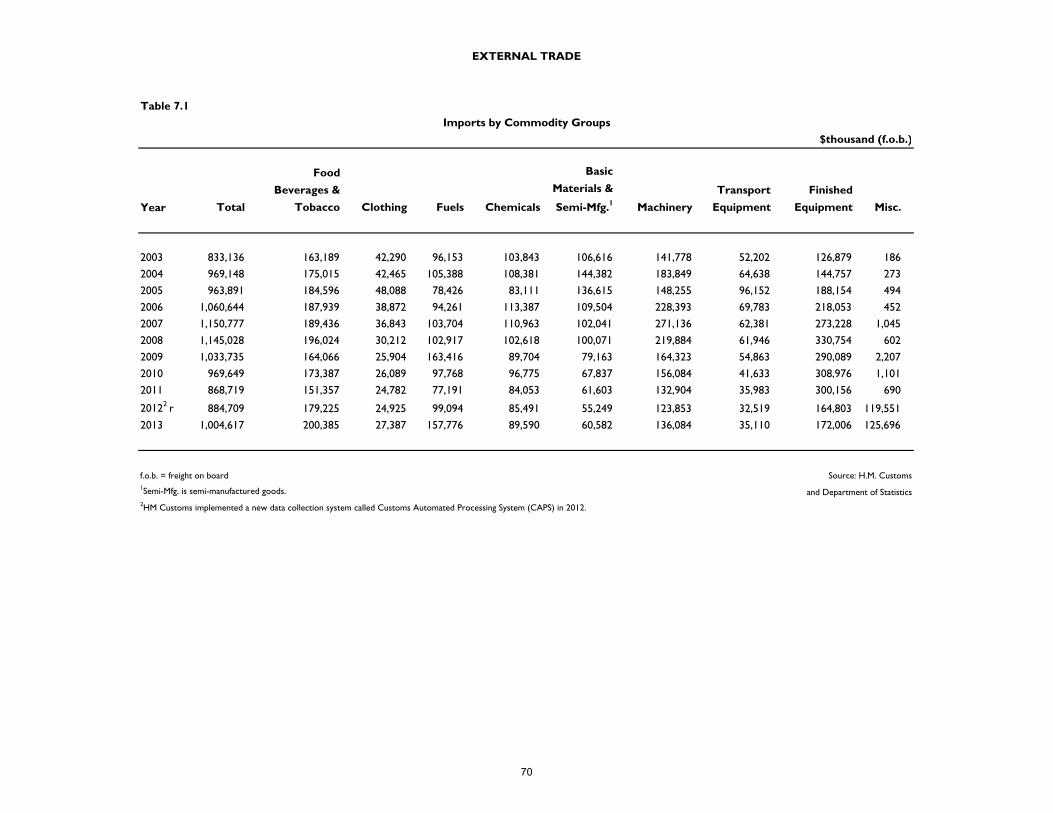
Table 7.1
$thousand (f.o.b.)
Year Total
Food
Beverages &
Tobacco Clothing Fuels Chemicals
Basic
Materials &
Semi-Mfg.1 Machinery
Transport
Equipment
Finished
Equipment Misc.
2003 833,136 163,189 42,290 96,153 103,843 106,616 141,778 52,202 126,879 186
2004 969,148 175,015 42,465 105,388 108,381 144,382 183,849 64,638 144,757 273
2005 963,891 184,596 48,088 78,426 83,111 136,615 148,255 96,152 188,154 494
2006 1,060,644 187,939 38,872 94,261 113,387 109,504 228,393 69,783 218,053 452
2007 1,150,777 189,436 36,843 103,704 110,963 102,041 271,136 62,381 273,228 1,045
2008 1,145,028 196,024 30,212 102,917 102,618 100,071 219,884 61,946 330,754 602
2009 1,033,735 164,066 25,904 163,416 89,704 79,163 164,323 54,863 290,089 2,207
2010 969,649 173,387 26,089 97,768 96,775 67,837 156,084 41,633 308,976 1,101
2011 868,719 151,357 24,782 77,191 84,053 61,603 132,904 35,983 300,156 690
20122 r 884,709 179,225 24,925 99,094 85,491 55,249 123,853 32,519 164,803 119,551
2013 1,004,617 200,385 27,387 157,776 89,590 60,582 136,084 35,110 172,006 125,696
f.o.b. = freight on board Source: H.M. Customs1Semi-Mfg. is semi-manufactured goods. and Department of Statistics2HM Customs implemented a new data collection system called Customs Automated Processing System (CAPS) in 2012.
EXTERNAL TRADE
Imports by Commodity Groups
70
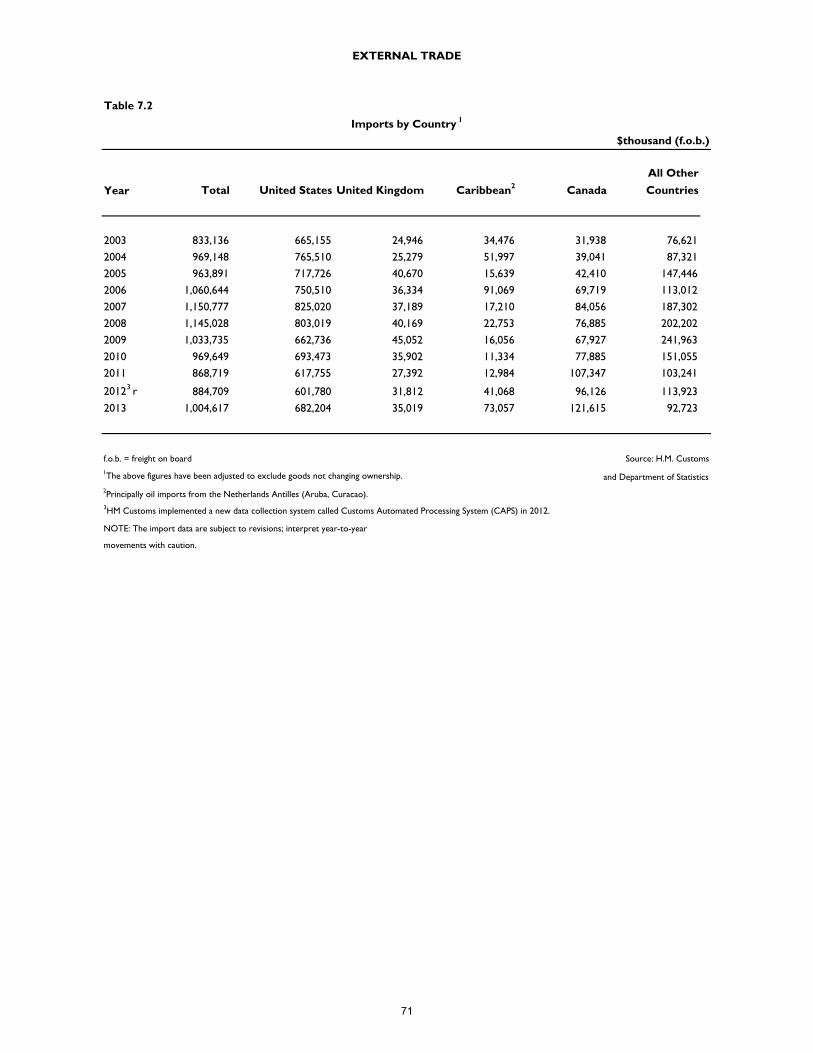
Table 7.2
$thousand (f.o.b.)
Year Total United States United Kingdom Caribbean2 Canada
All Other
Countries
2003 833,136 665,155 24,946 34,476 31,938 76,621
2004 969,148 765,510 25,279 51,997 39,041 87,321
2005 963,891 717,726 40,670 15,639 42,410 147,446
2006 1,060,644 750,510 36,334 91,069 69,719 113,012
2007 1,150,777 825,020 37,189 17,210 84,056 187,302
2008 1,145,028 803,019 40,169 22,753 76,885 202,202
2009 1,033,735 662,736 45,052 16,056 67,927 241,963
2010 969,649 693,473 35,902 11,334 77,885 151,055
2011 868,719 617,755 27,392 12,984 107,347 103,241
20123 r 884,709 601,780 31,812 41,068 96,126 113,923
2013 1,004,617 682,204 35,019 73,057 121,615 92,723
f.o.b. = freight on board Source: H.M. Customs1The above figures have been adjusted to exclude goods not changing ownership. and Department of Statistics2Principally oil imports from the Netherlands Antilles (Aruba, Curacao).3HM Customs implemented a new data collection system called Customs Automated Processing System (CAPS) in 2012.
NOTE: The import data are subject to revisions; interpret year-to-year
movements with caution.
EXTERNAL TRADE
Imports by Country 1
71
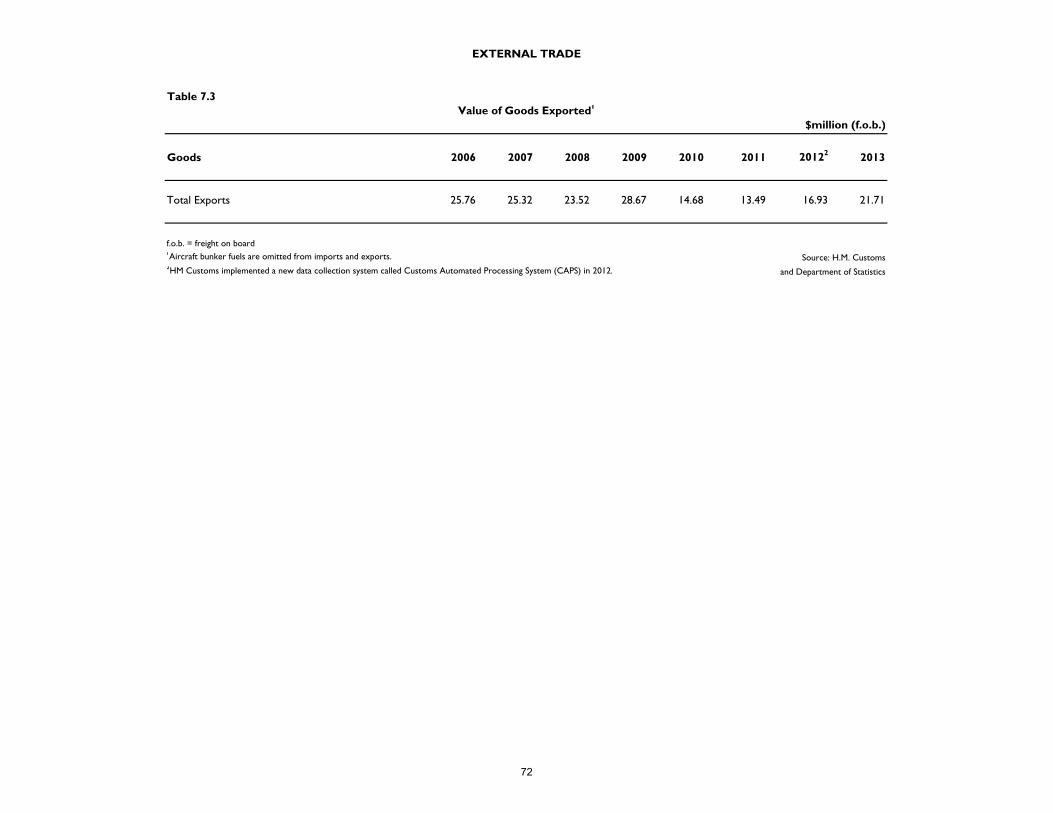
Table 7.3
$million (f.o.b.)
Goods 2006 2007 2008 2009 2010 2011 20122 2013
Total Exports 25.76 25.32 23.52 28.67 14.68 13.49 16.93 21.71
f.o.b. = freight on board1Aircraft bunker fuels are omitted from imports and exports. Source: H.M. Customs2HM Customs implemented a new data collection system called Customs Automated Processing System (CAPS) in 2012. and Department of Statistics
EXTERNAL TRADE
Value of Goods Exported1
72
Section VIII
Transport
2013 Quick Facts
Registered road vehicles: 46,853
Reported accidents: 1,776
Road casualties: 957
Road fatalities: 9
73
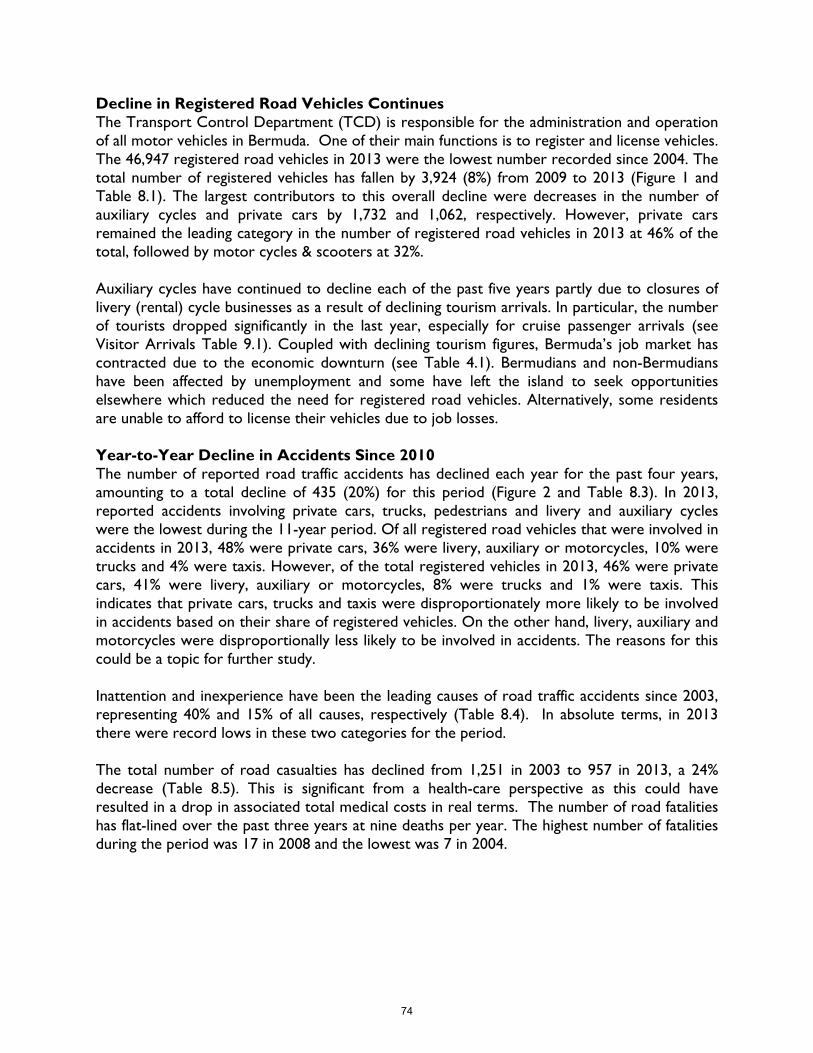
Decline in Registered Road Vehicles Continues The Transport Control Department (TCD) is responsible for the administration and operation of all motor vehicles in Bermuda. One of their main functions is to register and license vehicles. The 46,947 registered road vehicles in 2013 were the lowest number recorded since 2004. The total number of registered vehicles has fallen by 3,924 (8%) from 2009 to 2013 (Figure 1 and Table 8.1). The largest contributors to this overall decline were decreases in the number of auxiliary cycles and private cars by 1,732 and 1,062, respectively. However, private cars remained the leading category in the number of registered road vehicles in 2013 at 46% of the total, followed by motor cycles & scooters at 32%. Auxiliary cycles have continued to decline each of the past five years partly due to closures of livery (rental) cycle businesses as a result of declining tourism arrivals. In particular, the number of tourists dropped significantly in the last year, especially for cruise passenger arrivals (see Visitor Arrivals Table 9.1). Coupled with declining tourism figures, Bermuda’s job market has contracted due to the economic downturn (see Table 4.1). Bermudians and non-Bermudians have been affected by unemployment and some have left the island to seek opportunities elsewhere which reduced the need for registered road vehicles. Alternatively, some residents are unable to afford to license their vehicles due to job losses. Year-to-Year Decline in Accidents Since 2010 The number of reported road traffic accidents has declined each year for the past four years, amounting to a total decline of 435 (20%) for this period (Figure 2 and Table 8.3). In 2013, reported accidents involving private cars, trucks, pedestrians and livery and auxiliary cycles were the lowest during the 11-year period. Of all registered road vehicles that were involved in accidents in 2013, 48% were private cars, 36% were livery, auxiliary or motorcycles, 10% were trucks and 4% were taxis. However, of the total registered vehicles in 2013, 46% were private cars, 41% were livery, auxiliary or motorcycles, 8% were trucks and 1% were taxis. This indicates that private cars, trucks and taxis were disproportionately more likely to be involved in accidents based on their share of registered vehicles. On the other hand, livery, auxiliary and motorcycles were disproportionally less likely to be involved in accidents. The reasons for this could be a topic for further study. Inattention and inexperience have been the leading causes of road traffic accidents since 2003, representing 40% and 15% of all causes, respectively (Table 8.4). In absolute terms, in 2013 there were record lows in these two categories for the period. The total number of road casualties has declined from 1,251 in 2003 to 957 in 2013, a 24% decrease (Table 8.5). This is significant from a health-care perspective as this could have resulted in a drop in associated total medical costs in real terms. The number of road fatalities has flat-lined over the past three years at nine deaths per year. The highest number of fatalities during the period was 17 in 2008 and the lowest was 7 in 2004.
74
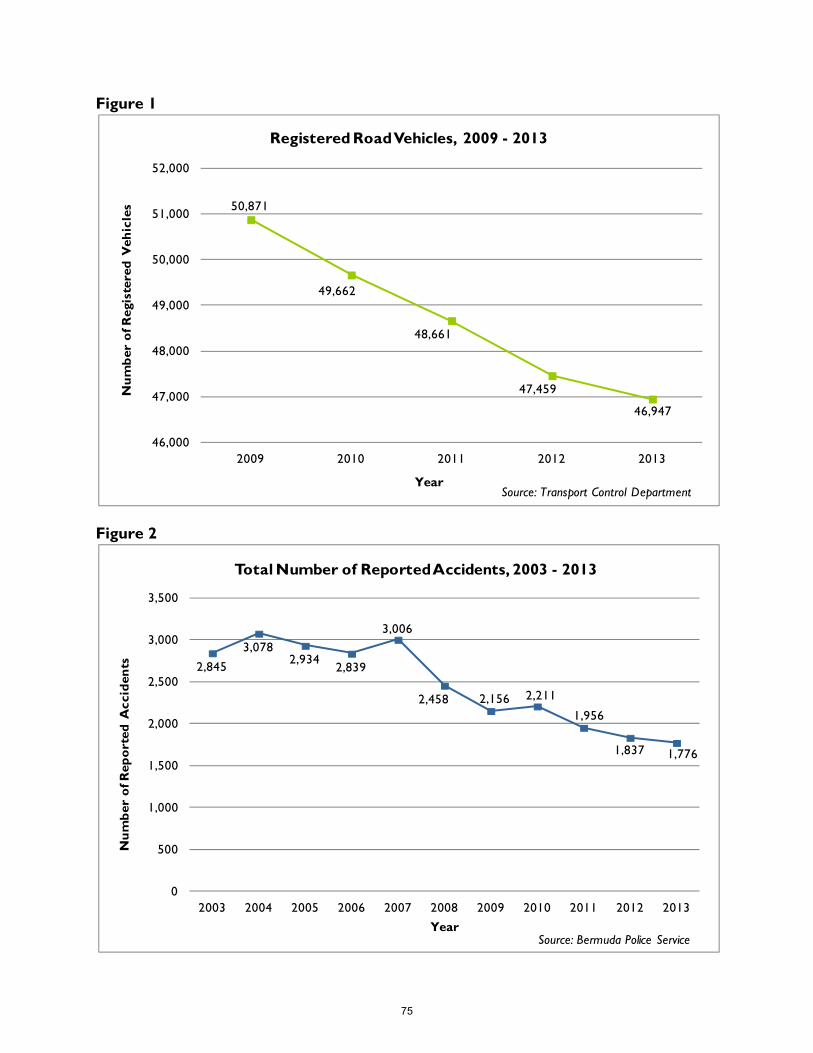
Figure 1
Figure 2
50,871
49,662
48,661
47,459
46,947
46,000
47,000
48,000
49,000
50,000
51,000
52,000
2009 2010 2011 2012 2013
Registered Road Vehicles, 2009 - 2013
Year
Nu
mb
er o
f Reg
iste
red
Veh
icle
s
Source: Transport Control Department
2,845
3,0782,934
2,839
3,006
2,458 2,156 2,211
1,956
1,837 1,776
0
500
1,000
1,500
2,000
2,500
3,000
3,500
2003 2004 2005 2006 2007 2008 2009 2010 2011 2012 2013
Year
Total Number of Reported Accidents, 2003 - 2013
Nu
mb
er o
f Rep
ort
ed A
ccid
ents
Source: Bermuda Police Service
75
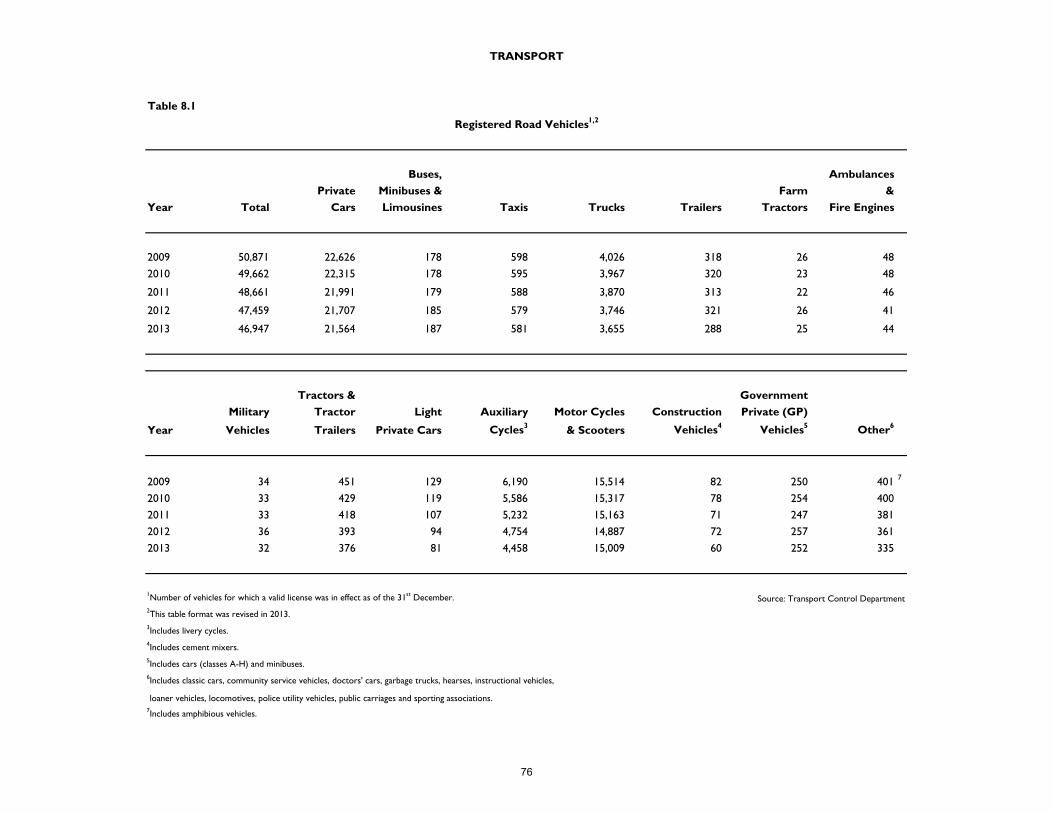
Table 8.1
Buses, Ambulances
Private Minibuses & Farm &
Year Total Cars Limousines Taxis Trucks Trailers Tractors Fire Engines
2009 50,871 22,626 178 598 4,026 318 26 48
2010 49,662 22,315 178 595 3,967 320 23 48
2011 48,661 21,991 179 588 3,870 313 22 46
2012 47,459 21,707 185 579 3,746 321 26 41
2013 46,947 21,564 187 581 3,655 288 25 44
Tractors & Government
Military Tractor Light Auxiliary Motor Cycles Construction Private (GP)
Year Vehicles Trailers Private Cars Cycles3 & Scooters Vehicles4 Vehicles5 Other6
2009 34 451 129 6,190 15,514 82 250 401 7
2010 33 429 119 5,586 15,317 78 254 400
2011 33 418 107 5,232 15,163 71 247 381
2012 36 393 94 4,754 14,887 72 257 361
2013 32 376 81 4,458 15,009 60 252 335
1Number of vehicles for which a valid license was in effect as of the 31st December. Source: Transport Control Department2This table format was revised in 2013.3Includes livery cycles.4Includes cement mixers.5Includes cars (classes A-H) and minibuses.6Includes classic cars, community service vehicles, doctors' cars, garbage trucks, hearses, instructional vehicles,
loaner vehicles, locomotives, police utility vehicles, public carriages and sporting associations.7Includes amphibious vehicles.
TRANSPORT
Registered Road Vehicles1,2
76
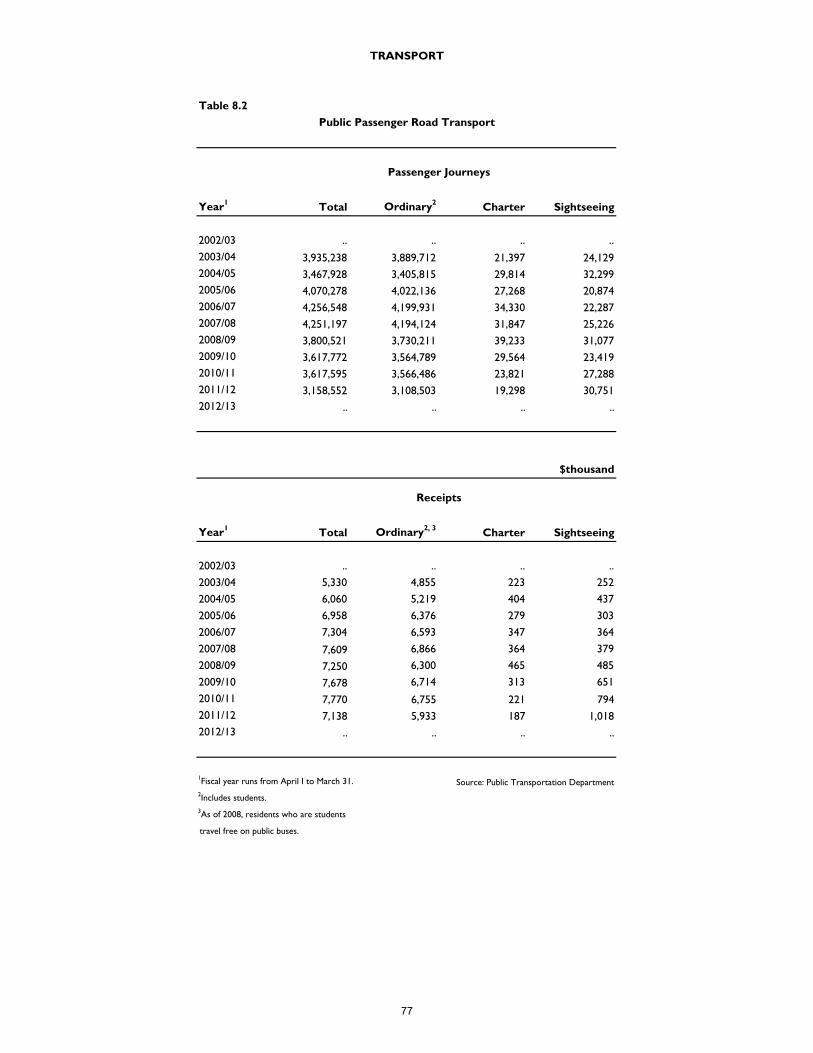
Table 8.2
Year1 Total Ordinary2 Charter Sightseeing
2002/03 .. .. .. ..
2003/04 3,935,238 3,889,712 21,397 24,1292004/05 3,467,928 3,405,815 29,814 32,2992005/06 4,070,278 4,022,136 27,268 20,8742006/07 4,256,548 4,199,931 34,330 22,2872007/08 4,251,197 4,194,124 31,847 25,2262008/09 3,800,521 3,730,211 39,233 31,0772009/10 3,617,772 3,564,789 29,564 23,4192010/11 3,617,595 3,566,486 23,821 27,2882011/12 3,158,552 3,108,503 19,298 30,7512012/13 .. .. .. ..
$thousand
Year1 Total Ordinary2, 3 Charter Sightseeing
2002/03 .. .. .. ..
2003/04 5,330 4,855 223 252
2004/05 6,060 5,219 404 437
2005/06 6,958 6,376 279 303
2006/07 7,304 6,593 347 364
2007/08 7,609 6,866 364 379
2008/09 7,250 6,300 465 485
2009/10 7,678 6,714 313 651
2010/11 7,770 6,755 221 7942011/12 7,138 5,933 187 1,0182012/13 .. .. .. ..
1Fiscal year runs from April I to March 31. Source: Public Transportation Department2Includes students.3As of 2008, residents who are students travel free on public buses.
TRANSPORT
Public Passenger Road Transport
Passenger Journeys
Receipts
77
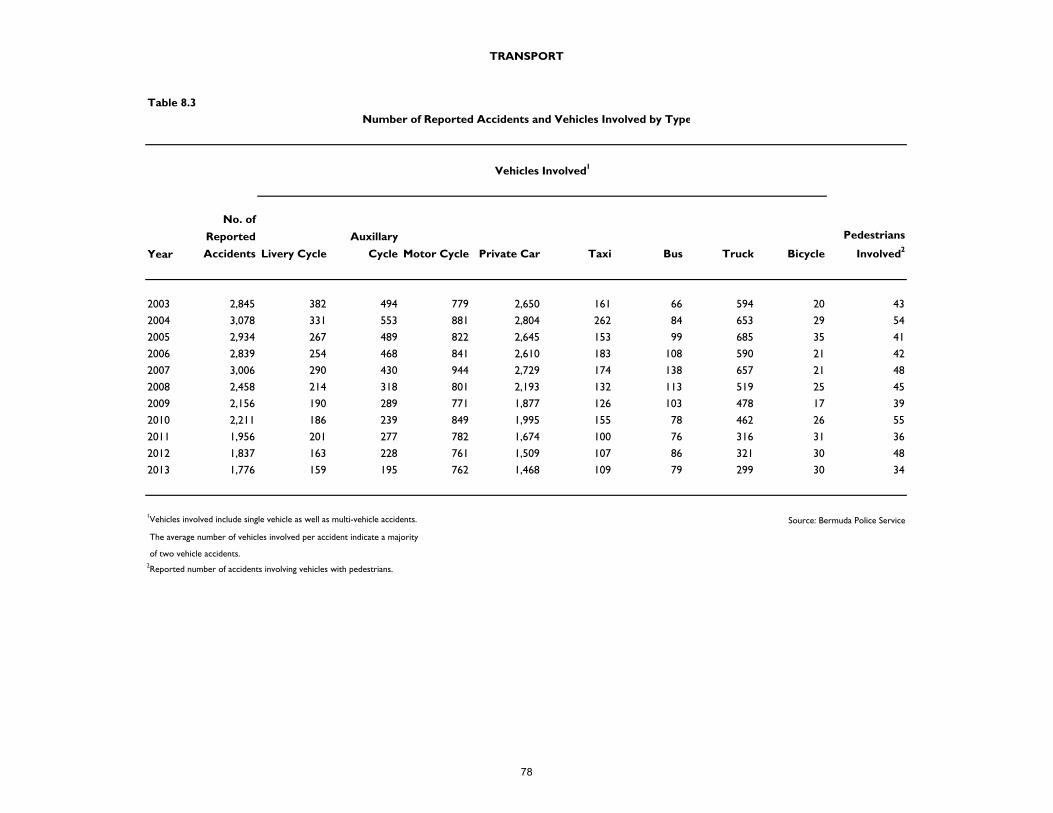
Table 8.3
Year
No. of
Reported
Accidents Livery Cycle
Auxillary
Cycle Motor Cycle Private Car Taxi Bus Truck Bicycle
Pedestrians
Involved2
2003 2,845 382 494 779 2,650 161 66 594 20 43
2004 3,078 331 553 881 2,804 262 84 653 29 54
2005 2,934 267 489 822 2,645 153 99 685 35 41
2006 2,839 254 468 841 2,610 183 108 590 21 42
2007 3,006 290 430 944 2,729 174 138 657 21 48
2008 2,458 214 318 801 2,193 132 113 519 25 45
2009 2,156 190 289 771 1,877 126 103 478 17 39
2010 2,211 186 239 849 1,995 155 78 462 26 55
2011 1,956 201 277 782 1,674 100 76 316 31 36
2012 1,837 163 228 761 1,509 107 86 321 30 48
2013 1,776 159 195 762 1,468 109 79 299 30 34
1Vehicles involved include single vehicle as well as multi-vehicle accidents. Source: Bermuda Police Service
The average number of vehicles involved per accident indicate a majority
of two vehicle accidents.2Reported number of accidents involving vehicles with pedestrians.
TRANSPORT
Number of Reported Accidents and Vehicles Involved by Type
Vehicles Involved1
78
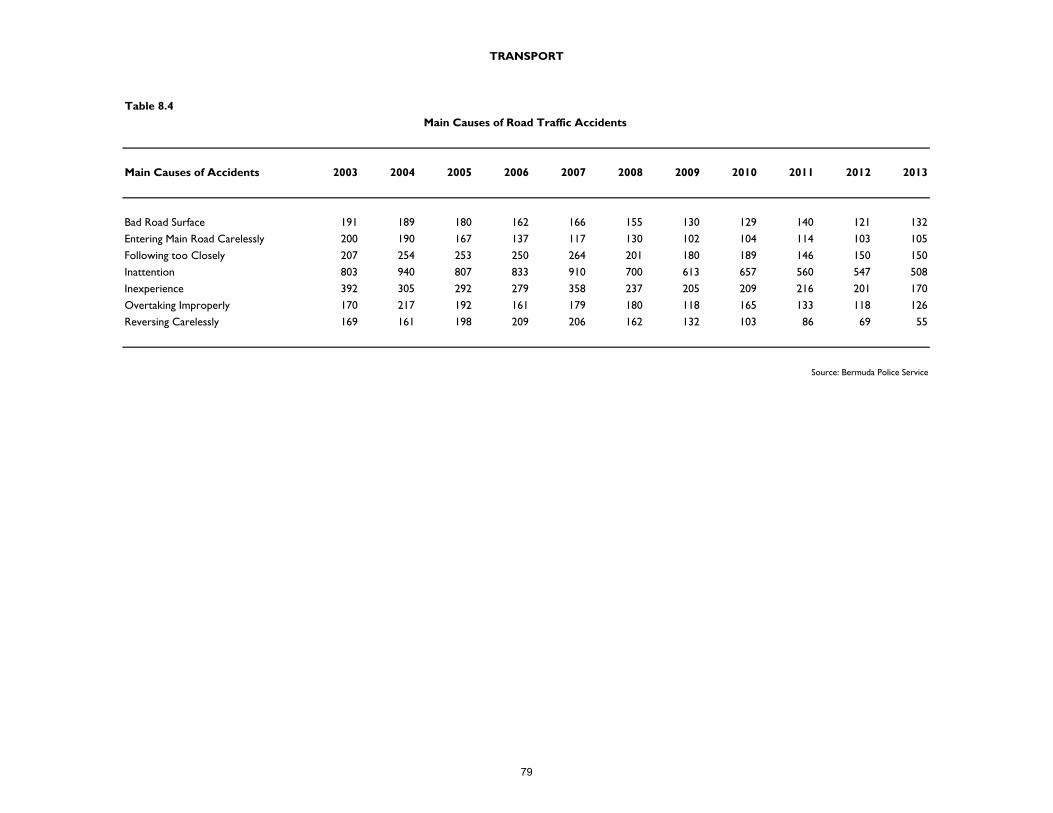
Table 8.4
Main Causes of Accidents 2003 2004 2005 2006 2007 2008 2009 2010 2011 2012 2013
Bad Road Surface 191 189 180 162 166 155 130 129 140 121 132
Entering Main Road Carelessly 200 190 167 137 117 130 102 104 114 103 105
Following too Closely 207 254 253 250 264 201 180 189 146 150 150
Inattention 803 940 807 833 910 700 613 657 560 547 508
Inexperience 392 305 292 279 358 237 205 209 216 201 170
Overtaking Improperly 170 217 192 161 179 180 118 165 133 118 126
Reversing Carelessly 169 161 198 209 206 162 132 103 86 69 55
Source: Bermuda Police Service
TRANSPORT
Main Causes of Road Traffic Accidents
79
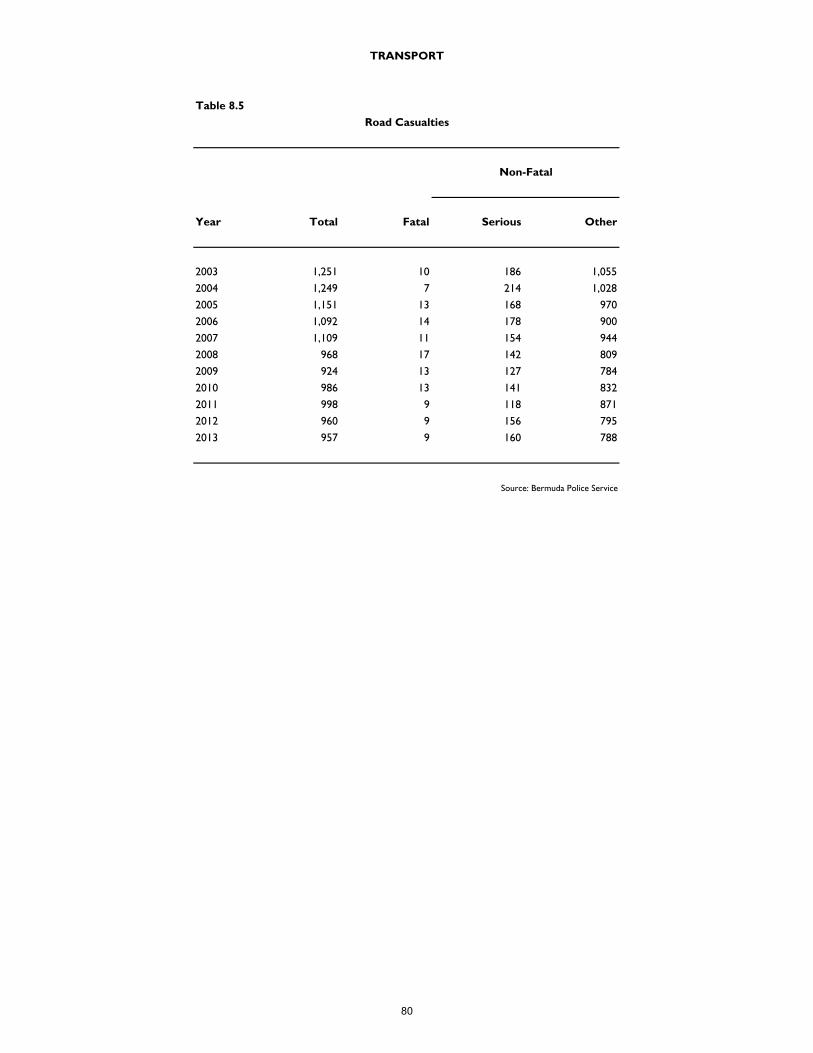
Table 8.5
Year Total Fatal Serious Other
2003 1,251 10 186 1,055
2004 1,249 7 214 1,028
2005 1,151 13 168 970
2006 1,092 14 178 900
2007 1,109 11 154 944
2008 968 17 142 809
2009 924 13 127 784
2010 986 13 141 832
2011 998 9 118 871
2012 960 9 156 795
2013 957 9 160 788
Source: Bermuda Police Service
TRANSPORT
Road Casualties
Non-Fatal
80
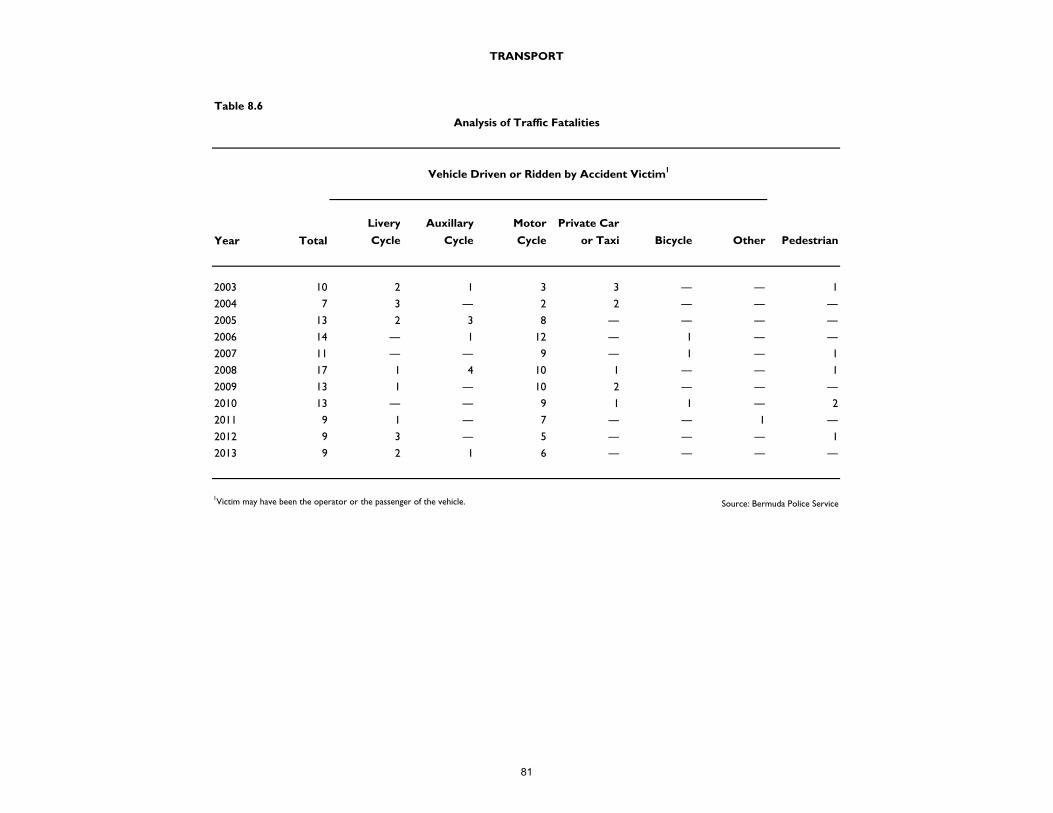
Table 8.6
Year Total
Livery
Cycle
Auxillary
Cycle
Motor
Cycle
Private Car
or Taxi Bicycle Other Pedestrian
2003 10 2 1 3 3 ― ― 1
2004 7 3 ― 2 2 ― ― ―
2005 13 2 3 8 ― ― ― ―
2006 14 ― 1 12 ― 1 ― ―
2007 11 ― ― 9 ― 1 ― 1
2008 17 1 4 10 1 ― ― 1
2009 13 1 ― 10 2 ― ― ―
2010 13 ― ― 9 1 1 ― 2
2011 9 1 ― 7 ― ― 1 ―
2012 9 3 ― 5 ― ― ― 1
2013 9 2 1 6 ― ― ― ―
1Victim may have been the operator or the passenger of the vehicle. Source: Bermuda Police Service
TRANSPORT
Analysis of Traffic Fatalities
Vehicle Driven or Ridden by Accident Victim1
81
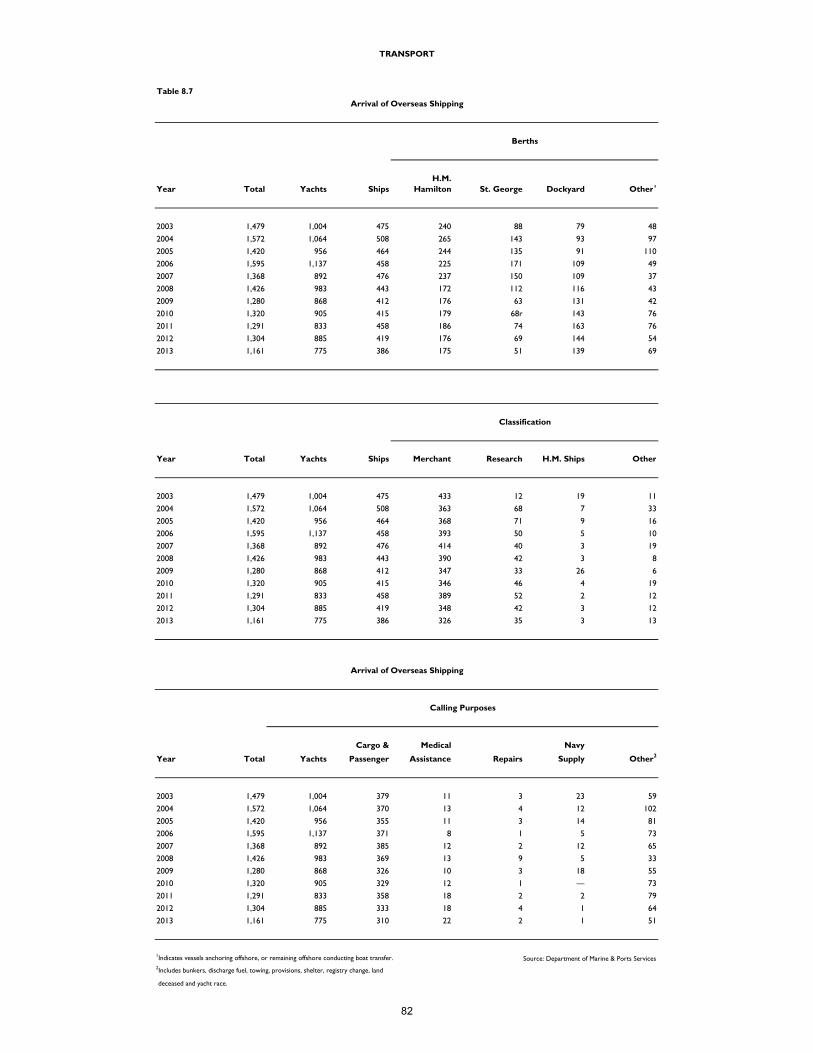
Table 8.7
H.M.Year Total Yachts Ships Hamilton St. George Dockyard Other1
2003 1,479 1,004 475 240 88 79 48
2004 1,572 1,064 508 265 143 93 97
2005 1,420 956 464 244 135 91 110
2006 1,595 1,137 458 225 171 109 49
2007 1,368 892 476 237 150 109 37
2008 1,426 983 443 172 112 116 43
2009 1,280 868 412 176 63 131 42
2010 1,320 905 415 179 68r 143 76
2011 1,291 833 458 186 74 163 76
2012 1,304 885 419 176 69 144 54
2013 1,161 775 386 175 51 139 69
Year Total Yachts Ships Merchant Research H.M. Ships Other
2003 1,479 1,004 475 433 12 19 11
2004 1,572 1,064 508 363 68 7 33
2005 1,420 956 464 368 71 9 16
2006 1,595 1,137 458 393 50 5 10
2007 1,368 892 476 414 40 3 19
2008 1,426 983 443 390 42 3 8
2009 1,280 868 412 347 33 26 6
2010 1,320 905 415 346 46 4 19
2011 1,291 833 458 389 52 2 12
2012 1,304 885 419 348 42 3 12
2013 1,161 775 386 326 35 3 13
Cargo & Medical Navy
Year Total Yachts Passenger Assistance Repairs Supply Other2
2003 1,479 1,004 379 11 3 23 59
2004 1,572 1,064 370 13 4 12 102
2005 1,420 956 355 11 3 14 81
2006 1,595 1,137 371 8 1 5 73
2007 1,368 892 385 12 2 12 65
2008 1,426 983 369 13 9 5 33
2009 1,280 868 326 10 3 18 55
2010 1,320 905 329 12 1 ― 73
2011 1,291 833 358 18 2 2 79
2012 1,304 885 333 18 4 1 64
2013 1,161 775 310 22 2 1 51
1Indicates vessels anchoring offshore, or remaining offshore conducting boat transfer. Source: Department of Marine & Ports Services2Includes bunkers, discharge fuel, towing, provisions, shelter, registry change, land
deceased and yacht race.
Calling Purposes
TRANSPORT
Arrival of Overseas Shipping
Berths
Classification
Arrival of Overseas Shipping
82
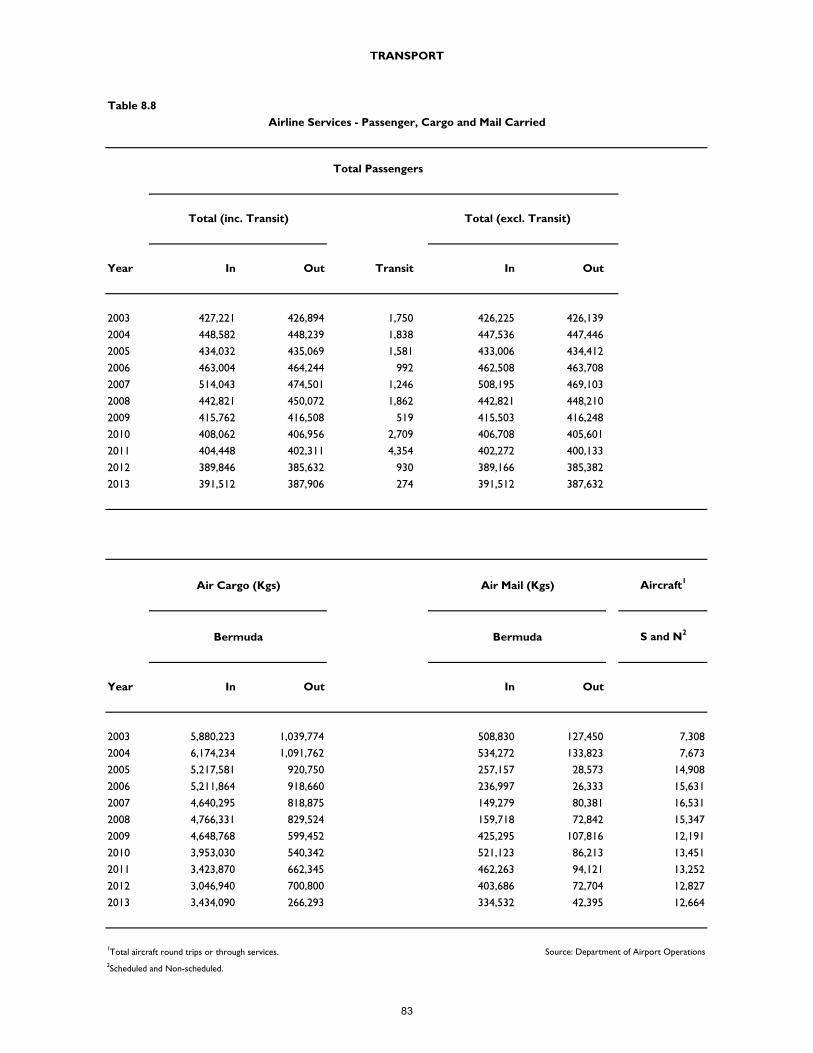
Table 8.8
Year In Out Transit In Out
2003 427,221 426,894 1,750 426,225 426,139
2004 448,582 448,239 1,838 447,536 447,446
2005 434,032 435,069 1,581 433,006 434,412
2006 463,004 464,244 992 462,508 463,708
2007 514,043 474,501 1,246 508,195 469,103
2008 442,821 450,072 1,862 442,821 448,210
2009 415,762 416,508 519 415,503 416,248
2010 408,062 406,956 2,709 406,708 405,601
2011 404,448 402,311 4,354 402,272 400,133
2012 389,846 385,632 930 389,166 385,382
2013 391,512 387,906 274 391,512 387,632
Aircraft1
S and N2
Year In Out In Out
2003 5,880,223 1,039,774 508,830 127,450 7,308
2004 6,174,234 1,091,762 534,272 133,823 7,673
2005 5,217,581 920,750 257,157 28,573 14,908
2006 5,211,864 918,660 236,997 26,333 15,631
2007 4,640,295 818,875 149,279 80,381 16,531
2008 4,766,331 829,524 159,718 72,842 15,347
2009 4,648,768 599,452 425,295 107,816 12,191
2010 3,953,030 540,342 521,123 86,213 13,451
2011 3,423,870 662,345 462,263 94,121 13,252
2012 3,046,940 700,800 403,686 72,704 12,827
2013 3,434,090 266,293 334,532 42,395 12,664
1Total aircraft round trips or through services. Source: Department of Airport Operations2Scheduled and Non-scheduled.
Bermuda Bermuda
TRANSPORT
Airline Services - Passenger, Cargo and Mail Carried
Total Passengers
Total (inc. Transit) Total (excl. Transit)
Air Cargo (Kgs) Air Mail (Kgs)
83
Section IX
Visitor Arrivals
2013 Quick Facts
Total visitors: 576,373
Air visitors: 236,343
Cruise visitors: 340,030
Peak month for visitors: July (17%)
84
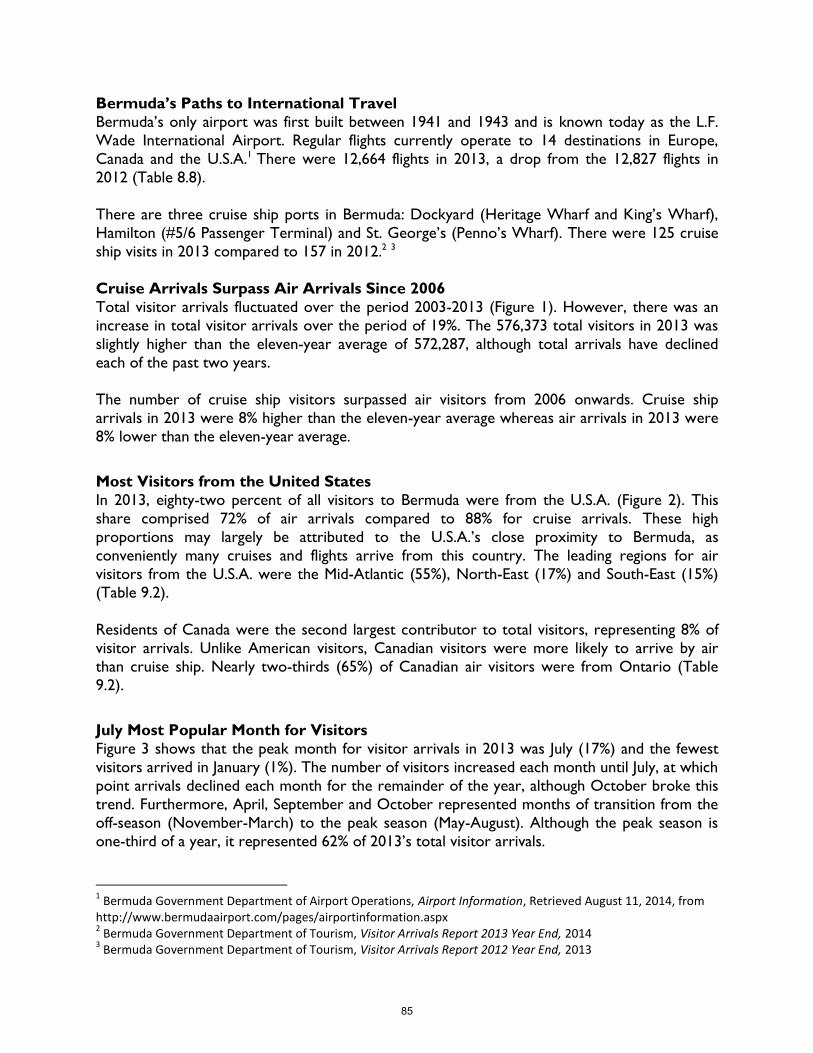
Bermuda’s Paths to International Travel
Bermuda’s only airport was first built between 1941 and 1943 and is known today as the L.F.
Wade International Airport. Regular flights currently operate to 14 destinations in Europe,
Canada and the U.S.A.1 There were 12,664 flights in 2013, a drop from the 12,827 flights in
2012 (Table 8.8).
There are three cruise ship ports in Bermuda: Dockyard (Heritage Wharf and King’s Wharf),
Hamilton (#5/6 Passenger Terminal) and St. George’s (Penno’s Wharf). There were 125 cruise
ship visits in 2013 compared to 157 in 2012.2 3
Cruise Arrivals Surpass Air Arrivals Since 2006
Total visitor arrivals fluctuated over the period 2003-2013 (Figure 1). However, there was an
increase in total visitor arrivals over the period of 19%. The 576,373 total visitors in 2013 was
slightly higher than the eleven-year average of 572,287, although total arrivals have declined
each of the past two years.
The number of cruise ship visitors surpassed air visitors from 2006 onwards. Cruise ship
arrivals in 2013 were 8% higher than the eleven-year average whereas air arrivals in 2013 were
8% lower than the eleven-year average.
Most Visitors from the United States
In 2013, eighty-two percent of all visitors to Bermuda were from the U.S.A. (Figure 2). This
share comprised 72% of air arrivals compared to 88% for cruise arrivals. These high
proportions may largely be attributed to the U.S.A.’s close proximity to Bermuda, as
conveniently many cruises and flights arrive from this country. The leading regions for air
visitors from the U.S.A. were the Mid-Atlantic (55%), North-East (17%) and South-East (15%)
(Table 9.2).
Residents of Canada were the second largest contributor to total visitors, representing 8% of
visitor arrivals. Unlike American visitors, Canadian visitors were more likely to arrive by air
than cruise ship. Nearly two-thirds (65%) of Canadian air visitors were from Ontario (Table
9.2).
July Most Popular Month for Visitors
Figure 3 shows that the peak month for visitor arrivals in 2013 was July (17%) and the fewest
visitors arrived in January (1%). The number of visitors increased each month until July, at which
point arrivals declined each month for the remainder of the year, although October broke this
trend. Furthermore, April, September and October represented months of transition from the
off-season (November-March) to the peak season (May-August). Although the peak season is
one-third of a year, it represented 62% of 2013’s total visitor arrivals.
1 Bermuda Government Department of Airport Operations, Airport Information, Retrieved August 11, 2014, from
http://www.bermudaairport.com/pages/airportinformation.aspx 2 Bermuda Government Department of Tourism, Visitor Arrivals Report 2013 Year End, 2014
3 Bermuda Government Department of Tourism, Visitor Arrivals Report 2012 Year End, 2013
85
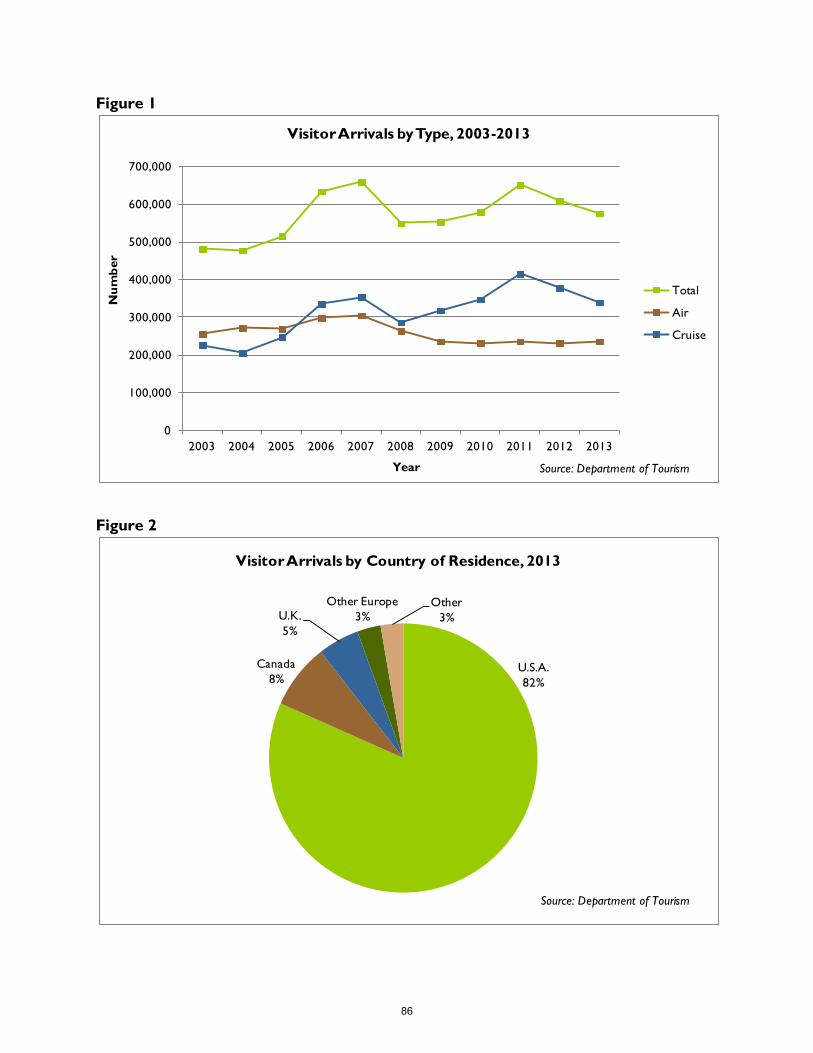
Figure 1
Figure 2
0
100,000
200,000
300,000
400,000
500,000
600,000
700,000
2003 2004 2005 2006 2007 2008 2009 2010 2011 2012 2013
Nu
mb
er
Year
Visitor Arrivals by Type, 2003-2013
Total
Air
Cruise
Source: Department of Tourism
U.S.A.
82%
Canada
8%
U.K.
5%
Other Europe
3%
Other
3%
Visitor Arrivals by Country of Residence, 2013
Source: Department of Tourism
86
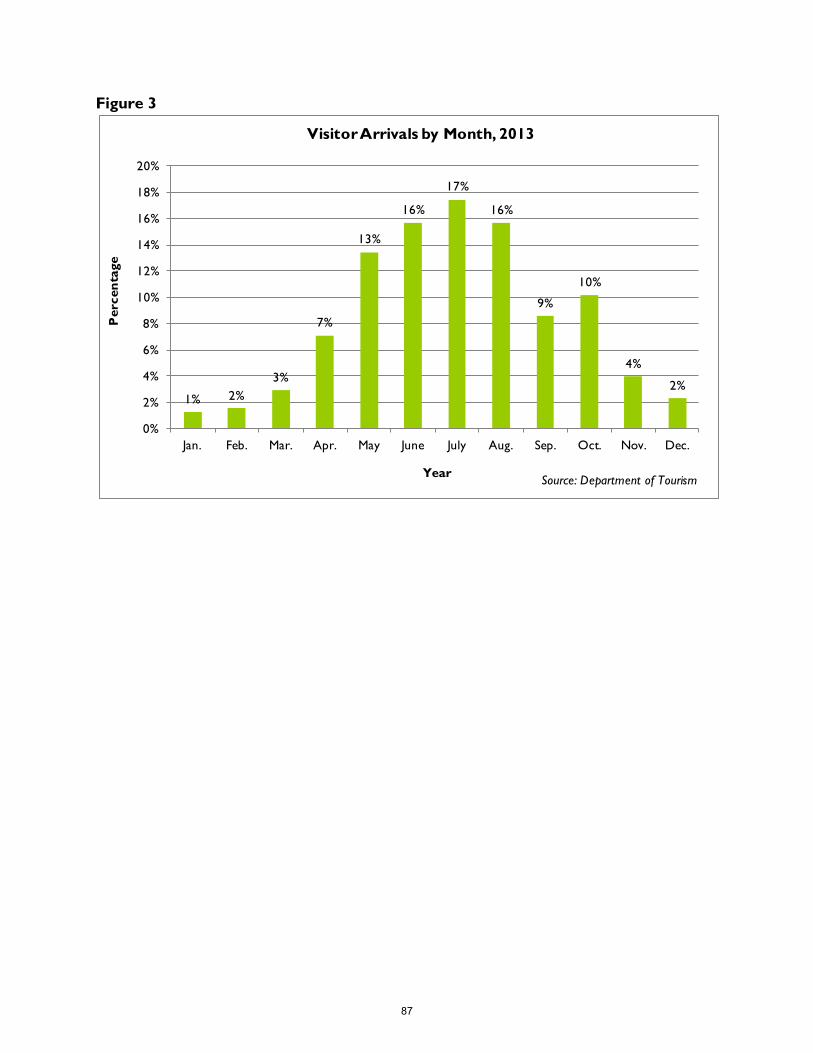
Figure 3
1% 2%
3%
7%
13%
16%
17%
16%
9%
10%
4%
2%
0%
2%
4%
6%
8%
10%
12%
14%
16%
18%
20%
Jan. Feb. Mar. Apr. May June July Aug. Sep. Oct. Nov. Dec.
Percen
tage
Year
Visitor Arrivals by Month, 2013
Source: Department of Tourism
87
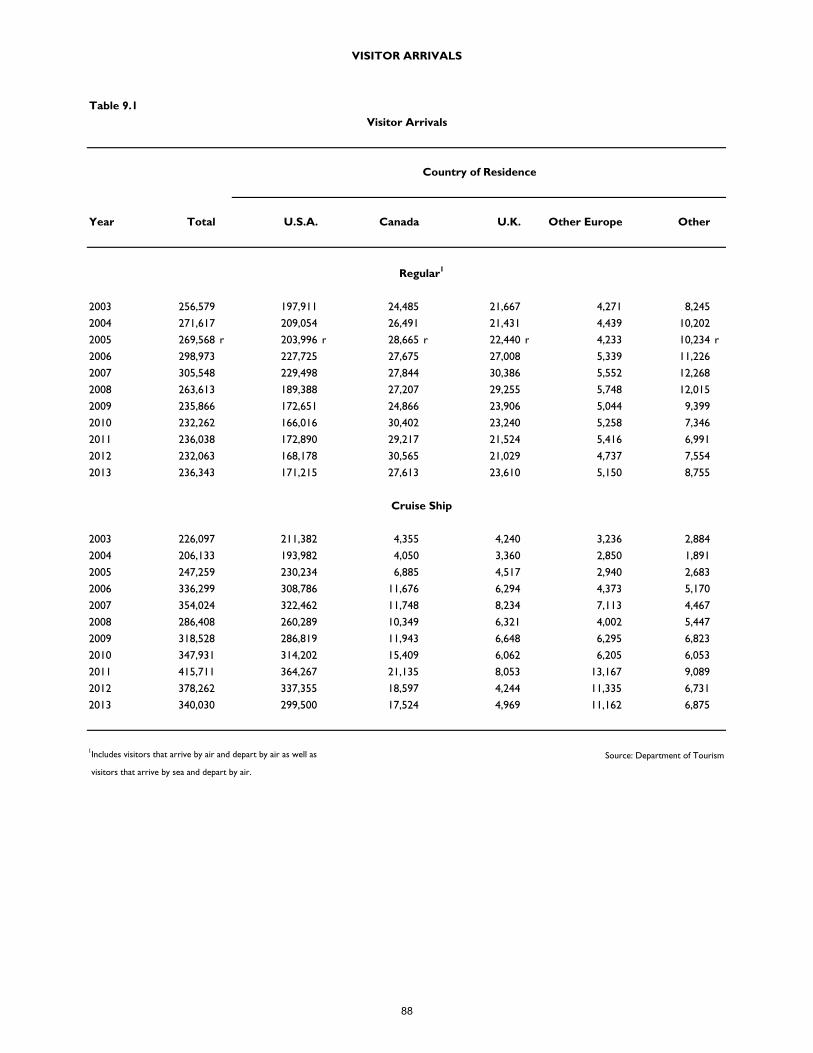
Table 9.1
Year Total U.S.A. Canada U.K. Other Europe Other
2003 256,579 197,911 24,485 21,667 4,271 8,245
2004 271,617 209,054 26,491 21,431 4,439 10,202
2005 269,568 r 203,996 r 28,665 r 22,440 r 4,233 10,234 r
2006 298,973 227,725 27,675 27,008 5,339 11,226
2007 305,548 229,498 27,844 30,386 5,552 12,268
2008 263,613 189,388 27,207 29,255 5,748 12,015
2009 235,866 172,651 24,866 23,906 5,044 9,399
2010 232,262 166,016 30,402 23,240 5,258 7,346
2011 236,038 172,890 29,217 21,524 5,416 6,991
2012 232,063 168,178 30,565 21,029 4,737 7,554
2013 236,343 171,215 27,613 23,610 5,150 8,755
2003 226,097 211,382 4,355 4,240 3,236 2,884
2004 206,133 193,982 4,050 3,360 2,850 1,891
2005 247,259 230,234 6,885 4,517 2,940 2,683
2006 336,299 308,786 11,676 6,294 4,373 5,170
2007 354,024 322,462 11,748 8,234 7,113 4,467
2008 286,408 260,289 10,349 6,321 4,002 5,447
2009 318,528 286,819 11,943 6,648 6,295 6,823
2010 347,931 314,202 15,409 6,062 6,205 6,053
2011 415,711 364,267 21,135 8,053 13,167 9,089
2012 378,262 337,355 18,597 4,244 11,335 6,731
2013 340,030 299,500 17,524 4,969 11,162 6,875
1Includes visitors that arrive by air and depart by air as well as Source: Department of Tourism
visitors that arrive by sea and depart by air.
VISITOR ARRIVALS
Visitor Arrivals
Country of Residence
Regular1
Cruise Ship
88
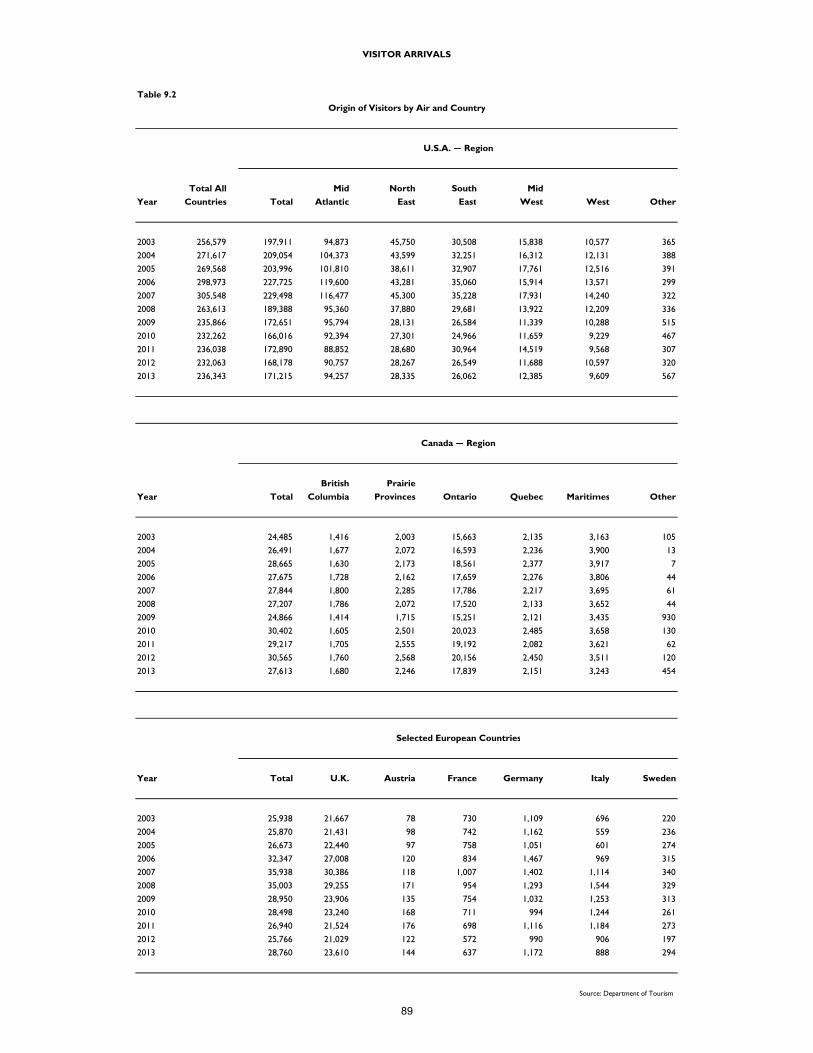
Table 9.2
Total All Mid North South Mid
Year Countries Total Atlantic East East West West Other
2003 256,579 197,911 94,873 45,750 30,508 15,838 10,577 365
2004 271,617 209,054 104,373 43,599 32,251 16,312 12,131 388
2005 269,568 203,996 101,810 38,611 32,907 17,761 12,516 391
2006 298,973 227,725 119,600 43,281 35,060 15,914 13,571 299
2007 305,548 229,498 116,477 45,300 35,228 17,931 14,240 322
2008 263,613 189,388 95,360 37,880 29,681 13,922 12,209 336
2009 235,866 172,651 95,794 28,131 26,584 11,339 10,288 515
2010 232,262 166,016 92,394 27,301 24,966 11,659 9,229 467
2011 236,038 172,890 88,852 28,680 30,964 14,519 9,568 307
2012 232,063 168,178 90,757 28,267 26,549 11,688 10,597 320
2013 236,343 171,215 94,257 28,335 26,062 12,385 9,609 567
British Prairie
Year Total Columbia Provinces Ontario Quebec Maritimes Other
2003 24,485 1,416 2,003 15,663 2,135 3,163 105
2004 26,491 1,677 2,072 16,593 2,236 3,900 13
2005 28,665 1,630 2,173 18,561 2,377 3,917 7
2006 27,675 1,728 2,162 17,659 2,276 3,806 44
2007 27,844 1,800 2,285 17,786 2,217 3,695 61
2008 27,207 1,786 2,072 17,520 2,133 3,652 44
2009 24,866 1,414 1,715 15,251 2,121 3,435 930
2010 30,402 1,605 2,501 20,023 2,485 3,658 130
2011 29,217 1,705 2,555 19,192 2,082 3,621 62
2012 30,565 1,760 2,568 20,156 2,450 3,511 120
2013 27,613 1,680 2,246 17,839 2,151 3,243 454
Year Total U.K. Austria France Germany Italy Sweden
2003 25,938 21,667 78 730 1,109 696 220
2004 25,870 21,431 98 742 1,162 559 236
2005 26,673 22,440 97 758 1,051 601 274
2006 32,347 27,008 120 834 1,467 969 315
2007 35,938 30,386 118 1,007 1,402 1,114 340
2008 35,003 29,255 171 954 1,293 1,544 329
2009 28,950 23,906 135 754 1,032 1,253 313
2010 28,498 23,240 168 711 994 1,244 261
2011 26,940 21,524 176 698 1,116 1,184 273
2012 25,766 21,029 122 572 990 906 197
2013 28,760 23,610 144 637 1,172 888 294
Source: Department of Tourism
VISITOR ARRIVALS
Origin of Visitors by Air and Country
U.S.A. ― Region
Canada ― Region
Selected European Countries
89
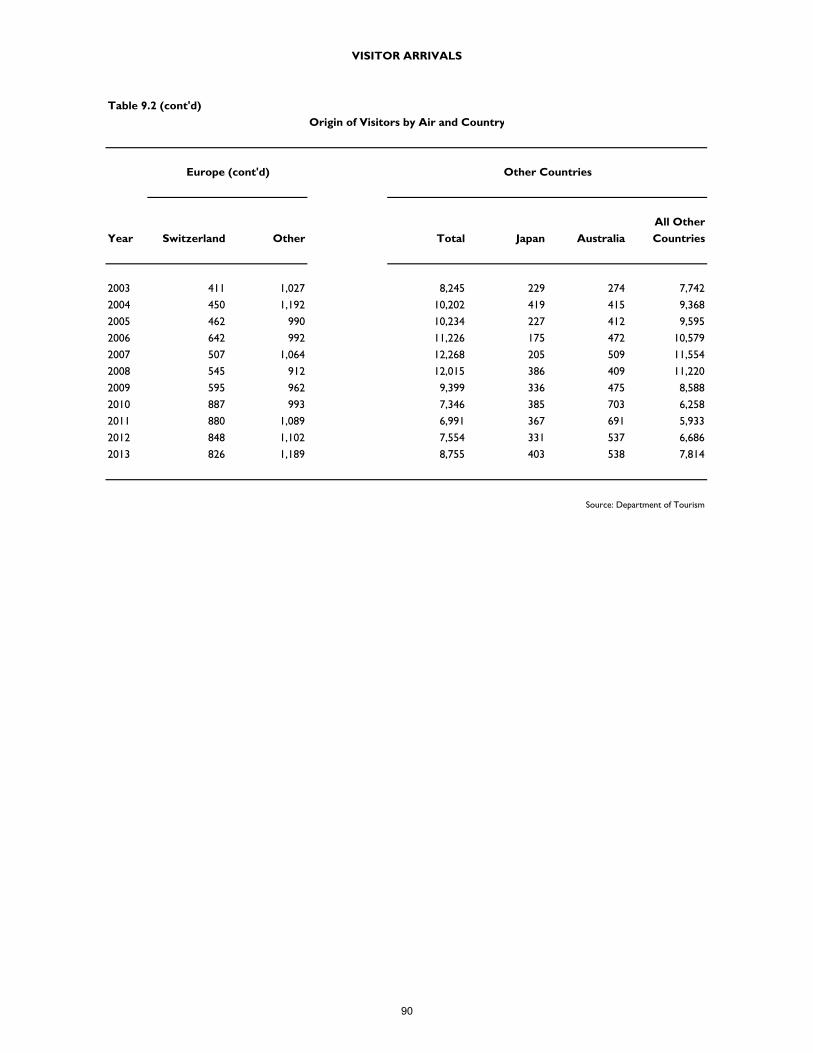
Table 9.2 (cont'd)
All Other
Year Switzerland Other Total Japan Australia Countries
2003 411 1,027 8,245 229 274 7,742
2004 450 1,192 10,202 419 415 9,368
2005 462 990 10,234 227 412 9,595
2006 642 992 11,226 175 472 10,579
2007 507 1,064 12,268 205 509 11,554
2008 545 912 12,015 386 409 11,220
2009 595 962 9,399 336 475 8,588
2010 887 993 7,346 385 703 6,258
2011 880 1,089 6,991 367 691 5,933
2012 848 1,102 7,554 331 537 6,686
2013 826 1,189 8,755 403 538 7,814
Source: Department of Tourism
VISITOR ARRIVALS
Origin of Visitors by Air and Country
Europe (cont'd) Other Countries
90
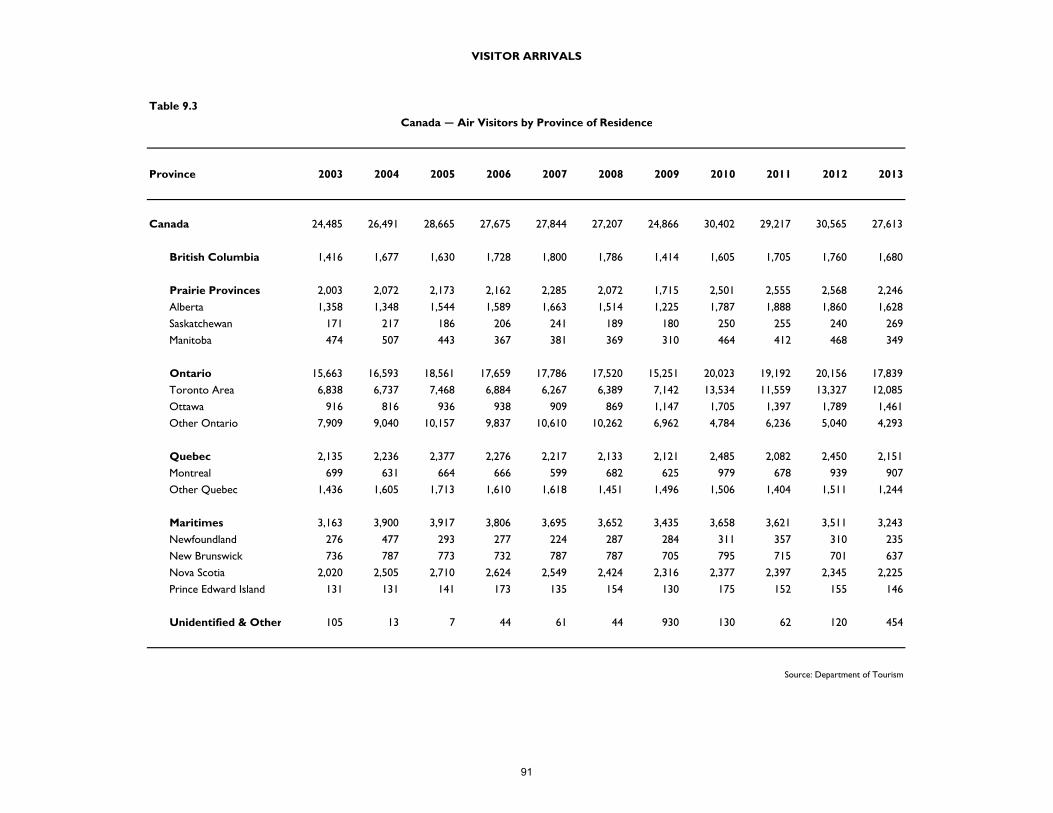
Table 9.3
Province 2003 2004 2005 2006 2007 2008 2009 2010 2011 2012 2013
Canada 24,485 26,491 28,665 27,675 27,844 27,207 24,866 30,402 29,217 30,565 27,613
British Columbia 1,416 1,677 1,630 1,728 1,800 1,786 1,414 1,605 1,705 1,760 1,680
Prairie Provinces 2,003 2,072 2,173 2,162 2,285 2,072 1,715 2,501 2,555 2,568 2,246
Alberta 1,358 1,348 1,544 1,589 1,663 1,514 1,225 1,787 1,888 1,860 1,628
Saskatchewan 171 217 186 206 241 189 180 250 255 240 269
Manitoba 474 507 443 367 381 369 310 464 412 468 349
Ontario 15,663 16,593 18,561 17,659 17,786 17,520 15,251 20,023 19,192 20,156 17,839
Toronto Area 6,838 6,737 7,468 6,884 6,267 6,389 7,142 13,534 11,559 13,327 12,085
Ottawa 916 816 936 938 909 869 1,147 1,705 1,397 1,789 1,461
Other Ontario 7,909 9,040 10,157 9,837 10,610 10,262 6,962 4,784 6,236 5,040 4,293
Quebec 2,135 2,236 2,377 2,276 2,217 2,133 2,121 2,485 2,082 2,450 2,151
Montreal 699 631 664 666 599 682 625 979 678 939 907
Other Quebec 1,436 1,605 1,713 1,610 1,618 1,451 1,496 1,506 1,404 1,511 1,244
Maritimes 3,163 3,900 3,917 3,806 3,695 3,652 3,435 3,658 3,621 3,511 3,243
Newfoundland 276 477 293 277 224 287 284 311 357 310 235
New Brunswick 736 787 773 732 787 787 705 795 715 701 637
Nova Scotia 2,020 2,505 2,710 2,624 2,549 2,424 2,316 2,377 2,397 2,345 2,225
Prince Edward Island 131 131 141 173 135 154 130 175 152 155 146
Unidentified & Other 105 13 7 44 61 44 930 130 62 120 454
Source: Department of Tourism
VISITOR ARRIVALS
Canada ― Air Visitors by Province of Residence
91
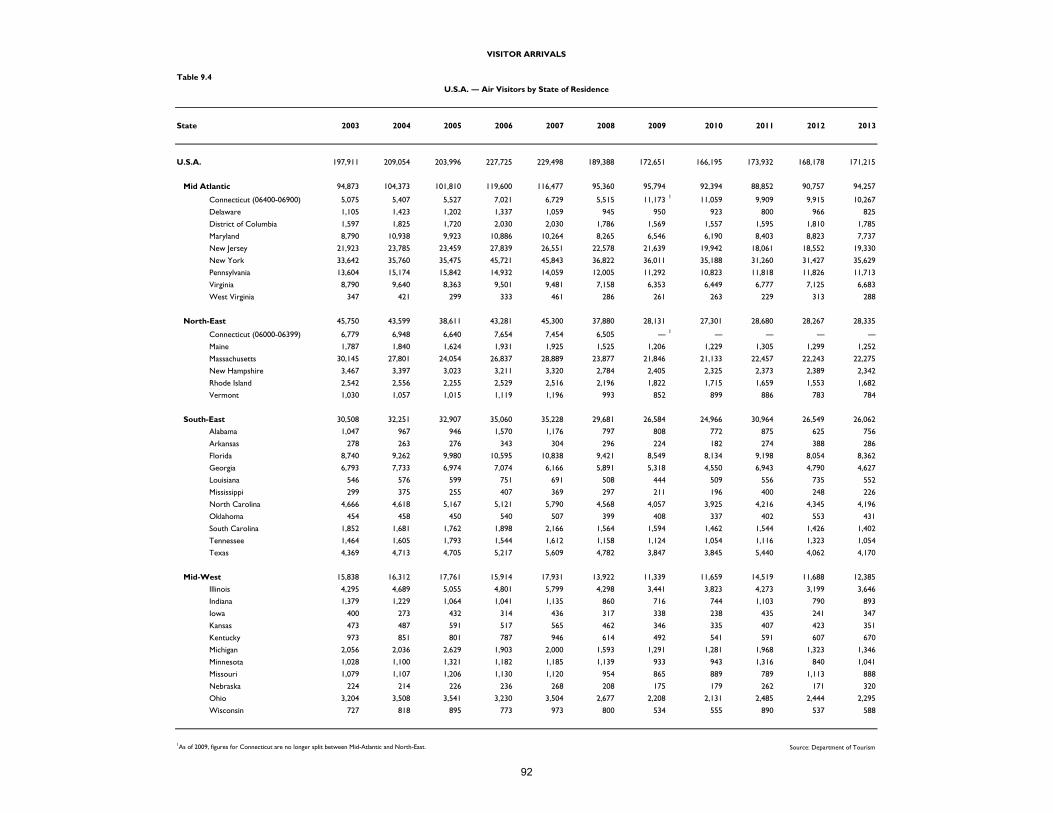
Table 9.4
State 2003 2004 2005 2006 2007 2008 2009 2010 2011 2012 2013
U.S.A. 197,911 209,054 203,996 227,725 229,498 189,388 172,651 166,195 173,932 168,178 171,215
Mid Atlantic 94,873 104,373 101,810 119,600 116,477 95,360 95,794 92,394 88,852 90,757 94,257
Connecticut (06400-06900) 5,075 5,407 5,527 7,021 6,729 5,515 11,173 1 11,059 9,909 9,915 10,267
Delaware 1,105 1,423 1,202 1,337 1,059 945 950 923 800 966 825
District of Columbia 1,597 1,825 1,720 2,030 2,030 1,786 1,569 1,557 1,595 1,810 1,785
Maryland 8,790 10,938 9,923 10,886 10,264 8,265 6,546 6,190 8,403 8,823 7,737
New Jersey 21,923 23,785 23,459 27,839 26,551 22,578 21,639 19,942 18,061 18,552 19,330
New York 33,642 35,760 35,475 45,721 45,843 36,822 36,011 35,188 31,260 31,427 35,629
Pennsylvania 13,604 15,174 15,842 14,932 14,059 12,005 11,292 10,823 11,818 11,826 11,713
Virginia 8,790 9,640 8,363 9,501 9,481 7,158 6,353 6,449 6,777 7,125 6,683
West Virginia 347 421 299 333 461 286 261 263 229 313 288
North-East 45,750 43,599 38,611 43,281 45,300 37,880 28,131 27,301 28,680 28,267 28,335
Connecticut (06000-06399) 6,779 6,948 6,640 7,654 7,454 6,505 ― 1 ― ― ― ―
Maine 1,787 1,840 1,624 1,931 1,925 1,525 1,206 1,229 1,305 1,299 1,252
Massachusetts 30,145 27,801 24,054 26,837 28,889 23,877 21,846 21,133 22,457 22,243 22,275
New Hampshire 3,467 3,397 3,023 3,211 3,320 2,784 2,405 2,325 2,373 2,389 2,342
Rhode Island 2,542 2,556 2,255 2,529 2,516 2,196 1,822 1,715 1,659 1,553 1,682
Vermont 1,030 1,057 1,015 1,119 1,196 993 852 899 886 783 784
South-East 30,508 32,251 32,907 35,060 35,228 29,681 26,584 24,966 30,964 26,549 26,062
Alabama 1,047 967 946 1,570 1,176 797 808 772 875 625 756
Arkansas 278 263 276 343 304 296 224 182 274 388 286
Florida 8,740 9,262 9,980 10,595 10,838 9,421 8,549 8,134 9,198 8,054 8,362
Georgia 6,793 7,733 6,974 7,074 6,166 5,891 5,318 4,550 6,943 4,790 4,627
Louisiana 546 576 599 751 691 508 444 509 556 735 552
Mississippi 299 375 255 407 369 297 211 196 400 248 226
North Carolina 4,666 4,618 5,167 5,121 5,790 4,568 4,057 3,925 4,216 4,345 4,196
Oklahoma 454 458 450 540 507 399 408 337 402 553 431
South Carolina 1,852 1,681 1,762 1,898 2,166 1,564 1,594 1,462 1,544 1,426 1,402
Tennessee 1,464 1,605 1,793 1,544 1,612 1,158 1,124 1,054 1,116 1,323 1,054
Texas 4,369 4,713 4,705 5,217 5,609 4,782 3,847 3,845 5,440 4,062 4,170
Mid-West 15,838 16,312 17,761 15,914 17,931 13,922 11,339 11,659 14,519 11,688 12,385
Illinois 4,295 4,689 5,055 4,801 5,799 4,298 3,441 3,823 4,273 3,199 3,646
Indiana 1,379 1,229 1,064 1,041 1,135 860 716 744 1,103 790 893
Iowa 400 273 432 314 436 317 338 238 435 241 347
Kansas 473 487 591 517 565 462 346 335 407 423 351
Kentucky 973 851 801 787 946 614 492 541 591 607 670
Michigan 2,056 2,036 2,629 1,903 2,000 1,593 1,291 1,281 1,968 1,323 1,346
Minnesota 1,028 1,100 1,321 1,182 1,185 1,139 933 943 1,316 840 1,041
Missouri 1,079 1,107 1,206 1,130 1,120 954 865 889 789 1,113 888
Nebraska 224 214 226 236 268 208 175 179 262 171 320
Ohio 3,204 3,508 3,541 3,230 3,504 2,677 2,208 2,131 2,485 2,444 2,295
Wisconsin 727 818 895 773 973 800 534 555 890 537 588
1As of 2009, figures for Connecticut are no longer split between Mid-Atlantic and North-East. Source: Department of Tourism
VISITOR ARRIVALS
U.S.A. ― Air Visitors by State of Residence
92
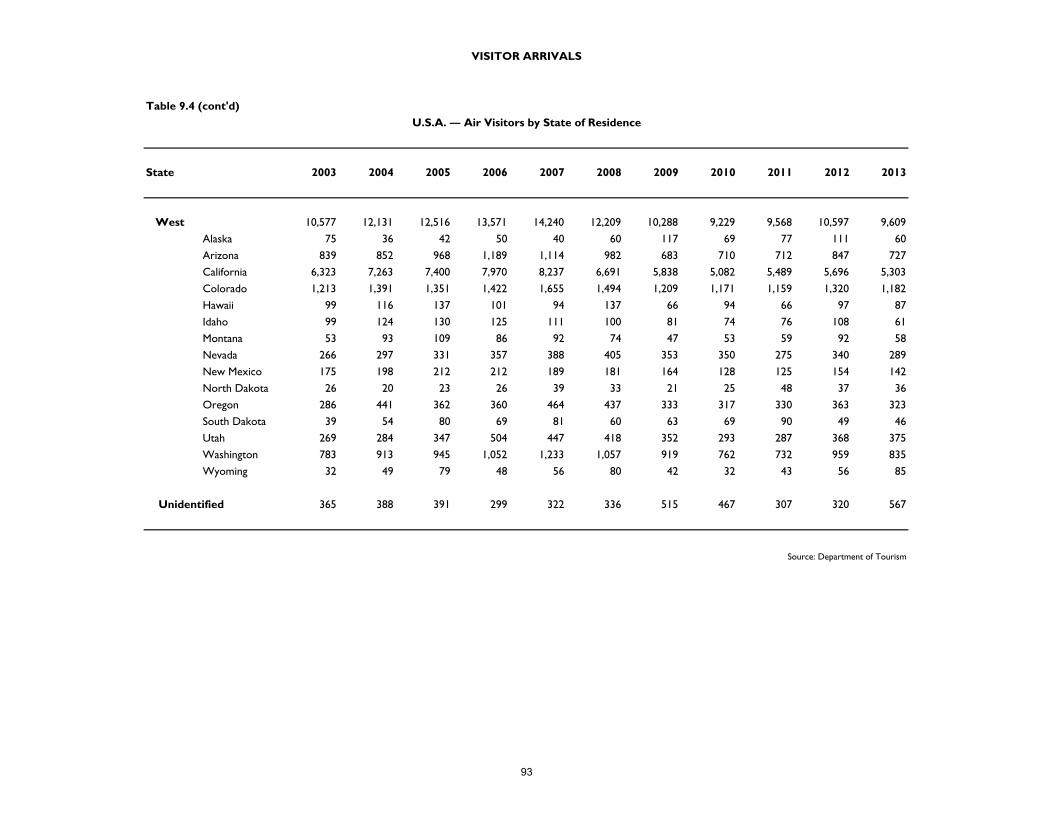
Table 9.4 (cont'd)
State 2003 2004 2005 2006 2007 2008 2009 2010 2011 2012 2013
West 10,577 12,131 12,516 13,571 14,240 12,209 10,288 9,229 9,568 10,597 9,609
Alaska 75 36 42 50 40 60 117 69 77 111 60
Arizona 839 852 968 1,189 1,114 982 683 710 712 847 727
California 6,323 7,263 7,400 7,970 8,237 6,691 5,838 5,082 5,489 5,696 5,303
Colorado 1,213 1,391 1,351 1,422 1,655 1,494 1,209 1,171 1,159 1,320 1,182
Hawaii 99 116 137 101 94 137 66 94 66 97 87
Idaho 99 124 130 125 111 100 81 74 76 108 61
Montana 53 93 109 86 92 74 47 53 59 92 58
Nevada 266 297 331 357 388 405 353 350 275 340 289
New Mexico 175 198 212 212 189 181 164 128 125 154 142
North Dakota 26 20 23 26 39 33 21 25 48 37 36
Oregon 286 441 362 360 464 437 333 317 330 363 323
South Dakota 39 54 80 69 81 60 63 69 90 49 46
Utah 269 284 347 504 447 418 352 293 287 368 375
Washington 783 913 945 1,052 1,233 1,057 919 762 732 959 835
Wyoming 32 49 79 48 56 80 42 32 43 56 85
Unidentified 365 388 391 299 322 336 515 467 307 320 567
Source: Department of Tourism
VISITOR ARRIVALS
U.S.A. ― Air Visitors by State of Residence
93
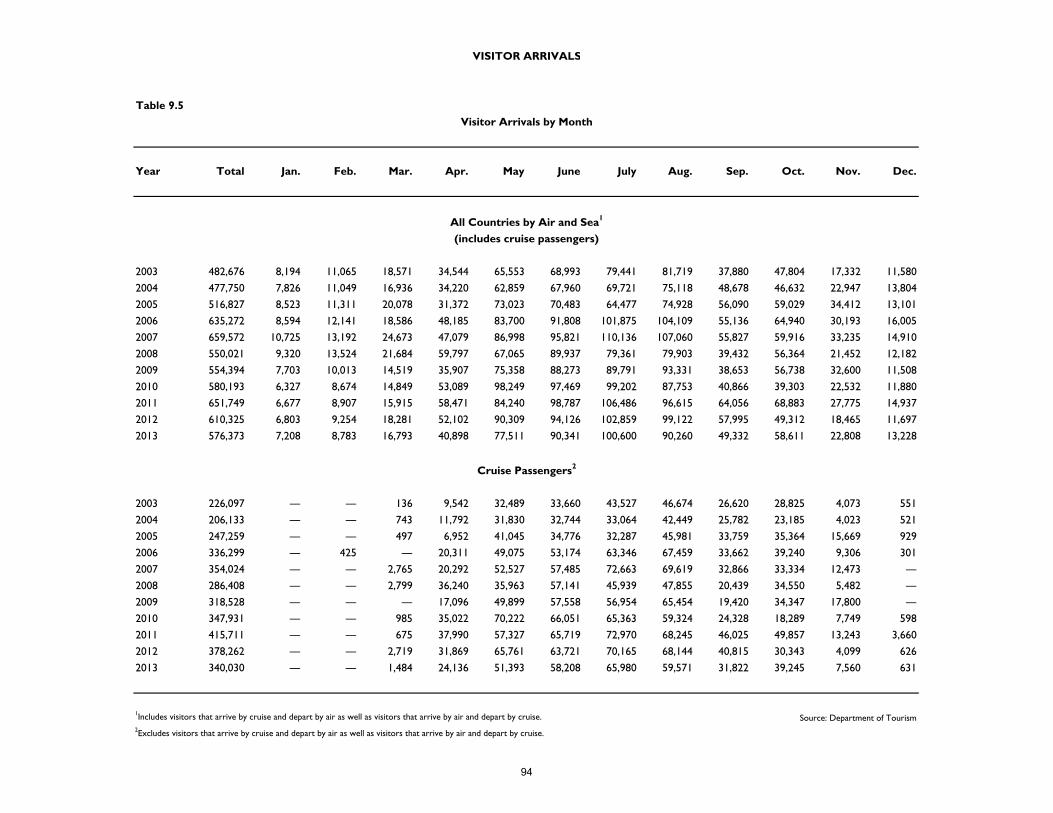
Table 9.5
Year Total Jan. Feb. Mar. Apr. May June July Aug. Sep. Oct. Nov. Dec.
2003 482,676 8,194 11,065 18,571 34,544 65,553 68,993 79,441 81,719 37,880 47,804 17,332 11,580
2004 477,750 7,826 11,049 16,936 34,220 62,859 67,960 69,721 75,118 48,678 46,632 22,947 13,804
2005 516,827 8,523 11,311 20,078 31,372 73,023 70,483 64,477 74,928 56,090 59,029 34,412 13,101
2006 635,272 8,594 12,141 18,586 48,185 83,700 91,808 101,875 104,109 55,136 64,940 30,193 16,005
2007 659,572 10,725 13,192 24,673 47,079 86,998 95,821 110,136 107,060 55,827 59,916 33,235 14,910
2008 550,021 9,320 13,524 21,684 59,797 67,065 89,937 79,361 79,903 39,432 56,364 21,452 12,182
2009 554,394 7,703 10,013 14,519 35,907 75,358 88,273 89,791 93,331 38,653 56,738 32,600 11,508
2010 580,193 6,327 8,674 14,849 53,089 98,249 97,469 99,202 87,753 40,866 39,303 22,532 11,880
2011 651,749 6,677 8,907 15,915 58,471 84,240 98,787 106,486 96,615 64,056 68,883 27,775 14,937
2012 610,325 6,803 9,254 18,281 52,102 90,309 94,126 102,859 99,122 57,995 49,312 18,465 11,697
2013 576,373 7,208 8,783 16,793 40,898 77,511 90,341 100,600 90,260 49,332 58,611 22,808 13,228
2003 226,097 ― ― 136 9,542 32,489 33,660 43,527 46,674 26,620 28,825 4,073 551
2004 206,133 ― ― 743 11,792 31,830 32,744 33,064 42,449 25,782 23,185 4,023 521
2005 247,259 ― ― 497 6,952 41,045 34,776 32,287 45,981 33,759 35,364 15,669 929
2006 336,299 ― 425 ― 20,311 49,075 53,174 63,346 67,459 33,662 39,240 9,306 301
2007 354,024 ― ― 2,765 20,292 52,527 57,485 72,663 69,619 32,866 33,334 12,473 ―
2008 286,408 ― ― 2,799 36,240 35,963 57,141 45,939 47,855 20,439 34,550 5,482 ―
2009 318,528 ― ― ― 17,096 49,899 57,558 56,954 65,454 19,420 34,347 17,800 ―
2010 347,931 ― ― 985 35,022 70,222 66,051 65,363 59,324 24,328 18,289 7,749 598
2011 415,711 ― ― 675 37,990 57,327 65,719 72,970 68,245 46,025 49,857 13,243 3,660
2012 378,262 ― ― 2,719 31,869 65,761 63,721 70,165 68,144 40,815 30,343 4,099 626
2013 340,030 ― ― 1,484 24,136 51,393 58,208 65,980 59,571 31,822 39,245 7,560 631
1Includes visitors that arrive by cruise and depart by air as well as visitors that arrive by air and depart by cruise. Source: Department of Tourism2Excludes visitors that arrive by cruise and depart by air as well as visitors that arrive by air and depart by cruise.
VISITOR ARRIVALS
Visitor Arrivals by Month
All Countries by Air and Sea1
(includes cruise passengers)
Cruise Passengers2
94
Section X
Miscellaneous
2013 Quick Facts
Value of Selected Domestic
Agricultural Output:
$4.9 million
Telephone Subscribers (2013/14):
36,311
Number of Fires: 1,830
95
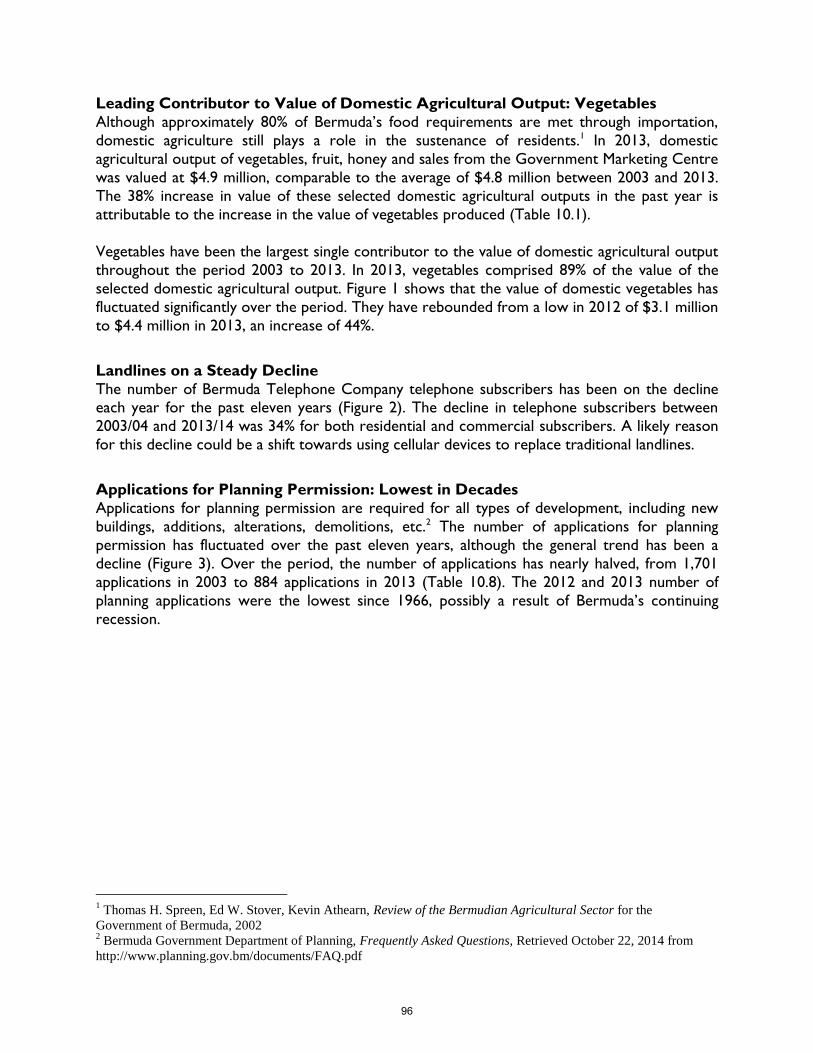
Leading Contributor to Value of Domestic Agricultural Output: Vegetables
Although approximately 80% of Bermuda’s food requirements are met through importation,
domestic agriculture still plays a role in the sustenance of residents.1 In 2013, domestic
agricultural output of vegetables, fruit, honey and sales from the Government Marketing Centre
was valued at $4.9 million, comparable to the average of $4.8 million between 2003 and 2013.
The 38% increase in value of these selected domestic agricultural outputs in the past year is
attributable to the increase in the value of vegetables produced (Table 10.1).
Vegetables have been the largest single contributor to the value of domestic agricultural output
throughout the period 2003 to 2013. In 2013, vegetables comprised 89% of the value of the
selected domestic agricultural output. Figure 1 shows that the value of domestic vegetables has
fluctuated significantly over the period. They have rebounded from a low in 2012 of $3.1 million
to $4.4 million in 2013, an increase of 44%.
Landlines on a Steady Decline
The number of Bermuda Telephone Company telephone subscribers has been on the decline each year for the past eleven years (Figure 2). The decline in telephone subscribers between
2003/04 and 2013/14 was 34% for both residential and commercial subscribers. A likely reason
for this decline could be a shift towards using cellular devices to replace traditional landlines.
Applications for Planning Permission: Lowest in Decades
Applications for planning permission are required for all types of development, including new
buildings, additions, alterations, demolitions, etc.2 The number of applications for planning
permission has fluctuated over the past eleven years, although the general trend has been a
decline (Figure 3). Over the period, the number of applications has nearly halved, from 1,701
applications in 2003 to 884 applications in 2013 (Table 10.8). The 2012 and 2013 number of
planning applications were the lowest since 1966, possibly a result of Bermuda’s continuing
recession.
1 Thomas H. Spreen, Ed W. Stover, Kevin Athearn, Review of the Bermudian Agricultural Sector for the
Government of Bermuda, 2002 2 Bermuda Government Department of Planning, Frequently Asked Questions, Retrieved October 22, 2014 from
http://www.planning.gov.bm/documents/FAQ.pdf
96
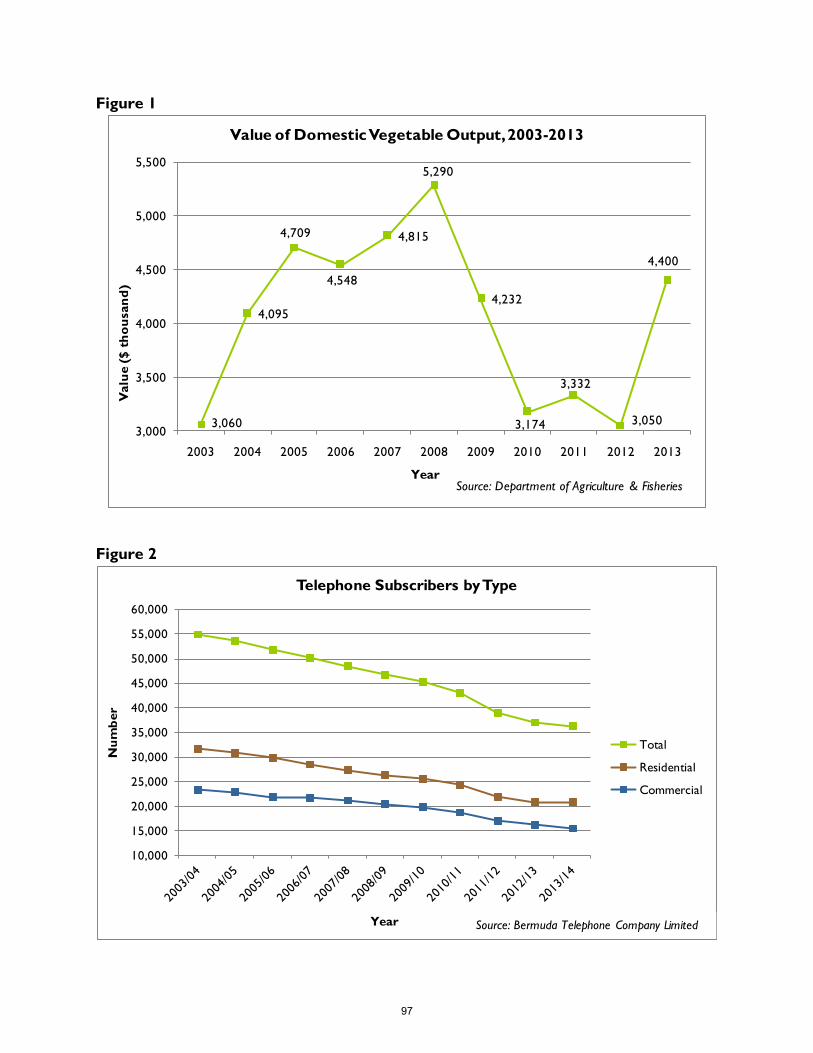
Figure 1
3,060
4,095
4,709
4,548
4,815
5,290
4,232
3,174
3,332
3,050
4,400
3,000
3,500
4,000
4,500
5,000
5,500
2003 2004 2005 2006 2007 2008 2009 2010 2011 2012 2013
Valu
e (
$ t
ho
usan
d)
Year
Value of Domestic Vegetable Output, 2003-2013
Source: Department of Agriculture & Fisheries
Figure 2
10,000
15,000
20,000
25,000
30,000
35,000
40,000
45,000
50,000
55,000
60,000
Nu
mb
er
Year
Telephone Subscribers by Type
Total
Residential
Commercial
Source: Bermuda Telephone Company Limited
97
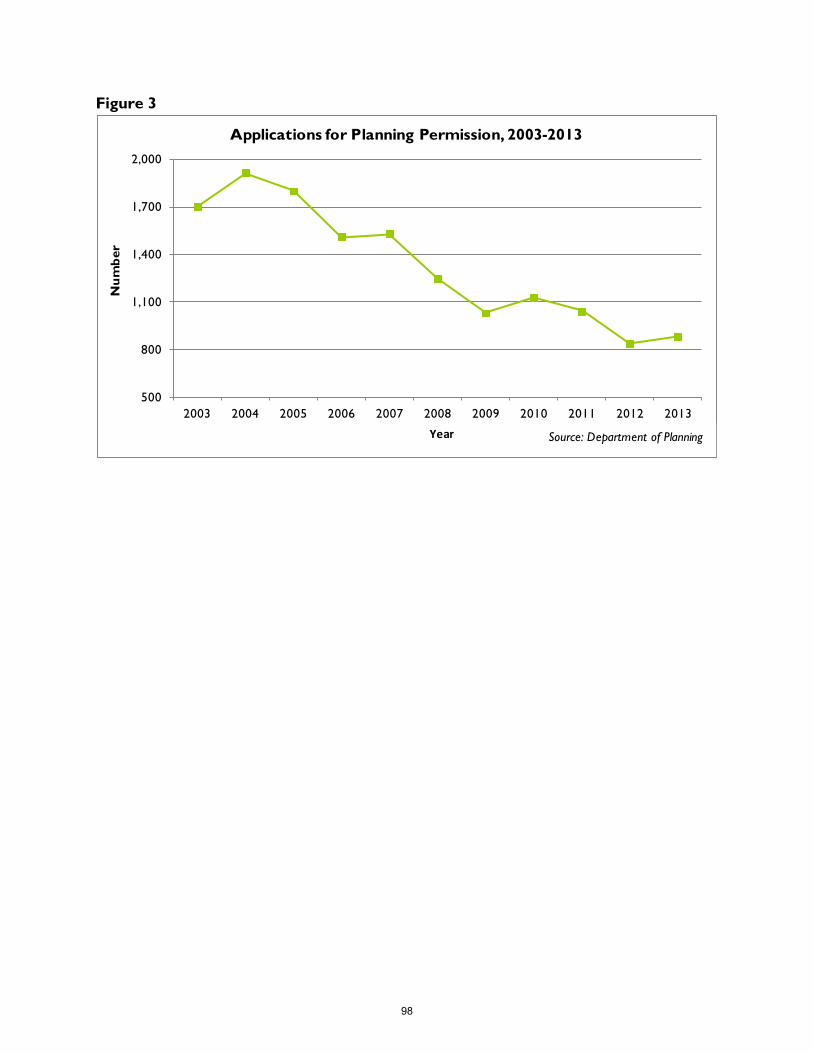
Figure 3
500
800
1,100
1,400
1,700
2,000
2003 2004 2005 2006 2007 2008 2009 2010 2011 2012 2013
Nu
mb
er
Year
Applications for Planning Permission, 2003-2013
Source: Department of Planning
98
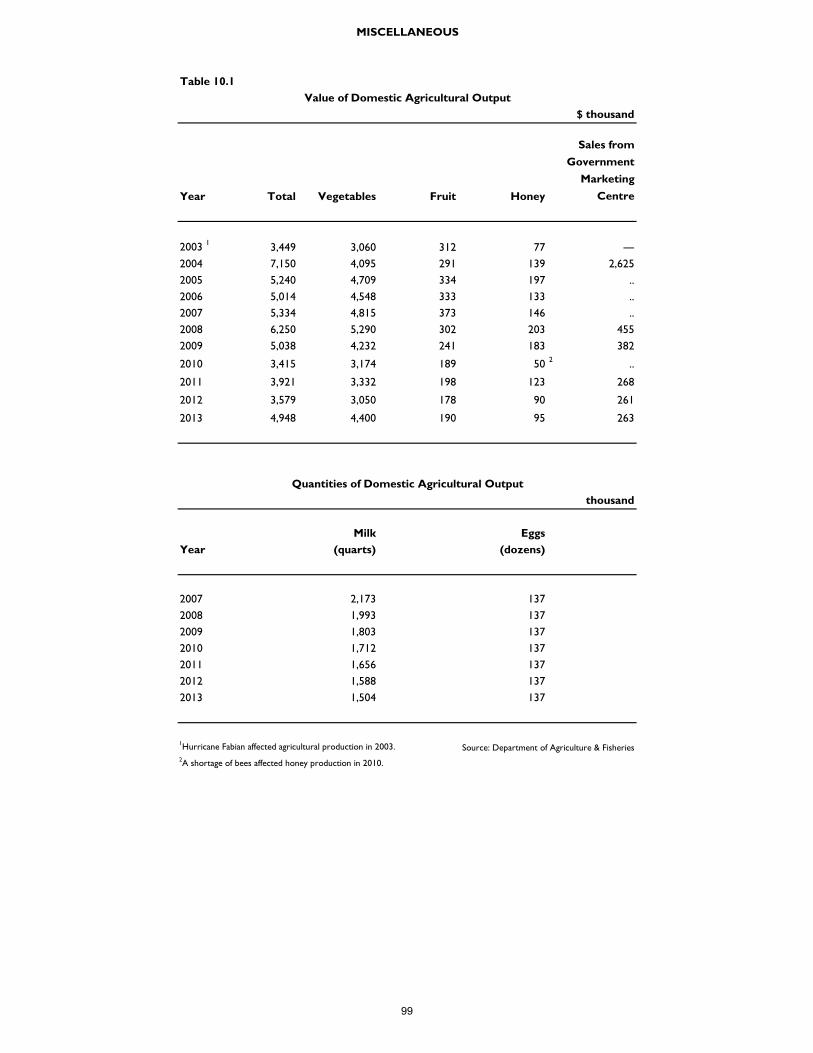
Table 10.1
$ thousand
Year Total Vegetables Fruit Honey
Sales from
Government
Marketing
Centre
2003 1
3,449 3,060 312 77 ―
2004 7,150 4,095 291 139 2,625
2005 5,240 4,709 334 197 ..
2006 5,014 4,548 333 133 ..
2007 5,334 4,815 373 146 ..
2008 6,250 5,290 302 203 455
2009 5,038 4,232 241 183 382
2010 3,415 3,174 189 502
..
2011 3,921 3,332 198 123 268
2012 3,579 3,050 178 90 261
2013 4,948 4,400 190 95 263
thousand
Milk Eggs
Year (quarts) (dozens)
2007 2,173 137
2008 1,993 137
2009 1,803 137
2010 1,712 137
2011 1,656 137
2012 1,588 137
2013 1,504 137
1Hurricane Fabian affected agricultural production in 2003. Source: Department of Agriculture & Fisheries
2A shortage of bees affected honey production in 2010.
MISCELLANEOUS
Value of Domestic Agricultural Output
Quantities of Domestic Agricultural Output
99
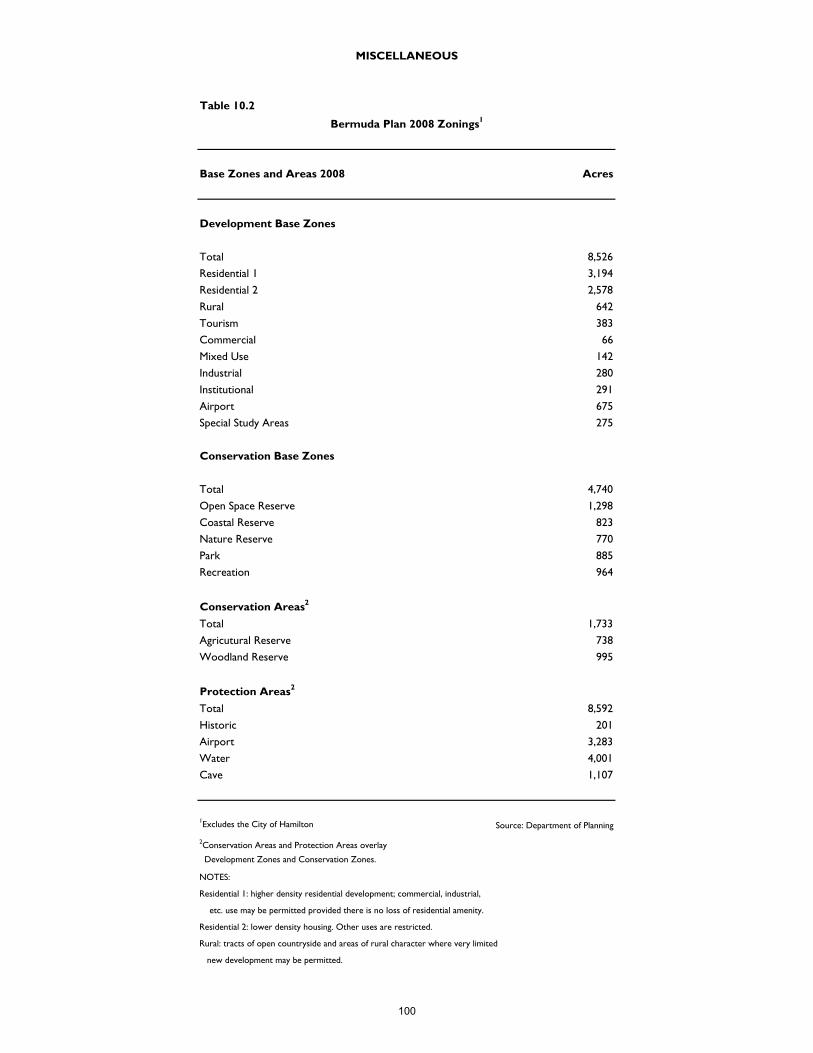
Table 10.2
Base Zones and Areas 2008 Acres
Development Base Zones
Total 8,526
Residential 1 3,194
Residential 2 2,578
Rural 642
Tourism 383
Commercial 66
Mixed Use 142
Industrial 280
Institutional 291
Airport 675
Special Study Areas 275
Conservation Base Zones
Total 4,740
Open Space Reserve 1,298
Coastal Reserve 823
Nature Reserve 770
Park 885
Recreation 964
Conservation Areas2
Total 1,733
Agricutural Reserve 738
Woodland Reserve 995
Protection Areas2
Total 8,592
Historic 201
Airport 3,283
Water 4,001
Cave 1,107
1Excludes the City of Hamilton Source: Department of Planning
2Conservation Areas and Protection Areas overlay
Development Zones and Conservation Zones.
NOTES:
Residential 1: higher density residential development; commercial, industrial,
etc. use may be permitted provided there is no loss of residential amenity.
Residential 2: lower density housing. Other uses are restricted.
Rural: tracts of open countryside and areas of rural character where very limited
new development may be permitted.
MISCELLANEOUS
Bermuda Plan 2008 Zonings1
100
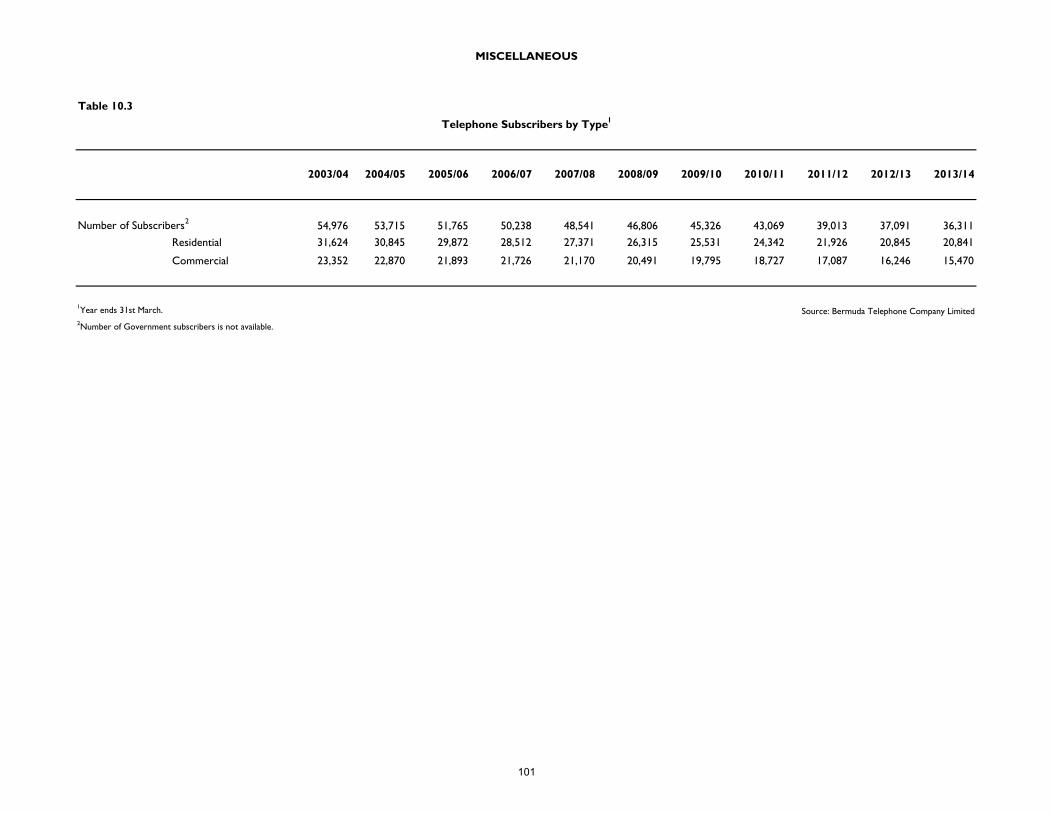
Table 10.3
2003/04 2004/05 2005/06 2006/07 2007/08 2008/09 2009/10 2010/11 2011/12 2012/13 2013/14
Number of Subscribers2 54,976 53,715 51,765 50,238 48,541 46,806 45,326 43,069 39,013 37,091 36,311
Residential 31,624 30,845 29,872 28,512 27,371 26,315 25,531 24,342 21,926 20,845 20,841
Commercial 23,352 22,870 21,893 21,726 21,170 20,491 19,795 18,727 17,087 16,246 15,470
1Year ends 31st March. Source: Bermuda Telephone Company Limited2Number of Government subscribers is not available.
MISCELLANEOUS
Telephone Subscribers by Type1
101
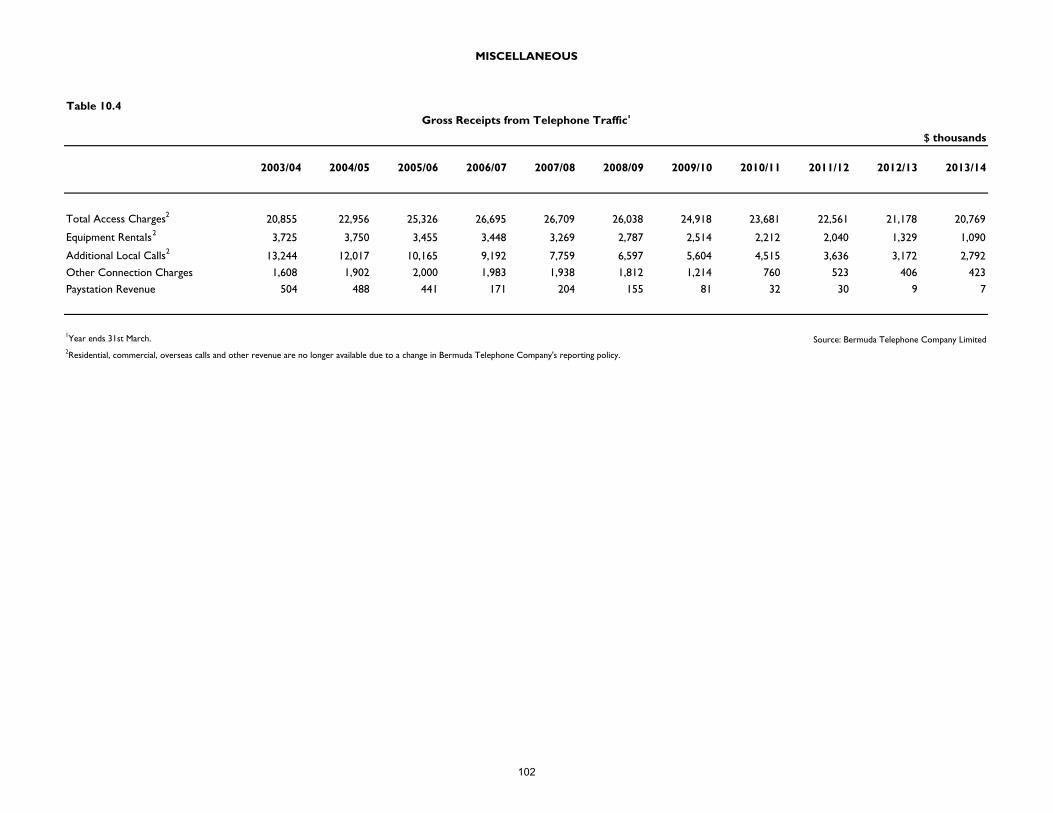
Table 10.4
$ thousands
2003/04 2004/05 2005/06 2006/07 2007/08 2008/09 2009/10 2010/11 2011/12 2012/13 2013/14
Total Access Charges2 20,855 22,956 25,326 26,695 26,709 26,038 24,918 23,681 22,561 21,178 20,769
Equipment RentaIs2 3,725 3,750 3,455 3,448 3,269 2,787 2,514 2,212 2,040 1,329 1,090
Additional Local Calls2 13,244 12,017 10,165 9,192 7,759 6,597 5,604 4,515 3,636 3,172 2,792
Other Connection Charges 1,608 1,902 2,000 1,983 1,938 1,812 1,214 760 523 406 423
Paystation Revenue 504 488 441 171 204 155 81 32 30 9 7
1Year ends 31st March. Source: Bermuda Telephone Company Limited2Residential, commercial, overseas calls and other revenue are no longer available due to a change in Bermuda Telephone Company's reporting policy.
MISCELLANEOUS
Gross Receipts from Telephone Traffic1
102
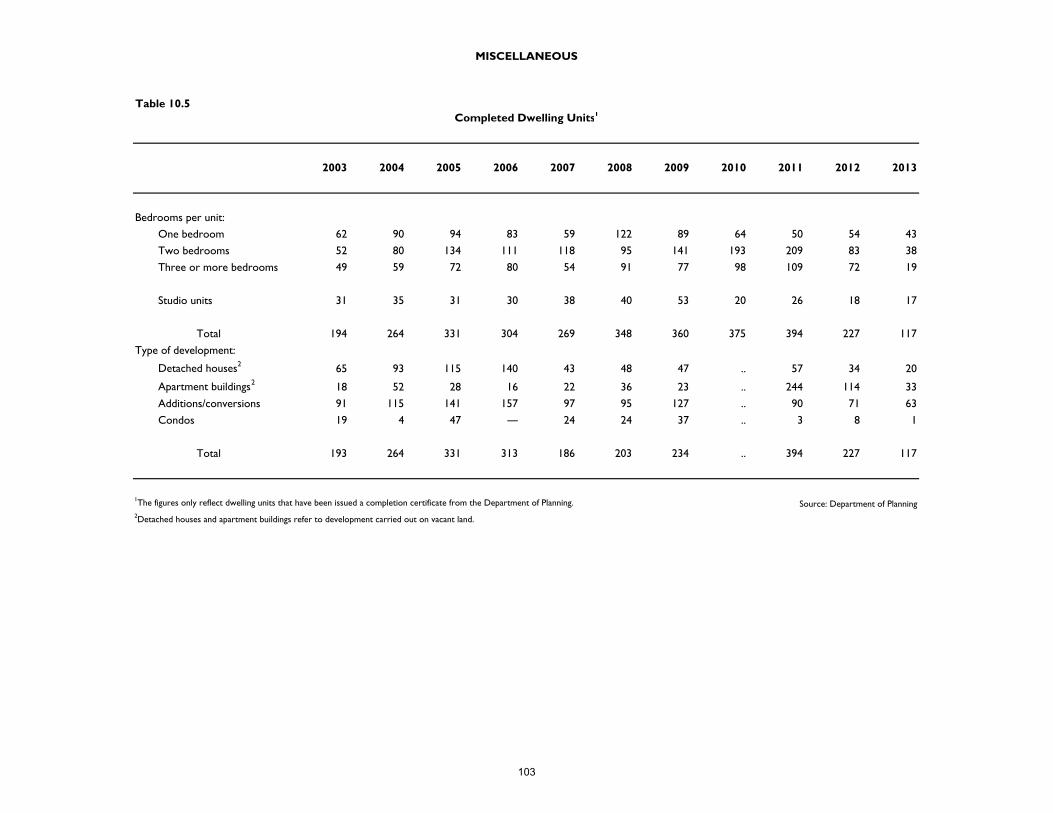
Table 10.5
2003 2004 2005 2006 2007 2008 2009 2010 2011 2012 2013
Bedrooms per unit:
One bedroom 62 90 94 83 59 122 89 64 50 54 43
Two bedrooms 52 80 134 111 118 95 141 193 209 83 38
Three or more bedrooms 49 59 72 80 54 91 77 98 109 72 19
Studio units 31 35 31 30 38 40 53 20 26 18 17
194 264 331 304 269 348 360 375 394 227 117
Type of development:
Detached houses2 65 93 115 140 43 48 47 .. 57 34 20
Apartment buildings2 18 52 28 16 22 36 23 .. 244 114 33
Additions/conversions 91 115 141 157 97 95 127 .. 90 71 63
Condos 19 4 47 ― 24 24 37 .. 3 8 1
193 264 331 313 186 203 234 .. 394 227 117
1The figures only reflect dwelling units that have been issued a completion certificate from the Department of Planning. Source: Department of Planning2Detached houses and apartment buildings refer to development carried out on vacant land.
MISCELLANEOUS
Completed Dwelling Units1
Total
Total
103
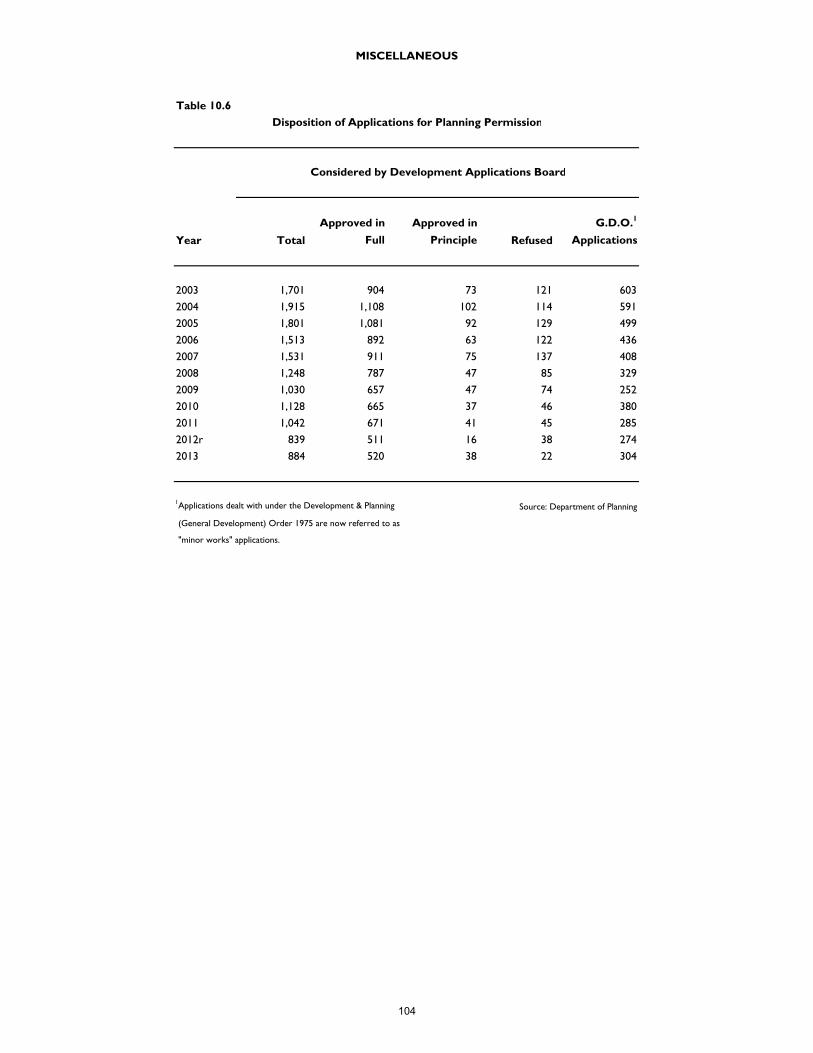
Table 10.6
Year Total
Approved in
Full
Approved in
Principle Refused
G.D.O.1
Applications
2003 1,701 904 73 121 603
2004 1,915 1,108 102 114 591
2005 1,801 1,081 92 129 499
2006 1,513 892 63 122 436
2007 1,531 911 75 137 408
2008 1,248 787 47 85 329
2009 1,030 657 47 74 252
2010 1,128 665 37 46 380
2011 1,042 671 41 45 285
2012r 839 511 16 38 274
2013 884 520 38 22 304
1Applications dealt with under the Development & Planning Source: Department of Planning
(General Development) Order 1975 are now referred to as
"minor works" applications.
MISCELLANEOUS
Disposition of Applications for Planning Permission
Considered by Development Applications Board
104
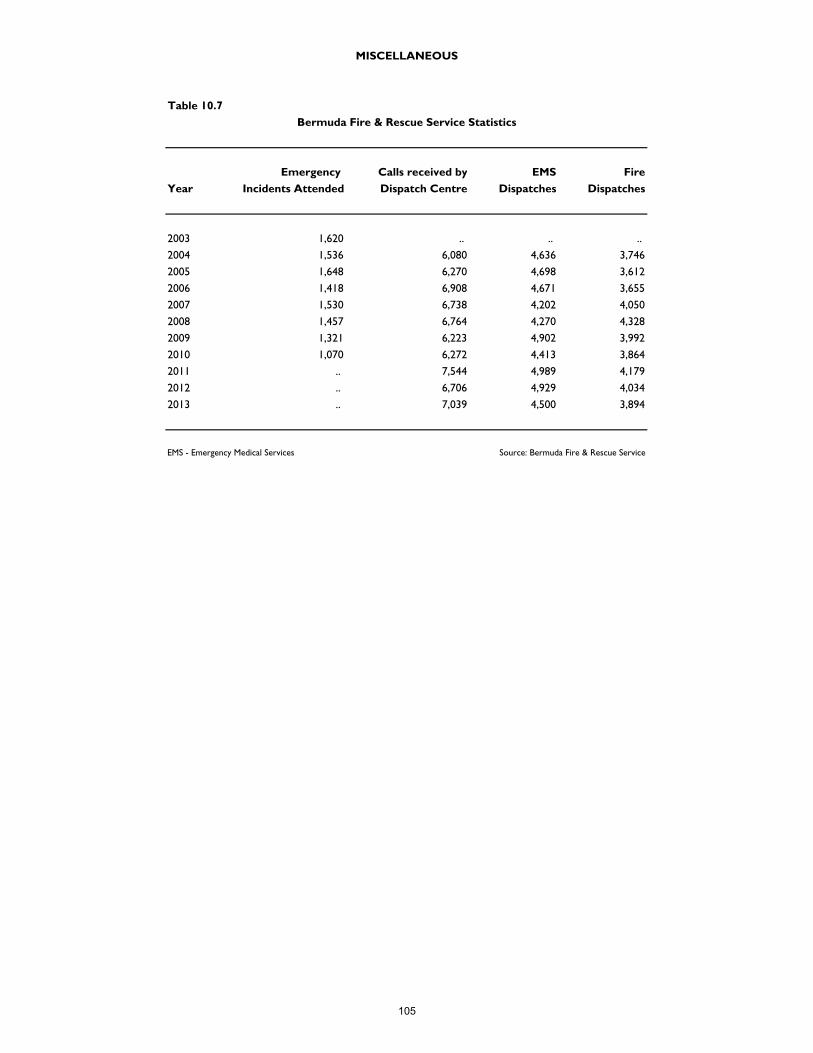
Table 10.7
Emergency Calls received by EMS Fire
Year Incidents Attended Dispatch Centre Dispatches Dispatches
2003 1,620 .. .. ..
2004 1,536 6,080 4,636 3,746
2005 1,648 6,270 4,698 3,612
2006 1,418 6,908 4,671 3,655
2007 1,530 6,738 4,202 4,050
2008 1,457 6,764 4,270 4,328
2009 1,321 6,223 4,902 3,992
2010 1,070 6,272 4,413 3,864
2011 .. 7,544 4,989 4,179
2012 .. 6,706 4,929 4,034
2013 .. 7,039 4,500 3,894
EMS - Emergency Medical Services Source: Bermuda Fire & Rescue Service
MISCELLANEOUS
Bermuda Fire & Rescue Service Statistics
105
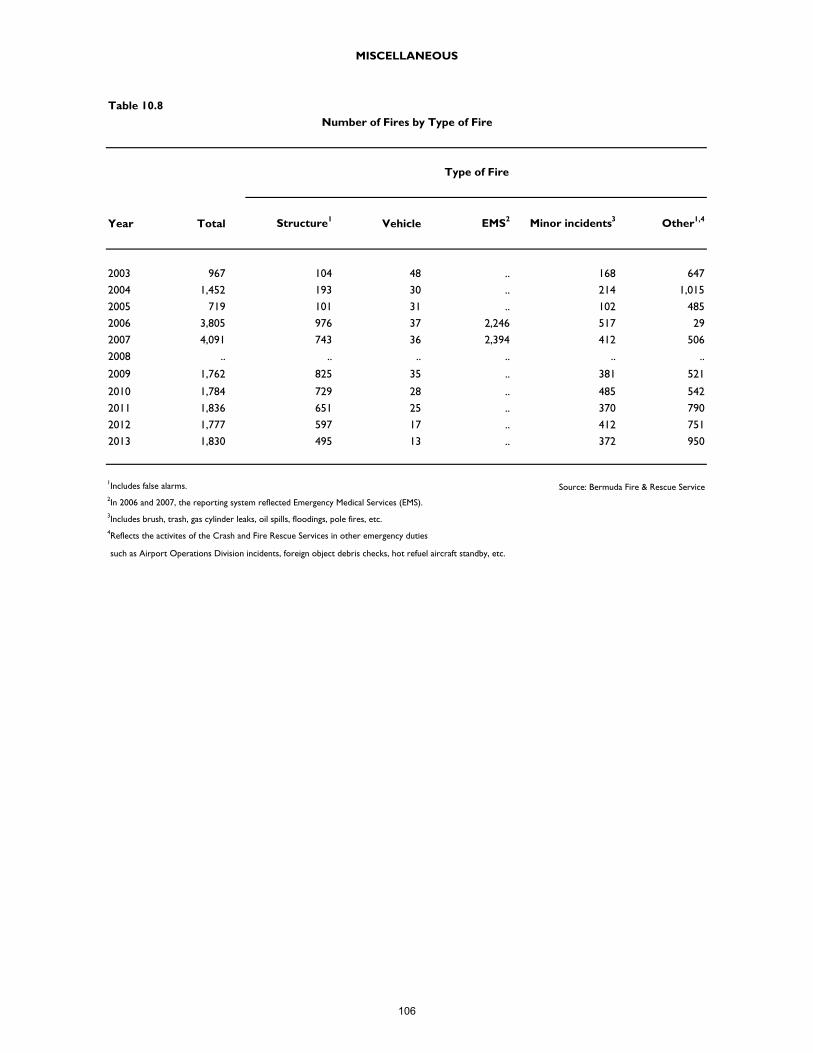
Table 10.8
Year Total Structure1 Vehicle EMS2 Minor incidents3 Other1,4
2003 967 104 48 .. 168 647
2004 1,452 193 30 .. 214 1,015
2005 719 101 31 .. 102 485
2006 3,805 976 37 2,246 517 29
2007 4,091 743 36 2,394 412 506
2008 .. .. .. .. .. ..
2009 1,762 825 35 .. 381 521
2010 1,784 729 28 .. 485 542
2011 1,836 651 25 .. 370 790
2012 1,777 597 17 .. 412 751
2013 1,830 495 13 .. 372 950
1Includes false alarms. Source: Bermuda Fire & Rescue Service2In 2006 and 2007, the reporting system reflected Emergency Medical Services (EMS). 3Includes brush, trash, gas cylinder leaks, oil spills, floodings, pole fires, etc.4Reflects the activites of the Crash and Fire Rescue Services in other emergency duties
such as Airport Operations Division incidents, foreign object debris checks, hot refuel aircraft standby, etc.
MISCELLANEOUS
Number of Fires by Type of Fire
Type of Fire
106