department of petroleum engineering pete 203: drilling ... · pdf filepete 203: drilling...
TRANSCRIPT

KING FAHD UNIVERSITY OF PETROLEUM & MINERALS
Department of Petroleum Engineering
PETE 203: DRILLING ENGINEERING
LABORATORY MANUAL
APRIL 2003

ii
PREFACE The purpose of this manual is two fold: first to acquaint the Drilling Engineering students with the basic techniques of formulating, testing and analyzing the properties of drilling fluid and oil well cement, and second, to familiarize him with practical drilling and well control operations by means of a simulator. To achieve this objective, the manual is divided into two parts. The first part consists of seven experiments for measuring the physical properties of drilling fluid such as mud weight (density), rheology (viscosity, gel strength, yield point) sand content, wall building and filtration characteristics. There are also experiment for studying the effects of, and treatment techniques for, common contaminants on drilling fluid characteristics. Additionally, there are experiments for studying physical properties of Portland cement such as free water separation, normal and minimum water content and thickening time. In the second part, there are five laboratory sessions that involve simulated drilling and well control exercises. They involve the use of the DS-100 Derrick Floor Simulator, a full replica of an actual drilling rig with fully operations controls, which allow the student to become completely absorbed in the exercises as he would in an actual drilling operation. The simulator has realistic drilling rig responses that are synchronized to specific events, like rate of penetration, rotary table motion, and actual rig sounds such as accumulator recharge, break drawworks, etc. It is hoped that the material in this manual will effectively supplement the theory aspect presented in the main course.
iii
TABLE OF CONTENTS
PART I: DRILLING FLUID AND CEMENTING 1. Preface…………………………………………………………………ii 2. Table of Contents……………………………………………………...iii 3. Laboratory Safety Instructions..…………………….………………… v 4. Experiment No. 1: Mud Weight, Marsh Funnel Viscosity and pH…..1 5. Experiment No. 2: Mud Rheology Test………………………………7 6. Experiment No. 3: Filtration, Wall Building and Resistivity……….15 7. Experiment No. 4. Mud Weight Control………………………….…21 8. Experiment No. 5. Drilling Fluid Contamination Test………………25 9. Experiment No. 6. Solid, Liquid Content and Emulsion Characteristic of Drilling Fluids……….…….27 10. Experiment No. 7. Oil Well Cementing Experiments………….…...43 PART II: DRILLING SIMULATOR SESSIONS 11. Front Page for Drilling Simulator Laboratory Sessions………………47 12. Lab. Session 1: Familiarization and Line-up of Operational Components I……………………………………....48 13. Lab. Session 2: Familiarization and Line-up of Operational Components II………………………………….…..58 14. Lab. Session 3: Operation of Major Components……………….…..66 15. Lab. Session 4: Kick Identifications and Well Shut-in Procedures…72

iv
16. Lab. Session 5: Kick Control Exercises: Well Control Operations….80 17. Appendix A: References……………..…………………………….83 18. Appendix B: Format for Laboratory Reports………………….…..83 19. Appendix C: Classification, Composition and Preparation of Drilling Fluids………….…………………………...85 20. Appendix D: Miscellaneous Formulas…………………………….89 20. Appendix E: Drilling Fluid and Cementing Expt. Equipment ..….92

v
LABORATORY SAFETY INSTRUCTIONS
Safety in the laboratory must be of vital concern to all those engaged in experimental science work. It is therefore the responsibility of everyone to adhere strictly to the basic safety precautions provided and to avoid any acts of carelessness that can endanger his life and that of others around him. It is equally important to always abide by all the instructions for conducting the experimental work during the laboratory sessions. Below are some guidelines for general laboratory safety and procedures: 1. All students must be familiar with the locations and operational procedures of the Emergency Shower, Fire Extinguishers, Gas Masks and Fire Blankets. These safety devices pictured below. 2. Laboratory coats, safety glasses and safety shoes MUST be worn at all times during the laboratory session. NO THOABS and open sandals are allowed during the laboratory sessions. 3. Eating, drinking and smoking are strictly PROHIBITED in the laboratory at all times. Laboratory glassware should NEVER be used for drinking purpose. 4. Report any injury immediately for First Aid treatment, no matter how small. 5. Report any damage to equipment or instrument and broken glassware to the laboratory instructor as soon as such damage occurs.
Emergency Shower Fire Blankets Gas Mask and Fire Extinguisher
1
EXPERIMENT NO. 1
MUD WEIGHT, MARSH FUNNEL VISCOSITY AND pH (A) MUD WEIGHT OR DENSITY TEST: Theory The density of the drilling fluid must be controlled to provide adequate
hydrostatic head to prevent influx of formation fluids, but not so high as to cause loss of circulation or adversely affect the drilling rate and damaging the formation.
Normal pressure gradient by water is equal to (0.433 psi/ft) and equal to
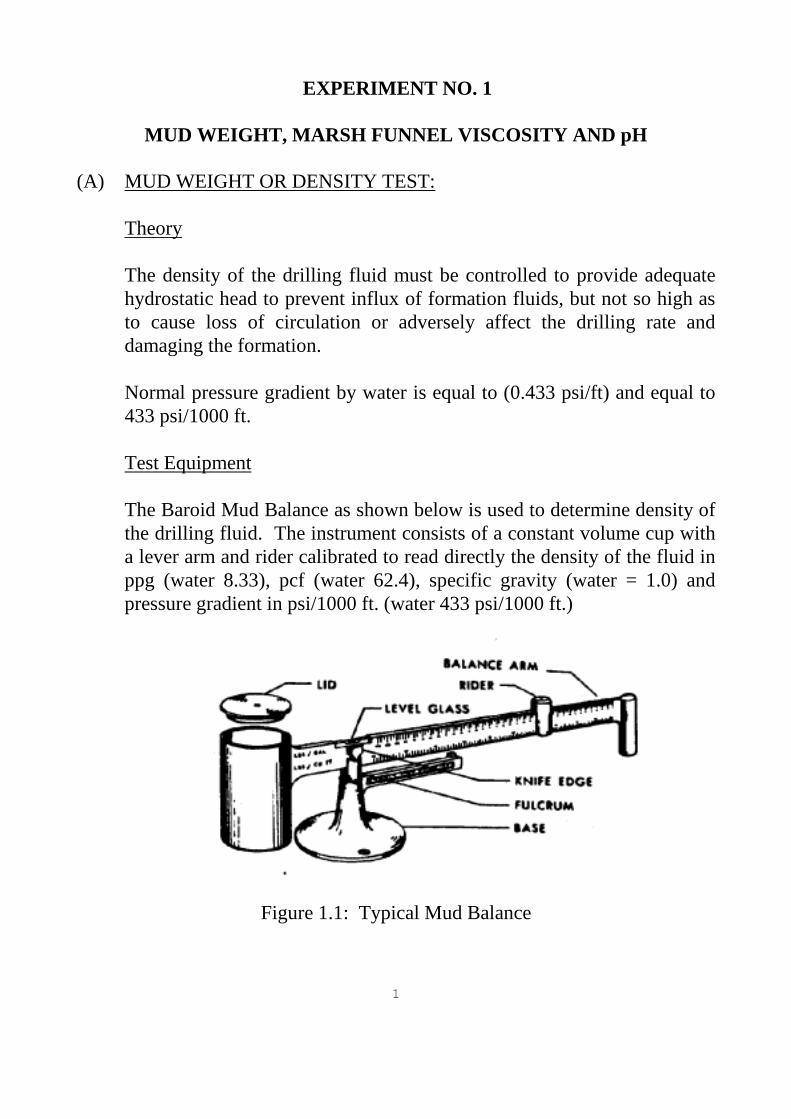
433 psi/1000 ft. Test Equipment The Baroid Mud Balance as shown below is used to determine density of
the drilling fluid. The instrument consists of a constant volume cup with a lever arm and rider calibrated to read directly the density of the fluid in ppg (water 8.33), pcf (water 62.4), specific gravity (water = 1.0) and pressure gradient in psi/1000 ft. (water 433 psi/1000 ft.)
Figure 1.1: Typical Mud Balance

2
Calibration 1. Remove the lid from the cup, and completely fill the cup with water. 2. Replace the lid and wipe dry. 3. Replace the balance arm on the base with knife-edge resting on the
fulcrum. 4. The level vial should be centered when the rider is set on 8.33. If not,
add to or remove shot from the well in the end of the bream. Test Procedure 1. Remove the lid from the cup, and completely fill the cup with the mud to
be tested. 2. Replace the lid and rotate until firmly seated, making sure some mud is
expelled through the hole in the cup. 3. Wash or wipe the mud from the outside of the cup. 4. Place the balance arm on the base, with the knife-edge resting on the
fulcrum. 5. Move the rider until the graduated arm is level, as indicated by the level
vial on the beam. 6. At the left-hand edge of the rider, read the density on either side of the
lever in all desired units without disturbing the rider. 7. Note down mud temperature corresponding to density. (B) MUD VISCOSITY: Theory The viscosity of a fluid is defined as its resistance to flow. The desired
viscosity for a particular drilling operation is influenced by several factors, including mud density, hole size, pumping rate, drilling rate, pressure system and requirements, and hold problems. The indicated viscosity as obtained by any instrument is valid only for that rate of shear and will differ to some degree when measured at a different rate of shear. For field measurements the marsh funnel has become the standard instrument. For laboratory, the Fann V-G meter, a direct indicating rotational multi-speed instrument, has become the standard, allowing measurements of plastic viscosity, yield point, gel strength to be made.

3
The Stormer viscometer is still, however, used to some extent for single point (apparent) viscosity and 0-10 min. gel.
Test Equipment The Marsh Funnel is a device that is common to every drilling rig.
Details of the Marsh Funnel and receiving cup are shown in Figures 1-2, and 1-3. The viscosity is reported in seconds allowed to flow out of the funnel. API specifications call for 1500 ml and one quart (946) ml out. For API water at 70 F + 0.5oF = 26 + 0.5 sec. The Marsh Funnel measures the apparent viscosity.
Calibration Fill the funnel to the bottom of the screen (1500 ml) with water at 70 F
(plus or minus 0.5 F) time of outflow of the quart (946 ml) should be 26 seconds plus or minus 1/2 second.
Figure 1.2: Marsh Funnel and One-liter Cup

4
Test Procedure 1. With the funnel in an upright position, cover the orifice with a finger and
pour the freshly collected mud sample through the screen into a clean, dry funnel until the fluid level reaches the bottom of the screen (1500 ml).
2. Immediately remove the finger from the outlet and measure the time
required for the mud to fill the receiving vessel to the 1-quart (946 ml) level.
3. Report the result to the nearest second as Marsh Funnel Viscosity at the
temperature of the measurement in degrees Fahrenheit or Centigrade. (C) HYDROGEN ION CONCENTRATION (pH): Theory The acidity and the alkalinity of the drilling fluid can be measured by the
concentration of the (H+) ion in the fluid. As for instance, if H+ is large (1 x 10⁻¹), then the (OH-) hydroxyl concentration is very low (1 x 10-13), the solution is strongly acidic. If the (OH-) concentration is (1 x 10⁻¹) very high then (H+) concentration is very low then the solution is strongly alkaline. The pH of a solution is the logarithm of the reciprocal of the (H+) concentration in grams moles per liter, expresses as:
pH = log [ ]++ −=
H
Hlog1
Example: If the solution is neutral then H+ and OH- concentrations are
the same equal to 1 x 10⁻⁷.
pH = [ ] ( ) 00.77101log1011log 7
7 =−−=−=
−
− xx
5
Therefore, if the pH of a mixture drops from 7.0 to 6.0, the number of (H+) increase ten times.
The pH of a mud seldom is below 7 and in most cases fall between 8 and
12.5 depending upon the type of mud. The pH is important because the pH affects the solubility of the organic thinners and the dispersion of clays presents in the mud.
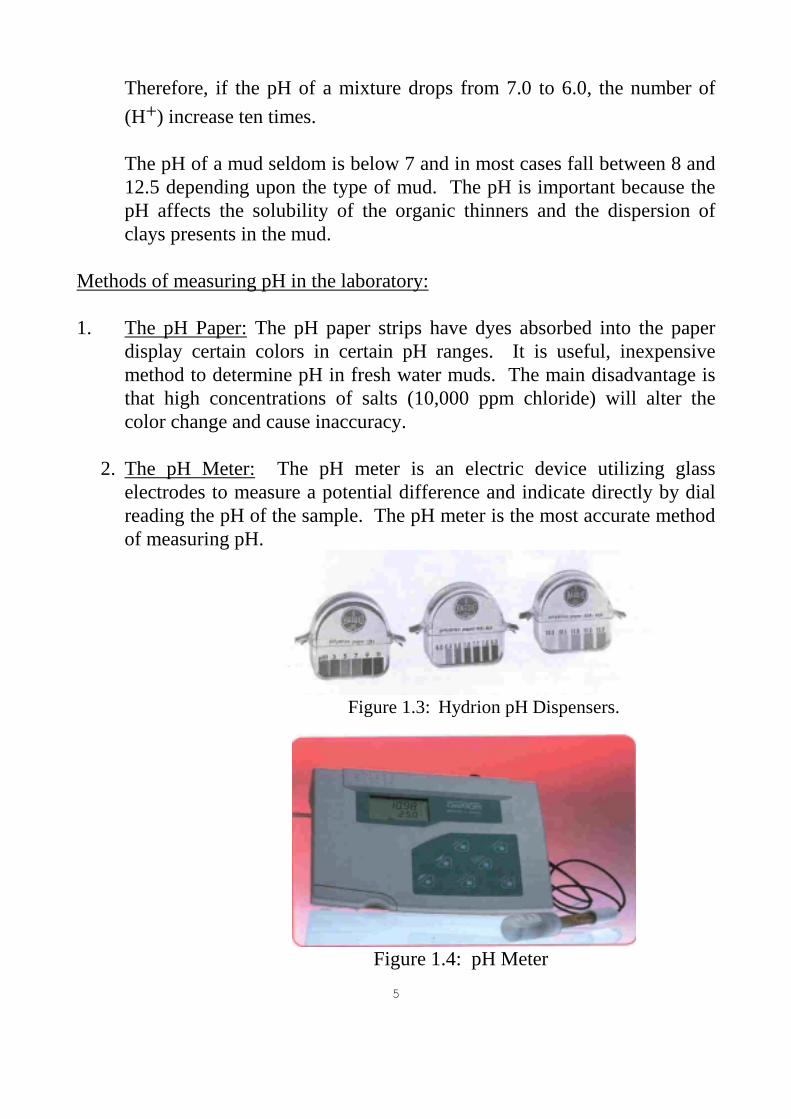
Methods of measuring pH in the laboratory: 1. The pH Paper: The pH paper strips have dyes absorbed into the paper
display certain colors in certain pH ranges. It is useful, inexpensive method to determine pH in fresh water muds. The main disadvantage is that high concentrations of salts (10,000 ppm chloride) will alter the color change and cause inaccuracy.
2. The pH Meter: The pH meter is an electric device utilizing glass
electrodes to measure a potential difference and indicate directly by dial reading the pH of the sample. The pH meter is the most accurate method of measuring pH.
Figure 1.3: Hydrion pH Dispensers.
Figure 1.4: pH Meter

6
EXPERIMENT The Laboratory Test: 1. Take 2 samples of mud from each of the mud tanks. 2. Stir the samples for 2 minutes and determine: (a) The Mud Weight (b) Marsh Funnel Viscosity in seconds (c) pH value using - pH meter - Hydrion papers

7
RESULTS OF MUD PROPERTIES TEST WATER BASED MUD
(Density, Viscosity, pH)
Room Temp. oF/ oC
Sample
No.
Mud Weight
Marsh Funnel Viscosity
pH (Hydrogen Ion Conc.)
ppg psi/1000 pp ft3 Sec. Phydrion PH Meter
1.
2.
8
QUESTIONS ON EXPERIMENT NO. 1 Answer the following: 1. List any five (5) very important functions of the drilling fluid? 2. What requirements should a drilling fluid meet? 3. Using the mud weights (ppg) obtained for Samples #1 and 2 of your experiment, calculate, how much hydrostatic pressure that each sample will exert on a formation at a depth of 10,000 ft. 4. What is the difference between Over-balance and Under-balance? 5. Estimate the mud weight needed to balance a formation pressure
equivalent to 10,000 ft. depth with 0.561 psi/ft. pressure gradient.

9
EXPERIMENT NO. 2
MUD RHEOLOGY TEST Viscosity, Gel Strength and Yield Point
Introduction Rheology refers to the deformation and flow behavior of all forms of matter. Certain rheologic measurements made on fluids, such as viscosity, gel strength, etc. help determine how this fluid will flow under a variety of different conditions. This information is important in the design of circulating systems required to accomplish certain desired objectives in drilling operations. (A) VISCOSITY: Theory Viscosity is defined as the resistance of a fluid to flow and is measured as the ratio of the shearing stress to the rate of shearing strain. Two types of fluid characterizations are: 1. Newtonian (true fluids) where the ratio of shear stress to shear rate or viscosity is constant, e.g. water, light oils, etc. and 2. Non-Newtonian (plastic fluids) where the viscosity is not constant, e.g. drilling muds, colloids, etc.
Figure 2.1: Flow Curves of Newtonian and non-Newtonian Fluids

10
Test Equipment The Baroid (Model 286) Rheometer is a coaxial cylindrical rotational viscometer, used to determine single or multi-point viscosities. It has fixed speeds of 3 (GEL), 100, 200, 300 and 600 RPM that are switch selectable with the RPM knob.
Figure 2.2: Variable Speed Rheometer
Additionally, the same switch set to the VAR position enables speed selection of between 3 and 625 RPM, by manual adjustment of the variable knob. VISCOSITY MEASUREMENT PROCEDURE 1. Place a recently agitated sample in the cup, tilt back the upper housing of
the rheometer, locate the cup under the sleeve (the pins on the bottom of the cup fit into the holes in the base plate), and lower the upper housing to its normal position.
2. Turn the knurled knob between the rear support posts to raise or lower
the rotor sleeve until it is immersed in the sample to the scribed line.

11
3. Stir the sample for about 5 seconds at 600 RPM, then select the RPM desired for the best.
4. Wait for the dial reading to stabilize (the time depends on the sample's characteristics).
5. Record the dial reading and RPM. RHEOLOGICAL CALCULATIONS 1. Plastic viscosity (in centipoise-up): Plastic Viscosity = µ p = 600 RPM reading - 300 RPM Reading 2. Apparent Viscosity (in centipoise-cp): Apparent Viscosity = µa = 600 RPM Reading 2 3. Yield Point (in lb/100 ft2): Yield Point = Y. P. = 300 RPM Reading - Plastic Viscosity (B) GEL STRENGTH: Theory The Baroid Rheometer is also used to determine the Gel strength, in lb/100 sq. ft., of a mud. The Gel strength is a function of the inter-particle forces. An initial 10-second gel and a 10-minute gel strength measurement give an indication of the amount of gellation that will occur after circulation ceased and the mud remains static. The more the mud gels during shutdown periods, the more pump pressure will be required to initiate circulation again. Most drilling muds are either colloids or emulsions which behave as plastic or non-Newtonian fluids. The flow characteristics of these differ from those of Newtonian fluids (i.e. water, light oils, etc.) in that their viscosity is not constant but varied with the rate of shear, as shown in Figure 2.2. Therefore,

12
the viscosity of plastic fluid will depend on the rate of shear at which the measurements were taken. Gel Strength Measurement Procedures 1. Stir a sample at 600 RPM for about 15 seconds. 2. Turn the RPM knob to the STOP position. 3. Wait the desired rest time (normally 10 seconds or 10 minutes). 4. Switch the RPM knob to the GEL position. 5. Record the maximum deflection of the dial before the Gel breaks, as the
Gel strength in lb/100 ft2. (lb/100 ft2 x 5.077 = Gel strength in dynes/cm2). (C) YIELD POINT: Theory This is the measure of the electro-chemical or attractive forces in the mud under flow (dynamic) conditions. These forces depend on (1) surface properties of the mud solids, (2) volume concentrations of the solids and (3) electrical environment of the solids. The yield point of the mud reflects its ability to carry drilled cuttings out of the hole. Measurement: YP = 300 RPM - Plastic Viscosity Experimental Procedure 1. Obtain a recently agitated mud sample from each of mud tanks (1) and
(2). 2. Using the Baroid Rheometer, obtain dial readings at 3, 300 and 600
RPM.
13
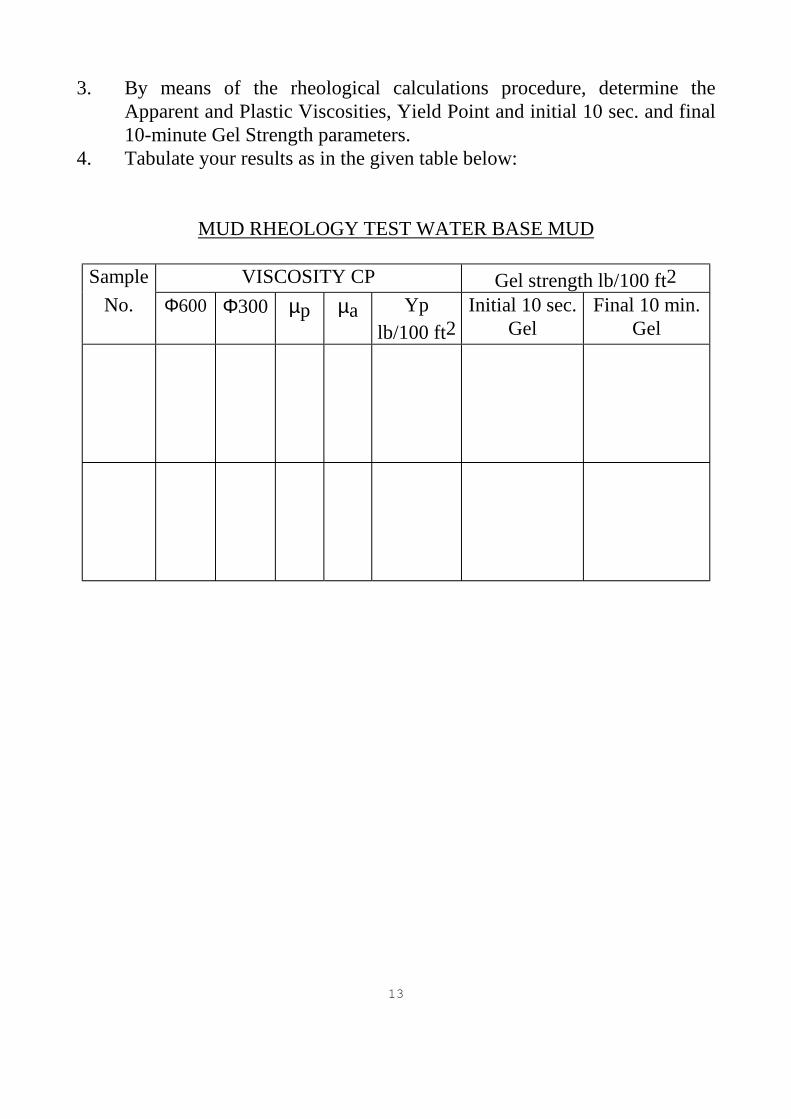
3. By means of the rheological calculations procedure, determine the Apparent and Plastic Viscosities, Yield Point and initial 10 sec. and final 10-minute Gel Strength parameters.
4. Tabulate your results as in the given table below:
MUD RHEOLOGY TEST WATER BASE MUD
Sample VISCOSITY CP Gel strength lb/100 ft2 No. Φ600 Φ300 µp µa Yp
lb/100 ft2 Initial 10 sec.
Gel Final 10 min.
Gel

14
QUESTIONS ON EXPERIMENT NO. 2 1. (a) What is Plastic Viscosity? (b) What does it characterize? (c) What is the difference between the Plastic Viscosity and Apparent
Viscosity of a drilling fluid? 2. Which role does Gel Strength play in the drilling process? 3. What type of fluids does drilling fluid belong to? 4. (a) What is the Yield Point? (b) What does it characterize? (c) What is the difference between Gel Strength and Yield Point of a
drilling mud? 5. Explain what you know about one point and two points curve fluids?
Give one example of each type of fluid.

15
EXPERIMENT NO. 3
FILTRATION, WALL BUILDING, AND RESISTIVITY (A) FILTRATION: Theory The loss of liquid from a mud due to filtration is controlled by the filter cake formed of the solid constituents in the drilling fluid. The test in the laboratory consists of measuring the volume of liquid forced through the mud cake into the formation drilled in a 30 minute period under given pressure and temperature using a standard size cell. It has been found in early work that the volume of fluid lost is roughly proportional to the square root of the time for filtration, i.e. tV ∝
The two commonly determined filtration rates are the low-pressure, low-temperature and the high-pressure high-temperature. Test Equipment The low pressure test is made using standard cell under the API condition of 100 + 5 psi for 30 minutes at room temperature. Another special cell, will be used to measure filtration rate at elevated temperatures and pressure. Filter press used for filtration tests consists of four independent filter cells mounted on a common frame. Each cell has its own valve such that any or all the cells could be operational at the same time. Toggle valve on the top of each cell could be operated independently for the supply of air for each individual cell. Special high pressure and high temperature filtration tests are run in the laboratory simulating formation temperature and formation back- pressure.

16
Figure 3.1: Standard API Filter Press
Figure 3.2: High Temperature High Pressure Filter Press

17
TEST PROCEDURE FOR FILTRATION RATE AT 100 PSI & ROOM TEMPERATURE
1. Detach the mud cell from filter press frame. 2. Remove bottom of filter cell, place right size filter paper in the bottom of
the cell. 3. Introduce mud to be tested into cup assembly, putting filter paper and
screen on top of mud tighten screw clamp. 4. With the air pressure valve closed, clamp the mud cup assembly to the
frame while holding the filtrate outlet end finger tight. 5. Place a graduated cylinder underneath to collect filtrate. 6. Open air pressure valve and start timing at the same time. 7. Report cc of filtrate collected for specified intervals up to 30 minutes. 8. Tabulate the results in an appropriate table. (B) WALL BUILD: MEASUREMENT PROCEDURE FOR MUD CAKE THICKNESS (32nd of an inch or cm) It should be reported in thirty-second of an inch in whole number. Vernier caliper could be used to measure the thickness, however, while measuring care should be taken not to press vernier jaw on mud cake to penetrate through. Results on mud cake thickness should be reported in whole number. Example: 0.75/32" should be reported as 1/32. i.e. closest to the whole number. Likewise 1.75/32" should be reported as 2/32"
18
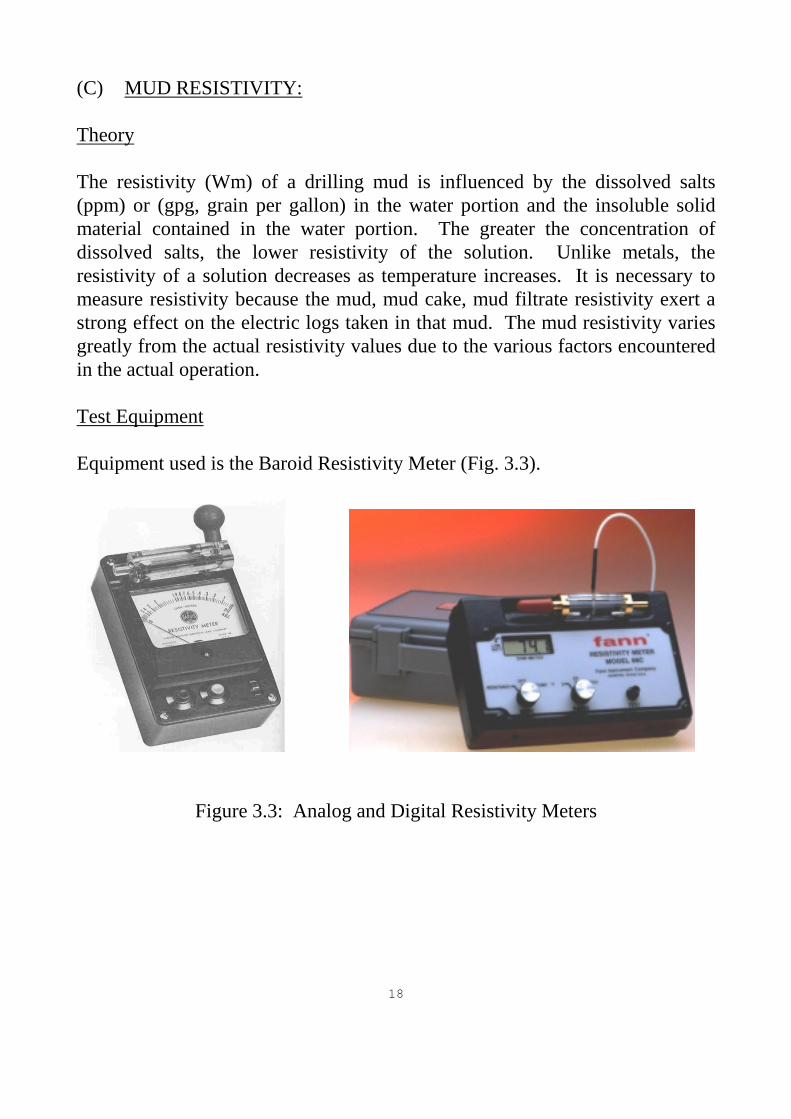
(C) MUD RESISTIVITY: Theory The resistivity (Wm) of a drilling mud is influenced by the dissolved salts (ppm) or (gpg, grain per gallon) in the water portion and the insoluble solid material contained in the water portion. The greater the concentration of dissolved salts, the lower resistivity of the solution. Unlike metals, the resistivity of a solution decreases as temperature increases. It is necessary to measure resistivity because the mud, mud cake, mud filtrate resistivity exert a strong effect on the electric logs taken in that mud. The mud resistivity varies greatly from the actual resistivity values due to the various factors encountered in the actual operation. Test Equipment Equipment used is the Baroid Resistivity Meter (Fig. 3.3).
Figure 3.3: Analog and Digital Resistivity Meters

19
(i) MEASUREMENT PROCEDURE FOR MUD CAKE ESISTIVITY 1. Remove excess water from filter cake. 2. Fill the slot on top of the cell with mud cake. 3. Press black button and adjust for full scale. 4. While keeping the black button depressed, press red button. 5. Reading on the meter is the resistivity of mud cake. 6. Record the resistivity of the mud cake and the temperature of the
cell. 7. Remove the cell and clean thoroughly with distilled water. (ii)MEASUREMENT PROCEDURE FOR MUD FILTRATE RESISTIVITY 1. Fill cell with mud and remove excess mud from the top of the cell
surfaces). 2. Connect cell to the resistivity meter. 3. Press black button and adjust for full scale reading on the meter. 4. While keeping the black button depressed, press the red button. 5. The reading on the meter is the resistivity of the mud (when testing
mud it may be necessary to allow 3-5 minutes after putting mud in the cell before taking a reading to allow cell and the mud filtrate to reach temperature equilibrium).
6. Record the resistivity reading and the temperature of the cell. 7. Remove the cell and clean with distilled water. (Pipe cleaner can
be used to remove particles of mud filtrate that cannot be flushed out with water).

20
QUESTIONS ON EXPERIMENT NO. 3
1. By comparing the Spurt Loss of Sample # 1 and Sample #2 in part A of
your experimental results, determine which of the two samples plugs the filter paper faster and explain why.
2. Describe how the filter cake is formed on the walls of a hole during a
normal drilling operation. 3. What are the factors controlling the rate of filtration? 4. What is sloughing of shale and how can it be controlled?

21
EXPERIMENT NO. 4
CONTROL OF MUD WEIGHT (A) EFFECT OF ADDING BENTONITE ON MUD PROPERTIES FOR
FRESH AND SALT WATER BASE MUD: Procedure 1. Add to every 400 c.c batch of fresh water base mud 2, 4, 6 and 8 grams of
bentonite and stir for 10 minutes. 2. Measure the density lb/gal, viscosity c.c. (apparent and plastic) and yield
point lb/100 ft, using the Rheometer for every batch. 3. Add 20.6 ml of 10% by weight salt water to every batch. Stir for 5
minutes and repeat step (2). 4. Report all the results (density, viscosities, yield) for every batch in a
convenient table. Plot them versus the amount of bentonite in gram in two plots, one for fresh water and the other for salt water.
Discussion: Include the following points in your discussions: 1. Discuss the effect of adding bentonite on density. 2. Discuss the effect of adding bentonite on the rheological properties. 3. Correlate and justify the results obtained for fresh and salt water. 4. What is the effect on yield point? (B) EFFECT OF ADDING WEIGHT MATERIAL (BARITE): Theory Barite was first used, in California, in a well being re-drilled with cable tools in 1923. According to that case, density of the mud was raised to 90 lb/ft3 (1.44 gr/cm3 to control gas in flow and to stop caving.

22
One function of barite has developed - the preparation of a temporary high-density plug formed from slurry of a barite in water (2.65 SG). Such slurry contains the maximum concentration of barite that is used - about 750 lb/bbl (2100 kg/cm3). The minimum concentration of barite might be as low as 10 lb/bbl (28 kg/m3), although usually it would be substantially higher. The quantity of barite required to raise the density of a given volume of mud a specific amount can be readily calculated from the relation, in consistent units:
fB
ofoB
bo
BBoof
VWt
VVVV
ρρρρρρρ
−−
=⇒++=
)(*3.4
where
fρ = Final Mud Density
oρ = Original Mud Density Bρ = Barite Density = 35.82 ppg OV = Original Mud Volume BV = Barite Volume BWt = Barite Weight NB: Specific Gravity of Barite = 4.3

23
Test Procedure 1. Calculate and list the amount of barite required to increase the density of
each batch from 8.6 ppg to 9, 10, 11 and 12 ppg. 2. Obtain 400 cc of original base mud (density 8.6) 3. Add the calculated amount of barite to each batch, stir for about 2
minutes and measure the Apparent and Plastic Viscosities and Yield Point.
4. Repeat step 3 for Salt water-base mud. 5. Tabulate the results and plot the density (ppg ), viscosity (apparent and
plastic) and yield point versus the amount of barite added.. (C) WATER-BACK (ADDING WATER TO A CHEMICALLY TREATED
MUD): 1. Obtain a 350 c.c. of water base mud of 13.5 ppg weight and 9.5 pH. 2. Add water incrementally and measure the Mud weight every time to
reach 10.5 ppg and same (9.5) pH. 3. Measure the viscosity and gel-strength and check if any change occurred. 4. List your results in an appropriate table.

24
QUESTIONS ON EXPERIMENT NO. 4
1. List the advantages obtained by adding weighting material to mud. 2. List three (3) names of weighting material. 3. What are the disadvantages of adding solids to the water based mud? 4. Give reasons for adding water to your mud.

25
EXPERIMENT NO. 5
DRILLING FLUID CONTAMINATION TEST Introduction In preparing a bentonite slurry using fresh water, the bentonite will hydrate and agitation furnished by a mixer is sufficient to separate the hydrated clay plate lets and result in a viscosity and gel strength increase, if the bentonite is placed in salty water or water containing dissolved hardness (calcium or magnesium) the hydration and subsequent dispersion by agitation is reduced. The question arises, what occurs when salt or hardness is added to a dispersed bentonite drilling fluid and what is necessary to return the slurry to an acceptable condition for drilling? In this test we will study the effect of contamination of monovalent chemicals (NaCl and KCl) and divalent chemicals that cause contamination are calcium sulfate (CaSO4), cement (Ca (OH2), and Gypsum (CaSO4 - 2H2O). These soluble salts are commonly encountered during drilling, completion or workover operations.
TEST PROCEDURE FOR MUD CONTAMINATION 1. Test base mud for weight ppg, plastic viscosity cp, apparent viscosity
c.p., yield point lb/100 ft2. 2. Add to 400 ml base mud, 0.75, 1.5, 2.5, 3.5 and 5.0 grams NaCl and
repeat step (1) after each addition (stir every time). 3. Add to a new 400 ml base mud 0.75, 1.5, 2.5, 3.5 and 5.0 grams Gypsum
(CaSO4 - 2H2O) and repeat step (1) after each addition (stir every time). 4. Add to a new 400 ml base mud 0.75, 1.5, 2.5, 3.5 and 5.0 grams
anhydrite (CaSO4) and repeat step (1) after each addition (stir every time).

26
5. Report the results in a convenient table for the three contaminants and plot in three different plots the effect of contamination with salt, gypsum and anhydrite on mud density and viscosities and yield point.
TREATMENT OF THE CONTAMINATED DRILLING FLUID
(A) SALT CONTAMINATION: Test Procedure 1. Test 525 ml of the base mud sample for weight ppg, viscosity cp, yield
point lb/100 ft2 and pH. 2. Add 27 ml of 10% by wt salt water (NaCl) to the base mud sample (525
ml) stir 2 minutes after adding salt. Age for about 15 minutes and stir again for 2 minutes. Determine its viscosity, density and pH.
3. Add to the contaminated sample 1/2 cc increments until the original
viscosity is restored. 4. Continue to add (SAPP) in 1/2 cc increments until the original viscosity
is restored. 5. Plot the result on a curve showing the viscosity and pH as a function of
(SAPP) concentration. (B) GYPSUM CONTAMINATION: Test Procedure 1. Repeat step No. 1 in (A). 2. Contaminate the base mud by (525 ml) with 6 gr of Gypsum, stir for 3
minutes. Age the sample for 15 minutes and stir again for 2 - 3 minutes. Determine the viscosity cp and density ppg and pH.
3. Add 3 gr soda ash (Na2CO3) to remove the hardness from sample in step
# 2. Stir for 10 minutes and test.

27
4. Add 4 gr Carbonox and 1 gr of Caustic Soda to sample in step # 3. Stir
10 minutes and test. 5. Add 4 gr Gypsum to a 525 ml sample of base mud and stir 10 minutes
and add 5 gr Q-Broxin and 3/4 of Caustic Soda. Stir 10 minutes and test. (C) CEMENT CONTAMINATION: Test Procedure 1. Repeat Step No. 1 in (A). 2. Contaminant the base mud (525 ml) by 1.0 PPB and stir for two minutes.
Age for 15 minutes. Stir and test. 3. Add to the contaminated sample 1/2 cc (SAPP). 4. Continue to add SAPP in 1/2 cc increments until the original viscosity is
restored measure pH every time. 5. Plot the result on a curve showing the viscosity and pH as function of
(SAPP) concentration. 6. Add to the base mud 1.5 cc (SAPP) and 1.0 Sodium Bicarbonate and stir
for 10 minutes. 7. Add 1.0 gr of cement while mixing the sample after aging and test. Experimental Results Tabulate all results in the appropriate table and present graphs where necessary.

28
QUESTIONS ON EXPERIMENT NO. 5
1. Would it be better to treat the mud before or after cement contamination?
Discuss this question using your experimentally obtained data. 2. Discuss and compare the effectiveness of various materials in treating
contaminated muds. 3. Did the CARBONEX treated Gypsum contaminated mud or the Q-
BROXIN treated Gypsum contaminated mud exhibit better flow properties? State why?

29
EXPERIMENT NO. 6
SOLID & LIQUID CONTENT AND EMULSION CHARACTERISTICS OF DRILLING FLUID
(A) SAND CONTENT DETERMINATION: Theory Periodic sand content determination of drilling mud is desirable, because excessive sand may result in the deposition of a thick filter cake on the wall of the hole, or may settle in the hole about the tools when circulation is stopped, thus interfering with successful operation of drilling tools or setting of casting. High sand content also may cause excessive abrasion of pump parts and pipe connections. Sand content is determined by elutriation, settling, or sieve analysis. Of the three methods, sieve analysis is preferred because of reliability of test and simplicity of equipment. The volume of sand, including void spaces between grains, is usually measured and expressed as percentage by volume of the mud. Experiment Equipment : Baroid Sand Content Set: The Baroid Sand Content Set consists of a 200-mesh sieve, funnel, and a glass measuring tube calibrated from 0 to 20% to read directly the percentage sand by volume.
Figure 6.1: Sand Content Set

30
Test Procedure 1. Pour mud into the Baroid Sand Content Tube until it fills up to the mark
labeled "Mud to Here". Then add water to the mark labeled "Water to Here". Cover mouth of the tube with thumb and shake vigorously.
2. Pour this mixture through the screen, being careful to wash everything
out of the tube with clear water through the same screen. Wash sand retained on screen with a stream of water to remove all mud and shale particles.
3. Fit funnel down over top of screen, invert slowly turning tip of funnel
into mouth of tube, and wash sand back into tube with a fine spray of clear water on the back side of the screen. Allow the sand to settle.
4. Observe the quantity of sand settled in the calibrated tube as the sand
content of the mud. Results Report the sand content of the mud in percent by volume (% by volume). Take into account coarse solids obtained on the screen. Care of instrument After each use, wash the screen, funnel and tube free of any dirt, and dry thoroughly. Take special care to clean and dry the 200-mesh screen. Remarks 1. In step 2 of the procedure, the pouring of the mud and water mixture
through the screen can be facilitated by tapping the side of the screen with a spatula handle.
2. Contents retained on the screen in Step 2 of the procedure should not be
mashed, stirred, or mutually forced through the screen with a finger,

31
pencil, or the like, as this will give an erroneous reading and may pull the screen loose from the side of the container.
(B) EMULSION TEST Theory Emulsion testers are used to indicate the stability and type of emulsion whether water-in-oil or oil-in-water. They are used in the evaluation of inverted emulsion drilling fluids, cements, and fracturing fluids. Time stability and resistance to electrolyte contamination of these systems can be predicted from a measurement of relative emulsion stability. Test Equipment
Figure 6.2: Fann Emulsion and Electrical Stability Testers
Test Procedure 1. The Fann Emulsion Tester may be operated from self-contained batteries,
external 12 volt DC or from 115-volt AC 50-60 cycle current. Select power source desired and set power switch accordingly (D.C. position is for either self-contained battery or for external storage battery).
2. Set meter multiplier switch at the X1 position with the voltage control
knob at zero. 3. Immerse probe in well-stirred sample so that electrodes are covered.

32
4. Raise voltage slowly by turning control clockwise and watch the flag indicator below meter. When movement of the red flag occurs, indicating current flow between electrodes, read breakdown voltage on meter. If breakdown does not occur, set range switch to X2 or to X4 position and repeat above steps.
5. Clean probe carefully after each use, using care not to alter the spacing of
electrode. 6. When internal batteries are depleted (indicated by a marked fall-off in
output voltage as shown on the meter) remove panel from carrying case and replace the 8 No. 2 flashlight cells. Only leak-proof batteries should be used.
Caution 1. Do not touch bare metal of electrodes when instrument is turned on. 2. Do not short out electrodes.
(C) OIL, WATER, SOLID & CLAY CONTENT DETERMINATION: Theory Knowledge of the liquid and solids content of a drilling mud is essential for good control of the mud properties. Such information will often explain poor performance of the mud and indicate whether the mud can best be conditioned by the addition of water or whether treatment with chemical thinner or the removal of the contaminant is required. Similarly, proper control of an oil emulsion mud depends upon a knowledge of the oil content. For muds containing only water and solids, the quantity of each can be determined from the mud density and from the evaporation of a weighed sample of mud. Oil and water content can also be obtained measuring the liquid fraction. The latter method is only applicable to oil emulsion muds.

33
Test Equipment The Baroid Oil and Water Retort Kit The apparatus required to determine the oil, water and solids content of the mud is included in the Baroid Oil and Water Retort Kit (See figure below).
Figure 6.3: Oil/Water Retort Kit
Test Procedure 1. Lift retort assembly, out of insulator block. Using the spatula as a
screwdriver, remove the mud chamber from the retort. 2. Pack the upper chamber with very fine steel wool. 3. Fill mud chamber with mud and replace lid, allowing excess to escape.
(This is a point where error is often introduced. Be sure that no air is trapped in the chamber. An accurate charge of mud is essential).
4. Wipe off excess mud and screw mud chamber into upper chamber. 5. Replace retort in insulator block and put insulation cover in place.

34
6. Add a drop of wetting agent to graduate and place under drain of condenser; then turn heater on.
7. Heat mud until oil stops coming over or until the pilot light goes out on
thermostatically controlled units. For diesel oil this time will be about 15 minutes with the thermostated retorts and about 20 minutes in the uncontrolled units at 110 volts. Low or high voltage will cause variations in time required. Crude oils may require longer heating periods.
NOTE: Nearly 100% recovery of refined oil will be obtained with this retort. If
the mud is made up with crude oil, calibration runs should be made on mud containing a known percentage of the crude used. Recovery on some crudes may be as low as 60%. If the distillation is being carried on for more than 30 minutes, the retort should be removed occasionally in the uncontrolled units and observed for temperature. In any case, the retort should never be heated above a DULL RED HEAT. The heater will burn out is left on too long.
8. Read the volume of oil and of water. (A drop of wetting agent at this
time will often improve the menisci for easier reading). 9. Where the new style thermostated retort is used faster heating can be
obtained and the temperature is controlled to prevent overheating. Care of Equipment Before each retorting the following should be done: 1. Use the spatula to scrape the dried mud from the mud chamber and lid to
assure correct volume. 2. Remove and replace any mud-caked steel wool. 3. Clean the retort drain tube and condenser with a pipe cleaner.

35
THEORY AND CALCULATIONS OF SOLID CONTENT
The solid phase of a drilling mud units of two components, i.e. (i) High specific gravity solids with a specific gravity of 4.3 and (ii) Low specific gravity solids with a specific gravity of 2.5. The total solids phase, in volume %, is found by the Baroid Oil and Water Retort. The information (data) from the retort test can be used to calculate the average specific gravity of solids, the % of different types of solids, and the % solids by weight in the mud, as shown below: NOTE: The accuracy of your calculations depends on the retort test data. These
care should be taken while running the equipment to ensure good results.

36
CALCULATIONS
A- % oil by volume = ml oil x 10 B- % water by volume = ml water x 10 C- % solids by volume = 100 - (ml oil + ml water) x 10 *D- Grams oil = corrected ml oil x 0.8 E- Grams water = ml water F- Grams mud = lb/gal mud weight x 1.2 G- Grams solids = F - (D + E) H- ML solids = 10 - (ml oil + ml water) I- Average specific gravity of solids = G H J- Solids % by weight = G x100 F K- High gravity (4.3) solids % by volume = (I - 2.5) x 55.6 L- Low gravity (2.5) solids % by volume = 100 - K
* Corrected ml of oil = ml of oil Table 6.1: Specific Gravity and Percent by Weight of Mud Contents
Sp. Gr. of Solids
2.6
2.8
3.0
3.2
3.4
3.6
3.8
4.0
4.3
% by Weight Barite
0
18
34
48
60
71
81
89
100
% by Weight Clay
100
82
66
52
40
29
19
11
0

37
Presentation of Experimental Results 1. Using your calculated results of the average specific gravity of solids,
determine the solid content of each of the samples from Table 6.1 (either directly or by interpolation, which ever the is applicable).
2. Present the results of your findings in (1) in an appropriate table.

38
QUESTIONS ON EXPERIMENT NO. 6
(1) From the results of your experiment in part (A), is there a correlation between the mud weight of the sample and the % sand by volume? Explain. (2) What problems are you likely to encounter during drilling operations if
you have a high sand content in your drilling mud?
(3) What is the importance of conducting Emulsion Stability tests on drilling fluids?
(4) From the results of your experiment in part (C), which of the samples
has the highest clay content?

39
OIL WELL CEMENTING, PROPERTIES AND FUNCTIONS 2
The cement used for oil well cementing differs from concrete or masonry work in that it consists of a thin slurry of primarily cement and water. The cement used in oil wells must possess three primary properties. They must possess a proper water-to-cement ratio, a sufficient fluid time to allow placement, and must develop enough strength in a minimum time to bond the pipe to the formation.
HYDRATION OF CEMENT Hydration (reaction with water) begins when water is added to cement. The cement slurry gradually sets to a solid as hydration continues. After hydration begins, which initiates the setting, the process slows, and the strength of the set cement continues to increase for many days.
ACCELERATION AND RETARDATION Anything that will have an effect on the chemical reaction influences the degree of acceleration. Factors that could influence the reaction rate are: pressure, temperature, concentration of each chemical or ionized particles present, and the chemical nature of the combined chemicals present. Cement setting is retarded by use of an additive either at the time of manufacture or at the time of use. The retardation of slow set cements is due chiefly to the addition of chemical retarders such as borax and starch, which are added at the time of manufacture. Another method is to adjust the particle size (grind) of the cement. The cement will set more slowly if it is coarsely ground. Cement is accelerated about the same way that it is retarded by the manufacturer. It is performed by composition adjustment, particle size adjustment, and by the addition of a chemical accelerator. The addition of a chemical accelerator is the most effective way to accelerate the setting of cement.

40
Calcium is the most effective and economical accelerator for Portland cement. Calcium Chloride slightly reduces the viscosity of Portland cement slurries. The more calcium chloride added to cement, the more pronounced the acceleration. Optimum concentration of calcium chloride for early strength is reached between 2% and 4% by weight of the dry cement. More or less will not produce higher strength. Any strength greater than 5% lowers strength. The usual effect of 2% Calcium Chloride is to reduce the thickening time by one half and to double the twenty-four hour strength.
COMMONLY MEASURED CEMENT PROPERTIES There are several properties of Portland cement, which are commonly measured. These properties are thickening time, compressive strength, slurry volume, free water separation, and hydraulic flow properties. The thickening time is the amount of time necessary for the slurry to reach a consistency of 100 poises at different well temperature, depth, and pressure conditions. The compressive strength is the force per unit internal cross-sectional area in psi necessary to crush the cement specimen. The free water separation is the measurement of the water loss of the cement expressed in volume per unit time. It is directly proportional to the water to cement ratio. The hydraulic flow properties are the rheological properties of the cement necessary to make critical velocity calculations. The calculation of slurry volumes will usually be based upon water to cement ratios. The water to cement ratio is the ratio of the weight of water to a unit weight of dry cement. The ratio of water to cement is important because cementing material must contain sufficient water to make it pumpable, yet not have setting with free water separation. The two terms used for water ratios are maximum and minimum. Maximum water is the greatest amount that can be mixed with cement and produce a set volume equal to the slurry volume. Minimum water is the least amount that can produce a pumpable slurry. The specific gravity of the cement is calculated to be 3.15. A commonly used water to cement ratio is 0.46, which means 46 grams of water to 100 grams of dry cement.

41
The results of the thickening time tests on the Consistometer. The Consistometer readings are plotted on common graph paper with the consistency as the ordinate and time as the abscissa. The general shape of the consistency time curve plotted as previously described presents a picture of a particular cement as far as it's setting characteristics are concerned. There are certain features common to all consistency-time curves. As the cement is introduced, it generally has a fairly low consistency. This value usually drops a little as the stirring is begun. It then begins to increase at a very gradual rate. As time goes on, the rate of increase of the consistency is accelerated to such an extent that the latter part of the curve is very steep. This acceleration varies with different cements and with different temperature of testing. The two main flow properties of a cement slurry are shear rate and shear stress. These properties permit the determination of two slurry properties: (1) Flow Behavior Index, n', and (2) Consistency Index, K'. These factors will then allow estimation of the pumping rate for turbulence of slurry in the annuals, frictional pressure drop of slurry in the annulus and pipe, and hydraulic horsepower necessary to overcome friction losses for non-Newtonian fluids. The flow curve, which is constructed to obtain the Flow Behavior Index and the Consistency Index, is prepared using a Fann V-G meter by plotting shear stress (pounds force/square foot) on the ordinate and the shear rate (sec -1) on the abscissa on logarithmic coordinate paper. Shear Stress = Dial Reading of Viscometer x N x 1.066 100 where N = range extension factor of the torque spring Shear Rate = (1.703)x (RPM of Viscometer) When the data points do not form a straight line flow curve, the best straight line through these values should be drawn and extrapolated to the shear stress axis. The Flow Behavior Index is equal to the slope of the flow curve and is

42
dimensionless. The Consistency Index is equal to the intercept of the flow curve at the unity rate of shear with the units (lb-secn' /ft2).
43
EXPERIMENT NO. 7
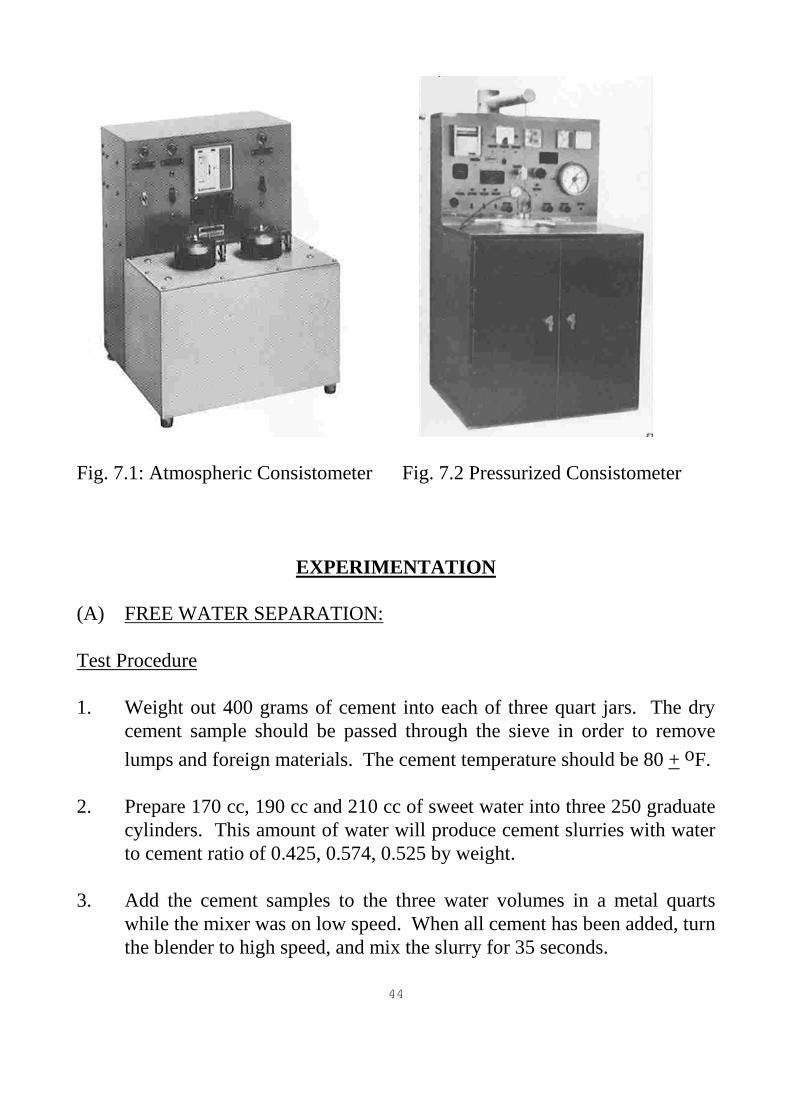
OIL WELL CEMENTING EXPERIMENT 2 WATER RATIOS FOR PORTLAND CEMENT SLURRY Objective To show the effects of varying amounts of mixing water on the physical properties of Portland cement. These properties are Free Water Separation, Normal and Minimum Water Content and Thickening Time. Test Equipment The Atmospheric Consistometer The Atmospheric Consistometer consists of a Stainless Steel Water bath that houses the slurry containers. An instrument panel houses components that allow control of the bath at any temperature from ambient to 93oC, and rotation of the slurry containers at 150 RPM. Units of consistency of the cement are directly indicated on the top dials of the slurry containers. The containers are rotated by engaging the pins of the lid in the slots of the rotator. The rotators have timing sprockets, belt driven by a gear-head motor. The belt also drives an impeller, which agitates the bath water. The motor should be turned off while engaging or disengaging the containers. Temperature is indicated and controlled by a Thermocouple actuated Potentiometric Type Temperature Controller. The Controller actuates a relay, controlling a 1,500- watt heater. Switches and Pilot Lights are provided as required by the operation. A dial thermometer indicates bath temperature when the temperature controller indicator is off the scale. The entire instrument has overall dimensions of 15" (39 cm) wide x 15" (38 cm) deep x 19" (48 cm) high.
44
Fig. 7.1: Atmospheric Consistometer Fig. 7.2 Pressurized Consistometer
EXPERIMENTATION
(A) FREE WATER SEPARATION: Test Procedure 1. Weight out 400 grams of cement into each of three quart jars. The dry
cement sample should be passed through the sieve in order to remove lumps and foreign materials. The cement temperature should be 80 + oF.
2. Prepare 170 cc, 190 cc and 210 cc of sweet water into three 250 graduate
cylinders. This amount of water will produce cement slurries with water to cement ratio of 0.425, 0.574, 0.525 by weight.
3. Add the cement samples to the three water volumes in a metal quarts
while the mixer was on low speed. When all cement has been added, turn the blender to high speed, and mix the slurry for 35 seconds.
45
4. Pour 225 c.c. of slurry into 250 c.c.- graduated cylinder. Tightly cover them with aluminum foil. Allow to stand for two hours.
5. Carefully decant the free water and measure in a 10 c.c. graduated
cylinder. Do this for each slurry. Calculate the per cent (%) free water upon settling.
(B) NORMAL & MINIMUM WATER CONTENT OF CEMENT SLURRY: Test Procedure 1. Prepare 4 slurry samples of varying water to cement ratios, as described
in part (A) 1 & 2. 2. Pour the samples immediately into an Atmospheric Consistometer and
stir for a period of 20 minutes, under ambient conditions. 3. Record the Consistency immediately after 20 minutes of stirring has
elapsed. 4. Determine the Normal and Minimum Water Content. DEFINITIONS Normal Water Content This is the water content of slurry yielding a consistency of 11 Bc. Minimum Water Content This is the water content of slurry yielding a consistency of 30 Bc.

46
(C) THICKENING TIME TEST: Definition This is the amount of time necessary for the cement slurry to reach a consistency of 100 Bc or poises, at different well temperature, depth and pressure conditions. It also represents the length of time the slurry is pumpable. Test Procedure 1. After the cement slurry (Sample 1 Part (B)) is prepared, pour it
immediately into the Atmospheric Consistometer and begin stirring. 2. Record the consistency after every 4 minutes. Tabulate the results in the
appropriate table. 3. Plot the Consistency in Bc versus time on a log-log paper and extrapolate
the straight time to 100 Bc, to determine the thickening time.
47
TABLE OF CONTENTS
KING FAHD UNIVERSITY OF PETROLEUM AND MINERALS
DEPARTMENT OF PETROLEUM ENGINEERING
PETE 203: DRILLING ENGINEERING
LABORATORY MANUAL PART II
DRILLING SIMULATOR LABORATORY SESSION

48
LAB SESSION 1
FAMILIARIZATION AND LINE-UP OF OPERATIONAL COMPONENTS I 3
(1) Stand pipe Manifold
The stand pipe manifold is designed with provisions for stand pipe connection to the rig pumps (1 & 2), the cement pump and the kill line. This enables the conduction of drilling mud to the bit, and cement to the annulus, during drilling and cementation, respectively. In addition, a separate line connects this manifold to a manual adjustable choke. All lines can be isolated by gate valves. Below is a diagram showing the standpipe manifold: Line-up Procedures for Flow Systems. 1. Stand Pipe Manifold
i. Line up and connect both pumps (1) and 2 to Stand Pipe and open all valves in between.
ii. Keep cement pump shut.

49
A detailed description of the Standpipe Manifold is as follows: (a) Gate Valves: These are fully operational valves that are either fully opened, fully closed or in a cracked position. They also require alignment by students. (b) Manifold Pressure Gauge: This measures the Standpipe pressure
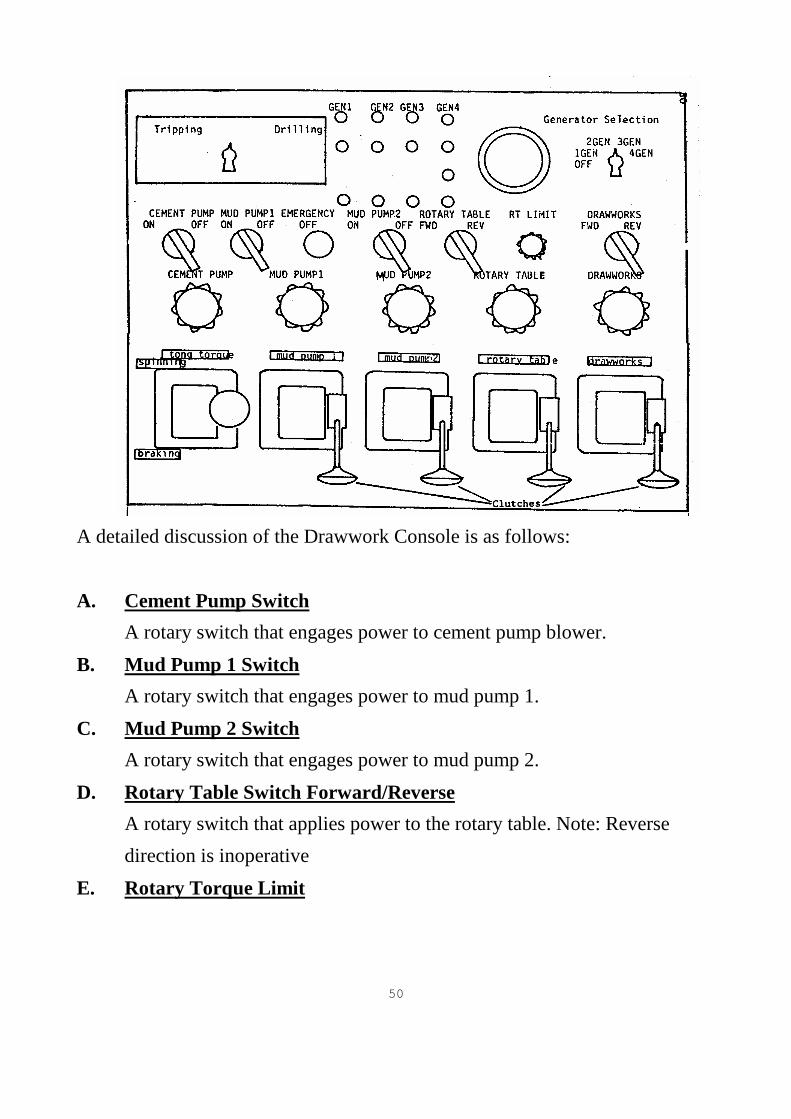
(2) Drawwork Console: The Drawwork console, which looks exactly like the one on a regular drilling rig contains five clutches and rheostat controls that control the drum, rotary table and the pumps (both mud and cement). In addition, the drawwork brake enhances a mechanism for controlling the weight on bit, penetration rate and the lifting of the drill string.
50
A detailed discussion of the Drawwork Console is as follows: A. Cement Pump Switch A rotary switch that engages power to cement pump blower. B. Mud Pump 1 Switch A rotary switch that engages power to mud pump 1. C. Mud Pump 2 Switch A rotary switch that engages power to mud pump 2. D. Rotary Table Switch Forward/Reverse A rotary switch that applies power to the rotary table. Note: Reverse direction is inoperative E. Rotary Torque Limit

51
Rotating control that allows the student to adjust the maximum power applied to the rotary table. Note: If limit is not properly set, a twist-off will Occur. F. Drawworks Forward/Reverse A forward and reverse switch that applies power to the drawworks. Note: Reverse switch is inoperative G. Cement Pump Rheostat A control allowing the student to increase or decrease the cement pump speed. H. Mud Pump 1 Rheostat A control allowing the student to increase or decrease the mud pump 1 speed I Mud Pump 2 Rheostat A control allowing the student to increase or decrease the mud pump 2 speed J. Rotary Table Rheostat A control allowing the student to increase or decrease the rotary table speed K. Mud Pump 1 Clutch used in engaging or disengaging mud pump. #1 L. Mud Pump 2 Clutch used in engaging or disengaging mud pump. #2 K. Drawworks Clutch used in engaging or disengaging mud pump. #1 Note: The clutch
must be energized for foot operation.

52
3. Drilling Console The drillers console contains the analog and digital gauges used to monitor the key parameters required for efficient drilling and effective well control. It also has four chart recorders for monitoring pit level, drill pipe, penetration rate and casing pressures.

53
A detailed description of the various components of the Drillers Console is as follows: A. Weight Indicator A large-scale face indicator calibrated to 500,00 lbs. The second dial
with expanded sensitivity is utilized to indicate weight-on-bit. Operator can zero set second dial.
B. Weight-On-Bit Digital readout of actual weight-on-bit. C. Rotary Torque A circular 4" face gauge that measures rotary torque with a scale of 0 to
1,000 amps. D. Tong Torque A circular 4" face gauge that measures make up or break out torque. E. Return Mud Flow A circular 6" face gauge that measures the return in the flow line from the
well with a scale of 0 to 100%. It consists of high and low set controls with 2 visual alarm indicators, a level adjust and a power on/off switch.
Note: For return mudflow gauge to become operational, the on/off
switch must be in the "ON" position. F. Rotary Speed (rpm) A circular 4" gauge that measures the rotary rpm with a scale of 0 to 300
rpm.

54
G. Mud Pump 1 (spm) A circular 4" gauge that measures the pump stroke per minute scaled for
0 to 200 spm. H. Low Pressure Select A Circular 4" gauge that can be selected to measure casing pressure or
drillpipe pressure, scaled at 0 to 1500 psi. I. Mud Pump 2 (spm) A circular 4" gauge which measures the pump strokes per minute, scaled
at 0 to 200 spm. J. Stroke Counter A digital readout of total elapsed strokes with reset and run/hold control. K. Drillpipe Pressure A circular 6" gauge that measures drillpipe pressure. Scales are
combined in psi and kg/cm2. These scales are 0 to 5000 psi and 0 to 350 kg/cm2.
L. Mud Weight Indicator A digital indicator that measures return mud weight. M. Casing Pressure A circular 6" gauge that measures casing pressure. Scales are combined
in psi and kg/cm2. These scale are 0 to 5,000 psi and 0 to 350 kg/cm2.
55
N. Deviation Mud Volume A circular 6" gauge that measures the increase or decrease in mud
volume. It consists of high and low level set controls with two visual alarms.
O. Mud Volume Totalizer A circular 6" gauge that measures the total mud in the system with a scale
of 0 to 1,000. A power on/off switch and four mud tank switches are provided so the student can add or subtract mud from the system.
Note: For mud volume Totalizer to become operational, the on/off
switch must be in the "ON" position. P. Stand Tally A digital readout that displays the total number of stands in the hole. Note: Each stand is equal to 90 feet. Q. Stand Tally Control A one-turn control that will allow the student to decrease the number of
stands in the hole. Note: When participating in well control exercises with bit on bottom,
this control must be in the fully clockwise direction to indicate bit on bottom.
R. Chart Recorder There are four two-pen chart recorders that can be used for a permanent
performance record.

56
S. Trip Tank 4" circular gauge that measures the total number of barrels of mud in the
trip tank. T. Stripping Tank/Trip Tank A two-position switch that allows the student to select either the stripping
tank or trip tank. U. Stroke Counter A digital readout of total pump strokes. Note: Cement pump strokes will be read on this digital readout. V. Trip Tank Pump A push button illuminated switch that allows the student to enter mud
into the hole. This switch will become illuminated when stands are removed from the hole.
W. On/Off Switch A switch allowing the geolograph to be turned on or off.

57
QUESTIONS FOR LAB SESSION 1 1. What are the main functions of the Stand Pipe Manifold? 2. Name the three (3) operational positions of the gate valves of the Stand
Pipe Manifold. 3 Which one of the four (4) recorders on the Driller’s Console gives an
indication of the rate of penetration during drilling? 4 Which component on the drillers console indicates the total mud volume
in circulation? 5. To see an increase or decrease in the mud volume, which component on
the driller's console provides this information? 6. To achieve a proper line-up position of the Stand Pipe Manifold, name all
the gate valves that have to be opened and the ones that should be closed.

58
LAB SESSION 2 FAMILIARIZATION AND LINE-UP OF OPERATIONAL
COMPONENTS II 4. Blow-Out Preventer (BOP) Panel This component is also designed and functions similar to the one on actual drilling rig. It consists of lever type activators for controlling the Pipe and Blind rams, the hydril, the Remote Choke and Remote Kill Line valves. It also has pressure gauges that monitor pressure changes at the Accumulator manifold, Annular Preventer and the Compressed Air system. In addition, it has a variable control that allows the Annular Preventer closing pressure to be adjusted. Line up procedure: i) Open Annular Preventer ii) Close Choke line
iii) Close Kill line

59
A detailed description of the BOP is as follows: A. Accumulator Pressure A circular 4" gauge that measures accumulator pressure with a scale of 0
to 5,000 psi. B. Manifold Pressure A circular 4" gauge that measures manifold pressure with a scale of 0 to
5,000 psi. C. Air Pressure A circular 4" gauge that measures air pressure with a scale of 0 to 5,000
psi. D. Annular A two-position spring returned joystick control that will allow the student
to open or close the Annular Preventer. E. Annular Pressure Control A twelve turn control that will allow the student to set the maximum
annular closing pressure. F. Annular Pressure A circular 4" gauge that measures annular closing pressure. G. Master Air Shut Off Valve A down activated valve that will allow the student to apply air pressure to
the B.O.P. controls.

60
H. By-Pass Valve A left or right control with a center position return that will allow the
student to apply total accumulator pressure to the rams and hydraulic control valves.
I. Pipe or Blind Rams A two-position spring returned joystick control that will allow the student
to open or close the rams. J. Kill Line A left or right control with a center position return that will allow the
student to open or close the hydraulic control valve. K. Choke Line A left or right control with a center position return that will allow the
student to open or close the hydraulic control valve.

61
(5) Choke Manifold (Land): This set up is designed to full sized model of a typical choke manifold on the rig. It consists of eleven gate valves operated by several turns of valve handle, Remote Choke (activated from a panel), Remote Outer Choke Valve and Kill Line valve (both controlled from the BOP Panel) as well as the Left and Right Manual Chokes. Both drill pipe and pressure gauges are also included. The entire set up provides the necessary support for fluid circulation and well control operation. Line-up procedure:
i. Open all valves between the choke line and the Automatic Hydraulic Choke (Remote Choke Manifold).
ii. Keep all other valves closed.
62
Following is a detailed description of the various components of the Choke Manifold (Land) A Gate Valve The gate valves are fully operational valves. They can be fully opened or
fully closed and can also be put into a cracked position. This will require that the student properly align the valves.
Note: If the valves are not properly aligned, flow through the manifold
will not be achieved. B. Manual Choke A fully operational choke that can be used in the well kill operation. C. Remote Choke A remote choke is a replica of a hydraulic-actuated choke such as a
Cameron or Swaco. This choke can also be used in the well kill operation.
D. Kill and Choke Lines Fully operational lines that can be used in circulation or well killing
operation. E. Straight Throw Line A fully operational line that can be circulated through. It can also be
used in well killing operation.

63
(6) Remote Choke Panel: This panel resembles the typical Swaco panel used on rigs. It includes analog and digital gauges that monitor the key parameters required for efficient well control exercises. The analog gauges monitor drill pipe pressure, casing pressure, pump stroke rate and choke position. The digital meters show the total elapsed pump strokes, one position choke control, master air valve, and a choke adjustment speed control.
64
Detailed discussions of Remote Choke Panel components is as follows: A. Drillpipe Pressure A circular 6" gauge that measures Drillpipe pressure. The scaling is psi
from 0 to 10,000 in subdivision of 20 psi per division. B. Stroke Counter A digital readout of total elapsed strokes with a reset bottom. C. Stroke Rate A 3" square meter which measures the pump strokes per minute, scaled at
0 to 200 spm. D. Casing Pressure A circular 6" gauge which measures casing pressure. The scaling is in
psi from 0 to 10,000 in subdivisions of 20 psi per division. E. Choke Position A circular 3" gauge, which displays the position of the choke. F. Air Supply Valve A two-position control that will allow the student to apply air pressure to
the Remote Choke Panel. G. Open Choke/Close Choke Control A two-position spring return control that will allow the students to open
or close the Remote Choke. H. Choke Adjustment Speed Control A control that will allow the student to increase or decrease the speed at
which the Choke will open or close.

65
QUESTIONS FOR LAB SESSION 2
1. (a) what is the main function of the Blow Out Preventer (BOP)? (b) What valve is used to provide the BOP with air pressure for
operations?
2. Describe completely in step-wise sequence how to line up the BOP for normal drilling operations. Show how each component is opened and closed. 3. (a) what are the main functions of the Choke Manifold (Land)?
(b) Describe in detail how the Choke Manifold (Land) is lined-up for normal drilling operations.
4. What is the function of the Remote Choke Panel? 5. What do the following do on the Remote Choke Panel: i. Stroke Counter ii. Air Supply Valve iii. Choke Position Valve iv. Choke Speed Control

66
LAB SESSION 3
OPERATION OF MAJOR COMPONENTS 1. The Mud Pumps - Identify the pump and switches, SPM gauges and controls for both
pumps # 1 and 2. - Engage the clutches of pump # 1. - Turn the knob to increase and decrease the pumping rates. - Pump mud at 80 SPM for normal drilling operations. 2. Operating Slow Circulation Rate (SCR)
a) Engage the mud pump clutch and rotate the pump knob to a specific SPM and observe the pressure on the drill pipe pressure gauge.
b) Read and record the Slow Circulating Rate Pressure (SCRP) = Pressure loss in the system due to friction.
c) Take SCR at 20, 30 and 40 SPM and read and record the corresponding SCRP.

67
(3) Operating the Rotary Table (a) Identify the clutch and control knob of the rotary table. (b) Engage the clutch of the rotary table (c) Exercise rotation at 100 RPM for normal drilling operation by turning the
Rotary Table knob and watching the rotary table gauge on the driller’s console. Turn until 100 RPM is indicated on the gauge.
68
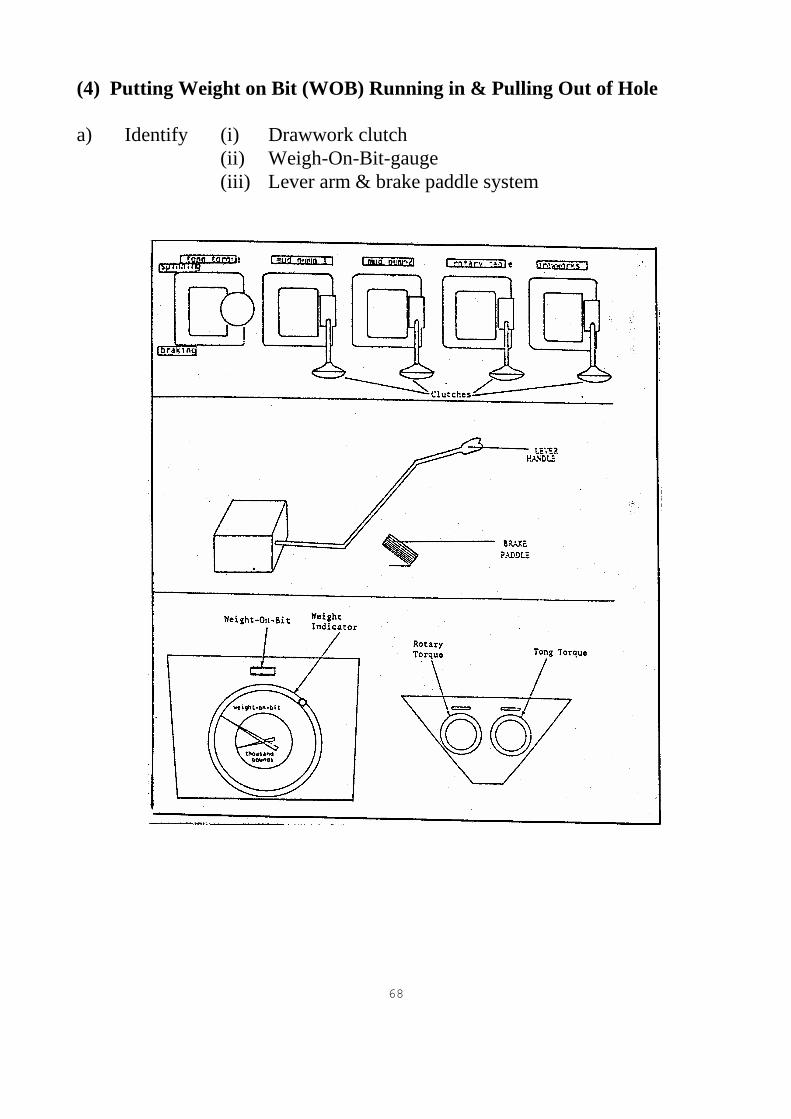
(4) Putting Weight on Bit (WOB) Running in & Pulling Out of Hole a) Identify (i) Drawwork clutch (ii) Weigh-On-Bit-gauge
(iii) Lever arm & brake paddle system

69
b) Engage Rotary and Drawwork Clutches c) To put Weight-On-Bit(WOB) & Run-In-Hole(RIH): i) Lift lever handle and observe the drill string advance in hole.
ii) Observe WOB indicator until the appropriate weight (e.g. 30,000 lb) is reached.
iii) Press down lever arm and hook it to the chain holder. d) To Pull-Out of Hole (POOH): i) Release lever arm ii) Step on brake and observe drill string come out of hole.
iii) Engage lever arm when rotary bushing is out of hole.

70
(5) Remote Choke Panel Operation a) Identify all controls on this panel. b) Turn on the power supply control to the panel using the power lever c) Open and close the choke and observe the choke position at various rates
of opening and closing. d) Utilize the switches and lever systems to control the Shut in Casing
Pressure (SICP) and Shut in Drill Pipe Pressure (SIDPP) as needed during kick circulation.

71
QUESTIONS ON LAB SESSION 3
1. Describe the step-wise procedure for circulating mud at the rate of 75 Strokes per minute (SPM) during a normal drilling operation.
2. Describe a detail procedure for taking a Slow Circulating Rate(SCR) of
25 SPM. 3. Describe the step-wise procedure for rotating the drill string at a rate of
60 RPM during normal drilling. 4. Provide a complete description of how to perform the following: a) Run-in hole and putting 25,000 lb (WOB). b) Pulling out of hole and securing the well safely.

72
LAB SESSION 4 KICK IDENTIFICATION AND WELL SHUT-IN PROCEDURES
1. Setting flow alarms (Deviation Mud Volume)
a) Identify the Deviation Mud Volume gauge and its low and high set controls.
b) Pump mud at 80 SPM and set the flow alarms as follows: i) Place Tank Select Switch to high position
ii) Use the Coarse switch to select number of barrels at which alarm should go off.
73
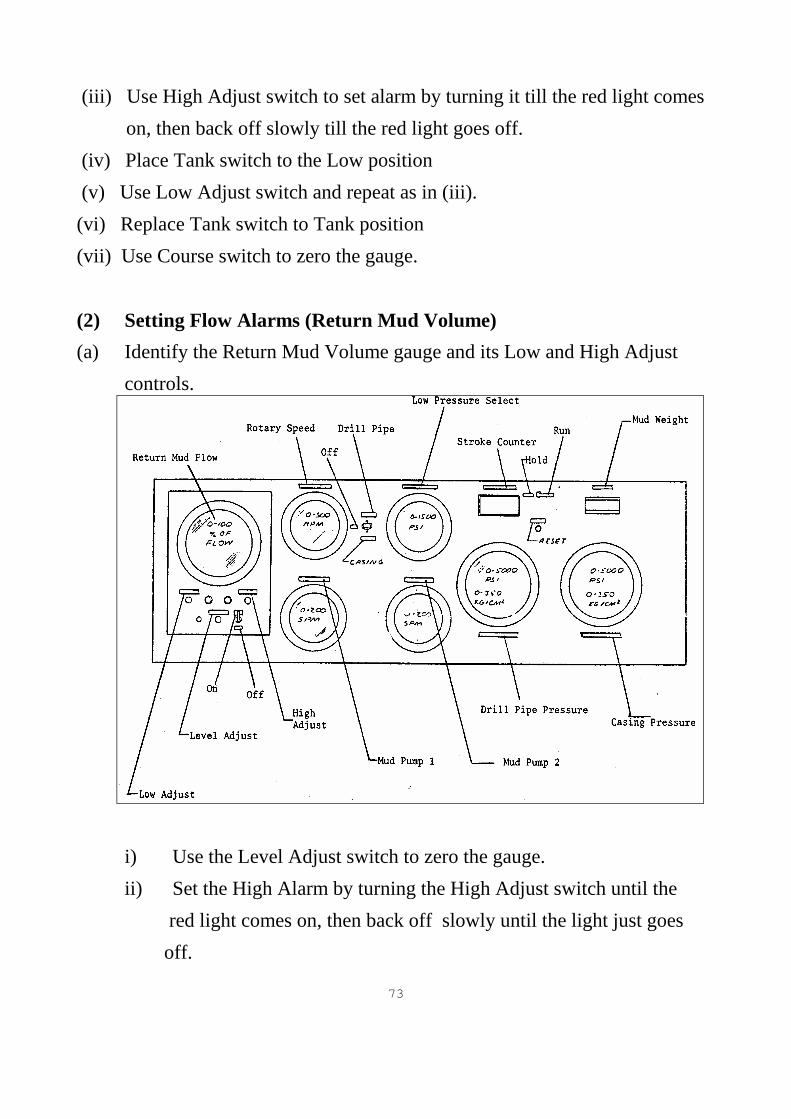
(iii) Use High Adjust switch to set alarm by turning it till the red light comes on, then back off slowly till the red light goes off. (iv) Place Tank switch to the Low position (v) Use Low Adjust switch and repeat as in (iii). (vi) Replace Tank switch to Tank position (vii) Use Course switch to zero the gauge. (2) Setting Flow Alarms (Return Mud Volume) (a) Identify the Return Mud Volume gauge and its Low and High Adjust
controls.
i) Use the Level Adjust switch to zero the gauge. ii) Set the High Alarm by turning the High Adjust switch until the red light comes on, then back off slowly until the light just goes off.

74
iii) Set the low alarm by using the Low Adjust switch and repeating as in (ii).
3. Identifying Kick Warning Signs a) Watch for increased flow rate on the Return Mud Flow gauge and visual
alarm. b) Watch for influx volume increase on the Deviation Mud Volume gauge
and visual alarms indicators. c) Watch for string weight change and drilling break on the
Geolograph charts. 4. Utilizing Shut-in Procedures to Kill Well. a) When a kick is suspected, conduct a flow check as follows: i) Shut down pumps. ii) Pull out of hole (POOH) iii) Stop Rotary Table iv) Watch flow alarms. If on, probably a kick. SOFT SHUT-IN
b) At BOP, open the Choke line. c) Close the Annular Preventer d) Observe the SIDPP and SICP and wait till both pressures stabilize. HARD SHUT-IN
a) Close the Annular Preventer b) Observe the SIDPP and SICP and wait till both pressures stabilize.
75
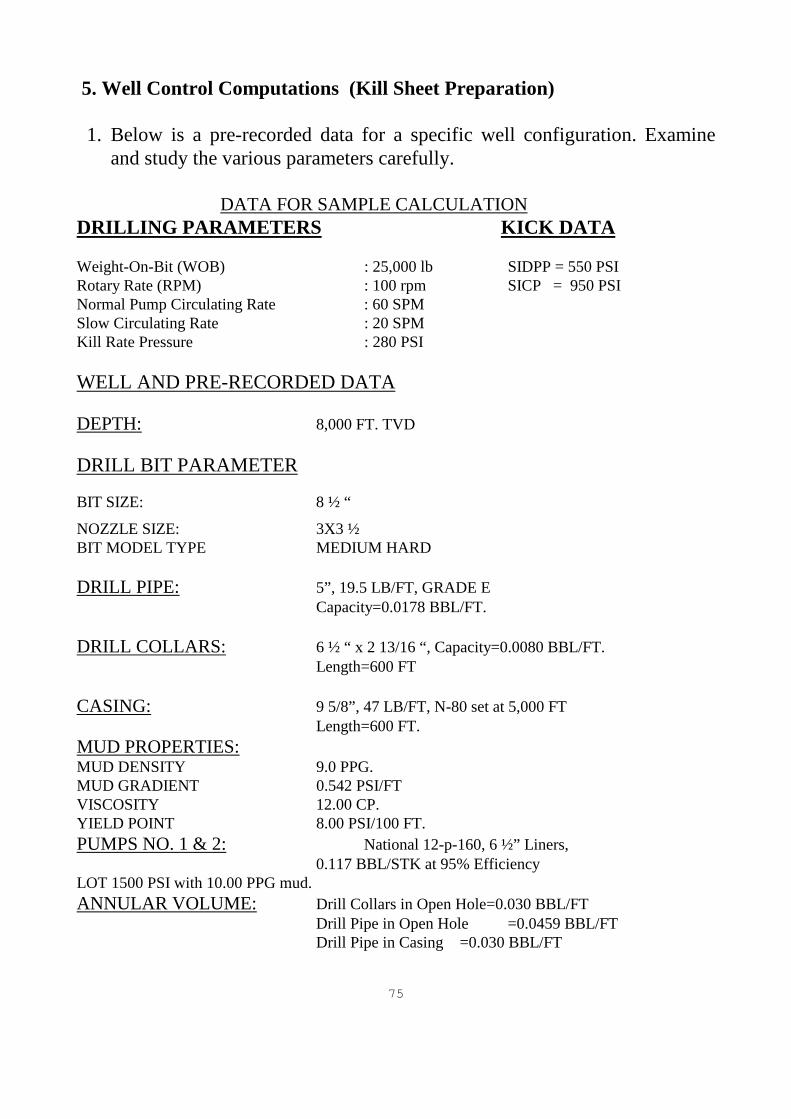
5. Well Control Computations (Kill Sheet Preparation) 1. Below is a pre-recorded data for a specific well configuration. Examine
and study the various parameters carefully.
DATA FOR SAMPLE CALCULATION DRILLING PARAMETERS KICK DATA Weight-On-Bit (WOB) : 25,000 lb SIDPP = 550 PSI Rotary Rate (RPM) : 100 rpm SICP = 950 PSI Normal Pump Circulating Rate : 60 SPM Slow Circulating Rate : 20 SPM Kill Rate Pressure : 280 PSI WELL AND PRE-RECORDED DATA DEPTH: 8,000 FT. TVD DRILL BIT PARAMETER
BIT SIZE: 8 ½ “
NOZZLE SIZE: 3X3 ½ BIT MODEL TYPE MEDIUM HARD
DRILL PIPE: 5”, 19.5 LB/FT, GRADE E Capacity=0.0178 BBL/FT. DRILL COLLARS: 6 ½ “ x 2 13/16 “, Capacity=0.0080 BBL/FT. Length=600 FT CASING: 9 5/8”, 47 LB/FT, N-80 set at 5,000 FT Length=600 FT. MUD PROPERTIES: MUD DENSITY 9.0 PPG. MUD GRADIENT 0.542 PSI/FT VISCOSITY 12.00 CP. YIELD POINT 8.00 PSI/100 FT. PUMPS NO. 1 & 2: National 12-p-160, 6 ½” Liners, 0.117 BBL/STK at 95% Efficiency LOT 1500 PSI with 10.00 PPG mud. ANNULAR VOLUME: Drill Collars in Open Hole=0.030 BBL/FT Drill Pipe in Open Hole =0.0459 BBL/FT Drill Pipe in Casing =0.030 BBL/FT

76
2. Examine the Kill Sheet (Engineering Method) below and observe how the various parameters have been computed.
ENGINEERS' METHOD KILL SHEET PRE-RECORDED DATA KICK DATA Original Mud Weight (OMW) ......( 9.0) PPG SIDPP = (550) PSI. Measured Depth (D) ....….…… (8,000) FT SICP = (950) PSI Slow Circulation Rate (SCR) ...... ( 20) SPM PIT GAIN = (10) BBL Kill Rate Pressure (KRP)……......( 280) PSI TVD = (8,000) FT DRILL STRING VOLUME DRILLING PARAMETERS a) Drill Pipe Capacity : Weight On Bit (WOB) =( 2500 )LBS ( 0.0178) BBL/FT x ( 7400 )L, FT = (131.72 ) BBLS Rotation Per Min. (RPM)=( 100 )RPM b) Drill Collar Capacity: Norm. Circ. Rate (NCR)=(60)SPM (0.008) BBL/FT x (600)L, FT = (4.8 ) BBLS Slow Circ. Rate (SCR) =(20)SPM Drill String Volume (Total ) = (136.52) BBLS Pump Output(0.117)BBLS/STK @ (95) % Efficiency Drill String Strokes = (Drill String Vol. (136.52)BBLS, = 1166.84 STKS Pump Output ( 0.117) BBLS/STK CALCULATIONS Kill Weight Mud: SIDPP( 550) PSI ÷ 0.052 ÷TVD( 8,000 )FT + OMW( 9.0 ) PPG = (10.32) PPG Initial Drill Pipe Pressure: SIDPP 550) PSI + Kill Rate Pressure(280) PSI = (830) PSI Final Drill Pipe Pressure: Kill Weight Mud(10.32)PPG x Kill Rate Pressure(280)PSI = ( 321 ) PSI Original Mud Weight (9.0)PPG)
PRESSURE CHART
STROKES PRESSURE O 830.00 Initial Drill Pipe
100 786.34 Pressure 200 742.76 300 699.14 400 655.52 500 611.90 600 568.28 700 524.66 800 481.04 900 437.42 Final Drill Pipe
Strokes to Bit 1166.84 321.00 Pressure

77
COMPUTATIONS. (a) The following data are either given or computed prior to the drilling
operation: - Pre-Recorded Data - Drill String Volume - Drilling Parameters (b) Kick-Data Recorded when kick warning signs are observed. (c) Calculations Performed using information from (a) and (b) and given formulas. (d) Pressure Chart Calculations
Stroke Column: If the Drill String Stroke is less than 1500 Strokes, choose Stroke Increment to be 100. If the Drill String Strokes is more than 1500, then choose Stroke Increment to be 200 strokes. * Add Stroke Increment to each previous stokes until “Stoke to Bit” is reached. Pressure Column:
Pressure Decline = )( IncrementStokeXStrokeStringDrill
DPPFinalDPPInitial −
* Subtract Pressure Decline from each previous pressure until “Final Drillpipe Pressure” is reached.

78
QUESTIONS ON LAB SESSION 4 1. Describe briefly how to set the flow alarms on the following devices: a) Deviation Mud Volume. b) Return Mud Volume. 2. Name four (4) Kick warning signs and indicate which device on the
Drilling Simulator shows these signs. 3. Use the following information on Well 3-124, drilled by the M&I
Drilling Consultants, fill out the attached Kill Sheet using the Engineers' Method:
DRILLING PARAMETERS KICK DATA
Weight-On-Bit (WOB) : 30,000 lb SIDPP = 460 PSI Rotary Rate (RPM) : 80 rpm SICP = 700 PSI Normal Pump Circulating Rate : 60 SPM PIT GAIN = 25 BBL Slow Circulating Rate : 35 SPM Kill Rate Pressure : 320 PSI WELL AND PRE-RECORDED DATA DEPTH: 9,000 FT. TVD DRILL BIT PARAMETER BIT SIZE: 8 ½ “
NOZZLE SIZE: 3X3 ½ BIT MODEL TYPE MEDIUM HARD DRILL PIPE: 5”, 19.5 LB/FT, GRADE E Capacity=0.0178 BBL/FT. DRILL COLLARS: 6 ½ “ x 2 13/16 “, Capacity=0.0080 BBL/FT. Length=600 FT CASING: 9 5/8”, 47 LB/FT, N-80 set at 5,000 FT Length=600 FT. MUD PROPERTIES: MUD DENSITY 10.5 PPG. MUD GRADIENT 0.542 PSI/FT VISCOSITY 12.00 CP. YIELD POINT 8.00 PSI/100 FT. PUMPS NO. 1 & 2: National 12-p-160, 6 ½” Liners, 0.117 BBL/STK at 95% Efficiency LOT 1500 PSI with 10.00 PPG mud. ANNULAR VOLUME: Drill Collars in Open Hole= 0.030 BBL/FT Drill Pipe in Open Hole = 0.0459 BBL/FT Drill Pipe in Casing = 0.030 BBL/FT

79
ENGINEERS' METHOD KILL SHEET PRE-RECORDED DATA KICK DATA Original Mud Weight (OMW) ..( ______ )PPG SIDPP = ( ______ )PSI. Measured Depth (D) .....…….(_______ ) FT SICP = ( ______ )PSI Slow Circulation Rate (SCR) ..( ______ )SPM PIT GAIN = ( ______ )BBL Kill Rate Pressure (KRP) ……( ______ )PSI TVD = ( _______ )FT DRILL STRING VOLUME RILLING PARAMETERS a) Drill Pipe Capacity : Weight-On-Bit(WOB) = (________)LBS ( ____ ) BBL/FT x ( ______ )L, FT =( ______ ) BBLS Rotation Per Min.(RPM)=( _______ )RPM Norm. Circ. Rate (NCR) =(______ )SPM b) Drill Collar Capacity: Slow Circ. Rate (SCR) =( _______ )SPM ( ____ ) BBL/FT x ( ______ )L, FT =( ______ ) BBLS Drill String Volume (Total ) = ( ______ ) BBLS Pump Output( ______ )BBLS/STK @ (95) % Efficiency Drill String Strokes = Drill String Vol ( _______ )BBLS, = ( ________ ) STKS Pump Output ( ________ ) BBLS/STK)
CALCULATIONS Kill Weight Mud: SIDPP( ______ ) PSI ÷ 0.052 ÷TVD( ______ )FT + OMW( ______ ) PPG =( _______ ) PPG Initial Drill Pipe Pressure: SIDPP ( ________ ) PSI + Kill Rate Pressure( ________ ) PSI = ( ___________ ) PSI Final Drill Pipe Pressure: Kill Weight Mud( ________ )PPG x Kill Rate Pressure( ________ )PSI = ( ___________ ) PSI Original Mud Weight (_________ )PPG) PRESSURE CHART
STROKES PRESSURE O Initial Drill Pipe
Pressure Final Drill Pipe
Strokes to Bit Pressure

80
LAB SESSION 5
KICK CONTROL EXERCISES-WELL CONTROL OPERATIONS 1.Establishing Regular Drilling – Flow Chart
FLOW CHART FOR SIMULATOR DRILLING OPERATION
Prepare Drill Floor by Lining up Flow Systems
Take Slow Circulating Rate Pressure
Establish Normal Drilling
Set Flow Alarms
Continue Drilling and
Monitor Kick Warning Signs
On Suspicion of Kick, Shut Down and
Conduct Flow Check
Kick
Yes
Conduct Contr. Oper’n
No
81
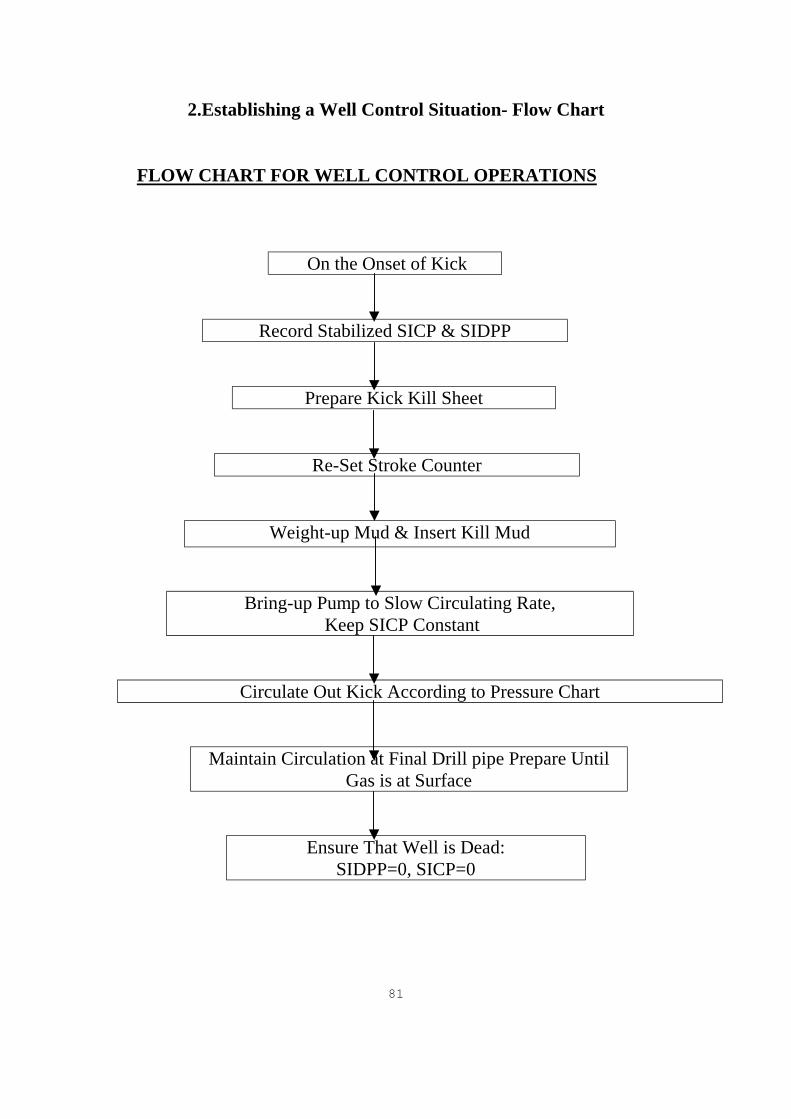
2.Establishing a Well Control Situation- Flow Chart
FLOW CHART FOR WELL CONTROL OPERATIONS
On the Onset of Kick
Record Stabilized SICP & SIDPP
Prepare Kick Kill Sheet
Re-Set Stroke Counter
Weight-up Mud & Insert Kill Mud
Bring-up Pump to Slow Circulating Rate, Keep SICP Constant
Circulate Out Kick According to Pressure Chart
Maintain Circulation at Final Drill pipe Prepare Until Gas is at Surface
Ensure That Well is Dead: SIDPP=0, SICP=0

82
2. Circulating Out a Kick (to kill the well)
a) Set the stroke counter on both Drillers Console and Remote
Choke console to zero. b) Obtain the Kill Sheet with SIDPP & SICP and all calculated
parameters. c) Also obtain Kill Mud Weight and Maximum Allowable
Casing Pressure. d) Bring up pump at slow circulating rate (0-30 SPM) while
maintaining casing pressure constant at the SICP using the remote choke control, continue till at 30 SPM or slow pump rate.
e) Follow the pressure decline on the Kill Sheet by opening and
closing the choke at the remote choke console till final circulating pressure is reached, as seen on Drill Pipe Pressure gauge.
At this point, the well should be killed. Flow check reveals
DPP = 0, CSGP=0.
83
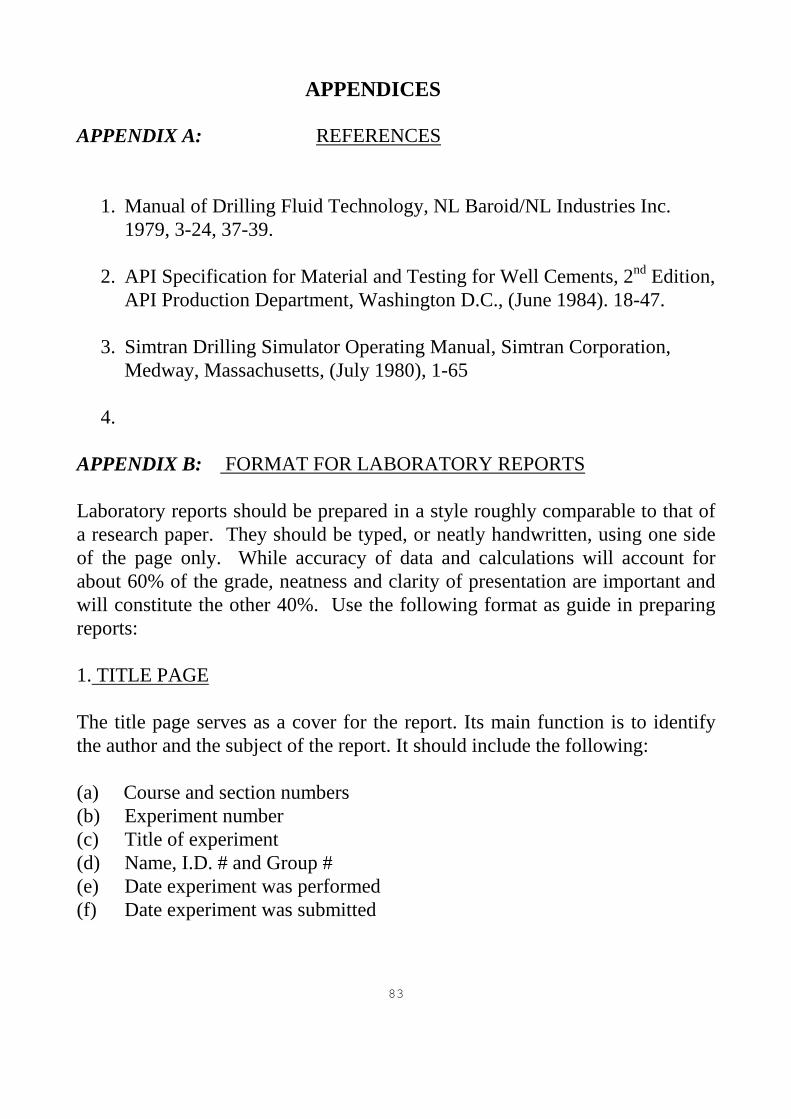
APPENDICES
APPENDIX A: REFERENCES
1. Manual of Drilling Fluid Technology, NL Baroid/NL Industries Inc. 1979, 3-24, 37-39.
2. API Specification for Material and Testing for Well Cements, 2nd Edition,
API Production Department, Washington D.C., (June 1984). 18-47.
3. Simtran Drilling Simulator Operating Manual, Simtran Corporation, Medway, Massachusetts, (July 1980), 1-65
4.
APPENDIX B: FORMAT FOR LABORATORY REPORTS Laboratory reports should be prepared in a style roughly comparable to that of a research paper. They should be typed, or neatly handwritten, using one side of the page only. While accuracy of data and calculations will account for about 60% of the grade, neatness and clarity of presentation are important and will constitute the other 40%. Use the following format as guide in preparing reports: 1. TITLE PAGE The title page serves as a cover for the report. Its main function is to identify the author and the subject of the report. It should include the following: (a) Course and section numbers (b) Experiment number (c) Title of experiment (d) Name, I.D. # and Group # (e) Date experiment was performed (f) Date experiment was submitted

84
2. INTRODUCTION This section should give a brief discussion of the general background and basic theory of the subject in the report. Pertinent equations can be included if any. 3. OBJECTIVE OF EXPERIMENT This should be a brief statement of the purpose of the experiment 4. PROCEDURES This section should describe the steps used in securing the experimental data. The description must be in sufficient detail so that the reader could repeat the experiment by using this stated account of the procedure. Write what you did and do not repeat the instructions. 5. RESULTS The final results obtained from analyzing the raw data of the experiment are given in this section. These can be presented in tabulated or graphical forms. All tables and figures should be labeled and given sequence of proper identification. All graphs should be made on standard graph paper, with the data clearly connected with smooth curves or straight lines, which ever is applicable. Intermediate data used in obtained the result should not be included in this section. 6. SAMPLE CALCULATION Where a calculation is required in connection with the results of an experiment, one complete sample calculations should be included. The equation used should be indicated and all variables used in the equation should be cited. 7. DISCUSSION OF RESULTS This section is used to explain the data given in the results section. Brief comment should be made on the experimental errors, data reproducibility and

85
discrepancies between experimental and theoretical results. A description of the practical application of the results can also be included. 8. ANSWERS TO GIVEN QUESTIONS Answer any questions given at the end of each lab material. References and material for these questions can be found in the laboratory manual as well as your course textbook. 9. REFERENCES The sources of any literature referred to in the report should be listed in order of appearance in the report. This should be in accordance with the standard format used in technical literature. For petroleum engineering subjects, the SPE standards should be adopted and this be arranged as follows:
(a) Author’s last name followed by his initials (b) The name of the book or article (c) If it is an article, the name and volume of the journal. (d) If it is a book, the date of publication, publisher and edition (e) Page number
EXAMPLES: (a) For a Book: Katz, D.L., Cornell, D., Kabayashi, R., Poetman, F., Vary, J.A., Elenbass, J.R. and Weinaug, C.F.: Handbook of Natural Gas Engineering, McGraw-Hill Book Co. Inc., New York, N.Y. (1959) 10-20. (b) For a Paper: Swift, G.W. and Kiel, O.C.: “The Prediction of Gas Well Performance Including the Effect of Non-Darcy Flow,” J. Pet. Tech. (July, 1962) 791

86
APPENDIX C: CLASSIFICATION, COMPOSTION AND PREPARATION OF DRILLING FLUIDS
1. CLASSIFICATION OF DRILLING FLUIDS
A. WATER BASE FLUIDS: (a) Fresh water muds - little or no chemical treatment 1. Spud Mud 2. Natural Muds (b) Chemically treated muds - No calcium compounds added 1. Phosphate muds 2. Organic treated muds (i) Lignite (ii) Quebracho and other extracts (iii) Chrome lignosulfonates (c) Calcium treated muds 1. Lime 2. Calcium chloride 3. Gypsum (d) Salt water muds 1. Sea water muds 2. Saturated salt-water muds (e) Oil - Emulsion Muds (Oil-in-water) Special modifications 1. Low solids oil-emulsion muds 2. Low clay solids weighted muds 3. Surfactant muds B. OIL BASE MUDS (a) Oil base muds (b) Inverted Emulsion Muds (water-in-oil)

87
C. GASEOUS DRILLING FLUIDS (a) Air or Natural gas (b) Aerated muds
2. COMPOSITION OF WATER-BASE MUD
Water-base mud consists basically of: 1. Liquid phase (a) Water (b) Oil (c) Emulsion 2. Solids phase - Inert, non-reactive components (a) Sand, silica, limestone, chert, dolomite, etc. (b) Barite, Galena 3. Colloidal phase - Small particle size (a) Non-swelling (b) Swelling clay - bentonite 4. Miscellaneous (Chemical phase) (a) Thinners, lost circulation material, dissolved solids, filtrate
reducing agents, surfactants, corrosion inhibitors and other chemicals.

88
4. LABORATORY PREPARATIONS OF WATER BASE MUD 1. Add enough bentonite to calculated amounts of sweet water to give muds
of specified densities in ppg. or pcf. 2. Stir these with the standard mixer for 30 min. After 25 minutes stirring
scrape down by lumped material adhering to the spindle or side of the container. Adjust the pH to 9.5 + 0.1 with either phosphoric acid or a caustic solution as required.
Resume the stirring for the period specified. 3. At the end of the stirring time transfer the samples to a sealed jar and age
for 24 hrs at room temperature. 4. After aging, readjust the pH to 9.5 + 0.1 as before stir the sample for 5
minutes and test immediately after stirring. 5. Measure the mud properties as in the proceeding experiments.
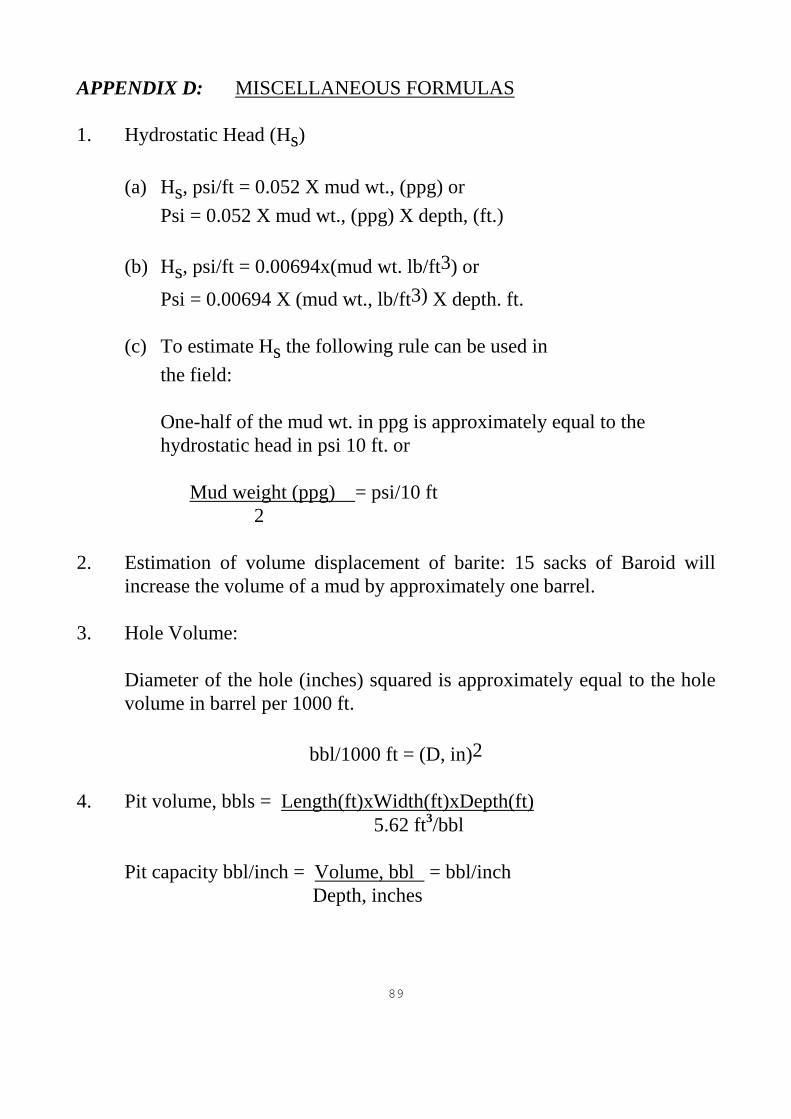
89
APPENDIX D: MISCELLANEOUS FORMULAS
1. Hydrostatic Head (Hs) (a) Hs, psi/ft = 0.052 X mud wt., (ppg) or Psi = 0.052 X mud wt., (ppg) X depth, (ft.) (b) Hs, psi/ft = 0.00694x(mud wt. lb/ft3) or Psi = 0.00694 X (mud wt., lb/ft3) X depth. ft. (c) To estimate Hs the following rule can be used in the field: One-half of the mud wt. in ppg is approximately equal to the
hydrostatic head in psi 10 ft. or Mud weight (ppg) = psi/10 ft 2 2. Estimation of volume displacement of barite: 15 sacks of Baroid will
increase the volume of a mud by approximately one barrel. 3. Hole Volume: Diameter of the hole (inches) squared is approximately equal to the hole
volume in barrel per 1000 ft.
bbl/1000 ft = (D, in)2 4. Pit volume, bbls = Length(ft)xWidth(ft)xDepth(ft) 5.62 ft3/bbl Pit capacity bbl/inch = Volume, bbl = bbl/inch Depth, inches

90
5. For laboratory purposes: 1 bbl = 42 gal. 1 bbl of water = 350 lbs., of water 1 bbl of water in the field = 350 cc of water i.e., 1 lb. : 350 lb 1 gr. : 350 gr. Therefore, 1 gr. / 350 ml. is equivalent to 1 lb./bbl. lb./ft3 = 7.5 X ppg.

91
APPENDIX E: DRILLING FLUID AND CEMENTING EQUIPMENT
Mud Balance Marsh Funnel and Cup
Hamilton Beach Mixer Portable Lab Mixing Tank
Pressurized Density Balance High-Speed Mixer for Cement

92
Rheometer HTHP Pressure Viscometer
Filter Press HTHP Filter Press
Digital pH Meter Digital and Analog Resistivity Meter

93
Electrical Stability Testers Oil/Water Retort Kit
Sand Content Kit Lubricity Tester
Atmospheric Consistometer Pressurized Consistometer