department of mathematics & statistics program review self ...department of mathematics &...
TRANSCRIPT

Department of Mathematics & Statistics
Program Review
Self-Study Report
June 2006

Table of Contents
Report ...................................................1 Appendix 1 ..........................................11 Appendix 2 ..........................................13 Appendix 3 ..........................................49 Appendix 4 ..........................................70 Appendix 5 ..........................................72 Appendix 6 ..........................................82

Department of Mathematics & Statistics Self-Study Report
Mission Statement Mathematics and statistics are responses to the fundamental human endeavor to understand the world. Furthermore, modern technological society relies on developments in these disciplines. Consequently, the Department of Mathematics and Statistics at California State University, Long Beach, as in most universities, plays a vital and indispensable role in the lives of the students and faculty. The Department’s mission is two-fold: to assist in integrating students into society by educating them in these fields; secondly, to build and foster an excellent faculty, which contributes to the development of mathematics and statistics and serves as a resource of mathematical expertise for the people of this state. This department aims to fulfill this mission by performing the following major functions:
1. Provide superior General Education instruction for every student on
campus. 2. Deliver quality instruction via a large collection of service courses to a
significant variety of departments and majors. 3. Sustain a considerable and qualified group of undergraduate majors in the
areas of general mathematics, applied mathematics, mathematics education and statistics.
4. Maintain vibrant graduate programs in the fields of general and applied
mathematics, mathematics education and applied statistics. 5. Enrich the intellectual life of the campus and the general mathematical
and statistical community by providing expertise and practicing scholarly activity.
In order to fulfill these functions the department should do the following:
seek, constantly, ways to improve its teaching methods thereby deepening
student understanding, including the use of new technology as a teaching tool, and maintain a diverse and modern curriculum at all levels;
convey to all students a sense of the relevancy of mathematics and
statistics, and of the importance of analytical and quantitative skills in contemporary society;
1

provide placement and advising tools for students so as to promote a high level of success among the many students taking its courses;
make available intervention tools to maintain a high level of success
among all its students;
schedule appropriate classes at the appropriate times to try to meet the diverse needs of the various communities of students that attend CSULB;
maintain communication with the departments whose majors are served
by its courses in order to ensure that the courses are providing the knowledge and skills needed, within the constraints of usefulness to all students in those courses and of the maintenance of mathematical integrity;
foster an environment for its students in which the excitement and vivacity
of mathematical and statistical activity is apparent, and in which students carry that enthusiasm back to their professional lives regardless of whether they are secondary school or community college teachers, applied mathematicians or statisticians in commerce and industry or graduate students pursuing higher degrees;
impart appropriate training in mathematics and statistics for graduate
students who will use that training professionally as mathematicians, statisticians or as teachers of mathematics while also providing adequate preparation for the students who will pursue doctoral studies;
encourage faculty to remain active in their discipline by reading and
learning new mathematics or statistics, attending and participating in conferences related to these subjects, sharing the results of successful teaching approaches, writing for appropriate journals or writing textbooks, or developing original mathematics or statistics or their applications.
Below we will address each of these individual points starting with
2

seek, constantly, ways to improve its teaching methods thereby deepening student understanding, including the use of new technology as a teaching tool, and maintain a diverse and modern curriculum at all levels
The Department of Mathematics and Statistics is a large department, which amounts (in terms of FTESs) to approximately four ninths of the College of Natural Sciences and Mathematics as the following table attests:
Number of FTES’s F01 S02 F02 S03 F03 S04 F04 S05 F05 Below 100 416.6 262.0 239.4 123.2 220.6 113.4 263.8 156.8 312.2100-level 1027.1 890.5 1027.0 832.8 1001.5 766.3 887.3 759.6 974.5200-level 125.9 136.3 139.3 150.9 134.7 119.9 122.9 115.4 114.2300-level 136.1 156.7 181.1 195.2 220.3 197.5 207.7 183.5 195.5400-level 61.0 70.6 73.7 23.4 77.5 87.9 95.9 96.4 87.2Graduate 15.9 12.0 16.7 16.4 18.5 17.4 26.9 21.7 37.2Total 1782.7 1528.1 1677.1 1341.8 1673.1 1302.5 1604.7 1333.5 1720.8
When viewed in percentages, the previous table illustrates the salient fact that a large component of the Department’s role is that of freshman instruction, that being in either a general education capacity or service components to different majors.
F01 S02 F02 S03 F03 S04 F04 S05 F05 Below 100 23.4% 17.1% 14.3% 9.2% 13.2% 8.7% 16.4% 11.8% 18.1%100-level 57.6% 58.3% 61.2% 62.1% 59.9% 58.8% 55.3% 57.0% 56.6%200-level 7.1% 8.9% 8.3% 11.2% 8.0% 9.2% 7.7% 8.7% 6.6%300-level 7.6% 10.3% 10.8% 14.5% 13.2% 15.2% 12.9% 13.8% 11.4%400-level 3.4% 4.6% 4.4% 1.7% 4.6% 6.8% 6.0% 7.2% 5.1%Graduate 0.9% 0.8% 1.0% 1.2% 1.1% 1.3% 1.7% 1.6% 2.2%Total 100.0% 100.0% 100.0% 100.0% 100.0% 100.0% 100.0% 100.0% 100.0%
There will be more said about the general education and service courses below. For the students with majors and minors in the Department, the programs that the Department supports are as follows: Four options for the Bachelor of Science degree: BS in Mathematics General (MATHBS01) Applied Mathematics (MATHBS02) Mathematics Education (MATHBS03) Statistics (MATHBS04)
3

Three possibilities for minors: Minor in Mathematics (MATHUM01) Minor in Applied Mathematics (MATHUM02) Minor in Statistics (MATHUM03) The single subject credential: Single Subject Credential in Mathematics (165) Four options for the Master’s degree: MS in Mathematics General (MATHMS01) Applied Mathematics (MATHMS02) Applied Statistics (MATHMS03)
Mathematics Education for Secondary School Teachers (MATHMS04)
The curriculum for each of the programs is regularly examined versus the curriculum in other similar universities (see Appendix 1). Also in Appendix 2 is a list of the most important courses in each of the undergraduate options as well as their aims and goals. The Department supports and staffs three computer labs, two equipped with PCs and one with Macs. These are extensively used for MATH 323, MTED 402 and 301, and sporadically used for other MATH and MTED classes. Of the general education classes, MATH 180 is taught with a heavy component of technology. The faculty in the department regularly attends local and national meetings of professional organizations such as the Mathematical Association of America, the American Statistical Association, the American Mathematical Society, National Council of Teachers of Mathematics and the Society for Industrial and Applied Mathematics, so they are cognizant of national and local trends in curricular and professional matters.
convey to all students a sense of the relevancy of mathematics and statistics, and of the importance of analytical and quantitative skills in contemporary society
In an era when more and more emphasis is being placed on the ability to process, manipulate, and convey information—especially quantitative information—the Department recognizes the importance of instilling in all students the ability to think analytically when required and make intelligent decisions when confronted with quantitative information. We are not concerned here with those students for whom intense training in mathematics is required in their major, but with those students whose exposure to mathematics is generally limited to one or two lower-division courses.
4

The Department offers a variety of courses that satisfy the General Education requirement—as well as pre-baccalaureate courses (Math 1 and Math 10) as needed to prepare students to take a course at college level. We present here a brief description of 100-level courses that are taken by a sizeable number of students, how they help to fulfill the mission described above, and the student demographic that is most likely to take these courses. Math 103 (Mathematical Ideas)—The vast majority of students who take this course are liberal arts majors, to whom math is frequently an anathema. The purpose of this course is twofold: to teach the students some interesting and practical topics, but also to help them appreciate, at least to some extent, the beauty and utility of mathematics. This is perhaps the only 100-level course whose content is, to some extent, at the instructor’s option—but the departmental syllabus (which must be followed by all part-time instructors) includes an introduction to the mathematics of finance, and a section on probability and statistics. These topics enhance the student’s ability to deal with the quantitative analyses that must be made in daily life. Math 112 (College Algebra)—Although this course is occasionally selected to satisfy the General Education requirement by liberal arts majors who are relatively comfortable with their ability to perform algebraic manipulations, it is more often chosen by majors in fields that either require it (such as life or social sciences) or by students who are tentatively considering majors in more mathematically intensive subjects, but feel that their algebraic skills need strengthening. The course content includes significant components in algebraic reasoning and problem analysis. Below some proposed changes to 112 are outlined. Math 114 (Finite Mathematics) and Math 115 (Business Calculus) – These two courses are grouped together because they are required by the business school for all their majors. Math 114 emphasizes probability and statistics in making successful decisions in business situations, and Math 115 covers a broad variety of business-related problems which calculus is uniquely adept at analyzing. Although the vast majority of the students who take this course are business majors, there is some enrollment from students who have sufficient confidence in their mathematical skills that they are comfortable taking more challenging courses than Math 103 and Math 112. In addition, the Department regularly offers sections of these courses for the University Honors Program. Math 180 (Statistics for Everyday Life) – This course is usually taken by students in a variety of majors including those that traditionally require a substantial background in statistical analysis. The course is designed to give students the key statistical tools that are used in analyzing data, as well as the ability to recognize when statistical information is being used erroneously. In Appendix 3 one can find the detailed descriptors of the courses with their aims and goals together with the outlined changes to 112 that are described below.
5

provide placement and advising tools for students so as to promote a high level of success among the many students taking its courses;
In addition to the CSU system-required ELM (Entry Level Mathematics) Exam, the Department has started requiring the MDPT (Mathematics Diagnostic Placement Test) from those students interested in enrolling in either regular calculus (Math 122) or Biological Sciences Calculus (Math 119A). The Department is just beginning to gather information on the efficacy of this effort. The department maintains an extensive presence at the advising workshops for incoming students run by the SOAR program. At least one faculty member (usually Dr. Merryfield) and at least one staff member are normally present at each workshop. The staff member is there to facilitate enrollment. Most incoming mathematics majors speak to a faculty member when they enter. Continuing students declaring a mathematics major must speak to an advisor in order to make that declaration; the advisors use that conversation to outline the requirements and estimate the time needed to finish. The same applies to students declaring minors. We rely on the normal procedures of university life to bring students in to see advisors, all of whom maintain frequent office hours and are among the most accessible faculty members. Such procedures include a mandatory consultation for second semester freshmen, seeking permission for such things as taking a course credit/no credit, or filing for graduations. Some special programs mandate consultation and schedule approval every semester, but most students are not in such programs. We encourage students to consult an advisor more often than that, and many do, but we do not force or require such visits.
make available intervention tools to maintain a high level of success among all its students;
The Department supports through lottery funds the Mathematics Tutoring Center which is open suitable hours throughout the year. Its purpose is to assist students who have question in their courses. The Department also sponsors a center to tutor the Mathematics Education multiple subject majors that may need assistance. The last academic year there was an additional tutoring center strictly for students in Math 1 and Math 10, the pre-baccalaureate courses. The fact is that the Department has a large remedial component each semester (1000 students), and one of the difficulties is that while some of the students in these pre-baccalaureate courses will eventually take a calculus-based course, the vast majority of them will not. Thus Math 10 had to prepare a student in a sufficiently demanding fashion so as to eventually be able to handle the rigors of calculus, yet, however, that level of rigor was perceived by most students as extreme and unnecessary.
6

Thus starting in the Fall of 2007, the Department will offer two pre-baccalaureate courses in intermediate algebra: Math 7 (Basic) and Math 11 (Enhanced). The former course will entitle the student to take only GE courses that are not calculus-based. Thus, the Department is adding to the aforementioned Math 103, Math 114 and Math 180, Math 101 (Pre-calculus Trigonometry) and Math 109 (Modeling with Algebra) as possibilities for the students that take Math 7. While Math 112 will eventually be done away with, the department will add to its curriculum Math 113 (Pre-Calculus Algebra). One can find descriptions of these in Appendix 3.
schedule appropriate classes at the appropriate times to try to meet the diverse needs of the various communities of students that attend CSULB
The Department prides itself in always making sure enough sections and at the appropriate times for necessary courses are offered so as to allow all students flexibility. The reader is referred to Appendix 4 for evidence in support of this from throughout the campus.
maintain communication with the departments whose majors are served by its courses in order to ensure that the courses are providing the knowledge and skills needed, within the constraints of usefulness to all students in those courses and of the maintenance of mathematical integrity.
The Department has established a position named Lower-Division Service Course Coordinator. The duties of this faculty member include in-depth and continuous communications with various departments on campus so at to assure the curriculum of in-service courses to those departments are aligned with their wants and needs. Other duties include selection of text-book for all courses not taught by tenured or tenured-track personnel as well as the syllabi of those courses.
foster an environment for its students in which the excitement and vivacity of mathematical and statistical activity is apparent, and in which students carry that enthusiasm back to their professional lives regardless of whether they are secondary school or community college teachers, applied mathematicians or statisticians in commerce and industry or graduate students pursuing higher degrees;
Undergraduate advising (for majors, minors, and other undergraduates interested in mathematics courses) is primarily the responsibility of the Undergraduate Associate Chair Dr. Kent Merryfield, and the Undergraduate Advisor, Dr. Will Murray. They both receive assigned time for their efforts. Other members in the department also contribute to advising.
7

For post-baccalaureate students in the Single Subject Teaching Credential program, we have a Credential Advisor, who has been Dr. Angelo Segalla. The Credential Advisor receives assigned time support. For advanced undergraduates intending to pursue teaching careers, the responsibilities of the Credential Advisor and the Undergraduate Advisor overlap somewhat, and Drs. Segalla, Murray, and Merryfield maintain close contact and frequently discuss particular students. Three years ago, the department instituted for undergraduates an Honors in the Major program which requires extra units and an undergraduate thesis. Since then, about two students per year have taken advantage of this program. Most of these students have gone on to Ph.D. programs in mathematics. We plan to maintain this at approximately its current level, encouraging our best student to enter this program. No monetary support is involved. In addition, top students with a flair for problem-solving are encouraged to take MATH 491 (Honors Seminar in Problem Solving) each fall and to participate in the Putnam Competition. Over the last six years, CSULB has rank about 110th or 120th out of more than 300 schools on five different and placed three students among the top 500 individuals in the country. A survey was taken of our graduate and undergraduates students to attempt to measure their level of satisfaction with the Departments offerings in advising, courses and instruction. The reader is encouraged to consult Appendix 5 for the positive results. Finally, the Math Stat Student Association is quite active. The Association has organized and supported talks from former students about their job experiences as well as academic talks from professors and graduate students about the mathematical-statistical experience.
impart appropriate training in mathematics and statistics for graduate students who will use that training professionally as mathematicians, statisticians or as teachers of mathematics while also providing adequate preparation for the students who will pursue doctoral studies;
The graduate curriculum in mathematics is designed to prepare students for careers as professional mathematicians, statisticians, or teachers of mathematics, as well as prepare them for further graduate study at the doctoral level. Although we have not kept complete data on the employment status of our graduates, anecdotal evidence suggests that nearly all are successfully employed or have completed doctoral degrees in these areas. We do, however, have complete data on the graduates in the Option in Applied Statistics, and these are representative of the other options. In the short three-year life of this option there have been 27 graduates; of these 20 are employed in various industries (financial 3, government 2, aerospace 3, pharmaceutical 2, medical 1, insurance 4, market research 1, other fields 3), 2 are teaching at local community colleges, 3 are pursuing a PhD in Statistics, 1 is teaching in high school, and the
8

remaining 2 have part-time employment. These data attest to the success of the program in preparing students for professional employment, teaching, or doctoral studies. The core course requirements in each of the graduate options in mathematics involve both breadth and depth requirements. The depth requirement prepares students for further graduate study. The breadth requirement gives students an advanced viewpoint for many of the mathematics topics taught in community colleges, thus preparing them to be knowledgeable and versatile teachers. In addition, graduate students employed as Teaching Associates gain valuable experience for future teaching careers at community colleges. The Option in Applied Mathematics and the Option in Applied Statistics prepare students for jobs in industry and government as well. Specifically, students in the Master of Science in Mathematics are required to complete at least 3 of the core graduate courses (a breadth requirement), including at least two full-year sequences (a depth requirement). The core graduate courses are Abstract Algebra, Topology, Real Analysis, and Complex Analysis. These courses represent the fields of mathematics students are expected to know for comprehensive exams at the doctoral level. Students in the option typically take all the core courses as well as the elective courses Elliptic Curves and Functional Analysis. Students in the Option in Applied Mathematics are required to take several analysis courses (including the core course Applied Analysis) intended to prepare them for further graduate study in applied mathematics. The applied courses, which prepare students for jobs in industry, include Numerical Analysis, Applied Nonlinear Ordinary Differential Equations, Partial Differential Equations, and Stochastic Calculus and Applications. Students in the Option in Applied Statistics choose courses in modern and highly sought after applications of statistics in industry. The courses include Experimental Design and Analysis, Actuarial Science, Survey Sampling, Time Series, Statistical Quality Control, Data Mining, and Statistical Simulation. The Statistical Inference course, as well as other required mathematics courses, prepares students for further graduate study in statistics. The Option in Mathematics Education for Secondary School Teachers is designed to enhance the effectiveness of secondary school teachers. The courses give students an advanced perspective on the teaching and learning of mathematics at the secondary school level. Specifically these courses include Algebra in the Secondary School Curriculum, Geometry and Measurement in the Secondary School Curriculum, Analysis in the Secondary School Curriculum, and Probability and Statistics in the Secondary School Curriculum. Lastly,
9

encourage faculty to remain active in their discipline by reading and learning new mathematics or statistics, attending and participating in conferences related to these subjects, sharing the results of successful teaching approaches, writing for appropriate journals or writing textbooks, or developing original mathematics or statistics or their applications.
The Department has a broad range of young and experienced faculty in a wide variety of fields in mathematics and statistics. Appendix 6 has a list of the faculty as well as their areas of expertise. Many members of the faculty have active research programs—in fact, all, but a handful, have a refereed publication in the last five years. The Department has encouraged and supported research grant solicitation from all its faculty. The Department also supports The Friday Colloquia, given mostly by visitors from other universities, local, national or international. The College of Natural Sciences and Mathematics has been giving 6 units of assigned time to faculty during their first two years of their tenure. The Department has occasionally given assigned time to faculty for research projects. More systemically, the Executive Committee has passed the following resolution:
Untenured faculty during the 3rd and 4th years of their tenure-track appointment, in order to assist them to have an active research program, shall receive three units of assigned time per semester.
Similar resolutions for the 5th and 6th year will be addressed next year and then voted by the department. The vote is expected to be affirmative. Naturally, the question of resources in order to provide for this assigned time will have to be addressed each semester.
10

Appendix 1 Comparison of Courses with other CSU’s and mostly local Universities
CSU Private Fullerton SDSU CSUN Fresno Millersvill,PA Loyola USC
103 2 2 2 2 2 1 0 112 2 0 2 0 2 1 0 114 1 0 0 0 9 1 1 115 2 2 2 0 2 2 1 117 2 2 2 2 2 2 2 119A 1.5 2 0 2 1.5 (=115) 2 1 122 2 2 2 2 2 2 2 123 2 2 2 2 2 2 2 180 2 2 2 2 1.5 2 0 MTED 110 1 1.5 2 2 1 0 233 2 2 2 2 2 1.5 1 247 1 (w. DEQ) 2 2 2 2 (recom 233) 1.5 (req 233) 1 341 1 (senior level) 2 1 2 (4 units) 2 0 2 355 1 (Prereq 347) 1 (3 classes) 1 1.5 1(2 classes) 1 1 361A 2 2 2 2 1.5 (1sem) 2 2 364A 1.5 (1.5 sem.) 1.5 (1sem.^) 1 1.5 (^) 1.5 (^) 1.5 (^) 1 380 1.5 2 2 2 2 1.5 (1 sem.) 1 381 1.5 (two classes) 2 2 2 2 0 2 310 / 410 1.5 0 0 1 (4 units, 1sem) 1 (1sem) 0 1 MTED 411 1 1 0 1 1 0 444 1 (2 sem.**) 1 (**) 1 (**) 1.5 (4 units) 1.5 1 (**) 1.5 470 2 2 2 2 2 0 0 480 0 2 2 0 0 0 0
11

Levels: 2: Course fits very well 1: Course seems to exist but the fit may be far from perfect 0: Course does not seem to exist Notes. 1. The list includes schools around here that have semester calendar plus one other (somewhat randomly chosen) school: Millersville University (located at Central Pennsylvania and has 7000 (resp. 1200) undergraduate (resp. graduate) students with a Master program in Math.). 2. It is more difficult to classify the MTED classes. Other schools have more general / generic titles like “Math/Geometry for teachers”. Comments: 1. What is unique about us? a. We require NumberTheory / Linear Algebra as a prerequisite for Abstract Algebra.
b. We have two-semester sequences of Differential Equations and History of Math. 2. What is special about Fullerton?
a. Each student is required to complete one of the (4) concentrations (18-20 units) and one of the (9) cognates (9-11 units). b. Their general Math requires (with equivalent course numbers): Algebra I, 361A, Topology and three of the following: Algebra II, 461, 451, 341 and Combinatorics.
12

Appendix 2 Undergraduate Courses for the Programs
In this appendix we include descriptors for what are considered some of the most crucial courses for the Majors in the Department. The list of courses is
General Option
Applied Math
Math Education Statistics
Math 122 Math 123 Math 233 Math 247 Math 361A Math 364A Math 380 Math 381 Math 410 Math 444 Math 470
Required and considered essential Required Not Required
13

MATH 122 CALCULUS I
Goals: 1. Students will learn, understand, and use the fundamentalconcepts of calculus, especially the derivative and the integral.
2. Students will use calculus to solve problems.
3. Students will read, understand, and use mathematicalreasoning and symbolism, and employ them to communicate their ideasin a logical organized manner.
4. Students will examine applications of calculus to science andengineering and learn to model problems in these areas as calculusproblems.
Assessment Method: Embedded questions throughout homework,quizzes, and exams. Discourse in class and office hours.
Illustration #1: To enable the Starship Enterprise to escape imminentperil from the Romulans, Spock must construct a space-time disrupter inthe shape of a box with a volume of . The bottom of the box must"#!7$
have a length which is 3 times its width and must be made of dilithiumcrystal. The top of the box must be made of Kryptonite and the sides ofthe box must be made of compressed tribble hide. Spock will minimizethe cost of the disrupter because Starfleet Command has been issued aprime directive from the Federation to balance its budget. Sulu reportsthat dilithium crystal costs 15 bars of latinum per square meter,Kryptonite costs 5 bars of latinum per square meter, and compressedtribble hide costs 3 bars of latinum per square meter. Find the cost ofthe disrupter that Spock constructs.
The student begins by translating the given information intomathematical form. Letting be the width of the bottom of the box inBmeters, the length is calculated to be . Letting be the height of the$B Cbox in meters and be the volume in cubic meters, the student usesZthe given volume of and the geometrical formula for volume of a"#!7$
box as length times width times height to obtain
14

Z œ $B B C œ $B C œ "#! Þ Ga ba ba b # #ß $ß % Now using to denote the cost of thebox in bars of latinum, the student recognizes the mathematical problemis to minimize . The student sums the products of the areas of theGsides of the box times the cost per unit area of the material used toobtainG œ "& $B & $B $ $BC $BC BC BC a b a b a b# #
œ '!B #%BC . Using the equation for the volume of the box to# #ß $ß %
solve for in terms of , the student finds that andC B C œ %!B#
substitutes into the equation for cost to obtain a function of one variableG B œ '!B #%B %!B œ '!B *'!B Þ G Ba b a b a b# # # " # The derivative of iscalculated to be when .G B œ "#!B *'!B B Á !w # "ß #a bSince the width of the box must be a positive number and isG Ba bdifferentiable for all positive , theorems from calculus imply that theBdesired maximum of will occur at the critical point where G B G B œ !a b a bw
if there is only one critical point and at that critical point.G B !ww "a bSolving , the student finds that , so"#!B *'!B œ ! B œ œ )# $ *'!
"#!B œ # G B œ "#! "*#! Bis the only critical point. Computing , theww $a bstudent determines that and hence the desiredG # œ $'! !wwa bminimum occurs at . Thus the student concludes that the costB œ # "ß #ß $
of the disrupter that Spock constructs is G # œ '! # *'! # œ *#!a b a b a b# "
bars of latinum.#ß %
Illustration #2: Temperature during one winter day in Trantor ispredicted to be °C at hours after0 > œ %/ ) -9= #> / >a b a b a b> >
midnight. If this prediction comes true, what would be the averagetemperature during that day?
Recognizing that the average value of over the interval is0 > ! Ÿ > Ÿ #%a basked for, the student uses the definition of average value of a functionto set up the definite integral
0 œ 0 > .> œ %/ ) -9= #> / .> Þ#% #%
! !+@/
> > "ß #ß $ß %" "#% ! #%
' 'a b a b a bTo evaluate the integral, the student attempts to use the substitution? œ #> / .? œ # / .>> >. Computing , the student finds that %.? œ %/ ) .> ? ! œ " ? #% œ %) /a b a b a b> #%. Since and , the integral
becomes . Using the Fundamental0 œ % -9= ? .?%) /
"+@/
#ß $"#%
' #%
15

Theorem of Calculus, the student concludes that the averagetemperature is
0 œ =38? l œ =38 %) / =38 "+@/%)/"
#% "ß #ß %" " "' ' '
#% ˆ ‰ °C .
16

MATH 123 CALCULUS II
Goals: 1. Students will learn, understand, and use the fundamentalconcepts of calculus, especially the integral and infinite series.
2. Students will use calculus to solve problems.
3. Students will read, understand, and use mathematicalreasoning and symbolism, and employ them to communicate their ideasin a logical organized manner.
4. Students will examine applications of calculus to science andengineering and learn to model problems in these areas as calculusproblems.
Assessment Method: Embedded questions throughout homework,quizzes, and exams. Discourse in class and office hours.
Illustration #1:
After a fierce attack by Empire stormtroopers, Princess Leia and HanSolo are left dangling at the end of a 50 ft long trilithium cable hangingfrom a walkway over the power pit of the Empire Deathstar. Chewbaccathen pulls the cable all the way up so that they are all at the walkway. Ifthe cable weighs 8 lb/ft, and Leia and Han together weigh 300 lb, findthe work done by Chewbacca.
The student immediately observes that the work required to lift Leia andHan is just the force times the distance lb ft ft-lb , soœ $!! &! œ "&ß !!!a b a bthe problem reduces to finding the work required to lift the cable. Since%
each cross-section of cable is at a different distance from the walkway,the student seeks to approximate the work by dividing the cable into 8parts, each having length . Numbering these parts 1?B œ 0>
&!8
through , a point on each part is selected to represent the whole8 3part in that its distance, , from the walkway is used for all points inB ‡
3
part in the computation of approximate work. The force of gravity on3 $
any part of the cable of length is , so the? ? ?B B 0> ) 6,Î0> œ ) B 6,a b a bapproximate work done on that part is .a b a b) B 6, B 0> œ )B B 0> 6,? ?3 3
‡ ‡
Adding up the approximate work for all the parts, the student arrives at
17

a total approximate work given by . The student observes that!3œ"
8
3‡ $)B B?
the larger the number of parts used in the approximation, the better8the approximation should be. Indeed, the exact work in lifting the cable
should be . Now the student recognizes that, according tolim8Ä_ 3œ"
8
3‡! )B B?
the definition of definite integral, the desired limit is . Using50
0' )B .B "ß $
the Fundamental Theorem of Calculus, the student calculates
50
0' a b)B .B œ %B l œ % &! œ "!ß !!! 0> 6, Þ# &! "ß #
!#
The student concludes that the work done by Chewbacca in lifting Leia,Han, and the cable is ."&ß !!! "!ß !!! œ #&ß !!! 0> 6, #ß %
Illustration #2: Find the Taylor series for about the point .0 B œ / + œ !a b B
Use it to find a polynomial of degree 6 that approximates 1 B œ /a b B#$
near Find an upper bound on the absolute error if the polynomial is! Þused to approximate for values of in 1 B B " ß " Þa b c dThe student seeks to use the definition of Taylor series of a function."Noting that for all , the student finds that0 B œ / 8a b8 Ba b
/ œ 0 B œ œ œ BB 8 $
8œ! 8œ! 8œ!
_ _ _0 + B+ / B!
8x 8xa b ! ! !a b8 !8 8a b a b a b .
Replacing by the student arrives atB #B ß$
1 B œ / œ œ "a b a b! !Œ
8œ! 8œ!
_ _88B
#$ $ $8
8B B# #
and uses the first three terms of this series to obtain " B B ß" "# %
$ '
a polynomial of degree 6 that approximates . To determine an1 Ba b "ß #ß $
upper bound on , the error when the polynomial is used toIapproximate in , the student observes that the above series1 B " ß "a b c dfor is an alternating series. The student then notes that, for1 Ba b "
B − "ß " ß 8 œ !c d ¹ ¹ ¹ ¹B B B# # #$8$ $8 $8
8" 8 8 for all and (by the Squeezelim8Ä_
Theorem as and , so the Alternating Ÿ Ÿ œ ! Ñ" B " "# # # #8 8 8 8
$8 lim8Ä_
Series Estimation Theorem yields The studentk k ¹ ¹I Ÿ Ÿ ÞB#
")
*
$"ß #ß $
18

concludes that the absolute error must never exceed for values of ") B
in .c d " ß "
19

233 Major Goals:
The main goal of this course is to prepare students for higher mathematics. This is done by engaging students in deep problem-solving situations and techniques of proof that presage higher level topics. Through example and exercise, students will raise their general mathematical sophistication—the ability to read and write complex and convincing arguments. The mathematical reasoning in this course is practiced on fundamental topics that are foundational for higher mathematics. These topics include numbers, sets, induction, relations, functions, and counting techniques. The specific goals are as follows. Students will demonstrate the ability to
Transform intuition into proof, and to differentiate between proof and opinion/example.
Use the propositional and predicate logic and the language of sets, relations, and functions in writing mathematical proofs.
Read and construct valid mathematical arguments (proofs), including proofs by induction, direct and indirect reasoning, proof by contradiction, and disproof by counterexample.
Solve counting problems by applying the multiplication principle, the inclusion-exclusion principle, the pigeonhole principle, recurrence relations, and, in particular; the use of permutations and combinations.
Use counting techniques to compute probabilities of events.
Representative Textbooks A transition to advanced mathematics, by D. Smith, M. Eggen and R. St. Andre A concise introduction to pure mathematics, by M. Liebeck Assessment Method: Embedded questions throughout homework, quizzes and exams. Illustration #1: Counting Putting “Balls-into-Buckets” is a model for the following mathematical constructs.
1. Partitions: Modeled by distinguishable balls into identical buckets
20

2. Functions: Modeled by distinguishable balls into distinguishable buckets. a. Injective functions: at most one ball in each bucket b. Surjective functions: no empty buckets c. Bijective functions: exactly one ball in each bucket
3. The number of nonnegative solutions of a Diophantine equation can be modeled by identical balls into distinguishable buckets. For example, the number of solutions of x+y+z=10 is modeled by ten identical balls into three distinguished buckets. Illustration #2: Relations 1. Define the relation on the set { }1, 1,2, 2,3, 3− − − by a b< if divides b . Is this relation a partial order? Prove your answer.
a
2. Define if ab is a square number. Is this relation an equivalence relation? Prove your answer.
a b≈
Illustration #3: Functions
1. If f g is injective, prove that g is injective. 2. Give an example where f g is injective but f is not injective.
21

247 Goals:
Students will understand matrices as collectors of information, execute key operations involving matrices, and use these operations to solve relevant problems.
Students will be able to find all solutions to arbitrary systems of linear equations, by using Gaussian Elimination. The student will understand the process behind the reduction, and eventually understand the relation between solvability, null spaces and column spaces.
Students will increase their level of mathematical linguistic ability by being able to deduce simple truths or give counterexamples to falsities involving the many concepts introduced in the course such as linear independence, spanning sets, dimension and basis.
Students will increase their sense of mathematical rigor by being able to argue simple theorems concerning matrices and vectors as well as follow more sophisticated arguments.
Students will be able to compute eigenvalues and eigenvectors of a matrix, and their relation to whether a matrix can be similar to a diagonal matrix or not.
Students will be able to orthogonally diagonalize any symmetric matrix by using the Gram-Schmidt process to find an orthonormal basis for such a matrix.
Assessment Method: Embedded questions throughout homework, quizzes and exams. Illustration #1: Of the three options on the right in the table, check all those that are applicable as to the possible number of solutions to the system Ax b= , assuming all the information that you are given. For some, only one option may apply, for others, two may apply, and still others all three may apply. For example, if you are told that A is 3 , and that it has rank 3, then you should put a check only on the Unique column, since such a system will have a unique solution. On the other hand, if all you are given is that
3×
A is 3 , then you should put a check in all three columns No solution, Unique Solution, and Infinitely many since all of these are possible under the assumptions.
3×
# Ax b= No
Solution Unique
Solution
Infinitely many
solutions
1 A is 12 and b 0 15× =
2 A is 12 15×
3 A is 15 10×
22

4 A is 12 12×
5 A is 15 and b 0 10× =
6 A is 12 and 12× A has rank as large as possible
7 A is 12 and 15× A has rank as large as possible
8 A is 15 and 10× A has rank as large as possible
9 A is 15 and both 10× A and ( )A b have rank as large as possible
10 A is 12 and both 15× A and ( )A b have rank as large as possible
The student is expected to fill the table correctly , , . In a similar fashion the student is expected to answer the following questions: Illustration #2: Consider the veracity or falsehood of each of the following statements, and argue for those that you believe are true while providing a counterexample for those that you believe are false. Let , { }1 2 3 4, , ,u u u uS =
( )1 2 3 4A u u u u= , { } { }1 2 3 4, , , ,v v u u u uT S= ∪ = , . v is in the span of T . 0 is in the span of T and in the span of . S Ax v= has a solution if and only if the span of is the same as the
span of T . S
The rank of A is 4 if and only if is a linearly independent set. S If T is linearly independent, then so is . S
Illustration #3 Show that the collection of symmetric matrices of size is a subspace of the space of all square matrices of size , and compute its dimension.
nn
The proof should follow from elementary properties of the transpose. That ( )a aΤ Τ+ = + ΤA B A B for any scalar and any matrices a ,A B implies that the collection of symmetric matrices ( Τ =A A ) is a subspace , . To compute the dimension, one needs to find a basis. The student could start by doing the
case and obtain easily the basis , and . So it is 3-dimensional.
2 2×1 00 0⎛ ⎞⎟⎜ ⎟⎜ ⎟⎜⎝ ⎠
0 11 0⎛ ⎟⎜ ⎟⎜ ⎟⎜⎝ ⎠
⎞ ⎞0 00 1⎛ ⎟⎜ ⎟⎜ ⎟⎜⎝ ⎠
23

For the case , an arbitrary symmetric case is , so one can see that
a basis will consist of 6 elements: , , , ,
and . From there the student is expected to conclude that the
basis will always have for arbitrary ,
3n=a b cb d ec e f
⎛ ⎞⎟⎜ ⎟⎜ ⎟⎜ ⎟⎜ ⎟⎜ ⎟⎟⎜⎝ ⎠1 0 00 0 00 0 0
⎛ ⎞⎟⎜ ⎟⎜ ⎟⎜ ⎟⎜ ⎟⎜ ⎟⎟⎜⎝ ⎠
0 1 01 0 00 0 0
⎛ ⎞⎟⎜ ⎟⎜ ⎟⎜ ⎟⎜ ⎟⎜ ⎟⎟⎜⎝ ⎠
0 0 10 0 01 0 0
⎛ ⎞⎟⎜ ⎟⎜ ⎟⎜ ⎟⎜ ⎟⎜ ⎟⎟⎜⎝ ⎠
0 0 00 1 00 0 0
⎛ ⎞⎟⎜ ⎟⎜ ⎟⎜ ⎟⎜ ⎟⎜ ⎟⎟⎜⎝ ⎠0 0 00 0 10 1 0
⎛ ⎞⎟⎜ ⎟⎜ ⎟⎜ ⎟⎜ ⎟⎜ ⎟⎟⎜⎝ ⎠
0 0 00 0 00 0 1
⎛ ⎞⎟⎜ ⎟⎜ ⎟⎜ ⎟⎜ ⎟⎜ ⎟⎟⎜⎝ ⎠
n ( )12
n n+ elements so the dimension given
by this number .
Illustration #4: Suppose A is 1010× . Suppose IA − has rank 3, ( )det 0A I+ =
and ( )det 2 0A I− = . Suppose the trace of A is 9. Decide whether A is invertible and whether A is similar to a diagonal matrix. Here the student is expected to deduce that 1 is an eigenvalue with multiplicity at least 7 , , and that also and 2 are eigenvalues. Finally since the trace is 9, the last remaining eigenvalue is also 1. From there the student concludes that
1−
A , while invertible, is not similar to a diagonal matrix , , .
Illustration #5 Let 5A J= =
1 1 1 1 11 1 1 1 11 1 1 1 11 1 1 1 11 1 1 1 1
⎛ ⎞⎜ ⎟⎜⎜⎜ ⎟⎜ ⎟⎝ ⎠
⎟⎟ . To find an orthogonal matrix whose
columns are eigenvectors, first one must compute the eigenvalues to be . First one must find a basis for the null space of 0,0,0,0,5 A , such as
, , and , and the observe that is an
eigenvector for 5. Then using Gram-Schmidt, one gets
1u =
11000
−⎛ ⎞⎟⎜ ⎟⎜ ⎟⎜ ⎟⎜ ⎟⎜ ⎟⎜ ⎟⎜ ⎟⎟⎜ ⎟⎜ ⎟⎜ ⎟⎜ ⎟⎟⎜⎜⎝ ⎠⎟
2u =
10100
−⎛ ⎞⎟⎜ ⎟⎜ ⎟⎜ ⎟⎜ ⎟⎜ ⎟⎜ ⎟⎜ ⎟⎟⎜ ⎟⎜ ⎟⎜ ⎟⎜ ⎟⎟⎜⎜⎝ ⎠⎟
3u =
10010
−⎛ ⎞⎟⎜ ⎟⎜ ⎟⎜ ⎟⎜ ⎟⎜ ⎟⎜ ⎟⎜ ⎟⎟⎜ ⎟⎜ ⎟⎜ ⎟⎜ ⎟⎟⎜⎜⎝ ⎠⎟
4u =
10001
−⎛ ⎞⎟⎜ ⎟⎜ ⎟⎜ ⎟⎜ ⎟⎜ ⎟⎜ ⎟⎜ ⎟⎟⎜ ⎟⎜ ⎟⎜ ⎟⎜ ⎟⎟⎜⎜⎝ ⎠⎟
11111
⎛ ⎞⎟⎜ ⎟⎜ ⎟⎜ ⎟⎜ ⎟⎜ ⎟⎜ ⎟⎜ ⎟⎟⎜ ⎟⎜ ⎟⎜ ⎟⎜ ⎟⎟⎜⎜⎝ ⎠⎟1 1 1 1 12 6 12 20 5
1 1 1 1 12 6 12 20 5
2 1 1 16 12 20 5
3 1 112 20 5
4 120 5
0
0 0
0 0 0
P
− − − −
− − −
− −
−
⎛ ⎞⎟⎜ ⎟⎜ ⎟⎜ ⎟⎜ ⎟⎜ ⎟⎜ ⎟⎜ ⎟= ⎟⎜ ⎟⎜ ⎟⎜ ⎟⎜ ⎟⎜ ⎟⎜ ⎟⎜ ⎟⎟⎜ ⎟⎜⎝ ⎠⎟
,
which satisfies: , the diagonal matrix with on the main diagonal .
1− =P AP D 0,0,0,0,5
24

Math 361AIntroduction to Mathematical Analysis
Goals:
1. Students will read and understand valid mathematical arguments.
2. Students will be able to write valid mathematical arguments.
3. Students will exhibit familiarity and ease of use with sequences and series.
4. Students will recognize, have knowledge of, be able to combine and eval-uate mathematical statements involving quantifiers.
5. Students will exhibit familiarity and ease of use with the definitions ofcontinuity and differentiability.
Assessment Method: Embedded questions throughout homework, quizzesand exams.
Illustration 1 What is the contrapositive of this statement:
∃ε, a− ε ≥ b ⇐⇒ a > b.
Show that the statement is false.
It is expected is the student will be able to read and interpret the symbols (1)and have sufficient command over them to form the contrapostive (4):
∀ε, a− ε < b ⇐⇒ a ≤ b.
Noting that ε is not restricted, a choice of ε = a − b makes the left side of thestatement false, therefore the implication ∀ε, a− ε < b =⇒ a ≤ b is false, andthus the full statement is false (2).
Illustration 2 Show that the function f(x) = 1/x is continuous, but not uni-formly continuous, on 0 < x ≤ 1.
It is expected is that student will be able to apply the ε − δ definition to thisproblem, find that that 0 < δ < εx2/(1 − εx) and that 0 = inf{εx2/(1 − εx) :0 < x ≤ 1} so that there is no uniform δ (5)(1)(4)(2).
Illustration 3 Show that a bounded monotone increasing sequence convergesto it’s supremum.
It is expected that the student will be able to read and decode this statementinto (1)(3)
∃M > 0 s.t. ∀n, an < M and an < an+1 =⇒ limn→∞
an = supn
an.
1
25

From this, further decode the conclusion into (1)(3)
∀ε > 0, ∃N s.t. |an − supn
an| < ε ∀n > N.
A consequence of the sequence being bounded is that the supremum is finite,and using the definition of finite supremum (1)(3),
∀ε > 0, ∃N s.t. supn
an − ε < aN and an ≤ supn
an, ∀n.
The result follows using monotonicity in that statement (2)(3):
∀ε > 0, ∃N s.t. supn
an − ε < aN < an ≤ supn
an, ∀n > N.
2
26

MATH 364A ORDINARY DIFFERENTIAL EQUATIONS I
Goals:
1. Students will learn, understand, and use the fundamentalconcepts of differential equations.
2. Students will solve problems involving differential equations.
3. Students will read, understand, and use mathematicalreasoning and symbolism, and employ them to communicate their ideasin a logical organized manner.
4. Students will examine applications of differential equations toscience and engineering and learn to model problems in these areasusing differential equations.
5. Students will study the theory of differential equations,especially the use of ideas from calculus and from linear algebra in itsdevelopment.
Assessment Method: Embedded questions throughout homework,quizzes, and exams. Discourse in class and office hours.
Illustration #1: In a nefarious scheme to render Superman helpless, LexLuthor immerses him in a tank containing 12 lb of Kryptonite dissolvedin 100 gal of water. Fortunately, Lois Lane is able to puncture the tankso that the mixture flows out of the tank at a rate of 5 gal/min.Unfortunately, Luthor is pouring water containing 2 lb of Kryptonite pergallon into the tank at a rate of 4 gal/min. How much Kryptonite is inthe tank one hour later?
The student starts by defining to be the amount of Kryptonite in lbsE >a bin the tank at time minutes after Superman is immersed. The student> $
sees that is the rate at which this amount changes in lb/min and.E.>
must equal the rate at which Kryptonite enters the tank minus the rateat which Kryptonite leaves the tank. The rate at which Kryptonite entersthe tank is . To find the rate at whicha b a b# 6,Î1+6 % 1+6Î738 œ ) 6,Î738
27

Kryptonite leaves the tank, the student calculates the number of gallonsin the tank at time to be>
"!! 1+6 % & >738 œ "!! > 1+6Œ a b1+6 1+6738 738 , and concludes that the
rate is
ΠΠE > 6,"!! > 1+6 738 "!!> 738
1+6 &E 6,a b& œ ! Ÿ > Ÿ "!! Þwhen Thus the%
student arrives at the differential equation .E &E.> "!! >œ ) Þ
Recognizing this as a linear first order equation, the student rewrites it inthe form and computes the integrating factorE E œ )w Š ‹&
"!!>
/ œ / œ Ð"!! >Ñ Þ' a b&
"!!> .> & 68 "!!> &
Upon multiplying both sides of the differential equation by theintegrating factor, the student obtains ‘a b a b a b’ “"!! > E œ "!! > E E œ "!! > )& & &w w &
"!!>after which both sides are integrated to geta b a b"!! > E œ # "!! > - Þ& % The student simplifies this to getE > œ # "!! > - "!! > Þa b a b a b& "ß #
Since there were originally 12 lb of Kryptonite in the tank, the studentplugs into the above equation to get and"# 6, œ E ! œ # "!! - "!!a b a b a b&simplifies to get - œ Þ"))
"!! a b&Noting that one hour is 60 minutes, the student concludes that theamount of Kryptonite in the tank one hour later isE '! œ # "!! '! "!! '! œ ()Þ" 6, Þa b a b a b"))
"!! a b& & #ß %
Illustration #2: Suppose and are twice differentiable functions? > @ >a b a bwhose Wronskian is . Are and linearly[ > œ > %> % / ? > @ >a b a b a b a b# (>
independent? Do there exist continuous functions and such: > ; >a b a bthat and form a fundamental set of solutions of the differential? > @ >a b a bequation in the interval ?C : > C ; > C œ ! _ > _ww wa b a bReferring to the theorem that states that if the Wronskian of and ? @exists and is nonzero at some point in an interval I, then and are? @linearly independent on I, the student ascertains that and are? @linearly independent on . Referring to Abel's Theorem,_ > _ $ß &
28

the student recognizes that, when and are continuous on an: ;interval I, the Wronskian of two solutions of the differential equationC : > C ; > C œ !ww wa b a b must be either always equal to zero or never equalto zero on I. In this case, I is and the Wronskian" _ > _
[ > œ > %> % / œ > # / > œ #a b a b a b# (> (># equals zero at and does notequal zero elsewhere, so the student concludes that and cannot? @both be solutions of the differential equation and hence cannot form afundamental set of solutions of the differential equation.$ß &
29

380 Goals: 1) Students will formulate real world situations in meaningful mathematical forms,
including frequency interpretation of probability, diagrams or equations. 2) Students will recognize axioms of probability theory and be able to apply them to real-world situations. 3) Students will be able to use counting techniques to compute elementary
probability estimates. 4) Students will be able to evaluate probabilities involving continuous density
functions and recognize their uses. 5) Students will execute statistical manipulation and computation with random
variables and statistical functions in order to solve a posed problem. 6) Students will interpret statistical results about real-world situations. Assessment Method: Embedded questions throughout homework, quizzes and exams. Illustration #1: Baye’s theorem is very good when applied to diagnosing medical conditions. When the disease being checked for is rather rare, the number of incorrect diagnoses can be surprisingly high. Consider “screening” for cervical cancer. Let A be the event of a woman having the disease and B, the event of a positive biopsy. So, B occurs when the diagnostic procedure indicates that she does have cervical cancer. Assume that the probability of a woman having the disease, P(A), is 0.0001, that is 1 in 10,000. Also, assume that given that the person has the disease, the probability of a positive biopsy is 0.90. So, the test correctly identifies 90% of all women who do have the disease. Also, assume that if the person does not have the disease, the test incorrectly says that person does have the disease 1 out of every 1000 patients. 1) Find the probability that a woman has the disease given that the biopsy says she does. The student has to recognize this problem as a Baye’s Theorem problem. In order to solve such a problem, the student has to be organized and write down everything that was given in the problem and then write down in symbols what is being asked to solve. Using A and B as described in the problem, the student should be able to see that the question can be written as: find P(A|B). Also, from the problem, the student can see that
30

P(A)=0.0001, (and therefore P(Ac)=1-P(A)=1-0.0001=0.9999). Also, the student should see that P(B|A)=0.90. Finally, the student should see that P(B|Ac)=0.001. Then, using Baye’s Theorem, the student should realize the following is equal to P(A|B):
)()|()()|()()|()|( cc APABPAPABP
APABPBAP+
=
= )9999.0)(001.0()0001.0)(9.0(
)0001.0)(9.0(+
= 0.08
So, only 8% of the women identified as having the disease actually do have the disease. This is an alarmingly low accuracy rate. 2) Now, assume we have a more common disease. Assume that the probability of a woman having the disease, P(A), is 0.01, that is 1 in 100. Now, find the probability that a woman has the disease given that the biopsy says she does. That is, find P(A|B).
)()|()()|()()|()|( cc APABPAPABP
APABPBAP+
=
= )99.0)(001.0()01.0)(9.0(
)01.0)(9.0(+
= 0.90
So, 90% of the women identified as having the disease actually do have the disease. This is a much higher accuracy rate. These questions combined show the prevalence of a disease has a major influence on the accuracy of the tests. Illustration #2: Any person who has an IQ in the upper 2% of the general population is eligible to join the international society devoted to intellectual pursuits called Mensa.
31

1) Assuming IQ’s are normally distributed with mean of 100 (i.e., μ=100) and a standard deviation of 16 (i.e., σ=16) what is the lowest IQ that will qualify a person for membership? Let the random variable Y be the person’s IQ. Let yL be the lowest IQ that qualifies someone to be a member of Mensa. So, the student should see that we are looking for P(Y ≥ yL)=0.02. First, the student should realize that standard normal charts are based on cumulative probabilities. So, the student needs to look up P(Y < yL) = 1 – 0.02 = 0.98. Next, the student needs to know how to standardizing the values to read off a standard normal chart.
In order to standardize, the student has to realize that σμ−
=Y
Z .
Using this, the student should get
P(Y < yL)= 98.0)16
100()16
10016
100( =−
<=−
<− LL YZPYYP
So, from a standard normal table, the student can see by looking inside the chart, the Z value that corresponds to 0.98 is Z=2.05.
So, setting equal 2.05= 16
100−LY , we get yL=100+16(2.05) = 133
So, a person needs to get an IQ score of at least 133 to be able to join Mensa.
32

Illustration #3: As the lawyer for a client accused of murder, you are looking for ways to establish “reasonable doubt” in the minds of jurors. The prosecutor has testimony from a forensics expert who claims that a blood sample taken from the scene matches the DNA of your client. One out of 1000 times such tests are in error. Assume your client is actually guilty. If six other laboratories in the country are capable of doing this kind of DNA analysis and you hire them all, what are the chances that at least one will make a mistake and conclude that your client is innocent? Each of the six laboratories constitutes an independent trial, where the probability of making a mistake, p, is 0.001 (i.e., 1 in 1000). Let X=the number of labs that make a mistake (and call your client innocent). The student should be able to recognize this as a discrete distribution, where X is a binomial with the sample size, n, equal to 6
and p=0.001. So, P(X=k) = knk
kn −⎟⎟⎠
⎞⎜⎜⎝
⎛ )999.0()0001.0(
P(at least 1 lab says the client is innocent)=P(X ≥ 1) The student should know that the sum of all the probabilities in a discrete distribution always equal 1. So, in this case, P(X=0)+P(X=1)+P(X=2)+P(X=3)+P(X=4)+P(X=5)+P(X=6)=1 Consequently, P(X ≥ 1) = P(X=1)+P(X=2)+P(X=3)+P(X=4)+P(X=5)+P(X=6) Or, equivalently and less computationally intensive, P(X ≥ 1) = 1 – P(X < 1) = 1- P(X=0)
= 0.006. 60 )999.0()0001.0(
06
1 ⎟⎟⎠
⎞⎜⎜⎝
⎛−=
So, there is only a 0.6% chance of the lawyer’s strategy working.
33
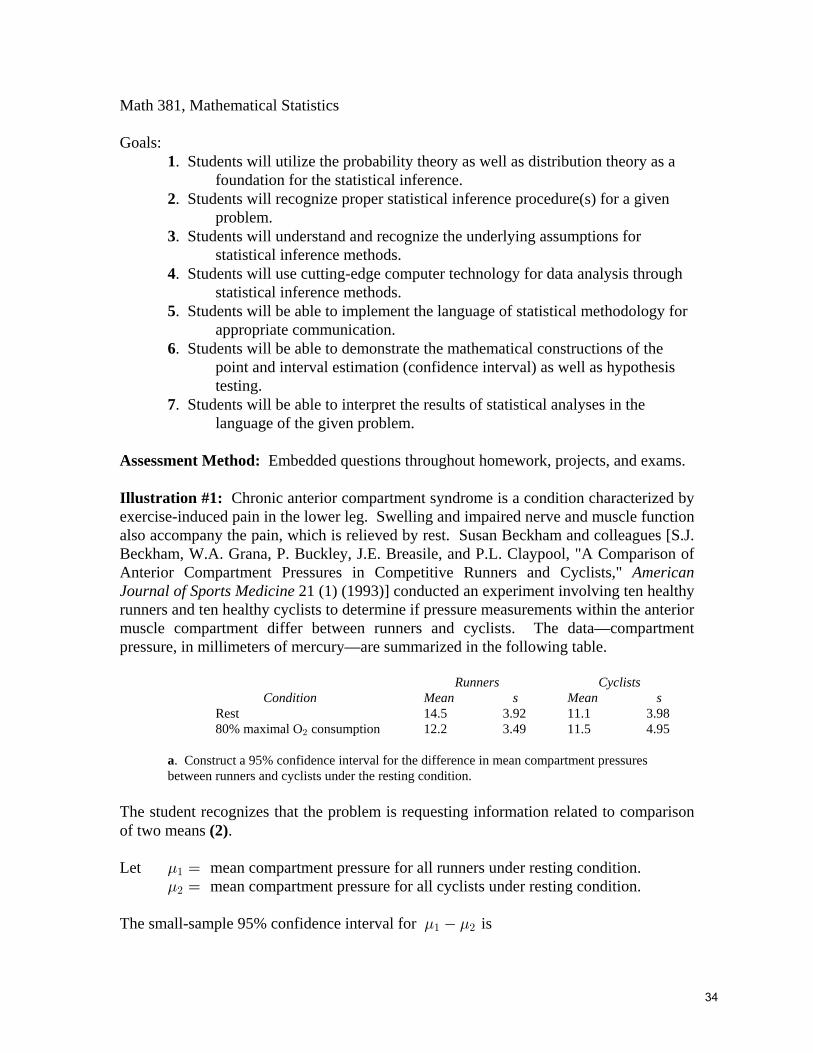
Math 381, Mathematical Statistics
Goals: 1. Students will utilize the probability theory as well as distribution theory as a foundation for the statistical inference. . Students will recognize proper statistical inference procedure(s) for a given2 problem. . Students will understand and recognize the underlying assumptions for3 statistical inference methods. . Students will use cutting-edge computer technology for data analysis through4 statistical inference methods. . Students will be able to implement the language of statistical methodology for5 appropriate communication. . Students will be able to demonstrate the mathematical constructions of the6 point and interval estimation (confidence interval) as well as hypothesis testing. . Students will be able to interpret the results of statistical analyses in the7 language of the given problem.
Assessment Method: Embedded questions throughout homework, projects, and exams.
Illustration #1: Chronic anterior compartment syndrome is a condition characterized byexercise-induced pain in the lower leg. Swelling and impaired nerve and muscle functionalso accompany the pain, which is relieved by rest. Susan Beckham and colleagues [S.J.Beckham, W.A. Grana, P. Buckley, J.E. Breasile, and P.L. Claypool, "A Comparison ofAnterior Compartment Pressures in Competitive Runners and Cyclists," AmericanJournal of Sports Medicine 21 (1) (1993)] conducted an experiment involving ten healthyrunners and ten healthy cyclists to determine if pressure measurements within the anteriormuscle compartment differ between runners and cyclists. The data—compartmentpressure, in millimeters of mercury—are summarized in the following table.
Runners Cyclists Condition Mean s Mean s Rest 14.5 3.92 11.1 3.98 80% maximal O consumption 12.2 3.49 11.5 4.95#
. Construct a 95% confidence interval for the difference in mean compartment pressuresa between runners and cyclists under the resting condition.
The student recognizes that the problem is requesting information related to comparisonof two means .(2)
Let mean compartment pressure for all runners under resting condition.." œ mean compartment pressure for all cyclists under resting condition..# œ
The small-sample 95% confidence interval for is. ." #
34

a b ÉB B „ > W " # :Î#ß 8 8 #" "8 8! " # " #
(2), (5)
The student mentions the underlying assumptions of normality and equal variances andexplains the notations involved in this process. (3), (1)
Numerical calculations can be performed by computer statistical packages or advancedgraphing calculators. Student reports the results of calculations(4)
8 8 # œ ") ß œ !Þ!#& ß > œ #Þ"!"" # !Þ!#&ß ")#!
W œ œ "&Þ'!$%#:
* $Þ*# * $Þ*)")
a b a b# #
a b a b a bÉ ˆ ‰"%Þ& ""Þ" „ #Þ"!" "&Þ'!$% Ê !Þ$ ß (Þ"" ""! "!
b. Construct a 90% confidence interval for the difference in mean compartment pressures between runners and cyclists who exercise at 80% of maximal oxygen consumption.
The student recognizes that in this case the comparisons between means is requested forrunners and cyclists who exercise at 80% of maximal oxygen consumption. (2)
The student also recognizes that similar assumptions and notations can be implementedin this case. (3), (1)
Similarly, the student reports the results of calculations (4), (5)
8 8 # œ ") ß œ !Þ!& ß > œ "Þ($%" # !Þ!&ß ")#!
= œ œ ")Þ$%"$#:
*Ð$Þ%*Ñ * %Þ*&")
# #a b
a b a b a bÉ ˆ ‰"#Þ# ""Þ& „ "Þ($% ")Þ$%"$ Ê #Þ'# ß %Þ!#" ""! "!
c. Consider the intervals constructed in (a) and (b). How would you interpret the results you obtained?
The student notices that both intervals above contain 0, as a result it cannot be concludedthat a difference exists in mean compartment pressure between runners and cyclists ineither condition. (7)
d. Is there sufficient evidence to justify claiming that a difference exists in the mean compartment pressure between runners and cyclists who are resting? Use .! œ Þ!& What can be said about the associated -value?:
35

In this case, the student recognizes that the language of the problem is hypothesis testing.(2)
The student formulates the problem and performs necessary computations. (1), (3), (4),(5)
L À œ !! " #. . L À Á !+ " #. .
The test statistic is
> œ œ œ "Þ*#a bÉ É ˆ ‰B B !
W
"%Þ&""Þ"
"&Þ'!$%
" #
:" "8 8" #
" ""! "!
The rejection region is k k> > œ #Þ"!" ÞÞ!#&ß ")
The value of does not belong to the rejection region. The student reports that> œ "Þ*#L! is not rejected, i.e., there is insufficient evidence to indicate a difference in the meansof compartment pressure for all runners and cyclists at resting condition. (7)
The student can report the -value as -value , that is consistent with the: !Þ!& : !Þ"!conclusion given above. (5)
e. Does sufficient evidence exist to permit us to identify a difference in the mean compartment pressure between runners and cyclists at 80% maximal O consumption?#
Use What can be said about the associated -value?! œ Þ!& Þ :
The student recognizes that here the testing is between the means of compartmentpressure of runners and cyclists at 80% maximal O consumption. # (2)
The student also recognizes that similar assumptions and notations can be implementedin this case. Similarly, the student formulates the problem in the language of(3), (1)hypothesis testing and performs necessary computations. (1), (3), (4), (5)
The test statistic is
> œ œ !Þ$'&"#Þ#""Þ&
")Þ$%"$ É ˆ ‰" ""! "!
The rejection region is . Since the value of does notk k> > œ #Þ"!" > œ !Þ$'&!Þ!#ß ")
belong to the rejection region, the student concludes that there is insufficient evidence toindicate a difference in the mean compartment pressure between runners and cyclists at80% maximal O consumption. # (7)
The associated -value is reported as:
36

: !Þ#!-value . (5)
Illustration #2:
Let denote a random sample from the normal distribution with] ß ] ß á ß ]" # 8
and . We wish to estimate the value of .I ] œ Z ] œa b a b" "# #. 5 5
. DefineaZ œ ßa b8" W#
#5
where . State the distribution of .W œ ] ] Z# "8"
3œ"
8
"#a b ! ˆ ‰
The student recognizes that is distributed as chi-square with degrees ofZ 8 "freedom, i.e., . Z µ \ 8 "#a b (1)
b a.. The random variable defined in is pivotal quantity. Make use of to derive aZ Z 100% one-sided upper confidence interval for (i.e., a CI of the forma b" ! 5#
Also derive a 100% one-sided upper confidence interval for .! Ÿ Ñ Þ " s5 5 ! 5# #Y a b
By using the information in part ., the student formulates the problem. a (1), (2), (6)
" œ T \ Ÿ Z œ T \ Ÿ! ˆ ‰ Š ‹# #" ß 8" "Bß 8"
8" W! 5
a b #
#
œ T ŸŠ ‹5# 8" WBa b #
#" ß8"!
Thus, 100% CI for is , where is the value of a b" ! = W! 5 5# # # #8" =Ba b #
#" ß 8"!
calculated from the sample. (5)
By taking the square root, the student obtains a 100% CI for asa b" ! 5
! Þ5 Ê a b8" =\
#
#" ß 8"!
(5)
c. A company wishes to experimentally establish the amount of variability to expectfrom a precision measuring device that they manufacture. To accomplish this, they select at random 30 identical such meters and use them to make measurements of the same item. Thus, except for the inherent variability in the meters, all measurements should be the same. The data so obtained are assumed to be normally distributed with mean and. variance . The data may be summarized as follows: units, and5# 8 œ $! ß C œ &Þ"$' squared units. Compute a 90% one-sided upper confidence interval for = œ !Þ!!"$%& Þ# 5
From part ., the student calculates a 90% CI for asb 5
! Ê ! !Þ!%%%5 5Éa ba b$!" !Þ!!"$%&"*Þ('(( (4)
37

The student reports that the interval constructed in this manner encloses the amount ofvariability expected from a precision measuring device that the company manufactures90% of the time in repeated sampling. Hence, we are fairly certain that this particularinterval encloses . 5 (7)
38

Self Review Math 410 April 2006
Goals
1) Students will examine the development of modern mathematics with an emphasis on under-standing the connections between problems, ideas, and theories. This can include readingand discussing original material.
2) Students will analyze and write with clarity, coherence, and concision. They will considerproblems in their historical context, formulate hypotheses that account for theoreticalapproaches to these problems, and support their claims with arguments tied to original orsecondary sources.
Assessment Method 1. Written responses to specific questions. Can be in the form of anessay or problem or a mixture.
Illustrations.
1) Given a regular polyhedron, the circumsphere is the sphere that passes through the vertices(the smallest sphere that contains the polyhedron) and the insphere is the sphere thatpasses through the face-centers (the largest sphere that the polyhedron contains).
In The Harmony of the World, Kepler describes a model for the solar system that’s basedon the five platonic solids. Briefly discuss how this model works. (The circumsphereand insphere terminology might help.) To what sort of paradigm of explanation doesthis appeal? How does the spirit of this approach fit into the way in which science wasdeveloping at that time?
Find the ratio of the radii of the circumsphere and insphere for the cube, regular octahe-dron, and regular tetrahedron.
2) Use Descartes’s method of normals to find the slope of the line tangent to the curve givenby y = x3 at an arbitrary point (x, y). Use Fermat’s method of adequation to find thesame result. (You needn’t follow their procedure exactly. You can use more modernnotation and ideas to convey the ideas.) What are the advantages and disadvantages ofeach compared to the other? What conceptual innovations make their methods possible?
3) By means of an illustrative problem or two, discuss the similarities and differences betweenthe notions of indivisibles and infinitesimals. (One approach would be to solve a problemusing each idea.) Treat the application of these concepts to both the problem of findingtangents to curves and to the classic problems of finding the area bounded by curves.What advantage does one have over the other? What are their relative disadvantages?
4) Use Newton’s general binomial theorem to compute—in the manner of the fluxionalcalculus—the first fluxion of the fluent
xp/q
where p and q are integers. Carefully discuss Newton’s conception and use of fluentquantities and their fluxions. What are the crucial or suspicious features of this derivation?
39

5) Use a specific and relatively simple example to present Cramer’s paradox for algebraiccurves. Carefully discuss what’s paradoxical here. In terms of your example, illustratehow to resolve the puzzle. In a theoretical sense, what makes the paradox possible?(Could the problem have occurred in classical Greece, say?)
6) Without giving technical details, how does Newton go about deriving and “proving” thegeneralized binomial theorem? By the standards of the time, to what extent can thetwo activities—derivation and proof—be distinguished? How does Newton’s work herecompare and contrast with mathematical work today?
Assessment Method 2. In-class presentations on a reading or problem.
Illustrations of what students will consider and treat.
1) What’s the problem at hand? How does the author approach it? What ideas and tech-niques are in use—both explicitly and implicitly? What’s the intellectual, technological,and social context?
2) What concepts does the reading rely upon? What’s the author’s point of view? Whatassumptions does the author make? What philosophical issues and historical questionsdoes the reading suggest? What does the reading tell us about how math was done at thetime?
3) What are the crucial points in the development of an idea or theory?4) What new ideas are involved? How do they arise from and connect with existing no-
tions and theories—particularly ones that we’ve seen in previous readings? What sort ofconceptual change is taking place?
5) What role does language and notation play in the attempt to explain things?6) In what ways did the ideas and developments in the reading influence subsequent mathe-
matics?
Assessment Method 3. Independent course project with substantive mathematical and his-torical content on a topic that is somewhat beyond the class material.
Illustrations.
1) In what ways did the development of the ‘function’ concept influence coordinate geometry?Compare algebraic and graphical representations of functions.
Source: C. Boyer, History of analytic geometry2) Investigate the interplay between mathematics and the making of maps. What problems
did the latter pose for the former? How did this interaction influence the development ofmathematical theory?
3) Examine the development of some of the statements in plane geometry that are equiv-alent to Euclid’s parallel postulate. (See below.) How was a specific statement foundto be equivalent to the parallel postulate? What impact on geometric thought did thesediscoveries have? Show how the parallel postulate comes into play.
2
40

• There are non-congruent similar triangles.• Three points determine a circle.• The angle sum of any triangle is π radians.• There are such things as rectangles.
4) Examine paradoxes of indivisibles—arguments based on indivisibles that “show” that twofigures having different areas have the same area. In response, how was the method ofindivisibles defended? What do these cases tell us about mathematical thought and proof?In what ways did these controversies influence the development of math?
5) An indivisible can be thought of as a “sum-of-limit” approach to integration. Describethis way of looking at the issue and compare it to Riemann’s “limit-of-sums” method.
6) How did Zeno’s paradoxes influence mathematical and philosophical thought in the Renais-sance or the Enlightenment periods. In particular, to what extent was calculus a responseto the paradoxes?
7) How did the evolution of calculus depend on and influence ideas of infinity? Was a par-ticular notion of “the infinite” required for calculus to develop beyond a certain point?
8) Archimedes carefully distinguished methods of discovery and proof. Can one make asimilar distinction regarding infinitesimal and “limit” approaches to calculus? Might themethod of infinitesimals have been a tool of discovery while “rigorous” argument requiredlimit-taking or exhaustion? Exhibit this sort of distinction with an example where onemust know the answer in advance in order to make a limit argument.
9) The Hughes-Hallet, Gleason text Calculus (the so-called “Harvard calculus”) introducesintegration as the inverse of differentiation. In many (most?) modern texts this relation-ship appears as a result of defining the integral as an area or Riemann sum. Study thehistory of presentations of integration and the fundamental theorem of calculus. Is theHarvard approach new? What’s your opinion concerning the effectiveness of the variousstyles?
10) Modern math often appears as the work of an elite class of white European men. Whatsocial conditions provided for and promoted this state of affairs? What influence did thisbias have on education in general and math education in particular? To what extent coulddevelopments in non-European cultures have influenced thinking in Europe? Speculate onhow the history of math could have been quite different had this neglect not taken place?
11) In the 17th century, scientific societies emerged for the first time—principally, in France,Italy, and England. How did they function and what did they promote? In what waysand to what extent did they foster new thinking and, contrarily, in what ways and to whatextent did they restrict the development of new ideas and theories?
12) Prepare a detailed plan for a high-school math course (or lesson) that involves (modern)historical issues? What pedagogical role do the historical features play? What activitieswill the students engage in? How does this approach promote understanding and deepenthe learning experience for students? What do you want students to get from the course(or lesson)?
Source: F. Swetz, ed. Learn from the masters!
3
41

MATH 444: Introduction to Abstract Algebra
Course description
1 Target audience
MATH 444 is required for all students studying for a Bachelor of Science in Mathematics (the“general option”) or for a Bachelor of Science in Mathematics: Option in Mathematics Education.These students, usually seniors, have mostly already had an introduction to techniques of proof inMATH 233 and a previous course in number theory or linear algebra, MATH 341 or MATH 347.
MATH 444 is also sometimes recommended by the Graduate Advisor for students in our Mastersprogram who may not be prepared for MATH 540A.
2 Goals
• Familiarity with specific topics.
See the list of topics below.
• Practice in studying abstract systems defined by formal axioms.
Students also receive such practice in other courses, notably with the definitions of vectorspaces in MATH 247 and MATH 347 and of metric spaces in MATH 361B. However, this ideadominates MATH 444 from beginning to end. Every MATH 444 student encounters formaldefinitions of groups and rings, and many courses also cover such variations at semigroups,monoids, fields, domains, algebras, principal ideal domains, and euclidean domains. Therepetition of the pattern teaches students that we are not simply introducing them to specificstructures. Rather, we are cultivating the skill of using formal axioms to capture the essentialqualities of an object and to find common principles among disparate examples. We then workfrom these formal axioms to prove theorems that are then valid for all the examples.
• Training in writing proofs.
Many mathematics courses at CSULB include some proofs, but the ones that are most focusedon proofs are MATH 233, MATH 361AB, and MATH 444. MATH 233 is a lower-divisiontransition course designed to prepare students for later work. MATH 361 focuses on the“δ − ε” style of proofs used in analysis. Students majoring Math Education are not requiredto take MATH 361, so for these students, MATH 444 is the most sophisticated training theywill receive in writing proofs.
• Preparation for graduate-level algebra.
Every Masters and Ph.D. program in mathematics includes a core algebra course as a staplecomponent of first year study. (At CSULB, this is the MATH 540AB sequence; at UCLA, itis MATH 210ABC.) Although these courses generally develop group theory from scratch, they
42

move at such a rapid pace that in practice, students need to have had some prior exposure toboth the material and the methods of algebra.
• A formal introduction to symmetry.
The symmetry of a formal system (for example, a geometric object such as a square) is aconcept that many students grasp intuitively, and many of our Math Education majors willexplore the idea with their high school students. In MATH 444 we develop formal frameworksin which such ideas can be studied.
3 Topics
The following topics are always covered in MATH 444:
• groups
– subgroups
– common examples
∗ symmetric groups∗ dihedral groups∗ the Klein 4-group∗ the finite quaternion group∗ the unit group of the integers mod n
– cyclic groups
– cosets
– Lagrange’s Theorem
– normal subgroups
– quotient groups
– homomorphisms and isomorphisms of groups
– kernel and image
– the Fundamental Homomorphism Theorem
• rings
– the integers and the integers mod n
– polynomial rings
– integral domains
– ideals
– quotient rings
– homomorphisms of rings
43

Here are some topics that may be covered in MATH 444:
• matrix groups
• alternating groups
• direct products
• simple groups
• Cayley’s Theorem
• Cauchy’s Theorem
• conjugacy
• semigroups
• monoids
• fields
• algebras
• euclidean domains
• prime and maximal ideals
• characteristic
• finite fields
• principal ideal domains
4 Assessment
Students in MATH 444 always complete homework assignments and exams. Other methods ofassessment can include quizzes, independent projects, and classroom presentations. In all methods,students both calculate examples and prove general theorems.
We present two illustrations of problems that were assigned as homework in Spring 2005, withcomments on their intended purpose.
1. Show Cayley’s Theorem in action by finding an isomorphic copy of the finite quaternion groupQ8 in the symmetric group S8:
(a) Write the elements of Q8 in the form {e, i, i2, i3, j, ij, i2j, i3j}.
44

(b) Figure out which two permutations in S8 correspond to i and j, as we did in class. (Youdon’t have to do this for every element of Q8, just i and j, since every other element canbe written in terms of i and j. In other words, i and j generate Q8.)
(c) Now that you know ϕ(i) and ϕ(j), figure out the permutations corresponding to the otherelements of Q8 by using the homomorphism law ϕ(g1g2) = ϕ(g1)ϕ(g2).
(d) We know that in Q8, i and j satisfy the relations i4 = e, j4 = e, and ji = (i2)ij. Checkthat these same relations are satisfied for the ϕ(i), and ϕ(j) you found in S8.
Comments:
A common quandary in theoretical courses is how to convey the workings of the proof of amajor theorem to the students. We can force them to memorize the proof and regurgitate it,but they may still not understand it. We can have them solve problems using the theorem,but many theorems can be applied with no knowledge at all of why they are true. We can askthem to prove similar theorems, but the ideas may be too sophisticated to expect students tocome up with them on their own.
This problem, which can be solved by fairly easy calculation, is an attempt to get studentsto understand the proof of Cayley’s Theorem, which involves representing a group as a set oftransformations on an external set (in this case, the group itself). Students must work throughthe proof in the context of a specific example, the finite quaternion group.
On a deeper level, we are trying to inculcate the concept that every group can be consideredas a group of transformations.
(a) This part gives students practice calculating in the finite quaternion group, an importantexample in abstract algebra. It also reminds them of the process of trying to write allelements in a group in terms of as few generators as possible. Finally, it establishes anorder for the elements of the group, which is necessary to fix a particular representationin the symmetric group. Since we are giving them a particular order, all students will usethe same order, so they can check their answers to the calculations in later parts withother students.
(b) To solve this part, students must first do a significant amount of calculation, multiplyingi and j by every other element of the group and then simplifying using the generatingformulas. They must then translate their answers into permutations in the symmetricgroup.The amount of calculation involved is enough to convince the students that doing it forall eight elements of Q8 would be truly cumbersome. This reinforces the power of usinggenerators to control all elements of a group.
(c) This reminds students of the homomorphism law and forces them to use it extensively.It also gives them lots of practice in multiplying permutations in a nontrivial symmetricgroup. (Most examples in MATH 444 do not go beyond S3 or S4.) It illustrates the pointthat because of the homomorphism law, a homomorphism is determined solely by itsaction on the generators of a group. Finally, it gives them a concrete set of permutaionsin S8 that correspond to the image of Q8.
(d) This gives students further practice in calculating in the symmetric group. They arechecking that their subset of S8 does indeed behave identically to Q8. This also allows
45

them to check all their previous work, so that by the time they are finished, they will bealmost certain that everything is right.More importantly, this teaches the idea that groups are determined not just by theirgenerators, but by a set of relations, and it is usually preferable to make the relations asbrief as possible. In this case, Q8 was originally defined using the relation ji = −k; thisshows students that the same relation can be written in terms of i and j only. In orderto check that a homorphism is well-defined, it is necessary to check that the relations onthe generators of the domain are still valid in the image.
2. Suppose a, b are two elements in a ring such that ba = 1 but ab 6= 1.
(a) Prove that the element v = 1 − ab is idempotent, i.e. that v2 = v. Prove that v is notequal to either of the trivial idempotents, 1 or 0.
(b) Prove that for all n = 0, 1, 2, . . ., the element cn = anv + b is a left inverse for a.
(c) Prove that if cn = cm, then n = m. (Hint: If n > m, then left multiply the equationcn = cm by bn.) Conclude that if an element is left invertible but not right invertible,then it has infinitely many left inverses!
(d) For the ring of infinite matrices we studied in class, calculate what each cn is.
Comments:
This problem walks the students through a relatively lengthy proof. Most of the mechanics canbe done by straightforward calculation, but the logic is subtle at times. It gives them concretepractice working in a system in which one of the long cherished principles of elementaryarithmetic, commutativity, does not hold. For the first three parts of the problem, they mustwork in an abstract system, and in the final part, they calculate a concrete example of whatthey have proved.
(a) The students first learn a new concept, idempotence, which is introduced in the context ofthe problem rather than in a formal definition. They must immediately use the definitionin a proof. The actual proof is a quite simple calculation following immediately from thedefinition.A common reaction from students upon seeing the equation v2 = v is to factor v(v−1) = 0and conclude that v = 0 or v = 1. This problem forces students to challenge thatassumption and recognize the existence of nonzero elements that multiply to zero. Infact, they must prove that v 6= 0 and v 6= 1. The former is trivial from the assumptionthat ab 6= 1, but the latter requires a slightly longer chain of logic.
(b) The phrase “for all n = 0, 1, 2, . . .” makes this look like an induction problem, and manystudents will immediately try to apply some form of induction. In fact, it is a simplecalculation following from the definition of left inverse. One of the lessons of our algebracourses is that many proofs can be derived simply by careful invocation of the definitionsof the terms in the hypothesis and conclusion.
(c) This proof would be quite tricky without the hint. Even with the hint, students mustargue the contrapositive, recognize the symmetry between n > m and m > n, do anontrivial calculation, and finally realize that the result v = 0 contradicts something thatthey had proved in an earlier part of the problem.
46

Students must then recognize the import of what they have just proved, namely thatthe elements cn are all different and that therefore the element a has infinitely many leftinverses. Again, this violates a cherished assumption, uniqueness of inverses, that hasheld true through the linear algebra they saw in MATH 247 and even as recently as thegroup theory that they saw earlier in MATH 444.
(d) Students had at this point already seen the following example in class:
a =
0 0 01 0 0 · · ·0 1 0
.... . .
, b =
0 1 00 0 1 · · ·0 0 0
.... . .
They must now calculate
v =
1 0 00 0 0 · · ·0 0 0
.... . .
, c0 =
1 1 00 0 1 · · ·0 0 0
.... . .
, c1 =
0 1 01 0 1 · · ·0 0 0
.... . .
, . . . .
These relatively simple matrices give a tangible representation of the elements calculatedin the first three parts of the problem. They also make it somewhat intuitively clear thatan element may have infinitely many distinct inverses.Students with better training from linear algebra will understand the correspondence be-tween matrices and linear transformations on a vector space. Under this correspondence,all the equations from the first three parts make intuitive sense. The initial elements aand b are right and left shift operators, which are inverses of each other on one side, butnot on the other. v is projection to the first coordinate axis, and a projection is alwaysidempotent even through it may not be the identity or the zero map. The right shifthas many left inverses, since it does not matter what happens to the first coordinate axisafter the right shift is applied and before the left shift is applied.
47

470 Goals:
Students will be familiar with the physical significance of the basic partial
differential equations of physics: the Laplace equation, the wave equation, and the heat equation.
Students will be able to classify second-order partial differential equations. They will be able to solve transport equations and understand their
connection to wave propagation. They will understand the significance of the auxiliary conditions of the
basic equations: boundary conditions, initial conditions, and mixed conditions.
They will be able to solve these partial differential equations with appropriate boundary conditions on simple domains by the method of separation of variables.
They will become familiar with basic facts of Fourier series, sine series, and cosine series, and be able to utilize them in solving initial and boundary value problems.
Students will understand and be able to contrast the fundamental properties of these basic partial differential equations.
Assessment Method: Embedded questions throughout homework, quizzes and exams. Illustration #1: Carefully derive the equation of a string in a medium in which the resistance is proportional to the velocity. Illustration #2: Interpret the physical significance of the homogeneous Neumann boundary condition for the one-dimensional heat equation. Illustration #3: Classify each of the equations. (A list of several second-order equations is given.) Illustration #4: Solve the first-order equation 032 =+ xt uu with the auxiliary condition when . xu sin= 0=t Illustration #5: Solve the boundary value problem for the Laplace equation on the rectangle with non-homogeneous boundary condition. Illustration #6: Show that there is no maximum principle for the wave equation. Illustration #7: Solve the initial value problem for the one-dimensional wave equation for general initial data.
48
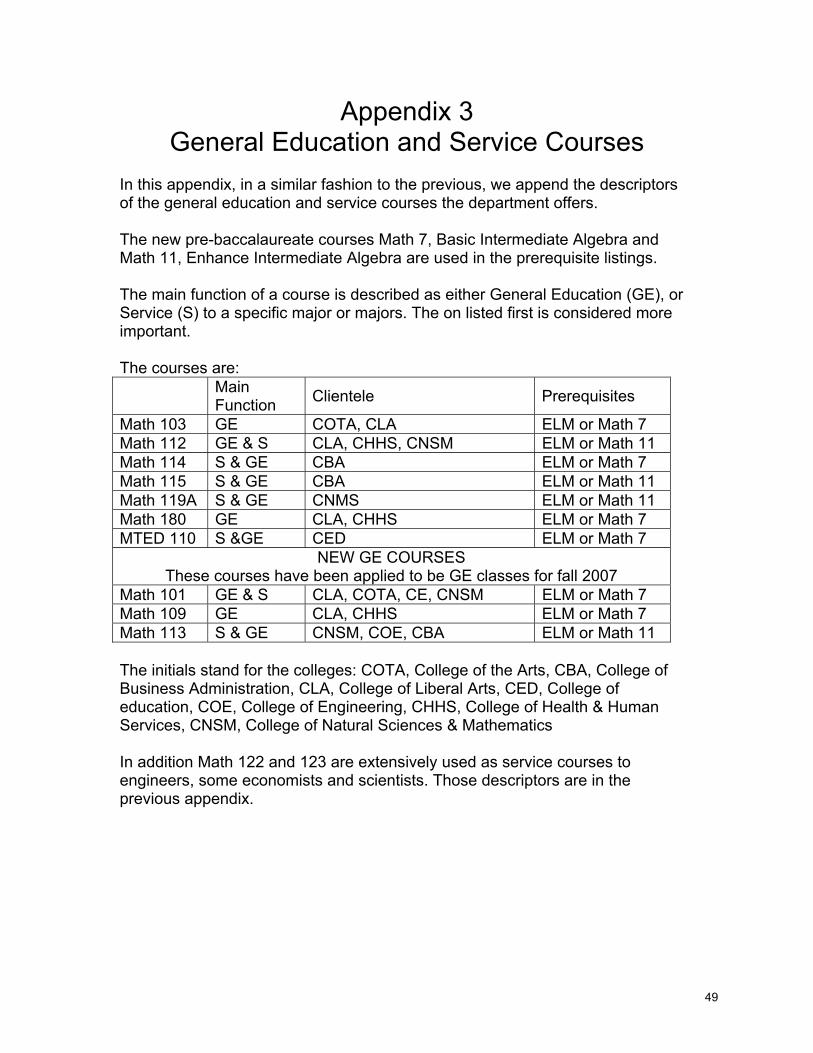
Appendix 3 General Education and Service Courses
In this appendix, in a similar fashion to the previous, we append the descriptors of the general education and service courses the department offers. The new pre-baccalaureate courses Math 7, Basic Intermediate Algebra and Math 11, Enhance Intermediate Algebra are used in the prerequisite listings. The main function of a course is described as either General Education (GE), or Service (S) to a specific major or majors. The on listed first is considered more important. The courses are:
Main Function Clientele Prerequisites
Math 103 GE COTA, CLA ELM or Math 7 Math 112 GE & S CLA, CHHS, CNSM ELM or Math 11 Math 114 S & GE CBA ELM or Math 7 Math 115 S & GE CBA ELM or Math 11 Math 119A S & GE CNMS ELM or Math 11 Math 180 GE CLA, CHHS ELM or Math 7 MTED 110 S &GE CED ELM or Math 7
NEW GE COURSES These courses have been applied to be GE classes for fall 2007
Math 101 GE & S CLA, COTA, CE, CNSM ELM or Math 7 Math 109 GE CLA, CHHS ELM or Math 7 Math 113 S & GE CNSM, COE, CBA ELM or Math 11 The initials stand for the colleges: COTA, College of the Arts, CBA, College of Business Administration, CLA, College of Liberal Arts, CED, College of education, COE, College of Engineering, CHHS, College of Health & Human Services, CNSM, College of Natural Sciences & Mathematics In addition Math 122 and 123 are extensively used as service courses to engineers, some economists and scientists. Those descriptors are in the previous appendix.
49

112 Goals:
Students will formulate real world situations in meaningful mathematical forms, including graphs, tables, diagrams or equations.
Students will execute mathematical manipulation and computation in order to solve a posed problem.
Students will recognize, have knowledge of, be able to combine and evaluate fundamental mathematical expressions and functions such as polynomials and exponentials.
Students will exhibit familiarity and ease of use of basic geometric and arithmetical facts such as the Pythagorean Theorem, similar triangles and ratios.
Students will interpret the mathematical result about real world situations derived mathematically.
Students will be able to use counting techniques to compute elementary probability estimates.
Assessment Method: Embedded questions throughout homework, quizzes and exams. Illustration #1: Ornithologists have determined that some species of birds tend to avoid flights over large bodies of water during daylight hours, because air generally rises over land and falls over water in the daytime, so flying over water requires more energy. A bird is released on an island 5 miles from shore. The nesting area is 12 miles down the straight shore from the point on the shore directly opposite the island. The bird uses 10 kcal/mi to fly over land, while it uses 14 kcal/mi to fly over water. Consider the following questions:
How much energy will the bird use if it flies directly from the island to the nesting area?
5
12
island
shoreline
What is expected is that the student will visualize the information in the form of a triangle : Thus, by letting denote the distance from the island to the nesting area, the student would arrive, by the use of the Pythagorean Theorem , to
d
2 2 25 12 25 144 169d = + = + = , and so one would conclude that 13d = miles. Naturally, the student should continue to answering the question:
The bird will need 13 14× =182 kcal to accomplish that trip.
50

If the bird flies directly over the water into land and then flies over land to the nesting ground, how much energy will the bird need then?
Continuing with the triangle model, the answer is readily arrived at , , :
5 14 12 10 70 120 190× + × = + = kcals. Now the more sophisticated question:
Suppose the bird is to fly directly over the water to some point on the shore between the nearest point and the nesting place, and then fly over land to the nesting place. Can the bird save energy by doing this? If so can the bird just use 170 kcals? If so where should the bird fly?
The student is then expected to come up with a variable, x , , which could represent the distance between the point on shore nearest the island and the point on the shore that the bird will fly to, so the picture now looks like x Now the student is expected to use the Pythagorean Theorem once again, and express the distance that the bird is flying over water as a function of y x :
2 25 2y x= + , so 225y x= + , . Additionally, the distance the bird is flying over land, 12z x= − . Thus the energy E that the bird will consume when it flies toward the point at x is given by the function:
( ) ( )225 x +14 10 12E x x= + − , .
dentify hat
The student could get a graphical representation of this function: and see a ready answer for the first part of the question
, , : Indeed, the bird can spend less energy if it flies to some point on shore different from the nearest point and then along the shore. Also from the picture, the student can itwo destinations that the bird could fly to in order to use exactly 170 kcals. Wis needed now is to solve the equation
165
170
175
180
185
190
195
0 5 10 15
( ) ( )214 25 10 12 170E x x x= + + − = , . Simplifying, it becomes
214 25 170 120 10 50 10x x x+ = − + = + ; or 27 25 25 5x x+ = + . Squaring both sides,
( ) ( )22 249 25 25 5 625 250 25x x x+ = + = + + x . Simplifying one more time,
51

224 250 600 0x x− + = . Using the quadratic formula,
250 4900 250 70 320 180 20 15or or48 48 48 48 3 4
x ± ±= = = = ,
and finally the student should conclude that that the bird should toward a point that is either 2
36 miles or 343 miles away along the shore from the nearest
point to the island. Ultimately, you would like the student to understand that if the bird flew to any point between the two points obtained in the previous problem, the bird would be using less than 170 kcals. Those students with an inquiring mind, might develop the curiosity of what is the optimal solution for the bird and how few kcals will it need to arrive at the sanctuary. Illustration #2: A poker hand, consisting of 5 cards, is dealt from a standard deck of 52 cards. Find the probability that the five cards are in the same suit. The first issue is that the student will realize that the computation of the denominator of the fraction that will give the probability is of utmost importance,
, and that that denominator is ( )52,5 2,598,960C = the number of ways of choosing 5 objects out of 52 objects. Second, the student will compute the numerator of that fraction as ( )4 13,5 4 1287 5,148C× = × = , the 4 coming from
the number of choices for the suit, and ( )13,5C as the number of ways of choosing 5 cards from the 13 cards in that suit. Taking the ratio, the student will
give 5148 .0019802598960
= , or approximately 0. % as the probability that the five
cards are in the same suit .
2
Alternatively, the student could think of a different model and suggest computing the probability that the five cards are hearts, and then multiplying the answer by 4
. Thus the first card being a heart has probability 1352
, and then the
probability that the second card is a heart, given that the first one was, is 1251
,
and then the third one, 1150
, and the fourth card, 1049
, and the final card being a
heart: 948
. The answer should then be:
13 12 11 10 94 0.00198052 51 50 49 48
× × × × × = , .
52

114 Goals:
Students will understand matrices as collectors of information, execute key operations involving matrices, and use these operations to solve relevant problems.
Students will translate real world situations into systems of linear equations, by identifying the unknowns and establishing relations among them. Students will use Gaussian Elimination to find and describe the meaningful solutions to the problem.
Students will be able to use counting techniques to compute probability estimates.
Students will use more sophisticated methods in probability theory such as Random Variables, Bayes’ Theorem, Expectation and the Binomial Distribution to solve deeper probability problems.
Students will be familiar with the Central Limit Theorem and how to use it in order to do estimation of probabilities.
Students will, at all times, be able to interpret the mathematical result about real world situations derived mathematically.
Assessment Method: Embedded questions throughout homework, quizzes and exams. Illustration #1: David is an independent supplier of restaurant supplies. He needs to supply three different customers with vegetables and with meat. The first customer, Mr. Smith requires 20 crates of vegetables and 50 pounds of meat, the second, Ms. Jones, requires 18 crates of vegetables and 60 pounds of meat, while the third one, Mr. Colt requires 30 crates of vegetable and 30 pounds of meat. David can buy the supplies at 4 different wholesalers, Pavilions (P), Vons (V), Albertson’s (A) and Ralph’s (R). Pavilions charges $12 for a crate of vegetables and $45 for pound of meat. Similarly, Vons charges $15 and $40 respectively for vegetables and meat, Albertson’s prices are $18 and $37 for vegetables and meat while those of Ralph’s are $26 and $34 respectively. For each of the three orders, David is going to order both vegetables and meat from only one of the four suppliers (in order to get free delivery). How should David order his supplies? The student should first store the required purchases in a 2 3× matrix where the rows stand for vegetables and meat respectively and the columns for Mr. Smith,
Ms. Jones and Mr. Colt respectively: . Similarly, then information
on the prices should be collected in a where the rows stand for Pavilions, Vons, Albertson’s and Ralph’s and the columns are vegetables and meat
20 18 3050 60 30⎛⎜⎝ ⎠
⎞⎟
4 2×
53

respectively: . Finally, using matrix multiplication
to obtain the matrix , the student should conclude that for Mr.
Smith the groceries should come from Albertson’s, for Ms. Jones from Ralph’s and for Mr. Colt from either Von’s or Albertson’s , .
12 4515 4018 3726 34
⎛ ⎞⎜ ⎟⎜⎜ ⎟⎜ ⎟⎝ ⎠
⎟
⎟
12 4515 4018 3726 34
⎛ ⎞⎜ ⎟⎜ ⎟⎜ ⎟⎜ ⎟⎝ ⎠
20 18 3050 60 30⎛ ⎞⎜ ⎟⎝ ⎠
2490 2916 17102300 2670 16502210 2544 16502220 2508 1800
⎛ ⎞⎜ ⎟⎜⎜ ⎟⎜ ⎟⎝ ⎠
Illustration #2: One rooster is worth five dollars; one hen is worth three dollars; while three young chicks are worth one dollar. Buying 100 fowls with 100 dollars, how many roosters, hens and chicks? If we let R stand for the number of roosters, H for the number of hens and C for the number of chickens, then the conditions of the problem easily translate to the following two equations :
R H C+ + = 100 135 3 10R H C+ + = 0
Or in augmented matrix notation this becomes13
1 1 1 1005 3 100⎛ ⎟⎜ ⎟⎜ ⎟⎜ ⎟⎜⎝ ⎠
⎞ . This matrix
reduces to 4373
1 0 1000 1 200
−⎛ − ⎟⎜ ⎟⎜ ⎟⎜ ⎟⎜ ⎟⎝ ⎠
⎞ so we have that 4
3100R C= − and 7
3200H C= − . In
order for the solutions to make sense, we need to have C to be a multiple of 3, and also since and , we must have
and , so the only possibilities for C are 75, 78, 81 and 84. In fact, the solutions are ,
0R≥ 0H ≥75C ≥ 85C ≤ R H C
12 4 84 8 11 81 4 18 78 0 25 75
Illustration #3: Five people: Mr. A, Ms. B, Mrs. C, Mr. D and Mr. E will stand side by side to pose for a picture. What is the probability that Mr. D and Mr. E will not be standing next to each other? The student should immediately realize that the number of ways that the five people can pose for a picture is 5! 120= . The student should also realize that it is easier to count the number of ways Mr. D and Mr. E can stand together, and hence use the complement of what is wanted . So one is reduced to counting the number of ways of arranging A, B, C, D and E for a picture so that D and E stand together. First decision is making D and E stand together, one has two options for it: DE and ED. After that one has to arrange 4 elements: A, B, C, and DE, for which there are 24 ways of doing it, so in total one has 2 2 4 48× =
54

ways. So there are 120 48 72− = ways to arrange A, B, C, D and E for a picture so that D and E do not stand together, and hence the probability is 72 3
120 560%= = , .
Illustration #4: A university claims that 85% of its students graduate. One is to test their veracity by setting up a test of their claim. One selects 12 students at random, and sees how many of them graduate. The decision is to accept the school’s claim if at least 8 of the 12 students graduated. What is the probability that one comes to the wrong conclusion if indeed the university’s claim is true? Let Y denote the number of students among the 12 that graduated, so Y is a binomial random variable with and . Thus one will be wrong if one encounters , thus one needs to compute , and the relevant values are:
12n= .85p =
7Y ≤ ( ) (7 1 8P PY Y≤ = − ≥ )
8 9 10 11 12 0.068284 0.171976 0.292358 0.301218 0.142242
with a sum of 0.976078, and so one will be wrong 2.39% of the time, a truly negligible possibility , . Illustration #4: A company manufactures perfume sprayers. They consider that 5% of their production is defective. A random sample of 600 sprayers is tested, which is large enough to treat as a normal approximation to the binomial , . In that sample one expects 30 defective ones . One also has that the standard deviation 600 .05 .95 5.34σ= ⋅ ⋅ ≈ atomizers. What is the probability then of each of the following?
At least 35 defectives? Since one is 5 .936=σ
above the mean, the
probability is 17.62% by inspection of the normal table , .
Between 25 and 35 defectives? Easily, 64.76% , .
Suppose one has obtained 50 defectives in the sample—should one worry that perhaps the defectives amount to more than 5%? Since the probability of being 3.7463 standard deviations above the mean is only .02%, one can consider the production to be more defective than was claimed , .
55

180 Goals:
Students will think statistically as evidenced by problem-solving in statistics.
Students will use statistics to create quantitative models of real-world situations, and then use the models to answer questions, make predictions, or make decisions about those real-world situations.
Students will demonstrate knowledge of how data is properly collected or generated, including common sources of bias in surveys and experiments.
Students will create and interpret numerical summaries and graphical displays of data.
Students will decide on appropriate sampling techniques for the purpose of making statistical inferences (i.e., generalize from the sample to the population).
Students will communicate the results of a statistical analysis in technical as well as non-technical terms.
Students will understand and use confidence intervals and statistical significance, including significance levels and p-values.
Students will interpret statistical results in context. Assessment Method: Embedded questions throughout homework, hands-on activities (Illustration #1, In class hands-on activities), projects (Illustration #4), quizzes and exams (Illustrations #2 & #3). Illustration #1: The anticipation of the first blossoms of spring flowers is one of the joys of April. One of the most beautiful of the spring blossoms is that of the Japanese cherry tree. Experience has taught us that, if the spring has been a warm one, the trees will blossom early, but if the spring has been cool, the blossoms will arrive later. Mr. Yamada is a gardener who has been observing the date in April when the first blossoms appears for the last 25 years. His son, Hiro, went to the library and found the average temperatures for the month of March during those 25 years. The data (Atarashii Sugaku II, 1996) is given in the table below. Temperature ( ) C°
4.0
5.4 3.2 2.6 4.2 4.7 4.9 4.0 4.9 3.8 4.0 5.1 4.3
Days in April to 1st Blossom
14 8 11 19 14 14 14 21 9 14 13 11 13
Temperature ( ) C°
1.5
3.7 3.8 4.5 4.1 6.1 6.2 5.1 5.0 4.6 4.0 3.5
Days in April to 1st Blossom
28 17 19 10 17 3 3 11 6 9 11 ?
56

Make a scatter plot.
What is expected is that the student will enter the data in his/her graphing calculator (TI 83 is recommended for the class) and make a scatter plot. The student should be able to determine that temperature is the independent variable and Days is the dependent variable. ,
Temperature
Day
s to
1st
blo
ssom
654321
30
25
20
15
10
5
0
Scatterplot of Days to 1st blossom vs Temperature
Find the equation of the linear regression model if there appears to be a
linear relationship between Temperature and Days in April to 1st Blossom. From the scatter plot the student makes in , he/she clearly sees the linear pattern between Temperature and Days in April to 1st Blossom. Using the Calculator, the student finds the equation of linear regression, 4.7 33.1Days Temp= − ∗ + ,
Find the predicted Days in April to 1st Blossom for the last year’s data with the Temperature 3.5 . Interpret the answer. C°
After getting the equation in , the student plugs 3.5 into Temp to get the predicted value for Days in April to 1st Blossom, which is 16.65. The student should be able to round up to 17 Days in April to 1st Blossom to make sense out of it. The student should interpret the answer as “If the average temperature of March of that year is 3.5 , you expect to see the first Cherry Blossom on the 17
C°th of April”. , ,
If the average temperature of March was 0 due to the unexpected cold,
what is the predicted Days in April to the 1C°
st Blossom? Interpret the answer.
By plugging 0 into temp, the student gets 33.1 days. Interpretation would be “If the average temperature of March of a certain year is 0 , then you expect to see the first Cherry Blossom on May 3
C°rd”. But the student learned that prediction
outside of data range is not recommended. Therefore, the student should write “
57

but, with an average temperature of 0 in the month of March, it’s very likely no Cherry Blossoms will appear that year since it was too cold” as a part of answer as well. , ,
C°
Illustration #2: A police-issue radar gun was used to record speeds for randomly selected motorists driving through a 30 mph speed zone. The results from 10 motorists are given below.
31, 30, 33, 43, 26, 37, 30, 28, 45, 36. Compute the mean and standard deviation.
Using a calculator, the student computes the mean (33.9 mph) and standard deviation(6.30 mph).
Construct the 95% confidence interval for μ, the average speed of motorists driving that speed zone.
Using the formula nsndftx )1(2/ −=± α , the student compute the confidence
interval with significance level α = 0.05. Using the data, the student gets
1030.6)9(9.33 025.0 =± dft , (29.39 mph, 38.451 mph).
Do they follow the speed limit?
Since the interval includes 30 mph in it, the answer would be “Yes, based on the significance level of 0.05, we conclude that they follow the speed limit”. , , Illustration #3: AT&T reports that 40% of the telephone customers in the city of Long Beach chose AT&T to provide long distance service. A consumer group wants to show that the actual figure is less than that reported by AT&T. A random sample of 300 individual selected from the city of Long Beach yielded 95 chose AT&T. Perform the hypothesis testing using significance level of 0.05.
Write down the null and alternative hypotheses with a proper definition of parameter.
This is the hypothesis testing on Population proportion. Using standard notations, the student writes
Ho: p = 0.4 versus Ha: p < 0.4 where the parameter p is the true rate of telephone customers in the city of Long Beach choose AT&T to provide long distance service.
Compute the test statistic.
58

The student calculates the test statistic, npp
ppz/)1(
ˆ−−
= = 300/)4.01(4.04.0300/95
−−
=z =
- 2.94.
Draw the Decision Rule (Rejection Region). The student recognizes that this is one-sided hypothesis testing. With α = 0.05, the student has decision rule as reject Ho in favor of Ha if the test statistic in is less than -1.645 and do not reject Ho, otherwise.
Conclusion with interpretation. The student writes “With α = 0.05, we reject the null hypothesis (Ho). Therefore, there is enough evidence to say that less than 40% of telephone customers in the city of Long Beach choose AT&T to provide long distance service”. ,
Calculate the p-value and perform the p-value test. Is the result consistent with what you get in d)?
The student calculates the p-value=P(z < -2.94) = 0.0016. Using the p-value test, the student rejects the null hypothesis (Ho) since the p-value < α and the results from d) and e) are consistent. Illustration #4: Which Supermarket is the true “Low Price Leader”? (project) Choose two comparable supermarkets where the student shops mostly, such as Ralph’s and Albertsons, and do a statistical analysis to determine which market is cheaper in general. The following is the procedure. First list 50 items the student buys most often; a half gallon milk, a loaf of bread,…. Using any reasonable sampling scheme, sample 15 items from them. Visit those two supermarkets and check the prices of those 15 items the student sampled. Conduct the analysis using the proper method. There are several things to be mentioned in the project; did you use sale price or regular price for items that were on sale? and did you use the same brand name or equivalent?. The project requires an introduction, raw data sheets, a graphical statistical analysis, a numerical statistical analysis, and a conclusion. The following is an actual project turned in. The 50 items the student select are:
1. 15 oz. Cheerios 26. 10 ¾ oz. Campbell’s chicken noodle soup
2. Gallon 1% milk 27. 15 oz. VanCamp’s Pork and Beans 3. Dozen large eggs 28. 6 oz. Contadina tomato paste 4. 1 lb Farmer John bacon 29. 24 oz. store brand maple syrup 5. 12 oz. Minute Maid orange juice 30. 16 oz. Miracle Whip 6. Loaf Roman Meal bread 31. 1 lb. 12 oz. Del Monte ketchup 7. Package of 8 hot dog buns 32. 1 lb. Blue Bonnet stick margarine
59

8. ½ gallon Breyer’s Ice cream 33. 3 oz. Friskies Fancy Feast 9. 12 oz. Starkist tuna 34. 1 lb. Medium Red Delicious apples 10. can of spam 35. 1 lb. Bananas 11. 1 lb Oscar Meyer hot dogs. 36. 5 lbs. Potatoes 12. 1 lb Hilshire Farm sausage 37. Head of iceberg lettuce 13. 20 oz. Kellogg’s Raisin Bran 38. 1 lb. pack of baby carrots 14. 1 ½ lb Grape Nuts 39. 1 cucumber 15. 13 ¼ oz. Lay’s potato chips. 40. 1 lb yellow onions 16. 2 liter Coca-Cola 41. Betty Crocker cake mix 17. 2 liter Dr. Pepper 42. 12 oz. Tollhouse chocolate chips 18. 2 liter Mug root beer 43. 7.25 oz. Kraft macaroni and
cheese 19. Lawry’s taco seasoning mix 44. 2 lb. Uncle Ben’s converted rice 20. 8 oz. sour cream (store brand) 45. 2 lb. store brand grape jelly 21. 11oz. can of Green Giant corn 46. 16 oz. Carnation Coffee mate 22. 1 lb. box of Krispy saltine crackers 47. 16 oz. Crisco all-vegetable
shortening 23. 1 lb. Wheat Thins crackers 48. 48 oz. Wesson canola oil 24. 48 Lipton tea bags 49. 1 lb. store brand miniature
marshmallows 25. 10 ¾ oz. Campbell’s tomato soup 50. 1 lb. store brand graham crackers
Using the random number table in the back of the textbook, the student decided to use the last two digits of the first column and went down until the student got 15 different numbers from 01 to 50 (She uses Simple Random Sampling without Replacement) and the numbers were 23, 34, 13, 09, 31, 44, 50, 27, 48, 25, 26, 11, 07, 35, 17. The student then used the grocery items which corresponds to these numbers and found their prices (not sale prices) at Ralph’s and at Albertsons. The results of the full prices of 15 items are on the table below: Grocery Items Stores and Respective Prices: Albertsons($) Ralph’s($) Difference(R-A)($)7. package of 8 store brand hot dog buns 1.39 1.09 -0.30 9. 12 oz. Starkist tuna 1.99 2.09 0.10 11. 1 lb. Oscar Mayer hot dogs 3.19 3.32 0.13 13. 20 oz. Kellogg’s Raisin Bran 3.39 3.39 0.00 17. 2 liter Dr. Pepper 0.99 1.29 0.30 23. 1 lb. Wheat Thins crackers 3.59 3.67 0.08 25. 10 ¾ oz. Campbell’s tomato soup 0.68 0.69 0.01 26. 10 ¾ oz. Campbell’s chicken noodle soup 0.69 1.25 0.56 27. 15 oz. Van Camp’s pork and beans 0.59 0.66 0.07 31. 1 lb 12 oz. Del Monte ketchup 1.31 1.89 0.58 34. 1 lb. Red Delicious apples 0.69 0.99 0.30 35. 1 lb. Bananas 0.59 0.63 0.04 44. 2 lb. Uncle Ben’s converted rice 2.51 2.67 0.16 48. 48 oz. Wesson canola oil 2.82 2.79 -0.03 50. 1 lb. store brand graham crackers 2.49 1.99 -0.50 TOTALS 26.91 28.41 1.50 The student used a Bar Graph for graphical presentation and carried the hypotheses testing on Inference in Matched Pairs data and came up with the conclusion that there was no difference in prices between those two markets.
60

101 Goals: Students will:
Exhibit familiarity and ease of use of basic geometric and arithmetical facts such as the Pythagorean Theorem, similar triangles and ratios.
Demonstrate knowledge and understanding of the trigonometric functions, their interrelations and their relations to triangles and the unit circle.
Use the trigonometric functions and their inverses, their manipulation and computation, to solve real world problems involving angles and triangles.
Model a variety of periodic phenomena using the trigonometric functions and their graphs.
Interpret the mathematical result about real world situations derived mathematically.
Exhibit understanding of the arithmetic and geometry of the complex numbers.
Assessment Method: Embedded questions throughout homework, quizzes and exams. Illustration #1: From a point on the ground 500 ft from the base of a building, it is observed that the angle of elevation to the top of the building is and the angle of elevation to the top of a flagpole atop the building is 27 . Find the height of the building and the length of the flagpole.
24
24
500 ft
What is expected is that the student will visualize the information in the form of two triangles :
Then the student would promptly recognize that tan 24500h
=
, , so straightforward computation gives
where denotes
the height of the building feet.
Similarly, if denotes the height of the building and agpole together, we
h
500 tan 24 500 .4452 223h = × ≈ × ≈k the fl
have that , , tan 27 k= , so
500 feet.
and finally the height of the flagpole is 500 tan 27 500 .5095 255k = × ≈ × ≈
255 223 32− = fe
lustration #2: The water depth in a narrow channel varies with the tides. Here is
3 4 5 6 7 8 9 10 11 12
et. Ilthe data for one half day:
Time 12 1 2 Depth (ft) 1 1 1 9 8 6 5 5 6 19.8 1.4 1.6 1.2 .6 .5 .5 .7 .4 .0 7.0 8.6 0.0 Then the student is expected to answer questions like the following:
61

Make a scatter plot of the water depth data where the x− axis is
nd the student should be thinking ahead
o the second question should be
Find a function that models the wa dep
he thinking student would select some form of the cosine function (the sine
time.
02
46
810
1214
0 5 10 15
Athat a periodic phenomenon (and hence a trigonometric function) is likely to be involved. , S
ter th as a function of time. Tfunction would do as well) to model it, so if we let ( )d t denote the depth of thewater measured in feet as a function of time (measured in hours), the student should select an expression of the form:
( ) ( ( ))t c bcosd t a= ω − + where there are four parameters to be computed, , and . The easiest
h e a , b c w
one is b , known as the vertical shift. It represents t e verage b tween highest
value and lowest value of the curve, so
a11.6 5.4 8.5b
2+
= = , . The next is the
amplitude, a , which is half of the difference between the highest and lowest
value: 11.6 5.4 3.1a −= = , . The period is 12 hours since the difference
2
between the highest tide and lowest tide is 6 hours, so 2 12π=
ω, and so
satisfies
ω
2 .5212π
ω = ≈ , . Finally, the phase
mply the time of the highest
3.= nd the student observes graphically that the
inally, a third and most interesting question
If a boat needs at least 11 ft of
shift, c , is sidepth, so 2c = , and we can model using:
( ) ( )( )1cos .52 2 8.5d t t − + ,
02
46
14
0 5 10 15
810
12
amatch is acceptable. Fwould be:
water to cross the channel, during which times can it safely do so?
62

( ) ( )( )3.1cos .52 2 8.5 11d t t= − + =Now the student needs to solve , which leads to
, and so ( )( )cos .52 2 .8065t − =( )arccos .8065
2.52
t = + , 3.2t ≈ . Since that is the
solution in the first quadrant, the other solution is in the fourth quadrant and is given by
( )arccos .8065t
−= + .8t ≈ . Transforming
get that the boat should safely travel between 12:48 and 3:12.
0
2
4
6
8
10
12
14
0 5 10 15
2.52
, so
these measurements from hours to minutes, one
63

109 Goals: Students will: Formulate real world situations in meaningful mathematical forms,
including graphs, tables, diagrams or equations, and in words. Execute mathematical manipulation and computation in order to
solve a posed problem. Recognize, have knowledge of, be able to combine and evaluate
fundamental mathematical expressions and functions such as polynomials and exponentials.
Exhibit familiarity and ease of use of basic geometric and arithmetical facts such as the Pythagorean Theorem, similar triangles and ratios.
Interpret the mathematical result about real world situations derived mathematically.
Assessment Method: Embedded questions throughout homework, quizzes and exams. Illustration #1: The Food and Drug Administration labels suntan products with a sun protection factor (SPF) typically between 2 and 45. Multiplying the SPF by the number of unprotected minutes you can stay in the sun without burning, you are supposed to get the increased number of safe sun minutes. For example, if you can stay unprotected in the sun for 30 minutes without burning, and you apply a product with SPF of 10, then supposedly you can sun safely for 30x10=300 minutes, or 5 hours. Assume that you can stay unprotected in the sun for 20 minutes without burning.
Give an equation that gives the maximum safe sun time T as a function of the sun protection factor . S
The student is expected to answer : 20T S= × .
Graph your equation. What is the suggested domain for S? Using either a calculator or simply a hand-sketch, the student should provide the graph :
00 10 20 30 40 50
100
200
300
400
500
600
700
800
900
1000And also the student explain that the domain consists of the real numbers between 2 and 45, or equivalently, the close interval [ ]2,45 .
Write an inequality that suggests times that would be unsafe to stay out in the sun.
64

The students should identify that areas above the graph are unsafe, and so their answer should be as unsafe , . 20T > S
S
Suppose one is using the best product around, how many hours can one
safely stay out? The student should realize that 900 minutes is the highest value that the function achieves , and answer “No more than 15 hours”.
How would the graph change if you could stay unprotected for 40 minutes?
0
200
400
600
800
1000
1200
1400
1600
1800
2000
0 10 20 30 40 50
Now the relation between the time and the safety level should given by 40T = × , and so the accompanying graph is given in contrast as in the picture. Perhaps the better student will realize that the slope of the line is of some importance.
)
Illustration #2: According to Rubin and Farber’s Pathology, “death from cancer of the lung, more than 85% of which is attributed to cigarette smoking, is today the single most common cancer death in both men and women in the United States.” The accompanying graph shows the annual death rate (per thousands) from lung cancer for smokers and nonsmokers.
The death rate for nonsmokers is roughly a linear function of age. After replacing each range of ages with a reasonable middle age (for example, you could use 60 to approximate the range 55-64), estimate the coordinates of two points on the graph of nonsmokers and construct a linear model. Interpret your results.
Although the question is purposely open, the easiest points to arrive at are possibly and (50,0 ( )80,5 , so the linear relationship between death rate per thousand, and
D =
A = age in years, is given by D mA b= + where and . Solving then for and , one gets:
50 0m b+ =80 5m b+ = m b
2516 3D A= − .
65

One interesting consequence is then to observe that since the slope of the line is 16 , one could conclude that every 6 added years of age leads to one more death in 1000 people .
By contrast, those who smoke more than one pack per day show an exponential rise in annual death rate from lung cancer. Estimate the coordinates for those points on the graph for heavy smokers and use the points to construct an exponential model (assume a continuous growth rate). Interpret your results.
Now the student should pursue an expression of the form and the two points that one can use to estimate the parameters
mAD ce=( )60,20 and ( . This
leads to the equations: and . To solve the equations one needs to look at their quotient : , and solve for :
)70,457045 mce= 6020 mce=
102.25 me= mln 2.25 0.08109
10m = ≈
and then substituting in either expression one gets 0.1541c ≈ . And one finally obtains .08109.1541 AD e= . One obvious consequence is that by age 80, the death rate becomes the significant: 101D ≈ in every thousand people!
Graph the models acquired in and , and compare with the shapes in the original graph.
-20
0
20
40
60
80
100
120
0 20 40 60 80 100
The graphs are given by And of course the observation should be made that there is fair resemblance between the original data and the models.
66

113 Goals: Students will: Formulate real world situations in meaningful mathematical forms,
including graphs, tables, diagrams, equations and in words. Execute mathematical manipulation and computation in order to
solve a posed problem. Recognize, have knowledge of, be able to combine and evaluate
fundamental mathematical expressions and functions such as polynomials and exponentials.
Exhibit familiarity and ease of use of basic geometric and arithmetical facts such as the Pythagorean Theorem, similar triangles, and ratios.
Interpret and articulate the mathematical result about real world situations derived mathematically.
Exhibit proficiency in understanding and usage of sequence and series terminology and language.
Assessment Method: Embedded questions throughout homework, quizzes and exams. Illustration: Ornithologists have determined that some species of birds tend to avoid flights over large bodies of water during daylight hours, because air generally rises over land and falls over water in the daytime, so flying over water requires more energy. A bird is released on an island 5 miles from shore. The nesting area is 12 miles down the straight shore from the point on the shore directly opposite the island. The bird uses 10 kcal/mi to fly over land, while it uses 14 kcal/mi to fly over water. Consider the following questions:
How much energy will the bird use if it flies directly from the island to the nesting area?
5
12
island
shoreline
What is expected is that the student will visualize the information in the form of a triangle : Thus, by letting denote the distance from the island to the nesting area, the student would arrive, by the use of the Pythagorean Theorem , to
d
2 2 25 12 25 144 169d = + = + = , and so one would conclude that 13d = miles. Naturally, the student should continue to answering the question:
The bird will need 13 14× =182 kcal to accomplish that trip.
67

If the bird flies directly over the water into land and then flies over land to the nesting ground, how much energy will the bird need then?
Continuing with the triangle model, the answer is readily arrived at , , :
5 14 12 10 70 120 190× + × = + = kcals. Now the more sophisticated question:
Suppose the bird is to fly directly over the water to some point on the shore between the nearest point and the nesting place, and then fly over land to the nesting place. Can the bird save energy by doing this? If so can the bird just use 170 kcals? If so where should the bird fly?
The student is then expected to come up with a variable, x , , which could represent the distance between the point on shore nearest the island and the point on the shore that the bird will fly to, so the picture now looks like x Now the student is expected to use the Pythagorean Theorem once again, and express the distance that the bird is flying over water as a function of y x :
2 25 2y x= + , so 225y x= + , . Additionally, the distance the bird is flying over land, 12z x= − . Thus the energy E that the bird will consume when it flies toward the point at x is given by the function:
( ) ( )225 x +14 10 12E x x= + − , .
dentify hat
The student could get a graphical representation of this function: and see a ready answer for the first part of the question
, , : Indeed, the bird can spend less energy if it flies to some point on shore different from the nearest point and then along the shore. Also from the picture, the student can itwo destinations that the bird could fly to in order to use exactly 170 kcals. Wis needed now is to solve the equation
165
170
175
180
185
190
195
0 5 10 15
( ) ( )214 25 10 12 170E x x x= + + − = , . Simplifying, it becomes
214 25 170 120 10 50 10x x x+ = − + = + ; or 27 25 25 5x x+ = + . Squaring both sides,
( ) ( )22 249 25 25 5 625 250 25x x x+ = + = + + x . Simplifying one more time,
68

224 250 600 0x x− + = . Using the quadratic formula,
250 4900 250 70 320 180 20 15or or48 48 48 48 3 4
x ± ±= = = = ,
and finally the student should conclude that that the bird should toward a point that is either 2
36 miles or 343 miles away along the shore from the nearest
point to the island. Ultimately, the student should understand that if the bird flew to any point between the two points obtained in the previous problem, the bird would be using less than 170 kcals. Those students with an inquiring mind, might be curious about the optimal flight plan for the bird and how few kcals will it need to arrive at the sanctuary.
69

Appendix 4 Letters of Support
Department of Mathematics and Statistics California State University, Long Beach June 13, 2006 Dr. Robert Mena:
The Center for Student-Athlete Services under the Division of Academic Affairs has worked in partnership with the Athletics Department to academically assist and provide necessary academic support to CSULB’s NCAA, Division I student-athletes. To that end, a collaborative effort was established with the Department of Mathematics and Statistics.
The student-athlete population at CSULB is a microcosm of the entire student body and as such, many are admitted to the university with out the requisite math skills to successfully transition through the required General Education and major requirements in math. As the academic success of the student-athlete population is extremely important to CSULB’s academic reputation and nationally reported in the media, a connection was made with the Department in an attempt to assist those student-athletes who have not experienced a successful math education in K-12. Adding urgency to this cause is the Chancellor’s edict that all remediation must be completed within the first year or the student may not continue at the university. Couple that with NCAA’s 2003 Academic Standards that decreased the allotted remediation that can be used for competitive eligibility in the first year from 12 units down to 6; the student-athlete population is being held for more academic requirements than other students on campus.
Meetings have ensued to discuss the needs of this special population and to arrive at appropriate solutions. Discussions on academic support, future changes in math remediation courses, MDP test, and the introduction of online math courses are some of the topics that are continuing to be examined. However, most importantly is the scheduling of math classes at the times conducive to student-athletes. Between team practice, weight training and conditioning, and other expectations on Division I student-athletes, the need to balance the athletic and academic schedule is most difficult for some departments. However, this Department has been very sensitive to the needs of this small but important population has been able to meet the math needs of CSULB’s NCAA student-athletes.
The Math and Statistics Department has been most supportive and enthusiastic to assist both the Athletic Department and the Center for Student-Athlete Services in this endeavor. With the added support of the new Athletic Director, Vic Cicles as well as President Alexander’s emphasis on “student success”, we are grateful and excited about the partnership with the Department of Mathematics and Statistics. If you would like any
70

additional information about our collaborative efforts, please contact me at 562-985-5622 or email at [email protected].
Sincerely, Gayle Fenton Director of Student-Athlete Services Special Assistant to the Vice Provost for Student Success Similar letters from other advising sections of the university may be added to the report later.
71

Appendix 5
Survey of Undergraduate Majors &
Graduate Students
72

Department of Mathematics and Statistics, California State University, Long Beach
Academic Program Review Student Survey, 2006 The results described in this document refer to the Spring 2006 departmental student survey. The survey was conducted between April and May 2006 in a number of upper division and graduate level mathematics and statistics classes. Results were analyzed based on student standing (graduate or undergraduate).
• It is clear that our students are satisfied with the overall performance of the faculty and the department. For example, 74.4% of undergraduates agree or strongly agree that faculty members in the department are interested in their academic development. Moreover, 83.3% of undergraduates sampled agree or strongly agree that faculty are appropriately prepared for the classes they are teaching. On a scale of 1(Strongly disagree) to 5(Strongly agree), the average rating for the 14 questions included in the survey was 3.94 for undergraduates. Satisfaction was even higher with graduate students, where the overall average was 4.16.
In light of the favorable findings, however, there were also a couple of areas that require attention:
• For both undergraduates and graduates, frequency of appropriate course offerings was a concern. 41.4% of undergraduates were neutral or didn’t agree that courses were offered enough. The corresponding percentage for graduate students was 45.9%.
• To the statement that career advisement is available in the department, 38% of
undergraduates were neutral, and another 14.5% did not agree. For the same question, 33.3% of graduate students were neutral, and another 8% did not agree.
In summary, Math and Stat majors tend to be satisfied with the education they are receiving and the efforts the department is putting forth in the traditional areas of responsibility. This being said, students are also asking for more variety and availability of courses, and also for more of a legitimate, concerted effort for the department to give them a solid idea of what career possibilities are available for their specific major. Perhaps part of their desire is to see concrete connections between material learned in class and real life problems encountered in work environments.
73

Department of Mathematics and Statistics, California State University, Long Beach Academic Program Review Undergraduate Student Survey (N=179)
Table
UNDERGRADUATE Strongly Disagree
2 n %
3 n %
4 n %
Strongly Agree
Total n %
Mean SD
1. Faculty Members in the department are interested in the academic development of undergraduate majors
5 2.8 6 3.4 34 19.0 81 45.3 52 29.1 178 99.4 3.95 .934
2. The undergraduate program of study is academically challenging
3 1.7 3 1.7 13 7.3 76 42.5 82 45.8 177 98.9 4.31 .817
3. Faculty in the department are appropriately prepared for their courses
4 2.2 5 2.8 20 11.2 87 48.6 63 35.2 179 100.0 4.12 .876
4. I feel the undergraduate program is preparing me for my professional career and/or further study
9 5.0 18 10.1 32 17.9 70 39.1 50 27.9 179 100.0 3.75 1.121
5. There is open communication between faculty and undergraduate students about student concerns
6 3.4 8 4.5 37 20.7 68 38.0 60 33.5 179 100.0 3.94 1.012
6. Class size is suitable for effective learning
5 2.8 3 1.7 13 7.3 77 43.0 81 45.3 179 100.0 4.26 .883
7. Academic advisement is available in the department
6 3.4 6 3.4 24 13.4 68 38.0 74 41.3 178 99.4 4.11 .991
8. Career advisement is available in the department
9 5.0 17 9.5 68 38.0 48 26.8 35 19.6 177 98.9 3.47 1.072
9. Faculty are available to students outside the classroom
5 2.8 3 1.7 27 15.1 76 42.5 68 38.0 179 100.0 4.11 .917
10. Teaching methods used by faculty are effective
4 2.2 8 4.5 40 22.3 90 50.3 37 20.7 179 100.0 3.83 .886
11. Procedures used to evaluate student performance are appropriate
3 1.7 17 9.5 30 16.8 100 55.9 29 16.2 179 100.0 3.75 .897
12. Frequency of undergraduate major course offerings is satisfactory
12 6.7 25 14.0 37 20.7 77 43.0 28 15.6 179 100.0 3.47 1.118
13. Variety of undergraduate major course offerings is satisfactory
6 3.4 12 6.7 37 20.7 84 46.9 40 22.3 179 100.0 3.78 .979
14. Degree requirements are clear
6 3.4 6 3.4 11 6.1 64 35.8 91 50.8 178 99.4 4.28 .968
74

Stronglyagree
432StronglyDisagree
Faculty Members in the Department areinterested in the academic development o...
50.0%
40.0%
30.0%
20.0%
10.0%
0.0%
Perc
ent
If I am a grad. student: NO
Stronglyagree
432StronglyDisagree
The undergraduate program ofstudy is academically challenging
50.0%
40.0%
30.0%
20.0%
10.0%
0.0%
Perc
ent
If I am a grad. student: NO
Stronglyagree
432StronglyDisagree
Faculty in the department areappropriately prepared for their courses
50.0%
40.0%
30.0%
20.0%
10.0%
0.0%
Perc
ent
If I am a grad. student: NO
Stronglyagree
432StronglyDisagree
I feel the undergraduate program ispreparing me for my professional career...
40.0%
30.0%
20.0%
10.0%
0.0%
Perc
ent
If I am a grad. student: NO
Stronglyagree
432StronglyDisagree
There is open communication betweenfaculty and undergraduate students abou...
40.0%
30.0%
20.0%
10.0%
0.0%
Perc
ent
If I am a grad. student: NO
Stronglyagree
432StronglyDisagree
Class size is suitable for effectivelearning
50.0%
40.0%
30.0%
20.0%
10.0%
0.0%
Perc
ent
If I am a grad. student: NO
75

Stronglyagree
432StronglyDisagree
Academic advisement is availablein the department
50.0%
40.0%
30.0%
20.0%
10.0%
0.0%
Perc
ent
If I am a grad. student: NO
Stronglyagree
432StronglyDisagree
Career advisement is available inthe department
40.0%
30.0%
20.0%
10.0%
0.0%
Perc
ent
If I am a grad. student: NO
Stronglyagree
432StronglyDisagree
Faculty are available to studentsoutside the classroom
50.0%
40.0%
30.0%
20.0%
10.0%
0.0%
Perc
ent
If I am a grad. student: NO
Stronglyagree
432StronglyDisagree
Teaching methods used by facultyare effective
60.0%
50.0%
40.0%
30.0%
20.0%
10.0%
0.0%
Perc
ent
If I am a grad. student: NO
Stronglyagree
432StronglyDisagree
Procedures used to evaluate studentperformance are appropriate
60.0%
50.0%
40.0%
30.0%
20.0%
10.0%
0.0%
Perc
ent
If I am a grad. student: NO
Stronglyagree
432StronglyDisagree
Frequency of undergraduate majorcourse offerings is satisfactory
50.0%
40.0%
30.0%
20.0%
10.0%
0.0%
Perc
ent
If I am a grad. student: NO
76

Stronglyagree
432StronglyDisagree
Variety of undergraduate majorcourse offerings is satisfactory
50.0%
40.0%
30.0%
20.0%
10.0%
0.0%
Perc
ent
If I am a grad. student: NO
Stronglyagree
432StronglyDisagree
Degree requirements areclear
60.0%
50.0%
40.0%
30.0%
20.0%
10.0%
0.0%
Perc
ent
If I am a grad. student: NO
77

Department of Mathematics and Statistics, California State University, Long Beach Academic Program Review Graduate Student Survey (N=87)
Table
GRADUATE Strongly Disagree
2 n %
3 n %
4 n %
Strongly Agree
Total n %
Mean SD
1. Faculty Members in the department are interested in the academic development of undergraduate majors
0 0.0 3 3.4 6 6.9 34 39.1 44 50.6 87 100.0 4.37 .764
2. The undergraduate program of study is academically challenging
1 1.1 4 4.6 13 14.9 35 40.2 34 39.1 87 100.0 4.11 .908
3. Faculty in the department are appropriately prepared for their courses
0 0.0 3 3.4 12 13.8 39 44.8 33 37.9 87 100.0 4.17 .795
4. I feel the undergraduate program is preparing me for my professional career and/or further study
1 1.1 0 0.0 12 13.8 30 34.5 44 50.6 87 100.0 4.33 .802
5. There is open communication between faculty and undergraduate students about student concerns
2 2.3 4 4.6 11 12.6 33 37.9 37 42.5 87 100.0 4.14 .967
6. Class size is suitable for effective learning
1 1.1 1 1.1 3 3.4 28 32.2 54 62.1 87 100.0 4.53 .729
7. Academic advisement is available in the department
1 1.1 1 1.1 8 9.2 29 33.3 48 55.2 87 100.0 4.40 .799
8. Career advisement is available in the department
3 3.4 4 4.6 29 33.3 29 33.3 21 24.1 86 98.9 3.71 1.004
9. Faculty are available to students outside the classroom
1 1.1 2 2.3 5 5.7 30 34.5 49 56.3 87 100.0 4.43 .802
10. Teaching methods used by faculty are effective
1 1.1 2 2.3 14 16.1 39 44.8 31 35.6 87 100.0 4.11 .841
11. Procedures used to evaluate student performance are appropriate
1 1.1 2 2.3 9 10.3 47 54.0 28 32.2 87 100.0 4.14 .780
12. Frequency of undergraduate major course offerings is satisfactory
3 3.4 14 16.1 23 26.4 28 32.2 19 21.8 87 100.0 3.53 1.109
13. Variety of undergraduate major course offerings is satisfactory
3 3.4 6 6.9 21 24.1 34 39.1 23 26.4 87 100.0 3.78 1.028
14. Degree requirements are clear
1 1.1 4 4.6 2 2.3 30 34.5 50 57.5 87 100.0 4.43 .844
78

Stronglyagree
432
Faculty Members in the Department areinterested in the academic development of...
60.0%
50.0%
40.0%
30.0%
20.0%
10.0%
0.0%
Per
cent
If I am a grad. student: YES
Stronglyagree
432StronglyDisagree
The graduate program of study isacademically challenging
50.0%
40.0%
30.0%
20.0%
10.0%
0.0%
Perc
ent
If I am a grad. student: YES
Stronglyagree
432
Faculty in the department areappropriately prepared for their courses
50.0%
40.0%
30.0%
20.0%
10.0%
0.0%
Perc
ent
If I am a grad. student: YES
Stronglyagree
43StronglyDisagree
I feel the graduate program is preparingme for my professional career and/or...
60.0%
50.0%
40.0%
30.0%
20.0%
10.0%
0.0%
Perc
ent
If I am a grad. student: YES
Stronglyagree
432StronglyDisagree
There is open communication betweenfaculty and graduate students about...
50.0%
40.0%
30.0%
20.0%
10.0%
0.0%
Perc
ent
If I am a grad. student: YES
Stronglyagree
432StronglyDisagree
Class size is suitable for effectivelearning
70.0%
60.0%
50.0%
40.0%
30.0%
20.0%
10.0%
0.0%
Perc
ent
If I am a grad. student: YES
79

Stronglyagree
432StronglyDisagree
Academic advisement is availablein the department
60.0%
50.0%
40.0%
30.0%
20.0%
10.0%
0.0%
Perc
ent
If I am a grad. student: YES
Stronglyagree
432StronglyDisagree
Career advisement is available inthe department
40.0%
30.0%
20.0%
10.0%
0.0%
Perc
ent
If I am a grad. student: YES
Stronglyagree
432StronglyDisagree
Faculty are available to studentsoutside the classroom
60.0%
50.0%
40.0%
30.0%
20.0%
10.0%
0.0%
Perc
ent
If I am a grad. student: YES
Stronglyagree
432StronglyDisagree
Teaching methods used by facultyare effective
50.0%
40.0%
30.0%
20.0%
10.0%
0.0%
Perc
ent
If I am a grad. student: YES
Stronglyagree
432StronglyDisagree
Procedures used to evaluate studentperformance are appropriate
60.0%
50.0%
40.0%
30.0%
20.0%
10.0%
0.0%
Perc
ent
If I am a grad. student: YES
Stronglyagree
432StronglyDisagree
Frequency of graduate majorcourse offerings is satisfactory
40.0%
30.0%
20.0%
10.0%
0.0%
Perc
ent
If I am a grad. student: YES
80

Stronglyagree
432StronglyDisagree
Variety of graduate major courseofferings is satisfactory
40.0%
30.0%
20.0%
10.0%
0.0%
Perc
ent
If I am a grad. student: YES
Stronglyagree
432StronglyDisagree
Degree requirements areclear
60.0%
50.0%
40.0%
30.0%
20.0%
10.0%
0.0%
Perc
ent
If I am a grad. student: YES
81

Appendix 6 Active Faculty from Fall 2001 to Fall 2006
First Name Last Name Area Current Status Institution Granting
Doctorate Year of Grad.
Year Hired
Tenure Year
Shafqat Ali Pure Mathematics Retired UC, Santa Barbara 1970 1968 1973 John Bachar Pure Mathematics Retired UC, Los Angeles 1970 1969 1974
Babette Benken Mathematics Education Assistant Professor University of Michigan 2004 2006 NA Joseph Bennish Applied Mathematics Professor UC, Los Angeles 1987 1988 1993 John Brevik Pure Mathematics Assistant Professor UC, Berkeley 1996 2006 NA Linda Byun Pure Mathematics Professor University of Wisconsin 1984 1984 1990 Bruce Chaderjian Applied Mathematics Associate Professor UC, Los Angeles 1989 1989 1995
Samuel Councilman Pure Mathematics Professor (FERP) UC, Los Angeles 1968 1968 1975 Scott Crass Pure Mathematics Associate Professor UC, San Diego 1996 2001 2005 Linda DeGuire Mathematics Education Professor University of Georgia 1983 1990 1995
Yu Ding Pure Mathematics Assistant Professor New York University 2001 2006 NA Carl Dorn Applied Mathematics Professor UC, Los Angeles 1967 1968 1982
Morteza Ebneshahrashoob Statistics Professor Oklahoma State U 1978 1990 1994 Tangan Gao Applied Mathematics Associate Professor Michigan State University 1999 1999 2005 Y. David Gau Pure Mathematics Professor Purdue University 1981 1988 1995 Eun Heui Kim, E. H. Applied Mathematics Associate Professor University of Connecticut 1999 2001 NA Sung Eun Kim, S. E. Statistics Assistant Professor UC, Davis 1998 2005 NA YongHee Kim-Park Statistics Associate Professor UC, Riverside 1995 1998 2002
Olga Korosteleva Statistics Assistant Professor Purdue University 2002 2002 NA Melvin Lax Applied Mathematics Professor Rensselaer P I 1974 1977 1981 William Margulies Applied Mathematics Professor Brandeis University 1967 1969 1981
82

Robert Mena Pure Mathematics Professor University of Houston 1973 1988 1988 Kent Merryfield Pure Mathematics Professor University of Chicago 1980 1988 1992
Kathleen Miller Pure Mathematics Resigned University of Maryland 2001 2001 NA William Murray Pure Mathematics Assistant Professor UC, Berkeley 2001 2001 NA
Florence Newberger Pure Mathematics Assistant Professor University of Maryland 1998 2001 NA Norma Noguera Mathematics Education Associate Professor Ohio University 1998 2001 2005 Alan Safer Statistics Associate Professor University of Wyoming 2000 2000 2005
Howard Schwartz Pure Mathematics Retired University of Toledo 1969 1969 1973 Angelo Segalla Mathematics Education Professor UC, Los Angeles 1973 2001 2005 James Stein Pure Mathematics Professor UC, Berkeley 1967 1989 1991 Kagba Suaray Statistics Assistant Professor UC, San Diego 2004 2005 NA Lindsay Tartre Mathematics Education Professor University of Wisconsin 1984 1985 1993 Robert Valentini Pure Mathematics Professor Ohio State University 1979 1989 1993
Ngo Viet Pure Mathematics Professor UC, Berkeley 1984 1989 1993 Derming Wang Pure Mathematics Professor University of Georgia 1981 1983 1993 Saleem Watson Pure Mathematics Professor McMaster University 1978 1986 1991 Arthur Wayman Pure Mathematics Professor (FERP) UC, Los Angeles 1975 1977 1982 Robert Wilson Pure Mathematics Retired UC, Los Angeles 1974 1966 1975
Wen-Qing Xu Applied Mathematics Associate Professor New York University 1999 2002 2006 William Ziemer Applied Mathematics Professor Carnegie Mellon U 1989 1989 1995
83

Teaching Units Assignments for
Faculty & Part-Time Instructors
84

A
A A A
A A A A
A A A A
A A A
Tenured & Tenure-Track
Current Status F01 S02 F02 S03 F03 S04 F04 S05 F05 S06
Ali Retired 6 6 6 6 5.6 5.6 5.6 5.6 5.6 5.6Bachar Retired 6 6.3 6 6 6 6 6 6 N NABennish Tenured 0 8.6 8.6 8.6 11.6 12.6 11.6 11.6 11.6 11.6Byun Tenured 11.6 8.6 8.6 8.6 11.6 0 11.6 11.6 11.6 11.6Chaderjian Tenured 10.6 9.6 0 0 9.6 13.6 10.6 12.6 10.6 12.6Councilman FERP 0 5.6 5.6 5.6 5.6 5.6 3 3 3 3Crass Tenured 6 6.7 11.5 4.8 10.5 10.6 11.6 9 0 0.3DeGuire Tenured 9.9 9.9 9.3 9.9 12.9 9.9 12.9 0 13.2 9.9Dorn Tenured 11.6 11.6 11.6 11.6 11.6 11.6 11.6 11.6 11.6 11.6Ebneshahrashoob Tenured 11.6 9 9.5 9.5 9.5 10.2 12 9 15 9Gao Tenured 4.2 3 6 6 9.5 8.6 8.6 11.6 0 8.6Gau Tenured 5.6 11.6 8.6 8.6 11.6 11.6 11.6 11.6 11.6 9.5Kim, E. H. Track 5.6 6.8 5.6 6 8.6 3 6 5.6 6.3 6.3Kim, S. E. Track NA NA NA NA NA N N N 6 6.5Kim-Park Tenured 9.3 8.6 0 8.9 11.6 11.9 14.6 9 11.6 9.1Korosteleva Track NA NA 6 6 7.2 7.5 9 9.3 0 10Lax Tenured 11.6 11.6 11.6 11.6 11.6 11.6 11.6 11.6 11.6 11.6Margulies Tenured 11.6 11.6 11.6 11.6 11.6 11.6 11.6 11.6 11.6 11.6Mena Tenured 10 3 12 12 11.6 12 12.1 11.9 3 3.5Merryfield Tenured 9.6 9 9.6 8.6 9.6 9 10 9 9.9 9Miller Resigned 6.6 6.6 6.6 6.6 NA N N N N NAMurray Track 6 6 6 6.5 9.1 9.6 11.6 9.4 8.6 6.6Newberger Track 6.5 6 6 7.5 9.9 7 6.8 9 8.9 1Noguera Tenured 6.6 6.6 6.6 6.6 7.05 9.4 12.3 9 11.4 8.7Safer Tenured 6.5 6 6.3 7.3 9.6 11.5 9.2 8.5 11.5 9Schwartz Retired 6 6 6 6 NA N N N N NASegalla Tenured 6.5 6.5 7 7.8 7.85 6.5 9.5 6.5 9.5 9.5Stein Tenured 6 0 9 6 11.6 12 11.6 11.6 11.6 11.6Suaray Track NA NA NA NA NA N N N 6 6Tartre Tenured 9.9 9.9 6.6 6.6 8.1 6.6 8.1 9.9 9 13.2Valentini Tenured 11.6 8.6 8.6 8.6 11.6 12.1 12.1 12.1 11.6 11.9Viet Tenured 8.6 8.6 8.6 8.6 8.6 8.6 11.6 11.6 11.6 5.6Wang Tenured 8.6 8.6 8.6 8.6 11.6 11.6 12 8.6 3 11.6Watson Tenured 9 8.6 8.6 9 12.1 9 9 9 0 0Wayman FERP 2.8 0 0 0 3.5 2 3 4.3 0 6Wilson Retired 0 10 0 11.6 9.6 0 10 0 14 NAXu Tenured NA NA 5.6 3 6 5.6 9 9 8.6 9.5Ziemer Tenured 3 3 5.6 5.6 8.6 11.6 8.6 6 8.6 11.6
85

A AA A
A A A A
A A A A
A A A A A
A AA A A A AA A A A AA A A A AA A A A A
A A A A A
A A A A A
A A A A A
A A A A AA
A A A A
A A A AA A A A
AA A AA A A A A
A A A A
Part Time Lecturers Current Status F01 S02 F02 S03 F03 S04 F04 S05 F05 S06Acosta Currently Employed 14.6 11.6 11.6 11.6 11.6 11.6 12.1 11.6 11.6 11.6Akins Currently Employed 6 6 8.6 6 8.6 N N 5.6 8.6 8.6Araeipour Currently Employed 14.6 12 12 12 5.6 N N 5.6 11.6 8.6Arsenidis Currently Employed 15 15 15 15 15 15 15 15 15 15Ath Currently Employed NA NA NA NA N N N N 3 3Baham Currently Employed 12.9 12.9 13.2 13.2 13.2 13.2 13.2 14.7 14.7 14.4Ball 8.9 6.3 12 12 15 15 12 12 15 12Blair Past Employee 6 6 3 3 6 N N N N NABourouis-Benyassine Past Employee 12 NA NA NA NA NA NA NA NA NABrown Past Employee NA NA 14.2 NA N N N N N NABrownson Currently Employed 8.6 8.6 8.6 8.6 8.6 8.6 9 9 8.6 8.6Chaffee Currently Employed 9 6 9 6 N N 9 9 9 9Chammas Past Employee NA NA 6 NA N N N N N NAChen Past Employee NA NA 13.2 NA N N N N N NAClarke Past Employee NA NA 1.65 1.65 N N N N N NACoopman Past Employee NA 9 NA NA N N N N N NADella Rocca Currently Employed 9 6 10.3 10 10.6 9 8.6 9.9 9 13English Currently Employed 11.2 11.6 9 8.6 6 5.6 5.6 6 11.2 8.6Estephan Past Employee 12 12 9 6.66 N N N N N NAFaridpak Currently Employed 11.6 9 14.6 11.2 14.6 14.2 14.2 14.2 14.6 14.6Foster Past Employee 9 6 6 NA N N N N N NAFoti Past Employee 3 3 3 3 3 3 4.8 3.9 2.4 NAGeier Currently Employed 15 15 15 15 15 15 15 15 15 15Gelenchi Past Employee 12 6 NA NA N N N N N NAGhamsary Currently Employed 9 12 9 9 9 9 6 6 9 9Gibson Currently Employed 12 12 11.6 11.6 12 11.2 11.6 12 14.6 14.6Granillo Currently Employed 12.9 12.9 13.2 14.58 13.95 14.7 15.6 14.7 14.7 15Hamza Currently Employed 14.2 14.6 11.6 11.2 11.6 11.6 14.2 14.2 14.2 15Heidt Past Employee 11.6 6 14.6 11.6 14.6 8.6 14.2 15 14.6 14.2Hernandez Currently Employed 14.6 14.6 14.6 14.6 14.6 14.6 14.2 14.2 14.2 14.2Hoang Past Employee 12 NA NA NA N N N N N NAHunter Currently Employed 14.2 14.6 14.6 14.6 14.6 14.6 14.6 N 14.6 NAIgolnikov Currently Employed 14.6 14.2 14.2 11.2 11.2 11.6 14.2 14.2 14.2 12Jackson Past Employee 6 NA NA NA N N N N 6 NAKhoddam Currently Employed 6 6 6 6 6 6 6 6 0 6Komzsik Past Employee NA NA 6 5.6 6 N N N N NALamanski Currently Employed NA NA NA NA N N N N 6 3Lau Currently Employed 3 4.5 6 6.66 3.75 4.5 7.5 7.5 7.4 10.1Leongson Past Employee NA NA 8.6 12.3 12.9 9.6 12.6 13.2 14.6 12.6Lewandowski Currently Employed 14.6 15 6 6 6 6 6 6 6 6Lindgren Currently Employed 11.6 17.6 ∗15 NA 14.6 N 0 0 12 NALopez Currently Employed NA NA NA NA N N N 3.3 2.4 4.5Mariani Past Employee 6.3 3.3 1.65 1.65 N N N N N NAMbanefo Currently Employed 11.2 11.2 11.2 11.2 8.6 8.6 8.6 9 9 8.6McCance Currently Employed NA NA NA NA N N N N 12 9McKay Currently Employed 15.1 14.6 12 12 15 15.3 15 12 12 12Misajon Currently Employed 15 15 12 12 12 9 8.6 12 15 9Moon Currently Employed 14.2 14.2 11.6 11.6 11.6 11.2 11.6 11.2 11.2 11.6
86

A A A A AA A A A A
A A A A
A A A A A
A AA A A A
A A A AA A A A AA A A A AA A A A AA A A A AA A A A AA A A A AA A A A AA A A A AA A A AA A A A AA A A A AA AA A A AA A A A A
A A AA A A AA A A A
A A A
Nasab Past Employee NA NA 5.6 NA N N N N N NANguyen, A.L. Past Employee 6 NA NA NA N N N N N NANguyen, S. Past Employee 6 6 9 6 8.6 N N N N NAOba Currently Employed 9.9 11.9 9.9 12.2 13.2 12.9 12.9 12.6 13.2 12.2Pack Past Employee NA NA 5.6 5.6 N N N N N NAPetrie Currently Employed 9.6 9.6 6.6 6.6 9.6 9.6 9 9.6 9.6 9Pomerantsev Currently Employed 14.9 12.9 13.2 13.2 13.2 13.2 13.2 13.2 13.2 13.2Riley Past Employee 4.5 5.5 6 3.8 6.81 3.9 1.5 N N NARoeun Past Employee 9 12 12.3 12.3 12 N N N N NARosenberg Currently Employed 6 6 6 6 6 6 6 6 6 6Sajjadham Currently Employed NA NA NA NA N N N N 9 3Saso Past Employee 11.6 3 NA NA N N N N N NAScully Past Employee 5.6 NA NA NA N N N N N NASklar Past Employee 9.9 0 NA NA N N N N N NASmith Past Employee NA 5.6 NA NA N N N N N NASobel Past Employee 0 NA 0 NA N N N N N NASquires Past Employee 12 11.2 NA NA N N N N N NASroka Past Employee NA NA 11.2 NA N N N N N NAStack Past Employee 11.2 11.2 11.2 5.6 N N N N N NASterling Currently Employed NA NA NA NA N N N N 3 6Swigart Past Employee NA NA 12 NA N N N N N NATakashima Past Employee 6 6 3 NA N N N N N NATanaka Past Employee NA NA NA NA N N 3 3 3 NATran Currently Employed NA NA NA NA N N N N 12 6Waddle Past Employee 12.3 9.6 NA NA N N N N N NAWard NA 9.9 9.9 9.9 12.2 13.2 9.9 9.9 9.6 0White Currently Employed NA NA NA NA N N N 7.8 6.9 10.8Wu Currently Employed NA NA NA NA N N N N 3.3 6.6Wuth Past Employee NA NA NA NA N N N N 12 6Zugates Currently Employed 5.6 6 12 11.2 8.6 N N N 6 NA
∗ Lindgren's D-WTU without the addition of his SAR units totals 15.00, with SAR, it totals 21.0 D-WTU
87