department of homeland security (dhs) fiscal year 2013 contract funding factsheet
TRANSCRIPT

April 2014 Issue #8
1100 North Glebe Road, Suite 1010, Arlington, VA 22201 | Tel: 703.224.4407 | Fax: 703.224.8001 | [email protected] © 2014 The Soter Group. All Rights Reserved.
1
The Soter Group
Perspectives – Department of Homeland Security (DHS) Fiscal Year 2013 Contract Funding Fact Sheet
There was an abundance of uncertainty around how sequestration would actually affect contractors in
fiscal year (FY) 2013. Budget issues certainly disrupted the Federal government procurement cycles.
This brief fact sheet provides an update on DHS contract funding for FY13 and builds on a previous
analysis covering FY08-FY12: Department of Homeland Security (DHS) Contract Funding, 2008 – 2012.
DHS-funded prime obligations totaled $12.7 billion in FY13, down 2.8% from $13.1 billion in FY12.
This decline in total prime obligations was driven by double-digit year-on-year percentage point
decreases in contract spending at the Transportation Security Administration (TSA), Immigration and
Customs Enforcement (ICE), the U.S. Secret Service (USSS), and the Office of the Inspector General (OIG).
These four agencies accounted for a decrease of $496 million in prime obligations compared to FY12.
DHS Funding Agency Prime Obligations, % Δ, FY13 v. FY12
U.S. Coast Guard (USCG) +6.9%
Federal Emergency Management Agency (FEMA) +6.8%
Office of Procurement Operations (OPO) +1.8%
Federal Law Enforcement Training Center (FLETC) -1.3%
U.S. Citizenship and Immigration Services (USCIS) -7.0%
Customs and Border Protection (CBP) -8.7%
Immigration and Customs Enforcement (ICE) -11.4%
Transportation Security Administration (TSA) -13.6%
U.S. Secret Service (USSS) -19.7%
Office of the Inspector General (OIG) -80.7%
The FY13 mix of spending between products, services, and research and development (R&D) contracts
remained within the ranges experienced between FY08 and FY12.
However, total prime obligations directed to services contracts reached a six-year low of only $9.1
billion in FY13; this represented approximately 72% of the total $12.7 billion. Meanwhile, product
acquisitions and R&D contracts garnered $3.0 billion and $570 million, respectively.
# Product and Service Category FY13 DHS-Funded Prime Obligations
% of FY13 Total
1 Professional, Administrative, and Management Support Svcs. $2,581.1 20%
2 IT and Telecommunications Services 2,139.6 17%
3 Utilities and Housekeeping Services 1,731.5 14%
4 Ships, Small Craft, Pontoon, and Floating Docks 902.2 7%
5 ADP Equipment, Software, Supplies and Support Equipment 802.8 6%
All Other Products and Services 4,559.3 36%
Total Prime Obligations $12,716.8 100%
(in $ millions)
April 2014 Issue #8
1100 North Glebe Road, Suite 1010, Arlington, VA 22201 | Tel: 703.224.4407 | Fax: 703.224.8001 | [email protected] © 2014 The Soter Group. All Rights Reserved.
2
The Soter Group
Use of definitive contracts increased to 24% of total prime obligations, or about $3.0 billion, in FY13.
This represents an increase of 9.8% from the $2.7 billion obligated via definitive contracts in FY12. This
increase was offset by decreases in usage of delivery orders on indefinite delivery contracts (IDC) and
blank purchase agreements (BPA). In fact, these two categories of award types experienced a $609
million year-on-year drop in prime obligations.
Fixed price contracts continued to gain ground at DHS at the expense of cost reimbursement and time
and materials (T&M) contracts.
In FY13, 67% of prime obligations went through fixed price type contracts – or approximately $8.5 billion
out of the $12.7 billion total. This is a marked increase from levels below 50% in FY08 and FY09.
Meanwhile, cost reimbursement and T&M contracts accounted for only 15% and 11% of total prime
obligations in FY13, down from 18% and 12% in FY12, respectively.
Non-competitive contracts increased four percentage points to 17% in FY13 but remained in line with
the FY08-FY12 range.
Non-competitive contracts represented $2.1 billion of the $12.7 billion in DHS-funded prime obligations
in FY13. Between FY08 and FY12, the proportion of non-competitive contracts reached a low of 13% in
FY10 and FY12 and a high of 19% in FY11. However, in general, contracting at DHS has trended towards
increased competition and will likely continue to do so.
Prevalence of set-aside contracts continued to increase as prime obligations on contracts with no set
aside decreased from $10.2 billion in FY12 to $9.8 billion in FY13.
Prime obligations on contracts with no set aside held only a 77% share of total prime obligations in FY13.
Socioeconomic designations that benefited in this past fiscal year included 8(a), service-disabled
veteran-owned small businesses (SDVOSB), HUBZone, and women-owned small businesses (WOSB),
with the latter two groups showing the greatest year-on-year growth. Prime obligations on contracts
set-aside for HUBZone contractors more than doubled from $101 million in FY12 to over $225 million in
FY13. However, this spending still represents only 2% of total prime obligations.
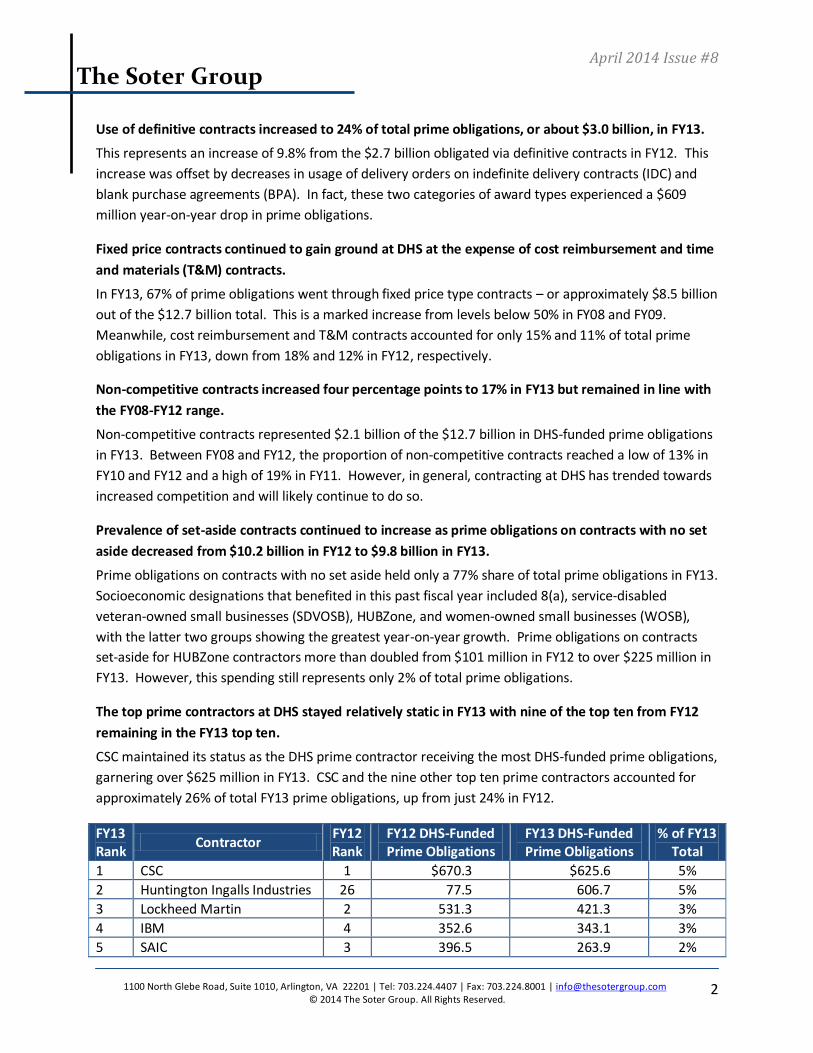
The top prime contractors at DHS stayed relatively static in FY13 with nine of the top ten from FY12
remaining in the FY13 top ten.
CSC maintained its status as the DHS prime contractor receiving the most DHS-funded prime obligations,
garnering over $625 million in FY13. CSC and the nine other top ten prime contractors accounted for
approximately 26% of total FY13 prime obligations, up from just 24% in FY12.
FY13 Rank
Contractor FY12 Rank
FY12 DHS-Funded Prime Obligations
FY13 DHS-Funded Prime Obligations
% of FY13 Total
1 CSC 1 $670.3 $625.6 5%
2 Huntington Ingalls Industries 26 77.5 606.7 5%
3 Lockheed Martin 2 531.3 421.3 3%
4 IBM 4 352.6 343.1 3%
5 SAIC 3 396.5 263.9 2%

April 2014 Issue #8
1100 North Glebe Road, Suite 1010, Arlington, VA 22201 | Tel: 703.224.4407 | Fax: 703.224.8001 | [email protected] © 2014 The Soter Group. All Rights Reserved.
3
The Soter Group
6 Bollinger Shipyards 5 282.8 254.3 2%
7 Securitas AB 8 208.9 235.9 2%
8 The GEO Group 10 182.3 198.3 2%
9 General Dynamics 6 269.6 190.2 1%
10 HP 9 195.4 174.1 1%
All Other Contractors – 9,920.8 9,403.6 74%
Total $13,088.2 $12,716.8 100%
(in $ millions)
Contracting activity and dynamics at DHS in FY13 appeared to be a continuation of ongoing trends that
have been apparent over the last several years. While budget documents and plans do not suggest any
major changes at DHS for FY14, the FY15 President’s Budget indicates a decrease in spending on
contractual services and supplies at DHS of nearly 10% compared to FY14 and over 8% from FY13 levels.
While it is unclear how this reduction in obligations may be implemented and how it may ultimately
affect the contracting community, contractors should have the proper strategies and plans in place and
in motion to mitigate any possible negative implications.
For a detailed analysis of prior years, reference a previously-released report covering the five-year
period from FY08 to FY12: Department of Homeland Security (DHS) Contract Funding, 2008 – 2012.
About The Soter Group
The Soter Group provides services to both the Federal government and the commercial entities that
support it. Our Commercial Services Division provides market research and strategic advisory services to
commercial clients seeking to enter or grow in the Federal government security market. Justin Taft,
President & CEO, and Peter Wong, Associate, authored these perspectives. The Soter Group welcomes
the opportunity for our research to be cited in third-party reports. To learn more, please visit
www.TheSoterGroup.com and/or email [email protected].
Report April 2014: Perspectives – Department of Homeland Security Fiscal Year 2013 Contract Funding Factsheet
Notes on Methodology: This analysis examines all unclassified prime contracts awarded to the private sector that are funded and/or contracted by DHS. Contracts funded by DHS may not necessarily be contracted by a DHS contracting office. This analysis excludes all grants and may exclude some contracts whose estimated value is below $3,000. Some figures may deviate from other published numbers due to rounding errors and/or typographical errors in government budget documents and contract data. Company-specific data may not account for recent acquisitions and are based on government-provided contract and vendor information. Sources include the Federal Procurement Data System – Next Generation, DHS Budget-in-Briefs and Congressional Budget Justifications, and OMB budget documents.