department of health delivering efficiency savings in the nhs · pdf filedepartment of health...
TRANSCRIPT
Department of Health
Delivering efficiency savings in the NHS
BRIEFING FOR THE HOUSE OF COMMONS HEALTH COMMITTEE
SEPTEMBER 2011

The National Audit Office scrutinises public spending on behalf of
Parliament. The Comptroller and Auditor General, Amyas Morse, is an Officer
of the House of Commons. He is the head of the NAO, which employs
some 880 staff. He and the NAO are totally independent of government.
He certifies the accounts of all government departments and a wide range
of other public sector bodies; and he has statutory authority to report
to Parliament on the economy, efficiency and effectiveness with which
departments and other bodies have used their resources. Our work led to
savings and other efficiency gains worth more than £1 billion in 2010-11.
Our vision is to help the nation spend wisely.
We apply the unique perspective of public audit to help Parliament and government drive lasting improvement in public services.
Department of Health
Delivering efficiency savings in the NHS
BRIEFING FOR THE HOUSE OF COMMONS HEALTH COMMITTEE
SEPTEMBER 2011

This memorandum has been prepared for the Health Committee to support its review. It sets out how the NHS, supported by the Department of Health, plans to deliver efficiency savings of up to £20 billion by 2014-15.
Contents
Introduction 4
Part OneThe scale of the challenge 7
Part TwoQIPP at a national level 11
Part ThreeThe QIPP challenge at a regional and local level 18
Part FourMonitoring progress against the QIPP challenge 27
Part FiveChallenges for achieving QIPP 34
Appendix One 36
This review was conducted by Leon Bardot, Mark Davies, Jemma Dunne, Maria-Christina Eskioglou and Dan Ward. This report can be found on the National Audit Office website at www.nao.org.uk
For further information about the National Audit Office please contact:
National Audit Office Press Office 157-197 Buckingham Palace Road Victoria London SW1W 9SP
Tel: 020 7798 7400
Email: [email protected]
Website: www.nao.org.uk
Twitter: @NAOorguk
© National Audit Office 2011
4 Introduction Delivering efficiency savings in the NHS
Introduction
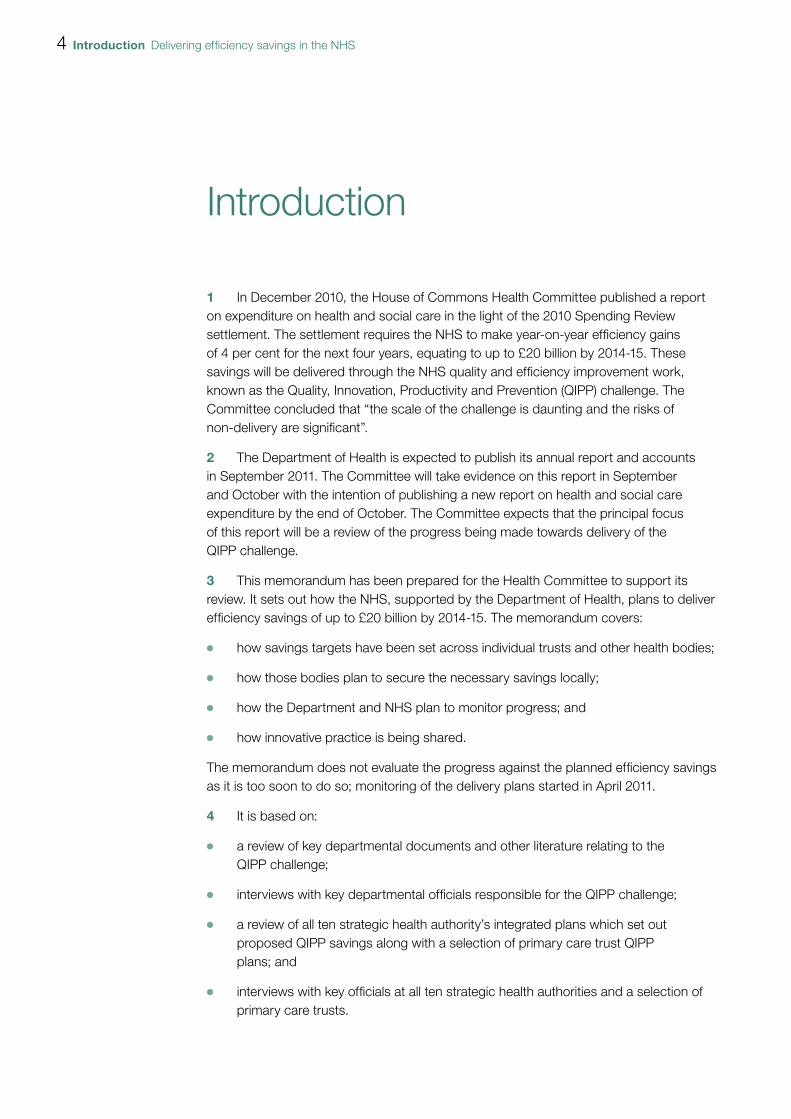
1 In December 2010, the House of Commons Health Committee published a report on expenditure on health and social care in the light of the 2010 Spending Review settlement. The settlement requires the NHS to make year-on-year efficiency gains of 4 per cent for the next four years, equating to up to £20 billion by 2014-15. These savings will be delivered through the NHS quality and efficiency improvement work, known as the Quality, Innovation, Productivity and Prevention (QIPP) challenge. The Committee concluded that “the scale of the challenge is daunting and the risks of non-delivery are significant”.
2 The Department of Health is expected to publish its annual report and accounts in September 2011. The Committee will take evidence on this report in September and October with the intention of publishing a new report on health and social care expenditure by the end of October. The Committee expects that the principal focus of this report will be a review of the progress being made towards delivery of the QIPP challenge.
3 This memorandum has been prepared for the Health Committee to support its review. It sets out how the NHS, supported by the Department of Health, plans to deliver efficiency savings of up to £20 billion by 2014-15. The memorandum covers:
OO how savings targets have been set across individual trusts and other health bodies;
OO how those bodies plan to secure the necessary savings locally;
OO how the Department and NHS plan to monitor progress; and
OO how innovative practice is being shared.
The memorandum does not evaluate the progress against the planned efficiency savings as it is too soon to do so; monitoring of the delivery plans started in April 2011.
4 It is based on:
OO a review of key departmental documents and other literature relating to the QIPP challenge;
OO interviews with key departmental officials responsible for the QIPP challenge;
OO a review of all ten strategic health authority’s integrated plans which set out proposed QIPP savings along with a selection of primary care trust QIPP plans; and
OO interviews with key officials at all ten strategic health authorities and a selection of primary care trusts.
Delivering efficiency savings in the NHS Introduction 5
Key facts
OO QIPP is an umbrella term used to describe the approach the NHS is taking at a local, regional and national level to reform its operations and design services in the light of the economic climate.
OO Over the current spending period (2011-12 to 2014-15) the NHS will face significant additional demand for services arising from the age and lifestyle of the population as well as the need to fund new technologies and drugs. To keep pace, the NHS needs to make efficiency savings of up to £20 billion by 2014-15. The Government has asked the NHS to do this whilst simultaneously driving up the quality of services it provides and the outcomes it achieves.
OO At a local level, commissioners working with clinicians, identify opportunities to improve quality and efficiency and produce local integrated plans. At a regional level, strategic health authorities coordinate action in workstreams and create regional integrated plans. At a national level, the Department provides support through national policies, communication, national workstreams, and planning support, oversight and monitoring.
OO At a local level, providers can achieve efficiency savings by either reducing input costs or by redesigning services to achieve the same or better outcomes with less resource. Commissioners can achieve efficiency savings by securing the same services for a lower cost, by reducing demand, or by redesigning services.
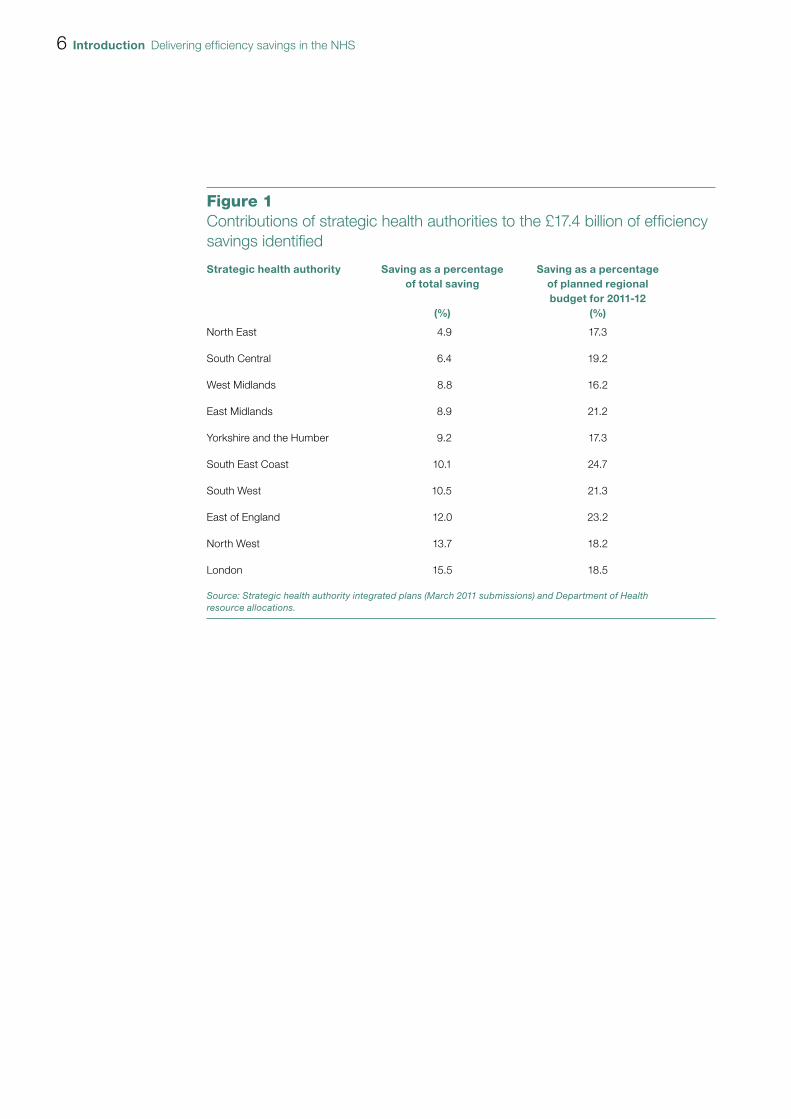
OO Strategic health authorities have identified that to meet the QIPP challenge efficiency savings of £16.4 billion by 2014-15 will need to be made (the challenge is to make savings of up to £20 billion). They have identified potential efficiency savings of £17.4 billion. Figure 1 overleaf shows the intended contribution of each strategic health authority to this total.
6 Introduction Delivering efficiency savings in the NHS
Figure 1Contributions of strategic health authorities to the £17.4 billion of effi ciency savings identifi ed
Strategic health authority Saving as a percentage of total saving
(%)
Saving as a percentageof planned regionalbudget for 2011-12
(%)
North East 4.9 17.3
South Central 6.4 19.2
West Midlands 8.8 16.2
East Midlands 8.9 21.2
Yorkshire and the Humber 9.2 17.3
South East Coast 10.1 24.7
South West 10.5 21.3
East of England 12.0 23.2
North West 13.7 18.2
London 15.5 18.5
Source: Strategic health authority integrated plans (March 2011 submissions) and Department of Health resource allocations.
Delivering efficiency savings in the NHS Part One 7
Part One
The scale of the challenge
1.1 Over the past ten years NHS expenditure has increased in real terms by 71 per cent to £103 billion in 2010-11, an average annual real-term increase of 5.5 per cent.
1.2 Following the Department’s recognition that wider economic factors were unlikely to allow this level of real-terms increase to continue, and in anticipation of the increased demand for NHS services expected over the same period, the Department commissioned a report which was produced in March 2009 by McKinsey. The report1 provided advice on how commissioners could generate efficiency savings in the NHS and quantified a possible NHS funding gap of £10 to £15 billion in 2013-14 (assuming 0 per cent funding allocation growth and current levels of productivity and demand).
1.3 The report concluded that there was scope for efficiency improvements of between £13 billion and £20 billion, over the next 3 to 5 years.1 It recommended that, to drive efficiency savings, a nationally-supported programme, delivered through the strategic health authorities and primary care trusts, should be set up and that the Department should also take direct actions to capture some opportunities, e.g. reductions in tariff prices. In order to deliver these savings it suggested that frameworks and tools should be developed and used alongside existing mechanisms. The McKinsey report was one of a number of inputs which helped the Department to understand the scale of the challenge and actions that could be taken to address the challenge.
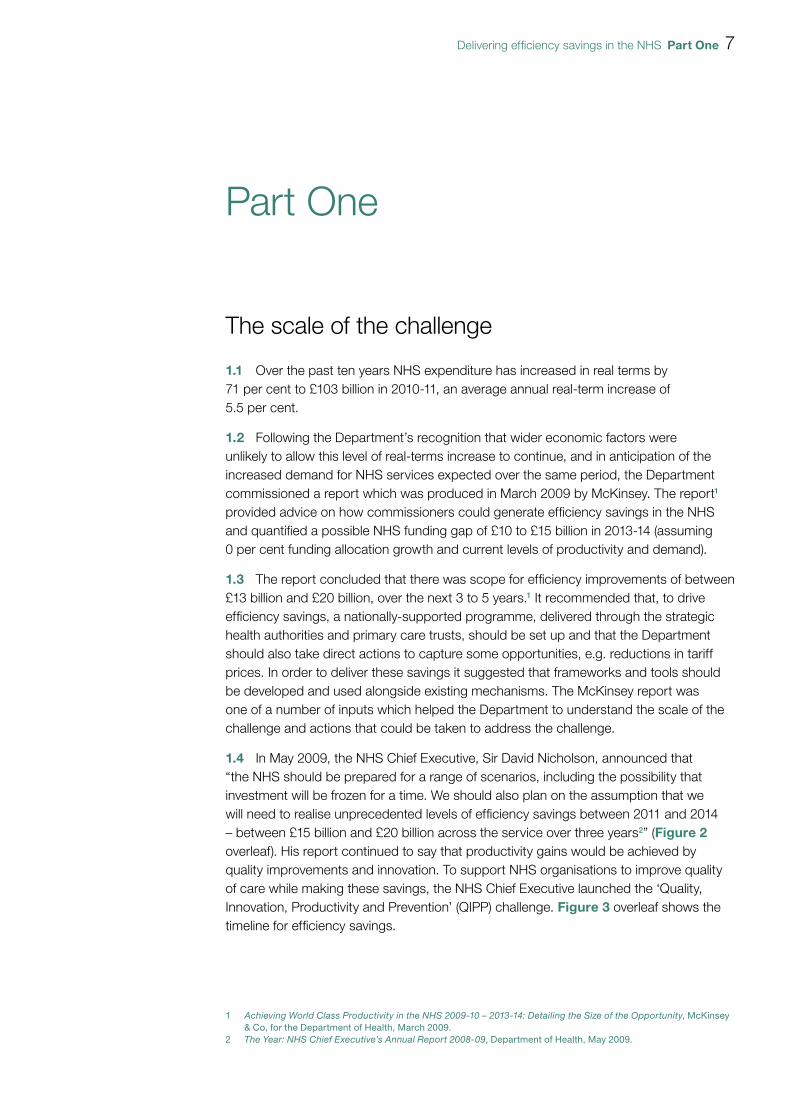
1.4 In May 2009, the NHS Chief Executive, Sir David Nicholson, announced that “the NHS should be prepared for a range of scenarios, including the possibility that investment will be frozen for a time. We should also plan on the assumption that we will need to realise unprecedented levels of efficiency savings between 2011 and 2014 – between £15 billion and £20 billion across the service over three years2” (Figure 2 overleaf). His report continued to say that productivity gains would be achieved by quality improvements and innovation. To support NHS organisations to improve quality of care while making these savings, the NHS Chief Executive launched the ‘Quality, Innovation, Productivity and Prevention’ (QIPP) challenge. Figure 3 overleaf shows the timeline for efficiency savings.
1 Achieving World Class Productivity in the NHS 2009-10 – 2013-14: Detailing the Size of the Opportunity, McKinsey & Co, for the Department of Health, March 2009.
2 The Year: NHS Chief Executive’s Annual Report 2008-09, Department of Health, May 2009.
8 Part One Delivering efficiency savings in the NHS
Figure 2Illustrative example of the efficiency challenge for an NHS organisation
£ million
Source: Department of Health
1,200
1,150
1,100
1,050
1,000
950
900
850
800
750
7002009-10 2010-11 2011-122006-07 2007-08 2008-09 2013-142012-13
Actual and planned primary care trusts allocations Scenario with ‘flat cash’ from 2010-11
Demand pressures Price pressures
800850
900950
1,000 1,000
3020
1,000
60
40
1,000
90
60£15 to £20 billionchallenge acrossthe health system
Figure 3Effi ciency savings timeline
2009 2010 2011
MarchMcKinsey report on efficiency savings
JanuaryQIPP plans for strategic health authorities
NovemberDavid Nicholson announces efficiency challenge
OctoberSpending review for 2011-12 to 2014-15
MarchStrategic health authority integrated plans
Up to £20 billion in efficiency savings (planned)
Source: National Audit Offi ce literature review
2014-15
Delivering efficiency savings in the NHS Part One 9
1.5 A number of factors have changed since November 2009, when the original assumptions were made.
OO The Spending Review3 settlement for the NHS covering the four years from 2011-12 to 2014-15, announced in October 2010, was higher than the autumn 2009 assumption, with NHS revenue budgets set to grow in real terms over the four years. The Review reflected the Government’s commitment to protect health spending with the total health budget set to increase by £10.6 billion between 2011-12 and 2014-15. Within this, total revenue spending is increasing by £11.1 billion with capital falling by £0.5 billion over the same period.
OO The adoption of a two-year pay freeze for most NHS staff, from 1 April 2011, will have a positive impact on efficiency between 2011-12 and 2013-14.
OO The Government has committed to reducing the costs of administration across the health system by one-third by 2014-15 from an agreed 2010-11 baseline. This includes a more than 45 per cent reduction in strategic health authority and primary care trust non-provider management costs4 detailed in the health White Paper, Equity and excellence: Liberating the NHS.5
1.6 The Department’s response to reviewing these developments was to retain the £20 billion challenge, but to extend the period over which the savings could be made to four years, from April 2011 to the end of 2014-15. The Department expects the savings to be reinvested in the NHS. The Department has identified three broad potential areas for savings:
OO centrally-driven savings (40 per cent) through pay freezes, central budgets and management cost savings;
OO provider-driven savings (40 per cent) through hospital staff productivity, procurement, primary care, mental health and community services; and
OO commissioner-driven savings (20 per cent) through urgent and emergency activity, elective care, prescribing and services from non-NHS bodies.
1.7 The Department has stated that it is confident it can deliver the centrally-driven savings, but acknowledges that it may not be able to achieve all the savings intended under the efficiency programme. Many provider-driven and commissioner-driven savings will require service change, such as migrating services from hospitals into the community. The Department recognises that these savings will be the most difficult to achieve.6
3 HM Treasury, Spending Review 2010, Cm 7942, October 2010.4 From 2011-12, primary care trusts are required to report their administration costs, which cover a wider definition
of expenditure than management costs, which they reported on prior to 2011-12.5 Department of Health, Equity and excellence: Liberating the NHS, Cm 7881, July 2010.6 HC Public Accounts Committee, National Health Service Landscape Review, Thirty-third Report of Session 2010-12,
HC 764, April 2011.
10 Part One Delivering efficiency savings in the NHS
The Quality, Innovation, Productivity and Prevention (QIPP) challenge
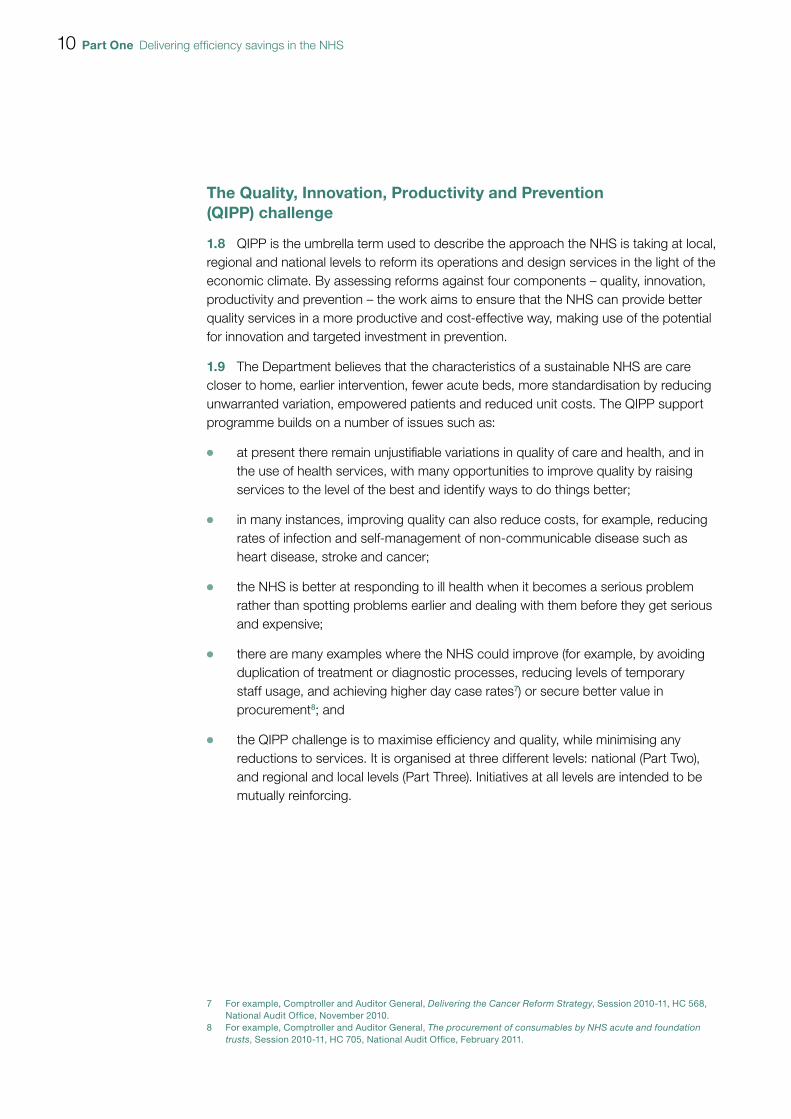
1.8 QIPP is the umbrella term used to describe the approach the NHS is taking at local, regional and national levels to reform its operations and design services in the light of the economic climate. By assessing reforms against four components – quality, innovation, productivity and prevention – the work aims to ensure that the NHS can provide better quality services in a more productive and cost-effective way, making use of the potential for innovation and targeted investment in prevention.
1.9 The Department believes that the characteristics of a sustainable NHS are care closer to home, earlier intervention, fewer acute beds, more standardisation by reducing unwarranted variation, empowered patients and reduced unit costs. The QIPP support programme builds on a number of issues such as:
OO at present there remain unjustifiable variations in quality of care and health, and in the use of health services, with many opportunities to improve quality by raising services to the level of the best and identify ways to do things better;
OO in many instances, improving quality can also reduce costs, for example, reducing rates of infection and self-management of non-communicable disease such as heart disease, stroke and cancer;
OO the NHS is better at responding to ill health when it becomes a serious problem rather than spotting problems earlier and dealing with them before they get serious and expensive;
OO there are many examples where the NHS could improve (for example, by avoiding duplication of treatment or diagnostic processes, reducing levels of temporary staff usage, and achieving higher day case rates7) or secure better value in procurement8; and
OO the QIPP challenge is to maximise efficiency and quality, while minimising any reductions to services. It is organised at three different levels: national (Part Two), and regional and local levels (Part Three). Initiatives at all levels are intended to be mutually reinforcing.
7 For example, Comptroller and Auditor General, Delivering the Cancer Reform Strategy, Session 2010-11, HC 568, National Audit Office, November 2010.
8 For example, Comptroller and Auditor General, The procurement of consumables by NHS acute and foundation trusts, Session 2010-11, HC 705, National Audit Office, February 2011.
Delivering efficiency savings in the NHS Part Two 11
Part Two
QIPP at a national level
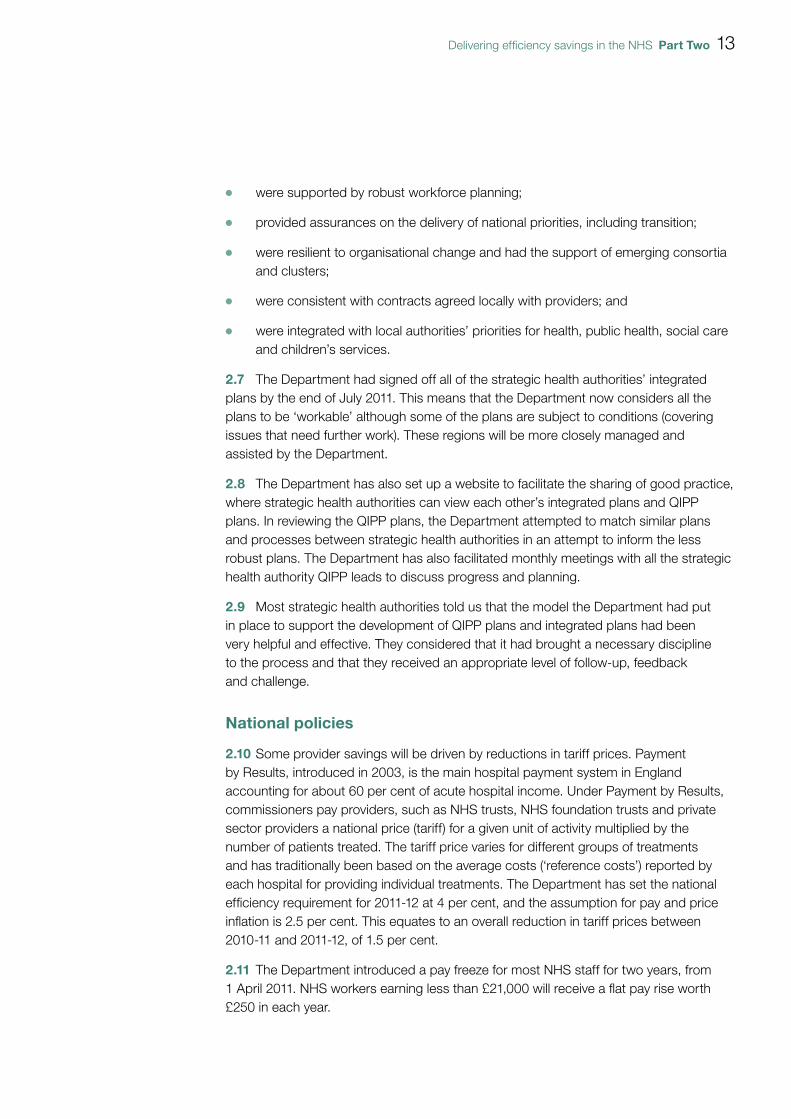
2.1 The NHS Chief Executive is accountable for the delivery of the QIPP challenge and will hold the NHS to account for doing so. The Department’s National Director for Improvement and Efficiency is in charge of the more detailed running of the QIPP challenge, run through a departmental programme management office. The Department has identified four key elements to its QIPP work:
OO Planning and monitoring. The Department has worked with strategic health authorities in 2010-11 to support them in developing QIPP savings plans. For 2011-12, strategic health authorities included these plans within their overall integrated plan (covering quality, resources and reform), which is signed off by the Department. The Department will monitor the NHS’s progress in delivering QIPP savings (see paragraphs 4.2 to 4.10).
OO National policies. The Department has national policy tools to support the QIPP challenge such as a pay freeze for NHS staff and a reduction in the price paid for some NHS services (the tariff).
OO Support programme. The Department has established a number of national workstreams to help identify areas where the NHS can improve quality and productivity.
OO Communication. The Department considers that communication is central to bring about the cultural change needed across the NHS to deliver the QIPP challenge.
Planning
2.2 In December 2009, the Department asked strategic health authorities to identify the level of efficiency savings that could be achieved in their area and to develop a QIPP savings plan covering the period 2010 to 2014. The Department required individual plans to be agreed by April 2010, although accepting they would change as the regional programmes to support the delivery of QIPP savings were developed. The Department asked strategic health authorities to refresh their plans by September 2010.

12 Part Two Delivering efficiency savings in the NHS
2.3 During the QIPP planning process, the Department provided strategic health authorities with a series of templates and criteria to assist in putting together their plans. For example:
OO A quality and productivity template, co-produced with the strategic health authorities was issued in February 2010. It contained advice on financial analysis, identifying opportunities, developing an implementation plan, the process and structure for implementation, engagement, risks and issues.
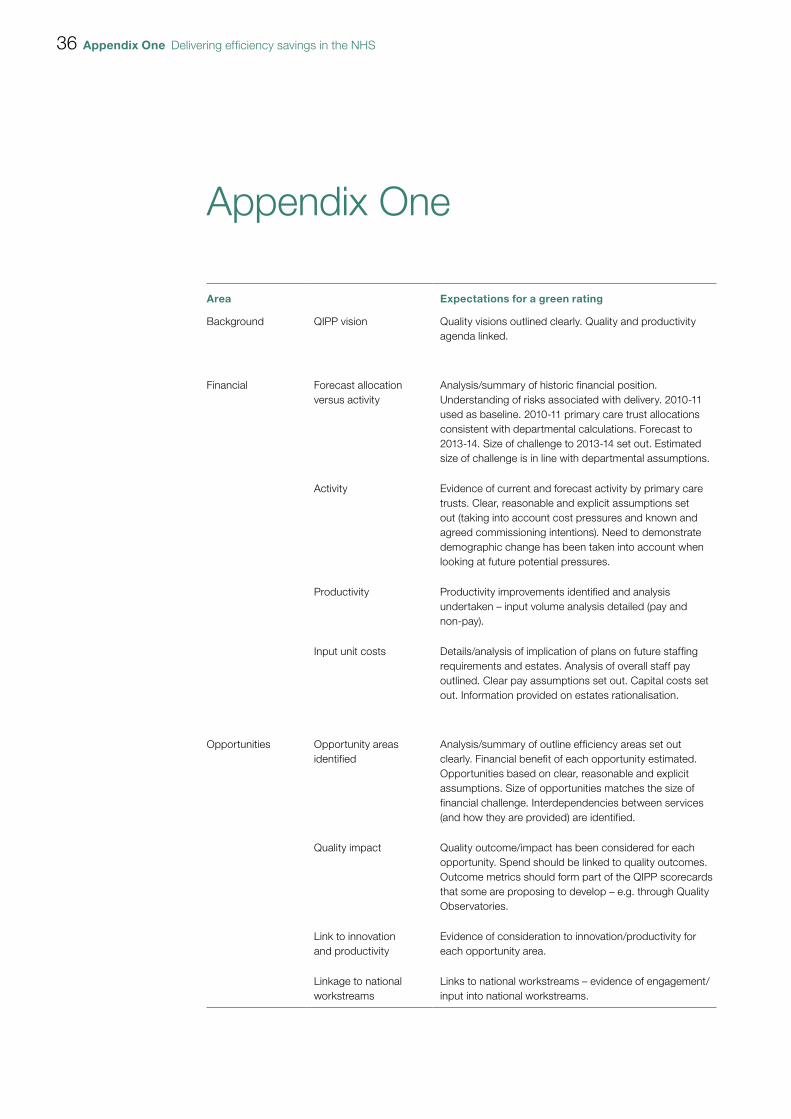
OO In February 2010, the Department launched a red, amber, green rating system which established the criteria against which it would assess the individual strategic health authority QIPP plans (Appendix One provides details of the green criteria).
OO An implementation tracker template was issued in July 2010 to allow an organisation or workstream to monitor and track performance against milestones and key performance indicators (quality, activity, workforce and finance) for each QIPP initiative and to demonstrate how risks are being mitigated.
2.4 In 2010, a Gateway Review rated the confidence of delivering QIPP as ‘amber’, indicating that successful delivery appears feasible but issues require management attention. As part of a study on productivity in 20109, the National Audit Office reviewed regional and national QIPP plans in relation to savings in hospitals. The review found that some of the national workstream plans were not yet sufficiently explicit in how they intend to engage and work with acute providers to either realise savings or demonstrate and measure effectiveness. While workstreams included some specific targets, poor baseline data for some of these meant that it would be difficult to measure the savings delivered by hospitals and progress against the nationally expected improvements. Our report noted that it was too early to audit the implementation of the plans at the time.
2.5 In 2011-12, the Department and the NHS have moved to an integrated planning process to address the combined challenges of QIPP, wider health reform and operational delivery. The Department’s expectation was that each locality would have a clear strategic vision for improvements in quality and productivity, together with plans for transition to the new system. It also expects NHS organisations to ensure that their plans support the delivery of the national priorities for the NHS, set out in the NHS Operating Framework for 2011-12.
2.6 The Department’s guidance on the new integrated planning process included the criteria against which it would assess individual plans. Each plan includes trajectories on relevant quality and reform indicators, financial indicators and workforce indicators. In reviewing the plans, the Department aimed to gain assurance that they:
OO represented a long-term vision with quality improvement and value for money at their heart;
OO were based on robust demand and activity assumptions over four years;
9 Comptroller and Auditor General report, Management of NHS hospital productivity, Session 2010-11, HC 491, National Audit Office, December 2010.
Delivering efficiency savings in the NHS Part Two 13
OO were supported by robust workforce planning;
OO provided assurances on the delivery of national priorities, including transition;
OO were resilient to organisational change and had the support of emerging consortia and clusters;
OO were consistent with contracts agreed locally with providers; and
OO were integrated with local authorities’ priorities for health, public health, social care and children’s services.
2.7 The Department had signed off all of the strategic health authorities’ integrated plans by the end of July 2011. This means that the Department now considers all the plans to be ‘workable’ although some of the plans are subject to conditions (covering issues that need further work). These regions will be more closely managed and assisted by the Department.
2.8 The Department has also set up a website to facilitate the sharing of good practice, where strategic health authorities can view each other’s integrated plans and QIPP plans. In reviewing the QIPP plans, the Department attempted to match similar plans and processes between strategic health authorities in an attempt to inform the less robust plans. The Department has also facilitated monthly meetings with all the strategic health authority QIPP leads to discuss progress and planning.
2.9 Most strategic health authorities told us that the model the Department had put in place to support the development of QIPP plans and integrated plans had been very helpful and effective. They considered that it had brought a necessary discipline to the process and that they received an appropriate level of follow-up, feedback and challenge.
National policies
2.10 Some provider savings will be driven by reductions in tariff prices. Payment by Results, introduced in 2003, is the main hospital payment system in England accounting for about 60 per cent of acute hospital income. Under Payment by Results, commissioners pay providers, such as NHS trusts, NHS foundation trusts and private sector providers a national price (tariff) for a given unit of activity multiplied by the number of patients treated. The tariff price varies for different groups of treatments and has traditionally been based on the average costs (‘reference costs’) reported by each hospital for providing individual treatments. The Department has set the national efficiency requirement for 2011-12 at 4 per cent, and the assumption for pay and price inflation is 2.5 per cent. This equates to an overall reduction in tariff prices between 2010-11 and 2011-12, of 1.5 per cent.
2.11 The Department introduced a pay freeze for most NHS staff for two years, from 1 April 2011. NHS workers earning less than £21,000 will receive a flat pay rise worth £250 in each year.
14 Part Two Delivering efficiency savings in the NHS
Support programme – national workstreams
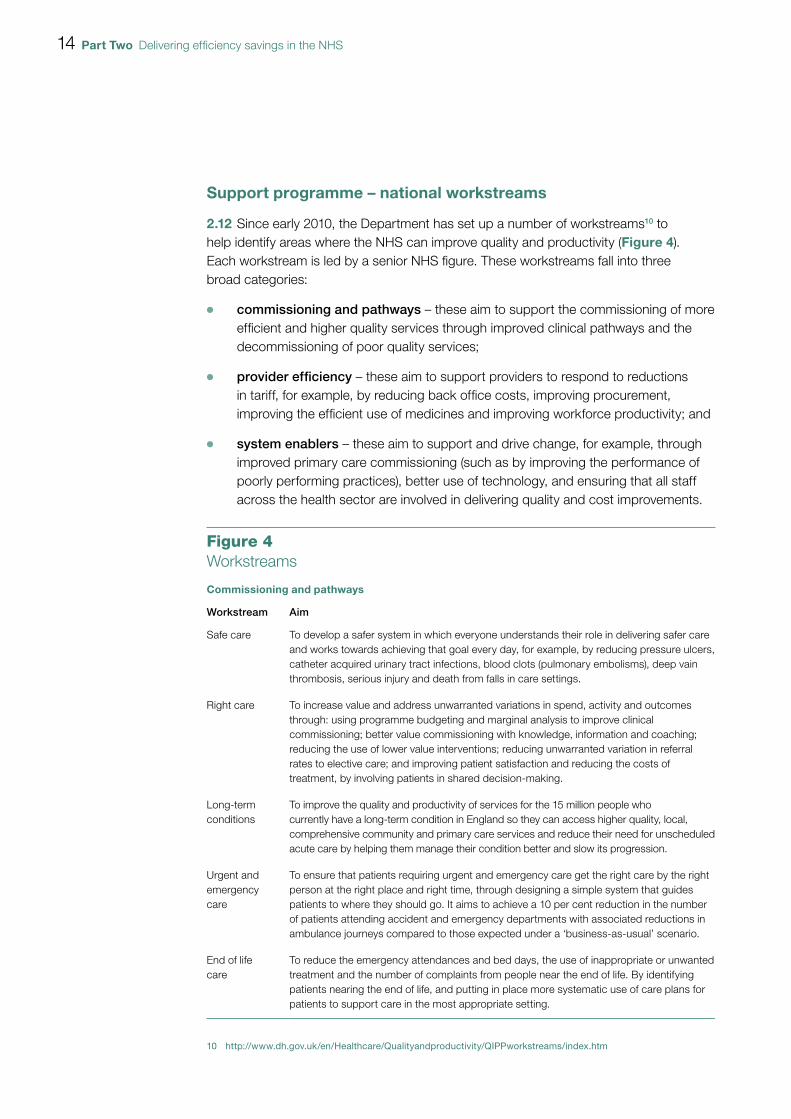
2.12 Since early 2010, the Department has set up a number of workstreams10 to help identify areas where the NHS can improve quality and productivity (Figure 4). Each workstream is led by a senior NHS figure. These workstreams fall into three broad categories:
OO commissioning and pathways – these aim to support the commissioning of more efficient and higher quality services through improved clinical pathways and the decommissioning of poor quality services;
OO provider efficiency – these aim to support providers to respond to reductions in tariff, for example, by reducing back office costs, improving procurement, improving the efficient use of medicines and improving workforce productivity; and
OO system enablers – these aim to support and drive change, for example, through improved primary care commissioning (such as by improving the performance of poorly performing practices), better use of technology, and ensuring that all staff across the health sector are involved in delivering quality and cost improvements.
10 http://www.dh.gov.uk/en/Healthcare/Qualityandproductivity/QIPPworkstreams/index.htm
Figure 4Workstreams
Commissioning and pathways
Workstream Aim
Safe care To develop a safer system in which everyone understands their role in delivering safer care and works towards achieving that goal every day, for example, by reducing pressure ulcers, catheter acquired urinary tract infections, blood clots (pulmonary embolisms), deep vain thrombosis, serious injury and death from falls in care settings.
Right care To increase value and address unwarranted variations in spend, activity and outcomes through: using programme budgeting and marginal analysis to improve clinical commissioning; better value commissioning with knowledge, information and coaching; reducing the use of lower value interventions; reducing unwarranted variation in referral rates to elective care; and improving patient satisfaction and reducing the costs of treatment, by involving patients in shared decision-making.
Long-term conditions
To improve the quality and productivity of services for the 15 million people who currently have a long-term condition in England so they can access higher quality, local, comprehensive community and primary care services and reduce their need for unscheduled acute care by helping them manage their condition better and slow its progression.
Urgent and emergency care
To ensure that patients requiring urgent and emergency care get the right care by the right person at the right place and right time, through designing a simple system that guides patients to where they should go. It aims to achieve a 10 per cent reduction in the number of patients attending accident and emergency departments with associated reductions in ambulance journeys compared to those expected under a ‘business-as-usual’ scenario.
End of life care
To reduce the emergency attendances and bed days, the use of inappropriate or unwanted treatment and the number of complaints from people near the end of life. By identifying patients nearing the end of life, and putting in place more systematic use of care plans for patients to support care in the most appropriate setting.
Delivering efficiency savings in the NHS Part Two 15
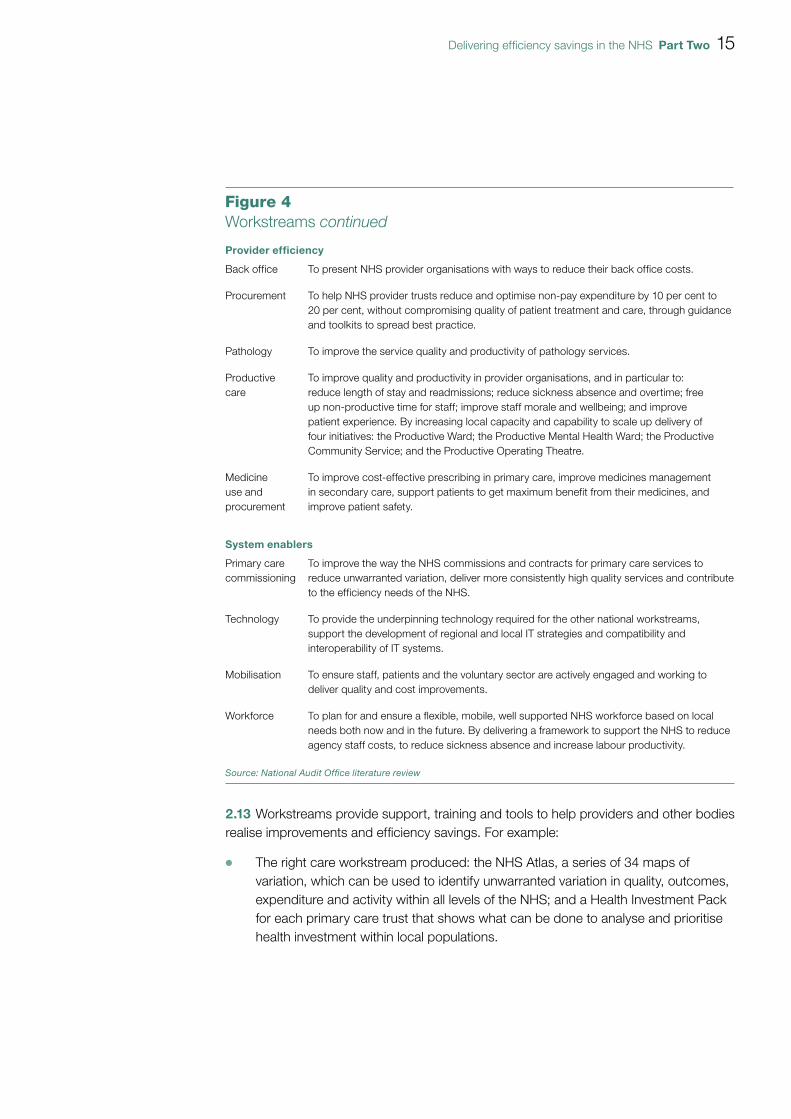
2.13 Workstreams provide support, training and tools to help providers and other bodies realise improvements and efficiency savings. For example:
OO The right care workstream produced: the NHS Atlas, a series of 34 maps of variation, which can be used to identify unwarranted variation in quality, outcomes, expenditure and activity within all levels of the NHS; and a Health Investment Pack for each primary care trust that shows what can be done to analyse and prioritise health investment within local populations.
Provider efficiency
Back office To present NHS provider organisations with ways to reduce their back office costs.
Procurement To help NHS provider trusts reduce and optimise non-pay expenditure by 10 per cent to 20 per cent, without compromising quality of patient treatment and care, through guidance and toolkits to spread best practice.
Pathology To improve the service quality and productivity of pathology services.
Productive care
To improve quality and productivity in provider organisations, and in particular to: reduce length of stay and readmissions; reduce sickness absence and overtime; free up non-productive time for staff; improve staff morale and wellbeing; and improve patient experience. By increasing local capacity and capability to scale up delivery of four initiatives: the Productive Ward; the Productive Mental Health Ward; the Productive Community Service; and the Productive Operating Theatre.
Medicine use and procurement
To improve cost-effective prescribing in primary care, improve medicines management in secondary care, support patients to get maximum benefit from their medicines, and improve patient safety.
System enablers
Primary care commissioning
To improve the way the NHS commissions and contracts for primary care services to reduce unwarranted variation, deliver more consistently high quality services and contribute to the efficiency needs of the NHS.
Technology To provide the underpinning technology required for the other national workstreams, support the development of regional and local IT strategies and compatibility and interoperability of IT systems.
Mobilisation To ensure staff, patients and the voluntary sector are actively engaged and working to deliver quality and cost improvements.
Workforce To plan for and ensure a flexible, mobile, well supported NHS workforce based on local needs both now and in the future. By delivering a framework to support the NHS to reduce agency staff costs, to reduce sickness absence and increase labour productivity.
Source: National Audit Offi ce literature review
Figure 4Workstreams continued
16 Part Two Delivering efficiency savings in the NHS
OO The workstream covering back office functions published a report, Back Office Efficiency and Management Optimisation, in November 2010, which outlines ways to simplify core functions (for example, by re-engineering processes around best practice), drive out unnecessary work and activities, standardise process and maximise opportunities for sharing services and cost bases.
OO Over a nine-month period, the clinical support programme offered participants four, two-day learning modules focusing on different aspects of leadership development, including self-directed problem solving and mentoring sessions.
2.14 The material generated by the national workstreams is shared with the strategic health authorities who are free to choose between the different schemes and adapt them to their local health economies as they see fit. Strategic health authorities can choose to use as many workstreams as they wish. Once a workstream becomes embedded and requires less management and clinical effort, strategic health authorities can pick new workstreams to develop.
2.15 The number of workstreams does not remain static. Originally, the Department established 12 workstreams. A few additional workstreams have been added, and it is likely that several will be removed as their functions get fulfilled. Some workstreams engage with organisations across the health sector including strategic health authorities, primary care trusts and providers, whereas for other workstreams all communication goes through the strategic health authorities.
2.16 Many of the national workstream leads were responsible for monitoring the uptake of their initiatives in strategic health authority plans. As of April 2011, the focus of national workstreams shifted as the NHS moved out of a planning phase into delivery of plans. The NHS Operating Framework for 2011-12 set out the way that the Department will monitor progress in the NHS, including progress on implementation of QIPP. The overall monitoring of delivery in the Department is led by the Department’s Performance Delivery Team, who work closely with strategic health authorities and policy teams to understand and performance manage progress. Monitoring performance is challenging for some QIPP workstreams because:
OO robust measures to assess progress have yet to be developed;
OO tracking and attributing financial benefits can be problematic as some strategic health authorities have individual targets attributed to each workstream but others are focusing on the overall savings; and
OO attributing savings to individual workstreams can be problematic, for example, the workforce and primary care workstreams are interrelated with the productive workstream making it difficult to measure and attribute financial savings independently.
Delivering efficiency savings in the NHS Part Two 17
2.17 Workstreams collaborate with a number of health organisations to develop ideas, support implementation and promote good practice. For example:
OO The NHS Evidence website hosts a collection of practical examples of how health and social care staff are improving quality and productivity across the NHS and social care.11 NHS staff can submit examples which are then evaluated by the National Institute for Health and Clinical Excellence (NICE). This evaluation is based on the degree to which the initiative meets the QIPP criteria for savings, quality, evidence and implementation; each criterion is given a score which are then combined to give an overall score. The overall score is used to identify the best examples, which are then shown on the website as ‘recommended’ or ‘highly recommended’.
OO The productive care workstream is overseen by the NHS Institute for Innovation and Improvement. The Institute is also developing a web-based tool which will identify key products and services that the Institute has available to help organisations with the implementation of the QIPP challenge.
2.18 Strategic health authorities told us that they found some of the workstreams very useful, such as the end of life care workstream and the right care workstream (and in particular the Atlas of Variation), but that overall, the majority of them were of limited use. They cited the fact that savings needed to be identified from the bottom up (i.e. what can work locally) and, therefore, national workstreams were of limited use. They also told us that some national workstreams were less proactive in their engagement with the health sector, which limited their usefulness.
Communication
2.19 The Department identified early on that in order for the QIPP challenge to be a success it would need to be embedded in all aspects of NHS work and that this would require cultural change. Communication underpins this by:
OO aligning NHS leaders so that they are working together and sharing information on QIPP plans;
OO gaining public, provider, policy maker and other stakeholder engagement; and
OO working with the Trade Unions on pay and tariff management.
2.20 The mobilisation workstream is focused on engaging and communicating the QIPP challenge to all stakeholders. The NHS Institute for Innovation and Improvement is assisting in the engagement process by leading work groups and sharing innovation and improvement techniques. A survey of NHS staff carried out over winter 2010, however, found that just under half of NHS staff were aware of the QIPP challenge.12
11 http://www.evidence.nhs.uk/qipp12 NHS staff tracking research – winter 2010 (research wave 5), GfK NOP Social Research for Department of Health,
June 2011.
18 Part Three Delivering efficiency savings in the NHS
Part Three
The QIPP challenge at a regional and local level
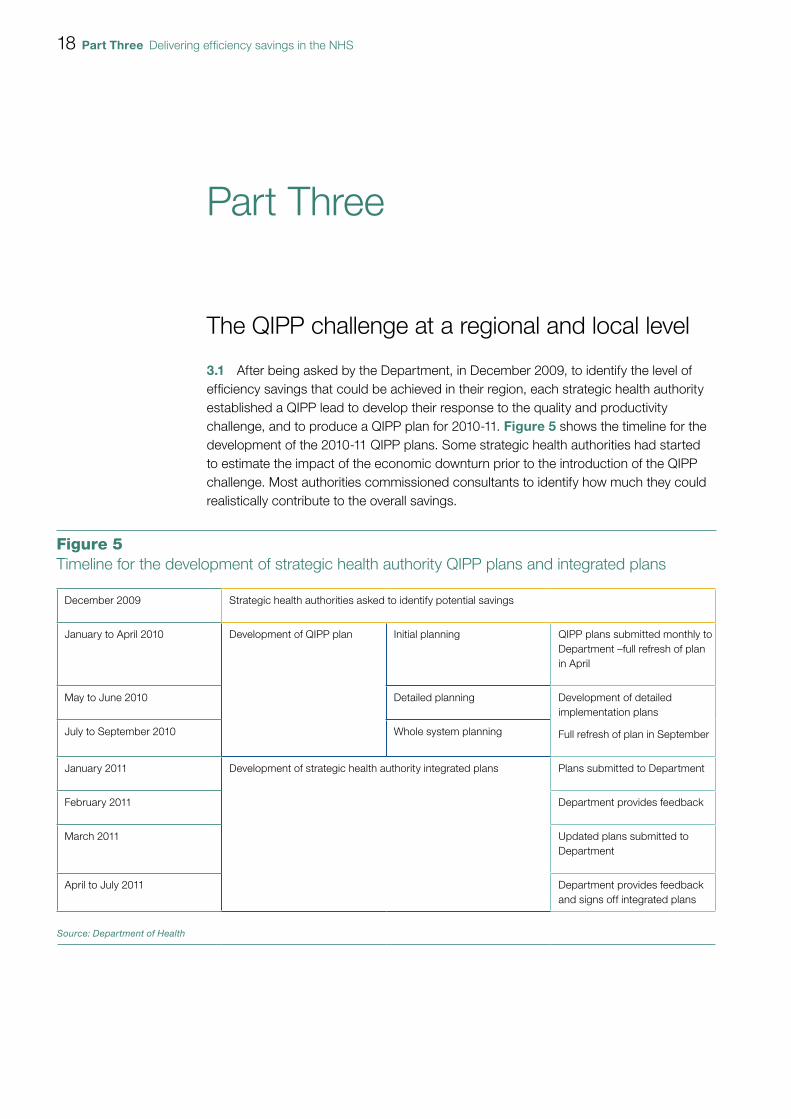
3.1 After being asked by the Department, in December 2009, to identify the level of efficiency savings that could be achieved in their region, each strategic health authority established a QIPP lead to develop their response to the quality and productivity challenge, and to produce a QIPP plan for 2010-11. Figure 5 shows the timeline for the development of the 2010-11 QIPP plans. Some strategic health authorities had started to estimate the impact of the economic downturn prior to the introduction of the QIPP challenge. Most authorities commissioned consultants to identify how much they could realistically contribute to the overall savings.
Figure 5Timeline for the development of strategic health authority QIPP plans and integrated plans
December 2009 Strategic health authorities asked to identify potential savings
January to April 2010 Development of QIPP plan Initial planning QIPP plans submitted monthly to Department –full refresh of plan in April
May to June 2010 Detailed planning Development of detailed implementation plans
Full refresh of plan in SeptemberJuly to September 2010 Whole system planning
January 2011 Development of strategic health authority integrated plans Plans submitted to Department
February 2011 Department provides feedback
March 2011 Updated plans submitted to Department
April to July 2011 Department provides feedback and signs off integrated plans
Source: Department of Health
Delivering efficiency savings in the NHS Part Three 19
3.2 The initial planning phase took around four months. Most strategic health authorities used the financial assumptions set out by the Department in the NHS Operating Framework for 2010-11 and a set of growth assumptions supplied by external consultants. In order to decide on areas where efficiency savings could be made and to give some structure to the process, all ten strategic health authorities developed regional workstreams in which savings were calculated and allocated, led by regional workstream leads or teams. These regional workstreams tended to overlap with the national workstreams but did not necessarily match them.
3.3 In each region, this initial planning phase was followed by a more detailed bottom-up planning phase whereby primary care trusts were consulted on the feasibility and achievability of all the proposed savings. Primary care trusts were asked to develop their local plans, working with their main providers, emerging GP consortia and social services, using some of the assumptions, tools and methodologies developed by strategic health authorities. Strategic health authority plans were then revised to reflect the aggregation of their primary care trusts’ plans.
3.4 In 2011-12, the Department and the NHS moved to an integrated planning process to reflect the challenges of QIPP, reform and operational delivery, as set out in the NHS Operating Framework for 2011-12. QIPP work was included in the strategic health authorities’ integrated plans, which brought together all of the key requirements across the three areas of quality, resources and reform. Figure 5 shows the timeline for the development of integrated plans. The QIPP elements of the plans evolved from the 2010-11 QIPP plans, and set out their expectations over the next four years, with delivery commitments and milestones for 2011-12. The plans describe the overall improvements required in terms of quality, productivity, management of resources and capacity building for the new system.
3.5 Some strategic health authorities have more comprehensive integrated plans than others. For example, some plans clearly demonstrate how the national workstreams are being taken forward at the regional and local level. The least comprehensive plans tended to be from those authorities which operate in a more decentralised way.
3.6 A significant reduction in management and administrative costs is expected to be made through the changes to commissioning and the dissolution of the strategic health authorities and primary care trusts. These savings form part of the one-third real-terms savings in administration costs and will vary by strategic health authority. All the integrated plans of strategic health authorities take account of the management cost savings, in line with local flexibility, although some include this saving as part of their QIPP savings whereas others do not. For example, the approach taken in one authority was to keep management cost savings separate from the QIPP savings because the management cost savings were used to fund the £2 per head for clinical commissioning groups, in line with NHS Operating Framework for 2011-12.
20 Part Three Delivering efficiency savings in the NHS
3.7 Communication is seen as key to delivering the QIPP savings (paragraphs 2.19-2.20). Most regional workstreams have engagement programmes and each strategic health authority has a strategy for communicating the changes that will take place as a result of work to meet the QIPP challenge to their locale and the wider public.
3.8 Each strategic health authority plan should be an aggregate of primary care trust or cluster information. The primary care trusts that we spoke to had identified early on that engagement of clinical staff was key to successfully achieving the QIPP challenge and that planning should be led by clinicians. Primary care trusts recalculated the savings from the bottom-up level. Some primary care trusts had already started to identify savings prior to the QIPP challenge (often as result of being in financial deficit in the past) and believe that they are now in a better position to realise savings.
3.9 Each primary care trust or cluster has a four-year QIPP plan, with a number of work programmes which are aligned to regional and national workstreams. As the plans are likely to outlive the lifespan of strategic health authorities and primary care trusts, the Department recommended that existing and emerging clinical commissioning groups (formerly GP consortia) should be fully involved in shaping the development of their primary care trusts’ plans. They also recommended that emerging clusters should be involved in the planning process. The level of engagement with consortia varies across the country depending on how well developed the consortia are in the region. These plans are continuing to evolve.
Identified QIPP savings
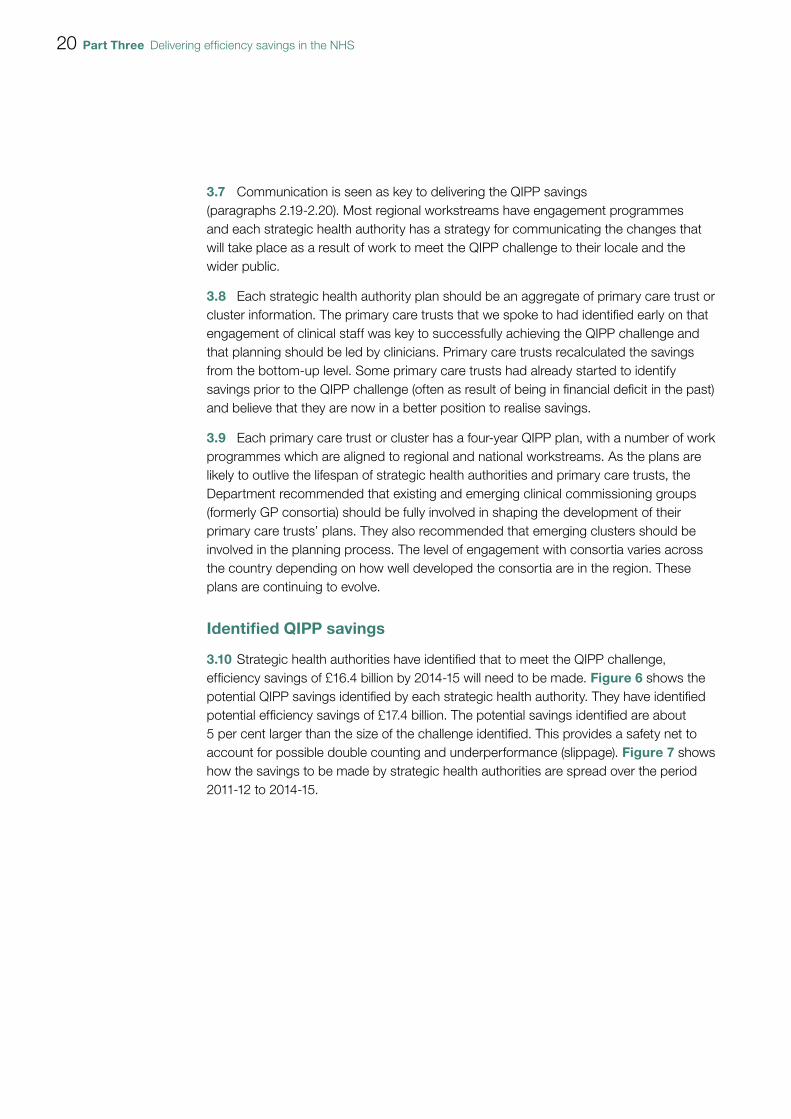
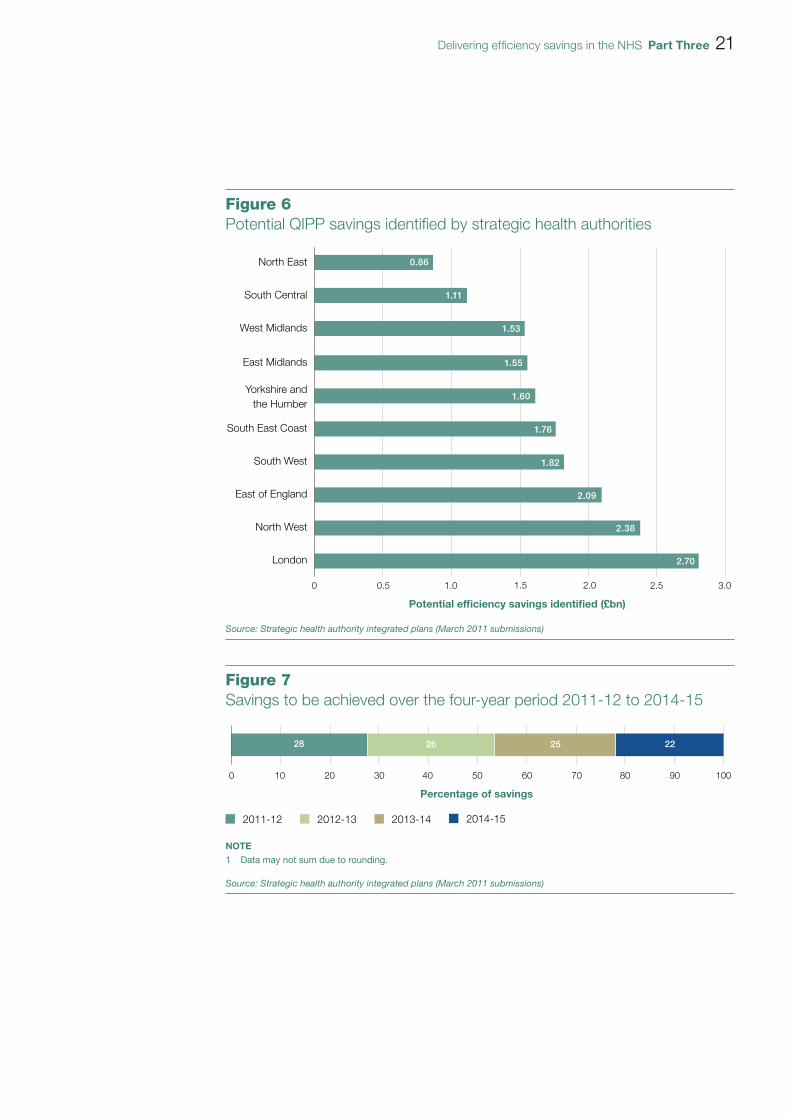
3.10 Strategic health authorities have identified that to meet the QIPP challenge, efficiency savings of £16.4 billion by 2014-15 will need to be made. Figure 6 shows the potential QIPP savings identified by each strategic health authority. They have identified potential efficiency savings of £17.4 billion. The potential savings identified are about 5 per cent larger than the size of the challenge identified. This provides a safety net to account for possible double counting and underperformance (slippage). Figure 7 shows how the savings to be made by strategic health authorities are spread over the period 2011-12 to 2014-15.
Delivering efficiency savings in the NHS Part Three 21
0 0.5 1.0 1.5 2.0 2.5 3.0
Source: Strategic health authority integrated plans (March 2011 submissions)
Figure 6Potential QIPP savings identified by strategic health authorities
North East
Potential efficiency savings identified (£bn)
South Central
Yorkshire andthe Humber
West Midlands
East Midlands
South East Coast
South West
East of England
North West
London
0.86
1.11
1.53
1.55
1.60
1.76
1.82
2.09
2.38
2.70
100 20 30 40 50 60 70 80 90 100
NOTE1 Data may not sum due to rounding.
Source: Strategic health authority integrated plans (March 2011 submissions)
Figure 7Savings to be achieved over the four-year period 2011-12 to 2014-15
Percentage of savings
2011-12 2012-13 2013-14 2014-15
28 26 25 22
22 Part Three Delivering efficiency savings in the NHS
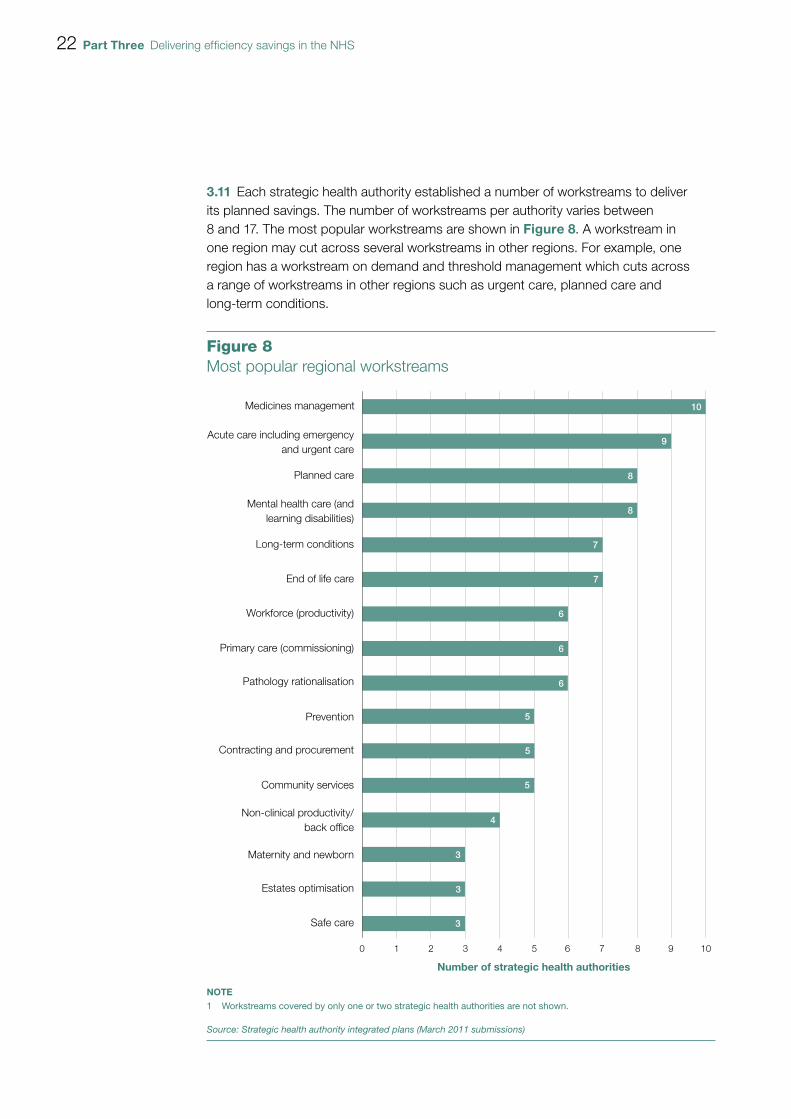
3.11 Each strategic health authority established a number of workstreams to deliver its planned savings. The number of workstreams per authority varies between 8 and 17. The most popular workstreams are shown in Figure 8. A workstream in one region may cut across several workstreams in other regions. For example, one region has a workstream on demand and threshold management which cuts across a range of workstreams in other regions such as urgent care, planned care and long-term conditions.
Figure 8Most popular regional workstreams
Medicines management
NOTE1 Workstreams covered by only one or two strategic health authorities are not shown.
Source: Strategic health authority integrated plans (March 2011 submissions)
10 2 3 4 5 6 7 8 9 10
Number of strategic health authorities
Acute care including emergencyand urgent care
Planned care
Mental health care (andlearning disabilities)
Long-term conditions
End of life care
Workforce (productivity)
Primary care (commissioning)
Pathology rationalisation
Prevention
Contracting and procurement
Community services
Non-clinical productivity/back office
Maternity and newborn
Safe care
Estates optimisation
10
9
8
8
7
6
5
4
3
7
6
6
5
5
3
3
Delivering efficiency savings in the NHS Part Three 23
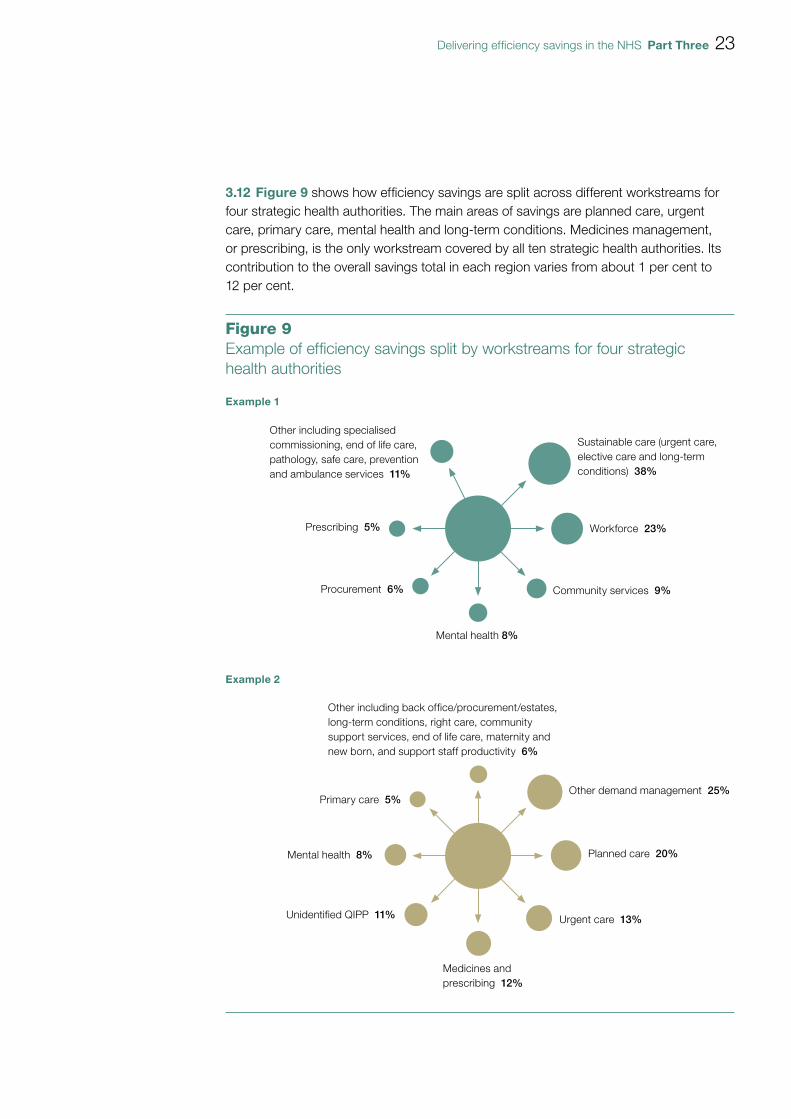
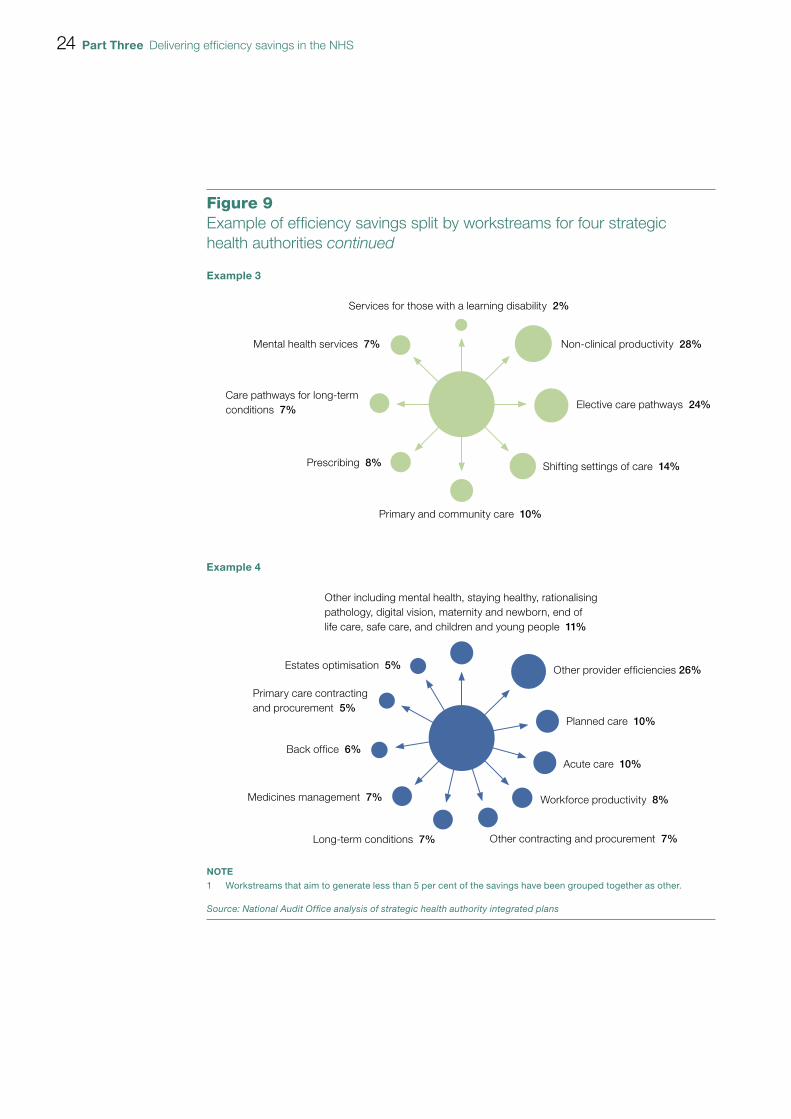
3.12 Figure 9 shows how efficiency savings are split across different workstreams for four strategic health authorities. The main areas of savings are planned care, urgent care, primary care, mental health and long-term conditions. Medicines management, or prescribing, is the only workstream covered by all ten strategic health authorities. Its contribution to the overall savings total in each region varies from about 1 per cent to 12 per cent.
Figure 9Example of effi ciency savings split by workstreams for four strategic health authorities
Sustainable care (urgent care, elective care and long-term conditions) 38%
Workforce 23%
Community services 9%
Mental health 8%
Procurement 6%
Prescribing 5%
Other including specialised commissioning, end of life care, pathology, safe care, preventionand ambulance services 11%
Other demand management 25%
Planned care 20%
Urgent care 13%
Medicines and prescribing 12%
Unidentified QIPP 11%
Mental health 8%
Primary care 5%
Other including back office/procurement/estates, long-term conditions, right care, community support services, end of life care, maternity and new born, and support staff productivity 6%
Example 1
Example 2
24 Part Three Delivering efficiency savings in the NHS
Figure 9Example of effi ciency savings split by workstreams for four strategic health authorities continued
Non-clinical productivity 28%
Elective care pathways 24%
Shifting settings of care 14%
Primary and community care 10%
Prescribing 8%
Care pathways for long-term conditions 7%
Mental health services 7%
Services for those with a learning disability 2%
Other provider efficiencies 26%
Planned care 10%
Acute care 10%
Other contracting and procurement 7%
Medicines management 7%
Back office 6%
Primary care contracting and procurement 5%
Workforce productivity 8%
Long-term conditions 7%
Estates optimisation 5%
Other including mental health, staying healthy, rationalising pathology, digital vision, maternity and newborn, end of life care, safe care, and children and young people 11%
Example 4
Example 3
NOTE1 Workstreams that aim to generate less than 5 per cent of the savings have been grouped together as other.
Source: National Audit Offi ce analysis of strategic health authority integrated plans
Delivering efficiency savings in the NHS Part Three 25
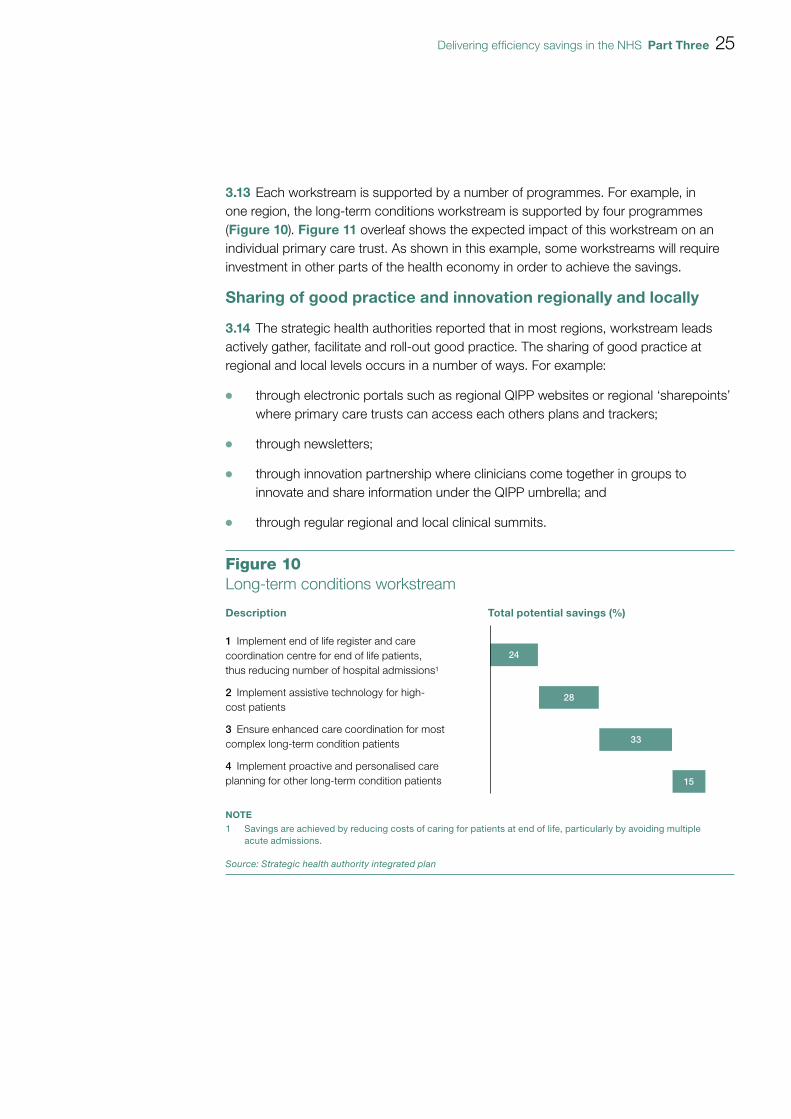
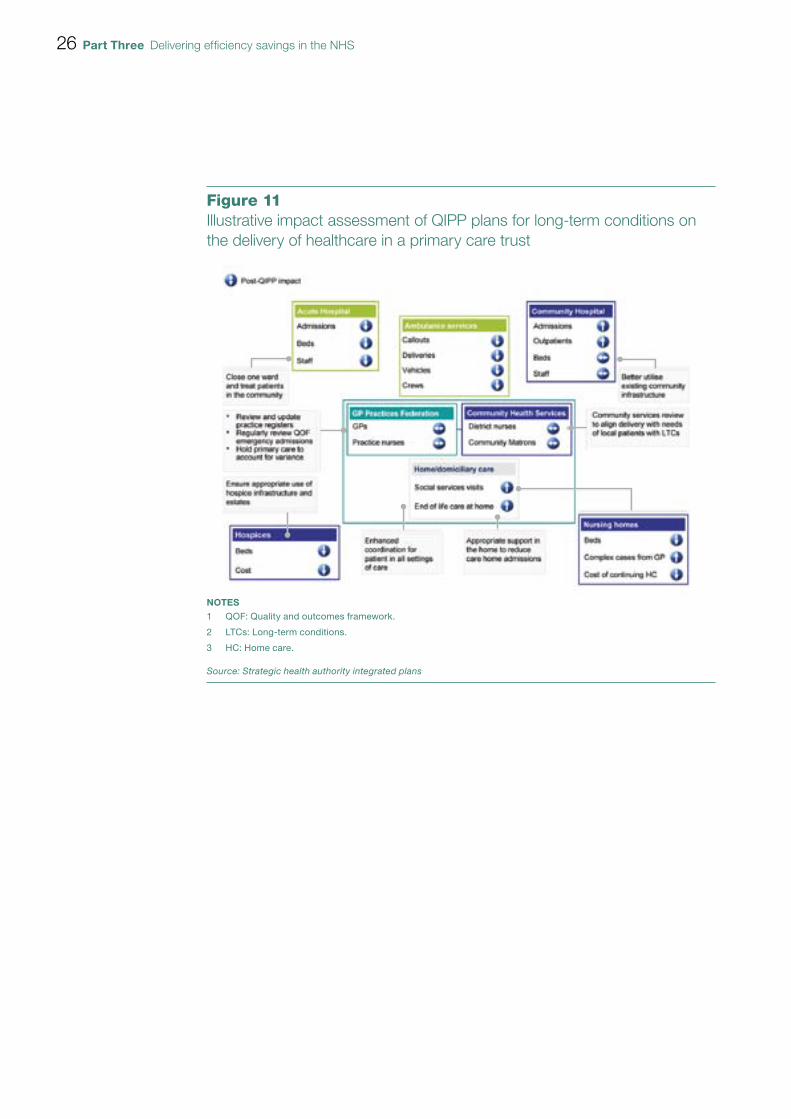
3.13 Each workstream is supported by a number of programmes. For example, in one region, the long-term conditions workstream is supported by four programmes (Figure 10). Figure 11 overleaf shows the expected impact of this workstream on an individual primary care trust. As shown in this example, some workstreams will require investment in other parts of the health economy in order to achieve the savings.
Sharing of good practice and innovation regionally and locally
3.14 The strategic health authorities reported that in most regions, workstream leads actively gather, facilitate and roll-out good practice. The sharing of good practice at regional and local levels occurs in a number of ways. For example:
OO through electronic portals such as regional QIPP websites or regional ‘sharepoints’ where primary care trusts can access each others plans and trackers;
OO through newsletters;
OO through innovation partnership where clinicians come together in groups to innovate and share information under the QIPP umbrella; and
OO through regular regional and local clinical summits.
24
28
33
15
Figure 10Long-term conditions workstream
Description Total potential savings (%)
1 Implement end of life register and care coordination centre for end of life patients, thus reducing number of hospital admissions1
2 Implement assistive technology for high-cost patients
3 Ensure enhanced care coordination for most complex long-term condition patients
4 Implement proactive and personalised care planning for other long-term condition patients
NOTE1 Savings are achieved by reducing costs of caring for patients at end of life, particularly by avoiding multiple
acute admissions.
Source: Strategic health authority integrated plan
26 Part Three Delivering efficiency savings in the NHS
Figure 11Illustrative impact assessment of QIPP plans for long-term conditions on the delivery of healthcare in a primary care trust
NOTES1 QOF: Quality and outcomes framework.
2 LTCs: Long-term conditions.
3 HC: Home care.
Source: Strategic health authority integrated plans
Delivering efficiency savings in the NHS Part Four 27
Part Four
Monitoring progress against the QIPP challenge
4.1 The Department monitors performance of the NHS as set out in the NHS Operating Framework 2011-12, and as part of that will monitor progress against the QIPP challenge. However, the main weight of assurance and oversight lies with the individual strategic health authorities and their monitoring of all their workstreams, primary care trusts, providers and local health economies.
Departmental monitoring
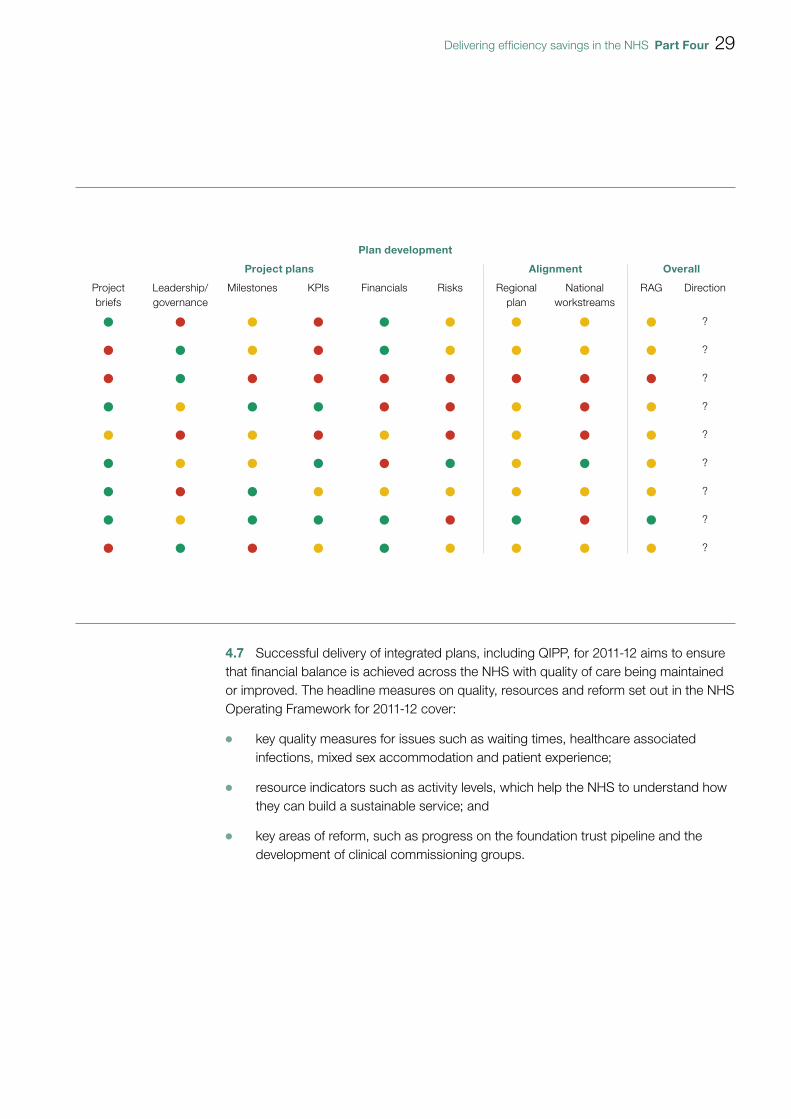
4.2 In 2010-11, the Department’s QIPP Programme Management Office was responsible for monitoring QIPP planning. The Department provided strategic health authorities with a report card template, in August 2010, to support the move towards summary reporting as authorities’ QIPP plans became more robust. The report card provides a high level summary of progress in plan development (if still underway) and of implementation progress against plan (Figure 12 overleaf).
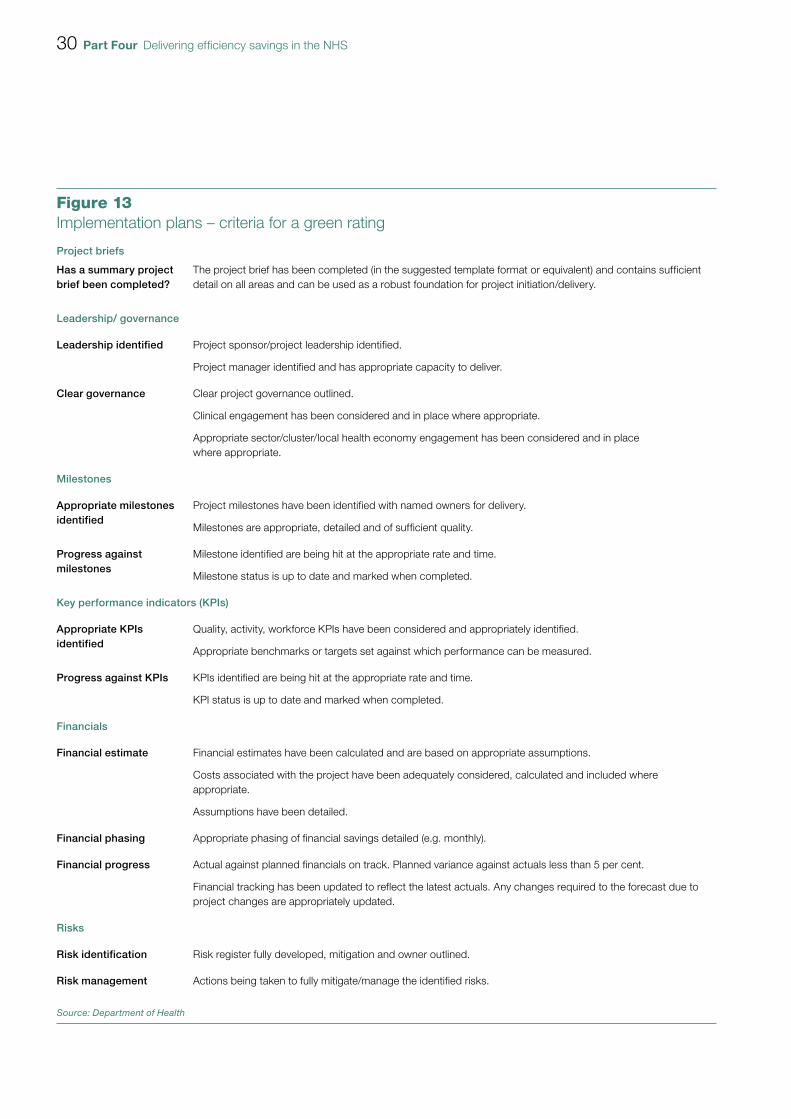
4.3 The report card also provided details of their planned and actual savings, including an exception report on those that are not on track; potential best practice examples; and a risk management log. They were signed off by the responsible strategic health authority directors including the QIPP lead. Strategic health authorities submitted their report card on a monthly basis to the Department until March 2011. The Department established a system of red, amber, green ratings against which it assesses strategic health authorities’ QIPP implementation plans (Figure 13 on page 30).
4.4 During 2010-11, the Department undertook a series of ‘deep dives’ into regional workstreams. This was to review alignment of QIPP plans, systems and process between the relevant strategic health authority, primary care trusts and providers and also to check that all parties understood what the QIPP savings represent. They identified best practice, which was then shared, and areas where further work, assistance, or guidance was needed.

28 Part Four Delivering efficiency savings in the NHS
4.5 The ‘deep dives’ were conducted at a mutually agreed time between the strategic health authority, the Department and primary care trusts and include representatives of clinical bodies and other providers to ensure that all communications regarding QIPP savings are understood by all. Examples of specific feedback points included opportunities to be paired up with other strategic health authorities in order to benefit from their planning and the need to include other stakeholder groups, such as GPs.
4.6 In 2011-12, as QIPP moved out of the planning phase and into the delivery phase, the Department moved from monitoring the production of plans into monitoring delivery. The NHS Operating Framework for 2011-12 set out the way that the Department will monitor progress in the NHS, including progress on implementation of QIPP. The overall monitoring of delivery in the Department is led by the Department’s Performance Delivery Team, who work with strategic health authorities and the Department’s policy teams to understand and performance manage progress.
Figure 12Illustrative example of part of the report card template
Progress against plan
Key performance indicators (KPIs) Overall
Milestones Quality Activity Workforce Finance Monitoring risks
RAG Direction
?
?
?
?
?
?
?
?
?
NOTE1 Each line represents the ratings for a regional workstream or a local health economy, primary care trust or provider.
Source: Department of Health
Delivering efficiency savings in the NHS Part Four 29
4.7 Successful delivery of integrated plans, including QIPP, for 2011-12 aims to ensure that financial balance is achieved across the NHS with quality of care being maintained or improved. The headline measures on quality, resources and reform set out in the NHS Operating Framework for 2011-12 cover:
OO key quality measures for issues such as waiting times, healthcare associated infections, mixed sex accommodation and patient experience;
OO resource indicators such as activity levels, which help the NHS to understand how they can build a sustainable service; and
OO key areas of reform, such as progress on the foundation trust pipeline and the development of clinical commissioning groups.
Plan development
Project plans Alignment Overall
Project briefs
Leadership/ governance
Milestones KPIs Financials Risks Regional plan
National workstreams
RAG Direction
?
?
?
?
?
?
?
?
?
30 Part Four Delivering efficiency savings in the NHS
Figure 13Implementation plans – criteria for a green rating
Project briefs
Has a summary project brief been completed?
The project brief has been completed (in the suggested template format or equivalent) and contains sufficient detail on all areas and can be used as a robust foundation for project initiation/delivery.
Leadership/ governance
Leadership identified Project sponsor/project leadership identified.
Project manager identified and has appropriate capacity to deliver.
Clear governance Clear project governance outlined.
Clinical engagement has been considered and in place where appropriate.
Appropriate sector/cluster/local health economy engagement has been considered and in place where appropriate.
Milestones
Appropriate milestones identified
Project milestones have been identified with named owners for delivery.
Milestones are appropriate, detailed and of sufficient quality.
Progress against milestones
Milestone identified are being hit at the appropriate rate and time.
Milestone status is up to date and marked when completed.
Key performance indicators (KPIs)
Appropriate KPIs identified
Quality, activity, workforce KPIs have been considered and appropriately identified.
Appropriate benchmarks or targets set against which performance can be measured.
Progress against KPIs KPIs identified are being hit at the appropriate rate and time.
KPI status is up to date and marked when completed.
Financials
Financial estimate Financial estimates have been calculated and are based on appropriate assumptions.
Costs associated with the project have been adequately considered, calculated and included where appropriate.
Assumptions have been detailed.
Financial phasing Appropriate phasing of financial savings detailed (e.g. monthly).
Financial progress Actual against planned financials on track. Planned variance against actuals less than 5 per cent.
Financial tracking has been updated to reflect the latest actuals. Any changes required to the forecast due to project changes are appropriately updated.
Risks
Risk identification Risk register fully developed, mitigation and owner outlined.
Risk management Actions being taken to fully mitigate/manage the identified risks.
Source: Department of Health
Delivering efficiency savings in the NHS Part Four 31
4.8 The Department’s monitoring of efficiencies will focus on several key areas, including those savings which are driven by changes in demand, and those which are cash releasing. Monitoring will also assess the reinvestment of these savings.
4.9 Progress against the comprehensive set of indicators in the NHS Operating Framework for 2011-12 will be regularly published in the Quarter13, ensuring an account of progress is publicly available. The Department will hold the NHS to account across this range of indicators.
4.10 There are some areas of QIPP where cost savings or quality improvements will not be apparent until substantial transformational change programmes have taken place locally. As part of the 2011-12 planning process, the Department has been working with strategic health authorities to agree milestones for the transformational change elements of their plans, which will then be used to support monitoring of progress on building the foundations for QIPP and reform.
Regional and local monitoring
4.11 In most strategic health authorities, monitoring of the QIPP challenge is evolving. Much of the QIPP monitoring is carried out by existing performance management teams within the strategic health authorities and has been built into the general monthly reporting (core returns) of performance to date.
4.12 Monitoring information tends to focus on activity data, workforce data and financial data, including the information on indicators set out in the NHS Operating Framework for 2011-12. Some of the activities underway will not generate outcomes for a few years. For these activities, strategic health authorities and the Department will monitor progress against key milestones. Financial monitoring is carried out on a quarterly basis using the Financial Information Management Systems (FIMS), which is the system through which trusts report their results to the Department and strategic health authorities. Activity and workforce data comes from a wide range of sources.
4.13 Different approaches have been taken in different strategic health authorities:
OO some have established project management offices in primary care trusts/clusters to assist with the monitoring of progress;
OO some have set up their monitoring arrangements to mirror their reporting to the Department using the report card format;
OO some areas performed their own ‘deep dives’ similar to those undertaken by the Department; and
OO one strategic health authority is developing an integrated dashboard for all primary care trusts to help them interpret progress against targets.
13 A quarterly departmental publication that provides a summary of the NHS financial position and performance against the national priorities set out in the NHS Operating Framework.
32 Part Four Delivering efficiency savings in the NHS
4.14 At a primary care trust level, monitoring is managed via numerous tools and processes including dashboard style reporting, board level monitoring and clinical level monitoring. Some have commissioned tools to support their monitoring activity.
4.15 Strategic health authorities highlighted a number of issues relating to monitoring including:
OO the time lag between action and saving accrual for some workstreams;
OO the lack of real-time data in some areas and poor/different data definitions are a hindrance to accurate reporting;
OO a loss of informatics staff is limiting the monitoring ability of some organisations;
OO foundation trusts do not have to provide data for monitoring purposes;
OO double counting is an issue across workstreams, but most strategic health authorities have mitigated this risk by only allowing one workstream to count a saving; and
OO data validation remains a challenge especially in the community and mental health settings.
Governance
4.16 Existing accountability arrangements will remain in place at a national level during 2011-12 and 2012-13, with the NHS Chief Executive remaining accountable for delivery. The NHS Chief Executive will hold the NHS to account for delivery of the requirements set out in the NHS Operating Framework for 2011-12 through a single integrated process. Strategic health authorities will remain accountable, at regional level during 2011-12 and 2012-13, for operational delivery and the transition to new commissioning arrangements. By the end of October 2011, the ten strategic health authorities will be clustered into four groups.
4.17 The primary care trust clusters that are now in place aim to sustain capacity in the system to oversee management and implementation of medium-term QIPP plans. From June 2011, at the latest, clusters will be responsible for ‘ownership and leadership’ of cluster-wide QIPP plans. From June 2011 to April 2013, they will be responsible for ongoing management and updating of medium-term QIPP plans, but should slowly hand over responsibility for them to clinical commissioning groups responsible for local delivery. This will be overseen and supported by the NHS Commissioning Board, who will take full control of implementation of the QIPP challenge from April 2013 onwards. In 2013-14, they will be carrying out QIPP plans developed between them and the primary care trusts cluster, and then they will be fully responsible for developing the QIPP plans for 2014-15.

Delivering efficiency savings in the NHS Part Four 33
4.18 Through cluster arrangements, primary care trusts must work with clinical commissioning groups to develop their operating plans. In some areas QIPP savings projections have been disaggregated to the level of commissioning groups and developing commissioning groups have been encouraged and supported to take on areas of QIPP delivery for which they are best placed.
34 Part Five Delivering efficiency savings in the NHS
Part Five
Challenges for achieving QIPP
5.1 Given the scale of the proposed efficiencies over the next four years and the fact that it coincides with the period of transformation of the NHS to achieve the wider reforms, effective risk management will be crucial. Risk registers are maintained on the QIPP challenge, at national, regional and local levels. Maintaining momentum over this four-year period, during a period of organisational change will be challenging. For example:
OO can clear governance and monitoring arrangements be maintained over a period where new structures are being created and where roles and responsibilities are changing?
OO can strong management of the QIPP challenge be maintained at a time when management capacity is diminishing with clustering and the dissolution of strategic health authorities and primary care trusts?
OO can staff at all levels remain focused on the achievement of efficiency improvements during the abolition of strategic health authorities and primary care trusts, which have a lead role in delivering the QIPP agenda, and the establishment of new organisations?
OO will those clinical commissioning groups that are not ready in 2013 still be able to deliver the level of efficiency savings needed, especially as the QIPP challenge is likely to get harder each year?
OO can those GPs who will not be directly involved in commissioning as part of a clinical commissioning consortium be engaged on the QIPP challenge?
OO can all providers be encouraged to make efficiency savings, given that we were told some providers are unwilling or unable to make efficiency savings?
OO can efficiency savings be delivered though the tariff without financially destabilising trusts?

Delivering efficiency savings in the NHS Part Five 35
OO can efficiency savings be delivered when local authorities are looking to reduce their social care budgets, which may increase demand for NHS services?
OO can a programme of support that is more focused on enabling and encouraging, rather than enforcing, deliver savings at the right pace?
OO can, as a minimum, quality and patient safety levels be maintained?
5.2 Achieving the efficiency savings will require a culture change involving clinicians, commissioners, patients and the wider public, and politicians:
OO can clinicians change their referral behaviour and patterns of work?
OO can commissioners drive service transformation through better commissioning of services?
OO will patients and the wider public accept that where they receive services may change, and that acute providers may reduce in size or even close?
OO will politicians support changes to the delivery of their local health service?
36 Appendix One Delivering efficiency savings in the NHS
Appendix One
Area Expectations for a green rating
Background QIPP vision Quality visions outlined clearly. Quality and productivity agenda linked.
Financial Forecast allocation versus activity
Analysis/summary of historic financial position. Understanding of risks associated with delivery. 2010-11 used as baseline. 2010-11 primary care trust allocations consistent with departmental calculations. Forecast to 2013-14. Size of challenge to 2013-14 set out. Estimated size of challenge is in line with departmental assumptions.
Activity Evidence of current and forecast activity by primary care trusts. Clear, reasonable and explicit assumptions set out (taking into account cost pressures and known and agreed commissioning intentions). Need to demonstrate demographic change has been taken into account when looking at future potential pressures.
Productivity Productivity improvements identified and analysis undertaken – input volume analysis detailed (pay and non-pay).
Input unit costs Details/analysis of implication of plans on future staffing requirements and estates. Analysis of overall staff pay outlined. Clear pay assumptions set out. Capital costs set out. Information provided on estates rationalisation.
Opportunities Opportunity areas identified
Analysis/summary of outline efficiency areas set out clearly. Financial benefit of each opportunity estimated. Opportunities based on clear, reasonable and explicit assumptions. Size of opportunities matches the size of financial challenge. Interdependencies between services (and how they are provided) are identified.
Quality impact Quality outcome/impact has been considered for each opportunity. Spend should be linked to quality outcomes. Outcome metrics should form part of the QIPP scorecards that some are proposing to develop – e.g. through Quality Observatories.
Link to innovation and productivity
Evidence of consideration to innovation/productivity for each opportunity area.
Linkage to national workstreams
Links to national workstreams – evidence of engagement/input into national workstreams.
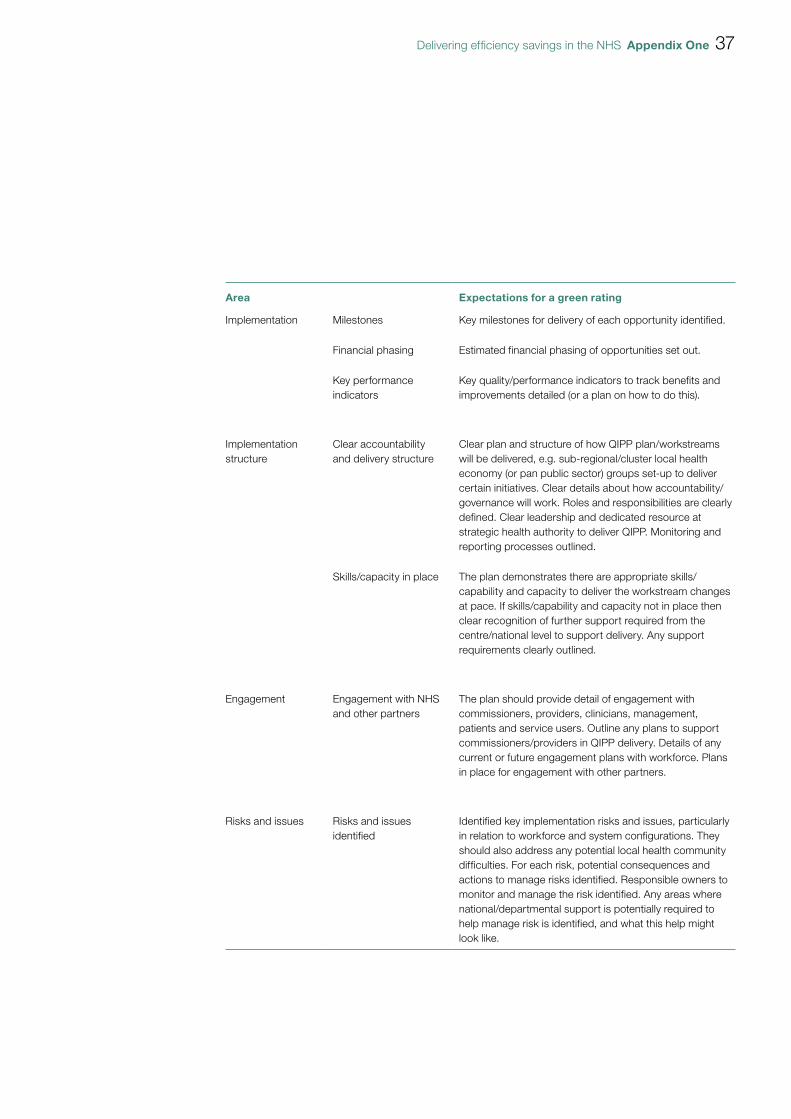
Delivering efficiency savings in the NHS Appendix One 37
Area Expectations for a green rating
Implementation Milestones Key milestones for delivery of each opportunity identified.
Financial phasing Estimated financial phasing of opportunities set out.
Key performance indicators
Key quality/performance indicators to track benefits and improvements detailed (or a plan on how to do this).
Implementation structure
Clear accountability and delivery structure
Clear plan and structure of how QIPP plan/workstreams will be delivered, e.g. sub-regional/cluster local health economy (or pan public sector) groups set-up to deliver certain initiatives. Clear details about how accountability/governance will work. Roles and responsibilities are clearly defined. Clear leadership and dedicated resource at strategic health authority to deliver QIPP. Monitoring and reporting processes outlined.
Skills/capacity in place The plan demonstrates there are appropriate skills/capability and capacity to deliver the workstream changes at pace. If skills/capability and capacity not in place then clear recognition of further support required from the centre/national level to support delivery. Any support requirements clearly outlined.
Engagement Engagement with NHS and other partners
The plan should provide detail of engagement with commissioners, providers, clinicians, management, patients and service users. Outline any plans to support commissioners/providers in QIPP delivery. Details of any current or future engagement plans with workforce. Plans in place for engagement with other partners.
Risks and issues Risks and issues identified
Identified key implementation risks and issues, particularly in relation to workforce and system configurations. They should also address any potential local health community difficulties. For each risk, potential consequences and actions to manage risks identified. Responsible owners to monitor and manage the risk identified. Any areas where national/departmental support is potentially required to help manage risk is identified, and what this help might look like.

This report has been printed on Consort 155
Design & Production by NAO Communications DP Ref: 009727-001 | Printed by Precision Printing