department of computing macquarie university...
TRANSCRIPT
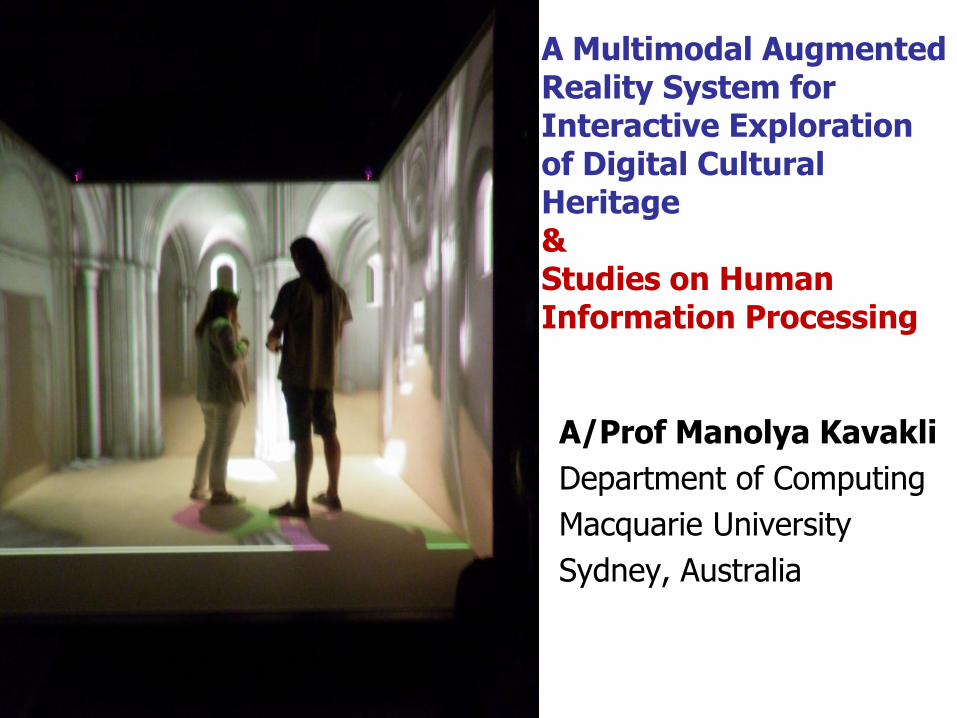
A Multimodal Augmented Reality System for Interactive Exploration of Digital Cultural Heritage & Studies on Human Information Processing
A/Prof Manolya Kavakli
Department of Computing
Macquarie University
Sydney, Australia
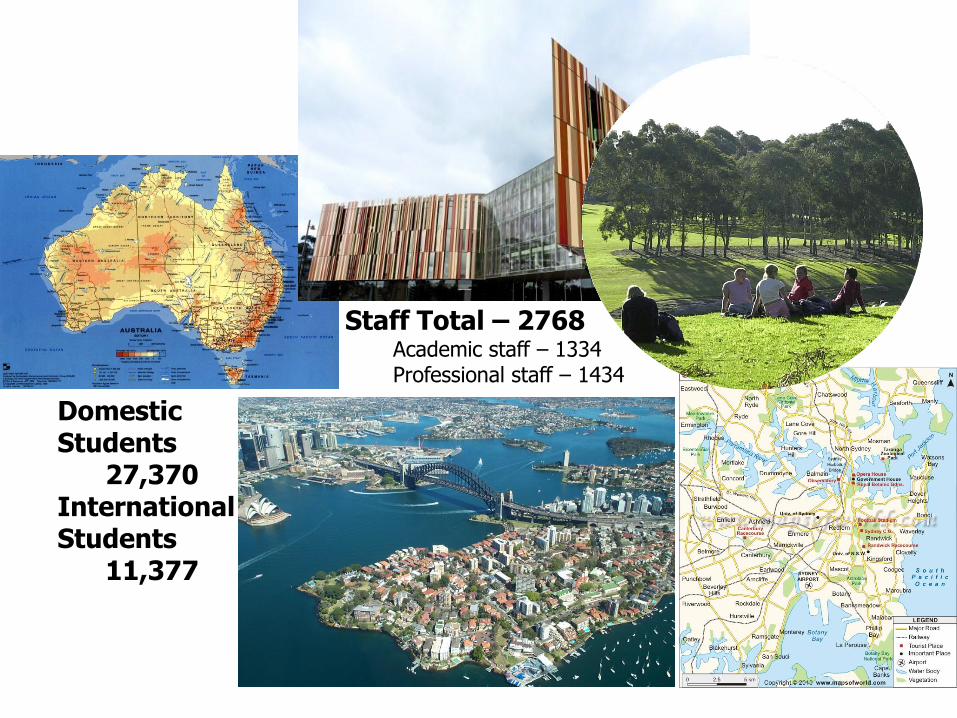
Domestic Students
27,370 International Students
11,377
Staff Total – 2768 Academic staff – 1334 Professional staff – 1434

CAVE @ ENSAM ParisTech, Chalon Sur Saone, France, 2007
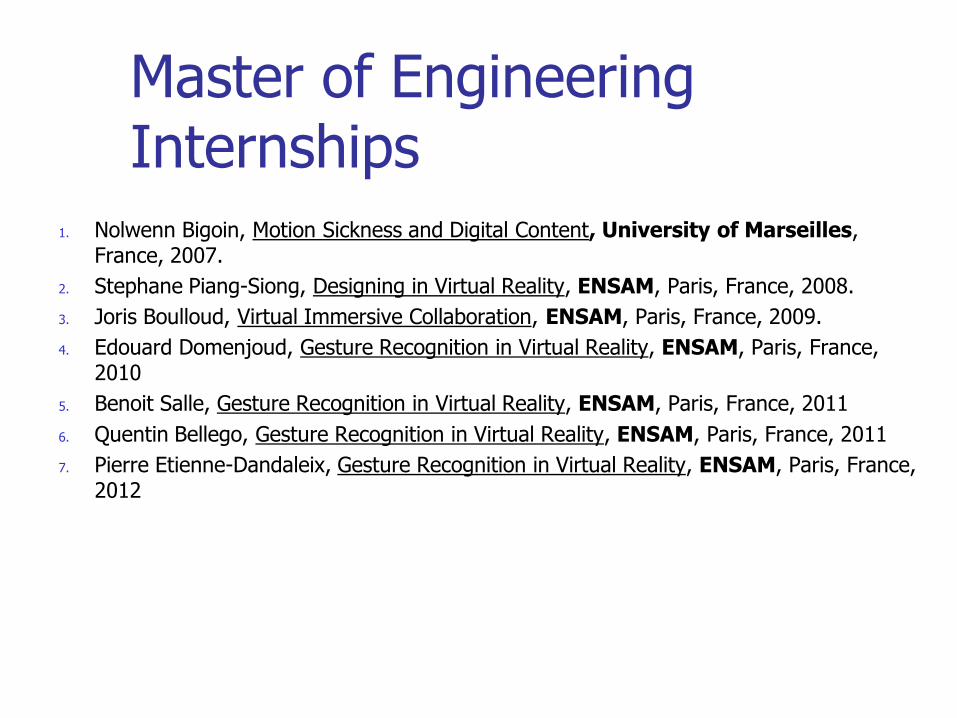
Master of Engineering Internships
1. Nolwenn Bigoin, Motion Sickness and Digital Content, University of Marseilles, France, 2007.
2. Stephane Piang-Siong, Designing in Virtual Reality, ENSAM, Paris, France, 2008.
3. Joris Boulloud, Virtual Immersive Collaboration, ENSAM, Paris, France, 2009.
4. Edouard Domenjoud, Gesture Recognition in Virtual Reality, ENSAM, Paris, France, 2010
5. Benoit Salle, Gesture Recognition in Virtual Reality, ENSAM, Paris, France, 2011
6. Quentin Bellego, Gesture Recognition in Virtual Reality, ENSAM, Paris, France, 2011
7. Pierre Etienne-Dandaleix, Gesture Recognition in Virtual Reality, ENSAM, Paris, France, 2012

Introduction Background
Simulation Hub
VISOR team
VR Applications at Macquarie University
HCI Development Process
A HCI Implementation: Sketchpad Development
Future Projects (e.g., I-DESIGN, CyberGUIDE, ArcHIVE)
Strategic Directions
Conclusion
Past Projects on some Relevant Theoretical questions:
The Integration of Speech and Gestures
Human Information Processing
Are Females’ Information Processing different from Males?
Are there cultural differences in Information Processing?
Is Information Processing in VR different from Non-VR?
Are Experts’ Information Processing different from Novices?

Background Director of Postgraduate Studies
Department of Computing, Macquarie University
VISOR
(Virtual and Interactive Simulations of Reality) Research Group http://web.science.mq.edu.au/groups/visor/
CEPET
(Centre for Elite Performance, Expertise, and Training) http://psy.dev.survivor.mq.edu.au/CEPET/assoc_members.htm
133 refereed papers (775 citations)
10 awards and 30+ grants
supervised 7 postdoctoral fellows &
45 postgraduate students in HCI
11 PhD, 2 MSc, 7 Honours, 18 MIT and 7 French MEng internships
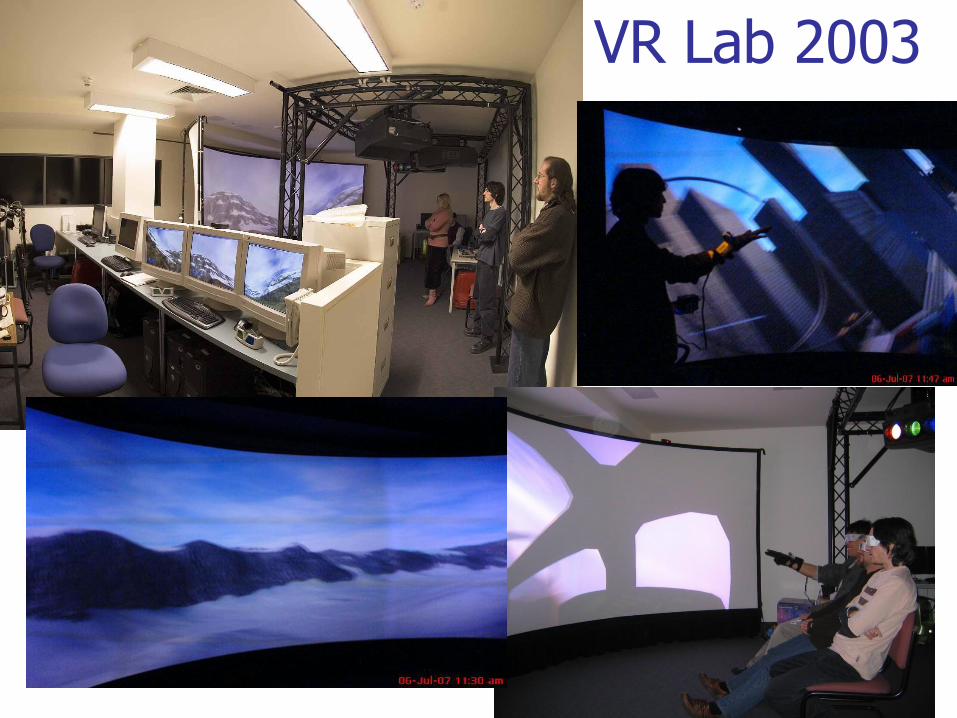
VR Lab 2003
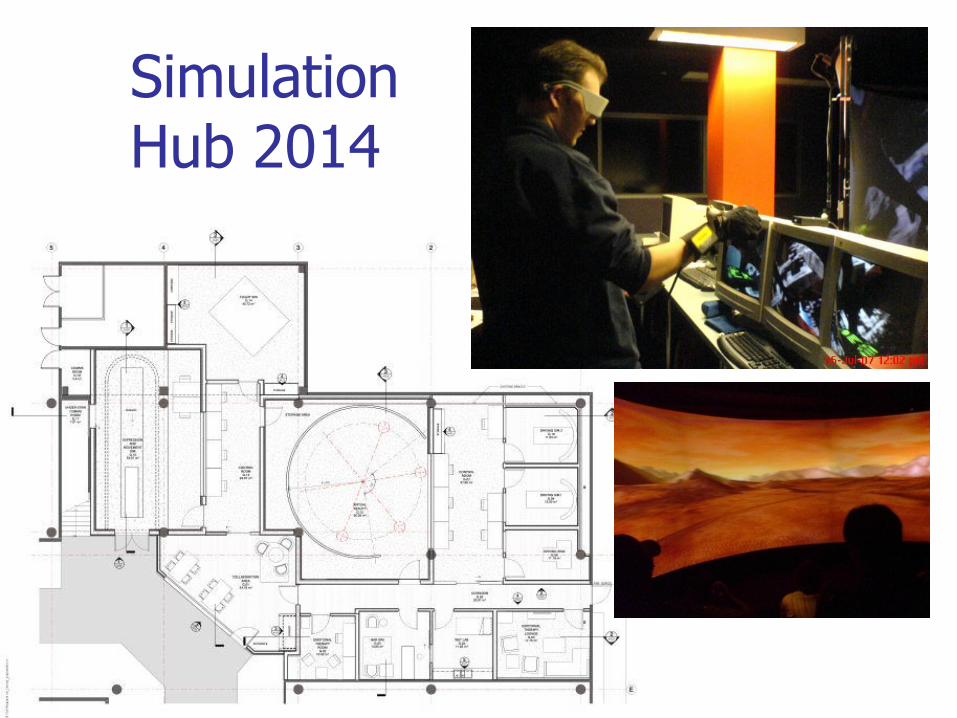
Simulation Hub 2014

Simulators

VISOR (Virtual and Interactive Simulations of Reality)
A/Prof Manolya Kavakli
Prof Ken Cheng
Prof Mark Wiggins
Prof Debbie Richards
A/Prof Michael Hitchens Prof Ron Rapee
Dr Scott McCallum
Dr Marc Dras
Dr Len Hamey
Dr Rajan Shankaran
Mr John Porte Dr Ali Boyali
Dr Iwan Kartiko (former PhD student)
Dr Rudra Tarashankar (former PhD student)
Dr Tauseef Gulrez (former PhD student)
Dr Antonio Lafusa (former PhD student)
Dr Anders Tychsen (former PhD student)
Dr Eric Fassbender (former PhD student)
Dr Eric Malbos (former PhD student)
Dr Susan Bruck (former PhD student)
Dr Max Wittmann (former PhD student)
Dr Yi Fan Gao (former PhD student)
Jing Liu (former PhD student)
Dilmi Palliyaguruge (former Honours student)
Eric Dalgliesh (former Honours student)
Ben Phelan (former Honours student)
Dilshan Hayarathna (former Honours student)

Current Postgraduate students
1. PhD Thesis on Energy Monitoring Through Social Mobile Applications, Majeed ALROWAILY (43846416) [Associate Supervisor Dr Rajan Shankaran] (Feb.2015-2018)
2. PhD Thesis on Motor Cognition and Agents using Cognitive Robotics for Interactive Navigation with An Adaptive Virtual Environment Interface, Zhenzhong (Charles) Liu 43874339 2015 International Postgraduate Research Scholarship (IPRS) upgraded from International Macquarie University Research Scholarship (iMQRES) [Associate Supervisor Prof Ken Cheng] (2015-2018)
3. PhD Thesis on A research on a new Myoelectric control system focused on developing accurate pattern classification and Signal Processing System for an affordable prosthesis, Hessam Jahani FARIMAN, 43880878, International Macquarie University Research Scholarship (iMQRES) (2015-2018)
4. MRes Thesis on Mobile Augmented Reality in Spatial Design, Pongsak Suvanpong, Department of Computing, Macquarie University, Sydney, Australia (2014-2016)
5. PhD Thesis on Mobile Applications to track biofeedfack, Don Hewage, Department of Computing, Macquarie University, Sydney, Australia (2014-2017)
6. PhD Thesis on Optimisation of Cognitive Load, Hasan Alyamani, Department of Computing, Macquarie University, Sydney, Australia (2014-2017) (23.11.2014)
7. PhD Thesis on Cognitive Load and Training Simulations, David Walker, Department of Computing, Macquarie University, Sydney, Australia (2013-2016) (3rd place in The Faculty of Science Final of the 2014 3 Minute Thesis Competition on 23rd July 2014) [Associate Supervisor A/Prof Mark Wiggins]
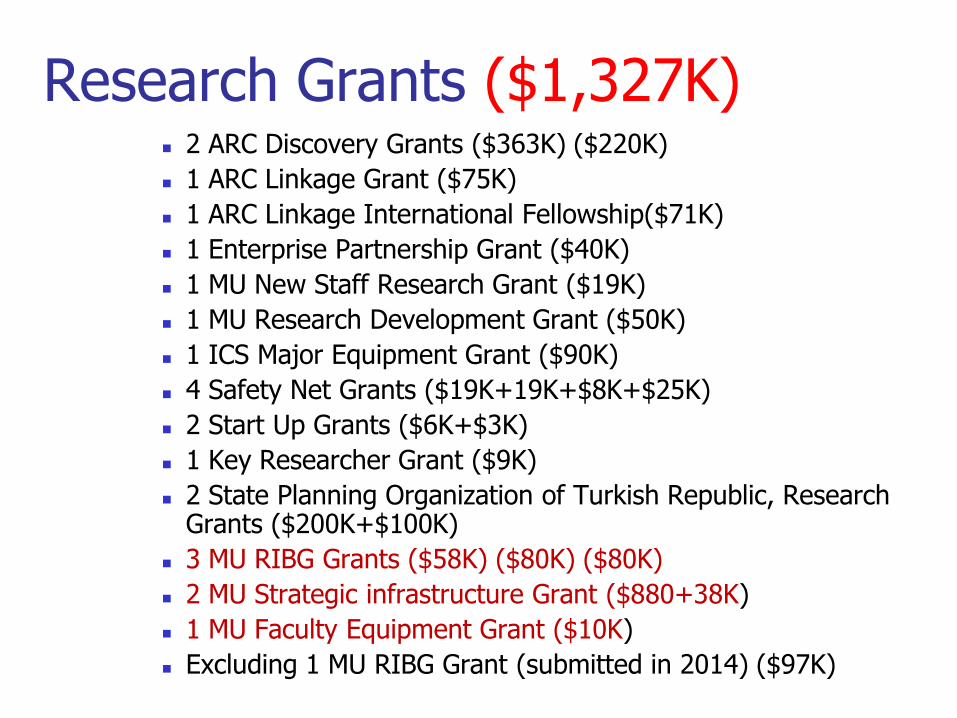
Research Grants ($1,327K) 2 ARC Discovery Grants ($363K) ($220K)
1 ARC Linkage Grant ($75K)
1 ARC Linkage International Fellowship($71K)
1 Enterprise Partnership Grant ($40K)
1 MU New Staff Research Grant ($19K)
1 MU Research Development Grant ($50K)
1 ICS Major Equipment Grant ($90K)
4 Safety Net Grants ($19K+19K+$8K+$25K)
2 Start Up Grants ($6K+$3K)
1 Key Researcher Grant ($9K)
2 State Planning Organization of Turkish Republic, Research Grants ($200K+$100K)
3 MU RIBG Grants ($58K) ($80K) ($80K)
2 MU Strategic infrastructure Grant ($880+38K)
1 MU Faculty Equipment Grant ($10K)
Excluding 1 MU RIBG Grant (submitted in 2014) ($97K)
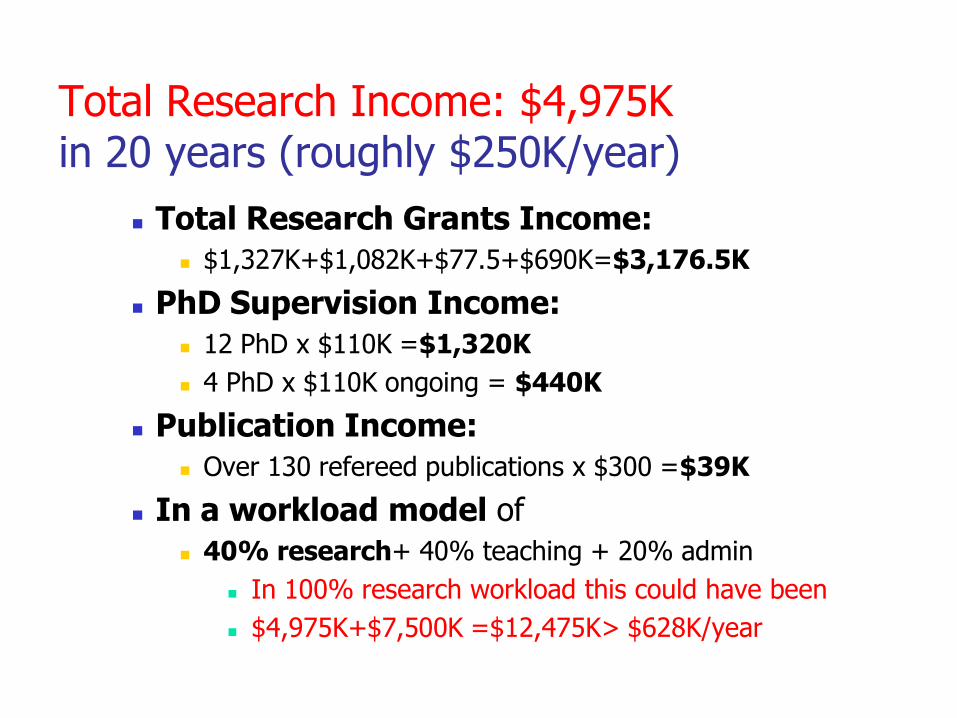
Total Research Income: $4,975K in 20 years (roughly $250K/year)
Total Research Grants Income:
$1,327K+$1,082K+$77.5+$690K=$3,176.5K
PhD Supervision Income:
12 PhD x $110K =$1,320K
4 PhD x $110K ongoing = $440K
Publication Income:
Over 130 refereed publications x $300 =$39K
In a workload model of
40% research+ 40% teaching + 20% admin
In 100% research workload this could have been
$4,975K+$7,500K =$12,475K> $628K/year
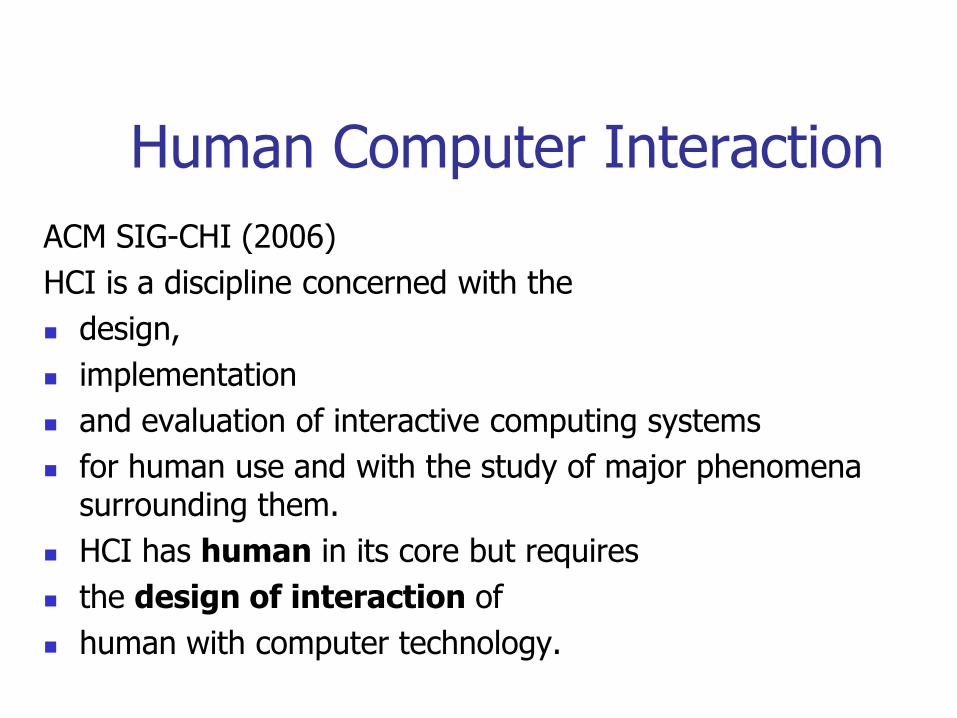
Human Computer Interaction
ACM SIG-CHI (2006)
HCI is a discipline concerned with the
design,
implementation
and evaluation of interactive computing systems
for human use and with the study of major phenomena surrounding them.
HCI has human in its core but requires
the design of interaction of
human with computer technology.

HCI
HCI (ACM-SIGCHI, 2006, http://old.sigchi.org/cdg/cdg2.html)
refers to the design and implementation of computer systems that people interact with.

Ubiquitous computing
The latest trend in HCI.
“The term which often used interchangeably by
ambient intelligence and pervasive computing,
refers to the ultimate methods of human-computer interaction that is the deletion of a desktop and
embedding of the computer in the environment so that it becomes invisible to humans while surrounding them everywhere hence the term ambient” (Karray et al, 2008).
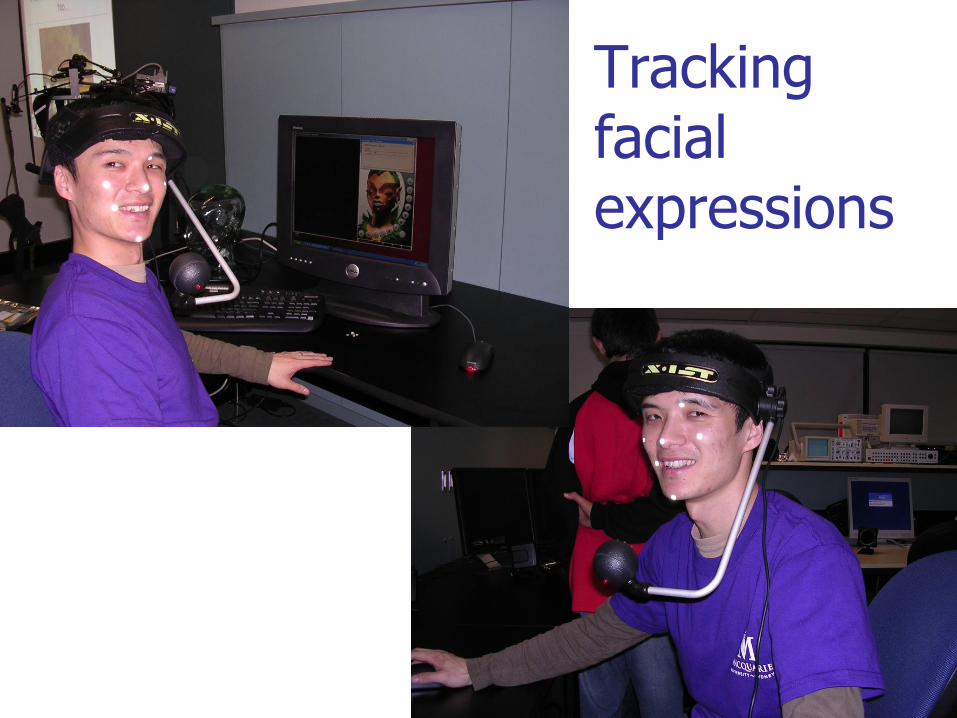
Tracking facial expressions

VisoR: Virtual and Interactive Simulation of Reality Research Group 2008

Motion Tracking
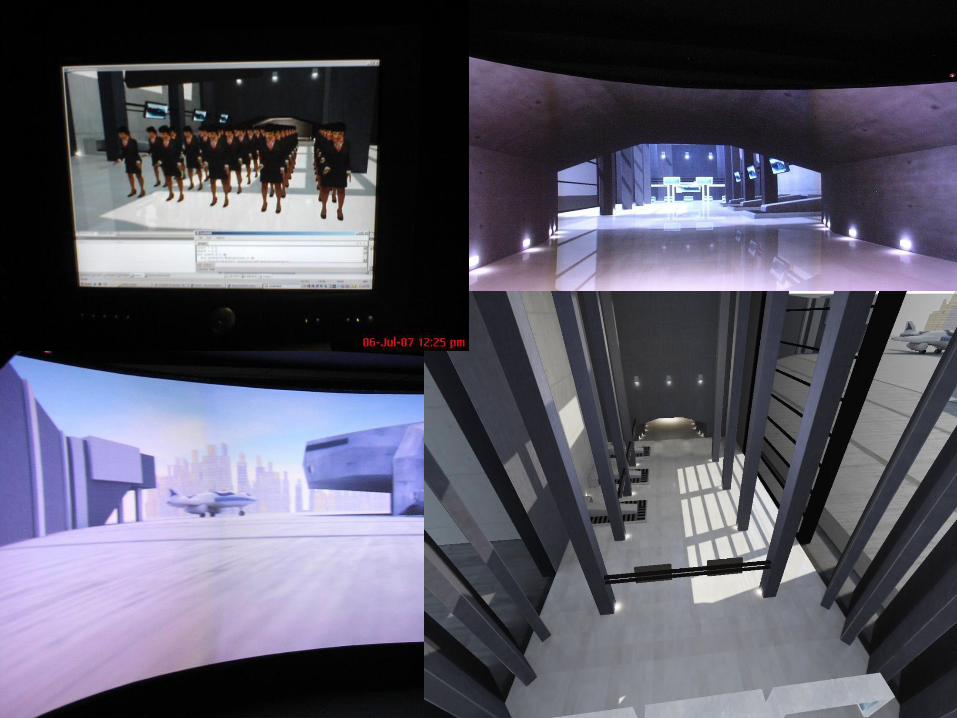
We used Softimage|XSI for creating a 3D landscape and an airport model.
We modified the layout of the digital world in Blender. We exported the digital world to Vizard file format. We used 3D Studio Max and Softimage|XSI with FBX plug-ins for 3D modelling. 3D Studio Max has a built in exporter for .FBX format which MotionBuilder reads. In MotionBuilder, we set up the rig of the character and applied the Motion-Capture (mocap) animation onto the character's skeleton. The animation footage is produced by Vizard Virtual Reality software.
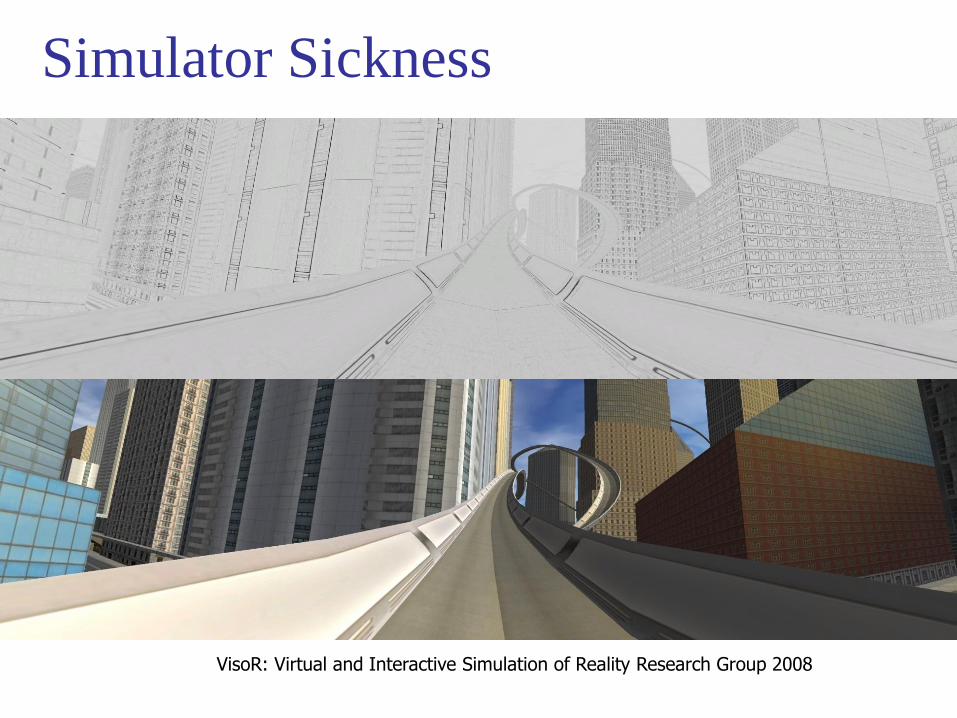
VisoR: Virtual and Interactive Simulation of Reality Research Group 2008
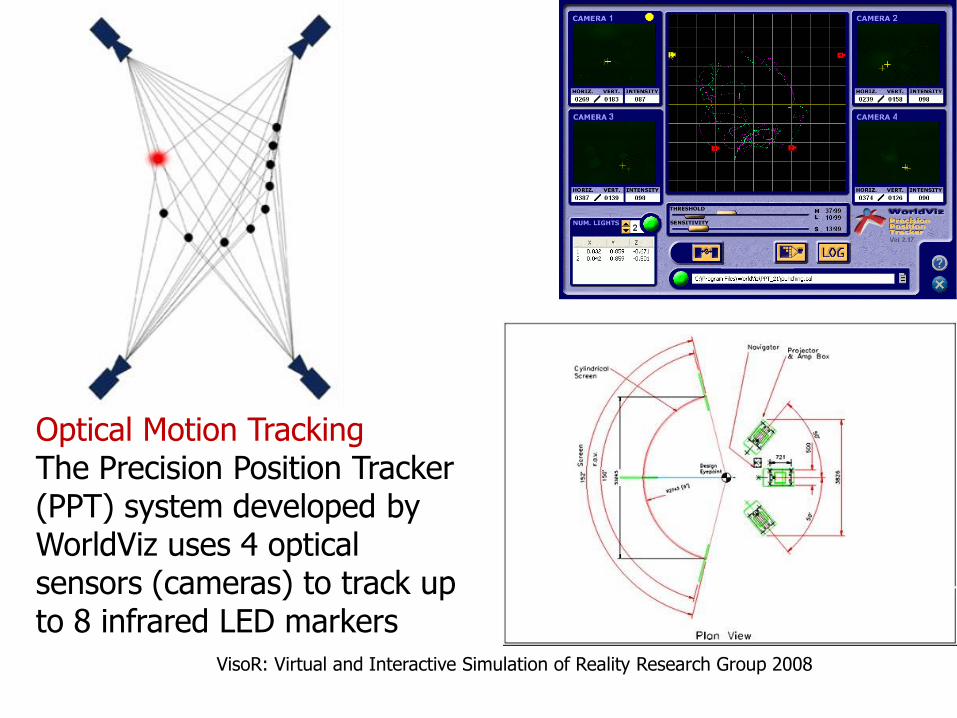
Optical Motion Tracking The Precision Position Tracker (PPT) system developed by WorldViz uses 4 optical sensors (cameras) to track up to 8 infrared LED markers

Screenshot from ATN 7 Border Security Video and RMM
the first implementation in 2005,
the Unreal Tournament (UT2004) game engine
Border Security Simulation (BOSS) Risk Management Mod

VisoR: Virtual and Interactive Simulation of Reality Research Group 2008
Simulator Sickness

Complexity of Avatars Training
psychology
students

Complexity of Environments Training firefighters

Biofeedback Biopack-EEG & Emotive

PhD Project: Detail Design Manufacturing Window Parts
Fig. 2. Functional decomposition of a window assembly
WALL
FRONT FRAME
FRAME
MUNTIN
SASH SASH
GLAZING
GLAZING
SILL
WALL
FRONT FRAME
FRAME
SASH
GLAZING
MUNTIN
SASH
SASH
SILL
FRAME
FRONT FRAME
WALL
SASH
SASH
GLAZING
SASH
MUNTIN
WALLFRONT FRAME
FRAME
SASH
GLAZING
SASH
MUNTIN
SASH SASH
FRAME
FRONT FRAMEWALLGLAZING
GLAZING
SILL
SILL
PLAN
ELEVATION SECTION
SILL
Figure 9. Rough mechanisms inserted on the nodes

Assembly Design
FRONT FRAME
FRAME
JOINT
SASH
GLAZINGCOMPOUND
MUNTIN
SASH
SASH
GLAZINGCOMPOUND
SILLEXTERIOR
FRONTFRAME
INTERIORSILL
FRAME
JOINT

Digital Heritage
Apollonio, Gaiani, Sun, 2013

Facades

Restoration Projects
Park Hyatt Hotel –
Macka Palace
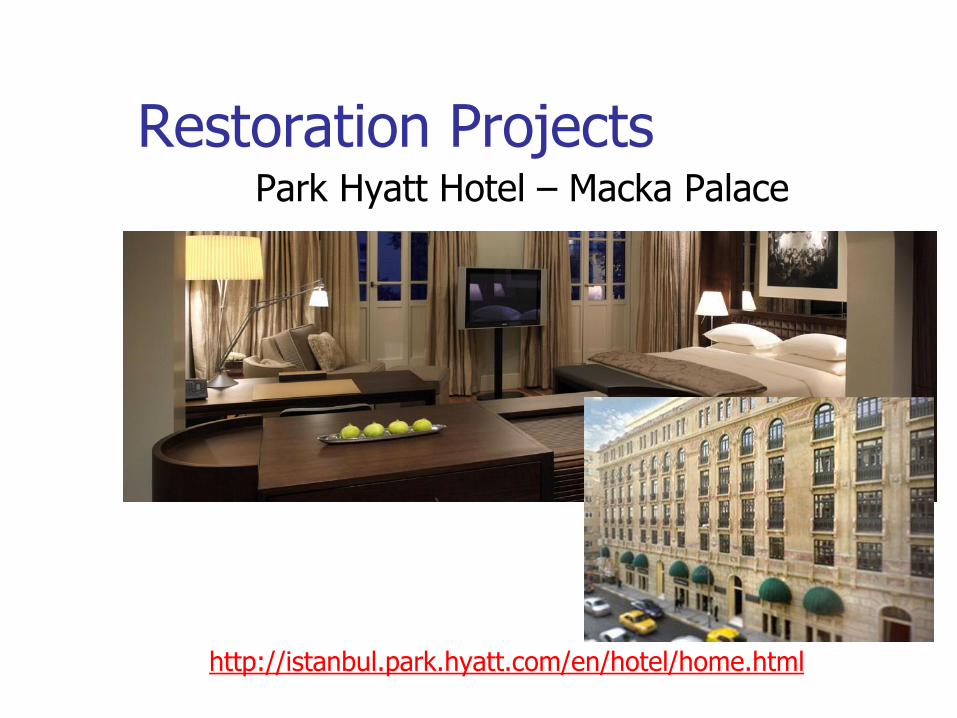
Restoration Projects Park Hyatt Hotel – Macka Palace
http://istanbul.park.hyatt.com/en/hotel/home.html

Postdoctoral fellowship: Sketchpad Development NATO Science Project (1996, UK)
An AI Application for the Transformation of a 2D Sketch to a 3D Geometric Model
Project Report:
The NATO Science Fellowship Program for Post Doctoral Studies, NATO area code: 4301, NATO list code: 51/B96/TU
Ubiquitous System Development
2009-2012
Australian Research Council
Discovery Grant, DP0988088 (Kavakli)
A Gesture-Based Interface for Designing in Virtual Reality
Research questions: “How do we generate 3D models of real objects by
sketching using VR in real-time?” and
“How can we support the design process using VR, design cognition, and gesture recognition?”
3D Sketchpad This project examines a novel environment in which a
designer can define the contour of a sketch
by controlling a pointer using a pair of cyber gloves and
can interact with the design product by using a sensor jacket in 3D space.
The sensor jacket, cyber gloves, and the pointer incorporate 3D position sensors so that
drawing primitives entered are recreated in real time on a head mounted display worn by the user.
Thus, the VR system provides a "3D sketch pad" and the designer has the benefit of a stereo image.
The interface to be developed will recognize hand-gestures of the designer, pass commands to a 3D modelling package via a motion recognition system, produce the 3D model of the sketch on-the-fly, and generate it on a head mounted display.

Frank Gehry, Guggenheim Museum, Bilbao, 1997
VisoR: Virtual and Interactive Simulation of Reality Research Group 2008
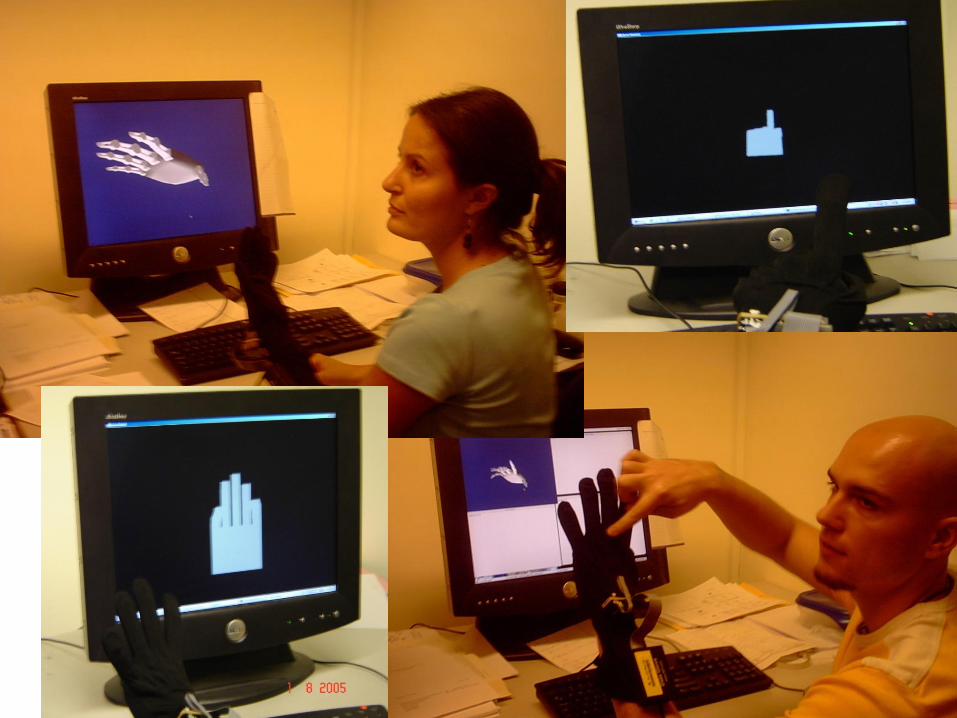
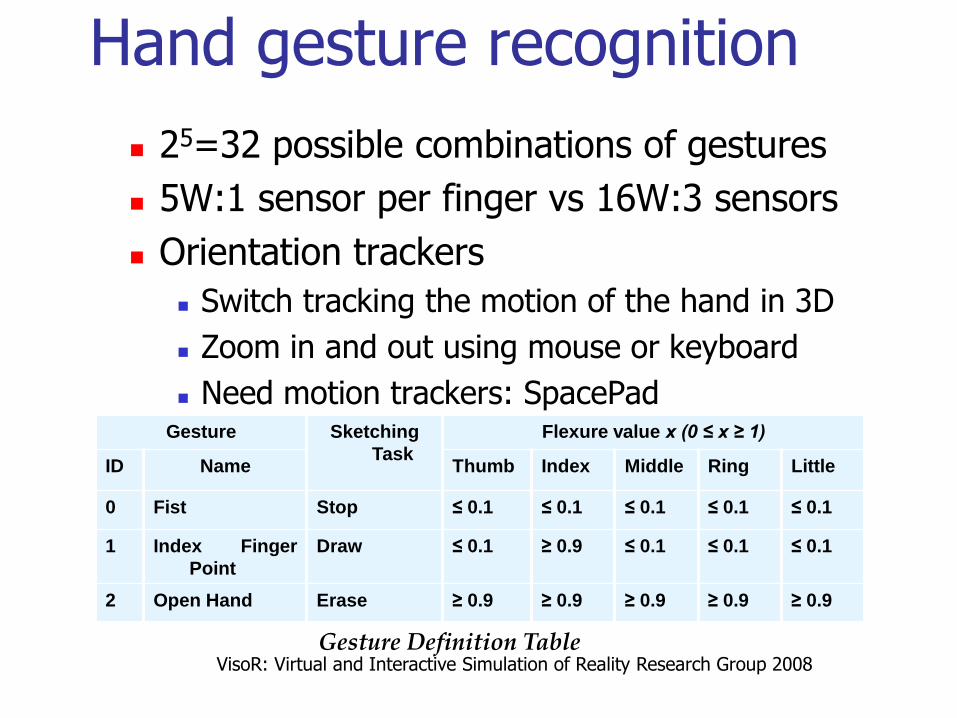
Hand gesture recognition
25=32 possible combinations of gestures
5W:1 sensor per finger vs 16W:3 sensors
Orientation trackers
Switch tracking the motion of the hand in 3D
Zoom in and out using mouse or keyboard
Need motion trackers: SpacePad Gesture Sketching
Task
Flexure value x (0 ≤ x ≥ 1)
ID Name Thumb Index Middle Ring Little
0 Fist Stop ≤ 0.1 ≤ 0.1 ≤ 0.1 ≤ 0.1 ≤ 0.1
1 Index Finger
Point
Draw ≤ 0.1 ≥ 0.9 ≤ 0.1 ≤ 0.1 ≤ 0.1
2 Open Hand Erase ≥ 0.9 ≥ 0.9 ≥ 0.9 ≥ 0.9 ≥ 0.9
Gesture Definition Table
VisoR: Virtual and Interactive Simulation of Reality Research Group 2008
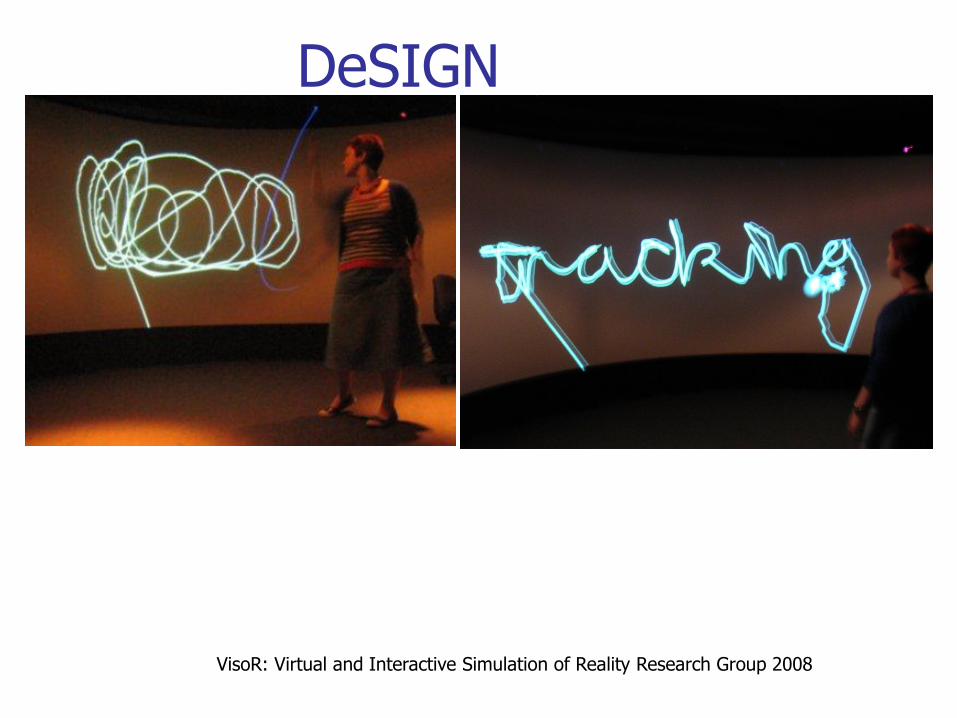
DeSIGN

VisoR: Virtual and Interactive Simulation of Reality Research Group 2008
DESIRE

Gesture Recognition 52 individual piezzo resistive sensor strips
located from wrist to shoulders on the right and left side of the t-shirt.
The data is acquired by the National Instrument Data Acquisition Unit.
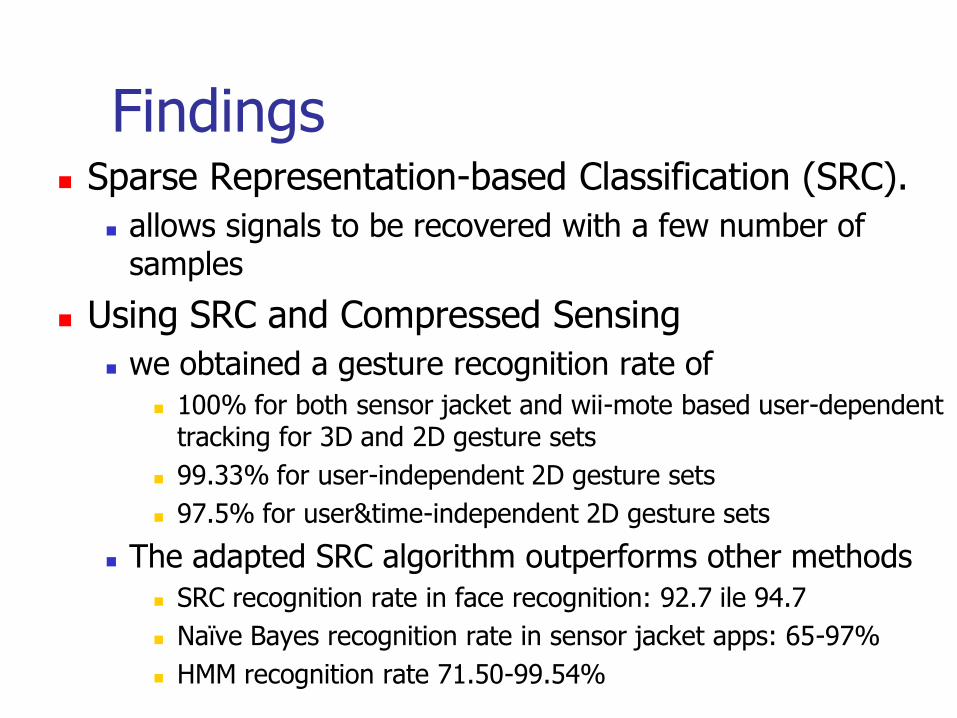
Findings Sparse Representation-based Classification (SRC).
allows signals to be recovered with a few number of samples
Using SRC and Compressed Sensing
we obtained a gesture recognition rate of
100% for both sensor jacket and wii-mote based user-dependent tracking for 3D and 2D gesture sets
99.33% for user-independent 2D gesture sets
97.5% for user&time-independent 2D gesture sets
The adapted SRC algorithm outperforms other methods
SRC recognition rate in face recognition: 92.7 ile 94.7
Naïve Bayes recognition rate in sensor jacket apps: 65-97%
HMM recognition rate 71.50-99.54%
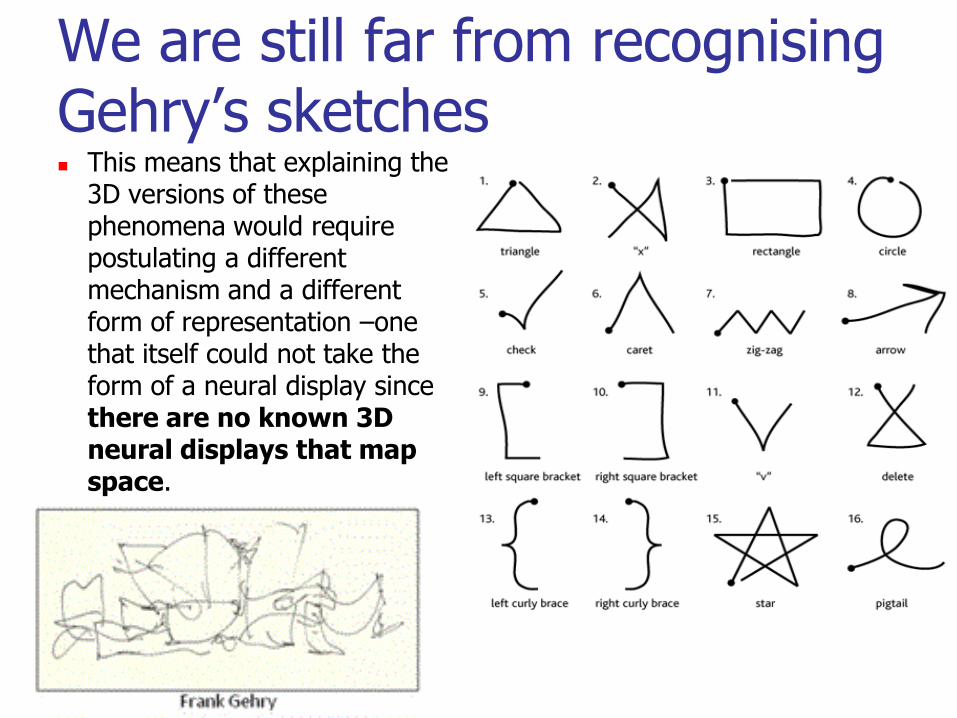
We are still far from recognising Gehry’s sketches This means that explaining the
3D versions of these phenomena would require postulating a different mechanism and a different form of representation –one that itself could not take the form of a neural display since there are no known 3D neural displays that map space.
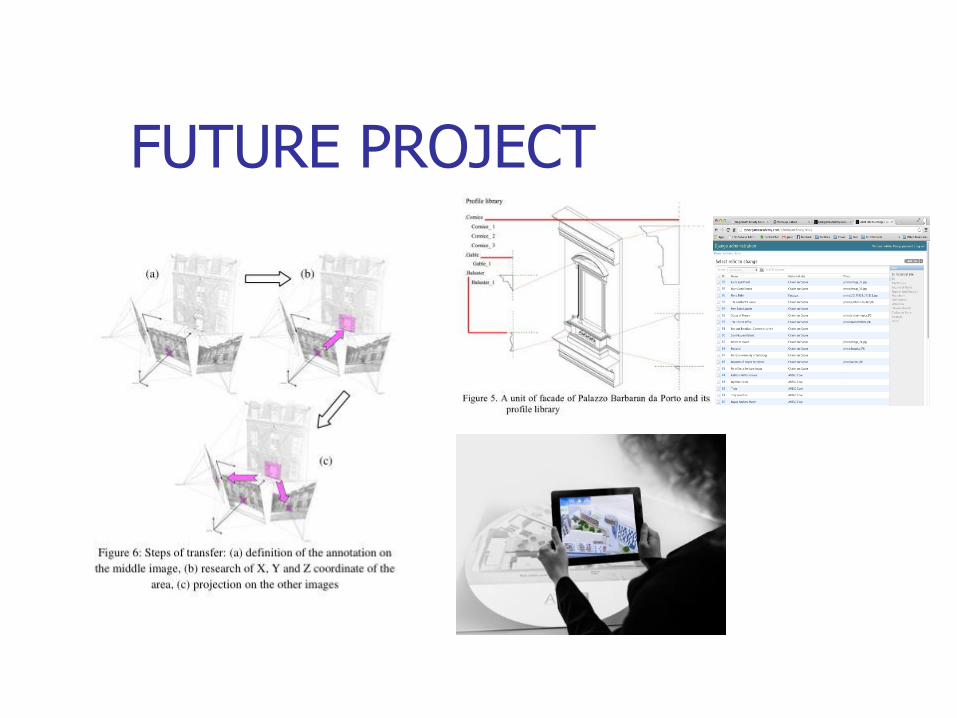
FUTURE PROJECT

Augmented Reality
a live, copy, view of a physical, real-world
environment whose elements are augmented
by computer-generated sensory input such as
sound, video, graphics or GPS data
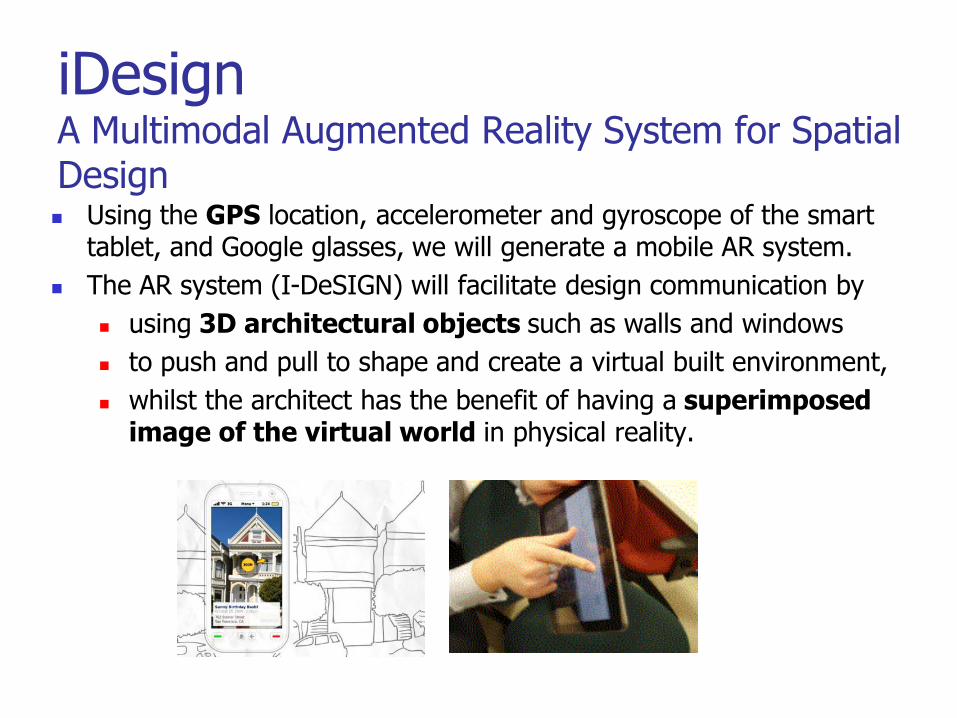
Using the GPS location, accelerometer and gyroscope of the smart tablet, and Google glasses, we will generate a mobile AR system.
The AR system (I-DeSIGN) will facilitate design communication by
using 3D architectural objects such as walls and windows
to push and pull to shape and create a virtual built environment,
whilst the architect has the benefit of having a superimposed image of the virtual world in physical reality.
iDesign A Multimodal Augmented Reality System for Spatial Design
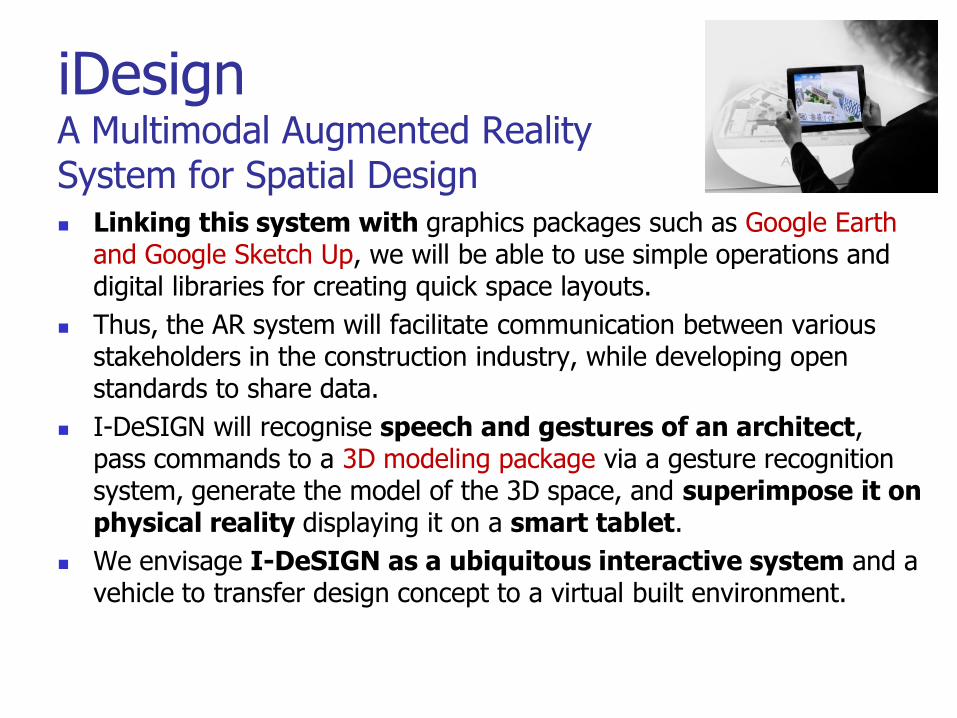
iDesign A Multimodal Augmented Reality System for Spatial Design Linking this system with graphics packages such as Google Earth
and Google Sketch Up, we will be able to use simple operations and digital libraries for creating quick space layouts.
Thus, the AR system will facilitate communication between various stakeholders in the construction industry, while developing open standards to share data.
I-DeSIGN will recognise speech and gestures of an architect, pass commands to a 3D modeling package via a gesture recognition system, generate the model of the 3D space, and superimpose it on physical reality displaying it on a smart tablet.
We envisage I-DeSIGN as a ubiquitous interactive system and a vehicle to transfer design concept to a virtual built environment.
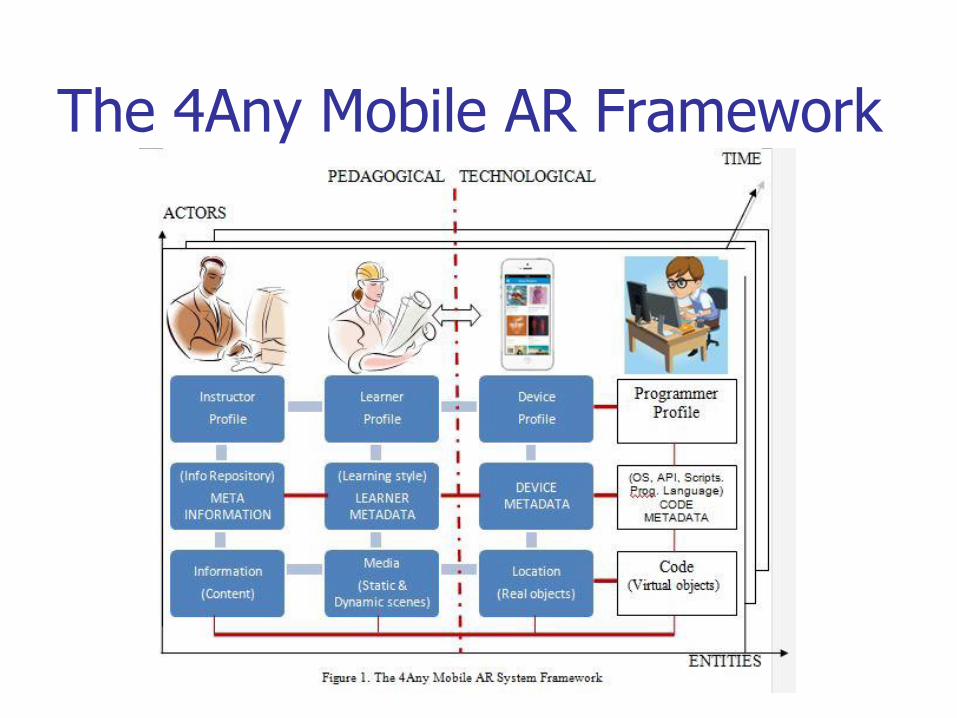
The 4Any Mobile AR Framework

ArcHIVE 4Any

ArcHIVE: Digital Heritage using Mobile Augmented Reality
Aim of this project is to explore users’ interaction with digital heritage.
Using the GPS location, accelerometer and gyroscope of the smart tablet, and Google glasses, we have generated a mobile AR system.
The AR system (ArcHIVE) facilitates the communication between the user and a heritage site offering a CyberGuide at specific GPS locations.
Future Projections: We aim at recreating a historical site as a virtual built environment in a 3D space, and
completing the missing elements of the remaining section of the digital heritage
using augmented reality and mapping the GPS locations provided by a smart tablet.
The outcome will be a digitally completed heritage model projected on a see-through head mounted display with head tracking facilities.
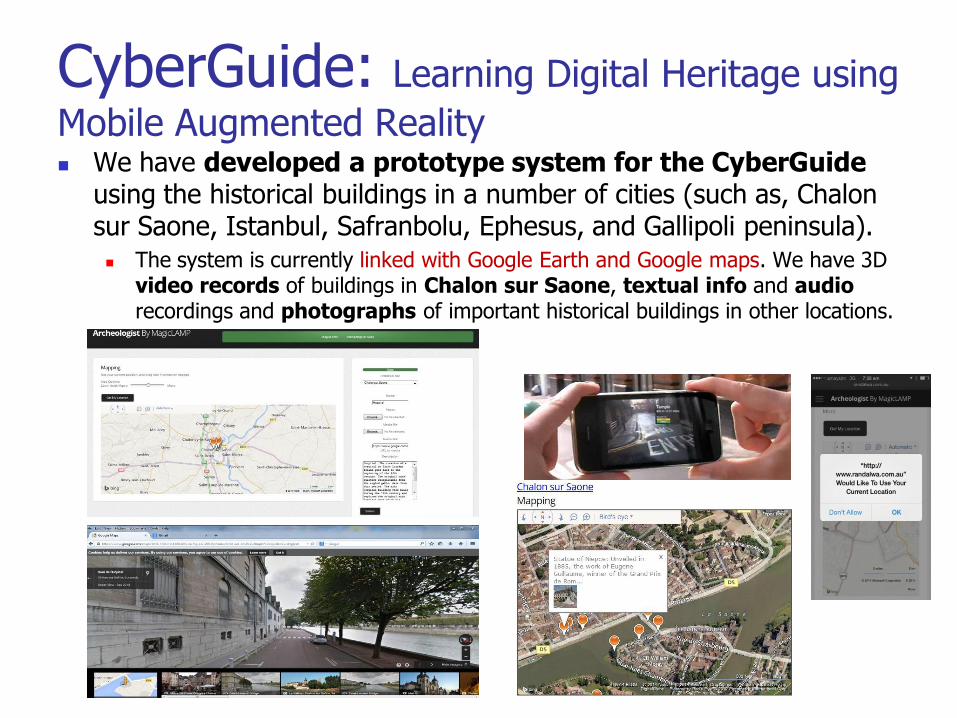
CyberGuide: Learning Digital Heritage using
Mobile Augmented Reality We have developed a prototype system for the CyberGuide
using the historical buildings in a number of cities (such as, Chalon sur Saone, Istanbul, Safranbolu, Ephesus, and Gallipoli peninsula). The system is currently linked with Google Earth and Google maps. We have 3D
video records of buildings in Chalon sur Saone, textual info and audio recordings and photographs of important historical buildings in other locations.

CyberGuide: Sketch (6 months) We have 3D video records of buildings in Chalon sur Saone, textual
info and audio recordings and photographs of important historical buildings in other locations.
In 2015 between Feb-August, our target is to link ArcHIVE system with a 3D modelling tool such as AutoCAD or Google Sketch Up to complete the front façade of a historical building and mapping this on the current facade in the videos or photographs.
What is expected of the intern is: to get familiar with the prototype (1 month –Feb),
to do scripting and coding to model a front façade (2 months –March-April),
to conduct experimental studies to test the usability of the system with 20 university students in Sydney, Australia (1 month May)
to analyse the collected data (1 month June), and
to draw conclusions to improve the system in the next iteration and to write up an internship report (1 month July).

CyberGuide-Sydney: Digital Heritage using Mobile Augmented Reality (3 months)
We have a collection of 3D video records, textual info, audio recordings and photographs of important historical buildings in many locations in the world, however, we have not done this for Sydney.
Our goal in this 3 month project to add Sydney section to the Digital Heritage projects with appropriate links to video records and 3D models: http://www.youtube.com/watch?v=JCkRORnRIJc
What is expected of the intern is: to get familiar with the prototype and add to this a collection of important
landmarks in Sydney visiting these, recording GPS locations, taking photographs, and compiling the information to be presented by the CyberGuide (1 month –June),
to conduct experimental studies to test the usability of the system with 20 people in Sydney, Australia (1 month -July)
to analyse the collected data and to draw conclusions to improve the system in the next iteration and to write up an internship report (1 month -August).
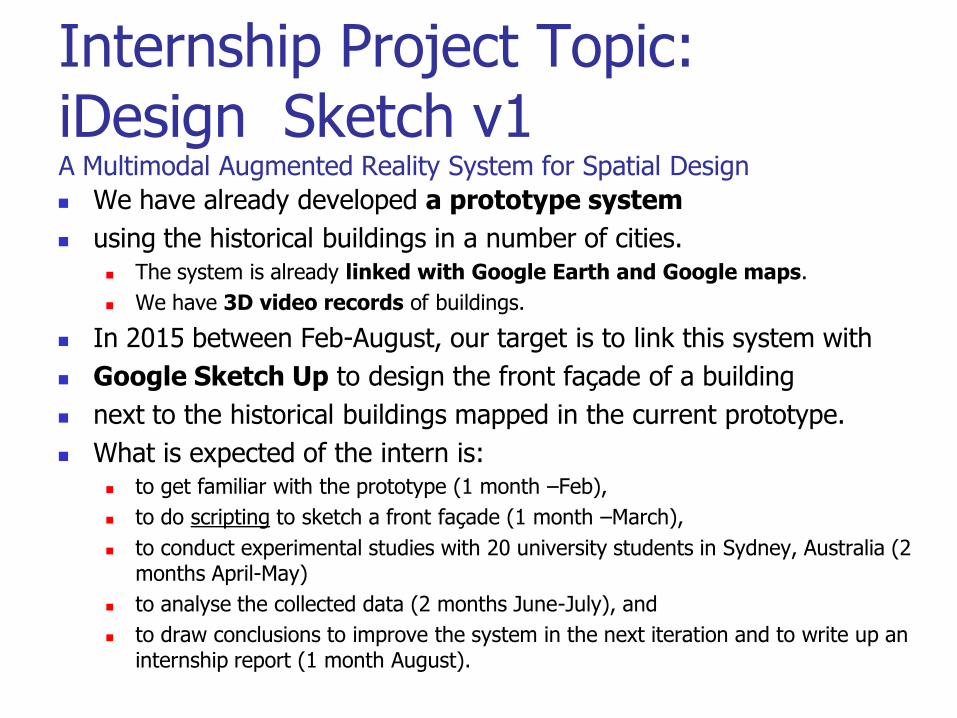
Internship Project Topic: iDesign Sketch v1 A Multimodal Augmented Reality System for Spatial Design
We have already developed a prototype system
using the historical buildings in a number of cities. The system is already linked with Google Earth and Google maps.
We have 3D video records of buildings.
In 2015 between Feb-August, our target is to link this system with
Google Sketch Up to design the front façade of a building
next to the historical buildings mapped in the current prototype.
What is expected of the intern is: to get familiar with the prototype (1 month –Feb),
to do scripting to sketch a front façade (1 month –March),
to conduct experimental studies with 20 university students in Sydney, Australia (2 months April-May)
to analyse the collected data (2 months June-July), and
to draw conclusions to improve the system in the next iteration and to write up an internship report (1 month August).

Expected Outcomes Investigation of how to design ubiquitous systems to turn the
streets we live into an open museum with no walls.
Implementation of a system model to support citizens’ communication with digital cultural heritage sites
Integration frameworks for speech and gesture recognition technologies
Development of models for Semantic Annotation
Usability testing in a number of cultural heritage locations in Europe, Asia, and Australia
Data Analysis and Evaluation
Development of a cross-cultural cognitive framework
Dissemination of results

Strategic Plan I To develop and share AR tools for 3D modelling
To develop and share frameworks and methodologies
Semantic coding and annotations for Digital Heritage
Cognitive coding and protocol analysis
To share PhD students
Co-supervision of existing students
Cotutelle scholarships (e.g., ENSAM, ParisTech & Polytech)
Arranging student & researcher exchange
Scientific Mobility Program
http://ambafrance-au.org/Scientific-Mobility-Program-2014
Applications will re-open mid-December 2014 for travel in 2015
Visits
Conferences
Strategic Plan II Joint grant applications
ARC Discovery & Linkage grants with CNRS being an OI
Industry support
Smart Cities (e.g., contact Grand Chalon)
BIM (e.g., contact Veolia and Bouygues)
CRC Grants with CNRS being an OI
National and EU Grants in France with MQ being an OI
the Creative Europe and Horizon 2020 Programmes.
Horizon 2020 is the new EU Framework Programme for Research and Innovation, with nearly €80 billion available from 2014 to 2020.
The EU Culture programme
launched in 2013 has been funding a project titled “Cultural Heritage Counts for Europe: Towards an European Index for Valuing Cultural Heritage” to ensure that Europe’s cultural heritage is safeguarded and enhanced.

EU Framework #4 Content technologies and information management / 2014-2015
• Addresses: - Big Data with focus on both innovative data products and services and solving research problems - Machine translation to overcome barriers to multilingual online communication - Tools for creative, media and learning industries to mobilise the innovation potential of SMEs active in the area - Multimodal and natural computer interaction
• Organised in eight topics:
• Big data innovation and take-up • Big data research • Cracking the language barrier • Support to the growth of ICT innovative creative industries SMEs • Technologies for creative industries, social media and convergence • Technologies for better human learning and teaching • Advanced digital gaming/gamification technologies • Multimodal and natural computer interaction

What brings us together?
While cultural heritage is central to the European Agenda,
it is equally important for the Commonwealth of Australia, due to its significant contribution to the following objectives:
promotion of cultural diversity and intercultural dialogue
promotion of culture as a catalyst for creativity– heritage contributes through its direct and indirect economic potential, including
the capacity to underpin our cultural and creative industries and inspire creators and thinkers
promotion of culture as a vital element of the European Union's and Australia’s multi-cultural and multi-national dimension

What can we do?
To strengthen our common position in the field of cultural heritage preservation, there is a need to:
encourage the modernisation of the heritage sector, raising awareness and engaging new audiences
apply a strategic approach to research and innovation, knowledge sharing and smart specialization;
seize the opportunities offered by digitisation; to reach out to new audiences and engage young people in particular.

What else can we do? In particular:
allow users to engage with their cultural heritage and
contribute their own personal experiences,
e.g. in relation to landmark historical events such as World War I. Therefore, inclusion of locations in Asia and Australia should be also considered.
promote the development of sustainable, responsible and high-quality tourism, including products linked with cultural and industrial heritage and
create cultural routes crossing several countries and joining them in a common narrative,
such as the "EU sky route" aimed at putting Europe on the Worldwide Tour of Astro-Tourism or the "Liberation Route Europe" around 1944-45 events.
What else can we do? Audience development is a key priority of the programme.
The heritage sector will be encouraged to experiment with new ways of reaching more diverse audiences,
including young people and migrants.
This may require the use of smart phones and tablets for a smart tour within a smart city context.
The EU Commission, in cooperation with the Council of Europe, will also promote heritage-based and local-led development within the territory of the Union, by identifying new models for multi-stakeholder governance and conducting on-site direct experimentations.
The Commission now invites all stakeholders to develop a more integrated approach.

Strategic Plan III Local grant applications
NSW Multicultural Advantage Grants Program
Multicultural Partnership Grants (up to 3 years $80K)
To maximise linguistic and cultural assets of NSW population
bringing together two or more organisations
Unity Grants (up to $30K)
to build relationships between multicultural and Aboriginal communities
closes on 14th Nov
Community Inclusion Grants (up to $20K)
with a particular focus on mentoring and inter-cultural activities that bring diverse groups of people together
2014/15 Community Applications will open later this year.
Thank you! We are all looking for an answer but in fact
what drives us is the question.
Future isn’t written. It is designed.
Questions?

PAST PROJECTS & Findings
How can we investigate user interaction with architectural/design objects?
METHODOLOGIES &
PILOT STUDIES on
Speech & Gesture Recognition
Cognitive Processing
Are speech and gesture processing Independent or Integrated systems? There are two main hypotheses relating to the
relationships between speech and gestures:
The ‘independent systems’ framework hypothesis holds that gesture and speech are autonomous and separate communication systems.
The alternative hypothesis “integrated-system” is that gesture and speech together form an integrated communication system.
Finding 0: We found more empirical evidence for the “integrated system” hypothesis.

Can Speech and Gesture be integrated?
Liu (2013) and Kavakli examined existing video and audio recordings and dissected their contents including the lexical, gestural but also the lexical categories.
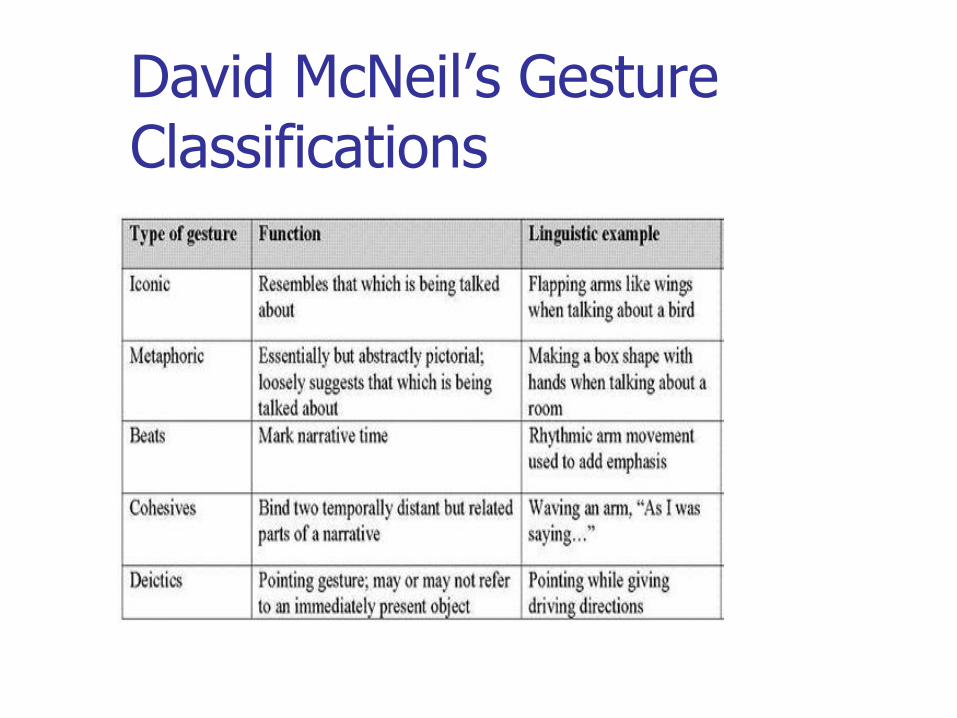
David McNeil’s Gesture Classifications
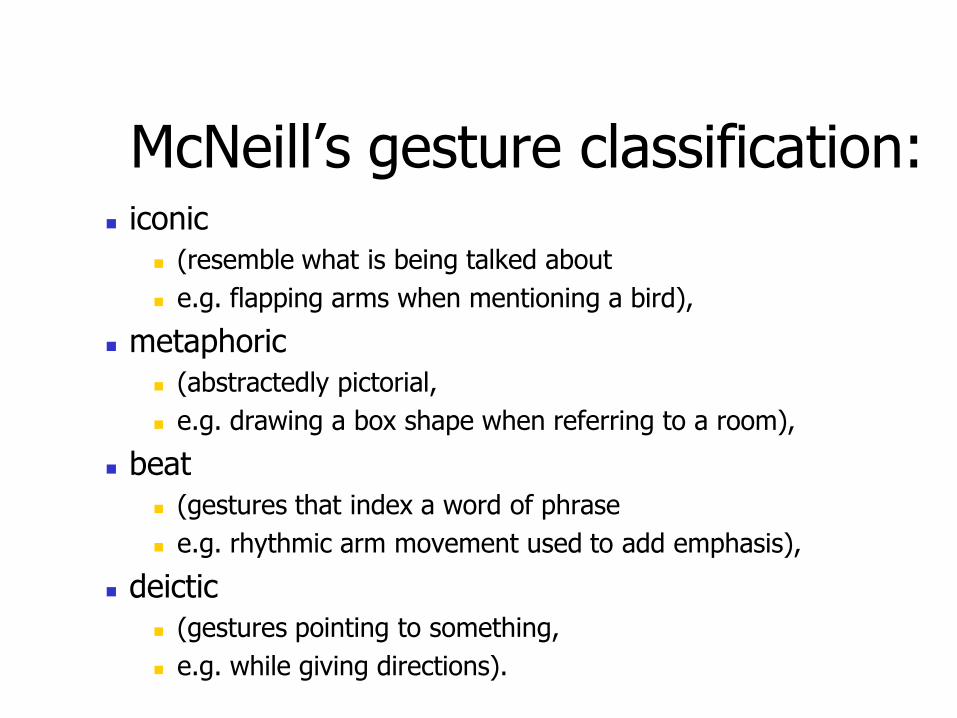
McNeill’s gesture classification: iconic
(resemble what is being talked about
e.g. flapping arms when mentioning a bird),
metaphoric
(abstractedly pictorial,
e.g. drawing a box shape when referring to a room),
beat
(gestures that index a word of phrase
e.g. rhythmic arm movement used to add emphasis),
deictic
(gestures pointing to something,
e.g. while giving directions).
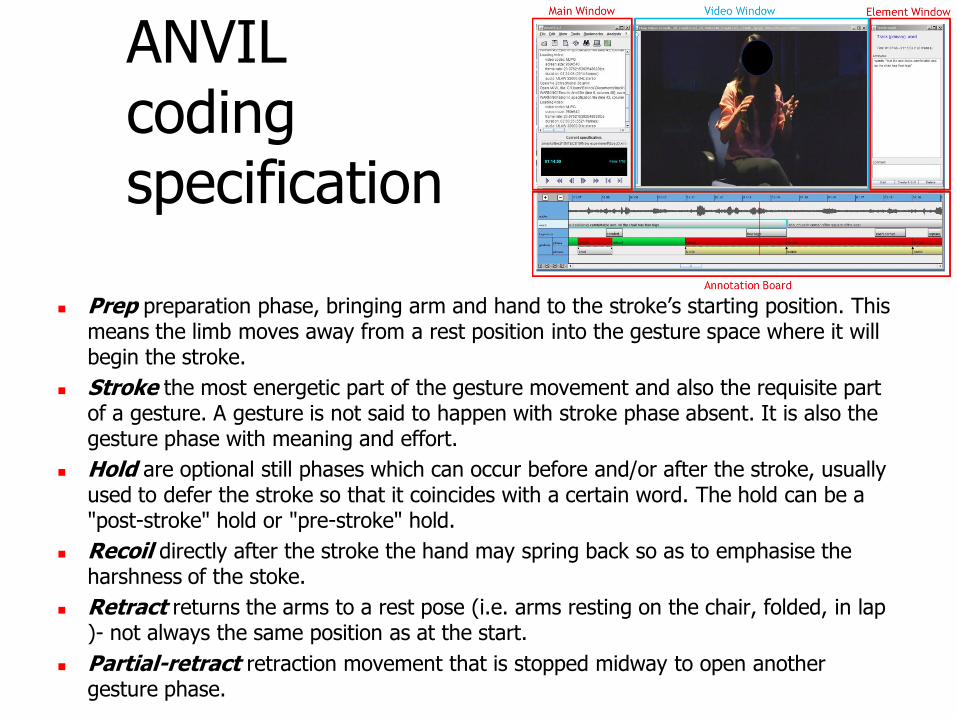
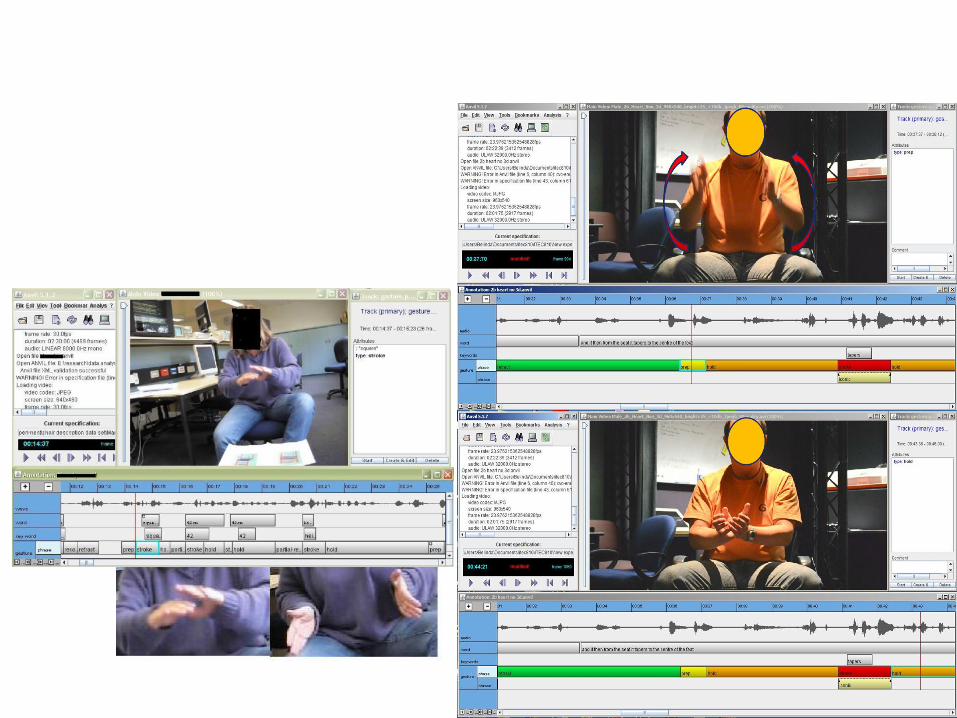
ANVIL coding specification
Prep preparation phase, bringing arm and hand to the stroke’s starting position. This means the limb moves away from a rest position into the gesture space where it will begin the stroke.
Stroke the most energetic part of the gesture movement and also the requisite part of a gesture. A gesture is not said to happen with stroke phase absent. It is also the gesture phase with meaning and effort.
Hold are optional still phases which can occur before and/or after the stroke, usually used to defer the stroke so that it coincides with a certain word. The hold can be a "post-stroke" hold or "pre-stroke" hold.
Recoil directly after the stroke the hand may spring back so as to emphasise the harshness of the stoke.
Retract returns the arms to a rest pose (i.e. arms resting on the chair, folded, in lap )- not always the same position as at the start.
Partial-retract retraction movement that is stopped midway to open another gesture phase.

Speech Coding
Each iconic and metaphoric gesture is related to at least one word.
We coded words frequently used
to identify which words were accompanied by gestures
adjectives, parts of the chair, verbs, order and shapes.
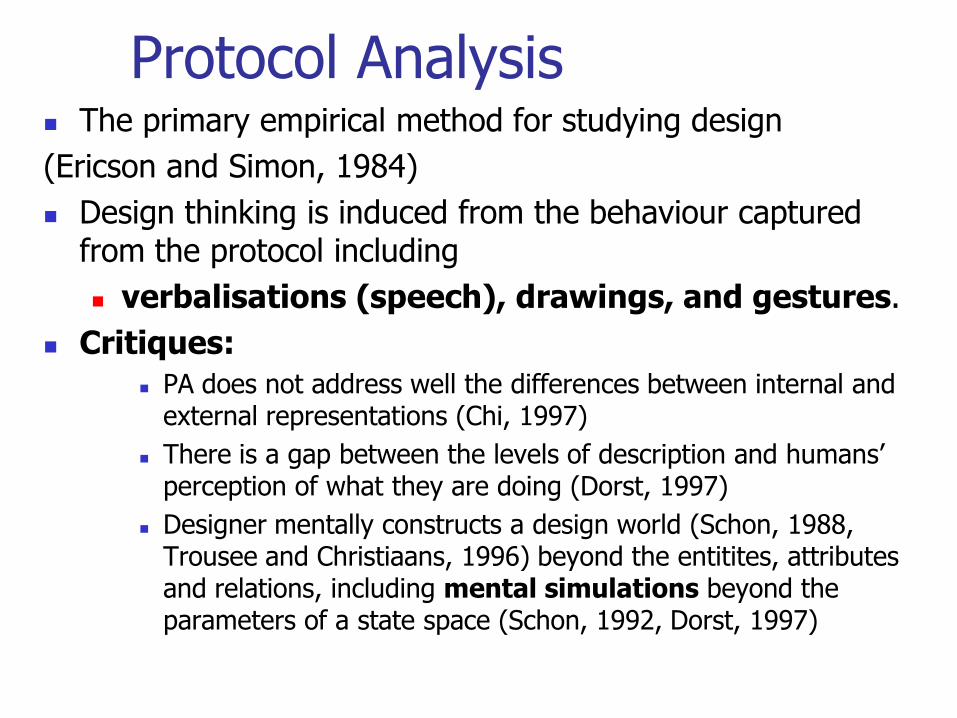
Protocol Analysis The primary empirical method for studying design
(Ericson and Simon, 1984)
Design thinking is induced from the behaviour captured from the protocol including
verbalisations (speech), drawings, and gestures.
Critiques:
PA does not address well the differences between internal and external representations (Chi, 1997)
There is a gap between the levels of description and humans’ perception of what they are doing (Dorst, 1997)
Designer mentally constructs a design world (Schon, 1988, Trousee and Christiaans, 1996) beyond the entitites, attributes and relations, including mental simulations beyond the parameters of a state space (Schon, 1992, Dorst, 1997)
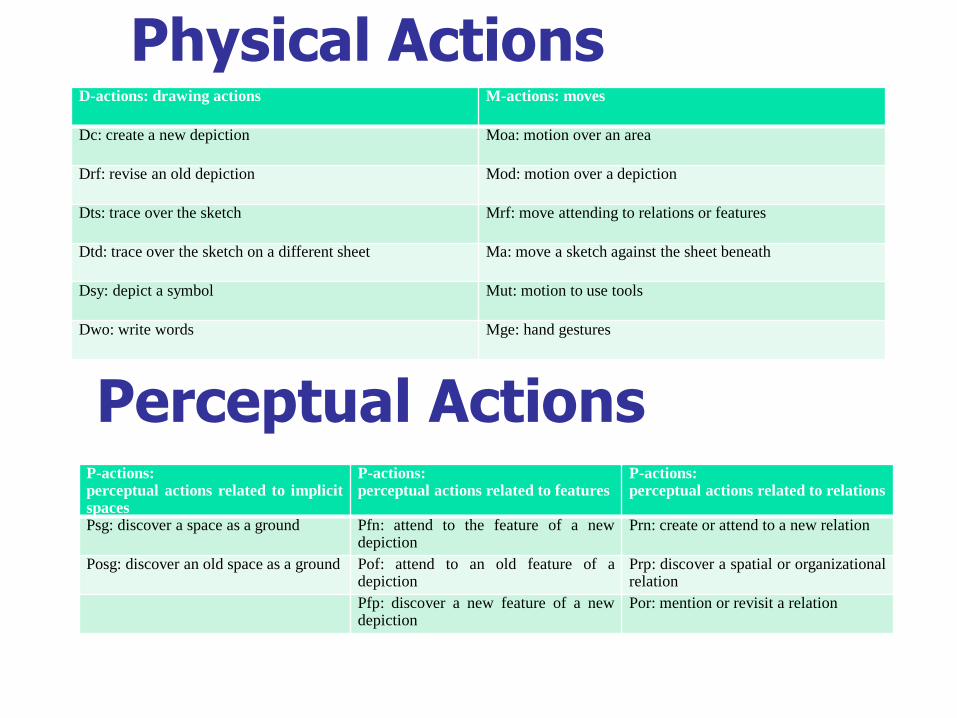
Physical Actions
D-actions: drawing actions M-actions: moves
Dc: create a new depiction Moa: motion over an area
Drf: revise an old depiction Mod: motion over a depiction
Dts: trace over the sketch Mrf: move attending to relations or features
Dtd: trace over the sketch on a different sheet Ma: move a sketch against the sheet beneath
Dsy: depict a symbol Mut: motion to use tools
Dwo: write words Mge: hand gestures
Perceptual Actions P-actions:
perceptual actions related to implicit spaces
P-actions: perceptual actions related to features
P-actions: perceptual actions related to relations
Psg: discover a space as a ground Pfn: attend to the feature of a new depiction
Prn: create or attend to a new relation
Posg: discover an old space as a ground Pof: attend to an old feature of a depiction
Prp: discover a spatial or organizational relation
Pfp: discover a new feature of a new depiction
Por: mention or revisit a relation
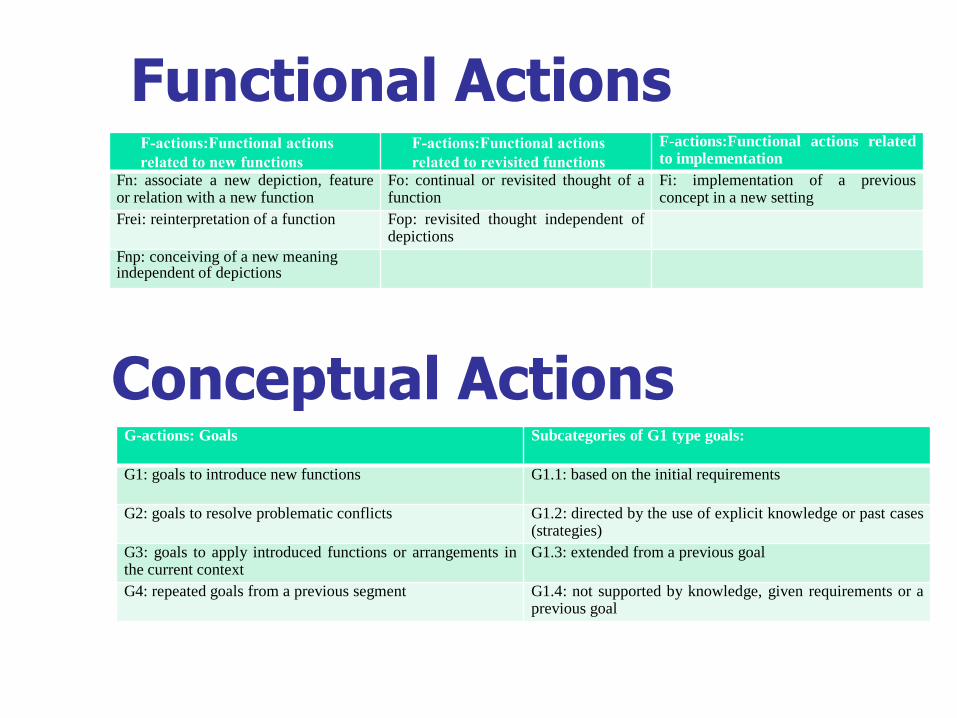
Functional Actions F-actions:Functional actions
related to new functions
F-actions:Functional actions
related to revisited functions
F-actions:Functional actions related to implementation
Fn: associate a new depiction, feature or relation with a new function
Fo: continual or revisited thought of a function
Fi: implementation of a previous concept in a new setting
Frei: reinterpretation of a function Fop: revisited thought independent of depictions
Fnp: conceiving of a new meaning independent of depictions
Conceptual Actions
G-actions: Goals Subcategories of G1 type goals:
G1: goals to introduce new functions G1.1: based on the initial requirements
G2: goals to resolve problematic conflicts G1.2: directed by the use of explicit knowledge or past cases (strategies)
G3: goals to apply introduced functions or arrangements in the current context
G1.3: extended from a previous goal
G4: repeated goals from a previous segment G1.4: not supported by knowledge, given requirements or a previous goal
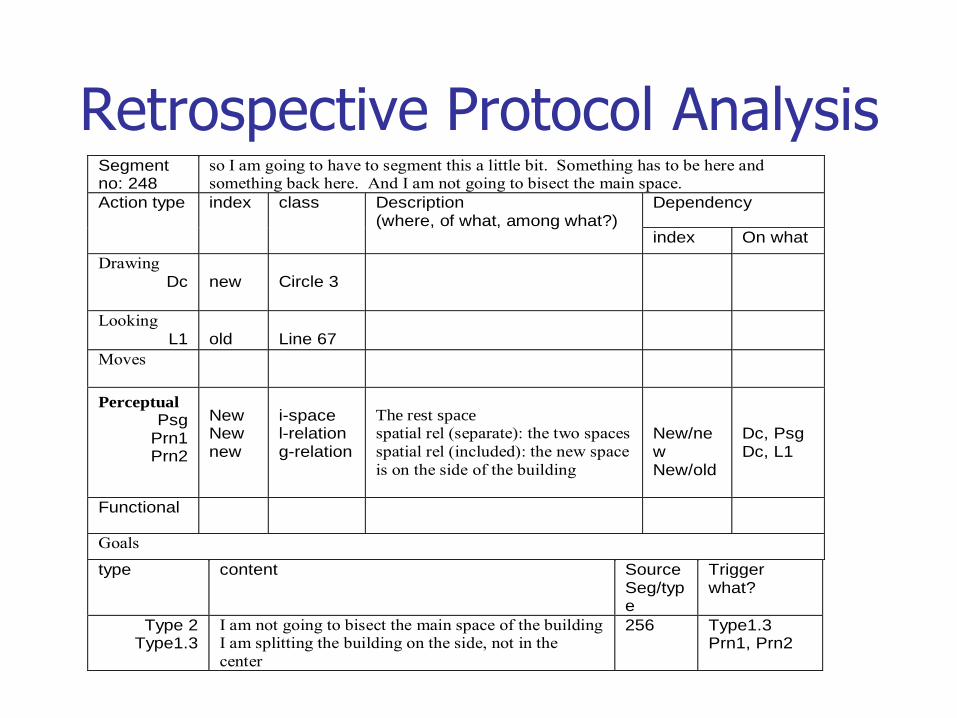
Retrospective Protocol Analysis
Segment no: 248
so I am going to have to segment this a little bit. Something has to be here and something back here. And I am not going to bisect the main space.
Action type index class Description (where, of what, among what?)
Dependency
index On what
Drawing
Dc new
Circle 3
Looking
L1 old
Line 67
Moves
Perceptual
Psg Prn1 Prn2
New New new
i-space l-relation g-relation
The rest space spatial rel (separate): the two spaces
spatial rel (included): the new space
is on the side of the building
New/new New/old
Dc, Psg Dc, L1
Functional
Goals
type content Source Seg/type
Trigger what?
Type 2 Type1.3
I am not going to bisect the main space of the building I am splitting the building on the side, not in the
center
256 Type1.3 Prn1, Prn2
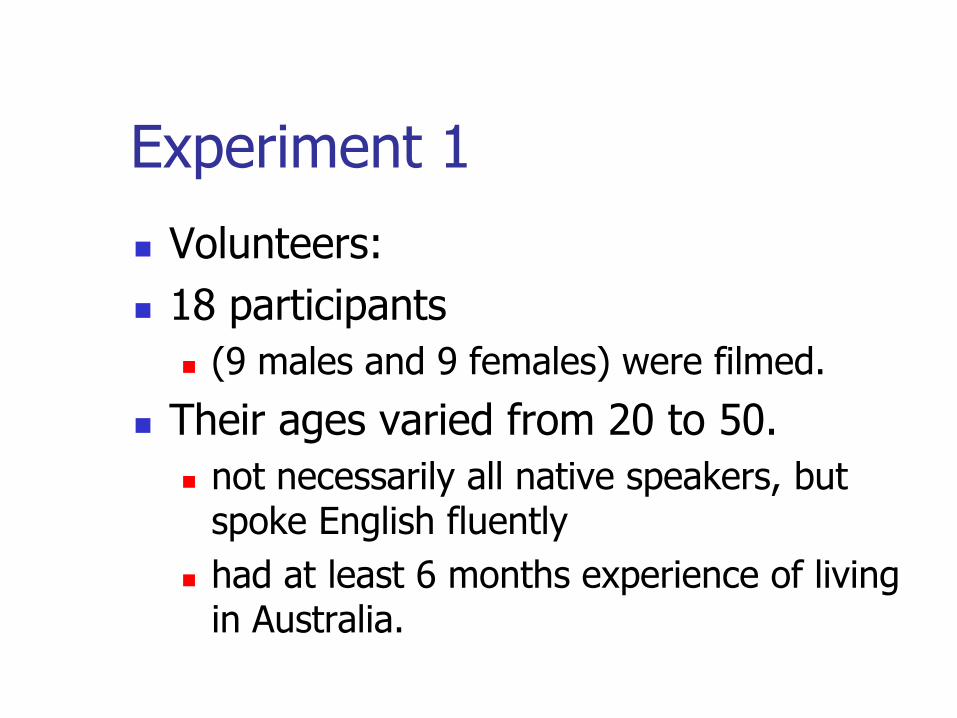
Experiment 1
Volunteers:
18 participants
(9 males and 9 females) were filmed.
Their ages varied from 20 to 50.
not necessarily all native speakers, but spoke English fluently
had at least 6 months experience of living in Australia.
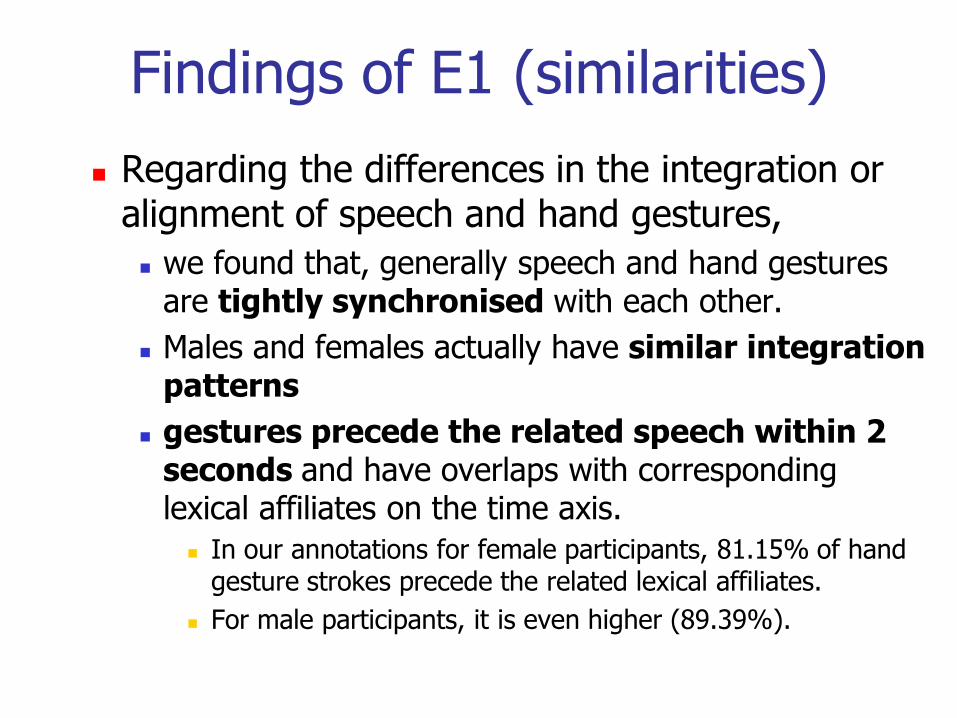
Findings of E1 (similarities)
Regarding the differences in the integration or alignment of speech and hand gestures,
we found that, generally speech and hand gestures are tightly synchronised with each other.
Males and females actually have similar integration patterns
gestures precede the related speech within 2 seconds and have overlaps with corresponding lexical affiliates on the time axis.
In our annotations for female participants, 81.15% of hand gesture strokes precede the related lexical affiliates.
For male participants, it is even higher (89.39%).
Findings of E1 (differences)
However, the temporal alignment of speech and hand gestures varies for males and females.
The time lags between speech and co-occurring hand gestures are shorter for females than males.
Also our findings showed that the duration of gesture strokes and related keywords are significantly different in males and females.

Findings of E1
These findings suggest that
gender is a significant factor in the integration of speech and hand gestures for the design of MMIS.
Adaptive integration strategies for different gender groups may improve the performance of systems.

Are Females’ Information Processing different from Males? In cognitive analysis, we found that females have
more cognitive actions for same tasks.
Females give more attention to details on different parts of the objects compared to males.
More cognitive actions may indicate more frequent brain activities, which can cause strong brain waves with significant changes.
The significant spectral moment in the brain for females may also imply faster brain activities associated with speech and hand gestures,
which may be the reason for shorter integration time of speech and hand gestures for females.
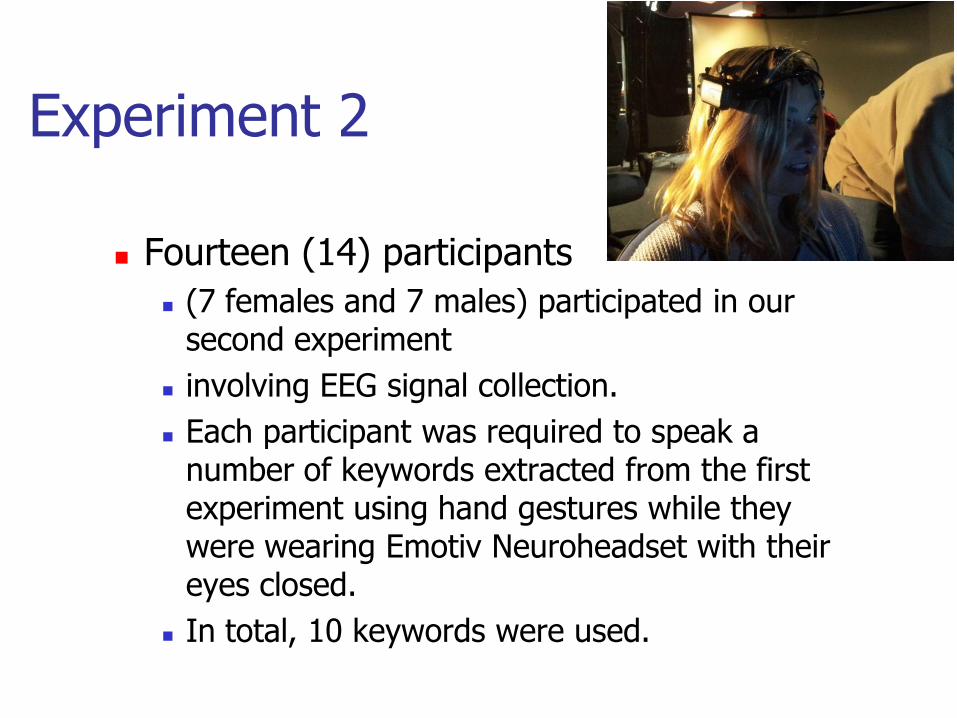
Experiment 2
Fourteen (14) participants
(7 females and 7 males) participated in our second experiment
involving EEG signal collection.
Each participant was required to speak a number of keywords extracted from the first experiment using hand gestures while they were wearing Emotiv Neuroheadset with their eyes closed.
In total, 10 keywords were used.
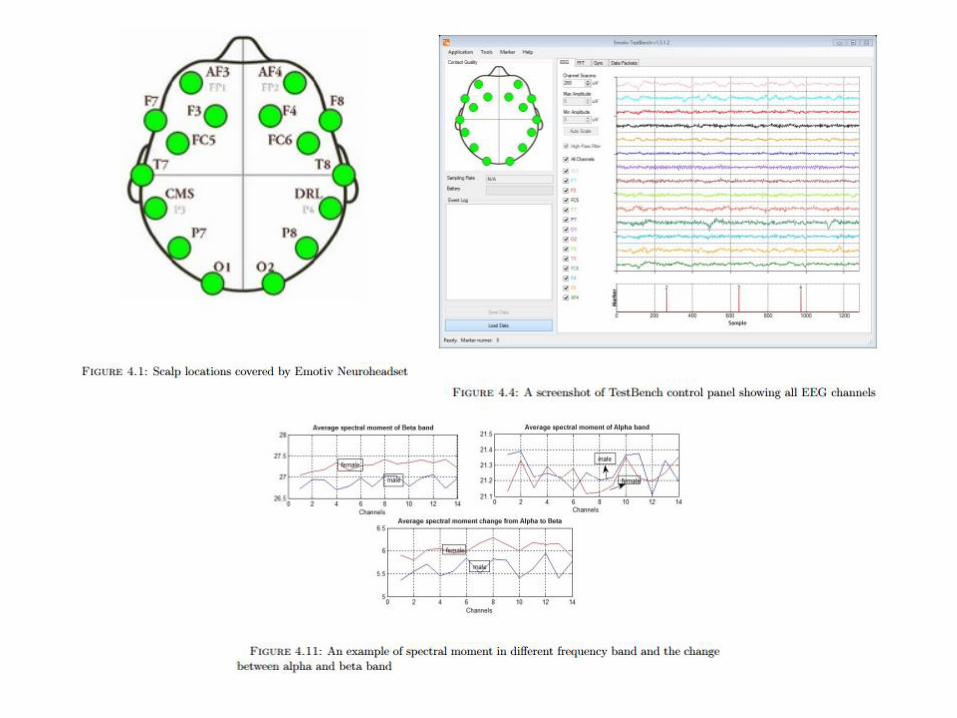
Findings of E2 However, when they use speech and hand
gestures coordinated together, we observe that beta spectral moment waves are stronger in females and the changes of spectral moment from alpha to beta bands are more significant for females.
The significant spectral moment in brain waves may imply faster brain activities for females when use speech and hand gestures coordination,
may be the reason for shorter integration time of speech and hand gestures for females.
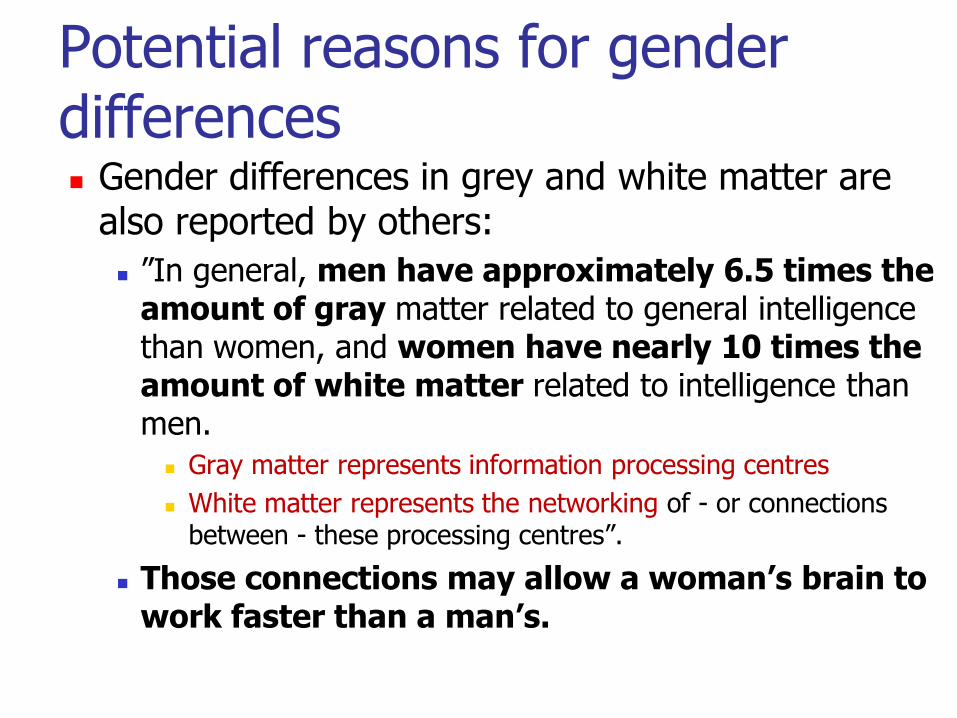
Potential reasons for gender differences Gender differences in grey and white matter are
also reported by others:
”In general, men have approximately 6.5 times the amount of gray matter related to general intelligence than women, and women have nearly 10 times the amount of white matter related to intelligence than men.
Gray matter represents information processing centres
White matter represents the networking of - or connections between - these processing centres”.
Those connections may allow a woman’s brain to work faster than a man’s.

Experiment 3
8 males and 10 females
5+5 were chosen
Total number of gestures: 157
25-30 years old
Asian and Australian
Professionals or university students
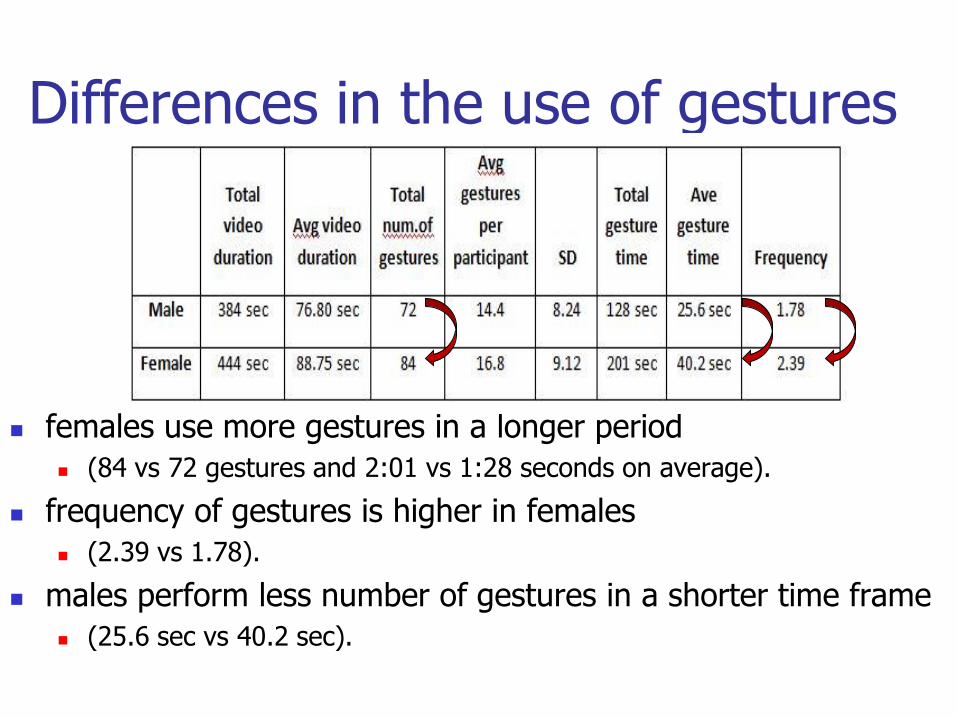
Differences in the use of gestures
females use more gestures in a longer period
(84 vs 72 gestures and 2:01 vs 1:28 seconds on average).
frequency of gestures is higher in females
(2.39 vs 1.78).
males perform less number of gestures in a shorter time frame
(25.6 sec vs 40.2 sec).

Findings of E3 There are gender differences in
the use of gestures and
the frequency and
types of gestures used.
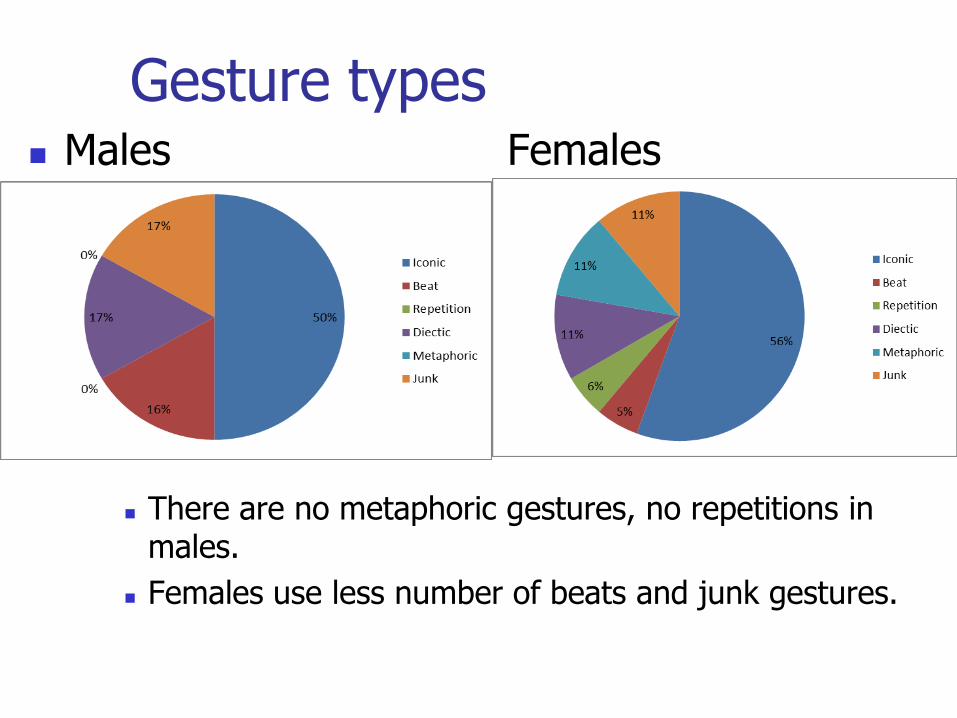
Gesture types Males Females
There are no metaphoric gestures, no repetitions in
males.
Females use less number of beats and junk gestures.

Culture We are locked into our cultural perspectives and
mindsets, while using a language.
Culture does not exist as a computational term in HCI.
The software of the machines may be globalized, but the software of the minds that use them is not.
Hofstede G. H., Hofstede G. J, Minkov Michael (2010) Cultures and organizations: software of the mind :
intercultural cooperation and its importance for survival. (3rd ed) McGraw-Hill Professional ISBN 0071664181, 9780071664189
Are there cultural differences in speech and gesture-based interaction?

Experiment 4
The participants are asked to describe two chairs to the camera.
We obtained approx 10 minutes of monologue object descriptions in a video footage.
10 participants divided in two groups.
Anglo-Celtics with English as a first language
English descendants (British or Irish ancestry).
Latin Americans with English as a second language
Mexican (3), Columbian (1) and Chilean (1)
proficient bilinguals with English as their second language and all have been in living in an English speaking country (Australia) for the past 6 months.

The Hofstede’s model of dimensions of national culture
Power Distance is the acceptance and expectation of power to be distributed unequally.
Uncertainty Avoidance indicates the extent to which the members of society feel uncomfortable or comfortable in an ambiguous or abnormal situation.
Individualism is the extent to which individuals are merged into groups.
Masculinity refers to the distribution of emotional roles between the genders, and also serves to classify a culture as assertive/ competitive (masculine) or modest/caring (feminine).
Long-Term Orientation. Countries with high Long-Term Orientation (LTO), foster pragmatic virtues oriented towards future rewards, in particular saving money, persistence, and adapting to changing circumstances.
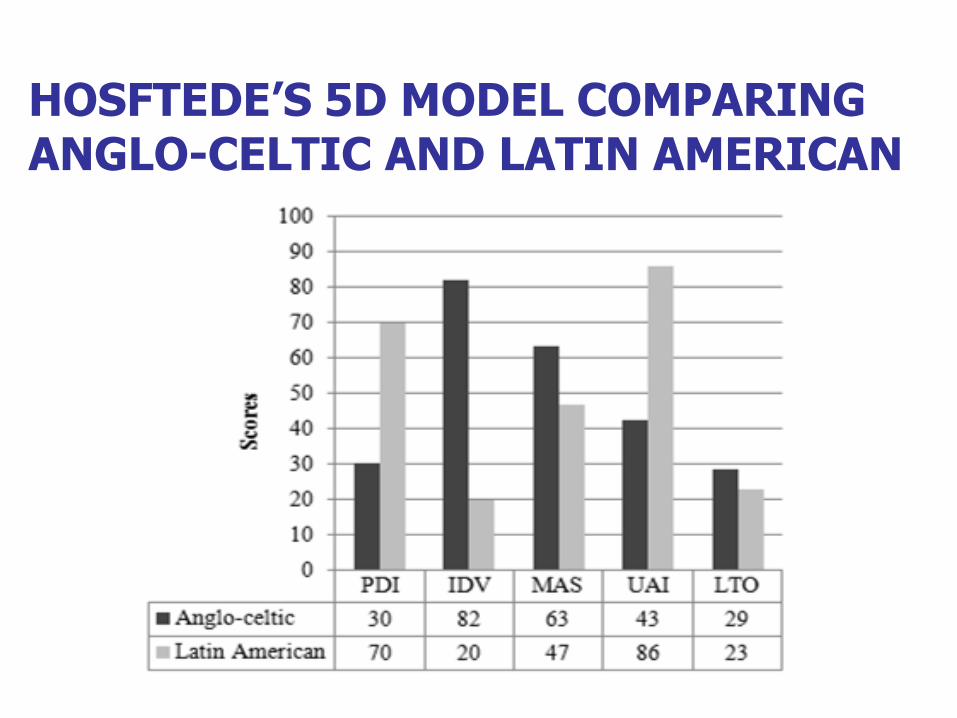
HOSFTEDE’S 5D MODEL COMPARING ANGLO-CELTIC AND LATIN AMERICAN

Hall’s classification of cultures
In a high context culture
the Middle East, Asia, Africa, and South America,
many things are left unsaid, letting the culture explain.
There is more non-verbal communication, a higher use of metaphors, and more reading between the lines.
In a low context culture
including North America and much of Western Europe,
the emphasis is on the spoken or written word.
They have explicit messages, focused on verbal communication, and their reactions could be visible, external and outward.

Assumption
Anglo-Celtic cultures
(e.g. Australian, British, Irish, and New Zealanders) categorize as low context cultures
Latin Americans
(American countries where Spanish and Portuguese are primarily spoken) correspond to the high context cultures.
Anglo-Celtic may predominantly use words,
while the Latin Americans would use gestures.

3 metrics
Gesture Type.
certain types of gestures could be attributed to different cultures
Frequency.
the number of gestures performed by a participant divided by the period of the gesture of the same participant.
Occurrence.
If certain gestures are culture-oriented or task-oriented (i.e., related to the task being performed).

EXPERIMENTAL RESULTS
Chair
Metrics
Sample Avg gesture
duration
Total no of
gestures Avg gestures SD
Avg gesture
Time Frequency
Chair 1 Anglo-Celtic 1.84 65 12.8 5.63 22.74 0.56
Chair 1 Latin
American 1.49 59 11.8 2.16 17.81 0.66
Chair 2 Anglo-Celtic 1.73 65 13 7.17 23 0.56
Chair 2 Latin
American 1.67 43 8.6 2.88 14.22 0.60

Results Anglo-Celtics
did not display too much variation between chair descriptions
The standard deviation was again higher
used more gestures on average to describe Chair 2 (Abstract chair)
The reason behind this could be the degree of comfort in using a language when describing complexity.
Latin Americans
used less number of gestures to describe the same chairs as Anglo-celtics.
had a smaller standard deviation and
more frequent gestures in both chairs,
shorter, concise, and common gestures by most of the participants.
smaller count of gestures by Latin Americans is justified by less time in which they performed the gestures.

Latin Americans gesture frequency is higher in Chair 1 compared to
Anglo-celtics, and
increases in Chair 2 when the chair is more abstract.
This could be because Latin Americans scored higher results in junk gestures in Chair 2.
used more words for Chair 1 and less in Chair 2
the lack of vocabulary.
The higher word count for Chair 1 must mean a higher degree of confidence, or more predictable and structured ideas
Words
Samples
Anglo-Celtic Latin American Both Total
Chair 1 9 13 6 28
Chair 2 13 10 5 30

Findings I
Gesture frequency indicates that
Overall, the Latin Americans performed more gestures per second;
Chair 1 had Iconic and repetition gestures with higher frequency in both samples.
Chair 2 on the other hand had an increase in junk and metaphoric gestures.
The most significant gestures for the gesture recognition were the iconic ones as well as repetitions, since these were the most frequent.

Findings II
Occurrence
For the Anglo-Celtics, there are no junk and deictic gestures in the description of Chair 1 sample, but they do appear in Chair 2.
number of gestures increases in Chair 2.
This means that the occurrence of gestures was related to the task, not to the culture.
Since Chair 2 was more complex and there was a need for more explanation by the user.
0
1
2
3
4
5
6
7
Chair 1 Chair 1 Chair 2 Chair 2
AUS MX AUS MX
Repetition
Beat
Iconic
Metaphoric
Diectic
Junk
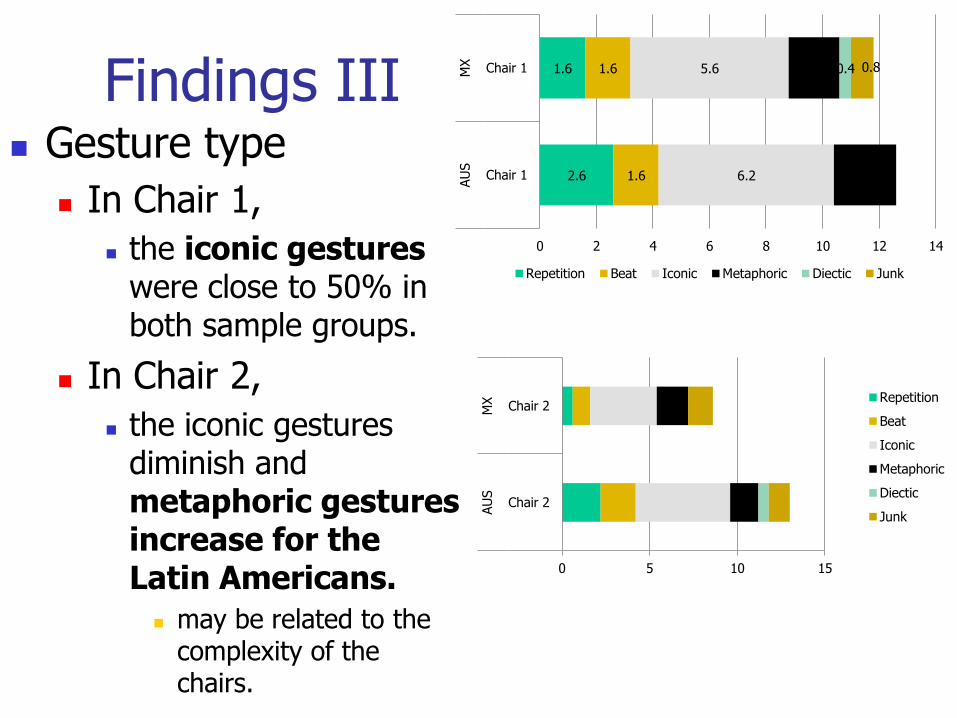
Gesture type
In Chair 1,
the iconic gestures were close to 50% in both sample groups.
In Chair 2,
the iconic gestures diminish and metaphoric gestures increase for the Latin Americans.
may be related to the complexity of the chairs.
2.6
1.6
1.6
1.6
6.2
5.6
2.2
1.8 0.4 0.8
0 2 4 6 8 10 12 14
Chair 1
Chair 1
AU
S
MX
Repetition Beat Iconic Metaphoric Diectic Junk
0 5 10 15
Chair 2
Chair 2
AU
S
MX Repetition
Beat
Iconic
Metaphoric
Diectic
Junk
Findings III

As Anglo-Celtics are low context cultures,
they used more words and gestures in longer time, since they took time to explain the chair in detail.
Latin Americans, which represent the high context culture, performed fewer gestures, in shorter time and used fewer words.
the higher use of metaphoric gestures, as this is a characteristic of a society that relies on reading between the lines and letting other nonverbal cues explain the meaning.
Hofstede’s Cultural Dimensions:

INDV.
This trait could be related in fact that the standard deviation between samples is higher with the Anglo-Celtic cultures reflecting the societies high individualism index (INDV, 82).
On the other hand, the low standard deviation with the Latin Americans shows the low individualism index (INDV, 20).
MASC.
This trait could be related to the fact that the Anglo-Celtics as a low context culture are more assertive (MASC, 63),
in comparison to the Latin Americans that are more human-oriented and therefore there is a higher use of metaphors (MASC, 47) in their descriptions.
UAI.
This trait could be reflected in Chair 2. The Anglo-Celtic sample did not vary too much in gesture means and time from one chair to another when they used more gestures to describe, showing greater comfort with adverse situations (UAI, 43).
It is possible to say that Latin Americans showed high uncertainty avoidance (UAI, 86) since they use less time and limited gestures, possibly sticking to “what they know”.

Findings E4 As the complexity of a task increases, so does the
use and type of gestures.
Frequency may affect the recognition rate because of the need for faster, and more efficient algorithms.
Occurrence affects interaction due to the possibility of absence (zero occurrence) of certain gestures that may convey functionality (iconic).
Identifying and classifying certain gestures would describe tendencies in the development of the gesture recognition tools.

Coucke (2013) examined multimodal computer interfaces with a particular attention to the area of speech and co-verbal gestures.
Krauss defines a lexical affiliate as
"The word whose retrieval the gesture is hypothesized to enhance”.
Experiment 5 Is Information Processing in VR different from Non-VR?

Task completion
Finding 1: Task times were longer in the 3D VR environment especially for some participants, compared to the non-3D environment.
Non-3D 0:00
1:12
2:24
3:36
4:48
6:00
2a tradi
tional
2a Hear
t
2b Hear
t
2b tradi
tional
2c hear
t
2c tradi
tional
2d hear
t
2d tradi
tional
2e hear
t
2e tradi
tional
Non-3D 2:22 1:43 2:01 1:00 1:12 1:08 1:53 1:56 1:53 1:15
3D 2:20 2:25 1:45 1:21 1:16 1:00 5:22 3:50 1:24 1:28
Re
co
rdin
g T
ime
Comparison of 3D and Non-3D recording times
0
10
20
30
40
50
60
Nu
mb
er
of
ge
stu
res
Gestures in 3D and Non-3d
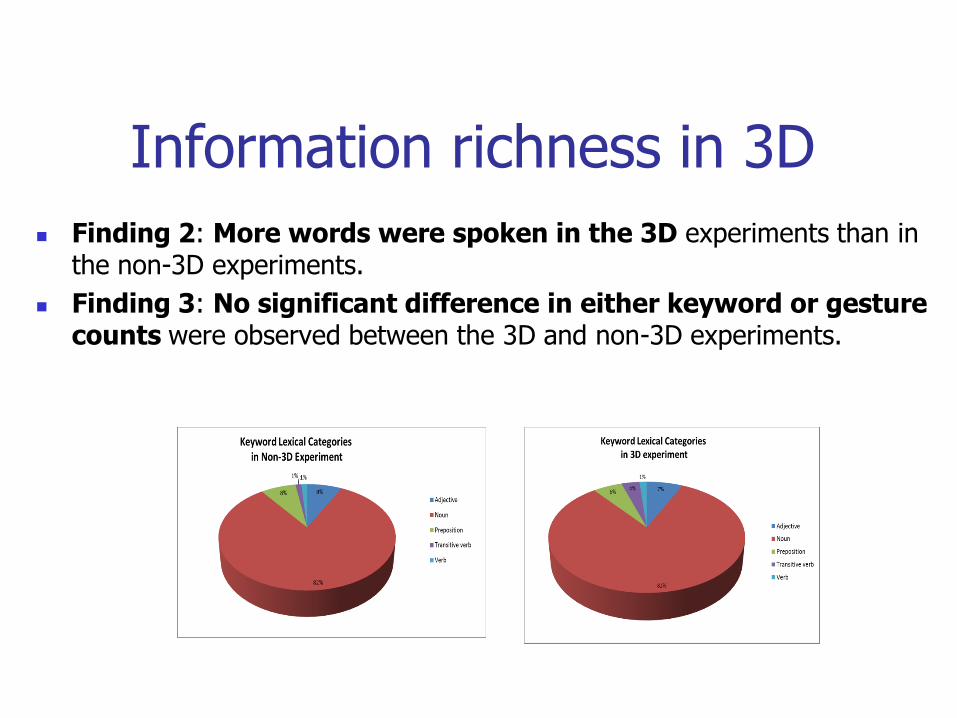
Information richness in 3D
Finding 2: More words were spoken in the 3D experiments than in the non-3D experiments.
Finding 3: No significant difference in either keyword or gesture counts were observed between the 3D and non-3D experiments.

Keywords Finding 4: The 3D environment
produced some unique keywords which reflected differences between the 2D and 3D objects, these include details.
Finding 5: Keywords and iconic gestures are correlated in both 3D and non-3D environments.
Finding 6: Nouns dominated keywords in both 3D and non-3D environments.
0
100
200
300
400
500
2a hear
t
2a Trad
itional
2b hear
t
2b tradi
tional
2c hear
t
2c tradi
tional
2d hear
t
2d tradi
tional
2e hear
t
2e tradi
tional
non 3d 200 296 214 93 116 84 195 213 149 132
3d 262 254 196 117 80 89 451 323 136 148
W
o
r
d
s
Words in 3D and Non-3D
0 10 20 30 40 50 60 70
2a hear
t
2a Tradi
tional
2b hear
t
2b tradi
tional
2c hear
t
2c tradi
tional
2d hear
t
2d tradi
tional
2e hear
t
2e tradi
tional
Non 3d 36 37 23 18 13 24 27 43 20 24
3d 32 24 20 20 15 16 62 41 19 21
Ke
yw
ord
s
Keywords in 3D and Non-3D
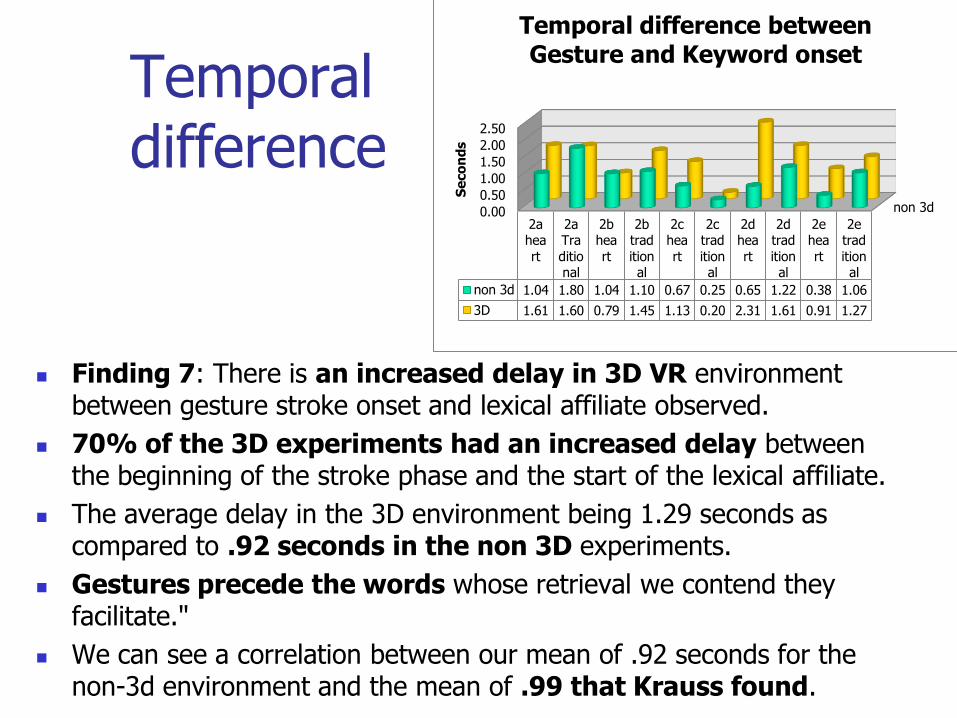
Finding 7: There is an increased delay in 3D VR environment between gesture stroke onset and lexical affiliate observed.
70% of the 3D experiments had an increased delay between the beginning of the stroke phase and the start of the lexical affiliate.
The average delay in the 3D environment being 1.29 seconds as compared to .92 seconds in the non 3D experiments.
Gestures precede the words whose retrieval we contend they facilitate."
We can see a correlation between our mean of .92 seconds for the non-3d environment and the mean of .99 that Krauss found.
Temporal difference
non 3d 0.00
0.50
1.00
1.50
2.00
2.50
2a hea
rt
2a Tra
ditional
2b hea
rt
2b trad
itional
2c hea
rt
2c trad
itional
2d hea
rt
2d trad
itional
2e hea
rt
2e trad
itional
non 3d 1.04 1.80 1.04 1.10 0.67 0.25 0.65 1.22 0.38 1.06
3D 1.61 1.60 0.79 1.45 1.13 0.20 2.31 1.61 0.91 1.27
Se
co
nd
s
Temporal difference between Gesture and Keyword onset

Experiment 6 Are Experts’ Information Processing different from Novices?
Analysis of design protocols of novice and expert designers, although based on a limited number of designers, have shown that there are differences in the balance of cognitive actions between the novice and the expert designers (Kavakli et al., 1999).
The hypothesis:
the reason for the imbalance in cognitive activity between the novice and the expert designers in the conceptual design process is the rate of information processing driven by their relative experience in drawing production and sketch recognition.

Design protocols Differences in Cognitive activity:
the expert : 2,916 actions and 348 segments,
the novice: 1,027 actions and 122 segments.
The expert's design protocol is 2.84 times as rich as the novice's in terms of actions.
There were 2.85 times as many segments in the expert designer's session as in the novice's.
Differences in Productivity: (~3.25-3.5 times)
the expert: 13 pages and 7 design alternatives
the novice: 4 pages and 2 design alternatives.
The statistical results (chi squared test, 2>c, at 0.5% significance level):
there are differences between the expert's and the novice's cognitive actions.
The strongest differences statistically are in perceptual actions and goals.

Key Centre of Design Computing, University of Sydney
Sketches I
What are the cognitive actions corresponding to each design action?

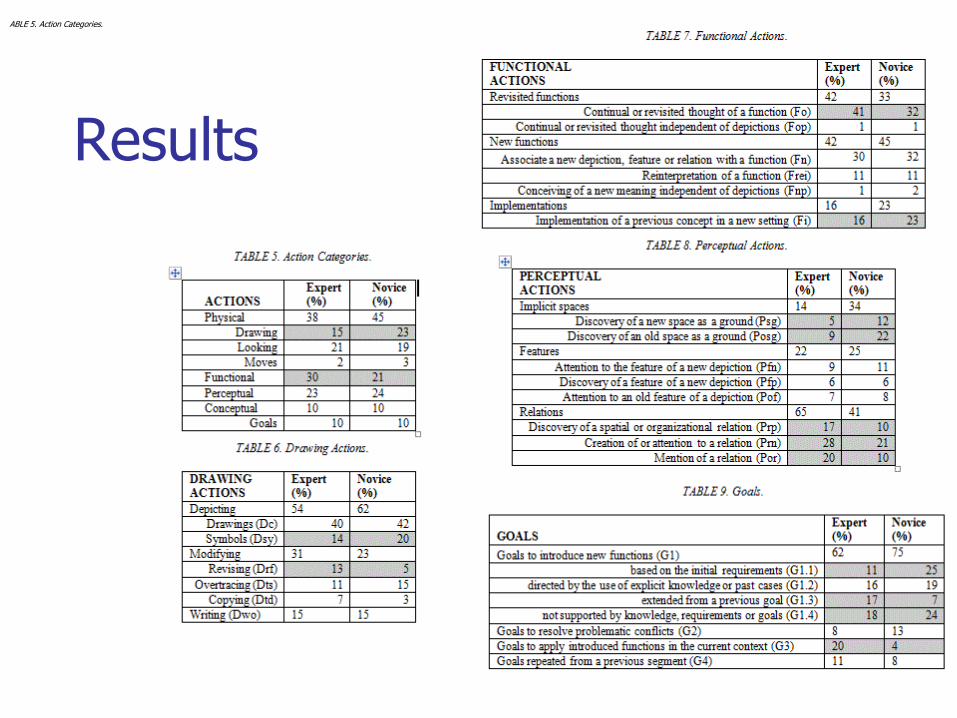
Results
ABLE 5. Action Categories.
Key Centre of Design Computing, University of Sydney
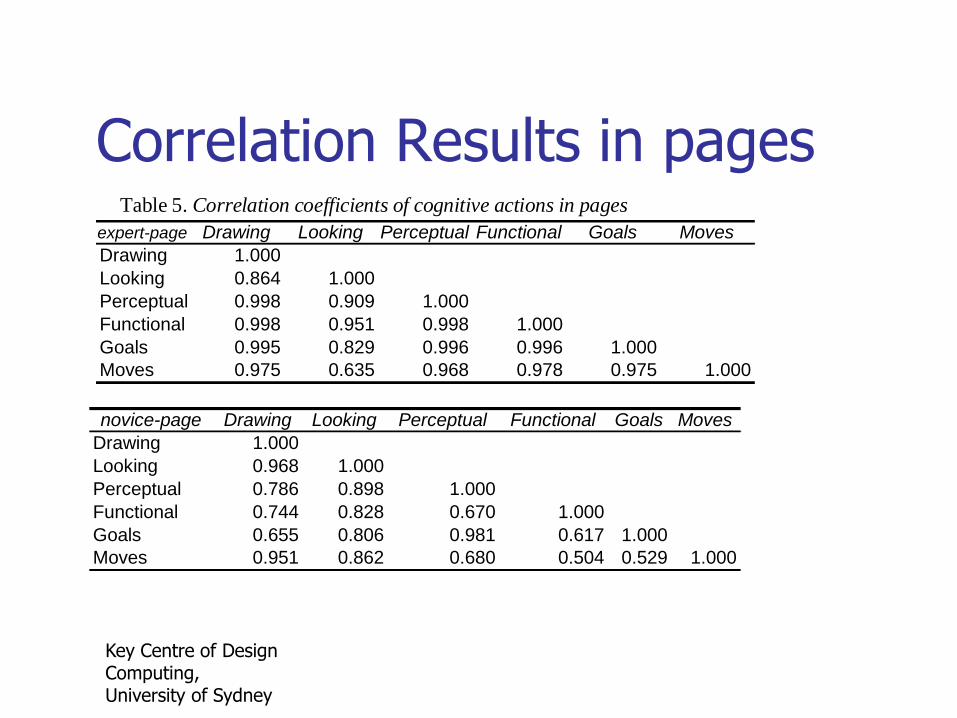
Correlation Results in pages Table 5. Correlation coefficients of cognitive actions in pages
expert-page Drawing Looking Perceptual Functional Goals Moves
Drawing 1.000
Looking 0.864 1.000
Perceptual 0.998 0.909 1.000
Functional 0.998 0.951 0.998 1.000
Goals 0.995 0.829 0.996 0.996 1.000
Moves 0.975 0.635 0.968 0.978 0.975 1.000
novice-page Drawing Looking Perceptual Functional Goals Moves
Drawing 1.000
Looking 0.968 1.000
Perceptual 0.786 0.898 1.000
Functional 0.744 0.828 0.670 1.000
Goals 0.655 0.806 0.981 0.617 1.000
Moves 0.951 0.862 0.680 0.504 0.529 1.000

Sketching as Mental imagery processing
Imagery and perception share many of the same types of neural mechanisms (Farah, 1988, Finke, 1980, 1989) and all characterizations of imagery rest on its resemblance to perception (Kosslyn, 1995).
Given the apparent parallels between the uses of imagery and those of like-modality perception (Osherson, 1995), it is not surprising that imagery apparently shares some of the same processing mechanisms used in recognition (Finke and Shepard, 1986, Kosslyn, 1995).
Modality-specific interference (Osherson, 1995):
Multisensory integration, also known as multimodal integration, is the study of how information from the different sensory modalities, such as sight, sound, touch, smell, self-motion and taste, may be integrated by the nervous system
Imagery and perception can often be considered functionally equivalent processes (Finke, 1980, Shepard, 1984).
Kavakli, M., Gero, J.S., 2001: Sketching as mental imagery processing, Design Studies, Vol 22/4, 347-364, July, ISSN 0142-694X (110 citations) [ERA A*] Impact Factor: 0.983
FOR MORE INFO...
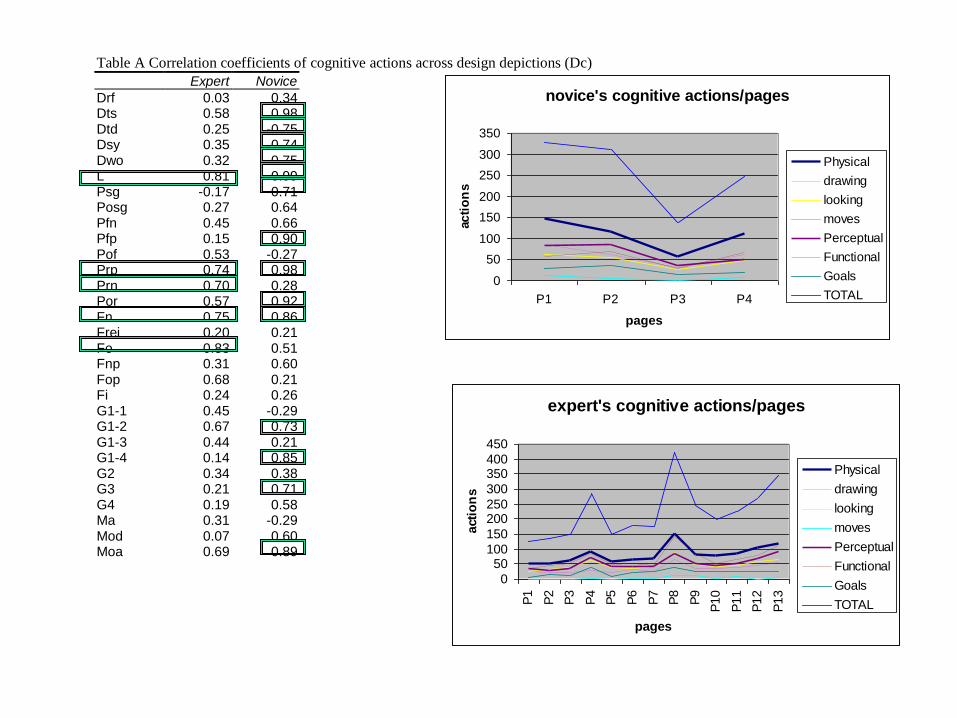
Table A Correlation coefficients of cognitive actions across design depictions (Dc)
Expert Novice
Drf 0.03 0.34 Dts 0.58 0.98 Dtd 0.25 -0.75 Dsy 0.35 0.74 Dwo 0.32 0.75 L 0.81 0.99 Psg -0.17 0.71 Posg 0.27 0.64 Pfn 0.45 0.66 Pfp 0.15 0.90 Pof 0.53 -0.27 Prp 0.74 0.98 Prn 0.70 0.28 Por 0.57 0.92 Fn 0.75 0.86 Frei 0.20 0.21 Fo 0.83 0.51 Fnp 0.31 0.60 Fop 0.68 0.21 Fi 0.24 0.26 G1-1 0.45 -0.29 G1-2 0.67 0.73 G1-3 0.44 0.21 G1-4 0.14 0.85 G2 0.34 0.38 G3 0.21 0.71 G4 0.19 0.58 Ma 0.31 -0.29 Mod 0.07 0.60 Moa 0.69 0.89
expert's cognitive actions/pages
0
50100
150
200250
300
350400
450
P1
P2
P3
P4
P5
P6
P7
P8
P9
P10
P11
P12
P13
pages
acti
on
sPhysical
drawing
looking
moves
Perceptual
Functional
Goals
TOTAL
novice's cognitive actions/pages
0
50
100
150
200
250
300
350
P1 P2 P3 P4
pages
ac
tio
ns
Physical
drawing
looking
moves
Perceptual
Functional
Goals
TOTAL
Key Centre of Design Computing, University of Sydney
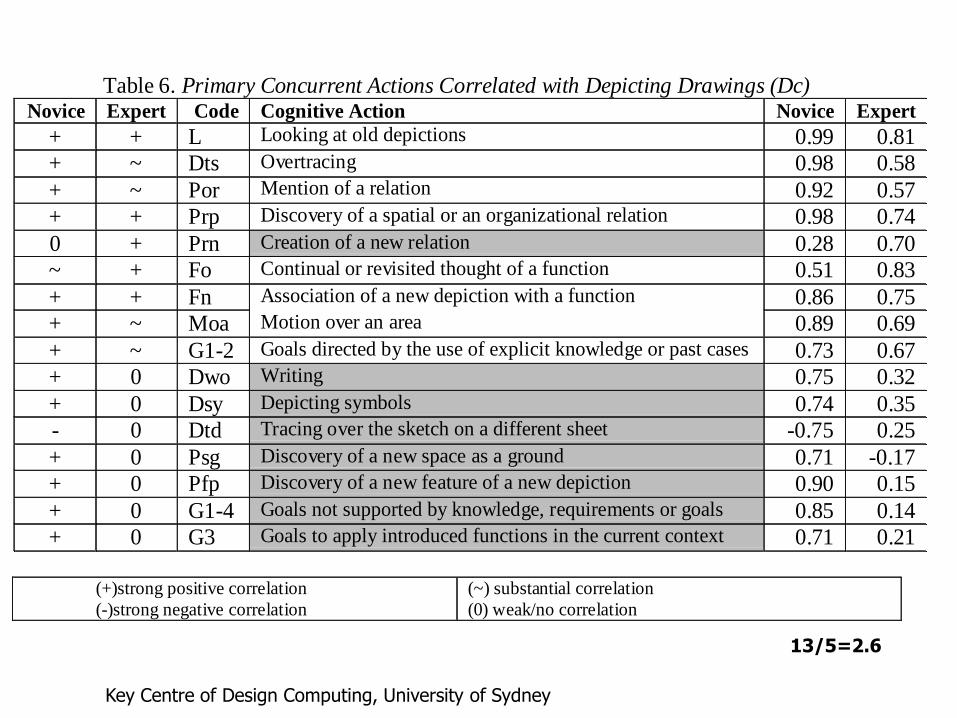
Table 6. Primary Concurrent Actions Correlated with Depicting Drawings (Dc)Novice Expert Code Cognitive Action Novice Expert
+ + L Looking at old depictions 0.99 0.81
+ ~ Dts Overtracing 0.98 0.58
+ ~ Por Mention of a relation 0.92 0.57
+ + Prp Discovery of a spatial or an organizational relation 0.98 0.74
0 + Prn Creation of a new relation 0.28 0.70
~ + Fo Continual or revisited thought of a function 0.51 0.83
+ + Fn Association of a new depiction with a function 0.86 0.75
+ ~ Moa Motion over an area 0.89 0.69
+ ~ G1-2 Goals directed by the use of explicit knowledge or past cases 0.73 0.67
+ 0 Dwo Writing 0.75 0.32
+ 0 Dsy Depicting symbols 0.74 0.35
- 0 Dtd Tracing over the sketch on a different sheet -0.75 0.25
+ 0 Psg Discovery of a new space as a ground 0.71 -0.17
+ 0 Pfp Discovery of a new feature of a new depiction 0.90 0.15
+ 0 G1-4 Goals not supported by knowledge, requirements or goals 0.85 0.14
+ 0 G3 Goals to apply introduced functions in the current context 0.71 0.21
(+)strong positive correlation
(-)strong negative correlation
(~) substantial correlation
(0) weak/no correlation
13/5=2.6

Table 7. Secondary Concurrent Actions Correlated with Depicting Drawings (Dc)Action
Code
Novice Expert Novice's
Secondary Concurrent Actions
Expert's Secondary
Concurrent ActionsL + + Dc, Dts, -Dtd, Dwo, Psg, Posg, Pfp, Prp, Por, Fn, G1-
2, G1-4, G3, Moa
Dc, Prp, Por, Fo
Dts + ~ Dc, Pfn, -Prn, Fi, G1-1, Ma Dtd
Por + ~ Dc, Dts, -Dtd, Dwo, L, Posg, Prp, Fo, G1.2, G1.4,
G2, G3
L, Prp, Fo
Prp + + Dc, Dts, -Dtd, Dwo, L, Psg, Posg, Pfp, Por, Fn, G1-2,
G1-4, G3, Moa
Dc, L, Pof, Por, Fo
Prn 0 + Dc
Fo ~ + -Dtd, Pfn, Por, Frei, Fop, G1-3, G1-4, G2, G3 Dc, L, Prp, Por
Fn + + Dc, Dsy, L, Psg, Pfp, Prp, -Pof Dc
Moa + ~ Dc, Dts, Dsy, L, Psg, Pfp, Prp, Fn, Fnp, Mod Dc, Fn, Fop, G1-2
G1-2 + ~ Dc, Dts, Dwo, L, Psg, Posg, Prp, Prn, Por, -G1.1,
G1.4, G4, -Ma
Moa
Dwo + 0 Dc, Dts, L, Posg, Prp, Prn, Por, G1-2, G1-4, G2, G3
Dsy + 0 Dc, Psg, Pfp, -Pof, Fn, Fnp, Mod, Moa
Dtd - 0 -Dc, -Dts, -L, -Pfn, -Prp, -Por, -Fo, -Fi, -G1-4, -G3
Psg + 0 Dc, Dts, Dsy, L, Pfp, Prp, Fn, Fnp, -G1.1, G1-2, G4,-
Ma, Mod, Moa
Pfp + 0 Dc, Dts, Dsy, L, Psg, Fo, Fi, G3
G1-4 + 0 Dc, Dts, -Dtd, Dwo, L, Posg, Prp, Por, Fo, G1-2, G2,
G3
G3 + 0 Dc, Dts, -Dtd, Dwo, L, Posg, Pfn, Prp, Por, Frei, Fo,Fop, G1-3, G1-4, G2
(+) positive strong correlation
(-) negative strong correlation
(~) substantial correlation
(0) weak/no correlation15/6=2.5
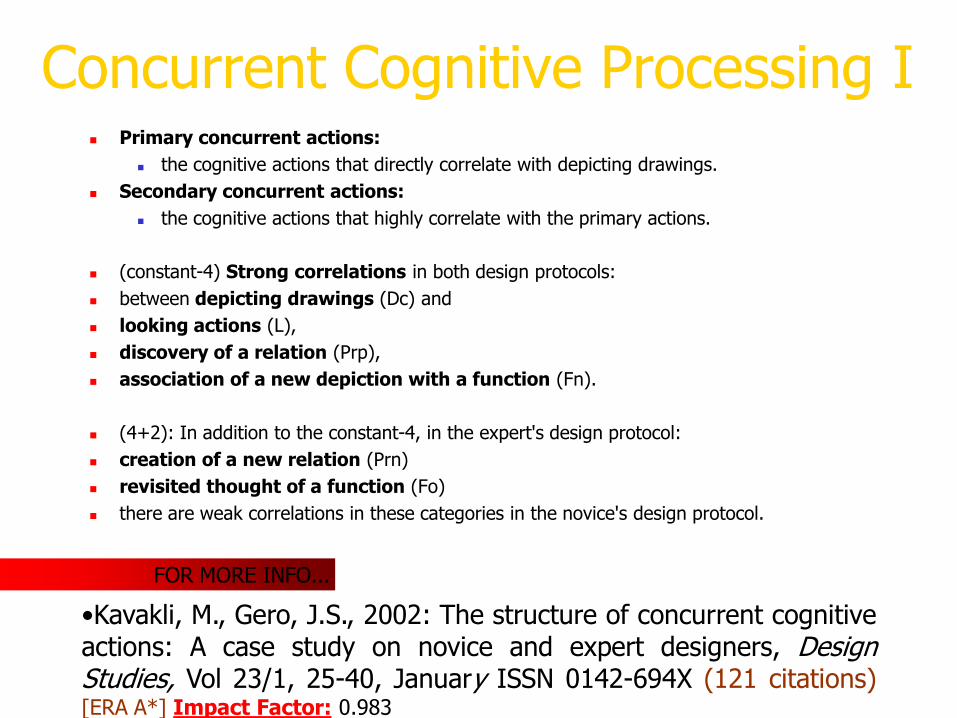
Concurrent Cognitive Processing I Primary concurrent actions:
the cognitive actions that directly correlate with depicting drawings.
Secondary concurrent actions:
the cognitive actions that highly correlate with the primary actions.
(constant-4) Strong correlations in both design protocols:
between depicting drawings (Dc) and
looking actions (L),
discovery of a relation (Prp),
association of a new depiction with a function (Fn).
(4+2): In addition to the constant-4, in the expert's design protocol:
creation of a new relation (Prn)
revisited thought of a function (Fo)
there are weak correlations in these categories in the novice's design protocol.
•Kavakli, M., Gero, J.S., 2002: The structure of concurrent cognitive actions: A case study on novice and expert designers, Design Studies, Vol 23/1, 25-40, January ISSN 0142-694X (121 citations) [ERA A*] Impact Factor: 0.983
FOR MORE INFO...
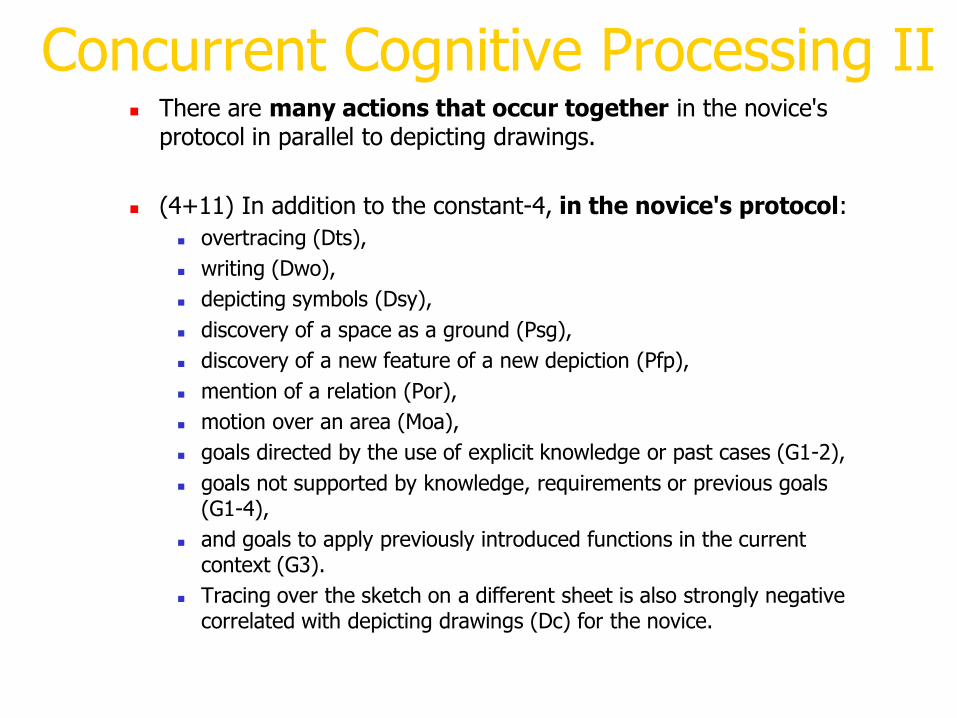
Concurrent Cognitive Processing II There are many actions that occur together in the novice's
protocol in parallel to depicting drawings.
(4+11) In addition to the constant-4, in the novice's protocol:
overtracing (Dts),
writing (Dwo),
depicting symbols (Dsy),
discovery of a space as a ground (Psg),
discovery of a new feature of a new depiction (Pfp),
mention of a relation (Por),
motion over an area (Moa),
goals directed by the use of explicit knowledge or past cases (G1-2),
goals not supported by knowledge, requirements or previous goals (G1-4),
and goals to apply previously introduced functions in the current context (G3).
Tracing over the sketch on a different sheet is also strongly negative correlated with depicting drawings (Dc) for the novice.
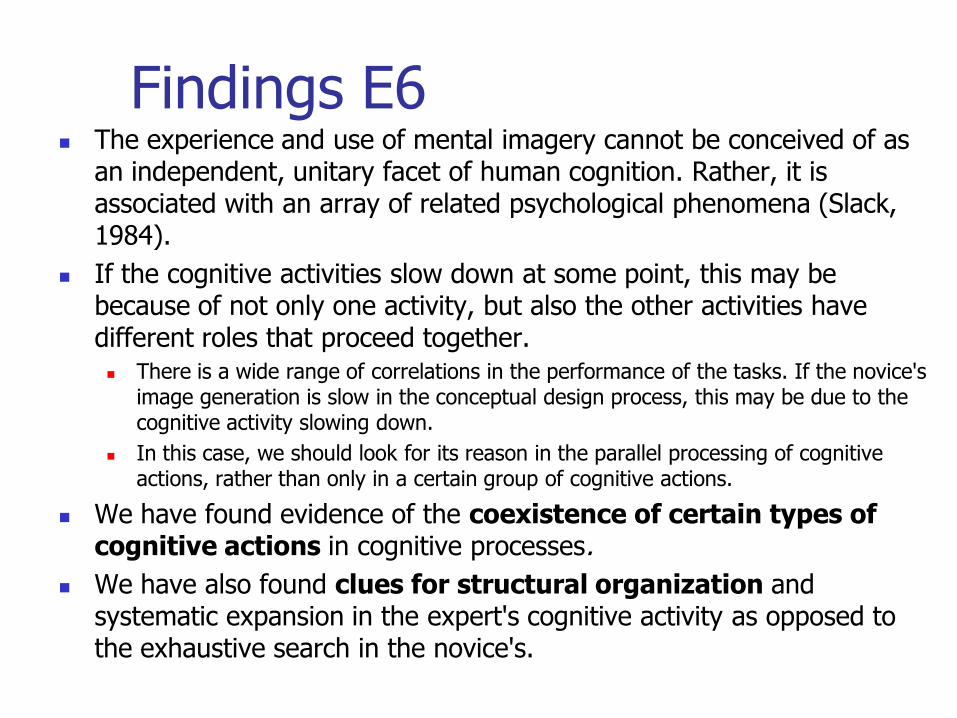
Findings E6 The experience and use of mental imagery cannot be conceived of as
an independent, unitary facet of human cognition. Rather, it is associated with an array of related psychological phenomena (Slack, 1984).
If the cognitive activities slow down at some point, this may be because of not only one activity, but also the other activities have different roles that proceed together. There is a wide range of correlations in the performance of the tasks. If the novice's
image generation is slow in the conceptual design process, this may be due to the cognitive activity slowing down.
In this case, we should look for its reason in the parallel processing of cognitive actions, rather than only in a certain group of cognitive actions.
We have found evidence of the coexistence of certain types of cognitive actions in cognitive processes.
We have also found clues for structural organization and systematic expansion in the expert's cognitive activity as opposed to the exhaustive search in the novice's.
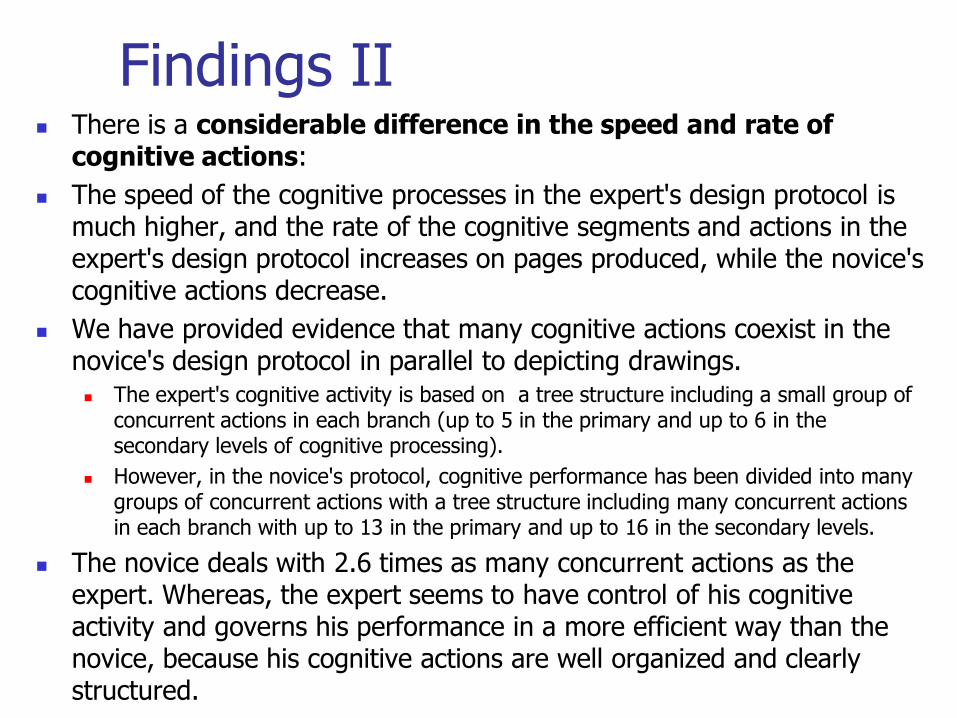
Findings II There is a considerable difference in the speed and rate of
cognitive actions:
The speed of the cognitive processes in the expert's design protocol is much higher, and the rate of the cognitive segments and actions in the expert's design protocol increases on pages produced, while the novice's cognitive actions decrease.
We have provided evidence that many cognitive actions coexist in the novice's design protocol in parallel to depicting drawings. The expert's cognitive activity is based on a tree structure including a small group of
concurrent actions in each branch (up to 5 in the primary and up to 6 in the secondary levels of cognitive processing).
However, in the novice's protocol, cognitive performance has been divided into many groups of concurrent actions with a tree structure including many concurrent actions in each branch with up to 13 in the primary and up to 16 in the secondary levels.
The novice deals with 2.6 times as many concurrent actions as the expert. Whereas, the expert seems to have control of his cognitive activity and governs his performance in a more efficient way than the novice, because his cognitive actions are well organized and clearly structured.

Findings III The structural organization in the expert's concurrent cognitive actions
may be the reason for the expert's relatively high performance compared to the novice's.
While the expert’s highly focused attention might play a major role in his higher performance and productivity, the novice's widely distributed and defocused attention might play a major role in the higher rates of certain types of discoveries, by making remote associations available.
This raises a question: may this unstructuredness in cognitive activity accidentally lead to certain type of discoveries? In this case, can we talk about the positive affect of unstructuredness on discoveries,
while it may also be the cause for the drop in the performance?
The structuredness in cognitive activity may govern the performance in design process, while the unstructuredness may support the occurrence of certain type of discoveries, making remote associations accessible.
This may explain the novice’s success in creating novelty and the experts’ success in performance called expertise.

Conclusion I We analyzed cognitive actions of designers using the retrospective
protocol analysis method and found evidence of coexistence of certain types of cognitive actions in both novice and expert designers’ protocols. The main difference between the two designers’ protocols is the structure of concurrent cognitive actions. While the expert's cognitive actions are clearly organized and structured, there are many concurrent actions that are hard to categorize in the novice’s protocol. We also found that the expert’s cognitive activity and productivity in the design process were three times as high as the novice's.
Structured and organized acts govern performance in the design process.
If so,
how can we optimise cognitive processing and cognitive load?

Conclusion II
We need to know more about Information Processing Models
in different environments
by different user groups
targeting different tasks
and using different modes of interaction.