department for international development bosnia...
TRANSCRIPT

Department for International Development
BOSNIA AND HERZEGOVINA
LABOUR AND SOCIAL POLICY IN BOSNIA AND HERZEGOVINA: THE DEVELOPMENT OF POLICIES AND MEASURES FOR SOCIAL MITIGATION
Contract Number CNTR 00 1368A
Living in BiH
Panel Study Final Report
DRAFT FINAL REPORT
for DUG MEMBER COMMENTS
and STAKEHOLDER DISCUSSION
A BACKGROUND FOR POLICY DEVELOPMENT
08 November 2004 Birks Sinclair & Associates Ltd. Independent Bureau for Humanitarian Issues Gatehouse Suite Šacira Sikirića 12 Palatine House 71000 Sarajevo Belmont Business Park Bosnia and Herzegovina Durham, DH1 1TW United Kingdom Phone: 00-44-191-386-4484 Phone/Fax: 00 387 33 219 780 /1/ 00 387 33 268 750 Fax: 00-44-191-384-8013 E-mail: [email protected] E-mail: [email protected] Institute for Social and Economic Research University of Essex Wivenhoe Park Colchester CO4 3SQ United Kingdom Phone: 00 44 1206 872 957 Fax: 00 44 1206 873 151 E-mail: [email protected]

This document is an output from a project funded by the UK Department for International
Development (DFID). The views expressed are not necessarily those of DFID.
Acknowledgements and Attributions
This Report was the result of the partnership of a joint international and Bosnia and Herzegovina
(BiH) team.
The joint team leaders were Dr Žarko Papić, Dr Stace Birks and Lewis Cornelius, supported by
Rachel Smith - who directed and trained for field survey operations and data input - and Dr. Heather
Laurie, Frances Williams, Randy Banks, Prof. Peter Lynn and Jon Burton, who provided technical
advice and guidance, training inputs and quality control to the management of the survey
implementation.
The Report itself was authored by Dr Heather Laurie and Dr Jon Burton from the Institute for Social
and Economic Research of the University of Essex.
Overall supervision and guidance was provided by the two Data User Groups (DUGs) of FBiH and
RS. The DUGs monitored the work process and guided the emphasis of the report. Institutional and
individual composition of the DUGs membership is listed in Appendix B.
The BiH team included Slavka Popović and Dr Hasan Zolić from the Agency for Statistics of BiH
(BHAS), prof. Derviš Đuđević and Munira Zahiragić from the Federal Office of Statistics (FOS) and
Slavko Šobot and Jelena Đokić from the Republika Srpska Institute of Statistics (RSIS) who provided
strategic advice in the management of the survey; Edin Šabanović and Jelena Miovčić from BHAS,
Zdenko Milinović and Fehrija Mehić from the FOS and Bogdana Radić and Vesna Grubiša from
RSIS who organised the fieldwork component of the survey and Fahrudin Memić and Ahmet Fazlić
from FOS and Donald Prohaska and Vladan Sibinović who were responsible for the data processing
component.
We would particularly like to emphasise that the Panel Survey is implemented as a joint effort and
"project" of BHAS, FOS and RSIS, contributing to their own capacity development.
The team were supported by Ana Abdelbasit, Project Assistant.
The team would also like to thank the supervisors and interviewers that made the collection of data in
the field a success and the data entry operators responsible for data input.
A special mention goes to the panel respondents themselves. The time given by them reflects their
understanding of the need to provide policy-makers with a more detailed picture of trends in BiH in
the hope of improving the tools on which the development of policies rely and the respondents’ desire
to participate in this processes themselves. The team are grateful for their time without which this
report would not have existed.
Comments on the questionnaire and helpful contributions were received from Kinnon Scott, Milan
Vodopivec, Ruslan Yemtsov and Kendra Gregson of the World Bank.
Thanks are due to the support of DFID, and in particular to comments and support from Robin Milton,
Laurie Joshua, Kim Bradford-Smith, Malcolm Worboys, Russell Watson, Anamaria Golemac Powell
and Alan Holmes.
The responsibility for the report and its conclusions lies with the team leaders.
List of Acronyms
BHAS Agency for Statistics of Bosnia and Herzegovina
BiH Bosnia and Herzegovina
BiHDS BiH Medium Term Development Strategy
DFID Department for International Development
DUG Data Users Group
FBiH The Federation of Bosnia and Herzegovina
FOS The Federal Office of Statistics
HBS Household Budget Survey
HSPS Household Survey Panel Series
IBHI Independent Bureau for Humanitarian Issues
ILO International Labour Organisation
ISCO International Standard Classification of Occupations
ISER Institute of Social and Economic Research
KM Convertible Mark (Konvertibilna Marka)
LFS Labour Force Survey
LSMS Living Standards Measurement Survey
NACE Nomenclature générale des Activités économiques dans les Communautés
Européenes (General Industrial Classification of Economic Activities within the
European Communities)
NSM New Sample Member
OSM Old Sample Member
RS The Republika Srpska
RSIS The Republika Srspka Institute for Statistics
SI Statistical Institution
WB World Bank

Contents
1. Introduction 3
2. Demographic and social situation in BiH 8
3. Housing, migration and geographic mobility 15
4. Employment and unemployment 30
5. Income 44
6. Poverty dynamics 54
7. Health 61
8. Values, opinions and quality of Life 72
Appendices
Appendix A Fieldwork and Technical Report
Appendix B Institutional Composition and Terms of Reference of the Data User Groups (DUGs)
Appendix C Summary of Project

1
Executive Summary
The Household Survey Panel Series (known as the “Living in BiH” survey) has conducted
interviews with around 3000 household in BiH over the last three years, 2001 - 2003.
The resulting panel data set provides the first longitudinal data for BiH and is a unique data
source for monitoring change over time across a range of areas important for policy development,
and especially in relation to the BiH Development Strategy (BiHDS) or PRSP.
Over the three years of the survey, the main findings suggest that there has been an overall
improvement in living conditions and the labour market situation in BiH:
• unemployment has fallen over the period;
• employment rates for the working age population have risen; and
• mean household income levels for BiH have increased, mainly due to increases in income
from employment sources.
People’s housing situation also seems to have shown signs of improvement, with fewer people
living in temporary types of accommodation and moving to more permanent situations. Access to
new technologies such as the internet and mobile telephones has grown rapidly over the past few
years, providing opportunities for personal and business development.
Despite these improvements areas of concern for social policy remain:
• A significant proportion of households still do not have access to basic facilities essential
for public health such as indoor running water and sewerage.
• Education levels remain low for the majority of the population, while those with higher
qualifications do significantly better in terms of employment, income and standard of
living than those with lower levels of qualifications.
• A significant proportion of households are in poverty over the three year period with
relatively few managing to make the transition out of poverty.
Making and monitoring progress in these areas will be key to the implementation of the BiHDS.
While general standards of living and the labour market situation have improved in BiH, there is
some evidence that the FBiH has, on the whole, fared better over the past few years than the RS.

2
Income levels have remained fairly static in the RS while they have improved in the FBiH,
despite the fact that both entities have seen an increase in employment and a decrease in
unemployment. This suggests some evidence of a growing gap in living standards and
opportunities between the entities. Without further years of panel data, it cannot be said whether
this trend will continue or not. Nonetheless, it does raise a number of policy implications which
will need to be considered over the coming years.

3
Living in BiH
Panel Study Final Report
DRAFT FOR STAKEHOLDER DISCUSSION
AND POLICY DEVELOPMENT
1. Introduction
This action oriented study addresses the fundamental issue of facilitating the appropriate development
of social policy in BiH. Policy making authorities in each entity within BiH face a series of
problematic choices in terms of social policy. The quantitative and qualitative data and analysis
essential for social policy are relatively weak. Yet circumstances are complex and pressures to
formulate effective and sustainable policy are growing in particular following the acceptance of the
BiHDS. This report therefore contributes to a framework that:
• informs and supports the policy making process throughout, and strengthens the social policy
making function at entity level;
• provides an established methodology of monitoring progress towards social and economic
goals as embodied in the BiHDS; and
• supports the Statistical Institutions (SIs) responsible for statistical analysis, monitoring and
reporting to enable informed policy making.
It does this by presenting BiH household panel data - resulting from repeat interviews of a sample of
households - that are part of a household survey series which was initiated by the Living Standards
Measurement Survey (LSMS) and which will be continued through the:
• Household Budget Survey (HBS);
• Labour Force Survey (LFS); and
• potentially by further rounds of this panel survey
BiH is experiencing rapid change, following recovery from the war, in accelerating transition to a market
economy and in the acceptance of a pro poor basis for medium term planning. The implications of these
developments for social policy can only be properly understood if the impacts on individuals, families
and households of macro changes within the economy are tracked over time. This requires an analysis of

4
the dynamics of events such as moves between jobs, geographic mobility, changing household
composition, income shifts, changes in health status, and how these interact.
This has been done by following the changing behaviour and fortunes of households, families, and their
members across time. The appropriate methodology for this is a household panel study - upon which this
report is based - “Living in BiH”.
The Household Survey Panel Series (HSPS - “Living in BiH”) allows annual measurement of change
and will permit the aggregation of data for individuals across time to derive estimates of the impact of
changes in a manner that cross sectional data cannot allow.
In the context of BiH, the ability to track over time such transitions whilst:
• privatisation and economic restructuring are furthered;
• as the labour market is restructured; and
• the BiHDS is brought into implementation
will be critical for the formulation of social policy overall and of subsidiary measures to mitigate
some of the potentially damaging effects of privatisation and restructuring upon the welfare of
individuals and families.
Thus the panel survey is complementary, in supporting policy development, to the cross-sectional
household survey series.
The report provides a broad picture of the coverage of the survey “Living in BiH”, and the potential
for policy analysis using panel data.
It deliberately does not report every measure included in the panel survey but rather is intended to
give the reader an understanding of the coverage and potential of the data for analysis. It is also
deliberately largely descriptive, and is of interest to policy makers, researchers as well as a more
general audience and the international community.
The BiH panel survey is the first of its kind in any Balkan country. It provides a unique data resource
for further analysis, as well as a platform for policy monitoring, especially in the context of the
BiHDS and the need to further pro poor initiatives to further EU accession developments and more
generally in the development of evidence based policy.
5
The report covers seven main themes. These are:
• Demographic and social situation in BiH;
• Housing, migration and geographical mobility;
• Employment and unemployment;
• Income;
• Poverty dynamics;
• Health; and
• Values, opinions and quality of life.
The analysis demonstrates the difference between cross-sectional and panel data. Cross-sectional
trend data generally show little change in the aggregate percentages year on year. The impression is
that there is overall stability or gradual change. Panel data, where the same individuals are tracked
over time, typically find much more movement going on as individuals within the overall distribution
move between states. For example, people:
• entering and leaving employment;
• people and families entering and leaving poverty; and
• people and families with changing health status as employment and income status change.
The report therefore presents concrete results of policy significance, but is also a demonstration
vehicle for showing the different types of analysis that are possible with longitudinal data. Again, it
provides pointers - in the particular social policy context of BiH - to:
• further research, that can be built upon the platform that this report represents; and
• strong pointers for empirically and evidence based policy development.
The emphasis of analysis and data tabulation is deliberately based, at this stage, upon the entity level -
this is because of the constitutional vesting of responsibility for social policy making at entity level.
The data - publicly available are also amenable to state level analysis.
The panel survey and the supporting project is funded by the UK Department for International
Development (DFID). The fieldwork and data processing are carried out by the SIs (The Agency for
Statistics of BiH (BHAS); the Federal Institute of Statistics (FOS) and the Republika Srpska Institute
of Statistics (RSIS) within BiH in partnership with Birks Sinclair & Associates Ltd. (Birks Sinclair),

6
the Independent Bureau for Humanitarian Issues (IBHI) and the Institute of Social and Economic
Research (ISER). The partnerships implementing the project extend to the data using ministries of
both entities and the state level Cabinet of Ministers in terms of policy development.
Throughout its development and implementation this work has been guided by the two entity level
Data User Groups (DUGs - see Appendix B) and latterly by the state level BiH DUG.
This draft is subject to comments and contributions from the members of all three DUGs, after which
a more generally available version will be published.
This report is based on panel data from Waves (years) 1, 2 and 3 of the “Living in BiH” panel survey.
The panel survey sample is made up of over 3000 households drawn from the LSMS conducted by the
World Bank in co-operation with the SIs in 2001. Approximately half the households interviewed on
the LSMS were selected and carried forward into the panel survey. These households were re-
interviewed for second time in 2002 and again in September 2003. We now have a panel of three
years of interviews where the same individuals are re-interviewed at consecutive time points. (See
Appendix A for a full description of the panel design, sample selection and fieldwork procedures.)
Wave 3 response outcomes
The panel survey has enjoyed high response rates throughout the three years of data collection with
the wave 3 response rates being slightly higher than those achieved at wave 2. At wave 3, 1650
households in the FBiH and 1300 households in the RS were issued for interview. Since there may be
new households created from split-off movers it is possible for the number of households to increase
during fieldwork. A similar number of new households were formed in each entity; 62 in the FBiH
and 63 in the RS. This means that 3073 households were identified during fieldwork. Of these, 3003
were eligible for interview, 70 households having either moved out of BiH, institutionalised or
deceased (34 in the RS and 36 in the FBiH).
As Table 1.1 shows, interviews were achieved in 96% of eligible households, an extremely high
response rate by international standards for a survey of this type.
Table 1.1 Wave 3 Response outcomes for eligible households by entity
Entity RS % FBiH % Total BiH %
Interviewed household 98.3 (1305) 93.9 (1573) 95.8 (2878) Untraced mover 0.8 (11) 1.0 (16) 0.9 (27) Non-interviewed 0.8 (11) 5.2 (87) 3.3 (98) Total N 1327 1676 3003
7
In total, 8712 individuals (including children) were enumerated within the sample households (4796
in the FBiH and 3916 in the RS). Within in the 3003 eligible households, 7781 individuals aged 15 or
over were eligible for interview with 7346 (94.4%) being successfully interviewed. Within co-
operating households (where there was at least one interview) the interview rate was higher (98.8%).
Table 1.2 Wave 3 Response outcomes for eligible individuals by entity
Entity RS % FBiH % Total BiH %
Interviewed 97.6 (3388) 90.2 (3958) 93.5 (7346) Non-interviewed 2.4 (82) 9.8 (429) 6.5 (511) Total N 3470 4387 7857 A very important measure in longitudinal surveys is the annual individual re-interview rate. This is
because a high attrition rate, where large numbers of respondents drop out of the survey over time,
can call into question the quality of the data collected. In BiH the individual re-interview rates have
been high for the survey. The individual re-interview rate is the proportion of people who gave an
interview at time t-1 who also give an interview at t. Of those who gave a full interview at wave 2,
6653 also gave a full interview at wave 3. This represents a re-interview rate of 97.9% - which is
extremely high by international standards. When we look at those respondents who have been
interviewed at all three years of the survey there are 6409 cases which are available for longitudinal
analysis, 2881 in the RS and 3528 in the FBiH. This represents 82.8% of the responding wave 1
sample, a retention rate which is again high compared to many other panels around the world1.
This report, for comment and discussion, tabulates analysis of wave 3 LiBiH Panel data, using the
longitudinal weights generated at wave 2 of the panel survey to take account of non-response and
attrition. Given the high re-interview response rates at wave 3 of the panel (of some 96 percent); the
interpretation of the wave 3 findings and results is not affected. Some of the numbers of cases in the
tables may vary slightly when the wave 3 weights are applied, but differences are very small. .
The LiBiH wave 3 data bases for the state and the two entities, including weights for differential
response and attrition between waves 2 and 3, are available on and can be downloaded from the SI
websites.
1 Note that all results presented throughout this report are weighted to account for sample selection probabilities
at wave 2. The numbers reported in the tables which follow are therefore the weighted sample numbers. The
tables report cases with valid responses only.
8
2. Demographic and social situation in BiH
Key Findings
At all three years of the survey, 2001 - 2003, the distributions of age, sex and marital status
are similar.
.
Those living in the RS are more likely than those living in the FBiH to be self-employed, be
doing seasonal work, have fixed term contracts or to be working in a family business.
Aggregate levels of unemployment in BiH have decreased over the three years by some three
percent, a change which seems to be mainly due to an increase in self-employment and a
slight reduction in the percentage describing themselves as a ‘housewife’. This suggests
more women with families may be starting to enter the labour force.
Around 25% of people in BiH have no educational qualifications and only 3% have university
level qualifications.
5% of respondents in the RS and 7% of those in FBiH had gained a qualification between
2002 and 2003. These were primarily younger people and students.
The trend over the three years suggests an increase in home ownership and, to a lesser extent,
rented accommodation. The percentage of people in temporary accommodation has
decreased and tenancy right holders have virtually disappeared over this period.
Households in the RS are more likely than those in FBiH to have two or more people in
employment in the household.
30% of households in BiH had no-one in paid employment at the time of the survey in 2003.
Households in FBiH are generally better off in terms of mean household income from all
sources. This seems to be mainly due to higher levels of income from employment in FBiH.

9
This section gives some descriptive tables across a variety of key demographic and social variables
for the three years of the survey. A more detailed examination of specific areas is contained in the
sections which follow.
Table 2.1 shows the distribution across a number of key demographic variables for the interviewed
sample. The year on year trends within each entity are fairly stable with both entities having similar
distributions of age, sex and current marital status at all waves.
Table 2.1 Key demographic variables Waves 1 to 3 (all interviewed adults including new entrants at
Waves 2 and 3)
Entity RS % FBiH % Total BiH % W1 W2 W3 W1 W2 W3 W1 W2 W3
Sex Male 49.9 50.3 49.2 47.2 47.2 47.0 48.4 48.6 48.0
Female 50.1 49.7 50.8 52.8 52.8 53.0 51.6 51.4 52.0 Age
15 - 24 18.2 18.3 17.6 19.8 19.7 19.7 19.1 19.1 18.7 25 - 34 15.4 15.4 15.8 16.4 16.1 16.0 16.0 15.8 15.9 35 - 44 16.6 15.8 15.3 18.8 17.8 17.8 17.8 16.9 16.6 45 - 54 18.5 18.3 18.9 16.3 16.5 16.5 17.3 17.3 17.6 55 - 64 14.1 14.2 13.7 13.4 13.2 13.4 13.7 13.7 13.5
65 and over 17.1 18.1 18.7 15.5 16.6 16.7 16.2 17.3 17.6 Marital Status
Single 30.2 28.2 27.8 30.1 27.8 27.3 30.1 28.0 27.5 Married 57.4 58.4 57.9 57.3 58.7 58.6 57.4 58.5 58.3
Widow/er 10.6 11.4 12.3 11.2 11.6 11.6 10.9 11.5 11.9 Divorced/separated 1.8 2.0 1.9 1.4 1.9 2.3 1.6 1.9 2.1
Employment status* Employee 26.5 25.1 25.9 22.9 23.9 24.6 24.5 24.4 25.2
Self-employed 4.7 7.1 7.0 2.4 3.6 4.3 3.4 5.2 5.6 Fixed term/seasonal worker 1.8 2.1 1.8 1.3 1.5 1.6 1.5 1.8 1.7
In family business 2.5 3.4 2.4 0.8 1.6 1.6 1.6 2.4 2.0 Housewife 18.4 18.2 17.5 23.7 20.9 20.6 21.4 19.7 19.2
Student 8.2 8.4 8.3 10.1 9.7 10.8 9.3 9.1 9.7 Pensioner 14.6 13.0 15.8 17.0 17.4 17.3 15.9 15.4 17.3
Unemployed 19.8 18.2 17.6 19.4 17.3 16.6 19.6 17.7 16.6 Military service 0.2 0.1 0.2 0.3 0.3 0.2 0.3 0.2 0.2 Unable to work 3.3 4.3 3.5 2.1 3.4 2.5 2.7 3.8 2.5
Note that employment status is the subjective report by the individual i.e. what 'best' describes their current status. Includes all sample members. When we look at current employment status, those in the RS report consistently higher levels of self-
employment, fixed term contract or seasonal work and also working in the family business at all three
years (2001 to 2003) than those living in FBiH. However, the trend suggests that levels of self-
employment are increasing in the FBiH, with 4.3% being self-employed at wave 3 compared to 2.4%
at wave 1. This does not appear to be due to any decrease in the percentage of employees but to
moves into self-employment from other non-employed categories. Both entities have a decreasing
proportion of respondents reporting themselves as a 'housewife' and the trend suggests that the level

10
of unemployment has also decreased over the three years by around 3%. This not accounted for by
those 'unable to work' as this remains fairly similar over the three years showing no clear trend. Both
entities maintain similar percentages of students and pensioners across the three years.
Table 2.2 gives the level of qualifications held by those interviewed at each of the three waves.
Overall, the highest level of qualification remains fairly stable over the period. In the FBiH the trend
suggests a slight decrease in the proportion with no qualifications at all or primary level only and a
slight increase in the percentage with secondary, junior college or university level qualifications. At
wave 1, 48.5% of respondents in FBiH had secondary level or higher qualifications and at wave 3 just
over half 51.2% had secondary level or higher, an increase of 2.7%. Most of this trend seems to be
due to an increase in the percentage with secondary level qualifications, rather than junior college or
university level qualifications. In the RS, 4.9% of respondents had gained a qualification of some
kind in the last year and in the FBiH 6.7% had done so. Most of those gaining qualifications were
students and those aged 15 to 24 years, presumably through completing or partially completing
educational courses they were doing over the period.
Table 2.2 Highest educational qualification (all interviewed)
Entity RS % FBiH % Total BiH % W1 W2 W3 W1 W2 W3 W1 W2 W3
No qualifications 23.8 22.9 26.1 26.1 25.3 23.0 25.1 24.3 24.4 Primary school certificate 27.7 27.8 26.0 25.4 25.1 25.8 26.4 26.3 25.9
Secondary school certificate 43.0 43.5 42.2 42.3 43.2 44.6 42.6 43.3 43.5 Junior College 3.0 3.1 2.9 2.9 2.9 3.0 2.9 3.0 2.9
Undergraduate diploma/higher degree
2.6 2.7 2.8 3.3 3.5 3.6 3.0 3.1 3.3
Total N 3501 3501 3069 4635 4637 3722 8136 8138 6791 Table 2.3 shows the legal status of dwellings at each of the three years of the survey. The overall
trend suggests quite a marked increase in ownership or co-ownership of property over this period. At
wave 1, 70.1% of households owned their dwelling but by wave 3, 81.1% were owners, an increase of
over 10%. The levels of home ownership in the RS are consistently lower over the three years than in
the FBiH but the increase in ownership is greater in the RS than the FBiH over the three years. In the
RS, home ownership has increased by 15.3% compared to the FBiH which had an increase of 7.7%.
Temporary accommodation was the second largest type of tenancy arrangement in both entities at
waves 1 and 2 but over the three years the trend is downwards. By wave 3 the percentage in
temporary accommodation for BiH as a whole had fallen to 4.9% from 13.8% at wave 1 and 8.1% at
wave 2. This trend can be seen in both entities with 7.2% of households being in temporary
accommodation at wave 3 in the RS and 3.1% in the FBiH. The RS has had a greater percentage fall

11
in temporary accommodation, down 8.9% over the three years with the FBiH levels falling by 6.5%.
In contrast, the trend in the rented sector seems to have seen an increase over the three years with
4.4% being in rented accommodation at wave 3 compared to just 1.9% at wave 1. The increases in
home ownership and in rented accommodation may signal a gradual shift towards households having
more permanent housing arrangements as the level of temporary accommodation decreases. By wave
3 just 1.5% of households were in illegal occupation of a property or in emergency accommodation of
some kind. The proportion of tenancy right holders has almost completely disappeared over the three
year period as the right to buy policy has encouraged these households to purchase the dwelling. Table 2.3 Legal status of dwelling, Waves 1 to 3.
Entity RS % FBiH % Total BiH % W1 W2 W3 W1 W2 W3 W1 W2 W3
Owned/ co-owned outright 62.1 69.6 77.4 76.4 79.9 84.1 70.1 75.2 81.1 Under privatisation 2.4 2.5 1.9 4.0 1.8 1.0 3.3 2.2 1.4
Tenancy right holder 7.8 1.8 0.7 1.2 1.1 0.5 4.1 1.5 0.6 Rented 2.5 6.1 5.9 1.5 2.6 3.1 1.9 4.2 4.4
Temporary accommodation 19.1 11.6 7.2 9.6 5.2 3.1 13.8 8.1 4.9 Free from family/friends 3.4 5.0 4.9 5.2 7.4 6.2 4.4 6.3 5.6
Illegal occupation 0.9 1.6 0.6 1.0 1.3 0.6 1.0 1.4 0.6 Emergency lodging/refugee
centre 1.1 0.8 0.9 0.6 0.4 0.9 0.8 0.6 0.9
Other 0.7 0.8 0.6 0.4 0.3 0.4 0.9 0.5 0.5 Total N 1318 1299 1153 1681 1580 1439 2999 2879 2592
For BiH as a whole the mean number of people, including children under 16, living in a household at
wave 3 was 3.29, only slightly smaller than the mean at wave 2 of 3.33 people. The mean household
size is similar in both entities and the distribution of household size does not differ markedly. Table
2.4 gives the number of people, adults and children per household at waves 2 and 3. Table 2.4 Household size - Number of people, adults and children aged under 15 in enumerated
households Waves 2 and 3
Entity RS % FBiH % Total BiH %
W2 W3 W2 W3 W2 W3 Number people
One 15.1 16.7 14.2 14.0 14.6 15.1 Two 20.4 19.9 22.3 23.4 21.5 21.9
Three 19.9 20.9 17.6 17.1 18.6 18.8 Four 22.8 21.3 24.4 24.2 23.7 22.9 Five 12.7 12.4 11.4 11.3 11.9 11.7
Six or more 8.9 8.9 10.1 10.0 9.7 9.6 Mean (Std. Dev) 3.31
(1.678) 3.24
(1.667) 3.34
(1.693) 3.33
(1.712) 3.33
(1.686) 3.29
(1.693) Total N 1335 1109 1715 1439 3050 2548

12
Number aged 15 or over One 15.8 17.5 15.5 15.3 15.6 16.3 Two 29.9 29.7 36.9 37.0 33.8 33.8
Three 24.8 24.3 20.9 20.7 22.6 22.3 Four 19.3 18.8 17.7 18.2 18.4 18.5 Five 7.8 7.7 5.9 6.0 6.7 6.7
Six or more 2.3 2.0 3.0 2.7 2.8 2.5 Mean (Std. Dev) 2.82
(1.314) 2.76
(1.285) 2.73
(1.340) 2.73
(1.329) 2.77
(1.329) 2.74
(1.310) Total N 1334 1109 1715 1439 3049 2547
Number aged under 15 None 70.0 70.5 63.2 63.7 66.2 66.7
One 15.0 14.7 17.5 17.2 16.4 16.1 Two 11.2 11.3 15.2 14.9 13.4 13.3
Three or more 3.7 3.6 4.2 4.2 3.9 4.0 Mean (Std. Dev) 0.49
(0.853) 0.48
(0.853) 0.61
(0.916) 0.60
(0.905) 0.58
(0.891) 0.55
(0.884) Total N 1335 1109 1715 1439 3050 2548
Table 2.5 shows the number of persons employed in households at wave 3 by entity. In terms of
numbers within each household who were in paid employment at wave 3 for BiH as a whole, there is
little difference from wave 2 in the proportion of households where there is no-one in employment.
The pattern is not the same in each entity however with the RS showing a slight increase in the
proportion of households with no-one in employment and the FBiH a decrease. As at wave 2, the RS
were more likely than the FBiH to have two or more people in the household in employment; 23.1%
in the RS compared to 17.8% in FBiH.
Where the head of household was aged under 65 years, under a third of households (30.8%) had no-
one in paid employment, a decrease from wave 2 where 33.6% of households had no-one in paid
employment. The decrease in the proportion of households with no-one in employment over the two
years is smaller in the RS than in the FBiH; 1.5% in the RS compared to 4.8% in FBiH. Again,
working age households in RS were more likely than those in the FBiH to have two or more working
people in the household; 28.6% in the RS and 13.2% in the FBiH.
Table 2.5: Numbers of employed in household.
Entity RS % FBiH % Total BiH %
W2 W3 W2 W3 W2 W3 Number people employed
None 40.5 42.2 47.5 45.6 44.5 44.1 One 37.1 34.7 35.5 36.5 36.2 35.7 Two 18.3 18.7 14.4 15.3 16.1 16.8
Three or more 4.1 4.4 2.6 2.5 3.2 3.4 Mean (Std. Dev) 0.87
(0.882) 0.86
(0.894) 0.72
(0.813) 0.75
(0.818) 0.79
(0.847) 0.80
(0.854) Total N 1335 1166 1714 1440 3049 2606
13
Number people employed (hoh under 65)
None 28.8 27.0 37.3 33.5 33.6 30.8 One 42.8 41.7 42.0 43.3 42.3 42.7 Two 23.1 25.1 17.3 19.7 19.8 22.0
Three or more 5.3 6.1 3.4 3.5 4.2 4.6 Mean (Std. Dev) 1.06
(0.887) 1.11
(0.900) 0.87
(0.828) 0.93
(0.829) 0.95
(0.859) 1.01
(0.864) Total N 969 733 1286 1015 2256 1748
The mean household income from employment and non-employment sources is given in Table 2.6
below. On average, household income from employment and non-employment sources is higher in
the FBiH than in the RS with the BiH mean household income from all sources being 525 KM per
month. Households with income from employment are better off than those without employment
income in both entities. In both entities, we see an increase in the mean income from employment
and a decrease in income from non-employment sources. The overall effect on total mean income
from all sources is not large, however, as the increase in income from employment is balanced out by
the fall in non-employment income. Table 2.6 Mean household usual monthly income from employment and non-employment sources -
Waves 2 and 3
Entity Source of income RS
(KM) FBiH (KM)
Total BiH (KM)
W2 W3 W2 W3 W2 W3 Employment* 479.72
(449.20) 691
513.61 (419.04)
546
660.96 (528.37)
886
744.39 (637.98)
787
581.50 (503.18)
1577
649.89 (570.04)
1332 Non-employment** 219.53
(321.75) 670
173.17 (178.23)
569
326.19 (307.73)
929
249.29 (175.24)
796
281.52 (319.09)
1599
217.55 (180.38)
1365 Gifts, services in kind from
within BiH 45.75
(68.51) 198
48.98 (64.84)
176
101.28 (183.44)
290
61.86 (91.95)
267
78.76 (150.38)
487
56.74 (82.41)
442 Remittances from abroad 74.59
(102.94) 256
78.61 (103.44)
190
89.00 (144.60)
279
121.44 (200.32)
245
82.11 (126.50)
535
102.75 (166.38)
435 Gifts, services in kind from
charities, humanitarian organisations
19.37 (38.65)
33
15.48 (15.95)
9
33.18 (54.82)
37
55.33 (178.22)
20
26.73 (48.12)
70
42.52 (147.05)
29 Total employment and non-
employment 435.58
(467.89) 1060
416.27 (398.38)
910
591.82 (538.36)
1497
596.18 (578.99)
1315
527.04 (516.00)
2557
522.60 (520.34)
2225 Total all sources 423.84
(452.04) 1211
409.73 (394.75)
982
590.86 (549.56)
1601
608.97 (583.70)
1365
518.94 (516.44)
2813
525.60 (522.41)
2347 The number in (brackets) is the standard deviation and the N is given in italics. * Employment income includes income from main plus any other jobs. ** Non-employment income includes payments received from veterans benefit, survivors pension, old age pension, disability pension, Civil Victims of War program, permanence allowance, temporary allowance, carers allowance, child benefits.
14
Households in both entities receive income or income in kind from support from gifts, services in
kind, remittances from abroad, charities and humanitarian organisations but the numbers receiving
income from these sources is relatively small. Income from employment and non-employment
sources therefore remain the main sources of income for most households. Remittances coming from
a family member abroad, while no doubt significant for some households, are received by around one
fifth of households in the sample. The distribution of income is looked at in detail in sections 5 and 6.

15
3. Housing, migration and geographical mobility Key Findings
65% of households in BiH reported having one or more problems with their current housing
conditions.
14% of households in BiH do not have running water in their accommodation and 18%
percent have no sewerage.
The percentage of households with access to the internet doubled between 2002 and 2003 and
mobile phone ownership also doubled over this period.
Mean housing costs per month increased in the FBiH between 2002 - 2003 but remained the
same in the RS.
Some suggestion that as mean incomes rise in the FBiH the cost of living is also rising, with
expenditure on food and essential items increasing in the FBiH between 2001 - 2003.
A non-monetary hardship scale suggests that households in the RS are generally worse off
than those in the FBiH.
The one third of households who have four or more problems with the condition of their
accommodation have the lowest mean incomes and score worst on the hardship scale so
suffer from multiple sources of deprivation.
8% of people in BiH moved house between 2002 and 2003. Of those who said in 2002 that
they expected to move in the coming year, only half had done so by the time of the interview in
2003.
Changes in housing tenure between 2001 and 2003 suggest that households in BiH are
moving towards more permanent types of tenure status as the levels of temporary and illegal
occupations fall.
16
This section looks at housing conditions, access to facilities, some non-monetary hardship indicators,
changes in housing tenure and geographical mobility over the years of the survey.
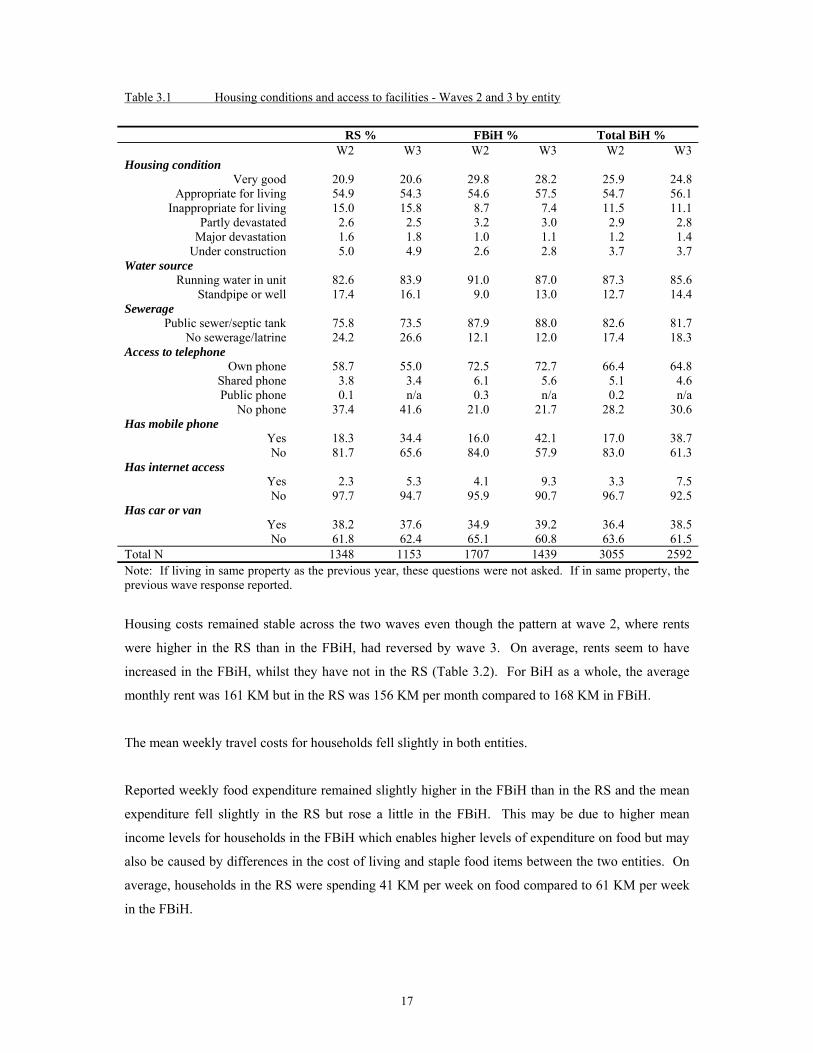
Table 3.1 gives details of housing conditions and access to facilities in the RS and FBiH at waves 2
and 3. Overall, housing conditions, access to water and sewerage seem similar at both years. Around
15% of households reported living in inappropriate or devastated conditions at both years, with a
higher proportion of RS households reporting inappropriate conditions than in the FBiH. In total 85%
of households in BiH had running water but 16.1% of RS households and 13% of FBiH households
relied on getting water from a standpipe or well. Under three quarters of households in the RS had
sewerage from either the public system or a septic tank at wave 3 with the remainder having no
sewerage or a latrine only. In the FBiH 12% of households had no sewerage at each year.
Access to a telephone was higher for households in the FBiH (78.3%) than the RS (58.4%). Having a
mobile phone increased markedly over the one year between interviews in both entities even though
the increase was larger in the FBiH than in the RS. At wave 2 just 16% of households in the FBiH
reported having a mobile phone compared to 42.1% at wave 3, more than doubling the number of
households with mobiles. Similarly in the RS, 34.4% had a mobile phone at wave 3 compared to
18.3% at wave 2.
The penetration of the internet also increased over the period with 7.5% of households having access
to the internet from home at wave 3 compared to 3.3% at wave 2. This trend can be seen in both
entities even though more households in the FBiH (9.3%) have access to the internet than in the RS
(5.3%).
The rate of increase in these relatively new technologies is rapid, doubling the proportion of
households with internet access over the one year period between interviews. While you would
expect this increase to continue over the next few years, there may be a point where the potential
market for these new technologies is saturated. In the UK for example, the penetration of access to
the internet from home has now reached around 40% of households from a base of only 4% in the mid
1990’s. So the data suggest that BiH has started the process of catching-up with other countries in
Europe in this regard.
Levels of car ownership have remained fairly stable, even though the proportion of households in
FBiH who have access to a car or van increased to just under 40% across the period 2002-2003.
17
Table 3.1 Housing conditions and access to facilities - Waves 2 and 3 by entity
RS % FBiH % Total BiH % W2 W3 W2 W3 W2 W3
Housing condition Very good 20.9 20.6 29.8 28.2 25.9 24.8
Appropriate for living 54.9 54.3 54.6 57.5 54.7 56.1 Inappropriate for living 15.0 15.8 8.7 7.4 11.5 11.1
Partly devastated 2.6 2.5 3.2 3.0 2.9 2.8 Major devastation 1.6 1.8 1.0 1.1 1.2 1.4
Under construction 5.0 4.9 2.6 2.8 3.7 3.7 Water source
Running water in unit 82.6 83.9 91.0 87.0 87.3 85.6 Standpipe or well 17.4 16.1 9.0 13.0 12.7 14.4
Sewerage Public sewer/septic tank 75.8 73.5 87.9 88.0 82.6 81.7
No sewerage/latrine 24.2 26.6 12.1 12.0 17.4 18.3 Access to telephone
Own phone 58.7 55.0 72.5 72.7 66.4 64.8 Shared phone 3.8 3.4 6.1 5.6 5.1 4.6 Public phone 0.1 n/a 0.3 n/a 0.2 n/a
No phone 37.4 41.6 21.0 21.7 28.2 30.6 Has mobile phone
Yes 18.3 34.4 16.0 42.1 17.0 38.7 No 81.7 65.6 84.0 57.9 83.0 61.3
Has internet access Yes 2.3 5.3 4.1 9.3 3.3 7.5 No 97.7 94.7 95.9 90.7 96.7 92.5
Has car or van Yes 38.2 37.6 34.9 39.2 36.4 38.5 No 61.8 62.4 65.1 60.8 63.6 61.5
Total N 1348 1153 1707 1439 3055 2592 Note: If living in same property as the previous year, these questions were not asked. If in same property, the previous wave response reported.
Housing costs remained stable across the two waves even though the pattern at wave 2, where rents
were higher in the RS than in the FBiH, had reversed by wave 3. On average, rents seem to have
increased in the FBiH, whilst they have not in the RS (Table 3.2). For BiH as a whole, the average
monthly rent was 161 KM but in the RS was 156 KM per month compared to 168 KM in FBiH.
The mean weekly travel costs for households fell slightly in both entities.
Reported weekly food expenditure remained slightly higher in the FBiH than in the RS and the mean
expenditure fell slightly in the RS but rose a little in the FBiH. This may be due to higher mean
income levels for households in the FBiH which enables higher levels of expenditure on food but may
also be caused by differences in the cost of living and staple food items between the two entities. On
average, households in the RS were spending 41 KM per week on food compared to 61 KM per week
in the FBiH.

18
The overall picture is that housing, travel and food costs are fairly similar for households in both
entities even though there is some suggestion that the cost of living for basic items such as food and
rent may be increasing at a faster rate in the FBiH than in the RS. Further data from the coming years
would be needed to see if this trend continues. One scenario may be a growing gap between mean
household income levels and the cost of living within each entity, something which may make
mobility within BiH more difficult for some types of people or households in the longer term.
These types of regional and state differences have policy implications for the basic infrastructure of
the state and the development of policies for employment, housing, transport and health and education
services.
Table 3.2 Mean monthly rent, weekly travel expenses and weekly food expenditure - Waves 2 and 3
Entity RS FBiH Total BiH
KM KM KM W2 W3 W2 W3 W2 W3
Mean monthly rent* 153.94 101
155.99 70
135.98 60
167.84 56
147.25 161
161.26 126
Mean weekly travel costs 27.80 937
25.39 803
28.80 1187
26.37 1136
28.36 2124
25.96 1939
Mean weekly food expenditure 47.12
1278
41.14
1129
55.67
1533
60.81
1404
51.78
2811
52.05
2533 * Excludes those living in rent free accommodation Hardship scale
Table 3.3 shows the results of a non-monetary hardship scale. The question was asked “If you wanted
to, could you afford to…” and then six activities including:
a) Have friends or family for a drink or meal at least once a month
b) Pay for a weeks annual holiday away from home
c) Replace worn out furniture
d) Buy new, rather than second hand clothes
e) Eat meat, chicken or fish at least every second day
f) Keep your house adequately warm
The responses were summed to give a scale ranging from zero (can afford to do none of the activities)
to six (can afford to do all of the activities). The proportion of households that could afford to do none
of the activities in the RS was twice that of the FBiH, whilst the proportion in the FBiH who could
afford to do five or six of the activities was twice that of the RS. The proportions who could afford
between one and four of the activities was similar in both entities. The mean number of activities
which could be afforded in the FBiH was 3.0, compared to 2.4 in the RS.

19
Table 3.3 Hardship scale
RS
% FBiH
% Total BiH
% Can afford to do:
None 22.5 11.2 16.2 1-2 28.2 28.9 28.6 3-4 37.8 37.8 37.8 5-6 11.5 22.1 17.4
N households 1152 1438 2590 Whether or not households can afford to do these activities depends on household income and other
characteristics of the household. When we look at housing tenure, except for those living rent free,
households in the FBiH are able, on average, to afford to have or do more of the activities than
households in the RS (Table 3.4). Those who own all or part of their house are able to afford to do
more of these activities than those who rent, something which applies in both entities. Households in
temporary accommodation in the RS are most likely to be unable to afford any of the activities and
least likely to be able to afford 5-6 of these. Table 3.4 Hardship scale by housing tenure and entity Housing Tenure
Own Rent Temporary occupant
Rent-free
RS %
FBiH %
RS %
FBiH%
RS %
FBiH %
RS %
FBiH %
None 21.2 9.6 21.9 15.4 41.0 15.6 14.3 22.7 1-2 27.2 27.9 37.0 36.5 31.3 24.4 28.6 34.1 3-4 39.1 39.8 27.4 21.2 25.3 28.9 48.2 30.7 5-6 12.5 22.7 13.7 26.9 2.4 31.1 8.9 12.5
Mean 2.51 3.09 2.26 2.73 1.43 3.20 2.60 2.25 N 914 1223 73 52 83 45 56 88
The numbers employed in the household is also associated with the ability to afford to do these
activities (Table 3.5). As the number of persons employed in the household increases, so does the
proportion able to afford three or more of the listed activities while the proportion of households who
cannot afford to do any of these falls. Despite this relationship holding for both entities, households
in the RS are still less well-off in terms of this scale than households in the FBiH, regardless of the
number employed. In households where three or more people are in employment, over 30% of those
in the RS could afford two or fewer activities compared to just 5% of households with three or more
people in employment in the FBiH.

20
Table 3.5 Hardship scale by number of employed persons in household and entity Number of employed people in household
None One Two Three or more RS
% FBiH
% RS %
FBiH %
RS %
FBiH %
RS %
FBiH %
None 29.3 18.9 20.1 6.3 11.5 2.3 20.4 0.0 1-2 33.7 42.4 28.6 21.7 19.7 9.0 10.2 5.4 3-4 32.2 28.5 36.8 46.3 50.5 42.1 46.9 56.8 5-6 4.8 10.1 14.4 25.7 18.3 46.6 22.4 37.8
Mean 1.89 2.20 2.53 3.38 3.17 4.24 3.21 4.32 N 481 655 402 525 218 221 49 37
As could be expected, households with lower incomes scored worst on the hardship scale. Table 3.6
shows the hardship scale by income quartile and entity. Households in the lowest quartile of income
for the whole of BiH were less likely to be able to afford to have or do any of the activities asked
about.
In the lowest quartile of income just over a third (34.5%) of RS households and under a quarter
(24.8%) of FBiH households could afford none of the activities. In the highest income quartile very
few households could afford none (4.3% in the RS and 1.3% in the FBiH). Within each quartile those
in the FBiH seem more affluent and able to do more - on average - than those in the RS.
Table 3.6 Hardship scale by income quartile and entity Income quartile
Lowest Second Third Highest RS
% FBiH
% RS %
FBiH %
RS %
FBiH %
RS %
FBiH %
None 34.5 24.8 23.6 16.2 15.5 10.3 4.3 1.3 1-2 29.3 41.0 37.0 39.1 27.0 30.8 14.1 13.2 3-4 30.8 20.7 34.2 34.0 44.2 37.5 48.9 49.1 5-6 5.4 13.5 5.3 10.6 13.3 20.9 32.6 36.3
Mean 1.82 2.09 2.05 2.35 2.75 2.97 3.77 3.97 N 406 222 284 376 278 373 184 468
Respondents were also asked whether they had any difficulties keeping up with housing payments
over the past twelve months. Nearly all said that they had not had any difficulties: 95.8% in the RS
and 94.6% in the FBiH. Of those who had found it difficult over the past year, under half had to
borrow money (44.9% in the RS and 48.1% in the FBiH). Most of those who were finding it difficult
had to cut back on other household spending in order to make payments (91.8% in the RS and 94.9%
in the FBiH).

21
Housing conditions
The survey asked about housing conditions and whether the household had any problems with the
accommodation (Fig 3.1). The most common problem with accommodation was lack of adequate
heating facilities, this was the highest reported problem in both entities but it was particularly
common in the FBiH. Shortage of space, war damage, too dark, noise and vandalism or crime were
also more common in the FBiH than in the RS. Households in the RS were more likely than those in
the FBiH to mention rot in window frames or doors, damp and leaky roof.
Figure 3.1 Proportion of households with problems with their accommodation
0
5
10
15
20
25
30
35
40
Lack
of ad
equa
te he
ating
Rot in fra
mes
Shorta
ge of s
pace
Damp
War dam
age
Leak
y roo
f
Too da
rk
Other s
treet
noise
Polluti
on
Vanda
lism or c
rime
Noise fro
m neigh
bours
%RSFBIH
A scale of housing conditions was computed ranging from zero, where no problems were reported, up
to eleven where there was a problem in each of the areas asked about (Table 3.7). Just over a third of
all households (34.9%) reported none of the problems whilst less than one percent (0.6%) reported
seven or more problems. The mean number of problems reported across BiH was 1.66. Households
in the FBiH reported slightly more problems, on average, than the RS with 1.77 per household
compared to 1.52.

22
Table 3.7 Housing conditions scale
RS % FBiH % Total BiH % Number of problems:
None 41.3 29.7 34.9 1 19.1 21.0 20.2 2 13.7 22.8 18.8 3 10.7 10.5 10.6
4+ 15.1 15.9 15.5 Mean number 1.52 1.77 1.66
N 1166 1440 2606
Those in rented or temporary accommodation appear to have more problems, on average, with their
accommodation than those who own their house (Table 3.8). In all tenure groups, those in the FBiH
report having more problems with their accommodation than those in the RS.
However, as we saw in Figure 3.1 above, the type of problems experienced by households in the RS
are more likely to be with the basic structure of the accommodation in terms of leaking roofs, rotting
doors and windows and damp, rather than other aspects of either the house itself or problems with the
immediate surrounding neighbourhood.
Table 3.8 Accommodation problems by housing tenure and entity Housing Tenure
Own Rent Temporary occupant
Rent-free
RS %
FBiH %
RS %
FBiH%
RS %
FBiH %
RS %
FBiH %
None 44.8 31.3 27.6 19.2 16.9 20.5 41.1 18.0 1 19.4 21.2 18.4 23.1 19.3 18.2 23.2 22.5 2 12.8 23.3 21.1 26.9 15.7 13.6 14.3 24.7 3 10.3 10.7 9.2 5.8 14.5 9.1 8.9 12.4
4+ 12.7 13.6 23.7 25.0 33.7 38.6 12.5 22.5 Mean 1.36 1.66 2.10 2.35 2.74 2.86 1.50 2.23
N 913 1225 76 52 83 44 56 89 Table 3.9 looks at the relationship between having problems with the accommodation and the
hardship scale, that is the ability to afford to do the activities mentioned earlier. As might be
expected, there is a clear association between the two with those who are able to afford more of the
activities in the hardship scale being less likely to have problems with their accommodation. Of those
who could afford none of the activities in the hardship scale, 27.5% in the RS and 37.3% in the FBiH
had four or more problems with their accommodation.
In contrast, of those who could afford five or six of the activities in the hardship scale, just 3% of
households in the RS and 9.1% in the FBiH reported having four or more problems with their
accommodation. This relationship holds for both entities even though households in the RS who can

23
afford to do five or six of the activities are more likely than those in the same situation in the FBiH to
have no problems with their accommodation (62.4% compared to 43.7%). Whilst just over three-
fifths of those in the RS who can afford five or six of the activities have no problems with their
accommodation, only one-fifth (18.2%) of those who can afford none of the activities can say the
same about their house. And in the FBiH only 14.3% of those who can afford none of the activities
also report having no problems with their accommodation. This suggests that there are a proportion
of households in BiH who are less able to afford to do various activities that might be considered part
of normal daily living and who also suffer from poor housing conditions. As the households who
score badly on the hardship scale also tend to have lower household incomes (Table 3.6) this suggests
there are some households suffering from multiple sources of deprivation.
Table 3.9 Problems with accommodation and hardship scale
Hardship scale Afford none One to two Three to four Five to six
Accommodation problems
RS %
FBiH %
RS %
FBiH %
RS %
FBiH %
RS %
FBiH %
No problems 18.2 14.3 34.6 20.3 52.0 33.0 62.4 43.7 One 17.4 19.9 16.0 21.7 20.9 21.8 26.3 19.5 Two 16.7 19.3 17.9 27.3 12.0 22.8 5.3 19.5
Three 20.2 9.3 12.7 12.6 6.2 10.6 3.0 8.2 Four or more 27.5 37.3 18.8 18.1 9.0 11.7 3.0 9.1
n 258 161 324 414 435 545 133 318 Geographic mobility
In total 8.3% of households had moved address between wave 1 and wave 2. Those in the RS
(10.4%) were more likely to have moved than those in the FBiH (6.6%). Table 3.10 shows some of
the characteristics of those who had moved. The characteristics of movers between waves 2 and 3 are
similar to movers between waves 1 and 2. Women in both entities were more likely to have moved
house than men as were the legally married.
Table 3.10 Characteristics of movers and non-movers between Wave 2 and Wave 3 RS
% FBiH
% Not moved Moved Not moved Moved
Male 49.4 46.9 47.3 38.3 Female 50.6 53.1 52.7 61.7
Single 27.9 27.7 28.0 25.4
Legally married 56.8 58.2 58.2 51.5 Living together 1.1 3.1 0.8 2.4
Widow/er 12.6 9.6 11.3 16.6 Divorced or separated 1.6 1.4 1.7 4.1
n 2803 292 3613 169

24
When asked whether they wanted to stay in their present neighbourhood or would prefer to move
most people said they liked living in their current neighbourhood. Just 17.3 percent of those in the RS
and 12.1 percent of those in the FBiH said that they did not like living where they were. In total about
three in ten people (30.1%) said that, if they could choose, they would prefer to move somewhere
else. This proportion was higher in the RS (34.9%) than the FBiH (26.1%). Of those who wanted to
move, two-thirds (66%) would like to move abroad with similar proportions saying they would like to
move within the same municipality (17.9%) and another municipality (16.1%) (Figure 3.2).
These preferences do not seem to have changed since wave 2, where similar views were given. Of the
one third who want to move, an overseas destination remains the main preference.
Figure 3.2: Preferred destination for those wanting to move - Wave 3.
All respondents were asked whether they expected to move in the coming year and compared to wave
2, fewer expected to move in the coming year. At wave 3, 6.2% of respondents expected to move in
the coming year compared to 11.4% at wave 2: 9% in the RS compared to 16.4% at wave 2 and 4% in
the FBiH compared to 7.1% at wave 2. Unlike the preferred destination, the main expected
destination of any move was within the same municipality. Just under one-fifth (19%) of those
expecting to move thought that they were likely to move abroad. This is a slight increase on wave 2
where 15.8% of those expecting to move in the coming year thought they would move abroad. (Fig
3.3)
At wave 2 respondents were asked the same questions on preferences and expectations of moving.
This allows us to compare people's expectations with their actual behaviour one year on. Of those
who at wave 2 said they preferred to move, 11.9% had moved address by wave 3. This compared
0
10
20
30
40
50
60
70
80
Within same municipality
To othermunicipality
Abroad
%
RS FBIH BiH Total

25
with just 4.5% of those who said that they wanted to stay where they were at wave 2. Respondents
were also asked how likely it was they would actually move in the next year. Respondents who, at
wave 2, said that they were either very likely or quite likely to move, were in fact more likely to have
moved address than those who thought it unlikely (Table 3.11). Even so, over half (54.5%) of those
who had said at wave 2 it was very likely that they would move in the coming year had not moved by
the time of the wave 3 interview. And of those who said at wave 2 that it was not very likely they
would move in the coming year, 12.6% had actually moved by the time of the wave 3 interview.
Figure 3.3: Expected destination for those wanting to move – Wave 3.
Table 3.11 Expectation of moving and behaviour at wave 3
Likelihood of moving at Wave 2
Moved between waves 2 and 3
Stayed at same place
Very likely 45.5 54.5 Quite likely 27.6 72.4
Not very likely 12.6 87.4 Not likely at all 3.3 96.7
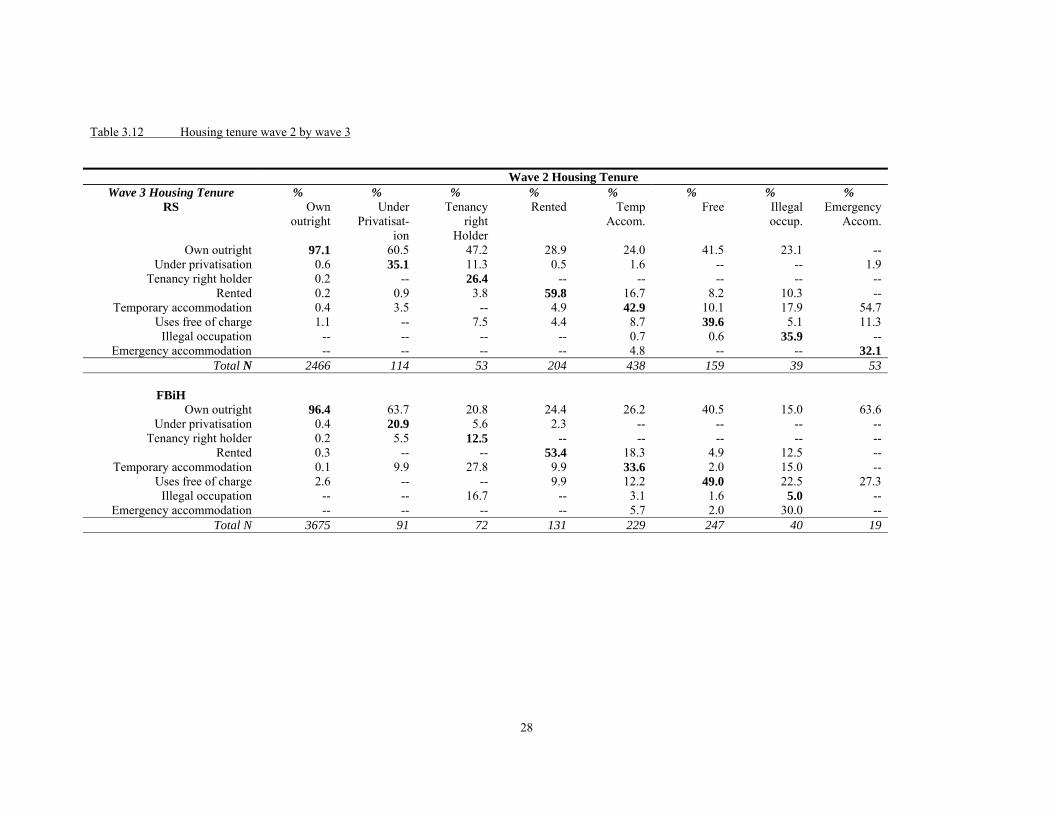
N 448 6228 Changes in housing tenure
Table 3.12 below is a cross-wave matrix of changes in housing tenure between waves 2 and 3 for
households where at least one individual from wave 2 was present at wave 3. The diagonal
highlighted in bold shows the cases where the reported housing tenure was the same at both waves.
The cases on the off-diagonal reported a change in housing tenure status, changes which are likely to
0
10
20
30
40
50
60
70
Within same municipality
To othermunicipality
Abroad
%RSFBIHBiH Total
26
be due to moving address in many cases. Note that the numbers of cases in the off-diagonal cells are
small, and so should be interpreted with caution. The categories have not been collapsed as the
differences are of substantive interest.
In the RS, we can see that 97.1% of cases were in accommodation that was owned outright at both
years and 35.1% were in accommodation under privatisation at both years. Of those who were under
privatisation at wave 2, 60.5% had shifted to the owned outright category at wave 3, none to the
tenancy right holder category, under one percent into rented accommodation and 3.5% into temporary
accommodation. A similar proportion in the FBiH (96.4%) were owned outright at both years. Those
in rented accommodation were the next most stable group in the RS with 59.8% being in rented
accommodation at both years. In the FBiH the percentage was 53.4% in rented accommodation at
both years.
It is interesting to note that in both entities the proportion who were in temporary accommodation at
both waves has fallen sharply. Of those who were in temporary accommodation at wave 1 half were
still in temporary accommodation at wave 2, suggesting that for a significant proportion of households
‘temporary’ may have been a relatively long term status. However between waves 2 and 3, 42.3% of
those in temporary accommodation at wave 2 were still in the same status at wave 3 and only one
third, 33.6% of FBIH households in this category at wave 2 were still in temporary housing at wave 3.
Table 3.13 shows the changes in housing tenure across the three years of the survey and gives a cross
wave matrix from wave 1 to wave 3. The changes over the slightly longer term show some of the
features as the year on year changes. Ownership is still the most stable category with 97.5% of RS
households and 95% of FBiH households owning their accommodation at both years. The least stable
category was tenancy right holder where just 7% of RS households and 2.3% of FBiH households
were in that category at both years. The numbers in this category are very small but in both entities
the majority had moved into ownership with some in the FBiH moving into temporary
accommodation.
Across all tenure types at wave 1, the main move is into ownership by wave 3 followed by moves into
rented accommodation. This supports the observation made earlier when looking at the trend in the
cross-sectional distributions over the three years, where the percentage of home ownership has
increased. As noted earlier, the proportion in tenancy right holder accommodation has fallen sharply
with only 7% in the RS and 2.3% in the FBiH of those with this type of tenure at wave 1 still being in
this category at wave 3. For most of these cases, they will have taken advantage of the right to buy
policy and simply purchased the property.

27
It is also interesting to note that in the RS, none of those who were in illegal occupation of property at
wave 1 were still in illegal occupation at wave 3. In the FBiH just 3.6% were in illegal occupation at
both years. Again, the numbers in this category are very small so should be interpreted with care.
However, the overall picture suggests that households in both entities have moving to more regular
and permanent types of tenure status over the three year period.
28
Table 3.12 Housing tenure wave 2 by wave 3 Wave 2 Housing Tenure
Wave 3 Housing Tenure % % % % % % % % RS Own
outright Under
Privatisat-ion
Tenancy right
Holder
Rented Temp Accom.
Free Illegal occup.
Emergency Accom.
Own outright 97.1 60.5 47.2 28.9 24.0 41.5 23.1 -- Under privatisation 0.6 35.1 11.3 0.5 1.6 -- -- 1.9
Tenancy right holder 0.2 -- 26.4 -- -- -- -- -- Rented 0.2 0.9 3.8 59.8 16.7 8.2 10.3 --
Temporary accommodation 0.4 3.5 -- 4.9 42.9 10.1 17.9 54.7 Uses free of charge 1.1 -- 7.5 4.4 8.7 39.6 5.1 11.3
Illegal occupation -- -- -- -- 0.7 0.6 35.9 -- Emergency accommodation -- -- -- -- 4.8 -- -- 32.1
Total N 2466 114 53 204 438 159 39 53
FBiH Own outright 96.4 63.7 20.8 24.4 26.2 40.5 15.0 63.6
Under privatisation 0.4 20.9 5.6 2.3 -- -- -- -- Tenancy right holder 0.2 5.5 12.5 -- -- -- -- --
Rented 0.3 -- -- 53.4 18.3 4.9 12.5 -- Temporary accommodation 0.1 9.9 27.8 9.9 33.6 2.0 15.0 --
Uses free of charge 2.6 -- -- 9.9 12.2 49.0 22.5 27.3 Illegal occupation -- -- 16.7 -- 3.1 1.6 5.0 --
Emergency accommodation -- -- -- -- 5.7 2.0 30.0 -- Total N 3675 91 72 131 229 247 40 19

29
Table 3.13 Housing tenure at Waves 1 and 3 Wave 1 Housing Tenure
Wave 3 Housing Tenure % % % % % % % % RS Own outright Under
Privatisat-ion
Tenancy right
Holder
Rented Temp Accom.
Free Illegal occup.
Emergency Accom.
Own outright 97.6 67.6 67.8 49.4 32.9 47.1 33.3 50.0 Under privatisation -- 27.0 16.6 5.6 1.6 -- 4.2 --
Tenancy right holder 0.1 1.4 7.0 -- -- -- -- -- Rented 0.4 4.1 5.5 41.6 16.9 8.0 16.7 7.7
Temporary accommodation 0.7 -- 1.5 -- 30.6 2.3 45.8 23.1 Uses free of charge 0.9 -- -- 3.4 9.9 42.5 -- 19.2
Illegal occupation -- -- -- -- 1.9 -- -- -- Emergency accommodation -- -- 1.5 -- 4.9 -- -- --
Total N 2096 74 199 89 738 87 24 26
FBiH Own outright 95.0 72.2 62.8 45.5 32.3 36.1 35.7 --
Under privatisation 0.1 12.2 7.0 3.0 2.6 -- -- -- Tenancy right holder 0.1 4.3 2.3 -- -- 2.7 -- --
Rented 0.1 -- -- 34.8 21.8 12.6 14.3 -- Temporary accommodation 0.1 7.0 27.9 12.1 28.2 1.6 -- 25.9
Uses free of charge 3.6 2.6 -- 3.0 6.1 43.2 32.1 55.6 Illegal occupation 0.4 0.9 -- -- 1.7 2.2 3.6 --
Emergency accommodation 0.1 -- -- 1.5 6.4 1.6 10.7 18.5 Total N 3387 115 43 66 344 183 28 27

30
4. Employment and unemployment Key Findings
Employment rates for the working age population (15-64 years) increased by almost 5%
between 2001 and 2003 and unemployment rates fell by 3%.
35% of people who were unemployed or out of the labour market in 2001 were in paid
employment by 2003.
10% of those who were in paid employment in 2001 were unemployed by 2003 and a further
8% had left the labour market altogether.
BiH has seen a decline in agricultural occupations between 2001 - 2003 and an increase in
sales and service occupations.
The proportion of those in employment receiving health or pension benefits has increased.
Men in BiH are more likely to be in paid employment than women.
Younger people and those in good health are more likely to be employed. However, in the RS
14% of those aged 65 years or over were still in employment.
People with no educational qualifications are least likely to be in paid employment followed
by those with primary school education only.
Those with no educational qualifications and older people are significantly less likely to have
moved into employment from unemployment between 2001 - 2003.
Temporary residents have improved their labour market situation over the three year period,
particularly in the RS, where they were significantly more likely to have found employment.
31
Employment is a key policy area - in general and BiH in particular. This section analyses
employment trends and the characteristics of those in the labour market, the unemployed and the
inactive over the survey years.
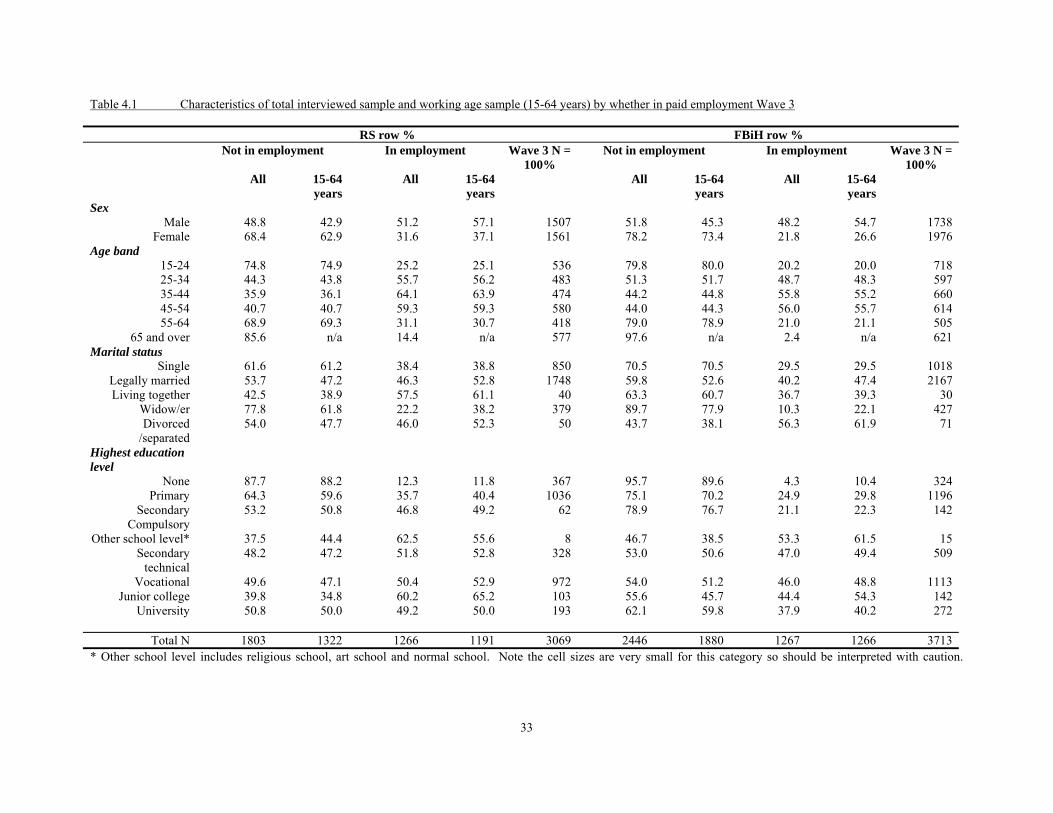
Table 4.1 gives the characteristics of the total interviewed sample, including those aged 65 years or
over at wave 3 and the working age population aged 15-64 years, according to whether they were in
paid employment or not in paid employment. The ‘not in paid employment’ category includes all
forms of non-employment including housewives, students, the retired, those in military service and
those unable to work.
In both entities, women were more likely than men to be not in paid employment, even though women
in the RS were more likely than women in the FBiH to be in paid employment. In the RS, 31.6% of
women were in paid employment compared 21.8% of women in the FBiH. Similar percentages of
men were employed in each entity, 48.8% in the RS and 48.2% in the FBiH. For the working age
population the patterns are similar with men being more likely to be in employment than women. In
the RS, 57.1% of men were in employment and 37.1% of women. In the FBiH, 54.7% of men were in
employment compared to 26.6% of women of working age.
In both entities younger people were less likely to be in paid employment than older age groups,
something which is likely to be due to still being in full-time education but also to relatively high
levels of unemployment for younger people.
The proportion of those in paid employment increases through the age ranges until a noticeable drop
in the 55 - 64 age range as people start to move into retirement. In the over 65 years age group the
majority of respondents were not in paid employment as you would expect. However in the RS
14.4% of older people reported being in paid employment compared to only 2.1% in the FBiH. In
both entities, the proportion of older people in employment has fallen since wave 2. At wave 2,
18.8% of respondents aged 65 or over in the RS said they were working and 4.6% in the FBiH.
When we look at the working age population, those in the 15-24 years age group and those in the 55-
64 age group continue to be less likely to be in employment than those in the 25-54 age group. The
fall in employment rates therefore begins sooner than retirement age for many people.
Education level is clearly associated with employment. Those with no education are most likely to be
not in paid employment followed by those with only primary level education. In the RS 64.3% of
those with primary education were not in paid employment compared to 75.1% in the FBiH. For the
working age respondents, similar patterns can be seen with those having secondary level or higher
32
qualifications being more likely to be in employment than those with primary school or no
qualifications.
33
Table 4.1 Characteristics of total interviewed sample and working age sample (15-64 years) by whether in paid employment Wave 3 RS row % FBiH row % Not in employment In employment Wave 3 N =
100% Not in employment In employment Wave 3 N =
100% All 15-64
years All 15-64
years All 15-64
yearsAll 15-64
years
Sex Male 48.8 42.9 51.2 57.1 1507 51.8 45.3 48.2 54.7 1738
Female 68.4 62.9 31.6 37.1 1561 78.2 73.4 21.8 26.6 1976 Age band
15-24 74.8 74.9 25.2 25.1 536 79.8 80.0 20.2 20.0 718 25-34 44.3 43.8 55.7 56.2 483 51.3 51.7 48.7 48.3 597 35-44 35.9 36.1 64.1 63.9 474 44.2 44.8 55.8 55.2 660 45-54 40.7 40.7 59.3 59.3 580 44.0 44.3 56.0 55.7 614 55-64 68.9 69.3 31.1 30.7 418 79.0 78.9 21.0 21.1 505
65 and over 85.6 n/a 14.4 n/a 577 97.6 n/a 2.4 n/a 621 Marital status
Single 61.6 61.2 38.4 38.8 850 70.5 70.5 29.5 29.5 1018 Legally married 53.7 47.2 46.3 52.8 1748 59.8 52.6 40.2 47.4 2167 Living together 42.5 38.9 57.5 61.1 40 63.3 60.7 36.7 39.3 30
Widow/er 77.8 61.8 22.2 38.2 379 89.7 77.9 10.3 22.1 427 Divorced /separated
54.0 47.7 46.0 52.3 50 43.7 38.1 56.3 61.9 71
Highest education level
None 87.7 88.2 12.3 11.8 367 95.7 89.6 4.3 10.4 324 Primary 64.3 59.6 35.7 40.4 1036 75.1 70.2 24.9 29.8 1196
Secondary Compulsory
53.2 50.8 46.8 49.2 62 78.9 76.7 21.1 22.3 142
Other school level* 37.5 44.4 62.5 55.6 8 46.7 38.5 53.3 61.5 15 Secondary
technical 48.2 47.2 51.8 52.8 328 53.0 50.6 47.0 49.4 509
Vocational 49.6 47.1 50.4 52.9 972 54.0 51.2 46.0 48.8 1113 Junior college 39.8 34.8 60.2 65.2 103 55.6 45.7 44.4 54.3 142
University 50.8 50.0 49.2 50.0 193 62.1 59.8 37.9 40.2 272
Total N 1803 1322 1266 1191 3069 2446 1880 1267 1266 3713 * Other school level includes religious school, art school and normal school. Note the cell sizes are very small for this category so should be interpreted with caution.

34
Table 4.2 gives the distribution of whether in current employment at waves 2 and 3 using the
respondents’ own definition of whether they were unemployed rather than the ILO definition of
unemployment used in the Wave 2 Report2. The table shows the proportions in each of the three
waves who are:
• employed:
• unemployed; and
• not in employment
for those of working age only (15-64 years). Those who are coded as unemployed are those who said
that “Unemployed” best describes their activity status. Those who are not in employment are
primarily those who said that they were a “housewife” but also includes students, those in military
service and those incapable to work. Using this definition of unemployment inevitably produces a
different distribution of unemployment to that provided by the ILO definition, where fairly strict
criteria are applied. However, we can see the trend in the unemployment rate over the three years
using the respondent’s self-definition, in many senses this is the most appropriate perspective for BiH
analysis.
At wave 2, we saw an increase in the percentage who were defined by the ILO criteria as being
unemployed compared to the wave 1 data; 13.6% at wave 2 compared to 9.2% at wave 1 in the RS
and 12% at wave 2 compared to 8.5% at wave 1 for FBiH. This was interpreted as being a positive
trend as it indicated that more people were actively looking for work and available to start working if
any were offered even if they had yet been successful in finding any work. This interpretation of the
ILO rates seems to be supported by the data using self-reported unemployment. Using the self-report
of unemployment status the trend over the three years is downwards for unemployment, from 22.9%
at wave 1 for BiH as a whole to 19.6% at wave 3. As non-employment rates have not risen over the
period, this suggests that at least some of those who were actively seeking work were successful in
finding employment.
In addition to a downwards trend in unemployment we see a slight fall in the percentage who were not
in employment over the three years and an accompanying increase in the percentage who were in
employment. This trend can be seen in both entities even though the RS continues to have higher
rates of employment than the FBiH. In the RS 44.5% of respondents were in employment at wave 3
compared to 41% at wave 1, an increase of 3.5%. In the FBiH 38% were in employment at wave 3 2 A routing error on the wave 3 questionnaire means that the ILO definition of unemployment could not be derived for wave 3 for all respondents. The ILO definition of unemployment is : not currently in paid employment, has looked for a job in the last four weeks and is available to start work in the next two weeks if a job were offered.

35
compared to 32.1% at wave 1, an increase of 5.9%. For BiH as a whole the employment rate has
increased to 40.9% at wave 3 from 36.1% at wave 1, an increase of 4.8%. This trend should be seen
as a positive development for BiH with the rise in employment rates being due mainly to a decrease in
unemployment at the aggregate level as well as a smaller fall in the percentage of non-employed.
Table 4.2 Cross-sectional employment status at Waves 1-3 by entity for working age respondents (15-64
years)
Entity RS % FBIH % BiH % W1 W2 W3 W1 W2 W3 W1 W2 W3
Unemployed 23.4 21.8 20.9 22.5 20.5 18.5 22.9 21.1 19.6 Employed 41.0 43.5 44.5 32.1 36.0 38.0 36.1 36.0 40.9
Not in employment 35.6 34.7 34.6 45.4 43.6 43.4 41.0 43.6 39.5 2609 2632 2552 3268 3295 3163 5877 5929 5715
As many of the same individuals have been interviewed at each of the three years of the survey, we
can look at the longer term movements for individuals between different employment statuses. Table
4.3 shows all respondents interviewed at every year who are aged between 15-64 years at all three
years. Again, the employment status is as reported by the respondent.
The percentages highlighted in bold on the diagonal show the respondents who were in the same
category at each of waves 1 and 3. For BiH as a whole, those in paid employment at wave 1 were the
most stable group with 82.1% still being in paid employment at wave 3. Those not in paid
employment at wave 1 were the next most stable group with 76.5% being in the same category at
wave 3. Unemployment was the least stable group with 49.3% being unemployed at both wave 1 and
wave 3.
While this suggests there is a core of long-term unemployed, there is considerable movement both
into and out of the unemployed category over the three years.
Table 4.3 Cross-wave employment status waves 1 - 3 by entity for working age respondents (15-64
years) Employment status at Wave 1 Wave 3 Employment status
Unemployed %
Employed %
Not in employment %
RS Unemployed 52.0 12.1 11.9
Employed 32.1 80.5 13.5 Not in employment 15.8 7.4 74.7
Total N 588 1028 825 FBiH
Unemployed 47.1 8.1 13.3

36
Employed 36.5 83.7 9.0 Not in employment 16.4 8.2 77.7
Total N 690 986 1317 All BiH
Unemployed 49.3 10.1 12.7 Employed 34.5 82.1 10.7
Not in employment 16.2 7.8 76.5 Total N 1279 2014 2142
For all in BiH, 10.1% of those who had been employed at wave 1 were unemployed at wave 3 and
12.7% of those not in employment at wave 1 were unemployed at wave 3. However, 34.5% of those
who were unemployed at wave 1 were in employment by wave 3 with a further 16.2% moving into
the ‘not in employment’ category.
Therefore, there are indications that half of the unemployed over this period either:
• found a job and became employed; or
• left the labour market for some other reason.
These reasons may include ill health or looking after the home or family or some respondents may
simply have redefined themselves as not employed, possibly because they had become discouraged
and stopped searching for work. A not insignificant proportion of respondents had moved from not in
employment to being unemployed or in employment. This suggests that over the three year period
around one quarter of the non-employed did start to look for work at some point and around half of
these were successful in finding work by wave 3.
The patterns in each entity are similar even though higher percentages are unemployed at both points
in the RS than in the FBiH. The employment category is more stable in the FBiH than in the RS. In
the FBiH the ‘not in employment’ category was also more stable than in the RS and the FBiH had a
slightly higher percentage of respondents moving into the ‘not in employment’ category from both
unemployment and employment than in the RS.
Table 4.4 gives the distribution of occupations and industries at waves 2 and 3 for those in
employment at each year. Occupations were coded to ISCO and industry to NACE classifications.
The distributions are similar across the two years with the main difference between entities continuing
to be the proportion of those in agricultural occupations, with twice as many being employed in
agriculture in the RS (20.7%) compared to the FBiH (11.5%). Despite this, there has been a
noticeable fall in the proportion of respondents in agricultural jobs in the RS since wave 2, down by
6.1%. In contrast, the proportion in service and sales occupations has grown by 4.9% in the RS while
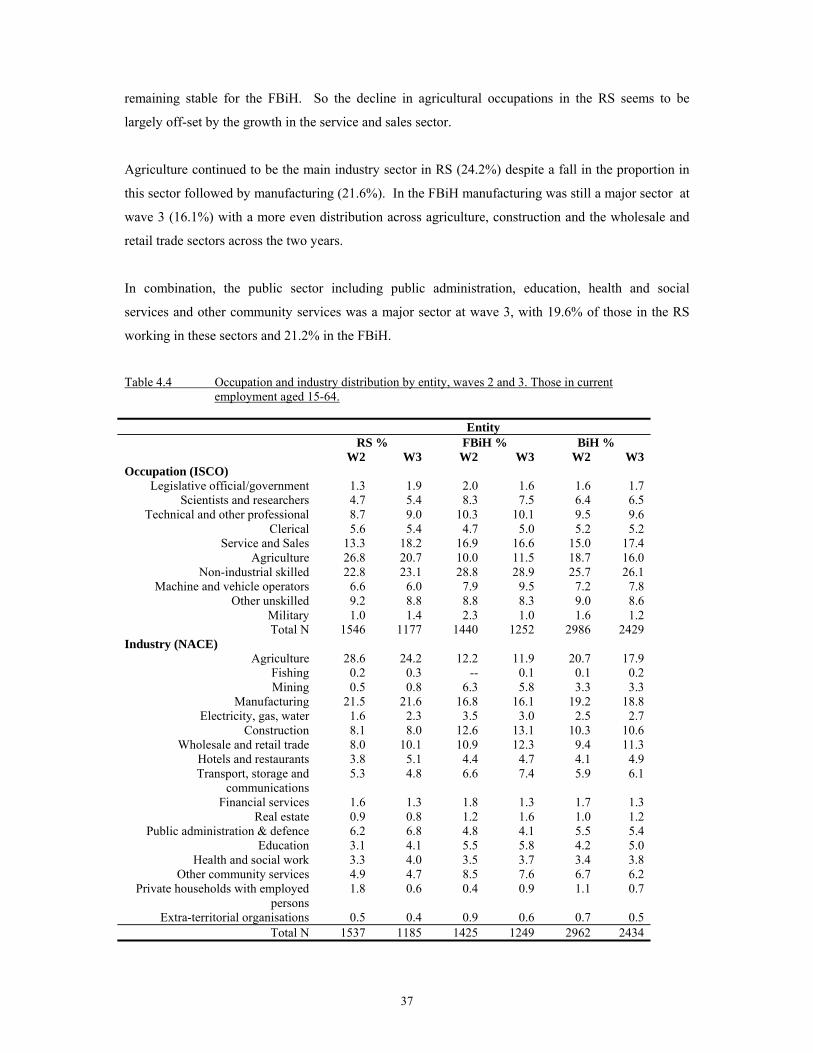
37
remaining stable for the FBiH. So the decline in agricultural occupations in the RS seems to be
largely off-set by the growth in the service and sales sector.
Agriculture continued to be the main industry sector in RS (24.2%) despite a fall in the proportion in
this sector followed by manufacturing (21.6%). In the FBiH manufacturing was still a major sector at
wave 3 (16.1%) with a more even distribution across agriculture, construction and the wholesale and
retail trade sectors across the two years.
In combination, the public sector including public administration, education, health and social
services and other community services was a major sector at wave 3, with 19.6% of those in the RS
working in these sectors and 21.2% in the FBiH.
Table 4.4 Occupation and industry distribution by entity, waves 2 and 3. Those in current
employment aged 15-64.
Entity RS % FBiH % BiH %
W2 W3 W2 W3 W2 W3 Occupation (ISCO)
Legislative official/government 1.3 1.9 2.0 1.6 1.6 1.7 Scientists and researchers 4.7 5.4 8.3 7.5 6.4 6.5
Technical and other professional 8.7 9.0 10.3 10.1 9.5 9.6 Clerical 5.6 5.4 4.7 5.0 5.2 5.2
Service and Sales 13.3 18.2 16.9 16.6 15.0 17.4 Agriculture 26.8 20.7 10.0 11.5 18.7 16.0
Non-industrial skilled 22.8 23.1 28.8 28.9 25.7 26.1 Machine and vehicle operators 6.6 6.0 7.9 9.5 7.2 7.8
Other unskilled 9.2 8.8 8.8 8.3 9.0 8.6 Military 1.0 1.4 2.3 1.0 1.6 1.2 Total N 1546 1177 1440 1252 2986 2429
Industry (NACE) Agriculture 28.6 24.2 12.2 11.9 20.7 17.9
Fishing 0.2 0.3 -- 0.1 0.1 0.2 Mining 0.5 0.8 6.3 5.8 3.3 3.3
Manufacturing 21.5 21.6 16.8 16.1 19.2 18.8 Electricity, gas, water 1.6 2.3 3.5 3.0 2.5 2.7
Construction 8.1 8.0 12.6 13.1 10.3 10.6 Wholesale and retail trade 8.0 10.1 10.9 12.3 9.4 11.3
Hotels and restaurants 3.8 5.1 4.4 4.7 4.1 4.9 Transport, storage and
communications 5.3 4.8 6.6 7.4 5.9 6.1
Financial services 1.6 1.3 1.8 1.3 1.7 1.3 Real estate 0.9 0.8 1.2 1.6 1.0 1.2
Public administration & defence 6.2 6.8 4.8 4.1 5.5 5.4 Education 3.1 4.1 5.5 5.8 4.2 5.0
Health and social work 3.3 4.0 3.5 3.7 3.4 3.8 Other community services 4.9 4.7 8.5 7.6 6.7 6.2
Private households with employed persons
1.8 0.6 0.4 0.9 1.1 0.7
Extra-territorial organisations 0.5 0.4 0.9 0.6 0.7 0.5 Total N 1537 1185 1425 1249 2962 2434
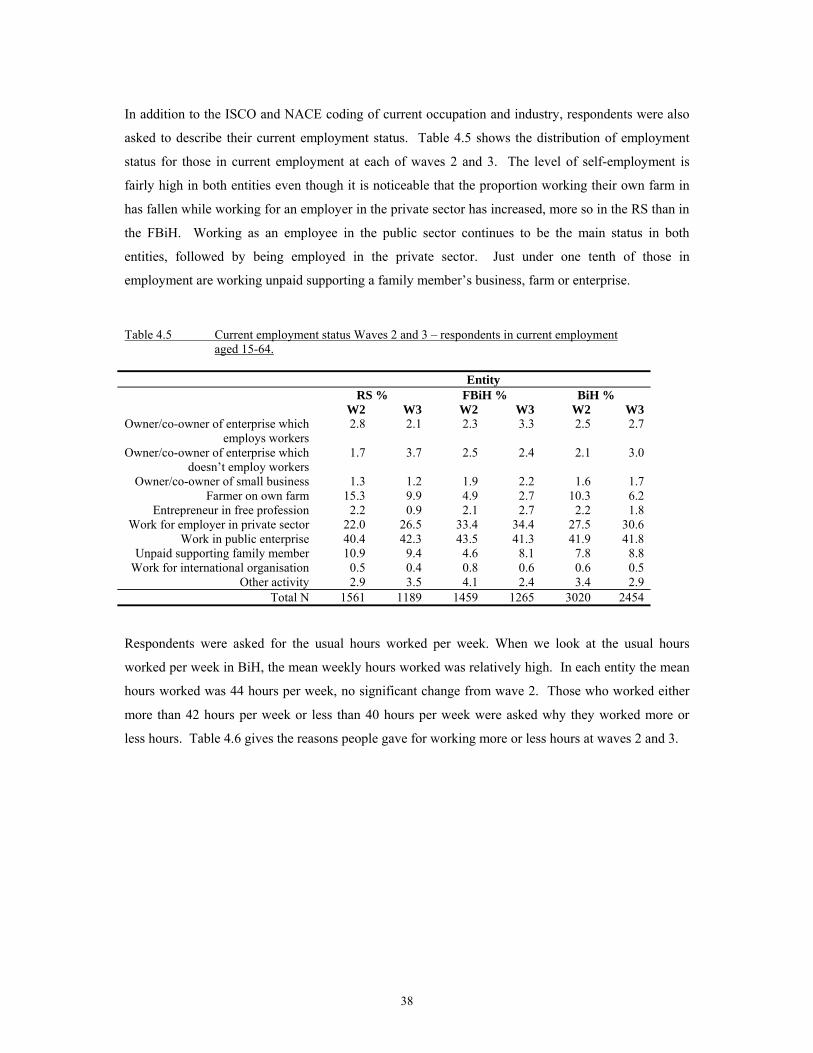
38
In addition to the ISCO and NACE coding of current occupation and industry, respondents were also
asked to describe their current employment status. Table 4.5 shows the distribution of employment
status for those in current employment at each of waves 2 and 3. The level of self-employment is
fairly high in both entities even though it is noticeable that the proportion working their own farm in
has fallen while working for an employer in the private sector has increased, more so in the RS than in
the FBiH. Working as an employee in the public sector continues to be the main status in both
entities, followed by being employed in the private sector. Just under one tenth of those in
employment are working unpaid supporting a family member’s business, farm or enterprise.
Table 4.5 Current employment status Waves 2 and 3 – respondents in current employment
aged 15-64.
Entity RS % FBiH % BiH %
W2 W3 W2 W3 W2 W3 Owner/co-owner of enterprise which
employs workers 2.8 2.1 2.3 3.3 2.5 2.7
Owner/co-owner of enterprise which doesn’t employ workers
1.7 3.7 2.5 2.4 2.1 3.0
Owner/co-owner of small business 1.3 1.2 1.9 2.2 1.6 1.7 Farmer on own farm 15.3 9.9 4.9 2.7 10.3 6.2
Entrepreneur in free profession 2.2 0.9 2.1 2.7 2.2 1.8 Work for employer in private sector 22.0 26.5 33.4 34.4 27.5 30.6
Work in public enterprise 40.4 42.3 43.5 41.3 41.9 41.8 Unpaid supporting family member 10.9 9.4 4.6 8.1 7.8 8.8
Work for international organisation 0.5 0.4 0.8 0.6 0.6 0.5 Other activity 2.9 3.5 4.1 2.4 3.4 2.9
Total N 1561 1189 1459 1265 3020 2454 Respondents were asked for the usual hours worked per week. When we look at the usual hours
worked per week in BiH, the mean weekly hours worked was relatively high. In each entity the mean
hours worked was 44 hours per week, no significant change from wave 2. Those who worked either
more than 42 hours per week or less than 40 hours per week were asked why they worked more or
less hours. Table 4.6 gives the reasons people gave for working more or less hours at waves 2 and 3.
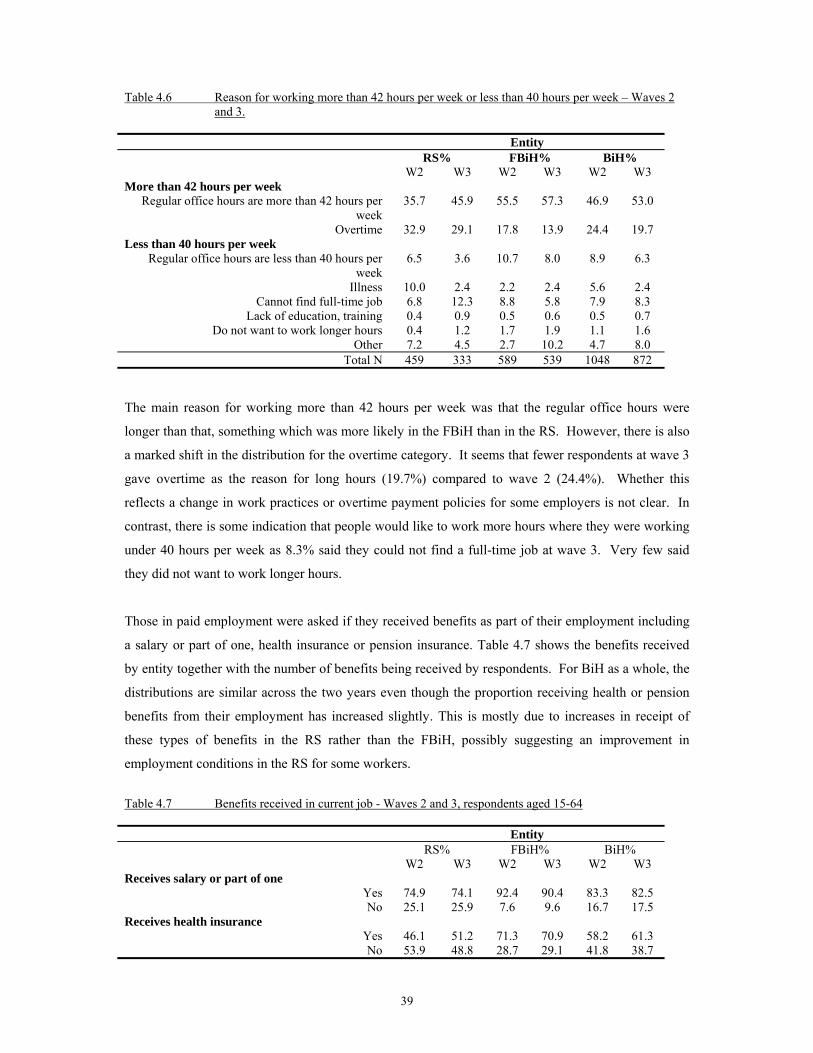
39
Table 4.6 Reason for working more than 42 hours per week or less than 40 hours per week – Waves 2 and 3.
Entity RS% FBiH% BiH% W2 W3 W2 W3 W2 W3 More than 42 hours per week
Regular office hours are more than 42 hours per week
35.7 45.9 55.5 57.3 46.9 53.0
Overtime 32.9 29.1 17.8 13.9 24.4 19.7 Less than 40 hours per week
Regular office hours are less than 40 hours per week
6.5 3.6 10.7 8.0 8.9 6.3
Illness 10.0 2.4 2.2 2.4 5.6 2.4 Cannot find full-time job 6.8 12.3 8.8 5.8 7.9 8.3
Lack of education, training 0.4 0.9 0.5 0.6 0.5 0.7 Do not want to work longer hours 0.4 1.2 1.7 1.9 1.1 1.6
Other 7.2 4.5 2.7 10.2 4.7 8.0 Total N 459 333 589 539 1048 872
The main reason for working more than 42 hours per week was that the regular office hours were
longer than that, something which was more likely in the FBiH than in the RS. However, there is also
a marked shift in the distribution for the overtime category. It seems that fewer respondents at wave 3
gave overtime as the reason for long hours (19.7%) compared to wave 2 (24.4%). Whether this
reflects a change in work practices or overtime payment policies for some employers is not clear. In
contrast, there is some indication that people would like to work more hours where they were working
under 40 hours per week as 8.3% said they could not find a full-time job at wave 3. Very few said
they did not want to work longer hours.
Those in paid employment were asked if they received benefits as part of their employment including
a salary or part of one, health insurance or pension insurance. Table 4.7 shows the benefits received
by entity together with the number of benefits being received by respondents. For BiH as a whole, the
distributions are similar across the two years even though the proportion receiving health or pension
benefits from their employment has increased slightly. This is mostly due to increases in receipt of
these types of benefits in the RS rather than the FBiH, possibly suggesting an improvement in
employment conditions in the RS for some workers.
Table 4.7 Benefits received in current job - Waves 2 and 3, respondents aged 15-64 Entity RS% FBiH% BiH%
W2 W3 W2 W3 W2 W3 Receives salary or part of one
Yes 74.9 74.1 92.4 90.4 83.3 82.5 No 25.1 25.9 7.6 9.6 16.7 17.5
Receives health insurance Yes 46.1 51.2 71.3 70.9 58.2 61.3 No 53.9 48.8 28.7 29.1 41.8 38.7
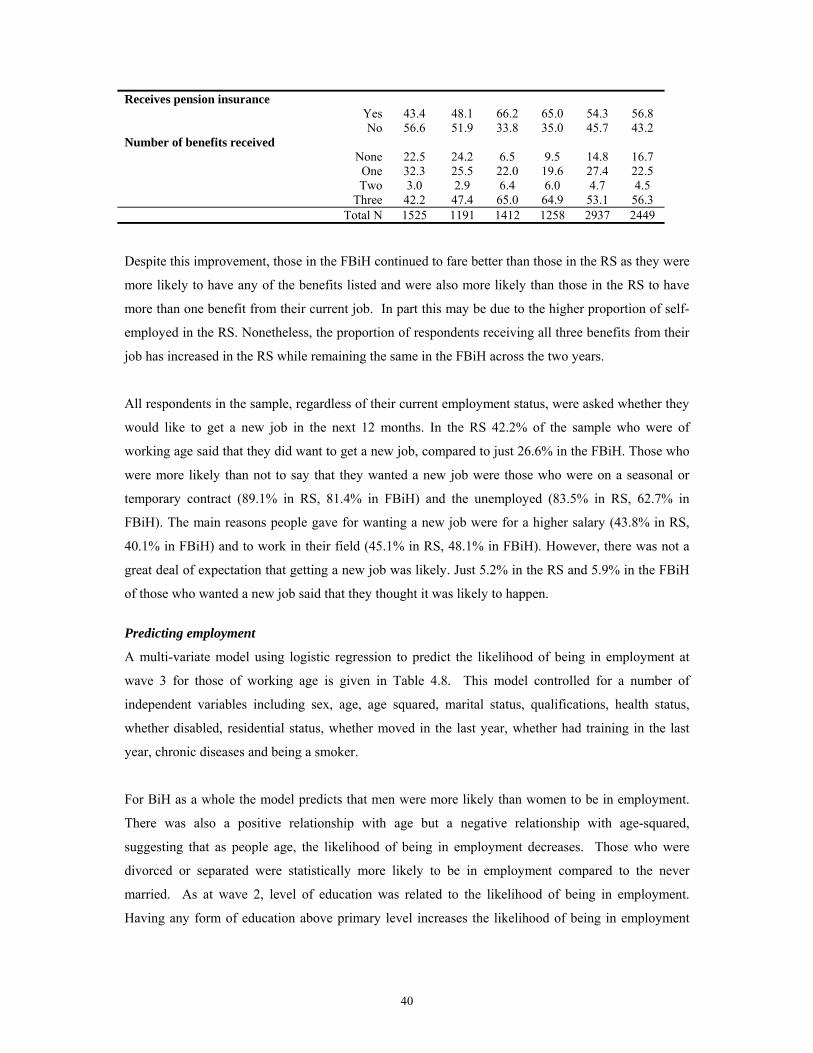
40
Receives pension insurance Yes 43.4 48.1 66.2 65.0 54.3 56.8 No 56.6 51.9 33.8 35.0 45.7 43.2
Number of benefits received None 22.5 24.2 6.5 9.5 14.8 16.7
One 32.3 25.5 22.0 19.6 27.4 22.5 Two 3.0 2.9 6.4 6.0 4.7 4.5
Three 42.2 47.4 65.0 64.9 53.1 56.3 Total N 1525 1191 1412 1258 2937 2449
Despite this improvement, those in the FBiH continued to fare better than those in the RS as they were
more likely to have any of the benefits listed and were also more likely than those in the RS to have
more than one benefit from their current job. In part this may be due to the higher proportion of self-
employed in the RS. Nonetheless, the proportion of respondents receiving all three benefits from their
job has increased in the RS while remaining the same in the FBiH across the two years.
All respondents in the sample, regardless of their current employment status, were asked whether they
would like to get a new job in the next 12 months. In the RS 42.2% of the sample who were of
working age said that they did want to get a new job, compared to just 26.6% in the FBiH. Those who
were more likely than not to say that they wanted a new job were those who were on a seasonal or
temporary contract (89.1% in RS, 81.4% in FBiH) and the unemployed (83.5% in RS, 62.7% in
FBiH). The main reasons people gave for wanting a new job were for a higher salary (43.8% in RS,
40.1% in FBiH) and to work in their field (45.1% in RS, 48.1% in FBiH). However, there was not a
great deal of expectation that getting a new job was likely. Just 5.2% in the RS and 5.9% in the FBiH
of those who wanted a new job said that they thought it was likely to happen.
Predicting employment
A multi-variate model using logistic regression to predict the likelihood of being in employment at
wave 3 for those of working age is given in Table 4.8. This model controlled for a number of
independent variables including sex, age, age squared, marital status, qualifications, health status,
whether disabled, residential status, whether moved in the last year, whether had training in the last
year, chronic diseases and being a smoker.
For BiH as a whole the model predicts that men were more likely than women to be in employment.
There was also a positive relationship with age but a negative relationship with age-squared,
suggesting that as people age, the likelihood of being in employment decreases. Those who were
divorced or separated were statistically more likely to be in employment compared to the never
married. As at wave 2, level of education was related to the likelihood of being in employment.
Having any form of education above primary level increases the likelihood of being in employment

41
and having a university level qualification is most significant compared to having no qualifications at
all.
The likelihood of being of in employment was reduced for the disabled compared to those who were
able bodied while those whose health was excellent, very good or fair were more likely than those
with poor health to be in employment. Those who were permanent residents who had to move during
the war or were temporary residents were also less likely to be in employment compared to permanent
residents who did not move during the war. However, unlike wave 2, the coefficients for these
categories were not statistically significant at wave 3. Being a smoker is also positively related to
being in employment but as at wave 2 this is likely to be a spurious effect due to the fact that men are
both more likely to be in employment and are more likely to be smokers.
When we run the same model separately for each entity, the broad picture remains the same as for
BiH as a whole. However, there are some differences for each entity. In the RS, cohabitation was
positively related to being in employment while in the FBiH cohabitation had a negative, but not
statistically significant, relationship with being in employment. In the FBiH those who were divorced
or separated were more likely to be in employment compared to the never married but this was not
significant in the RS. Being a temporary resident in the FBiH reduced the chances of being in
employment significantly while in the RS this did not affect the chances of being employed. In
contrast, being a displaced resident in the RS did reduce the likelihood of being in employment where
it was not significant in the FBiH. Table 4.8 Logistic regression results predicting being in employment at Wave 3
RS FBiH BiH
B S.E. B S.E B S.EMale 1.004** .102 1.259** .097 1.125** .070Age .340** .027 .397** .027 .367** .019Age-squared -.004** .000 -.005** .000 -.004** .000Married .148 .142 .133 .138 .118 .098Cohabiting .929+ .406 -.326 .447 .332 .294Widow/er .354 .265 .121 .257 .115 .180Divorced/separated .303 .358 .949* .331 .637* .239Primary educ. -.148 .166 .022 .164 -.045 .115Secondary educ. .638** .159 .676** .153 .683** .109College educ. 1.312** .301 1.466** .285 1.386** .204University educ. 1.963** .321 2.468** .320 2.234** .224Disabled -.785* .252 -.926** .218 -.891** .163Health excellent .530* .195 .777** .179 .645** .130Health very good .370+ .180 .657** .171 .513** .122Health fair .572** .156 .347+ .155 .451** .109Displaced resident -.563* .204 -.097 .165 -.287+ .127Temporary resident -.004 .114 -.563** .166 -.095 .090Moved in last year -.193 .162 -.054 .237 -.076 .132Has chronic disease .150 .145 .064 .143 .120 .101
42
Smoker .510** .099 .397** .092 .425** .067Constant -8.067 .538 -9.573 .526 -8.817 .372R2 0.316 0.384 0.345
N 2564 3113 5677 ** Sig .001 * Sig .01 + Sig .05 Predicting moves into employment, waves 1 to 3
As the same individuals have been interviewed at each of the three years of the survey, we can
examine the characteristics of those most likely to move into paid employment over the whole period.
The model shown in Table 4.9 predicts the likelihood of moving into employment between waves 1
and 3 for those of working age at both years. The dependent variable was coded ‘1’ if not in
employment, either unemployed or out of the workforce, at wave 1 and in employment at wave 3.
These are the cases that moved from non-employment to employment over this period. All other
cases were coded ‘0’ on the dependent variable. In this model the characteristics of respondents at
wave 1 are used as the independent variables predicting a move into employment by wave 3. As the
wave 1 questionnaire did not contain questions on general health, disability, and smoking, these
variables are not included in this model. All other variables are included as in the previous model at
Table 4.8.
For BiH as a whole, age is positively related to moving into employment while age squared has a
negative relationship with moving into employment. As people age they are more likely to move into
employment but as they approach the end of their working life they are less likely to move into
employment. This relationship with age is statistically significant in the FBiH but not in the RS. This
is probably due to the fact that the RS has around 15% of respondents continuing to work beyond 65
years of age. This may also suggest that respondents in the RS start their working life at an earlier age
than those in the FBiH, possibly because of differing rates of youngsters remaining in education
through their late teens and early twenties.
Men were more likely than women to have moved into employment from non-employment between
waves 1 and 3 even though this result is again driven entirely by men in the FBiH. Men in the RS
were no more likely to have moved into employment than women over this period. Those who were
widowed and, in the FBiH, married, were less likely to move into employment than single
respondents. This is probably due the married women being primarily located in the home. Those
respondents with any qualifications, and in particular university level qualifications, were less likely
to move into employment than those with no qualifications at all. While this may seem counter-
intuitive it can be interpreted as being the result of the higher probability of being employed at wave 1

43
for those who do have any qualifications at all. So those with any qualifications at all were less likely
to be unemployed at wave 1 so could not move into employment as they were already in employment.
Table 4.9 Logistic regression results predicting moving into employment between
waves 1 and 3 (respondents aged 15-64 interviewed at both waves)
RS FBiH BiH
B S.E. B S.E B S.EMale .015 .142 .716** .130 .395** .094Age -.002 .038 .122** .036 .058+ .026Age-squared .000 .000 -.002** .000 -.001** .000Married -.094 .198 -.373+ .176 -.203 .130Cohabiting -.084 .515 -4.492 5.697 -.505 .492Widow/er -.209 .438 -1.195+ .494 -.756+ .323Divorced/separated -.134 .548 .249 .475 .040 .354Primary educ. -.615+ .246 -.651* .221 -.623** .163Secondary educ. -.581+ .241 -.643* .209 -.548** .155College educ. -.613 .482 -1.119+ .495 -.835+ .342University educ. -1.528+ .637 -2.832* .838 -2.073** .500Has chronic disease .157 .203 -.107 .205 .020 .143Displaced resident .848** .238 .235 .216 .482* .158Temporary resident .517** .162 -.083 .226 .233 .124Moved in last year .156 .237 .064 .340 .148 .193Constant -.883 .623 -2.908 .596 -1.889 .427R2 0.067 0.099 0.069
N 2253 2731 4984 ** Sig .001 * Sig .01 + Sig .05
Those who were displaced residents were more likely to have moved into employment over the period
than those who were permanent residents. In this case, this is due to displaced residents in the RS
being significantly more likely to have found employment but is not significant in the FBiH.
Temporary residents in the RS are also more likely to have moved into employment over this period,
with both of these movements suggesting these types of respondents have managed to improve their
situation over the three year period. It is interesting to note that these results differ somewhat from
those found at wave 2 where only a one year transition could be observed and displaced residents
were less likely to have moved into employment than permanent residents. The value of having the
longer run of panel data is that the patterns over the longer term can be observed.

44
5. Income Key Findings
One third of households in the RS and one fifth of households in the FBiH were in the bottom
income quartile in 2003.
‘Work rich’ households where two or more people were in paid employment were
significantly better off than other households, especially in the FBiH.
The gender of the household head was associated with income levels, with female headed
households being more likely to be in the bottom income quartile than male headed
households. Male headed households were more likely than female headed households to be
in the upper income quartile.
People in the youngest age group (15-24 years) had low mean incomes, increasing in the
middle years to peak in the 35-44 age group and then falling as people age and enter
retirement.
Women’s incomes from all sources are significantly lower than men’s incomes in BiH,
possibly reflecting shorter working hours for women with women being located in less well-
paying jobs.
As the level of education held increases, so do income levels. Those with no qualifications or
primary education only are significantly worse off than those with higher level qualifications.
One quarter of households with dependent children under fifteen in BiH had no income from
employment sources.
Education level of the head of household for households with dependent children and whether
any employment income were clearly associated. Almost half (44.3%) of households with
dependent children where the head of the household had no qualifications had no income
from employment.
For BiH as a whole, the percentage of people saying they were living comfortably had
increased from 2.6% at wave 2 to 3.7% at wave 3 while the percentage who were ‘finding it
very difficult’ reduced slightly from 18% to 16.6% at wave 3.
45
Income is a central indicator of the long term well-being of households in BiH and this section
examines income trends over the three year period together with income transitions for individuals
within the sample.
Household income
The mean monthly household income from all sources reported in the survey at wave 3 including
employment income, non-employment income, gifts or remittances, was 526 KM for BiH as a whole,
410 KM in the RS and 609 KM in the FBiH. (See Table 2.6 in section 2 for the means for each
source by entity). If we divide the monthly household income distribution into deciles and quartiles
we can see the proportion of households in each tenth and each quarter of the income distribution.
Table 5.1 shows the proportion of households in each decile and quartile, by entity, at each of waves 2
and 3. The proportion of households in the lowest two deciles of the income distribution is higher in
the RS than in the FBiH. At the other end of the income distribution a higher proportion of FBiH
households are found in the top two deciles than in the RS, a difference which has increased slightly
over the two years.
Looking at income quartiles, the RS has seen a slight increase in the proportion of households in the
lowest income quartile since wave 2. In the RS, 34% of households at wave 3 were in the lowest
quarter of the income distribution compared to 32.4% at wave 2. The opposite is seen in the FBiH
where there has been a slight fall in the proportion of households in the lowest income quartile, 17.4%
at wave 3 compared to 19.5% at wave 2. In the RS, there is a slight increase in the proportion of
households in the middle of the income distribution but a fall in the proportion in the upper quartile,
from 20% at wave 2 to 16.3% at wave 3.
In contrast, there has been little change in the middle of the income distribution in the FBiH while the
proportion in the upper quartile has increased from 28.8% to 31.6%. As we have seen, mean
household income in the FBiH is higher than in the RS but the RS also has a relatively high
proportion of the poorest households compared to the FBiH, a difference which the data suggest is
increasing rather than decreasing over time. The data from the HBS, currently underway, will provide
additional information on this trend.
46
Table 5.1 Monthly household income decile and quartile by entity - Waves 2 and 3 Entity Monthly household income RS% FBiH%
W2 W3 W2 W3 Lowest decile 17.6 18.4 5.1 3.6
2 10.1 11.3 9.2 9.0 3 10.0 10.3 10.2 9.8 4 8.8 9.8 10.5 12.8 5 10.8 9.4 10.1 7.8 6 7.8 9.6 10.6 10.4 7 11.2 10.4 11.3 9.7 8 8.2 7.7 9.6 11.7 9 8.2 7.5 10.7 11.9
Highest decile 7.3 5.6 12.7 13.3
Lowest quartile 32.4 34.0 19.5 17.4 2 24.9 25.1 25.7 25.6 3 22.7 24.5 26.0 25.3
Highest quartile 20.0 16.3 28.8 31.6
N households 1212 1035 1602 1365
As the main source of income for households is from employment, the number of persons employed
in a household has a significant effect on total household income. In Table 5.2 household income
quartiles are shown by the number of persons employed in the household at each of waves 2 and 3.
Households with no-one employed, including those with no-one of working age, are more likely to be
in the lowest quartile compared to those with at least one person employed. Households with two or
more people employed in the household are more likely to be in the highest income quartile than other
households. These ‘work rich’ households are therefore significantly better off than other households
in both entities even though the distribution across quartiles differs in each entity.
In the RS, the proportion of households with no-one employed who are in the lowest income quartile
has increased, from 53.6% of households at wave 2 to 63.6% at wave 3. In contrast, the proportion of
households with two or more people employed in the upper quartile has increased slightly, from
43.1% at wave 2 to 44.3% at wave 3. In the FBiH it is striking that the proportion of households with
two or more people in employment who are in the upper quartile has increased from 65.4% at wave 2
to 81% at wave 3. The effect of having no-one employed in the household in terms of being in the
lowest quartile is not as marked in the FBiH as in the RS even though over one third of non-employed
households in the FBiH are found in the bottom quartile at each year.
The differential effect between entities of the numbers in employment on increasing total household
income is likely to be due to higher average wages from employment in the FBiH, rather than

47
differing employment rates in each entity. As was noted in section 1, a higher proportion of
households in the RS have more than one person in employment than in the FBiH. Table 5.2 Monthly household income quartile by numbers employed within the household – by entity Waves 2 and 3 Number persons employed None One Two or more % % % W2 W3 W2 W3 W2 W3
RS Lowest quartile 53.6 63.6 27.2 20.2 5.9 4.3
2 23.3 25.3 32.4 30.3 16.3 17.6 3 15.3 9.2 22.8 36.2 34.6 33.7
Highest quartile 7.8 1.9 17.6 13.2 43.1 44.3 N households 472 423 448 356 289 255
FBiH Lowest quartile 36.2 34.9 6.5 4.3 3.1 1.6
2 30.5 40.0 28.0 19.6 8.5 2.4 3 20.5 16.6 34.3 40.6 23.0 14.9
Highest quartile 12.8 8.4 31.2 35.5 65.4 81.0 N households 732 607 586 510 283 248
At wave 2, the composition of the household in terms of whether it was a female headed household or
a male headed household had an effect on household income, with female headed households being
on the whole poorer than those headed by a male.
At wave 3, the same pattern is evident and the pattern suggests that the increase in the proportion of
households in the lowest income quartile and the decrease in the proportion in the highest quartile is
largely driven by whether the household has a male or female head. Table 5.3 shows that for BiH as a
whole, the proportion of households with a male head in the bottom quartile fell from 20.4% at wave
2 to 18.7% at wave 3. On the other hand, the proportion of female headed households in the bottom
quartile increased from 39.4% at wave 2 to 41.7% at wave 3. Similarly, the proportion of male
headed households in the highest quartile increased from 26.6% at wave 2 to 28% at wave 3 while the
proportion of female headed households in the upper quartile fell from 20.3% to 16.3%.
These differences in income between male and female headed households are likely to be due, at least
in part, the differences in employment rates and wages earned between men and women. They are
also likely to be associated with age, where female headed households may be more likely to be
widows living on a limited income from social benefits, pensions and other non-employment sources
than male headed households. In addition, it may be the case that some female headed households
with dependent children are unable to work or have limited hours of work or low paid part-time work
due to their family commitments.
48
Table 5.3 Monthly household income quartile by whether male or female headed household – Waves 2 and 3
Gender of household head Male head Female head % % W2 W3 W2 W3
All BiH Lowest quartile 20.4 18.7 39.4 41.7
2 26.5 25.6 21.9 23.7 3 26.6 27.7 18.5 18.3
Highest quartile 26.6 28.0 20.3 16.3 N households 2123 1783 691 657
RS Lowest quartile 26.8 28.0 52.3 53.0
2 26.7 27.1 18.4 19.5 3 24.3 26.7 16.9 17.3
Highest quartile 22.1 18.3 12.4 10.2 N households 946 787 266 266
FBiH Lowest quartile 15.2 11.3 31.3 33.9
2 26.3 24.4 24.0 26.5 3 28.4 28.5 19.5 18.9
Highest quartile 30.2 35.7 25.2 20.7 N households 1177 996 425 392
Income sources
Figure 5.1, below, gives the mean individual monthly income by source of income and age group by
entity at wave 3. Individuals in both entities have the same pattern across the age range with the mean
income being low for the youngest age group, increasing through the middle years to peak in the 35-
44 age group and then falling as people age and enter retirement. Despite the similarity in the overall
pattern of individual income across age groups in each entity, the mean individual income is
consistently lower for those in the RS than in the FBiH, something which holds across income sources
and age groups.
Figure 5.2 shows the mean monthly individual income for men and women by entity. Women’s
incomes are significantly lower than men’s incomes from all sources. Women in the RS had a mean
monthly income from employment of 51 KM per month compared to 111 KM for men in the RS. The
gap in the FBiH is even greater with women in the FBiH having a mean monthly income from
employment of 63 KM per month compared to 206 KM for men in the FBiH. While these differences
are likely to reflect differences in hours worked with women possibly working fewer hours than men,
it also suggests that there may be an element of gender segregation within the labour market with
women being primarily located in less well paid jobs than men. Average earnings for men in FBiH
also seem to have increased significantly over the short term, from a mean of 167 KM per month at
wave 2.
49
Fig 5.1 Mean income by source and age group, Wave 3
0
50
100
150
200
250
300
350
15-24 25-34 35-44 45-54 55-64 65+
Age group
KM
s pe
r mon
th
RS EmploymentRS Emp + non-empRS All incomeFBIH EmploymentFBIH Emp + non-empFBIH All income
Fig 5.2 Mean monthly individual income by gender, Wave 3
0
50
100
150
200
250
300
RS Male FBIH Male All BiHMale
RSFemale
FBIHFemale
All BiHFemale
KM
s pe
r mon
th
Employment
Emp + non-emp
All income
The level of qualifications held by respondents is clearly associated with income levels (Fig 5.3). As
the level of education increases, the mean monthly income for those respondents increases. Those
with no education or primary level education only are significantly worse off than those with higher
level qualifications. The pattern is the same for each entity even though mean income levels differ.

50
Fig 5.3 Mean monthly income by level of qualifications, Wave 3
0
100
200
300
400
500
600
700
None Primary Secondary College University
Qualif ications held
KMs
per m
onth RS Employment
RS All income
FBIH Employment
FBIH All income
Reducing child poverty is a key policy objective within the BiHDS. Table 5.4 gives the percentage of
households with at least one dependent child aged under 15 by whether they had any employment
income at each of waves 1 and 2. At wave 1, in BiH as a whole 26.2% of households with dependent
children had no income from employment. In the RS 19.9 % of households with dependent children
had no employment income while in the FBiH this was 30.4% of households.
At wave 2, the RS had 24.5% and the FBiH 25.7% of households with dependent children having no
income from employment. As employment income forms the largest element of most household
income in BiH, children in these households are likely to be living in relatively poor conditions
compared to children living in a household which has some employment income.
Table 5.4 Households with dependent children aged under 15 years by whether any income from employment – by entity Waves 1 to 3
Entity RS % FBiH % Total BiH %
W1 W2 W3 W1 W2 W3 W1 W2 W3 Has employment income 80.1 75.5 71.8 69.6 74.3 75.0 73.8 74.8 73.7 No employment income 19.9 24.5 28.2 30.4 25.7 25.0 26.2 25.2 26.3
N 428 400 340 658 630 523 1086 1030 863 If we look at movements between categories over the three years from 2001 - 2003 (Table 5.5) we see
that in the RS 66.7% of households with dependent children had no employment income at both
points. In the FBiH, 54.9% of households with dependent children had no employment income at
both waves. This suggests these households are likely to have been consistently poorer over the three
year period than other households.

51
The table also shows that in the RS 33.3% of households with dependent children and no employment
income at wave 1 had shifted into the category with employment income by wave 3. In the FBiH,
45.1% of households with dependent children and no employment income at wave 1 had some
employment income by wave 3. On the other hand, 20.3% of RS households with dependent children
and employment income at wave 1 had no employment income at wave 3. In the FBiH, 11.2% had
shifted into having no employment income.
Table 5.5 Households with dependent children by whether have any employment income - Waves 1 and
3 by entity Wave 1 Wave 3 Has employment
income %
No employment income
% RS
Has employment income 79.7 33.3 No employment income 20.3 66.7
N 246 60 FBiH
Has employment income 88.8 45.1 No employment income 11.2 54.9
N 329 153
Once again there was a clear relationship between levels of income for households with dependent
children and the level of education of the head of the household (Table 5.6 ). Almost half (44.3%) of
households with dependent children where the head of the household had no qualifications had no
income from employment. In contrast, just 5.6% of households with dependent children, where the
head of household had a university level qualification, had no income from employment. The level of
education affects not only individual well-being and position in the labour market but has a wider
impact on the well-being of dependent children living in their households.
Table 5.6 Proportion of households with dependent children and no employment income, by level of
education of head of household – All BiH No
diploma Primary
school certificate
Secondary school
certificate
Junior college
University
Employment income 55.7 69.1 79.7 75.0 94.4 No employment income 44.3 30.9 20.3 25.0 5.6 As well as factual information on income, respondents were also asked a series of subjective
questions about their financial situation and expectations. Respondents were first asked how well
they thought they were managing financially. They were then asked whether they thought they were
better off financially than one year ago, worse off or about the same as one year ago. Finally they
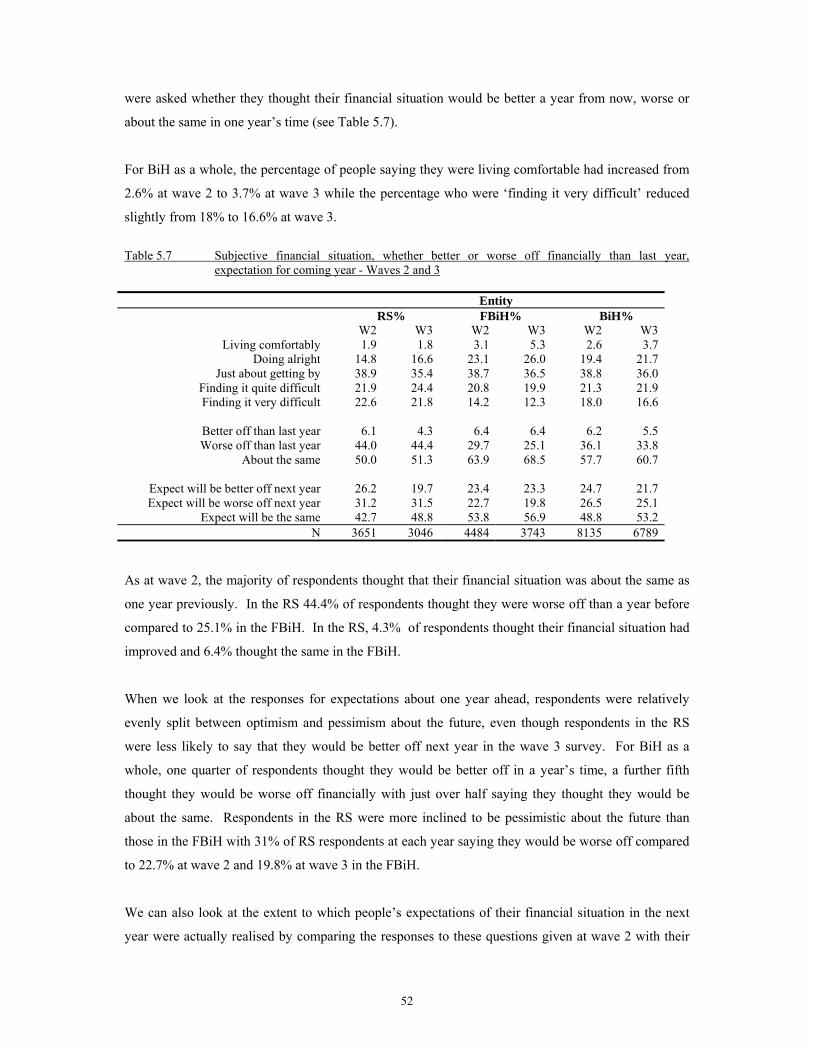
52
were asked whether they thought their financial situation would be better a year from now, worse or
about the same in one year’s time (see Table 5.7).
For BiH as a whole, the percentage of people saying they were living comfortable had increased from
2.6% at wave 2 to 3.7% at wave 3 while the percentage who were ‘finding it very difficult’ reduced
slightly from 18% to 16.6% at wave 3.
Table 5.7 Subjective financial situation, whether better or worse off financially than last year,
expectation for coming year - Waves 2 and 3 Entity RS% FBiH% BiH%
W2 W3 W2 W3 W2 W3 Living comfortably 1.9 1.8 3.1 5.3 2.6 3.7
Doing alright 14.8 16.6 23.1 26.0 19.4 21.7 Just about getting by 38.9 35.4 38.7 36.5 38.8 36.0
Finding it quite difficult 21.9 24.4 20.8 19.9 21.3 21.9 Finding it very difficult 22.6 21.8 14.2 12.3 18.0 16.6
Better off than last year 6.1 4.3 6.4 6.4 6.2 5.5 Worse off than last year 44.0 44.4 29.7 25.1 36.1 33.8
About the same 50.0 51.3 63.9 68.5 57.7 60.7
Expect will be better off next year 26.2 19.7 23.4 23.3 24.7 21.7 Expect will be worse off next year 31.2 31.5 22.7 19.8 26.5 25.1
Expect will be the same 42.7 48.8 53.8 56.9 48.8 53.2 N 3651 3046 4484 3743 8135 6789
As at wave 2, the majority of respondents thought that their financial situation was about the same as
one year previously. In the RS 44.4% of respondents thought they were worse off than a year before
compared to 25.1% in the FBiH. In the RS, 4.3% of respondents thought their financial situation had
improved and 6.4% thought the same in the FBiH.
When we look at the responses for expectations about one year ahead, respondents were relatively
evenly split between optimism and pessimism about the future, even though respondents in the RS
were less likely to say that they would be better off next year in the wave 3 survey. For BiH as a
whole, one quarter of respondents thought they would be better off in a year’s time, a further fifth
thought they would be worse off financially with just over half saying they thought they would be
about the same. Respondents in the RS were more inclined to be pessimistic about the future than
those in the FBiH with 31% of RS respondents at each year saying they would be worse off compared
to 22.7% at wave 2 and 19.8% at wave 3 in the FBiH.
We can also look at the extent to which people’s expectations of their financial situation in the next
year were actually realised by comparing the responses to these questions given at wave 2 with their

53
wave 3 income levels. Table 5.8 shows individual mean income levels at wave 3 by people’s
expectations at wave 2.
Table 5.8: Wave 2 expectations and Wave 3 mean income (individual)
Entity RS mean income FBiH mean income
Expectations at Wave 2
W2 W3 W2 W3
Better off 158.61 156.53 225.82 254.24 Worse off 112.47 96.37 179.74 197.16
About the same 154.50 149.14 207.28 225.21 In some respects, people’s expectations were fulfilled but in others they were not. In the RS, those
who thought they would be better off had around the same mean incomes at wave 3 as at wave 2.
Those who predicted they would be worse off seem to have been quite realistic in their prediction,
with mean income levels falling by wave 3. And those who though they would remain about the same
did remain around the same with just a slight fall in mean income levels. In the FBiH, mean income
levels increased by wave 3 regardless of whether people said they thought they would be better off,
worse off or the same in a year’s time.

54
6. Poverty dynamics Key Findings
Using a definition of poverty as two-thirds of median income we can construct a poverty
threshold for BiH. At wave 3, 34.7% of households in BiH were in poverty by our definition,
46.4% in the RS and 25.3% in the FBiH.
Household composition has a significant effect on the likelihood of being in poverty with
female headed households being more likely to be poor than male headed households.
5.2% of households with dependent children and some employment income were under the
poverty threshold, over two-thirds (67.8%) of households with dependent children and no
employment income were in poverty.
29.6% of children aged under fifteen in the RS and 17.1% of children in the FBiH were living
in poverty at wave 3.
There is a good deal of movement around the poverty threshold with just three-fifths of
households were on the same side of the poverty threshold at all three waves.
Over two-fifths (44.3%) of households in BiH never went below the poverty threshold over the
three year period; 35.9% in the RS and 50.9% in the FBiH. By contrast, 16.7% of households
were always under the threshold; 21.7% in the RS and 12.8% in the FBiH.
Age, employment status, marital status and level of education were all associated with levels
of poverty over the three years.
Those with any form of educational qualification, those who were married and those who had
moved in the last year were significantly less likely to fall into poverty.
Being married had a positive effect on moving out of poverty compared to those who are
never married. Any level of education and in particular a university level qualification in the
FBiH significantly improved the likelihood of moving out of poverty.

55
One of the strengths of longitudinal panel data is the ability to observe transitions between states over
time for individuals and households. A major use of panel data in other countries has been in poverty
research where movements into and out of poverty, together with the characteristics of those making
these shifts, can be analysed.
It is typically the case that poverty levels, however they are defined, tend to remain fairly stable at the
aggregate level over time. That is, the percentage of households or individuals at a given point in
time will tend to look similar year on year. A common finding with panel data however, is that there
is a good deal of movement into and out of poverty over time for individuals. In other words, many
people are not in long term permanent poverty but hover around the poverty line, at some points in
time being in poverty and at others just out of poverty. This phenomenon has been termed as
‘churning’ at the bottom of the income distribution.3
There are many debates about what constitutes an appropriate measure of poverty and differing views
about how a poverty line should be defined. For the purposes of the analysis reported in this section
we use a definition which is often employed for this type of analysis. This defines as being in poverty
those households whose income is less than two thirds of the median income for the population. In
the tables which follow, we have used the median income for BiH as whole rather than for each entity
as this allows us to examine poverty across the whole population and make comparisons between
entities using a common baseline.
Poverty threshold
Using the definition of poverty as two-thirds of median income we can construct a poverty indicator
for BiH. The median income at wave 3 is 331.67 KM per month, so the poverty threshold is 221.11
KM per month. In total, 34.7% of households in BiH at wave 3 were under this threshold so were in
poverty by our definition. There is a marked difference between entities, however. In the RS 46.4%
of households live under this threshold, compared to 25.3% in the FBiH.
Household composition has a significant effect on the likelihood of being in poverty. Half of the
households with a female head of household are under the poverty threshold compared to 29.3% of
those with a male head of household. This difference holds across entities: 63.8% of female-headed
households in the RS and 39.8% in the FBiH were below the threshold, compared to 40.9% and
19.8% of male-headed households.
3 See for example Jarvis, S. and Jenkins, S. (1995) ‘Do the poor stay poor? New evidence about income dynamics from the British Household Panel Survey’ Occasional paper 95-2, ISER, University of Essex.
56
The lack of employment income is also significant for levels of poverty in both entities. Whilst just
5.2% of households with dependent children and some employment income were under the poverty
threshold, over two-thirds (67.8%) of households with dependent children and no employment income
were in poverty. This proportion is worse in the RS (85.4% of households with children and no
employment income) than the FBiH (55%). The proportion of households with children in poverty
clearly will have a long term impact on the life chances of those children. When we look at all
children aged under 15 in each entity, 29.6% of children in the RS and 17.1% of children in the FBiH
were living in poverty at wave 3.
Table 6.1 shows the proportion of households under the poverty threshold for each of waves 1 to 3 by
entity. At all three years, the RS has a higher proportion of households in poverty than the FBiH. In
the RS, the percentage of households in poverty has remained fairly stable over the three years,
ranging from between 43.5% at wave 1, rising to 48.1% at wave 2 and falling again to 46.4% by wave
3. In the FBiH the pattern is somewhat different. At wave 1, 33.4% of households were in poverty,
and as with the RS we see a rise in poverty levels at wave 2 with 35.2% of households under the
threshold. At wave 3 there is a steep decline in the proportion under the threshold, down to 25.3% of
households.
Table 6.1 Proportion of households under the poverty threshold, Waves 1 - 3
Entity RS % FBiH % W1 W2 W3 W1 W2 W3
In poverty 43.5 48.1 46.4 33.4 35.2 25.3 N 1005 1164 1165 1276 1439 1441 Table 6.2 shows the transitions across the poverty threshold over the three year period4. As has been
found by other panel surveys, there is a good deal of movement around the poverty threshold. Just
three-fifths of households were on the same side of the poverty threshold at all three waves. Over two-
fifths (44.3%) of households in BiH never went below the poverty threshold over the three year
period; 35.9% in the RS and 50.9% in the FBiH. By contrast, 16.7% of households were always under
the threshold; 21.7% in the RS and 12.8% in the FBiH. There were some one-way moves into and out
of poverty during the three waves of the survey. Just over one in ten households (10.6%) moved into
poverty after wave one whilst 17.5% of households exited poverty after wave one. There were also
some households who moved from one side of the threshold to the other and back again: 3.6% of
households exited poverty in wave two and re-entered at wave three whilst 7.3% entered poverty at
wave 2 and exited at wave three.
57
Table 6.2 Poverty transitions across all three waves
Entity RS
% FBiH
% Always in poverty 21.7 12.8 Never in poverty 35.9 50.9 Exit poverty after wave 1 17.0 18.0 Enter poverty after wave 1 15.2 7.0 Enter then exit poverty 5.6 8.7 Exit then re-enter poverty 4.8 2.7 N 1004 1277 Table 6.3 shows the proportion of households and individuals who were under the poverty threshold
at each wave (first two rows). It also looks at the characteristics of those who were in poverty at each
year. So for example in the RS 36.3% of men were under the poverty threshold at wave 1, compared
to 38.4% of women at the same time.
A higher proportion of those aged 55 and over were in poverty at each year of the survey, something
which holds across entities even though the levels of poverty are higher in the RS than in the FBiH.
Interestingly, home ownership does not necessarily reduce levels of poverty, suggesting that housing
wealth does not necessarily reflect income levels.
Employment status is significant across the three years. Even though they are working, those who are
self-employed do not have reduced chances of being in poverty but being an employee does reduce
the chances of being in poverty. The unemployed, pensioners, those who are unable to work due to
ill-health, housewives and in the RS, those who work in a family business are more likely to be in
poverty.
Widows, and the divorced or separated were more likely than those in other marital situations to be in
poverty at each year, something which is in line with the effects of age and household composition
noted earlier.
Finally, those with no qualifications are more likely to be poor than those with higher level
qualifications, again highlighting the importance of education for improving living standards and
longer term life chances.
4 For this analysis any movement above or below the poverty threshold is included. There are therefore many short distance moves where a relatively small increase or decrease in income can move someone either above or below the threshold.

58
Table 6.3 Proportions under the poverty threshold
Entity RS % FBiH % W1 W2 W3 W1 W2 W3
In poverty (households) 43.5 48.1 46.4 33.4 35.2 25.3 In poverty (individuals) 37.7 42.0 39.0 26.7 29.9 19.7
Sex Male 36.3 40.1 37.9 25.1 27.9 18.8
Female 38.4 43.0 40.8 28.1 29.9 21.1 Age
15-24 32.1 37.5 33.2 21.4 26.8 17.4 25-34 30.2 36.5 32.2 21.7 26.1 15.5 35-44 36.4 32.4 32.5 21.2 22.4 16.6 45-54 32.6 38.2 33.9 22.5 25.8 17.4 55-64 40.4 49.1 46.2 38.6 40.5 26.9
65+ 54.8 60.9 61.0 46.6 43.9 28.9 Housing tenure
Own 38.1 43.5 39.8 25.8 29.2 18.4 Rent 28.3 31.4 25.1 21.2 24.0 18.8
Temporary occupant 38.2 32.4 38.1 27.1 20.5 28.4 Rent-free 26.2 43.2 32.0 38.8 34.0 33.0
Other 67.6 40.4 58.5 34.0 42.6 22.5 Employment status
Employee 21.4 19.3 15.5 10.1 11.9 6.2 Self-employed 29.4 48.9 47.5 13.8 14.0 12.3
Seasonal/temporary 28.0 33.3 31.6 12.5 35.1 10.0 Family business 29.5 64.5 48.1 25.0 26.2 18.0
Housewife 45.8 54.7 52.8 34.0 37.9 23.8 Student 30.7 31.9 26.8 18.9 25.0 13.6
Pensioner 49.9 45.8 47.2 43.8 41.9 25.7 Unemployed 48.2 53.6 51.7 35.4 43.1 36.0
Incapable 63.2 67.1 59.6 52.2 20.6 25.0 Marital status
Single 35.4 37.2 34.9 23.5 24.1 17.3 Married 36.1 40.7 36.7 26.5 30.0 18.1
Co-habiting 33.3 35.3 34.1 36.4 50.0 3.2 Widow/er 52.1 61.0 58.3 42.1 42.2 36.0
Divorced/separated 33.3 54.8 45.1 45.1 34.9 29.6 Education level
None 41.9 54.9 51.5 35.4 37.0 27.2 Primary school certificate 44.4 47.0 44.2 31.8 31.5 21.2
Secondary school certificate 31.9 32.7 29.5 21.2 25.2 14.6 Junior college 21.6 17.0 20.0 14.5 14.3 12.7
University 5.1 4.8 12.8 4.5 10.7 14.9 We can also model the likelihood of moving into or out of poverty. Table 6.4 shows the results of a
logistic regression analysis to model transitions into poverty over the period. Using those who were
not in poverty at wave 1 as the baseline, respondents with any form of educational qualification were
significantly less likely to fall into poverty compared to those with no qualifications. The higher the
level of education, the less likely it was for them to make the transition into poverty.
Marital status was also a significant predictor. Compared to the never married, married respondents
were less likely to fall into poverty as were those who were cohabiting, even though the coefficient

59
for cohabitees is not statistically significant. Widows and widowers in the RS were statistically less
likely to fall into poverty than the never married but the reverse is the case in the FBiH where widows
and widowers were more likely to fall into poverty. Those who had moved in the past year were less
likely to fall into poverty than those who had not moved, possibly suggesting that those who are able
to move address are on the whole more affluent. Table 6.4 Logistic regression modelling transitions into poverty
BiH RS FBiH
B S.E. B S.E B S.EMale -.060 .146 -.319 .185 .199 .281Age .045 .023 .077+ .031 -.031 .042Age-squared .000 .000 -.001 .000 .000 .000Married -.568* .204 -1.239** .261 .822 .446Cohabiting -1.912 1.258 -2.251 1.273 -3.165 9.830Widow/er -.478 .273 -1.233** .369 1.410+ .562Divorced/separated -.374 .510 -.986 .593 .520 1.197Primary educ. -.578* .182 -.595* .232 -.439 .356Secondary educ. -1.168** .187 -1.259** .239 -.682 .358College educ. -1.902** .509 -2.575** .743 -.643 .732University educ. -1.581** .406 -3.745* 1.239 .298 .508Has chronic disease .254 .147 .170 .183 .096 .291Displaced resident -.501 .305 .068 .411 -.548 .502Temporary resident .120 .173 -.332 .205 .024 .385Moved in last year -1.327* .425 -1.667** .515 -.966 .775Self-employed .204 .318 .197 .379 .112 .679Temporary worker .305 .450 .307 .534 .052 .991Family enterprise .698 .369 -.212 .453 1.427 .759Looking after house -.225 .220 -.345 .283 .514 .401Student .116 .304 .105 .380 .738 .585Pensioner -.025 .224 .254 .286 -.047 .437Unemployed .027 .213 -.183 .274 .681 .375Incapable of work -.142 .443 -.073 .550 -.672 1.343Constant -2.459 .582 -1.981 .755 -3.010 1.033R2 0.081 0.169 0.041
N 4126 1714 2412 NOTE: sample is all those not in poverty at wave 1. ** Sig .001 * Sig .01 + Sig .05 Table 6.5 shows the opposite model and predicts transitions out of poverty. In this case being married
had a positive effect on moving out of poverty compared to those who are never married. Any level
of education and in particular a university level qualification in the FBiH significantly improved the
likelihood of moving out of poverty.
60
Table 6.5 Logistic regression modelling transitions out of poverty
BiH RS FBiH
B S.E. B S.E B S.EMale -.113 .129 .024 .179 -.378 .203Age -.028 .021 -.039 .030 -.012 .031Age-squared .000 .000 .000 .000 .000 .000Married .532* .176 .498+ .248 .699* .269Cohabiting .685 .496 .007 .683 2.191+ .862Widow/er .198 .246 .439 .358 .016 .354Divorced/separated -.024 .430 -.511 .812 .034 .541Primary educ. .620** .167 .631+ .258 .778** .232Secondary educ. 1.018** .170 1.139** .271 1.107** .231College educ. 1.847** .371 2.108** .529 1.911** .546University educ. 2.125* .691 1.748 1.054 2.849* .975Has chronic disease -.196 .130 -.367 .190 -.079 .187Displaced resident -.277 .187 -.140 .299 -.446 .248Temporary resident .237 .138 .452+ .177 .314 .246Moved in last year .308 .225 -.022 .274 1.218* .429Self-employed .086 .366 -.010 .464 .310 .667Temporary worker .214 .509 .056 .623 .826 1.059Family enterprise -.006 .483 .553 .551 -1.623 1.283Looking after house .238 .209 .529 .297 -.414 .323Student .593+ .297 .902+ .414 .227 .447Pensioner .202 .206 .477 .295 -.393 .312Unemployed -.153 .181 -.124 .243 -.320 .289Incapable of work .720+ .332 .703 .496 .449 .480Constant -.765 .510 -1.056 .721 -.661 .756R2 0.119 0.125 0.170
N 1969 1022 946 NOTE: sample is all those in poverty at wave 1. ** Sig .001 * Sig .01 + Sig .05

61
7. Health Key Findings
35% of respondents described their own health compared to others of their own age as fair,
and a further 40% described their health as good or excellent. Just under one fifth said that
their health was poor and only 5% said it was very poor.
Half of those whose health was poor at wave 2 reported improved health and 38.8% of those
with very poor health reported being in this category at wave 3.
The majority of respondents (79.8%) had some form of health insurance, even though those in
the FBiH were more likely to have this than those in the RS. In both entities, the proportion
of respondents with health insurance had increased slightly since 2002, by 3.2% in the FBiH
and 2.5% in the RS.
In total 6.6% of respondents considered themselves to be disabled. The disabled were less
likely to be either in employment or unemployed and more likely to be out of the labour
market than able bodied respondents.
One-third of respondents said they had smoked in the last seven days. The proportion is
slightly higher in the FBiH (33.4%) than in the RS (30.3%) and men were more likely than
women to be smokers.
Around a quarter of those who were smoking at wave 2 had given up by wave 3 while one-
eighth of those who were non-smokers at wave 2 had taken up smoking a year later.
Respondents in the RS suffered from higher levels of psychological stress than those in the
FBiH.
Women reported higher levels of stress than men, possibly due to a greater willingness for
women to admit to such feelings than men.
Levels of psychological stress increased with age.
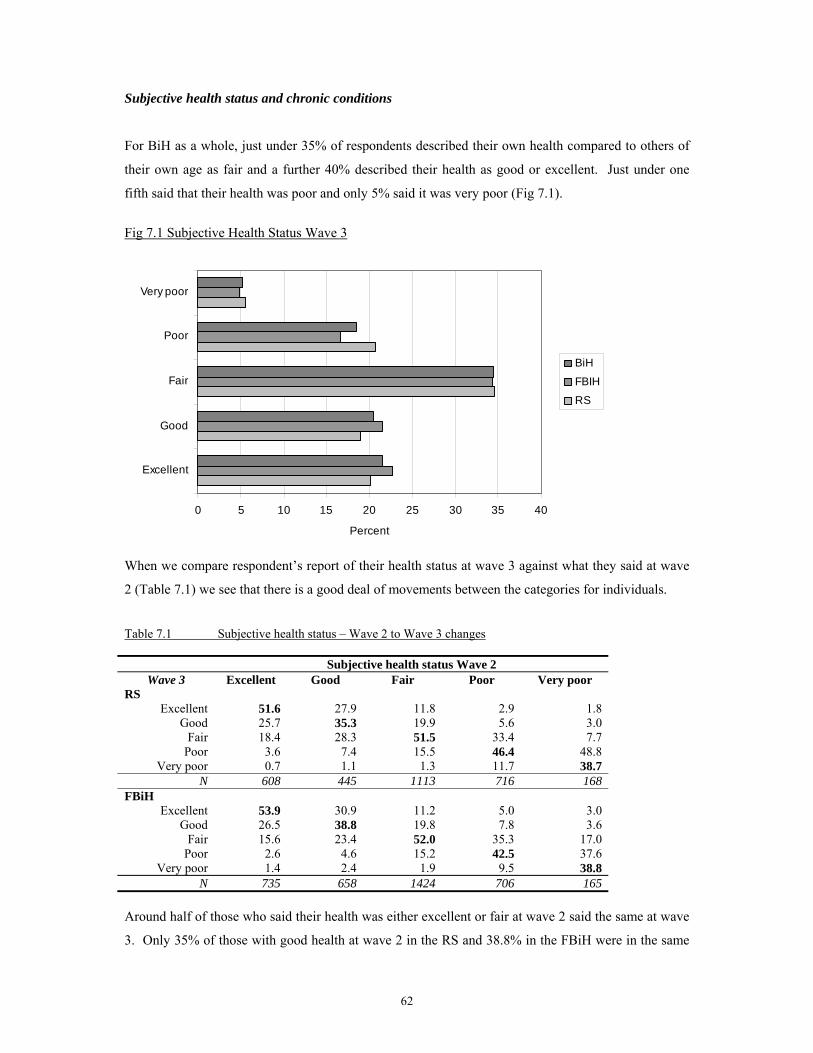
62
Subjective health status and chronic conditions
For BiH as a whole, just under 35% of respondents described their own health compared to others of
their own age as fair and a further 40% described their health as good or excellent. Just under one
fifth said that their health was poor and only 5% said it was very poor (Fig 7.1).
Fig 7.1 Subjective Health Status Wave 3
0 5 10 15 20 25 30 35 40
Excellent
Good
Fair
Poor
Very poor
Percent
BiH
FBIH
RS
When we compare respondent’s report of their health status at wave 3 against what they said at wave
2 (Table 7.1) we see that there is a good deal of movements between the categories for individuals.
Table 7.1 Subjective health status – Wave 2 to Wave 3 changes
Subjective health status Wave 2 Wave 3 Excellent Good Fair Poor Very poor
RS Excellent 51.6 27.9 11.8 2.9 1.8
Good 25.7 35.3 19.9 5.6 3.0 Fair 18.4 28.3 51.5 33.4 7.7
Poor 3.6 7.4 15.5 46.4 48.8 Very poor 0.7 1.1 1.3 11.7 38.7
N 608 445 1113 716 168 FBiH
Excellent 53.9 30.9 11.2 5.0 3.0 Good 26.5 38.8 19.8 7.8 3.6
Fair 15.6 23.4 52.0 35.3 17.0 Poor 2.6 4.6 15.2 42.5 37.6
Very poor 1.4 2.4 1.9 9.5 38.8 N 735 658 1424 706 165
Around half of those who said their health was either excellent or fair at wave 2 said the same at wave
3. Only 35% of those with good health at wave 2 in the RS and 38.8% in the FBiH were in the same
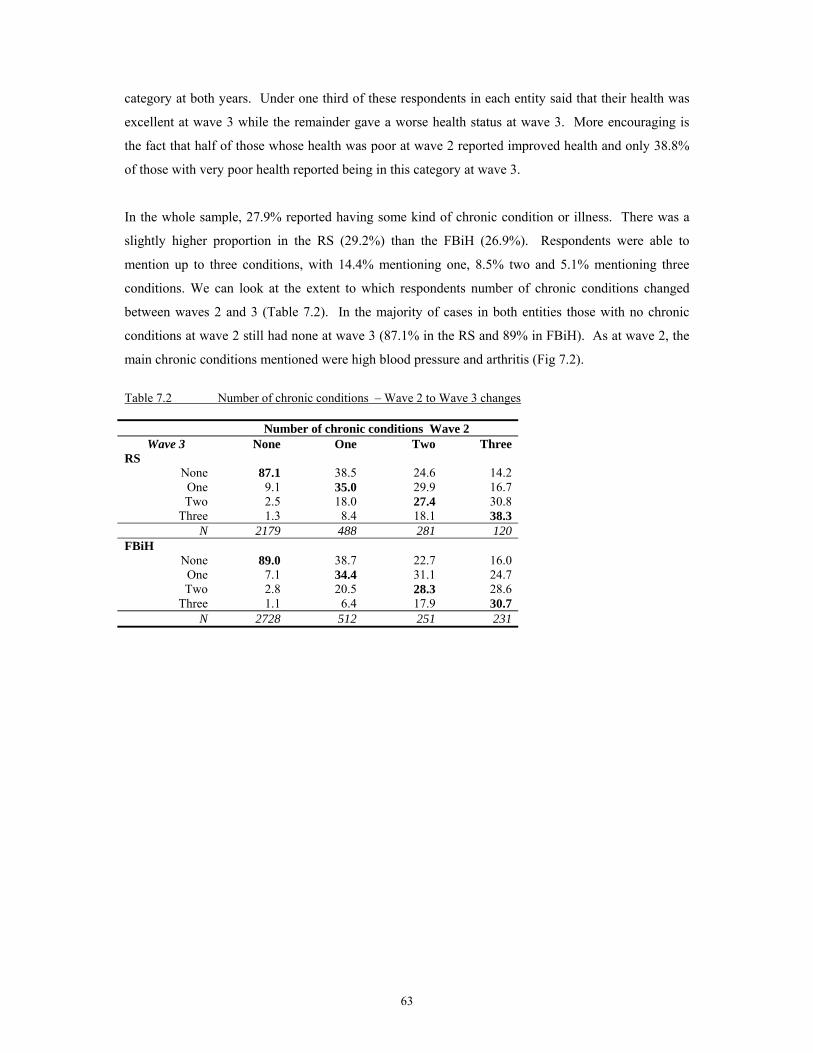
63
category at both years. Under one third of these respondents in each entity said that their health was
excellent at wave 3 while the remainder gave a worse health status at wave 3. More encouraging is
the fact that half of those whose health was poor at wave 2 reported improved health and only 38.8%
of those with very poor health reported being in this category at wave 3.
In the whole sample, 27.9% reported having some kind of chronic condition or illness. There was a
slightly higher proportion in the RS (29.2%) than the FBiH (26.9%). Respondents were able to
mention up to three conditions, with 14.4% mentioning one, 8.5% two and 5.1% mentioning three
conditions. We can look at the extent to which respondents number of chronic conditions changed
between waves 2 and 3 (Table 7.2). In the majority of cases in both entities those with no chronic
conditions at wave 2 still had none at wave 3 (87.1% in the RS and 89% in FBiH). As at wave 2, the
main chronic conditions mentioned were high blood pressure and arthritis (Fig 7.2).
Table 7.2 Number of chronic conditions – Wave 2 to Wave 3 changes
Number of chronic conditions Wave 2 Wave 3 None One Two Three
RS None 87.1 38.5 24.6 14.2
One 9.1 35.0 29.9 16.7 Two 2.5 18.0 27.4 30.8
Three 1.3 8.4 18.1 38.3 N 2179 488 281 120
FBiH None 89.0 38.7 22.7 16.0
One 7.1 34.4 31.1 24.7 Two 2.8 20.5 28.3 28.6
Three 1.1 6.4 17.9 30.7 N 2728 512 251 231
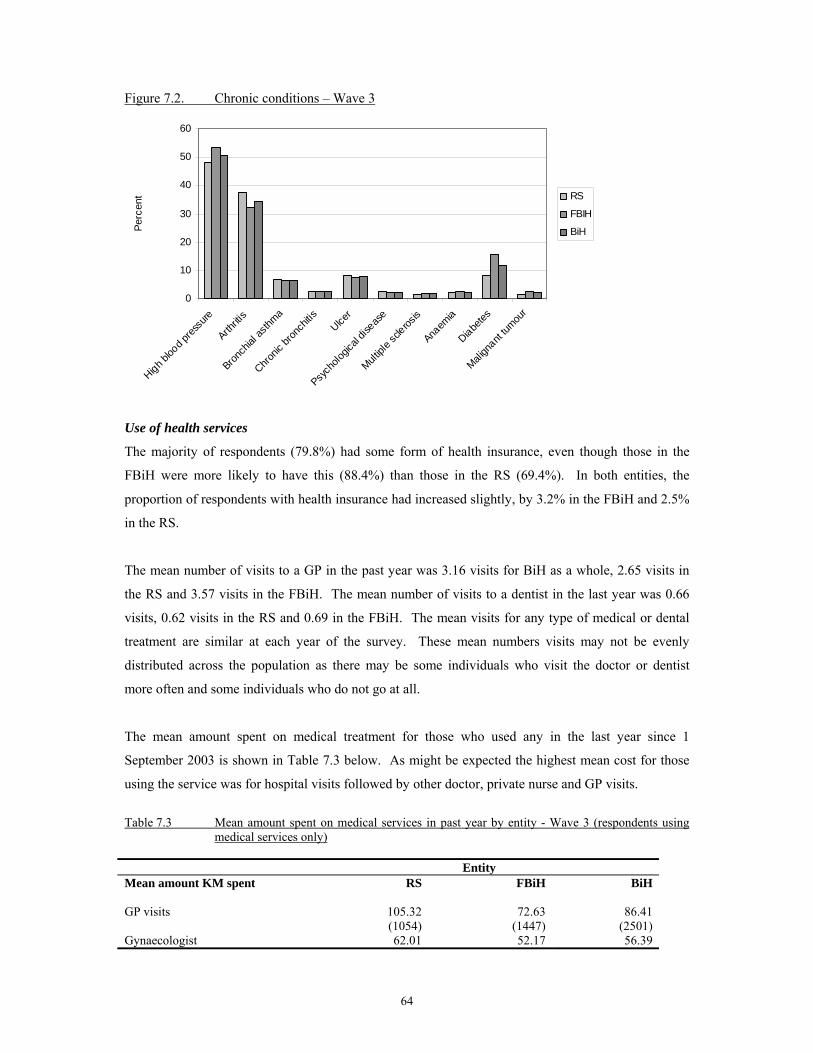
64
Figure 7.2. Chronic conditions – Wave 3
0
10
20
30
40
50
60
High bloo
d pres
sure
Arthriti
s
Bronch
ial as
thma
Chronic
bron
chitis
Ulcer
Psych
ologic
al dis
ease
Multipl
e scle
rosis
Anaem
ia
Diabetes
Malign
ant tum
our
Perc
ent RS
FBIH
BiH
Use of health services
The majority of respondents (79.8%) had some form of health insurance, even though those in the
FBiH were more likely to have this (88.4%) than those in the RS (69.4%). In both entities, the
proportion of respondents with health insurance had increased slightly, by 3.2% in the FBiH and 2.5%
in the RS.
The mean number of visits to a GP in the past year was 3.16 visits for BiH as a whole, 2.65 visits in
the RS and 3.57 visits in the FBiH. The mean number of visits to a dentist in the last year was 0.66
visits, 0.62 visits in the RS and 0.69 in the FBiH. The mean visits for any type of medical or dental
treatment are similar at each year of the survey. These mean numbers visits may not be evenly
distributed across the population as there may be some individuals who visit the doctor or dentist
more often and some individuals who do not go at all.
The mean amount spent on medical treatment for those who used any in the last year since 1
September 2003 is shown in Table 7.3 below. As might be expected the highest mean cost for those
using the service was for hospital visits followed by other doctor, private nurse and GP visits.
Table 7.3 Mean amount spent on medical services in past year by entity - Wave 3 (respondents using
medical services only) Entity Mean amount KM spent RS FBiH BiH GP visits
105.32 (1054)
72.63
(1447)
86.41
(2501) Gynaecologist 62.01 52.17 56.39
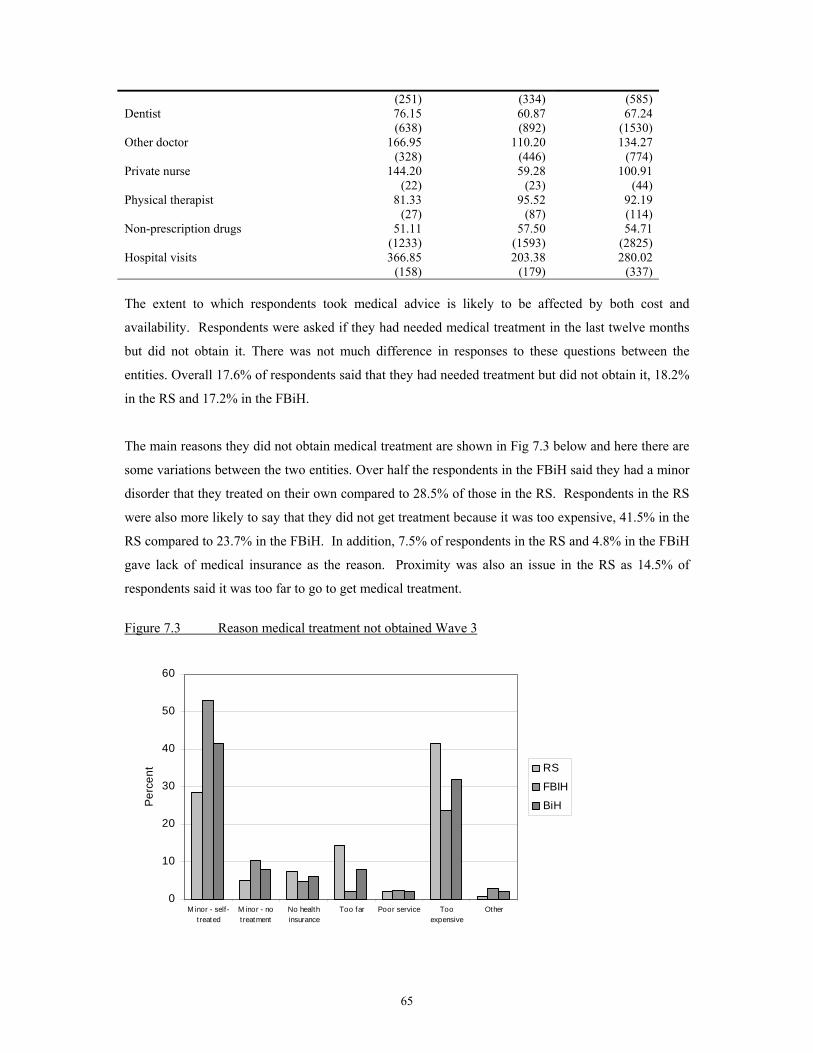
65
(251) (334) (585) Dentist 76.15
(638) 60.87 (892)
67.24 (1530)
Other doctor 166.95 (328)
110.20 (446)
134.27 (774)
Private nurse 144.20 (22)
59.28 (23)
100.91 (44)
Physical therapist 81.33 (27)
95.52 (87)
92.19 (114)
Non-prescription drugs 51.11 (1233)
57.50 (1593)
54.71 (2825)
Hospital visits 366.85 (158)
203.38 (179)
280.02 (337)
The extent to which respondents took medical advice is likely to be affected by both cost and
availability. Respondents were asked if they had needed medical treatment in the last twelve months
but did not obtain it. There was not much difference in responses to these questions between the
entities. Overall 17.6% of respondents said that they had needed treatment but did not obtain it, 18.2%
in the RS and 17.2% in the FBiH.
The main reasons they did not obtain medical treatment are shown in Fig 7.3 below and here there are
some variations between the two entities. Over half the respondents in the FBiH said they had a minor
disorder that they treated on their own compared to 28.5% of those in the RS. Respondents in the RS
were also more likely to say that they did not get treatment because it was too expensive, 41.5% in the
RS compared to 23.7% in the FBiH. In addition, 7.5% of respondents in the RS and 4.8% in the FBiH
gave lack of medical insurance as the reason. Proximity was also an issue in the RS as 14.5% of
respondents said it was too far to go to get medical treatment.
Figure 7.3 Reason medical treatment not obtained Wave 3
0
10
20
30
40
50
60
M inor - self-treated
M inor - notreatment
No healthinsurance
Too far Poor service Tooexpensive
Other
Per
cent RS
FBIH
BiH
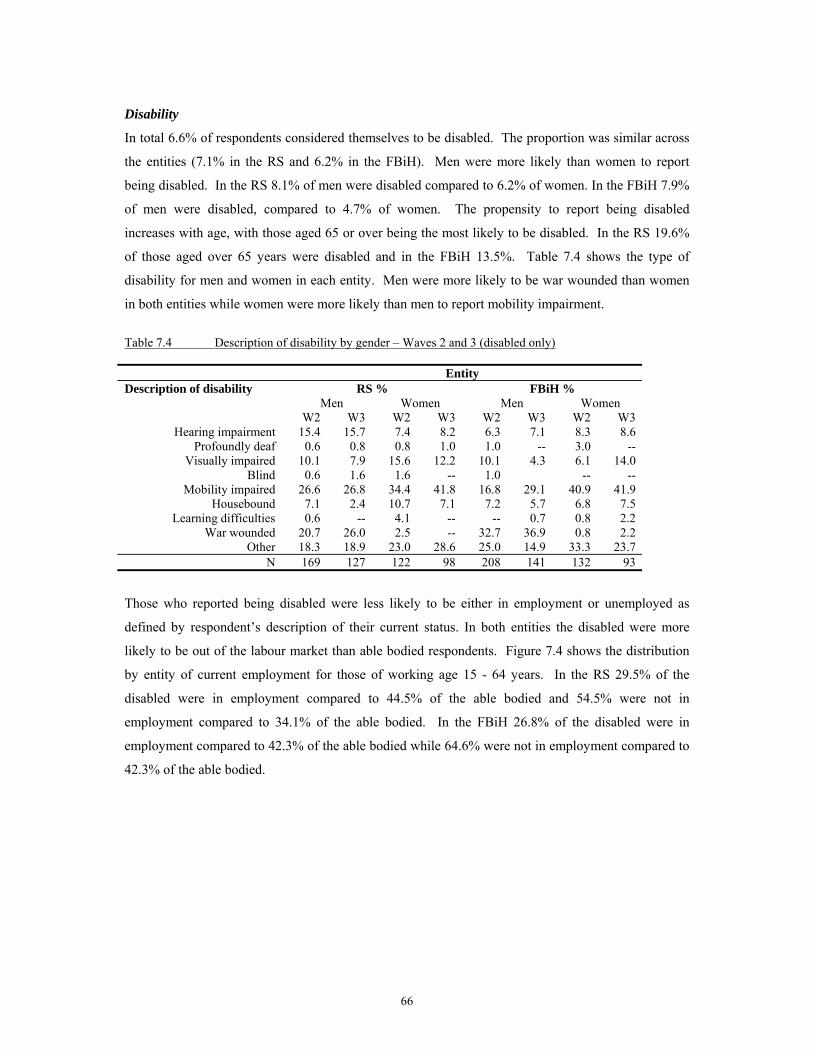
66
Disability
In total 6.6% of respondents considered themselves to be disabled. The proportion was similar across
the entities (7.1% in the RS and 6.2% in the FBiH). Men were more likely than women to report
being disabled. In the RS 8.1% of men were disabled compared to 6.2% of women. In the FBiH 7.9%
of men were disabled, compared to 4.7% of women. The propensity to report being disabled
increases with age, with those aged 65 or over being the most likely to be disabled. In the RS 19.6%
of those aged over 65 years were disabled and in the FBiH 13.5%. Table 7.4 shows the type of
disability for men and women in each entity. Men were more likely to be war wounded than women
in both entities while women were more likely than men to report mobility impairment.
Table 7.4 Description of disability by gender – Waves 2 and 3 (disabled only)
Entity Description of disability RS % FBiH % Men Women Men Women
W2 W3 W2 W3 W2 W3 W2 W3 Hearing impairment 15.4 15.7 7.4 8.2 6.3 7.1 8.3 8.6
Profoundly deaf 0.6 0.8 0.8 1.0 1.0 -- 3.0 -- Visually impaired 10.1 7.9 15.6 12.2 10.1 4.3 6.1 14.0
Blind 0.6 1.6 1.6 -- 1.0 -- -- Mobility impaired 26.6 26.8 34.4 41.8 16.8 29.1 40.9 41.9
Housebound 7.1 2.4 10.7 7.1 7.2 5.7 6.8 7.5 Learning difficulties 0.6 -- 4.1 -- -- 0.7 0.8 2.2
War wounded 20.7 26.0 2.5 -- 32.7 36.9 0.8 2.2 Other 18.3 18.9 23.0 28.6 25.0 14.9 33.3 23.7
N 169 127 122 98 208 141 132 93
Those who reported being disabled were less likely to be either in employment or unemployed as
defined by respondent’s description of their current status. In both entities the disabled were more
likely to be out of the labour market than able bodied respondents. Figure 7.4 shows the distribution
by entity of current employment for those of working age 15 - 64 years. In the RS 29.5% of the
disabled were in employment compared to 44.5% of the able bodied and 54.5% were not in
employment compared to 34.1% of the able bodied. In the FBiH 26.8% of the disabled were in
employment compared to 42.3% of the able bodied while 64.6% were not in employment compared to
42.3% of the able bodied.

67
Fig 7.4 Whether disabled by employment, Wave 3
Smoking behaviour
At wave 3, around one-third of respondents said they had smoked in the last seven days. The
proportion is slightly higher in the FBiH (33.4%) than in the RS (30.3%) and men were more likely
than women to be smokers. In the RS 39.7% of men smoked compared to 21.2% of women. In the
FBiH 45.6% of men smoked, compared to 22.3% of women (Fig 7.5).
Figure 7.5 Mean number of cigarettes smoked in the last seven days by gender (all sample)
0 20 40 60 80
RS
FBIH
BiH
Mean number of cigarettes
Women
Men
0
10
20
30
40
50
60
70
RS disabled RS notdisabled
FBIHdisabled
FBIH notdisabled
Percent Unemployed Employed Not in employment

68
When we look at those who smoke only, smokers tended, on average, to be heavy smokers with the
mean number of cigarettes smoked in the last seven days being 145 (almost 21 per day) in the RS and
135 (19 per day) in the FBiH. Fig 7.6 shows the mean number of cigarettes smoked in the last seven
days by gender for smokers only. Men are still heavier smokers, on average, than women smokers
but the gap is not as large as for the whole population. Men smoked an average of 151 cigarettes in
the last week (almost 22 per day) compared to 118 for women (almost 17 per day).
Figure 7.6 Mean number of cigarettes smoked in the last seven days by gender (smokers only)
0 25 50 75 100 125 150 175
RS
FBIH
BiH
Mean number of cigarettes
Women
Men
As the same individuals have been interviewed at each year of the survey, we can observe changes in
smoking behaviour over the two year period. So we can see what proportion of smokers continued
smoking, what proportion gave up smoking and what proportion of non-smokers started smoking over
that period.
Table 7.5 shows respondents wave 2 smoking status by their wave 3 status. In total, around a quarter
of those who were smoking at wave 2 had given up by wave 3 (25.6%). Around one-eighth of those
who were non-smokers at wave 2 had taken up smoking a year later (12.6%). The rates of taking up
and giving up smoking are similar for both entities even though the rate of taking up smoking is
slightly higher in the FBiH (14.1%) than in the RS (10.8%).
Table 7.5 Wave 2 smoking status by wave 3 status
Wave 2 smoking status RS FBIH
Wave 3 Smoker Non-smoker Smoker Non-smoker Smoker 74.2 10.8 74.6 14.1
Non-smoker 25.8 89.2 25.4 85.9 n 925 2098 1237 2400

69
Of those men who smoked at wave 2, 23.6% had given up by wave 3. The proportion of women who
gave up smoking in between waves 2 and 3 is slightly higher, at 29.6%. Looking at those who were
non-smokers at wave 2, men were more likely to have taken up smoking by wave 3: 17.7% of male
non-smokers were smoking a year later compared to just 9.2% of female non-smokers. There was
almost no difference in the rate of giving up between the RS and the FBiH. However, both men and
women in the FBiH were more likely to take-up smoking compared to those in the RS (Fig 7.7).
Fig 7.7 Giving up and taking up smoking between waves 2 and 3 by gender.
0
5
10
15
20
25
30
35
RS men RS women FBIH men FBIH women
Per
cent give up
take up
The proportion of smokers who gave up between waves 2 and 3 generally increases with age. Around
23 percent of those smokers aged 25-54 gave up compared to 27.8% of those aged 55-64 and 32.7%
of those aged 65 or more.
The proportion of people taking up smoking decreases with age, from 18.9% of those non-smokers
aged 25-34 to 8.2% of those aged 65 or more. Around one-fifth of smokers who were in employment
gave up smoking, compared to around a third of smokers who were a housewife, student, pensioner or
unemployed. Around a fifth of non-smokers who were employed or self-employed took up smoking
compared to just 7.4% of housewives, 6.6% of students and 10.2% of pensioners. Of the non-
employed groups, the unemployed were the most likely to start smoking (16.3%).
Psychological well-being
Respondents at wave 3 were asked a series of questions about their psychological well-being during
the last week. These were:
During the last week did you……
accuse yourself for different things

70
have problems falling asleep or sleeping
feel hopeless in terms of the future
feel melancholic
worried too much about different things
feel that everything was an effort
constantly recall the most painful events you experienced during the war
For each item they had four possible responses: ‘Not at all’, ‘A little’, ‘Quite a bit’ and ‘Extremely
often’.
Figure 7.8 shows the proportion of respondents who said “quite a bit” or “extremely often” when
asked how much they felt these things. On all of the items, those in the RS were more likely than
those in the FBiH to say that they felt or experienced these things quite a bit or extremely often. The
mean number of items that this response was given was 1.52 in the RS and 1.16 in the FBiH.
Respondents in the RS were much more likely than those in the FBiH to say that they often felt
hopeless in terms of the future, that everything was an effort and they recalled painful events they had
experienced during the war.
Women were more likely than men to say that they felt these emotions quite a bit or very often. The
average number of items to which a woman said “quite a bit” or “extremely often” was 1.98 compared
to 1.28 for men. The mean score for women was higher in the RS (2.26 for women, 1.40 for men)
than in the FBiH (1.76 for women, 1.17 for men). It may be the case that women suffer from more
psychological stress than men on average but the difference between men and women may be partly
due to a greater willingness for women to admit to such feelings than men.
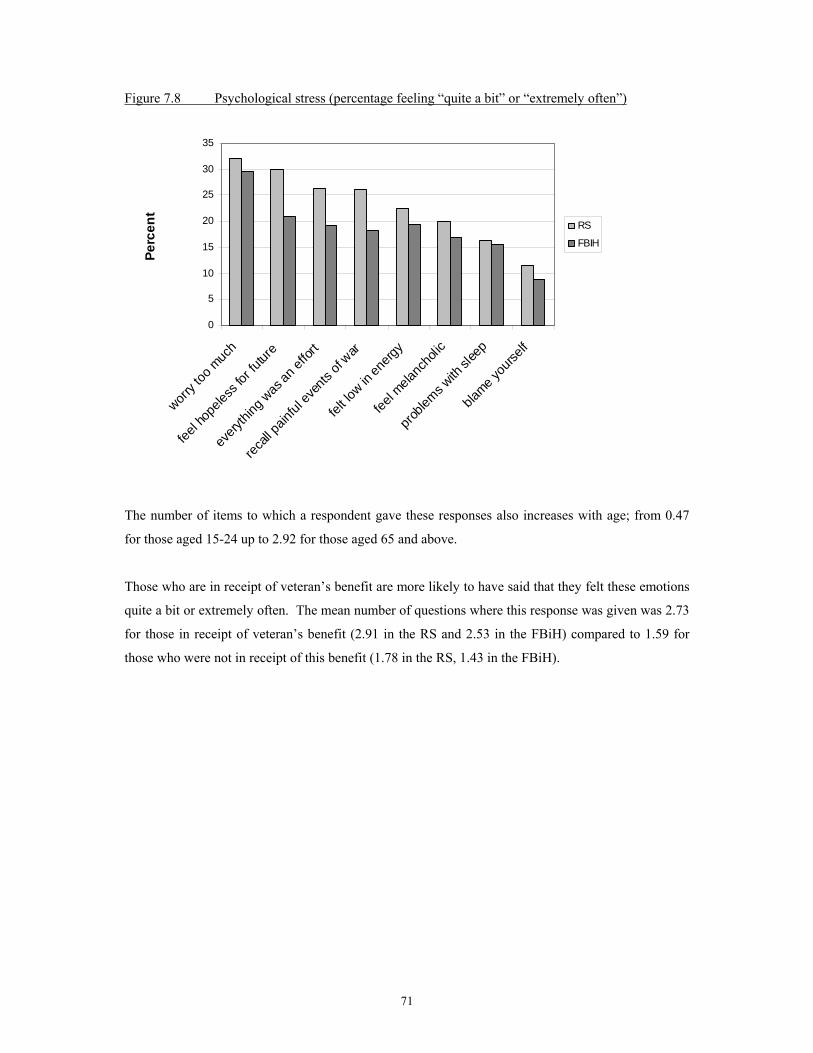
71
Figure 7.8 Psychological stress (percentage feeling “quite a bit” or “extremely often”)
0
5
10
15
20
25
30
35
worry t
oo m
uch
feel h
opele
ss fo
r futur
e
every
thing
was
an ef
fort
recall
painf
ul ev
ents
of war
felt lo
w in en
ergy
feel m
elanc
holic
proble
ms with
slee
p
blame y
ourse
lf
Perc
ent
RS
FBIH
The number of items to which a respondent gave these responses also increases with age; from 0.47
for those aged 15-24 up to 2.92 for those aged 65 and above.
Those who are in receipt of veteran’s benefit are more likely to have said that they felt these emotions
quite a bit or extremely often. The mean number of questions where this response was given was 2.73
for those in receipt of veteran’s benefit (2.91 in the RS and 2.53 in the FBiH) compared to 1.59 for
those who were not in receipt of this benefit (1.78 in the RS, 1.43 in the FBiH).

72
7. Values, opinions and quality of life Key Findings
The majority of respondents in both entities disagreed that it was alright for people to live
together rather than marrying.
The majority of respondents in both entities agreed or strongly agreed that it was better to
divorce than continue an unhappy marriage.
Over one third of respondents agreed or strongly agreed that when there are children in the
family, parents should stay together even if they don’t get along, around one fifth had no view
either way while the remaining half disagreed that parents should stay together for the sake
of the children.
Respondents tended to say that it was better for children if their parents were married rather
than cohabiting.
Almost all respondents in both entities either agreed or strongly agreed that adult children
had an obligation to look after their elderly parents.
The majority of respondents had at least one person who they could talk to and at least one
person who could help them out in a crisis.
Respondents were most likely to say they shared their private feelings and concerns with their
spouse or partner, followed by a parent, child, friend, or brother or sister.
People were most satisfied with their families, husband, wife or partner and least satisfied
with their household income.

73
In addition to factual information about employment, income, health and education, respondents were
asked a series of questions asking for their opinions and satisfaction with various aspects of their life.
Attitudes to cohabitation, marriage, divorce and family life
Using a five point scale from ‘strongly agree’ through to ‘strongly disagree’, respondents were asked
how strongly they agreed or disagreed with a set of statements about family life. Figures 8.1 to 8.5
show the responses to these statements.
The majority of respondents in both entities disagreed that it was alright for people to live together
rather than marrying. Respondents in the RS were more inclined to agree with cohabitation outside
marriage than those in the FBiH and there were some differences by gender. In the RS, 50% of men
agreed or strongly agreed with cohabitation outside marriage compared to 46.5% of women in the RS.
In the FBiH, 38.5% of men agreed or strongly agreed with the statement compared to 31.6% of
women. As might be expected, younger respondents under 45 years of age were more likely to agree
with cohabitation than those who were older but again there were some differences by entity. Of
those aged under 45 in the RS, over 60% agreed or strongly agreed with cohabitation compared to
27.6% of those aged 65 or more in the RS. In the FBiH, 40% of the under 45’s agreed with
cohabitation compared to 27.3% of the 65 and over age group.
Those with higher levels of education were about twice as likely to agree with cohabitation than those
with no qualifications, something which held in both entities. In the RS, 62.7% of those with
university level qualifications agreed with cohabitation compared to 27.9% of those with no
qualifications. In the FBiH, 55.3% of respondents with university level qualifications agreed with the
statement compared to 24.6% of those with no qualifications. Figure 8.1: It is alright for people to live together even if they have no interest in considering marriage
0
5
10
15
20
25
30
35
40
Strongly Agree
Agree Neitheragree nordisagree
Disagree Stronglydisagree
Perc
ent
RSFBIH

74
When asked whether it was better to divorce than continue an unhappy marriage, the majority of
respondents in both entities agreed or strongly agreed with this statement and in this case there was
little difference by gender. In the RS, 86.7% of men and 83.7% of women agreed or strongly agreed
with this statement and in the FBiH, 79.6% of men and 77.2% of women agreed that divorce is better
than an unhappy marriage. As with cohabitation, attitudes to divorce were related to both age and
level of education. Younger respondents were more likely to agree with divorce than older
respondents as were those with university level qualifications.
Figure 8.2: It is better to divorce than continue an unhappy marriage
When children were involved respondents attitudes are somewhat mixed regarding divorce. Over one
third of respondents agreed or strongly agreed that when there are children in the family, parents
should stay together even if they don’t get along, around one fifth had no view either way while the
remaining half disagreed that parents should stay together for the sake of the children.
In both entities, there was no difference by gender but there was a strong relationship with age with
younger respondents being less likely to agree with the statement than older respondents. The
relationship with level of education continues to hold with those with university level qualifications
being less likely to agree that parents should stay together when children are involved than those with
lower levels of qualifications.
In common with attitudes to divorce when children are involved, respondents tended to say that it was
better for children if their parents were married rather than cohabiting. When asked whether they
agreed or disagreed with the statement that it makes no difference to children if their parents are
married or just living together, over half disagreed or strongly disagreed with this statement.
Respondents in the RS were more likely to agree or strongly with the statement (40%) than those in
0
10
20
30
40
50
60
Strongly Agree
Agree Neitheragree nordisagree
Disagree Stronglydisagree
Perc
ent
RSFBIH

75
the FBiH (23%) but there was no gender difference in responses within each entity. Interestingly, the
relationship with age where younger respondents are more likely to agree with the statement than
older age groups holds in the RS but does not apply in the FBiH. In the FBiH younger and older
respondents are equally likely to agree or disagree with the statement. In both entities, the
relationship with level of education is once again apparent with those with university level
qualifications being more likely to agree that it makes no difference to children whether their parents
are married or cohabiting.
Figure 8.3: When there are children in the family, parents should stay together even if they don’t get along
Figure 8.4: It makes no difference to children if their parents are married or just living together
The final item asked about people’s feelings of obligation to care for elderly parents. Almost all
respondents in both entities either agreed or strongly agreed that adult children had an obligation to
look after their elderly parents. In this case there were no differences by gender, age or level of
0
5
10 15 20 25 30 35 40 45
Strongly Agree
Agree Neitheragree nordisagree
Disagree Stronglydisagree
Perc
ent
RSFBIH
0
5
10
15
20
25
30
35
40
45
50
Strongly Agree
Agree Neitheragree nordisagree
Disagree Stronglydisagree
Perc
ent
RSFBIH

76
education, making this an obligation which is clearly seen as a central element of family life in BiH.
It is interesting to note that in countries such as the UK where the debate about care for the elderly is
focusing on how best to reconcile the obligations of individuals and the state in the provision of care,
around one quarter of people disagree that it is children’s responsibility to care for their elderly
parents.5
Figure 8.5: Adult children have an obligation to look after their elderly parents
Social support networks
Respondents were asked whether there was anyone they could count on to listen to when they needed
to talk. Most people in the sample said that there was. Around half said that there was one person
(49.1%) and a slightly smaller proportion said more than one person (46.2%). Just 4.7% said that they
had no-one. There was not a great deal of difference between the entities; those in the RS were
slightly more likely to say that there was one person or no-one whilst those in the FBiH were slightly
more likely to say there was more than one person.
Respondents were also asked whether there was anyone they could really count on to help them out in
a crisis. Again, around half (49.2%) said that there was one person; 46.4% in the RS and 51.6% in the
FBiH. A similar proportion in each entity said that there was more than one person: 38.8% in the RS
and 41.2% in the FBiH. Those in the RS were twice as likely to say that they had no-one than those
in the FBiH: 14.8% compared to 7.2%.
5 This question was asked in the 2001 round of the British Household Panel Survey where 25% of respondents disagreed or strongly disagreed with the statement.
0
10
20
30
40
50
60
Strongly Agree
Agree Neitheragree nordisagree
Disagree Stronglydisagree
Perc
ent
RSFBIH
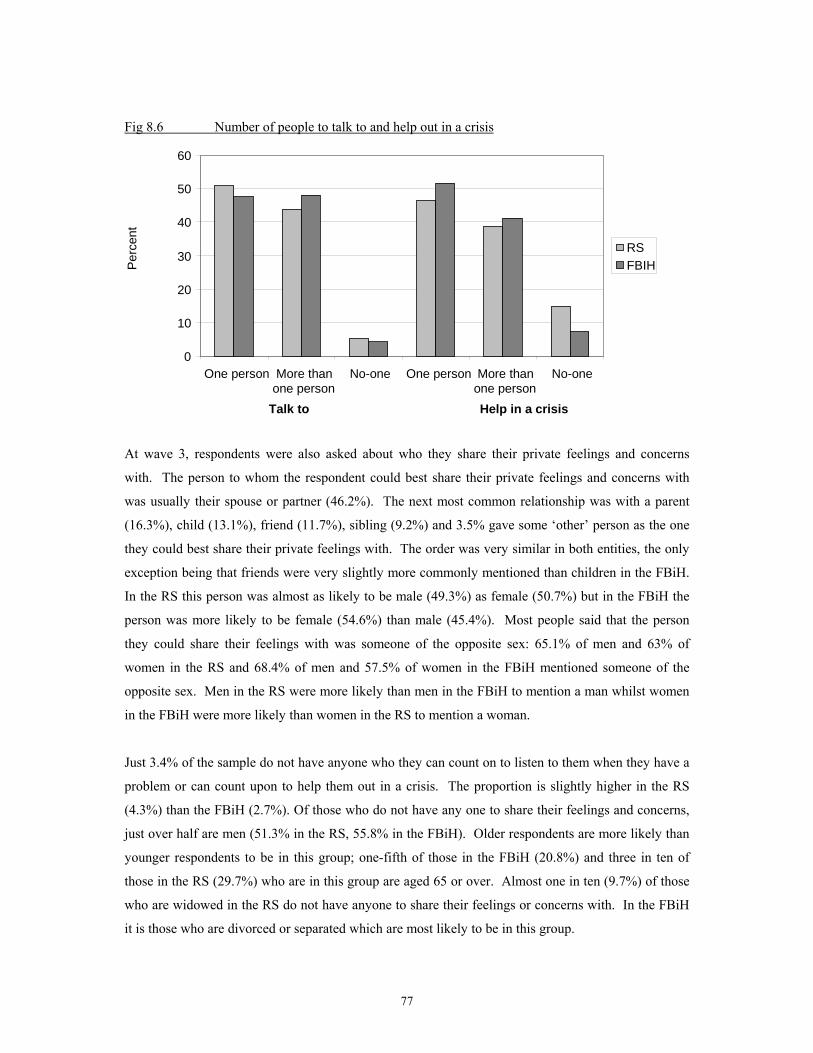
77
Fig 8.6 Number of people to talk to and help out in a crisis
At wave 3, respondents were also asked about who they share their private feelings and concerns
with. The person to whom the respondent could best share their private feelings and concerns with
was usually their spouse or partner (46.2%). The next most common relationship was with a parent
(16.3%), child (13.1%), friend (11.7%), sibling (9.2%) and 3.5% gave some ‘other’ person as the one
they could best share their private feelings with. The order was very similar in both entities, the only
exception being that friends were very slightly more commonly mentioned than children in the FBiH.
In the RS this person was almost as likely to be male (49.3%) as female (50.7%) but in the FBiH the
person was more likely to be female (54.6%) than male (45.4%). Most people said that the person
they could share their feelings with was someone of the opposite sex: 65.1% of men and 63% of
women in the RS and 68.4% of men and 57.5% of women in the FBiH mentioned someone of the
opposite sex. Men in the RS were more likely than men in the FBiH to mention a man whilst women
in the FBiH were more likely than women in the RS to mention a woman.
Just 3.4% of the sample do not have anyone who they can count on to listen to them when they have a
problem or can count upon to help them out in a crisis. The proportion is slightly higher in the RS
(4.3%) than the FBiH (2.7%). Of those who do not have any one to share their feelings and concerns,
just over half are men (51.3% in the RS, 55.8% in the FBiH). Older respondents are more likely than
younger respondents to be in this group; one-fifth of those in the FBiH (20.8%) and three in ten of
those in the RS (29.7%) who are in this group are aged 65 or over. Almost one in ten (9.7%) of those
who are widowed in the RS do not have anyone to share their feelings or concerns with. In the FBiH
it is those who are divorced or separated which are most likely to be in this group.
0
10
20
30
40
50
60
One person More thanone person
No-one One person More thanone person
No-one
Talk to Help in a crisis
Per
cent
RSFBIH

78
Satisfaction with life
Respondents were asked to say how satisfied they were with different aspects of their own life. These
included satisfaction with their health, household income, their house or flat, their husband or partner
(if they had one) and their job (if they were in employment), their social life, amount of leisure time,
the way they spend their leisure time and their satisfaction with life overall. Young people aged under
18 years were also asked how satisfied they were with their family and with their education.
Respondents were asked to say how satisfied or dissatisfied they were on a scale from 1 to 7 where 1
is not satisfied at all and 7 is completely satisfied. We produced a scale from 0 to 100% in order to
calculate the mean levels of satisfaction for each item (Fig 8.7).
Figure 8.7 Satisfaction with aspects of own life
0
10
20
30
40
50
60
70
80
90
100
Family
Husba
nd/w
ife/pa
rtner
Educa
tion
Health
House
/flat
Life o
veral
l
Amount
of lei
sure
time
Social lif
e
Way leis
ure tim
e spe
nt Job
House
hold
incom
e
Perc
ent
RS
FBIH
Note: Satisfaction with education and family asked of those aged under 18 years only. Satisfaction with income, housing, husband/wife/partner asked of those aged 18 and over only. For all aspects apart from the family and their husband, wife or partner, those in the FBiH were
generally more satisfied with their life than those in the RS. The aspects of life where the gap in
satisfaction was largest, that is the mean score of those in the FBiH was 10 points or more higher than
in the RS, was with their social life (+19.12), job (+14.28), way leisure time is spent (+14.11), the
amount of leisure time (+13.36), household income (+11.98) and their house or flat (+11.11). The
mean score for life overall was 10.4 points higher in the FBiH. Overall, young people aged under 18
years were happy with their family and around 70% in each entity were satisfied with their education.
As at wave 2, the aspect of life people were least satisfied with was household income with those in
the RS scoring 30% and those in the FBiH 41%, reflecting the lower average incomes in the RS.

Appendix A
Fieldwork and Technical Report
Appendix A
Department for International Development
BOSNIA AND HERZEGOVINA
LABOUR AND SOCIAL POLICY IN BOSNIA AND HERZEGOVINA: THE DEVELOPMENT OF POLICIES AND MEASURES FOR SOCIAL MITIGATION
Contract Number CNTR 00 1368A
FIELDWORK AND TECHNICAL REPORT
HOUSEHOLD SURVEY PANEL SERIES
WAVE 3 February 2004 Birks Sinclair and Associates Ltd. Independent Bureau for Humanitarian Issues Mountjoy Research Centre Šacira Sikirića 12 Durham 71000 Sarajevo DH1 3SW Bosnia and Herzegovina United Kingdom Phone: 00-44-191-386-4484 Phone/ Fax: 00 387 33 219 780 /1 /
00 387 33 268 750 Fax: 00-44-191-384-8013 E-mail: [email protected] E-mail: [email protected]
This document is an output from a Project funded by the UK Department for International
Development (DFID). The views expressed are not necessarily those of DFID.
List of Acronyms
BHAS Agency for Statistics of Bosnia and Herzegovina
BiH Bosnia and Herzegovina
DFID Department for International Development
DUG Data Users Group
EA Enumeration Area
FBiH The Federation of Bosnia and Herzegovina
FBSTA Field Based Survey Technical Advisor
FOS The Federal Office of Statistics
GND Group of enumeration areas
HSPS Household Survey Panel Series
IBHI Independent Bureau for Humanitarian Issues
ID Person Number
IDD Household Identifier
LID Unique Personal Identifier
LSMS Living Standards Measurement Survey
NSM New Sample Member
OSM Original Sample Member
RSIS The Republika Srspka Institute for Statistics
SIG Survey Implementation Group
WB World Bank

Contents
I Introduction 1
II Sampling 2
II.1 The Sample 2
III Panel Design 2
III.1 Eligibility for inclusion 2
III.2 Following rules 2
IV Identifiers 3
V Feed-forward 4
VI Questionnaire Design 4
VI.1 Pretesting 4
VI.2 Issues arising from the pretest 5
VII Mainstage Fieldwork Procedures 6
VII.1 Training Supervisors and Interviewers 6
VII.2 Fieldwork Progress 6
VII.3 Quality Control checks by the FBSTA 7
VII.4 Minimising non response 8
VII.5 Tracing Movers 8
VII.6 Advance Letter 8
VII.7 A gift 8
VII.8 Respondent Report 8
VII.9 Refusal Conversion 8
VII.10 Editing 9
VIII Survey Data Processing 9
IX Response Rates 10
X Documentation 11
Annexes
A Supervisor Instructions
B Questionnaire
C Control Form
D Movers Form
E Advance letter
F Note on Identifiers
G Editing Instructions
1
LABOUR AND SOCIAL POLICY IN BOSNIA AND HERZEGOVINA:
THE DEVELOPMENT OF POLICIES AND MEASURES FOR SOCIAL MITIGATION
FIELDWORK AND TECHNICAL REPORT
HOUSEHOLD SURVEY PANEL SERIES
WAVE 3
I. Introduction
In 2001, the World Bank in co-operation with the Republika Srpska Institute of Statistics (RSIS), the
Federal Institute of Statistics (FOS) and the Agency for Statistics of BiH (BHAS), carried out a Living
Standards Measurement Survey (LSMS). The primary aim of the LSMS was to provide reliable data
on income, employment, education, health and other key variables necessary for policy formulation
within each entity and across BiH as a whole.
The Department for International Development, UK (DFID) contributed funding to the LSMS and
provided funding for a further two years of data collection for a panel survey, known as the
Household Survey Panel Series (HSPS). Birks Sinclair & Associates Ltd. were responsible for the
management of the HSPS with technical advice and support provided by the Institute for Social and
Economic Research (ISER), University of Essex, UK. The panel survey provides longitudinal data
through re-interviewing approximately half the LSMS respondents for two years following the LSMS,
in the autumn of 2002 and 2003. The LSMS constitutes Wave 1 of the panel survey so there are three
years of panel data available for analysis. For the purposes of this document we are using the
following convention to describe the different rounds of the panel survey:
Wave 1 LSMS conducted in 2001 forms the baseline survey for the panel
Wave 2 Second interview of 50% of LSMS respondents in Autumn/ Winter 2002
Wave 3 Third interview with sub-sample respondents in Autumn/ Winter 2003
The panel data allows the analysis of key transitions and events over this period such as labour market
or geographical mobility and observe the consequent outcomes for the well-being of individuals and
households in the survey. The panel data provides information on income and labour market
dynamics within FBiH and RS. A key policy area is developing strategies for the reduction of
poverty within FBiH and RS. The panel will provide information on the extent to which continuous
2
poverty is experienced by different types of households and individuals over the three year period.
And most importantly, the co-variates associated with moves into and out of poverty and the relative
risks of poverty for different people can be assessed. As such, the panel aims to provide data, which
will inform the policy debates within FBiH and RS at a time of social reform and rapid change.
II. Sampling
II.1 The Sample
The Wave 3 sample consisted of 2878 households who had been interviewed at Wave 2 and a further
73 households who were interviewed at Wave 1 but were non-contact at Wave 2 were issued. A total
of 2951 households (1301 in the RS and 1650 in FBiH) were issued for Wave 3. As at Wave 2, the
sample could not be replaced with any other households.
III. Panel design
III.1 Eligibility for inclusion
The household and household membership definitions are the same standard definitions as a Wave 2
(see Supervisor Instructions, Annex A). While the sample membership status and eligibility for
interview are as follows:
i) All members of households interviewed at Wave 2 have been designated as original sample
members (OSMs). OSMs include children within households even if they are too young for
interview.
ii) Any new members joining a household containing at least one OSM, are eligible for inclusion
and are designated as new sample members (NSMs).
iii) At each wave, all OSMs and NSMs are eligible for inclusion, apart from those who move out-
of-scope (see discussion below).
iv) All household members aged 15 or over are eligible for interview, including OSMs and
NSMs.
III.2 Following rules
The panel design means that sample members who move from their previous wave address must be
traced and followed to their new address for interview. In some cases the whole household will move
together but in others an individual member may move away from their previous wave household and
form a new split-off household of their own. All sample members, OSMs and NSMs, are followed at
each wave and an interview attempted. This method has the benefit of maintaining the maximum
number of respondents within the panel and being relatively straightforward to implement in the field.

3
III.3 Definition of ‘out-of-scope’
It is important to maintain movers within the sample to maintain sample sizes and reduce attrition and
also for substantive research on patterns of geographical mobility and migration. The rules for
determining when a respondent is ‘out-of-scope’ are as follows:
i. Movers out of the country altogether i.e. outside FBiH and RS
This category of mover is clear. Sample members moving to another country outside FBiH and
RS will be out-of-scope for that year of the survey and not eligible for interview.
ii. Movers between entities
Respondents moving between entities are followed for interview. The personal details of the
respondent are passed between the statistical institutes and a new interviewer assigned in that
entity.
iii. Movers into institutions
Although institutional addresses were not included in the original LSMS sample, Wave 3
individuals who have subsequently moved into some institutions are followed. The definitions
for which institutions are included are found in the Supervisor Instructions.
iv. Movers into the district of Brcko are followed for interview. When coding entity Brcko is
treated as the entity from which the household who moved into Brcko originated.
IV. Identifiers
Individual level identifiers have been attached to all members of the Wave 3 households selected for
the panel sample. There is a household level identifier (IDD) for the issued household and each
member of that household has a person number (ID) within the household. The household level
identifier is needed for each wave but does not necessarily need to be related to the previous wave
identifier for a given household. Households change in composition over time, making the notion of a
core household that endures over time problematic for a panel.
In addition to these wave specific household and person number identifiers, each sample member has
a unique personal identifier (LID) attached to them. This identifier is the unique number that each
sample member carries with them throughout the life of the panel, even if they move between
different households. This is the key linking identifier to be used in analysis when matching together
4
data for the same individual from different waves of the survey and is a critical variable. Further
information on identifiers can be found in Annex F.
V. Feed-forward
Details of the address respondents were found at the previous wave together with a listing of
household members found in each household at the last wave was fed-forward as the starting point for
Wave 3 of fieldwork. The feed-forward data also includes key variables required for correctly
identifying individual sample members and includes the following:
For each household: Household ID (IDD); Full address details and phone number
For each Original Sample Member: Name; Person number (ID); unique personal identifier (LID);
Sex; Date of birth
The sample details are in an Access database and to maintain the confidentiality of respondents, the
personal details of names and addresses are held separately from the survey data collected during
fieldwork. The IDD, LID and ID are the key linking variables between the two databases i.e. the
name and address database and the survey database. Further information on feed forward processes
can be found in Annex F.
VI Questionnaire design
Approximately 90% of the questionnaire (Annex B) is based on the Wave 2 questionnaire, carrying
forward core measures that are needed to measure change over time. The questionnaire was widely
circulated and changes were made as a result of comments received.
VI.1 Pretesting
In order to undertake a longitudinal test the Wave 2 pretest sample was used. The Control Forms
and Advance letters were generated from an Access database containing details of ten households in
Sarajevo and fourteen in Banja Luka.
The pretest was undertaken from March 24-April 4 and resulted in 24 households (51 individuals)
successfully interviewed. One mover household was successfully traced and interviewed.
In order to test the questionnaire under the hardest circumstances a briefing was not held. A list of the
main questionnaire changes was given to experienced interviewers.
5
VI.2 Issues arising from the pretest
Interviewers were asked to complete a Debriefing and Rating form. The debriefing form captured
opinions on the following three issues:
1. General reaction to being re-interviewed. In some cases there was a wariness of being asked to
participate again, some individuals asking “Why Me?” Interviewers did a good job of persuading
people to take part, only one household refused and another asked to be removed from the sample
next year. Having the same interviewer return to the same households was considered an advantage.
Most respondents asked what was the benefit to them of taking part in the survey. This aspect was re-
emphasised in the Advance Letter, Respondent Report and training of the Wave 3 interviewers.
2. Length of the questionnaire. The average time of interview was 30 minutes. No problems were
mentioned in relation to the timing, though interviewers noted that some respondents, particularly the
elderly, tended to wonder off the point and that control was needed to bring them back to the
questions in the questionnaire. One interviewer noted that the economic situation of many
respondents seems to have got worse from the previous year and it was necessary to listen to
respondents “stories” during the interview.
3. Confidentiality. No problems were mentioned in relation to confidentiality. Though interviewers
mentioned it might be worth mentioning the new Statistics Law in the Advance letter.
The Rating Form asked for details of specific questions that were unclear. These are described below
with a description of the changes made.
Module 3 Q29-31 have been added to capture funds received for education, scholarships etc.
Module 4 Pretest respondents complained that the 6 questions on "Has your health limited
you..." and the 16 on "in the last 7 days have you felt depressed” etc were too many.
These were reduced by half (Q38-Q48). The LSMS data was examined and those
questions where variability between the answers was widest were chosen.
Module 5. The new employment questions (Q42-Q44) worked well and have been kept in the
main questionnaire.
Module 7 There were no problems reported with adding the credit questions (Q28-Q36)

6
Module 9. SIG recommended that some of Questions 1-12 were relevant only to those aged over
18 so additional skips have been added. Some respondents complained the
questionnaire was boring. To try and overcome this new questions were added to end
the interview on a lighter note.
VII. Mainstage Fieldwork Procedures
Apart from where new interviewers were taken on, in all but five cases interviewers returned to
households they had interviewed at Wave 2. Supervisor 701 returned to three households she
interviewed last year. At Wave 2 there were six households who moved across entity (three moving
from FBiH to RS and three vice versa) for Wave 3 they were re-issued to the same interviewer who
did the interview last year.
VII.I Training Supervisors and Interviewers
At the end of Wave 2 Supervisors were sent a form to rate the work of the Interviewers under their
control. Evaluation was made under a number of headings. All forms were returned and based on
this the FBTSA produced a list identifying 11 “weaker” interviewers, all but two of these were
replaced for Wave 3. From a total of 126 field staff, 16 were new to the survey at Wave 3 (10
interviewers and 2 supervisors in FBiH and 4 interviewers in RS).
On August 9 Supervisors and Interviewers were sent the Questionnaire, a Control Form (Annex C), a
Movers Form (Annex D) and Interviewer or Supervisor Instructions. Four days interviewer and
supervisor training was undertaken from 26-29 August. Three one-day sessions were held for
experienced staff and an additional half-day for new staff.
All briefing sessions were conducted at the Hotel Italia in Sarajevo. The primary trainers for the
sessions were the FBSTA Rachel Smith, SIG members Bogdana Radic and Vesna Grubiša (RSIS)
Zdenko Milinovic and Fehrija Mehic (FOS) and Edin Sabanovic and Jelena Miovcic (BHAS) and a
full-time interpreter.
All field staff were provided with Instructions which contained the basic information needed for
survey administration, but during the training this was heavily supplemented with additional printed
materials, forms and examples.

7
Each session was conducted semi-formally, with opportunities for questions and answers as well as
for further explanation and additional examples.
The importance of in-field quality control procedures was stressed throughout the training. Quality
control procedures for the Supervisors included:
1. review of all sample materials prior to assignment to each interviewer
2. strict control over the activities of a small group of interviewers (5 to 6 interviewers per
Supervisor)
3. weekly updates and meetings with each interviewer
4. verification of 10% of the work of each interviewer via field visits or telephone to selected
households
5. accounting for and review of all data from each interviewer prior to data entry.
Quality control procedures utilised by the interviewers included: careful use of the sample household
location procedures, detailed household member identification and selection for interview procedures.
During each training session, the sample addresses were distributed to each interviewer and discussed
with them in detail. Ample time was allowed for a clear understanding of the materials, quantity of
work expected from each interviewer and the procedures to be followed in conducting the work. Prior
to leaving the training session each interviewer thus had: an assignment, field administration forms
and a supply of survey questionnaires.
Each interviewer was allocated, on average, 30 households. The data collection period was twelve
weeks in length.
VII.2 Fieldwork Progress
Every two weeks Supervisors reported to the Field Office on the progress of each address allocated to
their Interviewers. In this way it was known by the Field Offices and the FBSTA how many
interviews had been completed and the refusal rates in order to have early warning of any potential
problems in the field.
VII.3 Quality Control checks by the FBSTA
Random checks were made by the FBSTA and interpreter to ensure the interviewers had called at
addresses. These checks were made in Grude/Posusje (FBiH). The quality control checks identified
that all these households had been interviewed at Waves 1 and 2, but that the interviewer had not yet
called for Wave 3. Progress in this area was a little slower than for the other areas but everyone
8
remembered the survey and had understood it’s purpose in re-interviewing the same people to see
how things had changed. Ana Abdelbasit undertook further quality control checks in Cajnice and
Visegrad over the telephone and no problems were identified.
VII.4 Minimising non-response
The major problem for panel surveys is attrition, that is, the loss of respondents who either refuse to
take part any further in the survey, are unable to be contacted during fieldwork, or who move and
cannot be traced. Attrition in panel surveys is potentially damaging as the sample size for respondents
with complete longitudinal records reduces over time and there is a danger of differential attrition
introducing bias. The following procedures have been taken in an attempt to reduce attrition.
VII.5 Tracing Movers
This wave, interviewers were given the tracking information they had collected at Wave 2. This
process has worked extremely well in enabling interviewers to find movers. Further tracing of
movers was undertaken by the BHAS, in particular Jelena Miovcic and Edin Sabanovic were
responsible for finding any households or individuals. For Wave 3, 32 mover households were sent to
BHAS of which 18 were successfully found (56%).
VII.6 Advance letter
One advance letter per household was produced (Annex E). Production of the advance letter was part
of the feed forward process and each letter was personally addressed to each sample household. The
letter included additional wording to ask it to be left where others in the household could see it.
VII.7 A gift
As a small token of thanks for taking part in the panel a notepad was given to each person who was
interviewed. The name of the survey was printed on the notepad, to give respondents a feeling of
“belonging” to the survey.
VII.8 Respondent Report
A two-side respondent report was compiled. The data within the report came largely from the Panel
Study Draft Wave 2 Report. Additional findings, regarding smokers, were taken from work
undertaken by Edin Sabanovic. The report was produced in Latin and Cyrillic and given to each
respondent.
VII.9 Refusal Conversion
9
In FBiH refusal conversion attempts were made and 70% of these households were successfully
converted as shown below.
Area Number reissued Number successfully
interviewed
Zavidovici 5 5
Visoko 22 15
Novo Sarajevo 7 7
Sarajevo Novi Grad 10 6
Sarajevo Centar 16 9
Total 60 42
VII.10 Editing
Editing Instructions were compiled (Annex G) and sent to Supervisors. For Wave 3 Supervisors were
asked to take more time to edit every questionnaire returned by their interviewers. The FBTSA
examined the work twelve of the twenty-two Supervisors. All Supervisors made occasional errors
with the Control Form so a further 100% check of Control Forms and Module 1 was undertaken by
the FBTSA and SIG members.
VIII. Survey Data Processing
As at Wave 2 CSPro was the chosen data entry software. The CSPro program consists of two main
features to reduce to number of keying errors and to reduce the editing required following data entry:
Data entry screens that included all skip patterns.
Range checks for each question (allowing three exceptions for inappropriate, don't know and
missing codes).
The Wave 3 data entry program had more checks than at Wave 2 and DE staff were instructed to get
all anomalies cleared by SIG fieldwork. The program was extensively tested prior to DE.
Ten computer staff were employed in each Field Office and as all had worked on Wave 2 training was
not undertaken.
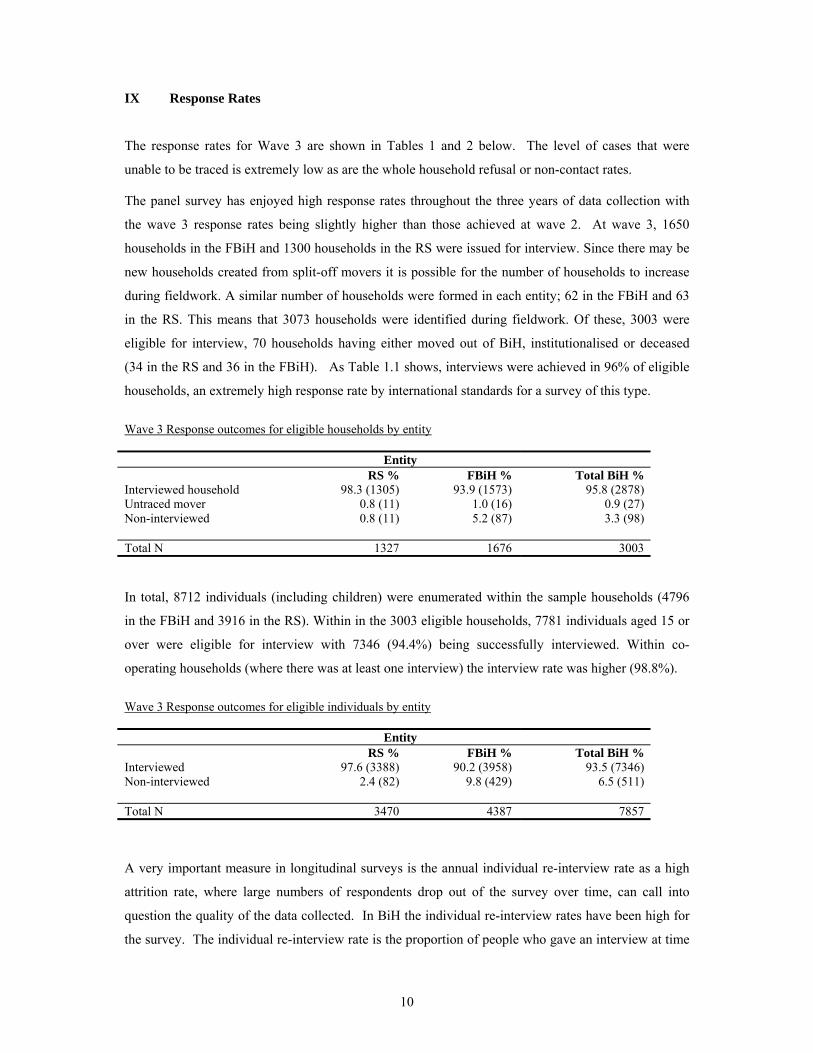
10
IX Response Rates
The response rates for Wave 3 are shown in Tables 1 and 2 below. The level of cases that were
unable to be traced is extremely low as are the whole household refusal or non-contact rates.
The panel survey has enjoyed high response rates throughout the three years of data collection with
the wave 3 response rates being slightly higher than those achieved at wave 2. At wave 3, 1650
households in the FBiH and 1300 households in the RS were issued for interview. Since there may be
new households created from split-off movers it is possible for the number of households to increase
during fieldwork. A similar number of households were formed in each entity; 62 in the FBiH and 63
in the RS. This means that 3073 households were identified during fieldwork. Of these, 3003 were
eligible for interview, 70 households having either moved out of BiH, institutionalised or deceased
(34 in the RS and 36 in the FBiH). As Table 1.1 shows, interviews were achieved in 96% of eligible
households, an extremely high response rate by international standards for a survey of this type.
Wave 3 Response outcomes for eligible households by entity
Entity RS % FBiH % Total BiH %
Interviewed household 98.3 (1305) 93.9 (1573) 95.8 (2878) Untraced mover 0.8 (11) 1.0 (16) 0.9 (27) Non-interviewed 0.8 (11) 5.2 (87) 3.3 (98) Total N 1327 1676 3003 In total, 8712 individuals (including children) were enumerated within the sample households (4796
in the FBiH and 3916 in the RS). Within in the 3003 eligible households, 7781 individuals aged 15 or
over were eligible for interview with 7346 (94.4%) being successfully interviewed. Within co-
operating households (where there was at least one interview) the interview rate was higher (98.8%).
Wave 3 Response outcomes for eligible individuals by entity
Entity RS % FBiH % Total BiH %
Interviewed 97.6 (3388) 90.2 (3958) 93.5 (7346) Non-interviewed 2.4 (82) 9.8 (429) 6.5 (511) Total N 3470 4387 7857
A very important measure in longitudinal surveys is the annual individual re-interview rate as a high
attrition rate, where large numbers of respondents drop out of the survey over time, can call into
question the quality of the data collected. In BiH the individual re-interview rates have been high for
the survey. The individual re-interview rate is the proportion of people who gave an interview at time
11
t-1 who also give an interview at t. Of those who gave a full interview at wave 2, 6653 also gave a full
interview at wave 3. This represents a re-interview rate of 97.9% - which is extremely high by
international standards. When we look at those respondents who have been interviewed at all three
years of the survey there are 6409 cases which are available for longitudinal analysis, 2881 in the RS
and 3528 in the FBiH. This represents 82.8% of the responding wave 1 sample, a retention rate which
is again high compared to many other panels around the world.
X Documentation
Further documentation for the survey including survey questionnaires, interviewer instructions,
coding frames for open-ended items and a cross-wave table of variable names for the three waves of
the survey are available for users from:
www.birks-sinclair.com (English version) www.ibhibih.org (local version)
Appendix B
Institutional Composition and Terms of Reference of the Data User Groups (DUGs)

Appendix B
Institutional and Individual Composition of the BiH Data User Group
Agency for Statistics of BiH (BHAS), Chair of the Executive Board, Slavka Popović
The Republika Srpska Institute for Statistics (RSIS), Director, Slavko Šobot
RS Ministry for Veteran Issues, Victims of War and Labour, Assistant Minister, Rajko Kličković
The Federal Office of Statistics (FOS), Assistant Director, Zdenko Milinović
Federal Ministry of Labour and Social Policy - Sector for Labour and Employment, Assistant
Minister, Džana Kadribegović
Council of Ministers BiH, Ministry of Foreign Trade and Economic Relations, State Coordinator for
the BiH Mid-Term Development Strategy, Zlatko Hurtić
Ministry of Foreign Trade and Economic Relations of BiH - Sector for Economic Development and
Entrepreneurship, Sector Head, Dušanka Divčić
BiH Ministry for Human Rights and Refugees – Sector for Human Rights, Almina Jerković
BiH Agency for Labour and Employment
Institutional and Individual Composition of the RS Data User Group
The Republika Srspka Institute for Statistics (RSIS), Director, Slavko Šobot
RS Ministry of Health and Social Protection, Assistant Minister, Pavle Paunić
RS Ministry of Education, Assistant Minister for High Education, Ranko Pejić
Public Fund for Child Protection RS, Director, Božidar Stojanović
RS Ministry of Labour and Veteran and Invalidity Protection, Assistant Minister, Rajko Kličković
RS Ministry of Health and Social Protection, Assistant Minister for Health Sector, Stevan Jović
RS Employment Bureau, Headquarters – Pale, Director, Milorad Janković
RS Employment Bureau, Head of the Banja Luka Branch, Milena Mandić
Agency for Statistics of BiH (BHAS), Chair of the Executive Board, Slavka Popović
Institutional and Individual Composition of the FBiH Data User Group
Federal Employment Bureau, Director, Hasan Musemić
Employment Bureau, Mostar, Director, Petar Golemac
Federal Ministry of Labour and Social Policy - Sector for Labour and Employment, Assistant
Minister, Džana Kadribegović

Federal Ministry of Labour and Social Policy - Sector for Social and Child Protection, Assistant
Minister, Asim Zečević
Federal Ministry for Education, and Science, Assistant Minister, Severin Montina
Agency for Statistics of BiH (BHAS), Chair of the Executive Board, Slavka Popović
The Federal Office of Statistics (FOS), Director, Derviš Đurđević
Federal Ministry of Health, Assistant Minister, Zlata Kundurović
Observers
Council of Ministers BiH, Ministry of Foreign Trade and Economic Relations, State Coordinator for
the BiH Mid-Term Development Strategy, Zlatko Hurtić
Department for International Development, Social Policy Coordinator, Anamaria Golemac Powell
World Bank, Research Analyst, Irina Smirnov
World Bank, Social Protection Consultant, Christian Bodewig
Independent Bureau for Humanitarian Issues (IBHI), Director, Žarko Papić
Birks Sinclair & Associates Ltd., Project Director, Stace Birks

LABOUR AND SOCIAL POLICY IN BOSNIA AND HERZEGOVINA: THE
DEVELOPMENT OF POLICIES AND MEASURES FOR SOCIAL MITIGATION
In cooperation with World Bank and UNDP supported
Living Standards Measurement Survey
Responsibilities of the RS and FBiH Data User Groups
Background
A statistically reliable basis for social sector policy making is a priority for the Federation of Bosnia
and Herzegovina (FBiH) and the Republic of Srpska (RS). Accordingly, the Agency for Statistics of
BiH (ASBiH), the Institute of Statistics of the Republic of Srpska (ISRS) and the Statistics Institute of
the Federation of Bosnia and Herzegovina (SIFBiH) are embarking on a series of household surveys
supported by the UK Department for International Development (DFID), the World Bank (WB),
UNDP and a range of donors.
Amongst these household surveys are the Living Standards Measurement Survey (LSMS), currently
in progress, and the Panel Study - a three year collection of longitudinal household data. In addition a
Household Budget Survey is planned, indicatively to begin in early 2002 and which will run for much
of the year, and a Labour Force Survey, a two week survey to be executed in early 2003.
Objectives of this Project
The goal of the panel Survey is to strengthen labour and social policies to mitigate the social effects of
privatisation, enterprise restructuring, unemployment and social exclusion.
Through the longitudinal panel survey, and the associated enhancement of policy development skills
in the entities, this project is designed to:
• improve the framework within which social policy can be made;
• support the statistical institutions responsible for statistical analysis and reporting; and
• strengthen the policy making function at Entity (and within FBiH, Canton) level, with a view
to enhanced implementation of social policy at municipal level.
This is being carried out through close cooperation, in the first place, with the development and
analysis of the LSMS.
The Data User Groups are a means to:
• establish linkages and cooperation between the LSMS and the Panel Study
• establish a participative approach in the planning and implementation of the Panel Study, with
full partnership between all counterparts in BiH with stakeholders fully consulted to ensure
the Study meets local aims;
• produce outputs of world class standards, in informational and policy development terms;
• promote the use of data in policy analysis and decision making at State, Entity, Cantonal (in
FBiH) and Municipal levels.
Components within the Panel Study
The project builds upon the WB. UNDP DFID and multi-donor supported, WB implemented Living
Standards Measurement Survey (LSMS). The LSMS will provide a cross sectional measure of
poverty and welfare in RS and FBiH.
The LSMS will also provide the base sample and reference point for the Panel Survey, which will
provide longitudinal data to track the outcomes for individuals and families over a three-year period.
The Panel Study project will achieve this by assisting statistical institutions, Ministries and agencies
to acquire both qualitative and quantitative information on:
• Trends in unemployment, underemployment and employment;
• Social data on linkages between labour and social policies; and
• The informal sector.
The Panel Study project will also, with its participative methodology, develop with entity level
counterparts:
• Strategies for supporting social mitigation through the:
• development of sustainable policy; and
• implementation of practical measures to reduce poverty and social exclusion.

This will be achieved in a partnership between the consultant team (international and local) and BiH,
RS and FBiH institutions which will result in:
• Enhanced social policy making skills in data using institutions at entity level;
• Strengthened capacity of Statistical Institutions to collect and compile data which is relevant
to policy formulation and development;
• Collection of Longitudinal panel data on employment trends and social policy, resulting in a
capacity to develop the analysis and policy implications of this and other data.
LSMS Development
Following development of the sample and questionnaire on a consultative basis, the interviewing of
households is now completed. The datasets were entered concurrently with collection and will be
checked and output tabulations will be processed when the survey is completed. A list of these base
tables is attached.
The next phase is to develop a more detailed analysis of data and the interpretation of this LSMS data
for the refinement and interpretation of policy.
Subsequent tasks include the:
• use of the LSMS survey to develop the Panel Study sample for the next two years of
interview rounds: and
• the interpretation of data in formulating social policy, particpatively, so enhancing data
analysis and policy development skills in BiH.
These activities will be linked with other household surveys in BiH, such as the Household Budget
Survey, the labour Force Survey and other related surveys and analyses carried out by the WB and
other Donors.
The Nature and Purposes of the Data Users Groups
A Data Users’ Group (DUG) will be established in each entity.
The DUGs will have a strategic and guidance role.

Initial discussions with a range of Stakeholders (including: DFID; WB; UNDP; ASBiH; ISRS;
SIFBiH) have confirmed the need for these DUGs as a vehicle for:
• the promotion of the LSMS, the DFID panel study project and their outputs generally;
• establishing understanding between the respective statistics “providers” and end users and
policy makers, entity ministries, and at the Cantonal (in FBIH) and municipal levels;
• the establishment of consistency of data outputs, standards and coherence of approach
across user groups;
• preliminary and more refined analysis of LSMS data in the social policy area;
• setting out of the technical transition from the LSMS data set to the longitudinal data set
drawn from the Panel Study; and
• consultation on the focus of proposed qualitative studies and ad hoc reports in the social
policy area.
The DFID project supporting the Panel Study, “Labour and Social Policy in BiH: the Development of
Policies and Measures for Social Mitigation”, will provide the logistical support to the DUGs.
The Responsibilities of the Data User Groups
Each DUG will, in the area of social policy:
• guide, supervise, and participate in data analysis and policy development based upon the
household survey data, especially from the LSMS in the first instance and subsequently the
Panel Survey;
• make recommendations for policy deriving from the household data sets to the entity
governments;
• support the dissemination, to the government and administrative structures, agencies and
population of BiH, as appropriate, of:
o statistical results; and
o policy implications;
of different surveys/ studies;
• initiate, guide and oversee seminars and workshops, and hold meetings including wider
representatives from entities, cantons (in FBiH) and municipalities and other agencies as
appropriate to examine statistics or policy issues of particular interest;
• make recommendations about the content and methodology of other planned survey
exercises;
• encourage and support enhanced cooperation between statistical institutes and data users and
policy makers in order to derive maximum benefit from the Statistical data;
• maintain links with other scientific and action oriented research;
• comment upon the outputs of the analysis of the LSMS;
• comment upon the Panel Study annual qualitative study;
• comment upon the Panel Study annual report;
• establish working groups to support the preparation of special reports on topics of particular
interest, including the annual Qualitative Studies to be carried out under this DFID Panel
Study project;
• advise on, guide and participate in capacity development activities in statistics and policy
development; and
• liaise as appropriate with other statistical and related policy initiatives, such as that carried out
by the WB’s Poverty Reduction Strategy Group
The DUGs will discuss and approve their own ToRs in the first meeting.
Membership of Data User Groups
A list of prospective members is attached.
Representation on the Project Coordinating Group
A representative of each DUG will be nominated to the Project Coordination Group, in order to
represent the DUG at the project management level.
Timing of Meetings and Duration of the Data User Groups
It is anticipated that DUGs will meet quarterly. Their lifespan will be, at a minimum, up to mid-
2004, in order that the DUGs contribute to the:
• Analysis of the LSMS and its contribution to the development of policies which will lead to a
reduction in poverty and social exclusion;
• Development of the methodology and questionnaire design for the Panel Survey; and
• Analysis of the HBS, Labour Force Survey and other surveys to be carried out in the coming
years.
LABOUR AND SOCIAL POLICY IN BOSNIA HERZEGOVINA: THE DEVELOPMENT OF
POLICIES AND MEASURES FOR SOCIAL MITIGATION
DRAFT
TERMS OF REFERENCE AND RESPONSIBILITIES
BiH DATA USER GROUP
Background
This Project aims to improve the frameworks within which social policy can be made in BiH, by
supporting:
• the Statistical Institutions at Entity and State level responsible for statistical analysis and
reporting; and
• strengthening the policy making function at Entity level.
Significant steps have been and are being taken in social policy development, but addressing social
policy issues is made particularly difficult in BiH by the:
• relatively small number of skilled and senior people capable of managing social transition;
and
• lack of reliable data on social and economic issues relevant to social policy due to the absence
in particular of household data sets.
This Project will assist FBiH and RS in addressing the latter task and will enhance institutional
capacity to mitigate the former constraint.
Outline of the Project
The Labour and Social Policy Project goal is to:
• strengthen labour and social policies to mitigate the social effects of privatization, enterprise
restructuring, unemployment and social exclusion.
The Project purposes are to:
• generate longitudinal panel data on employment trends and on the impact of social policies;
and
• strengthen the responsible State and Entity statistical institutions.
In summary, the activities of the Project focus on four Outputs:
Output 1: enhanced social policy making capacity
Outputs include:
• support to a Data Users’ Group (DUG) in each Entity, with membership drawn initially from
the RSIS and the FOS and social sector ministries and agencies. Working Groups will be
established as needed. Each Entity based DUG can commission and issue reports and
Qualitative Studies, and establish Entity based ownership of the process;
• a series of Qualitative Studies, to inform Panel design, and to investigate outcomes of the
Panel itself;
• a series of ministerial and regional workshops, round table meetings and seminars, to
disseminate key findings; and
• an Entity based Annual Report, which would reflect the main findings of the Panel Survey,
and summarise key changes affecting the labour market and social welfare.
Output 2: strengthened capacity of State and Entity level statistical institutions.
Provision of advice and guidance on:
• establishment of EU standards in the field of Household Surveys;
• dissemination of the representative BiH data set;
• design and management of studies of longitudinal data on the representative BiH data set; and
• support to training to the FOS and the RSIS in statistical tasks relevant to the HSPS. This
support would be provided locally and jointly as far as possible.
Output 3: the development of longitudinal panel data on employment trends and social policy

• contribute to the construction of the LSMS Questionnaire to ensure that:
(a) the LSMS Questionnaire was designed in a way which facilitated panel type questions
subsequently; and
(b) contained key encoding data, e.g. identifiers of household members, to permit
longitudinal analysis of results over time;
• assist the FOS and the RSIS to conduct the Panel Household Survey in the 3rd Quarters of
2002 and 2003; each of approximately 1500 households; assist the FOS and the RSIS clean,
enter and analyse the data; undertake a first order data analysis; begin the process of
longitudinal data analysis; prepare the public release files to be merged by DFID TA to be
forwarded to the ASBiH as a public release file; and maintain the Panel data for subsequent
years’ surveys.
Output 4: promote an improved capacity to analyse longitudinal data locally
It would achieve this by:
• promotion of a small research fund to be executed by local researchers.
The Purposes and Activities of the BiH DUG
The BiH DUG will have two key roles:
1) a short term and immediate role within the Panel Study Project as set out in the Project
Memorandum, in particular in utilisation of data in the development of policies, with
emphasis upon the social policy and social sector; and
2) A wider, longer term and strategic role related to:
• statistics and their collection, specification and utilisation, and
• support to social policy development, monitoring and evaluation.
In both of these contexts, the focus will be upon:
• the development of statistics in a better way;
• the utilisation of these statistics in a more effective manner; and
• enhancing qualitative and evidence based approaches to social policy development.
The Short Term BiH DUG Roles Within the Project
These short term roles – within the Project context - will focus upon:
• consultations and advice upon project implementation and its direction; and
• the promotion of the DFID Panel Study Project, and Qualitative Studies and their outputs
generally.
Thus the BiH DUG will have the purposes of:
• acting as a forum where methodological issues could be raised for resolution at the
appropriate level;
• acting as a forum for improvement of data analysis and use;
• a consultative forum to discuss and coordinate capacity development activities; and
• a means of liaison and communication with the Entity DUGs and coordination of statistics
institutions (Entity SIs and ASBiH).
Thus, within the Project, the BiH DUG might advise upon:
• support to the DUGs methodologically;
• comment upon State level aspects of the Qualitative Studies and Local Research programme;
• the content of the Annual Report;
• assisting the RSIS and the FOS disseminate Project results at Entity level;
• assisting the ASBiH disseminate the BiH data sets and Qualitative Studies that result from the
Project;
• from the technical point of view, the content of the Panel Questionnaire;
• Panel sub-sample selection;
• fieldwork procedures;
• data processing procedures and systems, post-field data cleaning and editing routines;
• sample management and panel maintenance procedures; and
• assistance with coordination, definition of and logistics of training and capacity building.

These roles will naturally evolve into wider activities that will go, in a sustainable way, beyond the
framework of the Project.
The BiH DUG Roles Wider than the Project
The wider roles of the BiH DUG are important.
The BiH DUG will potentially have a strategic and guidance role for the statistical and social policy
making communities of BiH and the international community. It will in particular facilitate the closer
relations and working partnerships between data producers and data users and policy makers at State
and Entity level.
Initial discussions with a range of Stakeholders (including: DFID; WB; UNDP; ASBiH; RSIS; FOS)
have confirmed the need for a BiH DUG as a vehicle for:
• establishing understanding between the respective statistics “providers” and end users and
policy makers, Entity ministries, at the Cantonal (in FBIH) and municipal levels and
institutions at BiH level ensuring the policy relevance of the outputs of the statistical
community;
• the establishment of consistency of data outputs, standards and coherence of approach across
user groups;
• making strategic plans for the satisfaction of policy makers’ data needs in key areas. This
would include re-specification of data sets and joint commissioning of specific surveys,
approaches to analysis and Qualitative Studies;
• preliminary and more refined analysis of statistical data for social sector purposes;
• supporting the development of samples and standards for analysis of and - in partnership with
donors - as local aspects of governance over the Household Budget Survey (HBS), Labour
Force Survey (LFS), and other household and other surveys to be carried out in the coming
years;
• advocating and contributing to the development of a future census for BiH;
• strengthening the institutional development and technical capacities of the statistical and data
using stakeholders, by guiding relevant education and training initiatives for statistics
producers and users, with a long term view to enhanced operation at EU levels and standards;
• ensuring a strategic view of statistical development in both entities and at State level,
including views of the population census;
• coordinated approaches to donors in terms of seeking funds and guiding their application; and

• coordinated approaches to the development of the PRSP and its implementation, monitoring
and evaluation.
The DFID Project supporting the Panel Study, “Labour and Social Policy in BiH: the Development of
Policies and Measures”, will provide the all the logistical support necessary to the BiH DUG for the
duration of the Project just as it services the Entity level DUGs.
The Responsibilities of the BiH DUG
The BiH DUG will:
• guide, supervise, and participate in data analysis and policy development based upon the
household survey data, especially from the LSMS in the first instance and subsequently the
Panel Survey;
• guide – within overall governance structures the development of the HBS and the LFS – in
terms of samples standards and analysis;
• make recommendations for policy deriving from the analysis of the household data sets to the
Entity governments and to the State government as appropriate;
• support the dissemination, to the government and administrative structures, agencies and
population of BiH, as appropriate, of:
o results of household and other surveys and other relevant sources of statistics and
o policy implications of such statistics;
o different surveys and studies;
• guide the development, overall, of policy friendly statistics in BiH and its entities;
• initiate, guide and oversee seminars and workshops, and hold meetings including wider
representatives from entities, cantons (in FBiH) and municipalities and other agencies as
appropriate to examine statistics or policy issues of particular interest;
• make recommendations about the content and methodology of other planned survey
exercises;
• encourage and support enhanced cooperation between statistical institutions and data users
and policy makers in order to derive maximum benefit from the statistical data and analysis;
• maintain links with other scientific and action oriented research;
• comment upon the outputs of the analysis of the LSMS;
• comment upon and contribute to the analysis, focus of and promotion of the Panel Study
annual Qualitative Study;
• comment upon the Panel Study Annual Report;
• advise on, guide and participate in education and training and capacity development activities
in statistics and related policy development. The BiH DUG will facilitate a practically and
task related series of training activities; and
• liaise, as appropriate, with other statistical and related policy initiatives, such as that carried
out by the WB’s Poverty Reduction Strategy Group and those established for particular
purposes and surveys. This would include initiating a coordinated approach to the monitoring
and evaluation of the PRSP and similar future initiatives
Approval of the ToRs for the BiH DUG
After consultations at the pre-meeting, these BiH DUG ToRs have been revised and will be discussed
again by subsequent meetings until - on a consensus basis, the BiH DUG approves its own ToRs.
Membership of BiH DUG
A list of the membership is attached to these ToRs.
Extra members can be adopted at the suggestion of and by consensus of the members.
Selection and election of BiH DUG Chairperson
At its first meeting, the BiH DUG selected a Chairperson, the Coordinator of the BiH PRSP team.
Provision is made for his substitution at an appropriate point.
Timing and frequency of the meetings of the BiH DUG
It is anticipated that the BiH DUG will meet at six monthly intervals, or more frequently if members
request.
It is anticipated that the lifespan of BiH DUG will be, at a minimum, up to late 2004, in order that the
BiH DUG can contribute to the State level coordination and developmental roles within the DFID
Labour and Social Policy Project and to contribute to the outcomes of the Panel Study exercise.
The importance of coordination of data production and utilisation and the focus of the BiH and Entity
governments and the international community upon production of appropriate high quality data in
BiH suggest a likelihood of a long term future for the BiH DUG.
Appendix C
Summary of Project

Appendix C
Labour and Social Policy in Bosnia and Herzegovina:
The Development of Policies and Measures for Social Mitigation
Brief Description of the Project
Background
The UK’s Department for International Development (DFID) is supporting a project to address the
fundamental issue of the appropriate development of Social Policy in Bosnia and Herzegovina (BiH).
The design phase of the project has been completed in partnership with the authorities of BiH, the
Federation of Bosnia and Herzegovina (FBiH) and the Republic of Srpska (RS). Birks Sinclair &
Associates Ltd. is responsible for managing the implementation phase of the project, which will last
for up to four years.
A statistically reliable basis for policy making, particularly in the social sphere, is now a priority for
FBiH and RS. Accordingly, the Agency for Statistics of BiH (ASBiH), the Republika Srpska Institute
for Statistics (RSIS) and the Federal Office of Statistics (FOS) are embarking on a series of household
surveys. The purposes of the DFID project are to:
• support the Household Surveys with a Panel Study to produce longitudinal data over three
years, with a base point of the Living Standards Measurement Survey (LSMS) of 2001; and
• enhance the framework within which social policy is made.
DFID will support the Statistical Institutions (SIs) responsible for statistical analysis and reporting,
and strengthen the policy making function at Entity and State level.
Objectives
The proposed project objective is to strengthen labour and social policies to mitigate the social effects
of privatisation, enterprise restructuring, unemployment and social exclusion.

The purposes of the project are to generate longitudinal Panel Survey data on employment trends and
on the impact of social policies for the years of 2001, 2002 and 2003, and to strengthen the
responsible State and Entity SIs.
Activities
In the context of BiH, the ability to track transitions over time, as the labour market is restructured
and privatisation introduced, will be critical for the formulation of social policy and measures to
mitigate some of the potentially damaging effects of privatisation on the welfare of individuals and
families.
As a base point in 2001, the LSMS will provide a measure of incomes and welfare for a nationally
representative sample of BiH at one time point. The Household Survey Panel Series (HSPS) will
provide longitudinal data to track change for individuals and families over a three-year period to
2003.
The project will achieve this by assisting SIs to acquire and analyse both qualitative and quantitative
information on:
• trends in unemployment, underemployment and employment;
• social data on linkages between labour and social policies and welfare; and
• strategies for supporting social mitigation through the development and implementation of
practical measures to reduce income poverty and social exclusion.
Birks Sinclair in partnership with the Institute of Social and Economic Research (ISER) and the
Independent Bureau for Humanitarian Issues (IBHI) will be responsible for supporting the
development, dissemination and communication of analytical results deriving from the project.
In addition to assisting the SIs in their data acquisition, the project team will also train and empower
the staff at all three SIs, thus enabling them to conduct both qualitative and quantitative research
effectively in the future. The project team will also support DUGs in each Entity and at State level,
which will interpret Panel data from a policy perspective, and assist refinement of more effective
social policy.

Outputs
There are four main outputs from the project, over the four years of its operation:
1. enhanced social policy making capacity;
2. strengthened capacity of State and Entity level SIs;
3. development of longitudinal Panel data on employment trends and social policy; and
4. an improved capacity to analyse longitudinal data within BiH.