dental microwear from natufian hunter-gatherers and early neolithic farmers: comparisons within and...
TRANSCRIPT

Dental Microwear From Natufian Hunter-Gatherersand Early Neolithic Farmers: Comparisons Withinand Between Samples
Patrick Mahoney*
Department of Archaeology, University of Sheffield, Sheffield S1 4ET, UK
KEY WORDS diet; functional morphology; facet nine
ABSTRACT Microwear patterns from Natufianhunter-gatherers (12,500–10,250 bp) and early Neolithic(10,250–7,500 bp) farmers from northern Israel are cor-related with location on facet nine and related to anarchaeologically suggested change in food preparation.Casts of permanent second mandibular molars are exam-ined with a scanning electron microscope at a magnifica-tion of 5003. Digitized micrographs are taken from theupper and lower part of facet nine. Microwear patternsare recorded with an image-analysis computer programand compared within and between samples, using uni-variate and multivariate analyses. Comparisons withinsamples reveal a greater frequency of pits on the lowerpart of the facet among the farmers, compared to the
upper part. Microwear does not vary over the facetamong the hunter-gatherers. Comparisons betweensamples reveal larger dental pits (length and width)and wider scratches among the farmers at the bottomof the facet, compared to the hunter-gatherers. Micro-wear does not vary between samples at the top of thefacet. The microwear patterns suggest that the Natu-fian to early Neolithic development led to a harder diet,and this is related to an archaeologically suggestedchange in food processing. The harder diet of the earlyfarmers may have required higher bite forces that wereexerted at the bottom of facet nine, in the basin of thetooth. Am J Phys Anthropol 130:308–319, 2006. VVC 2006
Wiley-Liss, Inc.
The development from a Natufian (12,500–10,250 bp)to early Neolithic (10,250–7,500 bp) culture in theLevant led to changes in settlement patterns, architec-ture, tools, and biological characteristics and demo-graphic structure of the people (Bar Yosef, 1992, 1998;Bar Yosef and Belfer-Cohen, 1989; Eshed et al., 2004a,b;Garrod, 1957; Henry, 1989; Kenyon, 1957; Mellaart,1975; Moore, 1982; Rollefson and Kohler-Rollefson, 1989;Wright, 1993). The early prepottery Neolithic culture(PPN), which is subdivided into an initial (PPNA,10,250–9,400 bp), middle (PPNB, 9,400–8,100 bp), andlate phase (PPNC, 8,100–7,500 bp), was also character-ized by dietary developments. Animal and plant foodsthat were hunted and gathered by the Natufians wereincreasingly farmed during the Neolithic (Clutton-Brock,1971; Colledge, 1994; Legge, 1996; Martin, 1994; Willcox,1998). These dietary developments were detected inhuman skeletons, through Sr-Ca ratios and changes inthe prevalence of dental caries (Sillen, 1981, 1986; Smithet al., 1984). Dietary abrasiveness was also inferred fromdental macrowear in Natufian populations (Smith, 1972;Smith et al., 1984). Yet few have made direct compari-sons between periods in order to infer dietary texture(hardness vs. softness).The aim of the present study is to infer dietary texture
during the Natufian to early Neolithic development innorthern Israel from microscopic dental pits andscratches (dental microwear). Prior studies demonstratedthe efficacy of dental microwear for dietary inferenceamong early hominids (Grine, 1981, 1987; Grine andKay, 1987; Lalueza and Perez-Perez, 1993; Laluezaet al., 1996; Puech, 1992; Puech et al., 1983; Ungar andGrine, 1991; Walker, 1979), fossil primates (Teaford,1993; Teaford et al., 1996; Ungar, 1996), and archaeologi-
cal samples of modern humans (Blaeur and Rose, 1982;Bullington, 1991; Gordon, 1986; Harmon and Rose, 1988;Molleson and Jones, 1991; Molleson et al., 1993; Pastor,1993; Puech, 1976; Schmidt, 2001; Teaford, 1991; Teafordet al., 2001; Ungar and Spencer, 1999).Dental microwear is caused by hard abrasive particles
as they are moved over the tooth surface during chew-ing. Some plant foods contain these particles, known asphytoliths (Baker et al., 1959; Piperno, 1988), and theseare implicated as a cause of both scratches (Mills, 1955;Teaford, 1993; Walker and Teaford, 1989; Walker et al.,1978) and pits (Gugel et al., 2001). Hard nonfood par-ticles, such as dietary grit, can produce a similar effect(Covert and Kay, 1981; Peters, 1982; Teaford and Lytle,1996).Another inferred cause of microwear is tooth-on-tooth
contact (Every, 1974). Such contact might removeenamel flakes (Rensberger, 1978), hydroxyapatite crys-tallites (Teaford and Runestad, 1992; Teaford and Walker,1984), prism-sized chips (Rensberger, 2000; Walker,1984), or anomalous ameloblast-sized enamel that proj-
Grant sponsor: Arts and Humanities Research Council, UnitedKingdom.
*Correspondence to: Patrick Mahoney, Department of Archae-ology, University of Sheffield, North Gate House, West Street,Sheffield, England S1 4ET. E-mail: [email protected]
Received 13 September 2004; accepted 4 April 2005.
DOI 10.1002/ajpa.20311Published online 4 January 2006 in Wiley InterScience
(www.interscience.wiley.com).
VVC 2006 WILEY-LISS, INC.
AMERICAN JOURNAL OF PHYSICAL ANTHROPOLOGY 130:308–319 (2006)

ects beyond the surrounding surface (Boyde, 1989). Thisidea is supported by the presence of dental pits on theteeth of stillborn guinea pigs, and between interproximalsurfaces, because neither are exposed to the abrasiveeffects of food (Teaford and Walker, 1983; Perez-Perezet al., 2003). Potentially, microwear size measurementsmay be able to identify tooth-on-tooth contact, given thatenamel prisms and ameloblasts have average dimensions(4–5 lm; Eisenmann, 1998; Moss-Salentijn and Henr-dricks-Klyvert, 1990).Based on these causal agents, studies on extant spe-
cies correlated variations in microwear patterns (fre-quency and size of pits and scratches) with dietary abra-siveness and texture. For instance, an increase in diet-ary abrasiveness can produce more scratches (e.g.,Teaford and Lytle, 1996; Walker et al., 1978), whileharder diets can generate more pits (e.g., Teaford andWalker, 1984; Teaford, 1985; Strait, 1993). Similar corre-lations were inferred from microwear size measure-ments. For example, harder foods can cause wider pits(Teaford and Oyen, 1989; Teaford and Runestad, 1992),while introducing larger particles into a diet can resultin wider scratches (Ungar, 1992, 1994). However, thetype and amount of force that is exerted during chewingmay influence all of these measurements. For instance, amodel of microwear formation processes developed inchimpanzees suggests that more shear and compressionmay increase scratch length and width, while a reduc-tion in shear and increase in compression might increasepit size (Gordon, 1982).
THE PREHISTORIC ECONOMY
Natufian hunter-gatherers from northern Israel,around the upper/lower Galilee and Mount Carmelregion, exploited a diverse range of potentially edibleanimal and plant foods from both sedentary and moremobile settlements (e.g., Bar Yosef, 1998; see also Fig. 1).Animal foods included gazelle, pig, deer, cattle, caprine,and fish at sites bordering Lake Hulleh (Bar Yosef, 1993;Martin, 1994; Noy, 1993; Perrot, 1993). Plant foodsincluded wild barley, lentils, and nuts (Henry, 1989; Hopfand Bar Yosef, 1987; Noy et al., 1973; Perrot, 1993;Willcox, 1999), some of which might have been preparedfor consumption through dehusking and grinding (e.g.,Hillman, 1984, 1985), using mortars, pestles, and grind-ing stones that were constructed from basalt, limestone,and sandstone (Bar Yosef, 1991, 1993; Henry, 1989; Noy,1993; Perrot, 1960, 1993; Stekelis and Yizraeli, 1963).Early Neolithic people in the study area practiced a
hunting-farming economy from increasingly sedentarysettlements (e.g., Garfinkel, 1987). As with the Natu-fians, animal foods included wild gazelle, cattle, and deer(Gopher, 1997; Hershkovitz and Galil, 1990), thoughcaprine may have been under a degree of human controlat some sites (Galil et al., 1993). Unlike the Natufians,some plant foods, such as emmer wheat, broad beans,and lentils, were cultivated (Galil, 1993; Galil et al.,1993; Garfinkel, 1987) and perhaps prepared for con-sumption using the large grinding tools (querns/grindingslabs) that are a characteristic of early Neolithic people(Galil et al., 1993; Garfinkel, 1993; Gopher, 1997; Goring-Morris, 1995; Wright, 1993).The economy of the Natufian and early Neolithic people
in the study area differs in two ways. First, the sheer vol-ume of potentially edible plant remains at some Neolithicsites, such as emmer wheat and pulses, suggests a dietary
emphasis toward farmed foods (Galil, 1993; Galil et al.,1993; Garfinkel, 1987). Second, the increase in size of stonetools at some Neolithic sites might reflect an increasedemphasis toward grinding plant foods, so that their nutri-tional value could be maximized, perhaps because local cul-tivable land was overexploited (Wright, 1993).
Hypothesis
More stone-ground foods could have increased theamount of hard abrasives entering the early Neolithic diet.This study tests the hypothesis that a harder, more abra-sive diet will produce larger and more frequent pits. Giventhat the seed coats of plants such as wheat are removedprior to consumption (Hillman, 1985), and that these con-tain phytoliths (Piperno, 1988), changes in scratch fre-quency and scratch length are not anticipated.
MATERIALS
The second mandibular molar was selected from 60human skeletons recovered from eight archaeological
Fig. 1. Location of archaeological sites in study area. Inset:Israel and Negev, West Bank, and Gaza Strip. Northern Israel(study area) is framed in inset.
309MICROWEAR PATTERNS FROM HUNTER-GATHERERS AND FARMERS
sites in the study area (Fig. 1). Thirty skeletons datefrom early and late in the Natufian period (HayonimCave, n ¼ 16; Ein Mallaha, n ¼ 8; Nahal Oren Terrace,n ¼ 4; and Raqefet Cave, n ¼ 2) and 30 date from thePPNB/C periods (Kfar Hahoresh, n ¼ 19; Yiftahel, n ¼ 3;Horvat Galil, n ¼ 2; and Atlit Yam, n ¼ 6). Each site hasseveral stratigraphic layers that include well-docu-mented evidence for Natufian (Bar Yosef, 1991; Noy,1989; Noy and Higgs, 1971; Perrot, 1993; Valla et al.,1998) and Neolithic (Galil, 1993; Garfinkel, 1993;Gopher, 1997; Goring Morris, 2000; Hershkovitz et al.,1986; Hershkovitz and Galil, 1990; Hershkovitz andGopher, 1988) habitation. The skeletons are curated atthe Sackler School of Medicine, Tel Aviv University.
METHODS
Developing a methodology
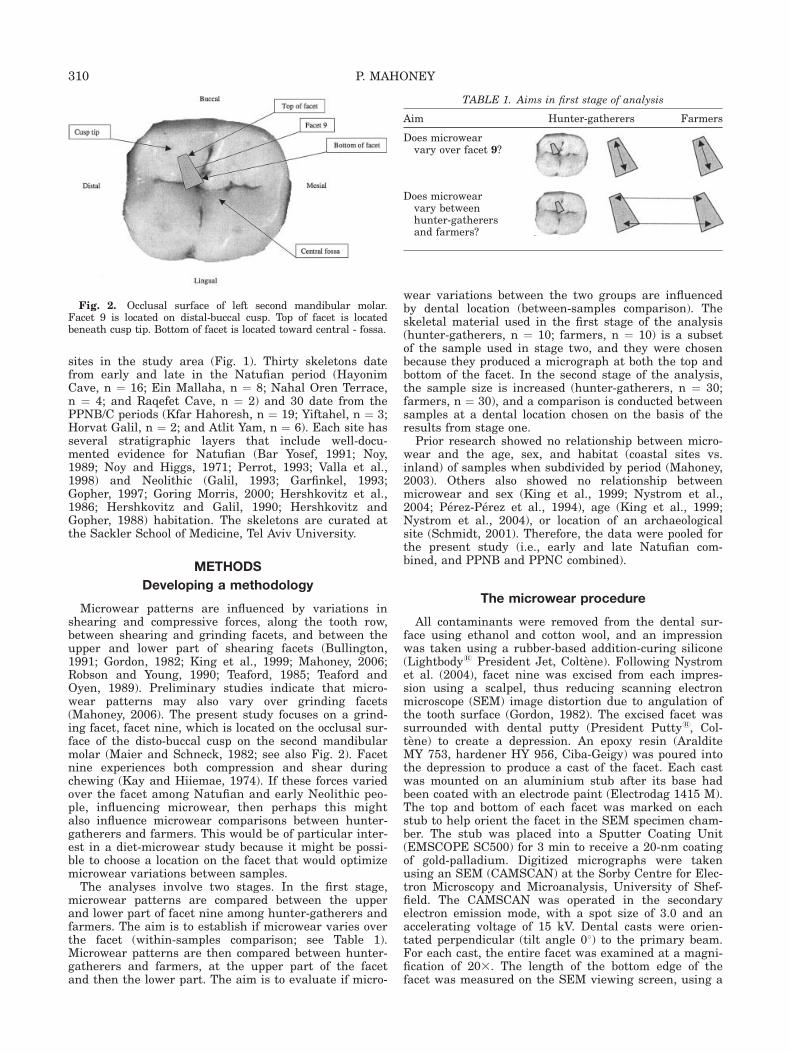
Microwear patterns are influenced by variations inshearing and compressive forces, along the tooth row,between shearing and grinding facets, and between theupper and lower part of shearing facets (Bullington,1991; Gordon, 1982; King et al., 1999; Mahoney, 2006;Robson and Young, 1990; Teaford, 1985; Teaford andOyen, 1989). Preliminary studies indicate that micro-wear patterns may also vary over grinding facets(Mahoney, 2006). The present study focuses on a grind-ing facet, facet nine, which is located on the occlusal sur-face of the disto-buccal cusp on the second mandibularmolar (Maier and Schneck, 1982; see also Fig. 2). Facetnine experiences both compression and shear duringchewing (Kay and Hiiemae, 1974). If these forces variedover the facet among Natufian and early Neolithic peo-ple, influencing microwear, then perhaps this mightalso influence microwear comparisons between hunter-gatherers and farmers. This would be of particular inter-est in a diet-microwear study because it might be possi-ble to choose a location on the facet that would optimizemicrowear variations between samples.The analyses involve two stages. In the first stage,
microwear patterns are compared between the upperand lower part of facet nine among hunter-gatherers andfarmers. The aim is to establish if microwear varies overthe facet (within-samples comparison; see Table 1).Microwear patterns are then compared between hunter-gatherers and farmers, at the upper part of the facetand then the lower part. The aim is to evaluate if micro-
wear variations between the two groups are influencedby dental location (between-samples comparison). Theskeletal material used in the first stage of the analysis(hunter-gatherers, n ¼ 10; farmers, n ¼ 10) is a subsetof the sample used in stage two, and they were chosenbecause they produced a micrograph at both the top andbottom of the facet. In the second stage of the analysis,the sample size is increased (hunter-gatherers, n ¼ 30;farmers, n ¼ 30), and a comparison is conducted betweensamples at a dental location chosen on the basis of theresults from stage one.Prior research showed no relationship between micro-
wear and the age, sex, and habitat (coastal sites vs.inland) of samples when subdivided by period (Mahoney,2003). Others also showed no relationship betweenmicrowear and sex (King et al., 1999; Nystrom et al.,2004; Perez-Perez et al., 1994), age (King et al., 1999;Nystrom et al., 2004), or location of an archaeologicalsite (Schmidt, 2001). Therefore, the data were pooled forthe present study (i.e., early and late Natufian com-bined, and PPNB and PPNC combined).
The microwear procedure
All contaminants were removed from the dental sur-face using ethanol and cotton wool, and an impressionwas taken using a rubber-based addition-curing silicone(Lightbody1 President Jet, Coltene). Following Nystromet al. (2004), facet nine was excised from each impres-sion using a scalpel, thus reducing scanning electronmicroscope (SEM) image distortion due to angulation ofthe tooth surface (Gordon, 1982). The excised facet wassurrounded with dental putty (President Putty1, Col-tene) to create a depression. An epoxy resin (AralditeMY 753, hardener HY 956, Ciba-Geigy) was poured intothe depression to produce a cast of the facet. Each castwas mounted on an aluminium stub after its base hadbeen coated with an electrode paint (Electrodag 1415 M).The top and bottom of each facet was marked on eachstub to help orient the facet in the SEM specimen cham-ber. The stub was placed into a Sputter Coating Unit(EMSCOPE SC500) for 3 min to receive a 20-nm coatingof gold-palladium. Digitized micrographs were takenusing an SEM (CAMSCAN) at the Sorby Centre for Elec-tron Microscopy and Microanalysis, University of Shef-field. The CAMSCAN was operated in the secondaryelectron emission mode, with a spot size of 3.0 and anaccelerating voltage of 15 kV. Dental casts were orien-tated perpendicular (tilt angle 08) to the primary beam.For each cast, the entire facet was examined at a magni-fication of 203. The length of the bottom edge of thefacet was measured on the SEM viewing screen, using a
TABLE 1. Aims in first stage of analysis
Aim Hunter-gatherers Farmers
Does microwearvary over facet 9?
Does microwearvary betweenhunter-gatherersand farmers?
Fig. 2. Occlusal surface of left second mandibular molar.Facet 9 is located on distal-buccal cusp. Top of facet is locatedbeneath cusp tip. Bottom of facet is located toward central - fossa.
310 P. MAHONEY

ruler. After the midpoint was identified, magnificationwas increased to 5003, and a micrograph was taken.Where a facet terminated in a point, the apex of thepoint was chosen. The procedure was repeated at the topof the facet, although ultimately the dental locations var-ied between individuals because of differences in facetsize. Each digitized micrograph (700 3 500 pixels) repre-sented approximately 0.03 mm2 of the tooth surface.A 4:1 length-to-width ratio was used to distinguish
between pits and scratches, which were measured andcounted using a semiautomated image-analysis computerprogram (Microware version 3.0Beta; Ungar, 1997). Theprogram was operated with a resolution of 0.333 lm perpixel (dots per inch [DPI] 152). Eight microwear varia-bles were created automatically by Microware 3.0 foreach micrograph, and these were used in all analyses:total number of features (i.e., total number of pits andscratches combined), mean number of pits, mean numberof scratches, percent pits, mean length and width of pits,and mean length and width of scratches.
Statistical procedure for stage one
Within samples. A paired-samples t-test was used tocompare microwear from the top of the facet with thebottom, in the Natufian and then the early Neolithicsample. This test assumes that the differences calculatedfor each pair have a normal distribution (Norusis, 1991),and this was checked with a Kolmogorov-Smirnov good-ness-of-fit-test (KS-test). In addition, each variable waseither log- or square root-transformed (percent pits arc-sine-transformed; Zar, 1999) to reduce the influence ofunivariate outlying data.
Between samples. An independent-samples t-test waschosen to compare microwear across the two time peri-ods, at the top of the facet and then at the bottom. Thetest assumes that the data have a normal distribution,and that the two groups have an approximately equalvariance. The assumptions were checked with a KS-testand Levene’s test, respectively. Each variable alsoreceived the appropriate transformation (see above). Allstatistical tests were conducted using SPSS 11 for Win-dows. The significance level was set at P � 0.05.
Statistical procedure for stage two
Between samples. A discriminant function analysis(DFA) was chosen to evaluate how well the (significant)microwear patterns characterize the two groups, and toassess how each (significant) microwear variable contrib-utes to between-samples variation. In a DFA, a new vari-able is created from a linear combination of independentvariables (i.e., microwear variables), named a function.Each independent variable is assigned a coefficient,which is selected to maximize the difference betweenpreviously defined groups (i.e., hunter-gatherers or farm-ers). Each individual is assigned a score from the func-tion. The score is used to place the individual in one ofthe two groups. The more successful the function, themore cases are correctly classified. These scores can alsobe plotted, which gives a visual appreciation of the re-sults.In addition to the classification process and a plot of
the discriminating scores, a DFA can be evaluatedthrough a significance test, measures of variance, andstandardized canonical correlation coefficients. A chi-square transformation of Wilks’ lambda tests the null
hypothesis that there is no difference between groupmeans. However, a significant result could, if interpretedin isolation, be misleading. Small differences betweenmeans may be statistically significant, yet this may notnecessarily reflect good discrimination (Norusis, 1993).Good discrimination can be evaluated through the
eigen value (E) and canonical correlation (U). The E valueis the ratio of the between-groups sum of squares to withingroups, and the higher the E value, the better the func-tion’s discriminating power (Norusis, 1993). E values of>0.4 are considered eligible for interpretation (Norusis,1991). The U value is the ratio of between groups to totalvariance, calculated from the scores on the function (Noru-sis, 1993). Correlation is measured between 1 and 0, and ahigh value indicates a successful function.Each variable’s relative contribution to the function
can be assessed through the standardized canonical cor-relation coefficients. These are the constants by whicheach variable is multiplied in order to construct the func-tion; the larger the coefficient, the greater the variable’scontribution to the function.A DFA assumes multivariate normality and homogene-
ity of the variance-covariance matrices (Tabachnick andFidell, 2001), which were checked using Box’s M test.Though not formally required by the DFA assumptions,the test’s discriminating power was improved throughfurther data screening (Tabachnick and Fidell, 2001).Univariate outliers were screened as above. A multivari-ate outlier, to which the DFA is particularly sensitive,was identified through a Mahalanobis measure of dis-tance and removed. Inspection of bivariate scatter plotsand a correlation matrix showed that the data satisfiedrequirements for linearity and multicolinearity, respec-tively. Throughout, a stepwise DFA was chosen becausethere was no reason to assign one of the (significant)independent variables higher priority than another.
RESULTS
Stage one
Within samples. Statistically significant differenceswere found for one variable, i.e., percent pits. The per-centage of pits increased from the top (38.8%) to the bot-tom of the facet (50.3%) among the farmers (P ¼ 0.043).An equivalent comparison indicated no significant differ-ences between the top and bottom of the facet among thehunter-gatherers. Table 2 provides descriptive statisticsfor the first stage of the analysis. Table 3 shows the stat-istical results for the within-samples comparison. Figure 3.shows representative microwear from the upper and lowerpart of the facet.
Between samples. Statistically significant differenceswere found for three variables, pit length, pit width, andscratch width, when the comparison was undertaken atthe bottom of the facet. Dental pits were larger amongfarmers compared to hunter-gatherers (length, 3.9–7.2 lm,P < 0.000; width, 2.0–3.2 lm, P < 0.000). Scratches werealso wider among farmers than hunter-gatherers (1.4–1.7 lm, P ¼ 0.015). Microwear patterns did not varybetween hunter-gatherers and farmers when the com-parison was undertaken at the top of the facet. Table 4shows the statistical results for the between-samplescomparison.
Discussion of stage one results. Even though onlyone microwear variable could distinguish between theupper and lower part of the facet among the farmers,
311MICROWEAR PATTERNS FROM HUNTER-GATHERERS AND FARMERS

variations in pit frequency seem to be an important vari-able for detecting differences between the top and bot-tom of shearing facets (Robson and Young, 1990),between shearing and grinding facets (Teaford andWalker, 1984), and along the tooth row (Gordon, 1982;Mahoney, 2006). In each of these studies, an increase inpit frequency was related to an increase in compression.If the same interpretation is applied in the presentstudy, then the greater frequency of pits at the bottom ofthe facet among farmers reflects relatively greater com-pression at that location. One reason for this may bethat the microwear pattern mirrors the functional designof the molar. The bottom of the facet, toward the inter-cuspal fissure, is a location that is morphologically well-designed to withstand high forces during chewing(Kehra et al., 1990). The intrafacet variation amongearly Neolithic farmers may therefore suggest a need toexert higher bite forces at the bottom of the facet, in away that was not required during the earlier period.Microwear did not vary over the facet among the
hunter-gatherers (Table 3). The lack of variation sug-gests that the shearing and compressive forces that actupon facet nine do not necessarily predetermine micro-wear variations. One reason for this may be that facetnine, a grinding facet, unlike a shearing facet, does nothave the same clear ‘‘leading’’ upper and ‘‘trailing’’ loweredge as it moves over the surface of the opposing molarduring the chewing cycle. Perhaps this precludes biome-chanicaly predetermined forces occurring at the upper
and lower part of facet nine, in the way that it seems toon shearing facets from marsupials (e.g., Robson andYoung, 1990).Based on the results from the comparison between the
samples in the first stage of the analysis, the bottom ofthe facet was chosen for stage two, because this dentallocation optimized the microwear variations betweensamples.
Stage two
Between samples. One discriminant function was cal-culated with an v2 (2) of 14.656, P ¼ 0.002, which indi-cated that the mean of the function was not equal acrosstime periods. The function assigned 78% of the cases tothe correct dietary group (hunter-gatherers ¼ 76.9%,farmers ¼ 79.2%). The high proportion of individualscorrectly classified indicated that an increase in pit sizeand scratch width was a good combination of variablesfor emphasizing differences between the two groups.This interpretation was supported by the measures ofvariance (U ¼ 0.472; R ¼ 0.621) and the plot of the dis-criminant scores taken from each individual, which illus-trated the good visual separation between hunter-gath-erers and farmers. Based on the standardized canonicalcorrelation coefficients, scratch width made the greatestcontribution to the discrimination between the groups(pit width ¼ 0.677, pit length ¼ 0.687, scratch width ¼0.946). Table 5 provides descriptive statistics for the sec-ond stage of the analysis. Figure 4 is a plot of the dis-criminant scores and representative micrographs.
DISCUSSION
The increase in pit size suggests that the diet becameharder during the Neolithic period (Table 5, Fig. 4). Thisresult supports the idea that the early farmers reliedmore heavily on stone-ground plant foods (Wright, 1993).These tools were constructed from sandstone, limestone,and basalt, which contain particles of grit, like quartzinclusions, which are harder than enamel (Baker et al.,1959; Pough, 1996). More use of the tools might there-fore have introduced more grit into the early Neolithicdiet, producing a harder diet and larger pits (e.g., Pastor,1993). The sheer volume of plant foods at Neolithic sites,like wheat, which can be processed with stone tools sup-ports this interpretation (Galil et al., 1993; Garfinkel,1987; Hillman, 1984, 1985). However, the width of pits
TABLE 3. Within-samples comparison for stage one,with significant differences in bold1
Variable
Hunter-gatherers Farmers
t df P t df P
Total numberof features
0.615 9 0.554 0.945 9 0.369
Mean numberof pits
0.752 9 0.472 �0.403 9 0.696
Mean numberof scratches
0.093 9 0.928 1.415 9 0.191
Percent pits 0.458 9 0.648 �2.359 9 0.043Mean pit length 1.473 9 0.175 �1.294 9 0.228Mean pit width 0.049 9 0.962 �0.745 9 0.476Mean scratchlength
�0.777 9 0.457 0.290 9 0.779
Mean scratchwidth
�0.379 9 0.713 �0.441 9 0.669
1 Paired-samples t-test.
TABLE 2. Mean values and standard deviations (SD) for first stage of analysis1
Variable
Hunter-gatherers (n ¼ 10) Farmers (n ¼ 10)
Top Bottom Top Bottom
Mean SD Mean SD Mean SD Mean SD
Total number offeatures
142.7 81.5 135.7 69.4 99.8 45.7 100.3 25.8
Mean number of pits 69.5 53.6 63.3 40.6 38.8 19.4 50.5 15.7Mean number ofscratches
73.2 32.7 72.4 33.7 61.0 25.4 49.8 17.5
Percent pits 48.7 14.3 46.6 13.9 38.8 11.8 50.3 10.8Mean pit length 4.1 0.9 3.9 0.7 5.6 1.6 7.2 2.9Mean pit width 2.0 0.4 2.0 0.3 2.9 0.8 3.2 0.9Mean scratch length 25.2 6.8 27.9 8.5 30.4 10.8 39.0 11.0Mean scratch width 1.4 0.1 1.4 0.3 1.6 0.1 1.7 0.1
1 Top, top of facet; Bottom, bottom of facet.
312 P. MAHONEY

Fig. 3. Microwear at top and bottom of facet 9. A: Cast of facet 9 from second mandibular molar (inset), as seen on SEM view-ing screen (magnification 203). B: A few dental pits at top of facet (arrows indicate pits). C: Increase in pit frequency at bottomof facet, compared to top. B and C are montages, created from several adjacent and overlapping micrographs. Each montagerepresents approximately 0.50 mm2 (B) and 1 mm2 (C) of enamel surface. Micrograph magnification ¼ 5003, resolution ¼ 3, kilo-voltage ¼ 5.
TABLE 4. Between-samples comparison for stage one,with significant differences in bold1
Variable
Top of facet Bottom of facet
t df P t df P
Total numberof features
�1.424 18 0.174 2.170 18 0.096
Mean numberof pits
�0.698 18 0.494 1.728 18 0.101
Mean numberof scratches
�1.678 18 0.111 1.657 18 0.115
Percent pits 0.880 18 0.391 0.960 18 0.350Mean pit length 0.660 18 0.518 �4.457 18 0.000Mean pit width 0.424 18 0.667 �4.430 18 0.000Mean scratch length �0.589 18 0.563 �0.124 18 0.903Mean scratch width 0.764 18 0.460 �2.691 18 0.015
1 Independent-samples t-test.
TABLE 5. Mean values and standard deviations (SD) forsecond stage of analysis1
Variable
HG (n ¼ 30) F (n ¼ 30)
Mean SD Mean SD
Total numberof features
166.5 22.5 195.3 19.1
Mean numberof pits
85.0 12.4 95.6 11.2
Mean numberof scratches
81.5 10.1 99.7 8.1
Percent pits 51.0 15.1 49.0 15.6Mean pit length 4.7 1.8 5.2 2.2Mean pit width 2.4 0.2 2.5 0.1Mean scratch length 23.8 8.6 26.1 8.8Mean scratch width 1.4 0.1 1.5 0.2
1 HG, hunter-gatherer; F, farmer.
313MICROWEAR PATTERNS FROM HUNTER-GATHERERS AND FARMERS

Fig. 4. Plot of discriminant function analysis. Plot illustrates discrimination between hunter-gatherers (l) and farmers (*),using combination of variables scratch width, pit width, and pit length. Large raised indicators (centroids) illustrate means of func-tion for each group. Representative micrographs beneath plot illustrate difference in size of pits and scratches. A: Small (lengthand width) pits from hunter-gatherers (indicated by arrow). B: Large pits from agriculturalists (indicated by arrow). C: Narrowdental scratches from hunter-gatherers (indicated by arrows). D: Wide scratches from agriculturalists (indicated by arrow). NO 15,Nahal Oren skeletal number 15; K 72, Kfar Hahoresh skeletal number 72; H 17, Hayonim Cave skeletal number 17; AY 43, AtlitYam skeletal number 3; Res, Resolution; KV, accelerating voltage. Magnification, 3500 (original magnification); Size bar ¼ 10 lm.
314 P. MAHONEY

from the farmers (2.5 lm) does not suggest that theharder diet also led to more tooth-on-tooth contact.The increase in scratch width during the Neolithic period
is probably a result of the harder diet. Harder diets canrequire high bite forces (Lucas et al., 1994). A model ofmicrowear formation processes developed in chimpanzeessuggests that high bite forces, such as greater compression,might produce larger scratches (e.g., Gordon, 1982). Apply-ing inferences gained from microwear research on chim-panzees to humans should not be problematic, given theirsimilarities in enamel structure and the way that micro-wear responds to shear and compression (Boyde, 1989;Gordon, 1982; Mahoney, 2006).The relationship between the width of the scratches and
pits among hunter-gatherers and farmers suggests a simi-lar causal agent (e.g., Teaford, 1993; Nystrom et al., 2004).The pits are not that much larger than the scratches(mean width of scratches ¼ 58% of mean pit width amonghunter-gatherers; mean width of scratches ¼ 60% of meanpit width among farmers; Table 5). This relationship com-pares well to a study conducted by Teaford et al. (2001) onarchaeological samples of modern humans, in which pitsand scratches were attributed to the same cause (meanwidth of scratches ¼ 34% of mean pit width in the prehis-toric sample; mean width of scratches ¼ 38% of pit widthin the mission sample; data taken from Table 4.15 in Tea-ford et al., 2001). Therefore, perhaps dietary grit was animportant cause of microwear in both periods.While an increase in pit size across the two time peri-
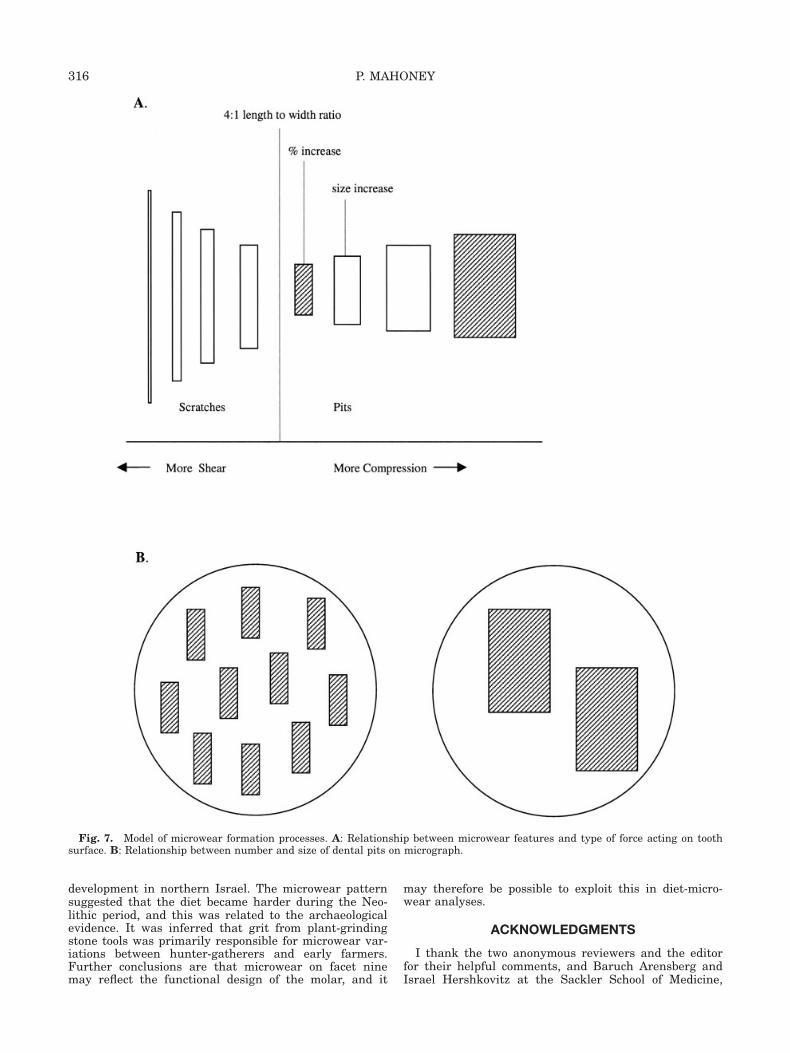
ods was predicted, the decline in percentage of pits wasnot (Table 5). Yet studies on extant species showed thatharder diets often generate more pits, not less. Unex-pectedly, simple correlations indicate a significant nega-tive relationship between the percentage and width ofpits among hunter-gatherers (Pearson’s R ¼ �0.420; P ¼0.021; Fig. 5) and farmers (Pearson’s R ¼ �0.463; P ¼0.010; Fig. 6). As pit size increases in both groups, pitfrequency decreases. One explanation for this relationshipis that the frequency and size of pits might reflect a contin-uum during microwear formation processes (Fig. 7). Asshear decreases and compression increases, featuresbecome shorter and wider, and are more likely categorizedas a pit (Gordon, 1982). The point at which a feature is clas-sified as a pit using a 4:1 ratio, rather than a scratch, pro-duces an increase in pit frequency. As compression contin-ues to increase hard particles are driven deeper into theenamel, and pit size increases (Ryan, 1979). Decreases infrequency might then occur as adjacent pits begin to merge.Under this hypothesis, the negative correlation between pitsize and frequency among hunter-gatherers and farmersreflects increasing compression.Most of the time, major differences in microwear occur
during the transition to farming (e.g., Pastor, 1993). Yethere, there is some consistency between samples. Varia-tion occurs between samples at the bottom of the facet,but not at the top (Table 4). One explanation is thatmicrowear variation between samples reflects the func-tional design of the molar, just like the variation withinsamples (Table 3). Both patterns suggest that farmersexerted more compression at the bottom of the facet,toward the basin of the tooth, a location that is well-designed for resisting such force. This interpretation issupported by the lack of variation between samples atthe top of the facet (Table 4). The top of the facet, towardthe cusp tip, is unsupported by the bulk of the tooth andless able to withstand high forces during chewing (e.g.,Macho and Spears, 1999). If more bite force was required
by the Neolithic diet, then differences between Natufiansand early farmers would not be expected at that dentallocation.These results suggest that microwear analyses are
capable of detecting subtle dietary developments withaccompanying changes in mastication (i.e., more and lessforce) in a geographically localized area (i.e., northernIsrael). This furthers our understanding about dietaryhardness across the transition to agriculture, because itshows that an increased reliance on food processing doesnot necessarily produce a less resistant diet, which hasbeen inferred from macrowear studies (e.g., Smith,1984). Indeed, the results from the microwear analysisare incongruent with her study on hunter-gatherers andfarmers. Smith (1984, p 54) attributed differences in macro-wear between such economies to less resistant foods duringthe Neolithic period due to a greater reliance on grindingstones and pottery for food preparation. The archaeologicalperiods chosen for the present study were prepottery peri-ods. Therefore, perhaps the introduction of pottery in thestudy area would also have led to a softer diet. Indeed, pre-vious microwear research inferred that the introduction ofpottery can have a profound effect on dietary hardness(Molleson et al., 1993).
CONCLUSIONS
The aim of this study was to infer dietary texture fromdental microwear during the Natufian to early Neolithic
Fig. 5. Correlation between pit frequency and pit widthamong hunter-gatherers.
Fig. 6. Correlation between pit frequency and pit widthamong farmers.
315MICROWEAR PATTERNS FROM HUNTER-GATHERERS AND FARMERS
development in northern Israel. The microwear patternsuggested that the diet became harder during the Neo-lithic period, and this was related to the archaeologicalevidence. It was inferred that grit from plant-grindingstone tools was primarily responsible for microwear var-iations between hunter-gatherers and early farmers.Further conclusions are that microwear on facet ninemay reflect the functional design of the molar, and it
may therefore be possible to exploit this in diet-micro-wear analyses.
ACKNOWLEDGMENTS
I thank the two anonymous reviewers and the editorfor their helpful comments, and Baruch Arensberg andIsrael Hershkovitz at the Sackler School of Medicine,
Fig. 7. Model of microwear formation processes. A: Relationship between microwear features and type of force acting on toothsurface. B: Relationship between number and size of dental pits on micrograph.
316 P. MAHONEY

Tel Aviv University, for allowing access to samples intheir care.
LITERATURE CITED
Baker G, Jones LHP, Wardrop ID. 1959. Cause of wear insheeps’ teeth. Nature 184:1583–1584.
Bar Yosef O. 1991. The archaeology of the Natufian layer atHayonim Cave. Int Monogr Prehist Archaeol Ser 1:81–92.
Bar Yosef O. 1992. The Neolithic period. In: Ben-Tor A, editor.The archaeology of ancient Israel. Open University. Yale Uni-versity Press. p 10–39.
Bar Yosef O. 1993. Hayonim cave. In: Lewinson-Gilboa A,Aviram J, editors. The new encyclopedia of archaeologicalexcavations in the Holy Land, II. New York: Simon andSchuster. p 590–591.
Bar Yosef O. 1998. The Natufian culture in the Levant: thresholdto the origins of agriculture. Evol Anthropol 6:159–77.
Bar Yosef O, Belfer-Cohen A. 1989. The origin of sedentism andfarming communities in the Levant. J World Prehist 3:447–498.
Blaeuer MW, Rose JC. 1982. Bioarchaeology of the Powell Canalsite. In: House JH, editor. Powell Canal. Arkansas Archaeo-logical Survey publication no. 19. Fayetteville: ArkansasArchaeological Survey. p 72–84.
Boyde A. 1989. Enamel. In: Berkovitz BKB, Boyde A, FrankRM, Hohling HJ, Moxham BJ, Nalbandian J, Tonge CH, edi-tors. Teeth: handbook of microscopic anatomy (volume, V/6).New York: Springer Verlag. p 309–407.
Bullington J. 1991. Deciduous dental microwear of prehistoricjuveniles from the lower Illinois Valley. Am J Phys Anthropol84:59–73.
Clutton-Brock J. 1971. The primary animals of the Jericho tellfrom the proto-Neolithic to the Byzantine period. Levant3:41–55.
Colledge S. 1994. Plant exploitation on epi-Palaeolithic andearly Neolithic sites in the Levant. Ph.D. thesis, University ofSheffield.
Covert HH, Kay RF. 1981. Dental microwear and diet: implica-tions for determining the feeding behaviors of extinct pri-mates, with a comment on the dietary pattern of Sivapithe-cus. Am J Phys Anthropol 55:1–36.
Eisenmann DR. 1998. Enamel structure. In: Cate AR, editor.Oral histology. Development, structure and function. 5th ed.St. Louis: Mosby-Year Book, Inc. p 218–235.
Eshed V, Gopher A, Gage TB, Hershkovitz I. 2004a. Has thetransition to agriculture reshaped the demographic structureof prehistoric populations? New evidence from the Levant.Am J Phys Anthropol 124:315–329.
Eshed V, Gopher A, Galili E, Hershkovitz I. 2004b. Musculoske-letal stress markers in Natufian hunter-gatherers and Neo-lithic farmers in the Levant: the upper limb. Am J PhysAnthropol 123:303–315.
Every RG. 1974. Thegosis in prosimians. In: Martin RD, WalkerA, Doyle GA, editors. Prosimian biology. London: Duckworth.p 579–620.
Galil E. 1993. Atlit: prehistoric site on the sea floor. In: Lewin-son-Gilboa A, Aviram J, editors. The new encyclopaedia ofarchaeological excavations in the Holy Land, I. New York:Simon and Schuster. p 120–122.
Galil E, Weinstein-Evron M, Hershkovitz I, Kislev M, LernauO, Kolska-Horwitz L, Lernau H. 1993. Atlit-Yam: a prehistoricsite off the Israel coast. J Field Archaeol 20:133–156.
Garfinkel Y. 1987. Yiftahel: a Neolithic village from the seventhmillennium B.C. in lower Galilee, Israel. J Field Archaeol14:199–212.
Garfinkel Y. 1993. Yiftahel. In: Lewinson-Gilboa A, Aviram J,editors. The new encyclopaedia of archaeological excavations inthe Holy Land, IV. New York: Simon and Schuster. p 1511–1512.
Garrod DAE. 1957. The Natufian culture: the life and economyof a Mesolithic people in the Near East. Proc Br Acad 43:211–227.
Gopher A. 1997. Horvat Galil—an early PPNB site in the upperGalilee, Israel. Tel Aviv 24:183–222.
Gordon KD. 1982. A study of microwear on chimpanzee molars:implications for dental microwear analysis. Am J PhysAnthropol 59:195–215.
Gordon KD. 1986. Dental microwear analysis to detect humandiet. Am J Phys Anthropol 69:206–207.
Goring-Morris N. 1995. Investigations at an early Neolithic set-tlement in the lower Galilee: results of the 1991 season atKfar Hahoresh. Atiqot 27:37–62.
Goring-Morris N. 2000. The quick and the dead. The social con-text of aceramic Neolithic mortuary practices as seen fromKfar Hahoresh. In: Kuijt I, editor. Life in Neolithic farmingcommunities. New York: Kluwer Academic/Plenum Publish-ers. p 103–136.
Grine FE. 1981. Trophic differences between ‘‘gracile’’ and‘‘robust’’ australopithecines: a scanning electron microscopeanalysis of occlusal events. S Afr J Sci 7:203–230.
Grine FE. 1987. Quantitative analysis of occlusal microwearin Australopithecus and Paranthropus. ScanMicrosc 1:647–656.
Grine FE, Kay RF. 1987. Early hominid diets from quantitativeimage analysis of dental microwear. Nature 333:765–768.
Gugel IL, Grupe G, Kunzelmann KH. 2001. Simulation of den-tal microwear: characteristic traces by opal phytoliths givesclues to ancient human dietary behavior. Am J Phys Anthro-pol 114:124–138.
Harmon AM, Rose JC. 1988. The role of dental microwear anal-ysis in the reconstruction of prehistoric diet. In: Kennedy BV,LeMoine GM, editors. Diet and subsistence: current archaeo-logical perspectives. Calgary: Archaeological Association ofthe University of Calgary. p 267–272.
Henry DO. 1989. From foraging to agriculture. The Levant at theend of the Ice Age. Philadelphia: University of Pennsylvania Press.
Hershkovitz I, Galil E. 1990. 8000 year-old human remains onthe sea floor near Atlit, Israel. J Hum Evol 5:319–358.
Hershkovitz I, Gopher A. 1988. Human burials from HorvatGalil: a pre-pottery Neolithic site in the upper Galilee, Israel.Paleorient 14:110–125.
Hershkovitz I, Garfinkel Y, Arensburg B. 1986. Neolithic skele-tal remains at Yiftahel, area C. Paleorient 12:73–81.
Hillman G. 1984. Traditional husbandry and processing ofarchaic cereals in modern times: part I, the glume wheats.Bull Sumer Agric 1:114–152.
Hillman G. 1985. Traditional husbandry and processing ofarchaic cereals in recent times: part II, the free-threshingcereals. Bull Sumer Agri 2:1–31.
Hopf M, Bar Yosef O. 1987. Plant remains from Hayonim Cave.Paleorient 13:117–120.
Kay RF, Hiiemae K. 1974. Jaw movement and tooth use inrecent and fossil primates. Am J Phys Anthropol 40:227–256.
Kenyon K. 1957. Excavations at Jericho. Palestine Explor Q3:67–82.
Khera SC, Carpenter CW, Staley RN. 1990. Anatomy of cusps ofposterior teeth and their fracture potential. J Prosthet Dent64:139–147.
King T, Aiello LC, Andrews P. 1999. Dental microwear of Gri-phopithecus alpani. J Hum Evol 36:3–31.
Lalueza C, Perez-Perez A. 1993. The diet of the Neanderthalchild Gibraltar 2 (Devil’s Tower) through the study of the ves-tibular striation pattern. J Hum Evol 24:29–41.
Lalueza C, Perez-Perez A, Turbon D. 1996. Dietary inferencesthrough buccal microwear analysis of Middle and Upper Pleis-tocene human fossils. Am J Phys Anthropol 100:367–387.
Legge A. 1996. The beginning of caprine domestication in South-west Asia. In: Harris DR, editor. The origins and spread of agri-culture and pastoralism in Eurasia. London: UCL Press. p 238–262.
Lucas P, Peters CR, Arrandale SR. 1994. Seed-breaking forcesexerted by orangutans with their teeth in captivity and a newtechnique for estimating forces in the wild. Am J PhysAnthropol 94:365–378.
Macho GA, Spears IR. 1999. Effects of loading on the biome-chanical behavior of molars of Homo, Pan, and Pongo. Am JPhys Anthropol 109:211–227.
317MICROWEAR PATTERNS FROM HUNTER-GATHERERS AND FARMERS

Mahoney P. 2003.Human dental microwear in Natufian hunter-gatherers and pre-pottery Neolithic agriculturalists fromnorthern Israel. Ph.D. dissertation, University of Sheffield.
Mahoney P. 2006. Brief communication: intertooth and intra-facet dental microwear variation in an archaeological sampleof modern humans from the Jordan Valley. Am J Phys Anthro-pol 129:39–44
Maier W, Schneck G. 1982. Functional morphology of hominoiddentitions. J Hum Evol 11:693–696.
Martin L. 1994.Hunting and herding in a semi-arid region: anarchaeological and ethnological analysis of the faunal remainsfrom the epi-Palaeolithic and Neolithic of the eastern Jordansteppe. Ph.D. dissertation, University of Sheffield.
Mellaart J. 1975. The Neolithic of the Near East. London:Thames and Hudson.
Mills JR. 1955. Ideal dental occlusion in the primates. DentPract 6:47–63.
Molleson T, Jones K. 1991. Dental evidence for dietary changeat Abu Hureyra. J Archaeol Sci 18:525–539.
Molleson T, Jones K, Jones S. 1993. Dietary change and theeffect of food preparation on microwear patterns in the LateNeolithic at Abu Hureyra, northern Syria. J Hum Evol24:455–468.
Moore AMT. 1982. The first farmers in the Levant. In: YoungTC, Smith P, Mortensen P, editors. The hilly flanks andbeyond: essays on the prehistory of southwestern Asia. Stud-ies in ancient civilization, no. 36. Chicago: Oriental Institute.p 91–112.
Moss-Salentijn L, Hendricks-Klyvert M. 1990. Dental and oraltissues. 3rd ed. Baltimore: Williams and Wilkins.
Norusis MJ. 1991. The SPSS guide to data analysis for SPSS/PCþ. 2nd ed. Chicago: SPSS, Inc.
Norusis MJ. 1993. SPSS for Windows professional statisticsrelease 6.0. Chicago: SPSS, Inc.
Noy T. 1989. Some aspects of Natufian mortuary behaviour atNahal Oren. BAR Int Ser 508:53–58.
Noy T. 1993. Nahal Oren. In: Lewinson-Gilboa A, Aviram J,editors. The new encyclopaedia of archaeological excavations inthe Holy Land, II. New York: Simon and Schuster. p 1167–1170.
Noy T, Higgs E. 1971. Raqefet cave. Israel Explot J 21:225–226.Noy T, Legge AJ, Higgs ES. 1973. Recent excavations at Nahal
Oren, Israel. Proc Prehist Soc 39:75–99.Nystrom P, Phillips-Conroy JE, Jolly CJ. 2004. Dental micro-
wear in anubis and hybrid baboons (Papio hamadryas, sensulato) living in Awash National Park, Ethiopia. Am J PhysAnthropol 125:279–291.
Pastor R. 1993. Dental microwear among prehistoric inhabitants ofthe Indian subcontinent: a quantitative and comparative analy-sis. Ph.D. dissertation. University of Oregon at Eugene.
Perez-Perez A, Lalueza C, Turbon D. 1994. Intraindividual andintragroup variability of buccal tooth striation pattern. Am JPhys Anthropol 94:175–187.
Perez-Perez A, Espurz V, de Castro JMB, de Lumley MA,Turbon D. 2003. Non-occlusal dental microwear variability ina sample of Middle and Late Pleistocene human populationsfrom Europe and the Near East. J Hum Evol 44:497–513.
Perrot J. 1960. Excavations at Eynan (Ein Mallaha). Prelimi-nary report on the 1959 season. Isr Explor J 2:14–22.
Perrot J. 1993. Enan. In: Lewinson-Gilboa A, Aviram J, editors.The new encyclopaedia of archaeological excavations in theHoly Land, III. New York: Simon and Schuster. p 389–393.
Peters C. 1982. Electron-optical microscope study of incipientdental microdamage from experimental seed and bone crush-ing. Am J Phys Anthropol 57:283–301.
Piperno DR. 1988. Phytolith analysis: an archaeological andgeological perspective. San Diego: Academic Press.
Pough FH. 1996. Rocks and minerals. New York: Houghton Mif-flin Co.
Puech PF. 1976. Recherche sur le mode d’alimentation des hommesdu Paleolithique par l’etude microscopique des couronnes den-taires. In: de Lumley H, editor. La prehistoire Francaise I. Paris:Centre National de la Recherche Scientifique. p 708–709.
Puech PF. 1992. Microwear studies of early African hominidteeth. Scan Microsc 6:1083–1088.
Puech PF, Albertini H, Serratrice C. 1983. Tooth wear and diet-ary patterns in early hominids from Laetoli, Hadar and Oldu-vai. J Hum Evol 12:721–729.
Rensberger JM. 1978. Scanning electron microscopy of wearand occlusal events in some small herbivores. In: Butler PM,Joysey KA, editors. Development, function and evolution ofteeth. London: Academic Press. p 415–437.
Rensberger JM. 2000. Pathways to functional differentiationin mammalian enamel. In: TeafordM,Meredith Smith M, Fergu-son MWJ, editors. Development, function and evolution of teeth.Cambridge: Cambridge University Press. p 252–268.
Robson SK, Young WG. 1990. A comparison of tooth microwearbetween an extinct marsupial predator, the Tasmanian tigerThylacinus cynocephalus (Thylacinidae) and extant scavenger,the Tasmanian devil Sarcophilus harrisii (Dasyuridae: Mar-supialia). Aust J Zool 37:575–589.
Rollefson G, Kohler-Rollefson I. 1989. The collapse of early Neolithicsettlements in the southern Levant. BAR Int Ser 508:73–90.
Ryan A. 1979. Wear striation direction on primate teeth. Am JPhys Anthropol 50:155–168.
Schmidt CW. 2001. Dental microwear evidence for a dietaryshift between two nonmaize-reliant prehistoric human popula-tions from Indiana. Am J Phys Anthropol 114:139–145.
Sillen A. 1981. Strontium and diet at the Hayonim Cave. Am JPhys Anthropol 56:131–137.
Sillen A. 1986. Dietary reconstruction and Near Eastern archae-ology. Expedition 28:16–22.
Smith BH. 1984. Patterns of molar wear in hunter-gatherersand agriculturalists. Am J Phys Anthropol 63:39–56.
Smith P. 1972. Diet and attrition in the Natufians. Am J PhysAnthropol 37:233–238.
Smith P, Bar-Yosef O, Sillen A. 1984. Archaeological and skele-tal evidence for dietary change during the late Pleistocene/early Holocene in the Levant. In: Cohen MN, Armelagos GJ,editors. Palaeopathology at the origins of agriculture. NewYork: Academic Press. p 101–136.
Steckelis M, Yizraely T. 1963. Excavations at Nahal Oren. Pre-liminary report. Isr Explor J 13:1–12.
Strait S. 1993. Molar microwear in extant small-bodied faunivo-rous mammals: an analysis of feature density and pit fre-quency. Am J Phys Anthropol 92:63–79.
Tabachnick BG, Fidell L. 2001. Using multivariate statistics.4th ed. Needham Heights, MA: Allyn and Bacon.
Teaford MF. 1985. Molar microwear and diet in the genusCebus. Am J Phys Anthropol 66:363–370.
Teaford MF. 1991. Dental microwear: what can it tell us about dietand dental function? In: Kelley MA, Larsen CS, editors. Advan-ces in dental anthropology. New York: Alan R. Liss. p 341–356.
Teaford MF. 1993. Dental microwear and diet in extant andextinct Theropithecus: preliminary analyses. In: JablonskiNG, editor. Theropithecus: the life and death of a primategenus. Cambridge: Cambridge University Press. p 331–349.
Teaford MF, Lytle JD. 1996. Brief communication: diet-inducedchanges in rates of human tooth microwear: a case study involv-ing stone-ground maize. Am J Phys Anthropol 100:143–147.
Teaford MF, Oyen OJ. 1989. Differences in the rate of molarwear between monkeys raised on different diets. J Dent Res6:1513–1518.
Teaford MF, Runestad JA. 1992. Dental micowear and diet inVenezualan primates. Am J Phys Anthropol 88:347–364.
Teaford MF, Walker A. 1983. Dental microwear in adult and stillborn guinea pigs (Cavia porcellus). Arch Oral Biol 28:1077–1081.
Teaford MF, Walker A. 1984. Quantitative differences in dentalmicrowear between primate species with different diets and acomment on the presumed diet of Sivapithecus. Am J PhysAnthropol 64:191–200.
Teaford MF, Maas M, Simons, EL. 1996. Dental microwear andmicrostructure in early Oligocene primates from the Fayum,Egypt: implications for diet. Am J Phys Anthropol 101:527–543.
Teaford MF, Larsen CS, Pastor RF, Noble VE. 2001. Pits andscratches. Microscopic evidence of tooth use and masticatorybehaviour in La Florida. In: Larsen CS, editor. Bioarchaeologyof La Florida: human biology in the northern frontier NewSpain. Gainesville: University Press of Florida. p 82–112.
318 P. MAHONEY

Ungar PS. 1992. Feeding behavior and dental microwear inSumatran anthropoids. Ph.D. dissertation, State University ofNew York at Stony Brook.
Ungar PS. 1994. Incisor microwear of Sumatran anthropoid pri-mates. Am J Phys Anthropol 94:339–363.
Ungar PS. 1996. Dentalmicrowear of EuropeanMiocene catarrhines:evidence for diets and tooth use. JHumEvol 31:355–366.
Ungar PS. 1997. Microware 3. http://comp.uark.edu/�pungar/Ungar PS, Grine FE. 1991. Incisor size and wear in Australopi-
thecus africanus and Paranthropus robustus. J Hum Evol 20:313–340.
Ungar PS, Spencer MA. 1999. Incisor microwear, diet, and toothuse in three Amerindian populations. Am J Phys Anthropol109:387–396.
Valla FR, Khalaily H, Samuelian N, Bocquentin F, Delange C,Valentin B, Plisson H, Rabinovitch R, Belfer-Cohen A. 1998.Le Natoufien final et les nouvelles fouilles a Mallaha (Eynan),Israel, 1996–1997. Mitekufat Haeven 28:105–176.
Walker A. 1979. SEM analysis of microwear and its correlationswith dietary patterns. Am J Phys Anthropol 50:489.
Walker A. 1984. Mechanisms of honing in the male babooncanine. Am J Phys Anthropol 65:47–60.
Walker A, Teaford M. 1989. Inferences from quantitative analysisof dental microwear. Folia Primatol (Base1) 53:177–189.
Walker A, Hoeck HN, Perez L. 1978. Microwear of mammalianteeth as an indicator of diet. Science 201:908–910.
Willcox G. 1998. Archaeobotanical evidence for the beginningsof agriculture in Southwest Asia. In: Damania AB, Valkoun J,Willcox G, Qualset CO, editors. The origins of agriculture andcrop domestication. Aleppo, Syria: ICARDA. p 25–38.
Willcox G. 1999. Agarian change and the beginnings of cultiva-tion in the Near East: evidence from wild progenitors, experi-mental cultivation and archaeobotanical data. In: Godsen C,Hather J, editors. The prehistory of food: appetites for change.London: Routledge. p 478–500.
Wright K. 1993. Early Holocene ground stone assemblages inthe Levant. Levant 25:93–111.
Zar JH. 1999. Biostatistical analysis. 4th ed. Upper Saddle River,NJ: Prentice Hall.
319MICROWEAR PATTERNS FROM HUNTER-GATHERERS AND FARMERS