densitometric analysis of body composition: revision of some quantitative assumptions
TRANSCRIPT

DENSITOMETRIC ANALYSIS OF BODY COMPOSITION: REVISION OF SOME QUANTITATIVE ASSUMPTIONS*
Josef Broiek,t Francisco Grande, Joseph T. Anderson, Ancel Keys Laboratory of Physiological Hygiene, University of Minnesota,
Minneapolis, Minn.
Introduction
One can trace to Archimedes the idea that in a system consisting of two additive components which are mixed but the densities of which are known ( d l , d 2 ) , the determination of the density of the system ( D ) allows one to calculate the proportional masses of the two components. Let’s denote these components as W1 and W2.S Then, in a system with total weight W = W1 + Wz, the general equation for calculating component W1 ex- pressed as a fraction (w1) of the total body weight is:
(Keys & Broiek, 1953, equation 11, p. 276).
How do we go about applying this concept to the calculation of the fat content of the human body? In the Minnesota system of densitometric analysis of body composition, the two basic constituents into which the body weight ( W ) of an individual is partitioned have been defined as ( 1) R , the constituent corresponding in density and composition to that of a “reference man,” and ( 2 ) G, the “obesity tissue”§:
W = R + G . (2)
Having determined the body density ( Dn) of an individual, we can com- pute G by substituting, in Equation 1, the appropriate densities ( dn and d c ) of the two constituents ( R and G) , and the observed density of the body, Do:
It is now feasible to compute the fat association with the compartment corresponding to the “reference body mass,” f R , and with the “obesity tis- sue,’’ f c . Their sum will give us total body fat, f B .
* The research presented here was supported in part by a grant from the U. S. Public Health Service to A. Keys (Grant H-4997).
f Present address: Lehigh University, Bethlehem, Pa. 4 The comnsrhents when referred to in general or when given in kg. are denoted
by capitals. When expressed as fractions of body weight, they are represented by the corresponding lower-case letters.
Q The term “obesity tissue” was coined so as to differentiate it from the anatomically defined adipose tissue. Obesity tissue represents a “body compartment,” a construct defined in terms of specified manipulative and arithmetical operations.
113
114
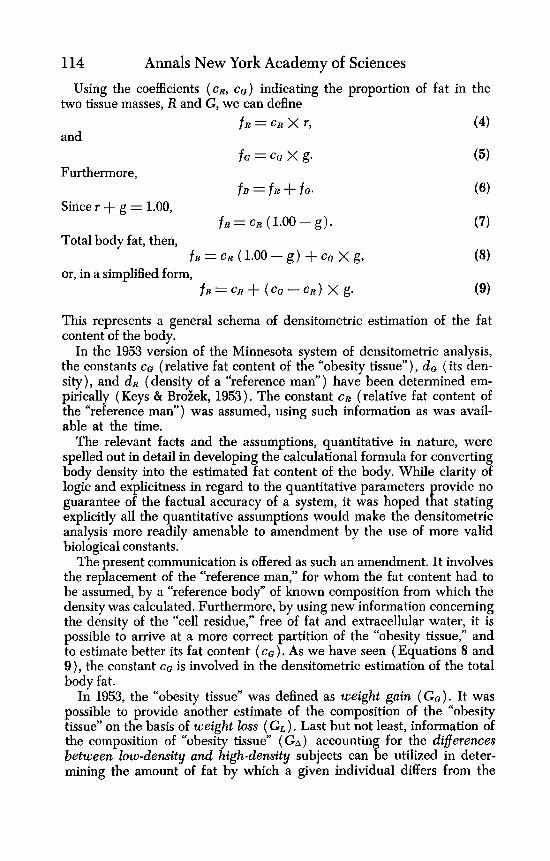
two tissue masses, R and G, we can define
and
Furthermore,
Since r + g = 1.00,
Total body fat, then,
or, in a simplified form,
Annals New York Academy of Sciences Using the coefficients ( cR, c a ) indicating the proportion of fat in the
(4)
( 5 )
(6)
(7)
(8)
f B = c R + ( C Q - C R ) x g * (9)
f R = C R x r)
ff3 = CQ x g*
f B = f R + f a .
f R = C R ( 1.00 - g )
f B = C R ( 1 . 0 0 - g ) + CQ x g ,
This represents a general schema of densitometric estimation of the fat content of the body.
In the 1953 version of the Minnesota system of densitometric analysis, the constants c g (relative fat content of the “obesity tissue”), da (its den- sity), and d R (density of a “reference man”) have been determined em- pirically (Keys & Broiek, 1953). The constant cR (relative fat content of the “reference man”) was assumed, using such information as was avail- able at the time.
The relevant facts and the assumptions, quantitative in nature, were spelled out in detail in developing the calculational formula for converting body density into the estimated fat content of the body. While clarity of logic and explicitness in regard to the quantitative parameters provide no guarantee of the factual accuracy of a system, it was hoped that stating explicitly all the quantitative assumptions would make the densitometric analysis more readily amenable to amendment by the use of more valid biological constants.
The present communication is offered as such an amendment. It involves the replacement of the “reference man,” for whom the fat content had to be assumed, by a “reference body” of known composition from which the density was calculated. Furthermore, by using new information concerning the density of the “cell residue,” free of fat and extracellular water, it is possible to arrive at a more correct partition of the “obesity tissue,” and to estimate better its fat content ( C U ) . As we have seen (Equations 8 and 9), the constant ca is involved in the densitometric estimation of the total body fat.
In 1953, the “obesity tissue” was defined as weight gain (GG). It was possible to provide another estimate of the composition of the “obesity tissue” on the basis of weight loss ( GL ) . Last but not least, information of the composition of “obesity tissue” ( G A ) accounting for the differences between low-density and high-density subjects can be utilized in deter- mining the amount of fat by which a given individual differs from the

Broiek et al. : Densitometric Formulas 115 reference standard and in estimating the total fat content of the human body in vivo.
Calculation of the density of the “reference body” calls for a reconsidera- tion of the partitioning and the density of body mineral. We shall, then, begin by considering the matter of body mineral, and go on to the chemi- cal composition and calculated density of an empirical “reference body,” the density of “cell residue” and some other body compartments, the com- position of “obesity tissue” from weight gain, from weight loss, and from differences between low-density and high-density subjects, and conclude by the development and comparison of several formulas for the densito- metric estimation of body fat.
It may be useful, at the outset, to summarize the symbols used in de- scribing body composition in terms of the “somatolytic” body compart- ments (compartments used in the indirect analysis of the body) and the major chemical components of the body, This is demonstrated in TABLE 1. No separate consideration is given to carbohydrates and other organic components since they make up only a small part of the total body weight and no direct information on their amounts in the human body is available.
The choice of compartments into which a body is divided is dictated, first, by the constancy of their composition and, second, by the availability of suitable methods for estimating their size in different individuals and in the same individual in different nutritional states.
The chemical partitioning has the advantage of simplicity, with all the chemical components having maximal constancy. Unfortunately, total pro- teins and minerals have not been measurable in viuo, at least not with the desired precision ( as regards bone minerals ) .
Fat, F Extracellular Water, AE Cell residue, C Bone (osseous) mineral, Mo
TABLE 1
COMPARTMENTS A N D THE CHEMICAL COMPONENTS OF THE BODY A SYSTEM OF SYMBOLS USED IN DESCRIBING THE “SOMATOLYTIC” BODY
I Chemical components
_____. - - - F AB Ac - P A l C
hl0
- - -
- - -
Body compartments 1 Water ’ Fi t 1 P r p 1 M i y l s A
Total bodyweight, W = F + AE + C + M o = A 4- F + P + M Total body water, A = AE + Ac Total body mineral, M = M o + M c “Cell residue,” C = AC + P + M C = W - ( F + AE + Mo ) “Cell residue” solids = P + MC Fat-free weight = A + P + M = A, + Ar + P + M c + M o
Note: M C refers to the mineral content of “cell residue” and represents, by definition, all mineral that is not osseous ( M c = M - M o ) , i.e., the mineral in the “cells” and a small amount present in the extracellular fluid.

116 Annals New York Academy of Sciences The separation of the body weight into the specified “compartments” is
dictated by methodological considerations, including the consideration of one of the crucial points of densitometry, the composition of the mass ac- counting for weight gain or weight loss and for individual differences in density. There are also biological considerations, involving the definition of the standards of reference for such characteristics as blood volume or basal oxygen consumption.
In research on body composition, the focus on body fat was dictated by large interindividual differences in the fat content of the body and the availability of techniques for its estimation. The relationship between the other components is assumed, of necessity and until these components become measurable, to be the same in a given individual as in the refer- ence standard. This inescapable assumption is a major source of error in the partitioning of the body. The remedy consists in increasing the number of compartments amenable to more direct and more precise measurement.
The bone mineral, fat, and extracellular water represent simple, chem- ically defined compartments. The compartment “cell residue” ( C ) is com- plex in composition. It can be defined by the addition of the components it contains, C = A0 + P + Mc, or by subtraction, from weight, of the com- ponents it does not contain: C = W - ( F + An + M o ) . The two esti- mates are identical, within the “error of measurement” introduced by neglecting the carbohydrate content of the body.
Composition and Density of Body Mineral A. Composition of body mineral. The bone minerals and the remaining
“nonosseous” minerals, contained in the soft tissues and extracellular fluid, are two components of the body which may be considered to be reason- ably constant in composition for human adults. The components can be described in terms of their chemical composition and, with some care, their densities can be established. A survey of the literature yields four human bodies which have been completely analyzed for protein, calcium, and phosphorus. The bodies were those of a 35-year-old male (Mitchell et al., 1945); a 42-year-old female and a 25-year-old male, both reported by Widdowson and coworkers ( 1951); and a 46-year-old male (Forbes et al., 1953).
The two sets of analyses of Widdowson and coworkers also include de- terminations of sodium, potassium, magnesium, iron, and an estimate of chloride. These mineral constituents, expressed as grams of element per kilogram of body protein, are given in TABLE 2. The possibility that some of the bodies may have been abnormal in hydration, due to the process which caused death, makes it advisable to relate the minerals to a body component which would be expected to remain constant in a period of altered hydration. On this basis, the body protein seems well suited as the standard of reference for body minerals. Expressed as the ratio of mineral to protein, the concentration of each mineral element may be expected to be nearly the same in the bodies of different adults. The mean of the

Broiiek et al. : Densitometric Formulas TABLE 2
OF BODY PROTEIN
117
WHOLE BODY MINERAL CONSTITUENTS. GRAMS PER KILOGRAM
Ca P Na K
Fe C1'
Protein in fat-free body, gm./kg.
Mg
Female i 42':e)ars
131.91 68.62 11.81 15.11 2.27 0.32 8.30
18.8
(1) Total ash (m.)
Ca 1000.0 P 536.3 Na 99.8 K 129.2
20.9 3.3 Fe
c1 71.7
Mg
( 2 ) Male
25 years
( 3 ) ( 2 ) Nonosseous
Bone asho mineral (Bm.) (m.)
1000.0 - 462.0 74.3 27.5 72.3 - 129.2 17.8 3.1 - 3.3 - 71.7
109.23 71.79 10.87 14.26 2.47 0.45 8.00
19.5
( 3 ) Male
35 years
110.91 53.58
16.6
( 4 ) ( 5 ) Male 1 Mean
46 years
102.44 49.73
23.4
113.62 60.93 11.34 14.68 2.37 0.38 8.15
' Estirnatedvfrorn data of Shohl, Mineral Metabolism, New York, 1939, by Widdow- son et al., 1951.

118 Annals New York Academy of Sciences by including the remaining mineral components actually associated with them in the body and which were not included in the analysis. The ions in one kilogram of bone mineral were reported by Hendricks and Hill ( 1942) in moles as follows: 8.5 Cat +, 0.25 Mg+ +, 0.19 Na+, 2.0 H + , 5.07 Po4 =, 1.24 COP and 2.0 OH-. Nichols & Nichols (1956) presented evidence that a better value for Na+, expressed on the same basis, is 0.408. This cor- rection was accepted and the value for CO3= was increased by an equiva- lent amount to 1.349 moles. By converting to grams, the values in column 2 of TABLE 4 were obtained. The H+ and OH- have been combined and reported as water of crystallization. As indicated in column 2 of TABLE 4. 50.84 grams of bone mineral remains unaccounted for. This unaccounted weight may be explained by the fact that some carbonate in the crystal lattice actually exists as bicarbonate and some phosphate as HPO4= or HzP04- ions and consequently the actual amounts of COZ and H20 are larger than described in the table.
( 3 )
Weight per kg. of body calcium
(m.) Ca PO1 Na
cos H20 *
Unaccounted Total
Mg
( 4 ) Weight per kg. of total body
mineral (pm.)
TABLE 4 COMPUTED COMPOSITION OF BONE MlNERAL
218.4 105.8 149.2
2935.3
(1) Formula weight
60.9 29.5 41.6
819.1
40.08 94.98 23.00 24.32 60.01 18.02
( 2 )
Weight per kg. of bone mineral
(m.) 340.68 482.57
9.38 6.08
74.41 36.04 50.84
1000.00
1000.00 I 279.1 1416.5 395.3
27.5 I 7.7 17.8 5.0
* Water of crystallization.
In column 3 of TABLE 4 the same data are given as ratios to calcium. These are the values which were used to separate osseous from nonosseous mineral elements as shown in TABLE 3. This calculation indicates that the totaI weight of bone mineral is 2935.3 grams per kilogram of body calcium.
The elements in the nonosseous portion of the ash were assigned to various salts as explained below and listed in TABLE 5. The sum of these salts gave 648.1 grams of total nonosseous mineral per kilogram of body calcium. Adding the osseous and nonosseous minerals yielded 3583.4 grams of total body mineral per kilogram of body calcium. Per kilogram of total body mineral, the bone mineral was 819.1 grams. The components of bone mineral were as listed in column 4 of TABLE 4.
The metals and the phosphorus and chlorine of the nonosseous minerals were calculated in relation to each other and to body calcium and listed in TABLE 3. These elements actually exist as dissolved salts in the extra- cellular fluid and cells. An attempt to calculate the total weight of the non-

BroHek et al. : Densitometric Formulas 119 osseous mineral compartment resolves itself into the conversion of these elements into a mixture of salts. The chief criterion for formulating salts is that the total equivalents of positive ions must equal the negative ones. The exact pairing of types of ions is not very important since the contribu- tions of the dissolved ions to weight and to apparent volume are nearly independent.
The weights of the nonosseous elements were converted to formula weights and the mixture of salts given in column 1 of TABLE 5 was calcu- lated. Mg was taken to be Mg C12. The excess C1 was considered to be NaCl. The excess Na was taken as NaHC03. Phosphorus was assumed to be present as KH2POl and the excess K was calculated as KHCO,. In TABLE 5 the data are calculated both per kilogram of body calcium and per kilogram of total body mineral. This completes the description of the com- position of the body minerals.
MgCk NaCl NaHCOs KH,POA KHCOI SUm
TABLE 5 COMPUTED COMPOSITION OF THE NONOSSEOUS MINERAL
(1) Amount per kg. of body calcium
( millimoles )
127 1768 1375 2398 906
of body calcium (W.)
12.1 103.4 115.5 326.4 90.7
648.1
total body mineral (pm.)
3.4 28.9 32.2 91.1 25.3
180.9
B. The density of bone (osseous) and nonosseous minerals. Bone min- eral was isolated from long bones of cows and dogs by M6ndez et al. (1960). Fat was first removed by a mixture of equal volumes of ethanol and ethyl ether. Protein was extracted by 85 per cent ethylene diamine boiling under reflux. The ethylene diamine was removed with C02-free water, and the water was evaporated under vacuum. For four samples of bone mineral the mean density was found to be 2.982 (range 2.96 to 3.01 ) . The mean loss on ignition at 550” C, the usual procedure for ashing, was 4.18 per cent (range 3.5 to 4.7) of the bone mineral. The bone mineral of TABLE 4 would be expected to lose on ignition its water of crystallization plus some of the “unaccounted” matter, that is, between 4 and 8 per cent. Since there is no serious discrepancy in composition between these two reported examples of bone mineral, it is assumed that the density (2.982 ) and the loss upon ashing (4.18 per cent) apply to the bone mineral of
Another approach to the density of bone mineral is by comparison with the density of solid hydroxyapatite, 3 Ca3 ( PO, )&a ( OH ) 2 , Although
TABLE 4.

120 Annals New York Academy of Sciences bone mineral has the gross composition and the crystal structure of hy- droxyapatite, it also contains extra water of crystallization, small amounts of magnesium and sodium substituting for calcium, and small amounts of bicarbonate replacing phosphate or hydroxide. No data were discovered for the density of this particular compound but densities of closely related compounds are available in the Handbook of Chemistry and Physics (Hodgman, 1948). They were used to estimate the density of hydroxyapa- tite, in two ways, as shown in TABLE 6. In line 3 the density was calculated by dividing the sum of the weights of 3 moles of Caa( PO~)Z, line 1, and one mole of CaC03, line 2, by the corresponding sum of their molecular volumes. In line 6 the computation was done by subtracting the molecular weight and molecular volume of CaF2, line 5, from the corresponding weight and volume of apatite, line 4, and adding the corresponding weight and volume of Ca( OH)z, line 2. The weight of 3Ca3( Po4)z * Ca( 0H)n so obtained was divided by its volume to obtain the density. These den- sities, 3.06 and 3.13, are higher than the value for bone mineral determined by Mkndez et al. ( 1960 ) . A difference in this direction is expected since bone mineral contains more H 2 0 and COZ than the prototype mineral, the hydroxyapatite. For these reasons the density of 2.982 was accepted as the proper value for the bone mineral.
caS(Po& Ca(0H)Z 3c&(Po1)1 Ca(OH)* 3c&(Po4)2 CaF. CaFz 3Cas(PO& Ca(OH)?
- __
Line
310.28 74.10
1004.94 1008.92
78.08 1004.94
1. 2. 3. 4. 5. 8. - -
3.14 2.34 3.06 3.21 3.11 3.13
TABLE 6
COMPUTATION OF BONE MINERAL DENSITY DENSITIES OF MINERALS USED IN THE THEORETICAL
0.3185 0.4274 0.3285 0.3115 0.3215 0.3193
Mineral ( 4 )
Formula volume (ml.)
98.82 31.67
328.13 314.30
25.11 320.86
Reference
HCP' HCP Computed HCP HCP Computed -~
* Hodgman, 1948.
The nonosseous minerals of the body exist in solution in the water of the cells, interstitial fluid, and blood. Their contributions to the body den- sity are best computed by estimating the apparent volume occupied by a gram of each of the salts in dilute aqueous solution at body temperature. For each of the 5 salts, listed in TABLE 5, which may be considered to make up the nonosseous mineral, densities of dilute aqueous solutions are given in the International Critical Tables (Washburn, 1926). The volume of the solution containing 1 gram of water was calculated and from this was subtracted the volume of 1 gram of pure water at the same temperature. The difference is the apparent volume of the salt, and when divided by the weight of salt associated with 1 gram of water it gives the apparent specific
Broiek et al. : Densitometric Formulas
MgCla NaCl NaHCOa KHPOi KHCOa
Nonosseous mineral
121
12.1 4.99 0.2004 2.42 103.4 3.14 0.3185 32.93 115.5 3.73 0.2681 30.97 326.4 3.28 0.3049 99.52 90.7 3.07 0.3257 29.54
648.1 3.317 0.3015 195.38
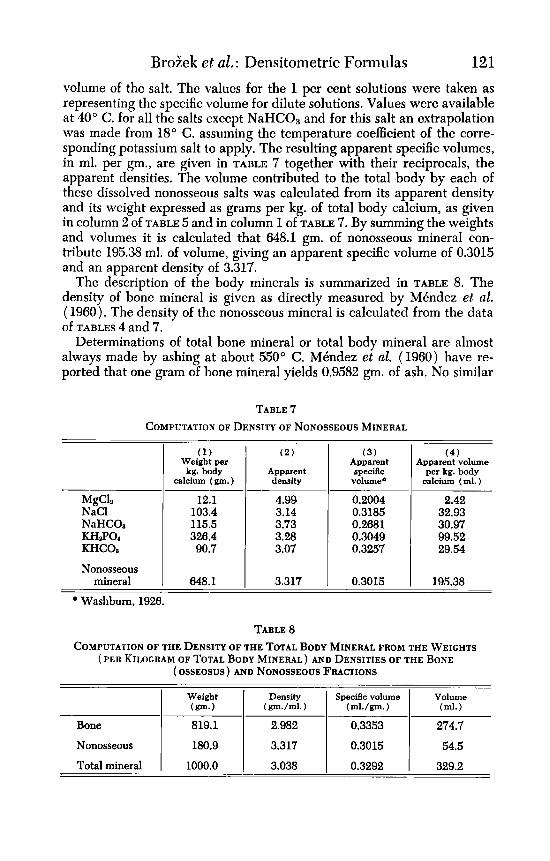
volume of the salt. The values for the 1 per cent solutions were taken as representing the specific volume for dilute solutions. Values were available at 40" C. for all the salts except NaHC03 and for this salt an extrapolation was made from 18" C. assuming the temperature coefficient of the corre- sponding potassium salt to apply. The resulting apparent specific volumes, in ml. per gm., are given in TABLE 7 together with their reciprocals, the apparent densities. The volume contributed to the total body by each of these dissolved nonosseous salts was calculated from its apparent density and its weight expressed as grams per kg. of total body calcium, as given in column 2 of TABLE 5 and in column 1 of TABLE 7. By summing the weights and volumes it is calculated that 648.1 gm. of nonosseous mineral con- tribute 195.38 ml. of volume, giving an apparent specific volume of 0.3015 and an apparent density of 3.317.
The description of the body minerals is summarized in TABLE 8. The density of bone mineral is given as directly measured by MBndez et al. (19fN). The density of the nonosseous mineral is calculated from the data of TABLES 4 and 7.
Determinations of total bone mineral or total body mineral are almost always made by ashing at about 550" C. MBndez et al. (1960) have re- ported that one gram of bone mineral yields 0.9582 gm. of ash. No similar
Bone
Nonosseous
Total mineral
TABLE 7 COMPUTATION OF DENSITY OF NONOSSEOUS MINERAL
819.1 2.982 0.3353 274.7 180.9 3.317 0.3015 54.5 1000.0 3.038 0.3292 329.2
( 1 ) ( 2 ) (3) ( 4 ) Weight per Apparent Apparent volume kg. body Apparent per kg. body 1 calcium (gm.) 1 density 1 :Es 1 calcium (ml.)
TABLE 8 COMPUTATION OF THE DENSITY OF THE TOTAL BODY MINERAL FROM THE WEIGHTS
( P E R KILOGRAM OF TOTAL BODY MINERAL) AND DENSITIES OF THE BONE (OSSEOSUS) AND NONOSSEOUS FRACTIONS
Density Specific volume
122 Annals New York Academy of Sciences determinations are available for total body mineral. Considering the com- position of the nonosseous mineral salt mixture it seems that ashing of this mixture would result in the loss of COz by conversion of bicarbonates to carbonates. On the other hand, if these salts were intimately mixed with bone minerals, as is the case in ashing the whole body, the COa would be trapped by the relatively alkaline bone salts and retained in the ash. Ac- cordingly, it follows that 1000 gm. of whole body mineral will give rise to (819.3) (0.9582) or 785.1 gm. of ash from bone mineral plus 180.7 gm. of ash from nonosseous mineral, making a total of 965.8 gm. of ash. The corresponding factor for converting body ash to body mineral is 1000/965.8 or 1.0354. This factor was used in calculating the mineral content of the bodies reported in the section that follows.
Chemical Composition and Calculated Density of an Empirical “Reference Body”
Obviously, the validity of the densitometric estimates of the total fat content depends on the validity of the assumption introduced in the deriva- tion of the computation formulas. The standard of reference (the “refer- ence man”) used in the past for the densitometric determination of body fat, was derived from direct measurements of body density in a group of young men ( Broiek, 1952). The average density was 1.063 and the amount of body fat was assumed as 14 per cent of gross body weight. This fat figure may or may not correspond to the real amount of fat present in an “average normal young man.” This uncertainty is inherent also in the computation of the absolute amount of fat in a given individual.
It is possible to establish a “reference body” in the reverse way, that is, by using the analytical data on body composition and computing the density of the body and its several compartments on the basis of the densi- ties of its chemical components. We shall discuss this approach in the present section.
While the available data on the chemical composition of man are ad- mittedly limited, both in regard to the number of cadavers analyzed and the clinical normality of the bodies, the work of Mitchell et al. (1945), Widdowson et al. (1951) and Forbes et al. (1953) provides at least a tentative basis for closing the gap in the theory of densitometric analysis. The “missing link” is a reference body for which the fat content is known and for which the density can be calculated on the basis of the densities of its constituents. The basic data are presented in TABLE 9. The “reference body” is taken as the mean of the 3 male bodies.
In further analysis the very small unaccounted fraction of body weight (last column in TABLE 9 ) is disregarded. Ash is converted into mineral (mineral = 1.0354 ash; vide supra) :
(10) The sum of the values for water (40.8 kg.), fat (10.0 kg.), protein ( 10.7 kg.), and body mineral (3.8 kg.) is taken as the weight of the reference
Body Mineral = 1.0354 x 3.7 kg. = 3.8 kg.

BroHek et al. : Densitometric Formulas TABLE 9
BODY COMPOSITION. FROM DIRECT CHEMICAL ANALYSIS OF THREE MALE CADAVERS
123
Age Height Total Reference (yrs.) (cm.) weight Water Fat
Mitchell( 1945) 35 183.0 70.6 47.9 8.8
Widdowson(l951) 25 179.0 71.8 44.4 10.7
Forbes( 1953) 46 168.5 53.8 30.0 10.5
Mean 35.3 176.8 65.4 40.8 10.0
~ ~ ~ _ _ _ ~ ~ - Protein Ash
10.2 3.4
11.9 4.6
10.1 3.0
10.7 3.7
Unac- counted
0.3
0.2
0.2
0.2
Symbol
The weights of the bodies and their components are given in kilograms.
Specific
36” C. Component
body ( 65.3 kg. ) . In TABLE 10 the weights of the chemical body components are given in grams per kilogram of this reference weight.
The bone minerals (58.2 gm./kg. ) were split, subsequently, into their osseous and nonosseous fraction on the basis of considerations described in the previous section of this paper.
The information provided by the chemical analysis of the 3 male cadavers can be used for the reconstruction of an empirically defined “reference body,” with a density of 1.064. It may be noted that this density is asso- ciated with 15.3 per cent of body weight as fat.
The densities of water, fat ( Fidanza et al., 1953), and protein were taken from the literature. The estimation of density of body minerals is described in the previous section.
The per cent composition of the “reference body” in terms of water, pro- tein. fat, and the two types of minerals is indicated in TABLE 11.
The difference between the new “reference body” and the earlier “ref-
624.3 164.4 153.1
47.7
10.5 1000.0
TABLE 10
(BASED ON THE ANALYSIS OF THREE MALE CADAVERS), THEIR DENSITIES,
DEFINED “REFERENCE BODY”
WEIGHTS AND VOLUMES OF THE COMPONENTS OF 1 KG. OF THE REFERENCE BODY
AND THE CALCULATED DENSITY ( d = 1.084) OF THE EMPIRICALLY
0.99371 1.34 0.9007
2.982
3.317 1.064
A P F Mo
M a
Total
Water Protein Fat Bone (osseous)
mineral Nonosseous
mineral
1.0063 0.7463 1.1102
0.3353
0.3015 0.9398
Volume at 36” C.
( ml. ) 628.2 122.7 170.0
16.0
3.2 940.1

124 Annals New York Academy of Sciences erence man” is trivial, as far as the density and fat content are concerned. The two standards of reference are very close in regard to density (1.064 and 1.063, respectively). The fat content of the “reference body” is some- what higher ( 15.3 per cent us. 14 per cent in the reference man). The prin- cipal difference is that in one case the value of the total body fat is em- pirically determined, whereas the older value was hypothetical.
It may be of interest to examine the composition and calculate the den- sity of the fat-free mass of the new reference standard. By weight, water represents 73.8 per cent, protein 19.4 per cent, and mineral 6.8 per cent of the fat-free weight (total weight less the weight of fat). The density figure of 1.100 (TABLE 3 ) will amuse, we are sure, A. R. Behnke, the father of the densitometric method in this country, and the members of his “Navy School” who stated (Rathbun & Pace, 1945) that from the data of Behnke, Feen & Welham (1942) “a value of 1.10 may be estimated for the density of the fat-free human body.”
Reference to the columns in TABLE 11, labeled “Cell-Residue” and “Cell- Residue” Solids, will be made in a later section of the paper.
Fat-free, bone Reference Fat-free mineral-free “Cell
Component body body body residue”
Water A 62.4 A 73.8 A 78.1 Ao’72.7 Protein P 16.4 P 19.4 P 20.6 P 25.7 - - - - Fat F 15.3 - - Mineral Mo 4.8 Mo 5.6 - - - -
Mu 1.1 M o 1.2 Mo 1.3 Mu 1.6 Density, at 38” C. 1.064 1.100 1.060 1.078 Per cent of 100.0 84.7 79.9 63.9
total body
Fat-free “cell residue” solids
- - P 94.0 - - - - Mu 6.0 1.389 17.5
Density of “Cell Residue” and Other Body Compartments
In developing a formula for the computation of body fat from body density, the density of the compartment labeled “cells” was originally estimated as 1.057, with a range of 1.055 to 1.060 (Keys & Broiek, 1953; Keys, Anderson & Broiek, 1955). This value was used in the process of breaking down the “obesity tissue” into fat and “cells,” after removing the weight and volume of the extracellular fluid from the gross weight of the “obesity tissue,” gained through overeating.

Broiek et al. : Densitometric Formulas 125 A consideration of various sources of evidence indicates that the figure
1.057 probably represents an underestimation of the density of the “cells,” free of fat (and free of extracellular water).
The compartment labeled “cell residue” in the present system of body partitioning corresponds very closely to the compartment “cells” of the 1953 version of the Minnesota system. The only difference is that, by defi- nition, the “cells” did not contain the minerals present in the extracellular fluid, while in the present system the cell-residue minerals ( M c ) include both the minerals of the cells plus those of the extracellular fluid. For the sake of simplicity of partitioning the body, the extracellular compartment in the present system is defined as extracellular water(AE).
I t is clear that, in the body, the “cell residue” is not made up of cellular elements only. By definition it includes everything in the body which is not fat, extracellular water, or bone mineral (see TABLE 1). It contains, therefore, in addition to all the cells of the body, the plasma proteins, the fibrous material of the connective tissue, the tendons, the cartilages, and the soft tissue of the bone, as well as the minerals of the extracellular fluid. The protein and mineral content of this compartment is consequently higher than that of the cellular elements. Its density must be accordingly higher. Even should the density of 1.057 be a good estimate of the density of the typical nondefatted cell mass, it is clear that this figure underesti- mates the density of the “cell residue” compartment of the whole body.
From the analyses of the cadavers presented in TABLE 9 and from the data given in TABLES 10 and 11 it can be seen that the density of this corn- partment, calculated from its content of water, protein, and minerals, is equal to 1.078.
The question remains whether this figure applies to the density of the cell residue associated with the “obesity tissue” as well. I t is impossible at this time to calculate the density of the “cell residue” of the obesity tissue with certainty but considerations, spelled out in greater detail in the Comment, indicate that the value 1.078 obtained for the whole body may be used for the cell residue of the weight gain or weight loss, pending the acquisition of more reliable information.
Composition of “Obesity Tissue,” G
Three estimates of the composition of the “obesity tissue” were made, based on weight gain, weight loss, and on difference between individuals with low and high body density, matched for height (and age). As we have seen (Equation 8 ) , the fat content of the obesity tissue determines, together with the fat content of the reference body, the estimate of total body fat.
A. Obesity tissue defined as weight gain, GG. The weight, volume, and density ( d o = 0.9478) of the “obesity tissue,” designated by the subscript G, for “gain,” was determined in 10 men who gained weight over a period of six months by simple overeating (Keys, Anderson ik Broiek, 1955). The basic and derived data are given in TABLE 12.

126 Annals New York Academy of Sciences What is the composition of the gain? One component, the extracellular
water, was determined on the basis of measurements of thiocyanate space (Keys & Broiek, 1953, p. 277). It accounted for 15.62 kg. or about 14 per cent of the total gain.
By subtracting from the total gain the volume (which was measured) and the weight (calculated from volume) of extracellular water we ob- tained the Remainder, having a density of 0.9410. Its composition may be determined by substituting proper constants for fat and “cellular residue” in the general densitometric formula for partioning a system into two parts (Equation 1) . Thus fat, as fraction of the Remainder, is obtained from the eauation.
1. Total gain
2. Gain in extracellular water*
Using the density values for “fat” and “cell residue” of dF = 0.9007 and dc = 1.078 respectively, we obtain the fat fraction of the Remainder as f = 0.74. The fraction of the Remainder, corresponding to the “cell resi- due,” is obtained by subtraction (1.00 - 0.74 = 0.26).
When all three components are expressed as percentages of the total gain, we obtain the following composition for this type of “obesity tissue”: 14 per cent extracellular water, 64 per cent fat, and 22 per cent “cell resi- due.’’ It may be recalled that the initial computations (Keys & Broiek,
Body weight, kg. Body volume, 1. Density
Weight, kg.
Volume, 1.
TABLE 12
PARTITIONING OF THE OBESITY TISSUE, Go, GAINED BY 10 NORMAL-WEIGHT, MIDDLE-AGED MEN AS THE RESULT OF POSITIVE CALORIE BALANCE
3. Remainder = total gain - gain in extracellular
water
Weight, kg. Volume, 1. Density
Fat, per cent of remainder “Cell residue,” per cent of
remainder
4. Partitioning of the total gain Extracellular water Fat “Cell residue”
114.41 120.71
0.9478
15.62 (14 per cent of total gain)
15.72
98.79 104.99
0.9410
74 per cent
26 per cent
14 per cent 64 per cent 22 per cent
* In the original publication (Keys, Anderson & Brofek, 1955) the extracellular fluid, taken as representing 70 er cent of the thiocyanate space, was reported as kilo-
ing that 1 kilogram of protein-free serum contains 976.9 grams of water. grams of protein-free serum. T K e weight of the extracellular water is obtained assum-

Broiek et al. : Densitometric Formulas 127 1953), in which the figure 1.057 gm./ml. was used as the density of “cells” ( d c ) , yielded a somewhat lower fat percentage (62 per cent) and a higher “cell” percentage (24 per cent). Underestimation of the density of the “cell residue” results automatically in the underestimate of the fat content of the “gain” and affects the estimation of total body fat.
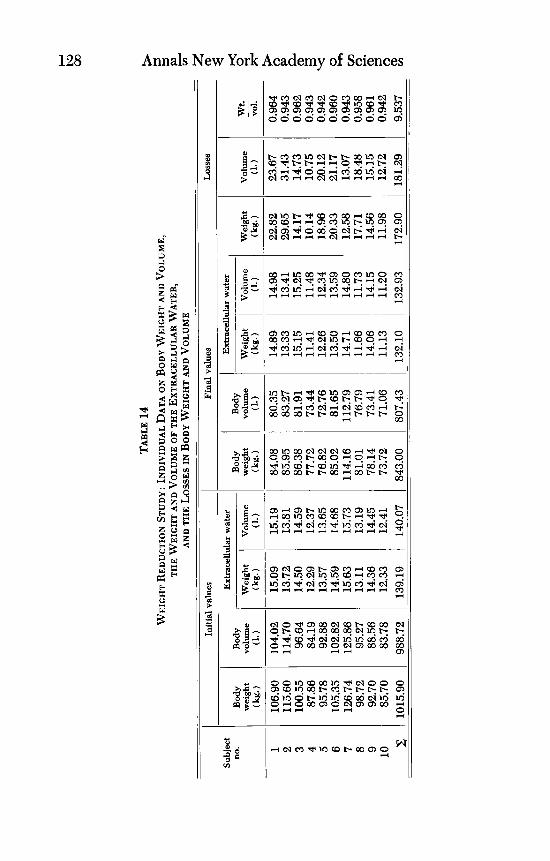
B. Obesity tissue defined as weight loss, GL. In order to examine the degree of constancy (or inconstancy) of the composition of the “obesity tissue,” we shall analyze the composition of weight losses achieved by obese individuals who were maintained on a reducing regimen for 10 weeks. Their general characteristics are given in TABLE 13. The initial (pre- reduction) and the final (postreduction) values of body weight, body volume, and extracellular water are presented in TABLE 14.
The partitioning of the obesity tissue (GL variety, from “weight loss”), following the procedure described in the preceding subsection, is pre-
TABLE 13 WEIGHT REDUCTION STUDY: GENERAL CHARACTERISTICS OF THE SUBJECTS
Subject DO.
1 2 3 4 5 6 7 8 9
10 Mean
Age, (yr.)
20 26 18 24 25 21 24 24 22 22 22.9
Height (m.)
175.0 180.8 175.4 175.0 180.0 176.0 168.5 178.5 176.5 178.5 175.21
Standard Weight (kg.)
66.9 74.3 65.3 68.7 73.2 68.1 64.3 71.3 69.0 69.0 68.42
Relativeo Weight
(%)
160 156 154 128 131 155 197 138 134 134 149
* x 100 (ActuaVStandard). The actual initial weights are presented in TABLE 14.
sented in TABLE 15. The striking difference, in comparison with the “obesity tissue” defined on the basis of the weight gain, is the substantially smaller amount of extracellular water. The fat percentages are identical.
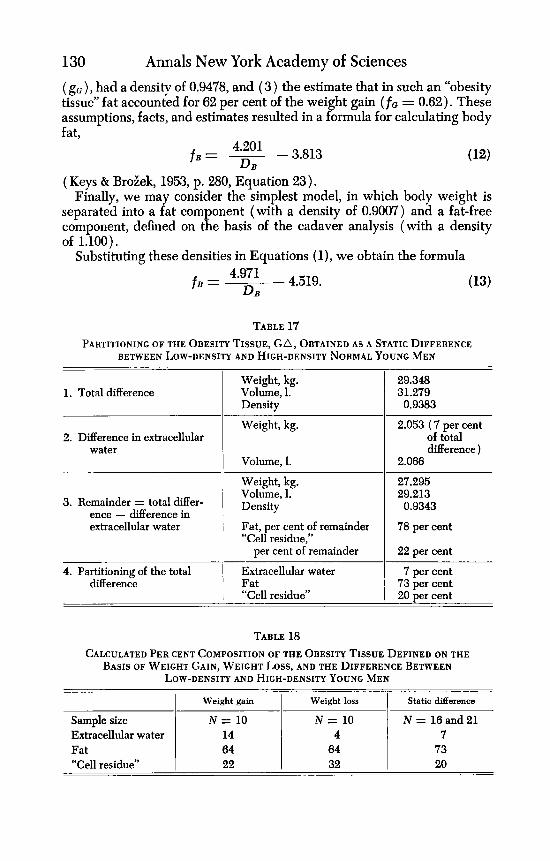
C . Obesity tissue defined as static weight diference, G A. A third ap- proach to the analysis of the composition of the obesity tissue is based on differences between low-density and high-density young men. TABLE 16 documents that the two groups were similar in age and precisely matched for height.
The breakdown of the total difference, following the same procedure as was oulined in analyzing the weight gain and weight loss (TABLES 12 and 15), is given in TABLE 17. The extracellular water has an intermediatry, fat the highest value.
In order to facilitate the comparisons of the “varieties” of obesity tissue, the data were presented in parallel in TABLE 18.
TABLE
14
WE
IGH
T R
EDU
CTI
ON
ST
UD
Y:
IND
IVID
UA
L D
AT
A
ON
BO
DY
WE
IGH
T A
ND
VO
LU
ME
, T
HE
WE
IGH
T A
ND
VO
LU
ME
OF
TH
E E
XT
RA
CE
LL
UL
AR
W
AT
ER
, A
ND
TH
E L
OSS
ES IN
BO
DY
WE
IGH
T
AN
D V
OL
UM
E
Init
ial v
alue
s I
Final
valu
es
I Su
bjec
t no
. 1
2 3 4 5 6 7 8 9 10
106.
90
115.
60
100.
55
87.8
6 95
.78
105.
35
126.
74
98.7
2 92
.70
85.7
0
Bod
y vo
lum
e (1
.)
104.
02
114.
70
96.6
4 84
.19
92.8
8 10
2.82
12
5.86
95
.27
88.5
6 83
.78
z I 1
015.
90
I 988
.72
Ext
race
llula
r w
ater
I
I I
Ext
race
llula
r w
ater
Wei
ght
15.0
9 13
.72
14.5
0 12
.29
13.5
7 14
.59
15.6
3 13
.11
14.3
6 12
.33
139.
19
( kg.
) V
olum
e (1
.)
15.1
9 13
.81
14.5
9 12
.37
13.6
5 14
.68
15.7
3 13
.19
14.4
5 12
.41
140.
07
Bod
y w
eigh
t (k
g.)
84.0
8 85
.95
86.3
8 77
.72
76.8
2 85
.02
114.
16
81.0
1 78
.14
73.7
2 84
3.00
Bod
y vo
lum
e (1
.)
80.3
5 83
.27
81.9
1 73
.44
72.7
6 81
.65
112.
79
76.7
9 73
.41
71.0
6 80
7.43
14.8
9 13
.33
15.1
5 11
.41
12.2
6 13
.50
14.7
1 11
.66
14.0
6 11
.13
132.
10
Vol
ume
(1.)
14.9
8 13
.41
15.2
5 11
.48
12.3
4 13
.59
14.8
0 11
.73
14.1
5 11
.20
132.
93
~-
22.8
2 29
.65
14.1
7 10
.14
18.9
6 20
.33
12.5
8 17
.71
14.5
6 11
.98
172.
90
Los
ses
Vol
ume
(1.)
23.6
7 3 1
.43
14.7
3 10
.75
20.1
2 21
.17
13.0
7 18
.48
15.1
5 12
.72
181.
29
wt.
vol. -
0.96
4 $
0.94
3 0.
962
0.94
3 3
0.94
2 Y
0.
960
0.94
3 v)
0.95
8 8.
0.94
2 c)
0.96
1 g
9.53
7 g

Broiek et al. : Densitometric Formulas TABLE 15
129
1. Total loss Weight, kg. 172.90 Volume, 1. 181.29 Density 0.9537
Weight, kg.
Volume, 1. 2. Loss of extracellular water
3. Remainder = total wei ht loss - loss of extrace i ular water
7.09 ( 4 per cent of total loss)
~ 7.14
Weight, kg. 185.81 Volume, 1. 174.15 ~~~~i~~ 0.9521
Fat, per cent of remainder “Cell residue,”
per cent of remainder
67 per cent
33 per cent
4. Partitioning of the total Extracellular water
“Cell residue” weight loss 1 Fat
4 per cent 64 per cent 32 per cent
TABLE 16 COMPARISON OF GROUPS OF “NORMAL” YOUNG MEN DIFFERING IN BODY DENSITY,
D,. GENERAL CHARACTERISTICS OF THE GROUPS (MEANS)
Low-density group I High-density group 1 (up to D, = 1.0449) (Ds = 1.0700 and up)
Sample size
Height, cm. Body weight, kg. Body volume, 1. Body density
*gk r. N = 18 25 176.5 95.231 92.295 1.0318
N = 21 24 176.5 65.883 61.018 1.0798 11.708 1 11.780
Extracellular water, kg. Extracellular water, 1.
Densitometric Estimation of Body Fat
The formula for calculating the amount of “obesity tissue,” g, as a frac- tion of body weight, can be derived by replacing in Equation 3 the den- sities of da and dR by the densities of the obesity tissue and the reference
Calculation formulas, based on the three varieties of the obesity tissue that were studied, for g, its fat content ( f a ; cf., Equation 5 ) , and the total fat content of the body ( f B ; cf., Equation 9) are given in TABLE 19.
Two other formulas may be noted. The 1953 Minnesota formula based on ( 1 ) the assumption that the density of the “reference man” ( d R = 1.0629) corresponded to a fat content of 14 per cent of gross body weight ( cR = 0.14), (2 ) the fact that the “obesity tissue” defined as weight gain
body (dR = 1.064).
130 Annals New York Academy of Sciences ( g o ) , had a density of 0.9478, and ( 3 ) the estimate that in such an “obesity tissue” fat accounted for 62 per cent of the weight gain ( f a = 0.62). These assumptions, facts, and estimates resulted in a formula for calculating body fat.
Sample size Extracellular water Fat “Cell residue”
f B = - 4*201 - 3.813 DB
N = 10 N = 10 N = l8and21 14 4 7 84 84 73 22 32 20
( Keys & Broiek, 1953, p. 280, Equation 23). Finally, we may consider the simplest model, in which body weight is
separated into a fat component (with a density of 0.9007) and a fat-free component, defined on the basis of the cadaver analysis (with a density of 1.100).
Substituting these densities in Equations (l), we obtain the formula
4*971 4.519.
TABLE 17
BETWEEN LOW-DENSITY AND HIGH-DENSITY NORMAL YOUNG MEN PARTITIONING OF THE OBESITY TISSUE, GA, OBTAINED AS A STATIC DIFFERENCE
1. Total difference
2. Difference in extracellular water
3. Remainder = total differ- ence - difference in extracellular water
4. Partitioning of the total difFerence
Weight, kg. Volume, 1. Density
Weight, kg.
Volume, 1.
Weight, kg. Volume, 1. Density
Fat, per cent of remainder “Cell residue,”
per cent of remainder
Extracellular water Fat “Cell residue”
29.348 31.279
2.053 ( 7 per cent of total difference )
0.9383
2.088
27.295 29.213
78 per cent
22 per cent
0.9343
7 per cent 73 per cent 20 per cent
TABLE 18 CALCULATED PER CENT COMPOSITION OF THE OBESITY TISSUE DEFINED ON THE
BASIS OF WEIGHT GAIN, WEIGHT LOSS, AND THE DIFFERENCE BETWEEN LOW-DENSITY AND HIGH-DENSITY YOUNG MEN
1 Weight gain I Weight loss I Static difference

Broiek et al. : Densitometric Formulas 131
From weight From weight From gain loss dBerence
~~
2.3 1.4 1.3 15.3 15.3 15.3 27.7 28.4 28.6 40.8 42.3 42.8
TABLE 19
“OBESITY TISSUE,” OF THE FAT ASSOCIATED WITH THE OBESITY TISSUE, AND OF THE TOTAL BODY FAT. THE DENSITY OF THE REFERENCE BODY IS 1.064,
FORMULAS FOR THE ESTIMATION, FROM BODY DENSITY ( D B ) , OF THE AMOUNT OF
ITS FAT CONTENT 15.3 PER CENT OF BODY WEIGHT
From fat and fat-free
0.0 15.3 29.8 45.2
Density ( d ~ )
Fat content of obesity tissue (as fraction, f.)
Obesity tissue, g, from body density
Fat content, f ~ , from body density
Total body fat, fB,
from body density
DB
1.100 1.064 1.032 1.000
From gain
1953 Formula
0.6 13.5 25.8 38.8
~ _ _
~~
0.948
0.64
p - 8 . 1 7 2 8.696
D B
-- 5‘565 -5230 DB
4’235 3.827 DB
From loss
0.954
0.64
9.228 __ -8.673
5.906 ~ -5.551 DE 4.494 ~ -4.071 DB
DE
From static difference
0.938
0.73
7.921 __ - 7.444 DB
__ -5434 5.782 DB
4.570 DB p - 4 . 1 4 2
TABLE 20
SELECTED VALUES OF BODY DENSITY, DB COMPARISON OF DENSITOMETRIC FORMULAS: CALCULATED FAT PERCENTAGES FOR
The results of applying these formulas to selected values of body density are given in TABLE 20. By definition, the fat values for the density corre- sponding to the density of the reference body ( d = 1.064), are 15.3 per cent, whether we use as the point of departure the data on weight gain, weight loss, or the difference between high-density and low-density indi- viduals. The 1953 formula assumed a lower fat content and this assump- tion, naturally enough, results in a lower fat estimate. In the fat plus fat- free model, the fat values for both d = 1.100 and for d = 1.064 are fixed, since the fat-free portion of the “reference body” as well as its fat content were derived from the same data. Consequently the predicted fat values must give us 0.0 per cent and 15.3 per cent fat for the two densities.
The fact that the other formulas, used in calculating the figures given in TABLE 20, do not predict a zero fat for body density of 1.100 should not be regarded as sure grounds for indictment. We were aware from the outset that the “obesity tissue” will retain most likely its density and com- position only within a certain range, which yet remains to be specified with precision.
The question of a “best formula” will be discussed in the Comment.

132 Annals New York Academy of Sciences Comment
In the present paper we have provided an empirical definition of a “reference body” and have considered the differences in the composition of the “obesity tissue,” determined under conditions of weight gain or weight loss and by comparing the weights and volumes of young men varying in body density but matched for height. Having established the density of a “reference body,” the fat content of which was known, and the densities and composition of the three varieties of the “obesity tissue,” we proceeded to calculate equations for estimating the amount of obesity tissue, the fat associated with the obesity tissue, and the total body fat in an individual for whom body density has been determined.
The separation of the “remainder” ( total obesity tissue less extracellular water) into fat and “cell residue” depends crucially on the density value of these compartments. It was felt that the density of the “cell residue” had to be re-examined. A new value was derived and used in the computation of the equations for estimating the fat content.
A number of the quantitative assumptions, computations, and estimates call for comment.
The new “reference body” is gratdyingly similar in density (1.064 us. 1.063) and fat content (measured 15.3 per cent us. assumed 14.0 per cent of body weight ) to the theoretically defined Minnesota “reference man.” This alters, to be sure, the amount of fat corresponding to a given body density. However, the difference resulting from the substitution of the new value for density and fat content of the “reference body” is small. The important advance consists in replacing an assumed by an empirically de- termined fat content of the reference body. Thus the gain is increased validity rather than increased precision. We believe that in terms of its protein, water, and mineral content the “reference body” is a reasonable standard of reference for adult men even though we are fully aware that more data on the variation in the relative proportion of these components in cIinicaIIy norma1 individuals are urgently needed. The density of fat-free compartment of the “reference body” turned out, happily, to be 1.100 (TABLE 3) . However, the biological significance of this coincidence should not be exaggerated.
Density of body fat. The value used for the density of fat, at 3 6 O C., was 0.9007 ( Fidanza et al., 1953). This figure corresponds to the density of the fat in the adipose tissue. It probably somewhat underestimates the density of whole body fat since the fat of some organs is known to have higher density.
MBndez et al. (1960) have shown that the fat of rabbit and of dog muscle has a higher density than the adipose tissue of the same animals. Morales et al. (1945) reported for the mixed fat of the guinea pig carcass a value that, corrected to 36” C., yields a density of 0.904. The density of the ether extract of the brain is close to 1.03 in the dog ( MBndez, ibid.)
It is impossible at present to make an accurate estimate of the density of the mixed fat of the human body. However, a limiting calculation will

Brozek et al. : Densitometric Formulas 133 show the order of magnitude of the error possibly introduced by using the figure 0.9007 as density of the total fat. If we assume that 50 per cent of the body fat is subcutaneous and that the remaining 50 per cent has a density of 0.930, the volume of one part of mixed fat will be 1.0927 and its density 0.915. Using this figure for the computation of the density of the “reference body” we arrive at a density of 1.067, as compared with the value of 1.064 given in TABLE 10.
Bone minerd. Baker ( 1961 ) calls attention to the fact that the amount of bone mineral is an important variable in body composition. He specifi- cally states that there is less mineral in the body than was assumed in the “reference man” of Keys and Broiek (1953). The value for the mineral content of the new “reference body” is based on chemical analysis and, consequently, represents a more dependable standard of reference. The main potential limitation of our estimate is in the separation of the total mineral into the osseous and the nonosseous compartments. In this separa- tion it was assumed that all of the calcium of the body is present in the bone. Clearly, this assumption cannot result in a great error since the amount of calcium in the soft tissue is only a very small fraction of the total calcium of the body.
The variability of the mineral content of the three bodies used in setting up the reference body may be assessed by considering that the ratio of ash to protein has a range from 0.30 to 0.39.
In the 1953 “reference man” the bone mineral content was estimated at 6 per cent of gross body weight ( 7 per cent of the fat-free weight), The three male cadavers used for deriving the new standard contained, on the average, 4.77 per cent of body weight as bone mineral. In 64 young white men Baker & Newman (1957) found that the weight of the dry defatted skeleton represented 6 per cent of the gross body weight. Assuming 65 per cent of the weight to be bone mineral, Baker (1961) computed that mineral represents, on the average, about 3.9 per cent of the body weight. The figure that we computed from the cadavers (4.8 per cent) is between the value given by Baker and that used by Keys and Broiek in 1953.
“Cell residue.” The main limitation in the calculation of the density of the “cell residue,” besides the analytical errors, is a consequence of the necessity to estimate the extracellular water content of the reference body. In the absence of direct measurements, extracellular water was taken as 16 per cent of the gross weight of the body.
Support for the validity of the “cell residue” density figure of 1.078, based on the average of the three cadavers, is found in the following data. MBn- dez & Keys ( 1960) examined the density of the “cell residue” (fat-free extracellular fluid-free tissue) of rabbit and dog muscle and found it to be between 1.069 and 1.079. These values which, on the average, are slightly lower than the “cell residue” density of the reference body, were computed by using a density of 1.007 for the extracellular fluid. Recompu- tation of the data, using extracellular water ( d = 0.99371), gives a density value of 1.076 for both muscles. In this computation the densities of muscle fat determined by MBndez & Keys (1960) was used.
134 Annals New York Academy of Sciences From the analysis of 10 samples of meats (edible portion of beef, lamb,
and pork), reported by Chatfield & Adams ( 1940), the density of the “cell residue” was computed. The calculations were carried out in the same way as in computing the density of the reference body. Extracellular water was taken as 16 per cent of the weight of the sample, and the densities used to compute the volumes of the components were those reported in TABLE 10. The mean density of the “cell residue” was 1.081 (SD = * 0.007). One of the samples, (pork meat) had a very high fat content (55 per cent) and gave the highest density for the cell residue (1.1023). When this atypical sample is omitted from the computations, the average density of the “cell residue” for the other 9 samples is 1.079 ( SD = * 0.004).
Another indication of the general validity of the figure 1.078 for the density of the “cell residue” is obtained by considering the density of the fat-free cell solids. As shown in TABLE 11, the density of these solids, which consist of protein and a small proportion of minerals, is 1.389. This value agrees exactly with the average value found by Allen, Krzywicki & Roberts ( 1959) for the fat-free solids (labeled by these authors as M 3 ) of various soft tissues.
A further agreement between the data reported by Allen et al. and our computations, based on the analysis of the cadavers, is found when the fat-free bone mineral-free compartment of the body is considered. As indicated in TABLE 11, this compartment of the cadavers has an average water content of 78.1 per cent and a density of 1.060. The values reported by Allen et al. (1959) are as follows: water content 78.4 per cent and density ranging from 1.050 to 1.071.
Therefore the “cell residue” computed from the data reported by Allen et al. would agree very closely in density and composition with our “cell residue,” if the same proportion of extracellular water is assumed.
The cell residue of the “obesity tissue.” The density of the “cell residue” is a critical factor in computing the fat content of the “obesity tissue” from data on the density and the extracellular water content of the gain or loss of weight.
Using for the “cells” a density of 1.057, Keys et al. (Keys & Broiek, 1953; Keys, Anderson & Broiek, 1955) calculated that the “obesity tissue,” with 14 per cent of extracellular water, had 62 per cent of fat and 24 per cent of “cells.” Clearly, if a higher density of “cells” is accepted, the calculated composition will show a higher proportion of fat and a lower proportion of “cells.”
Since in the Minnesota system the amount of fat assigned to the “obesity tissue” influences the amount of fat computed for the whole body, it is important to establish the density of the cellular part of the obesity tissue with as much precision as possible.
On the basis of information presently available we believe that 1.078 is a reasonable estimate of the density of the “cell residue” for the reference body as a whole. In order to establish firmly the validity of this figure for “obesity tissue,” we would need to know the nature of the materials de- posited in the body or lost from the body in association with the gain or

Broiiek et al. : Deiisitometric Formulas 135 loss of fat. Unfortunately, we can not answer this important question in a fully satisfactory manner.
The idea (von Dobeln, 1956) that the tissue deposited or lost is identical with adipose tissue ignores the fact that the adipose tissue itself changes in the course of weight loss ( Entenman et al., 1958) and its composition varies widely.
As an approximation, it may be hypothesized that the cell residue of the “obesity tissue” corresponds to the “cell residue” associated with adi- pose tissue. A direct computation of the density of the “cell residue” from the analysis of human adipose tissue is impossible at present due to the lack of information about the proportion of extracellular water associated with the fat-free part of the adipose tissue. However, some useful informa- tion can be obtained by computing the density of the “cell solids,” that is to say, the nonfat dry solids of the adipose tissue. On the basis of the chem- ical analysis of adipose tissue reported by Mitchell et al. (1945), we have estimated the density of the fat-free cell solids as 1.396. The data reported by Forbes et al., (1953) yield a density of 1.367.
Allen, Krzywicki, and Roberts (1959) have measured the density of the “cell residue” solids (designated M 3 ) of human adipose tissue and reported a value of 1.38.
The mean of these 3 values for the “cell solids” of adipose tissue is 1.381, which compares satisfactorily with the density of 1.389 for the “cell solids” of the whole body, derived from the cadaver data. It appears that the fat-free solids of the adipose tissue are not basically different from those of the “cell residue” calculated for the whole body. We agree with Allen et al. (1959) who stated that “the fat-free portion of adipose tissues be- longs to the same water-density system as the other fat-free soft tissues of the body” ( p. 1006).
The fraction of water contained in the fat-free adipose tissue was re- ported by Allen as 0.795. Regretfully, we failed to uncover information regarding the amount of extracellular fluid in the adipose tissue and its proportion to the total water. Using the data on the analyses of human adi- pose tissue reported by Entenman et al. (1958), we have calculated the density of the “cell residue” for different proportions of extracellular water using 1.389 and 1.380 as the densities of the dry fat-free residue. A “cell residue” density of 1.078 is found when the extracellular water represents between 11.3 and 11.7 per cent of the total fresh weight of the tissue. This is compatible with known facts, A figure of 14 per cent of extracellular water in the “gain” was determined by Keys, Anderson & Broiek (1956) in the overeating experiment.
It may be noted that the average total water of the four samples of adipose tissue examined by Entenman et al. (1958) was 20.2 per cent of the fresh weight (fat included). This suggests that in the adipose tissue about 50 per cent of the total water is in the extracellular space.
Composition of “obesity tissue.” There is no doubt that sizable differ- ences exist in the composition of “obesity tissue,” defined by analyzing
136 Annals New York Academy of Sciences weight gains or weight losses studies under conditions in which the initial nutritional status and the rate of weight gain vary appreciably.
When it can be established ( cf., Grande, 1961 ) that the composition of the gain or loss is substantially different from that assumed in a densito- metric “model,” somatolysis based on determinations of body density is simply not valid and should not be attempted. It can hardly be overempha- sized that the densitometric method, when used alone, assumes necessarily that the weight gains or weight losses have a constant known density and composition.
The three varieties of “obesity tissue,” described in this communication represent by no means the total range of variation in the composition of weight gains or weight losses, although they may be regarded as fairly representative. They are, in fact, in general agreement with the values reported by Johnston & Bernstein (1955) and by Ljunggren et al. ( 1957). Nevertheless, under special conditions the weight gains or weight losses may deviate substantially from these values.
Data obtained in our laboratory provide suggestive evidence that the composition of the weight gain has been changing in the course of refeed- ing after 24 days of calorie restriction in physically active individuals who had lost 7.6 kg. in weight. A large part of the early weight gain appeared to be water. In the later phase of the refeeding period the data on energy balance and nitrogen excretion indicate that fat and protein were being stored, in spite of the fact that there was no net gain in body weight. I t appeared that during this phase the gain in fat and protein, reflecting the observed positive energy and nitrogen balances, was masked by a simul- taneous loss of water (Broiek et al., 1957, p. 416). These data agree with other reports of nitrogen retention in previously underfed individuals, without a corresponding increase of body weight (Cook & van Auken, 1951; Bray, 1953; Holmes et al., 1954) and with the observations of Pass- more et al. (1955) on constitutionally thin individuals.
More detailed data were available on the changing composition of the weight loss in the course of 24 days of maintenance on a diet providing 1000 Cal/day. Average calorie deficit was estimated at about 1840 Cal/day for the first 12-day period and 1540 Cal/day for the second 12-day period. In the first few days, water constituted more than 50 per cent of the weight loss; the calorie equivalent of a kilogram of weight loss equaled less than 4500 Cal. As the study progressed, there was a definite decrease in the proportion of the loss accounted (by water, and the calorie equivalent of a kilogram of weight loss increased. The data for 22d to 24th day of caloric restriction indicate that weight loss was accounted for by fat (85 per cent) and protein (15 per cent), with no net loss of water (cf., Grande, 1961, esp. p. 180 ff ). The estimated caloric equivalent of such loss is 8700 Cal/kg. Passmore et al. (1958) have observed also marked differences in the com- position of the “obesity tissue” lost under different circumstances. As we have noted, under these conditions the ordinary densitometric analysis of body composition, used alone, is inapplicable.

Broiek et al. : Densitometric Formulas 137 Formulas for densitometric estimation of body fat. Four formulas were
developed for the estimation of total body fat from body density. Three of these were based on the model in which body weight is separated into masses corresponding, in density and composition, to the “reference body” and the “obesity tissue.” The latter was studied on the basis of data on the density and extracellular water content of tissue (1) gained, through overeating, by middle-aged, physically active schizophrenics, ( 2 ) lost by markedly obese young men as a result of reduced calorie intake, and (3 ) defined as difference between high-density and low-density “normal” young men. In the model underlying the fourth formula, body weight was sepa- rated into its fat ( d = 0.9007) and fat-free ( d = 1.100) fraction, as on@- nally proposed by Behnke, even though the constants used in our formula are different (fat) or were derived by different procedures ( fat-free mass).
Which of the four formulas is the ‘%best’’ one? If we assume that the three varieties of “obesity tissue” are different from each other, beyond the variations due to sampling and errors of measurement-this hypothesis cannot be tested statistically with reference to the formula based on dif- ference, since it was derived from means of high- and low-density indi- viduals-we may postulate that each formula would best fit the biological situations similar to those in which the data for the derivation of the formu- las were obtained. Fortunately, the calculated fat content of the “obesity tissue” in weight loss and weight gain was identical ( CG = 0.64). It may be recalled that there were substantial differences in the other components (with extracellular water of 14 per cent and 4 per cent respectively).
In contrast to the “dynamic” conditions of the weight gain and the weight loss, the data for differences between groups of men matched for height but differing in density refer to a stable, chronic, “static” situation. Consequently, the resulting formula, f = (4.570/D) - 4.142, is most ap- plicable to the estimation of the fat content in individuals in whom the body weight has been free from large, recent fluctuations, be it up or down.
In view of the substantial variations in the composition of the “obesity tissue,” it appears impossible to arrive at a generally valid formula. Under these conditions the simplest model in which the body weight is viewed as consisting of fat and the fat-free portion gains in appeal, even though simplicity is by no means a guarantee of validity.
In reality there are two, not one, issues that are involved. The first con- cerns the composition of weight gain or loss. Typically, these gains or losses are complex, involving extracellular water and “cell residue,” as well as fat. The second issue is the estimation of the total fat content of the body. For this purpose, the simplest model (fat plus fat-free) appears to be a useful approximation. It yields values which are in close agreement with the estimates based on the new formulas involving the use of the concept of obesity tissue. In the lowest ranges of body density, the formula derived from the “fat plus fat-free” model seems to overestimate the fat content of the body.

138 Annals New York Academy of Sciences Summary
Densitometric systems of two-component analysis of body composition operate with components (compartments) of known or assumed density and composition.
In the 1953 version of the Minnesota densitometric system, the body weight was separated into a mass corresponding to that of the “reference man” and of the “obesity tissue.” The density of the reference man was known (1.063). It was assumed that fat accounted for 14 per cent of the body weight.
On the basis of available information on the chemical composition of adult male bodies, supplemented by special considerations of body min- eral, a new “reference body” was established and its density (1.064) was computed. The fat content of the “reference body” was known (15.3 per cent of body weight ).
The compartment labeled “obesity tissue” was defined in 1953 by ana- lyzing weight gains made by middle-aged men, in a normal range of body weight for height and age at the onset of six months of positive caloric balance.
When a new density figure (1.078 gm./ml.) is used for a compartment labeled “cell residue,” the composition of this variety of obesity tissue re- sults as follows: extracellular water, 14 per cent; fat, 64 per cent; and “cell residue,’’ 22 per cent.
When a weight loss observed in young obese men rather than weight gain is analyzed, the following composition is obtained: extracellular water, 4 per cent; fat, 64 per cent; and “cell residue,” 32 per cent.
Finally, when the tissue accounting for the differences between young men of high and low body density is considered, the values are 7 per cent ( extracellular water), 73 per cent (fat), and 20 per cent (“cell residue”) respectively.
Equations for the estimation of the amount of “obesity tissue,” of fat associated with this compartment, and of total fat were developed on the basis of this information.
It appears that no universally valid formulas for densitometric estima- tion of the fat content can be offered.
In spite of the complexity and variability of the tissue gained or lost, the system “reference body” plus “obesity tissue” offers certain advantages over the simplest model of body composition (“fat-free plus fat”), origi- nally proposed by Behnke.
References ALLEN, T. H. & H. J. KRZYWICKI. 1961. From body water to bone mineral and back
again. In Techniques for Measuring Body Composition: 162-187. J. Bro5ek & A. Henschel, Eds. National Academy of Sciences-National Research Council. Wash- ington, D. C.
ALLEN, T. H., H. J. KRZYWICKI & J. E. ROBERTS. 1959. Density, fat, water and solids in freshly isolated tissues. J. Appl. Physiol. 14: 1005-1008.

Broiek et nl. : Deiisitometric Formulas 139 ALLEN, T. H., B. E. WELCH, T. T. TRUJILLO & J. E. ROBERTS. 1959. Fat, water and
tissue solids of the whole body less its bone mineral. J. Appl. Physiol. 14: 1009- 1012.
BAKER, P. T. 1961. Human bone mineral variability and body composition esti- mates. In Techniques for Measuring Body Composition: 6%75. J. Brofek & A. Henschel, Eds. National Academy of Sciences-National Research Council. Wash- ington, D. C.
BAKER, P. T. & A. W. NEWMAN. 1957. The use of bone weight for human identifica- tion. Am. J. Physical Anthropol. 15: 601-618.
BEHNKE, A. R., B. G. FEEN & W. C. WELHAM. 1942. Specific gravity of healthy men. J. Am. Med. Assoc. 118: 495-498.
BRAY, B. 1953. Nitrogen metabolism in West African Children, Brit. J. Nutrition. 7: 3-13.
BROZEK, J. Changes in body composition in men during maturity and their nutritional implications. Federation Proc. 11: 784-793.
BROEEK, J., F. GRANDE, H. L. TAYLOR, J. T. ANDERSON, E. R. BUSKIRK & A. KEYS. 1957. Changes in body weight and body dimensions in men performing work on a low calorie carbohydrate diet. J. Appl. Physiol. 10: 412-420.
CHATFIELD, C. & G. ADAMS. 1940. Proximate Composition of American Food Mate- rials. U. S. Department of Agriculture Circular 549. Washington, D. C.
COOK, W. R. & H. A. VAN AUKEN. 1951. Nitrogen balance studies in Laennec’s cirrhosis of liver. Ann. Internal Med. 34: 1404-1415.
VON DOBELN, W. 1956. Human standard and maximal metabolic rate in relation to fatfree body mass. Acta Physiol. Scand. 37 ( Suppl. 126) : 1-76.
ENTENMAN, C., W. H. GOLDWATER, N. S. AYRES & A. R. BEHNKE. 1958. Analysis of adipose tissue in relation to weight loss in man. J. Appl. Physiol. 13: 129-134.
FIDANZA, F., A. KEYS & J. T. ANDERSON. 1953. Density of body fat in man and other mammals. J. Appl. Physiol. 6: 252-256.
FORBES, R. M., A. R. COOPER & H. H. MITCHELL. 1953. The composition of the adult human body as determined by chemical analysis. J. Biol. Cem. 203: 359-366.
GRANDE, F. 1961. Nutrition and energy balance in body composition studies. In Tech- niques for Measuring Body Composition: 168-180. J. Brofek & A. Henschel, Eds. National Academy of Sciences-National Research Council. Washington, D. C.
HENDRICKS, S. B. & W. L. HILL. 1942. The inorganic constitution of bone. Science. 96: 255-257.
HODGMAN, C. D., Ed. 1948. Handbook of Chemistry and Physics. 30th Edition. Chemical Rubber Publishing Co. Cleveland, Ohio.
HOLMES, E. G., E. R. JONES & M. W. STANIER. 1954. Malnutrition in African adults. 2. Protein storage. Brit. J. Nutrition. 8: 173-193.
JOHNSTON, L. C. & L. M. BERNSTEIN. Body composition and oxygen consump- tion of overweight, normal, and underweight women. J. Lab. Clin. Med. 45: 109- 118.
Weight gain from simple overeating. I. Character of the tissue gained. Metabolism. 4: 427-432.
1952.
1955.
KEYS, A., J . T. ANDERSON & J. BROZEK.
KEYS, A. & J. BROZEK. 1953. Body fat in adult man. Physiol. Rev. 33: 345-325. LJUNGCREN, H., D. IKKOS & R. LUFT.
1955.
1957. Studies on body composition 11. Body fluid compartments and exchangeable potassium in obese females. Acta Endocrinol. 25: 19!3-208.
M ~ N D E Z , J. & A. KEYS. 1960. Density and composition of mammalian muscle. Metab- olism. 9: 184-188.
M ~ N D E Z , J., A. KEYS, J. T. ANDERSON & F. GRANDE. 1960. Density of fat and bone mineral of mammalian body. Metabolism. 9: 472.477.
MITCHELL, H. H., T. S. HAMILTON, F. R. STECCERDA & H. W. BEAN. 1945. The chemical composition of the adult human body and its bearing on the biochemistry of growth. J. Biol. Chem. 158: 625-637.

140 Annals New York Academy of Sciences MORALES, M. F., E. N. RATHBUN, R. E. SMITH & N. PACE. 1945. Studies on body
composition: 11. Theoretical considerations regarding the major body tissue com- partments with suggestions for application to man. , Biol. Chem. 158: 677-884.
NICHOLS, G., JR. & N. NICHOLS. 1956. The role o l bone in sodium metabolism. Metabolism. 5: 438-446.
PASSMORE, R., A. P. MEIKLEJOHN, A. D. DEWAR & R. K. THOW. 1955. An analysis of the gain in weight of overfed thin young men. Brit. J. Nutrition. 9: 27-37.
PASSMORE, R., J. A. STRONG & F. J. RITCHIE. 1958. The chemical composition of the tissue lost by obese patients on a reducing regimen. Brit. J. Nutrition. 12: 113-122.
RATHBUN, E. N. & N. PACE. 1945. Studies on body composition: I. Determination of body fat by means of the body specific gravity. J. Biol. Chem. 158: 667-676.
WASHBURN, E. W., Ed. 1926. International Critical Tables. McGraw-Hill. New York, N. Y.
WIDDOWSON, E. M., R. A. MCCANCE & C. M. SPRAY. 1951. The chemical compo- sition of the human body. Clin. Sci. 10: 113-125.