demographics & trends indianapolis, marion county & the indianapolis region
DESCRIPTION
Demographics & Trends Indianapolis, Marion County & the Indianapolis Region. Indianapolis-Carmel MSA Cities with population over 10,000. Source: 2010 U.S. Census. Source: 2000 U.S. Census. Source: 2000 U.S. Census. Source: 2000 & 2010 U.S. Censuses. Source: U.S. Censuses. - PowerPoint PPT PresentationTRANSCRIPT

Demographics & TrendsIndianapolis, Marion County &
the Indianapolis Region
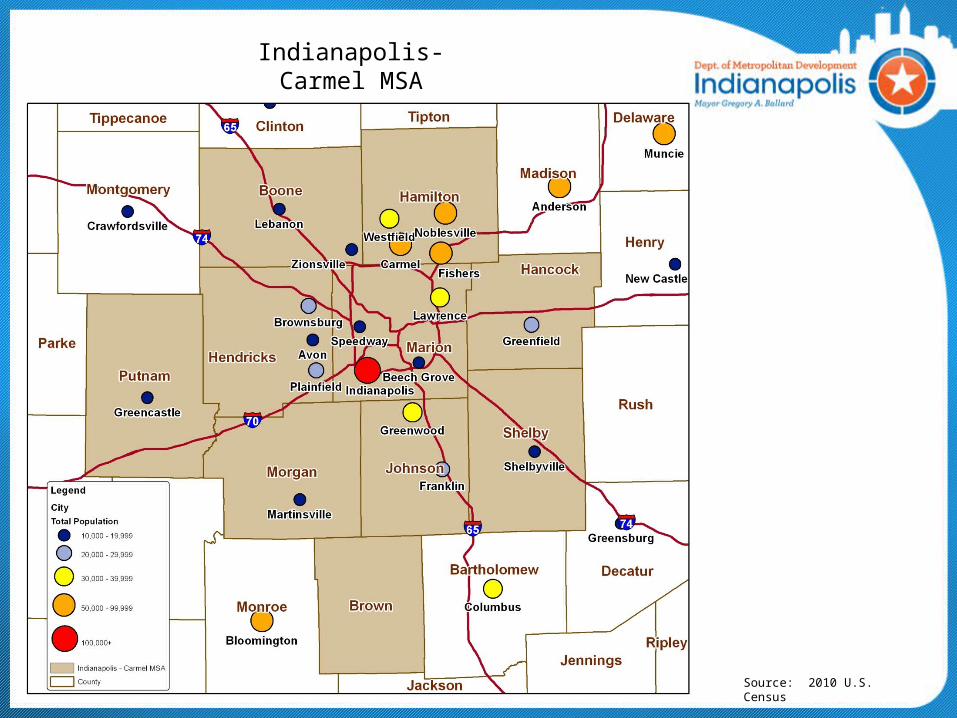
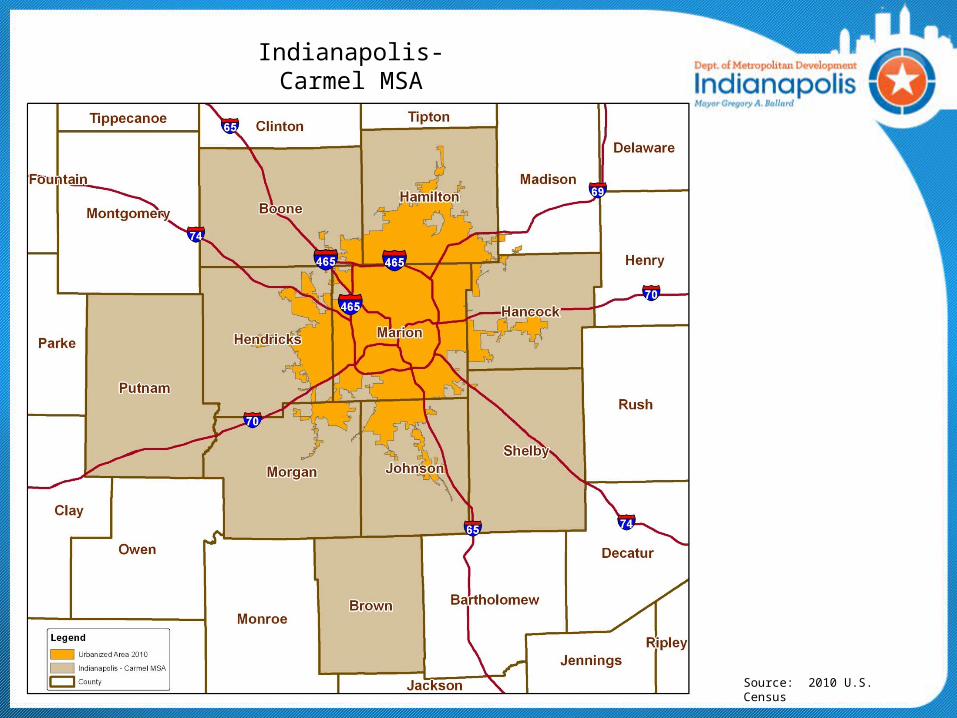
Indianapolis-Carmel MSACities with population over 10,000
Source: 2010 U.S. Census
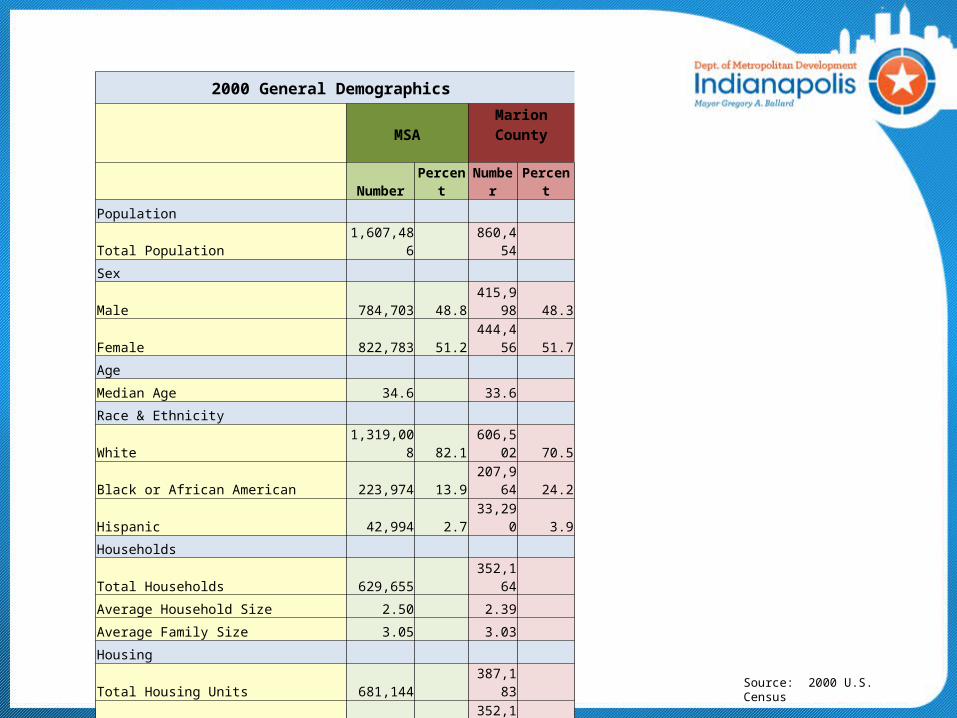
2000 General Demographics
MSA
Marion County
Number Percent Number Percent
Population
Total Population 1,607,486 860,454
Sex
Male 784,703 48.8 415,998 48.3
Female 822,783 51.2 444,456 51.7
Age
Median Age 34.6 33.6
Race & Ethnicity
White 1,319,008 82.1 606,502 70.5
Black or African American 223,974 13.9 207,964 24.2
Hispanic 42,994 2.7 33,290 3.9
Households
Total Households 629,655 352,164
Average Household Size 2.50 2.39
Average Family Size 3.05 3.03
Housing
Total Housing Units 681,144 387,183
Occupied Housing Units 629,655 92.4 352,164 91.0
Owner-Occupied 427,027 67.8 208,957 59.3
Renter-Occupied 202,628 32.2 143,207 40.7
Source: 2000 U.S. Census
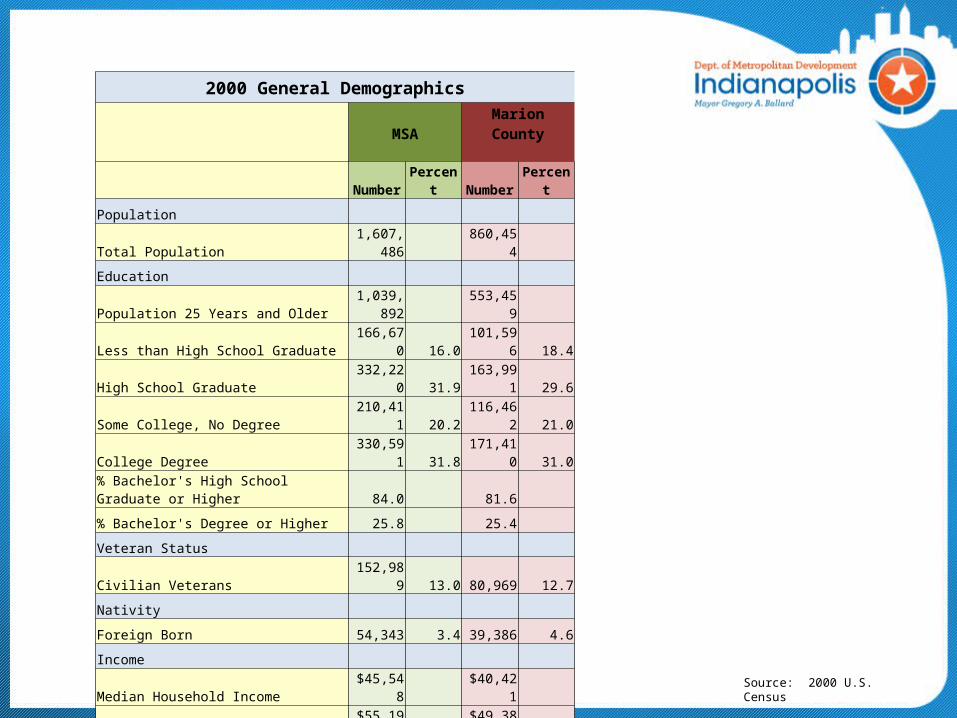
2000 General Demographics
MSA
Marion County
Number Percent Number Percent
Population
Total Population 1,607,486 860,454
Education
Population 25 Years and Older 1,039,892 553,459
Less than High School Graduate 166,670 16.0 101,596 18.4
High School Graduate 332,220 31.9 163,991 29.6
Some College, No Degree 210,411 20.2 116,462 21.0
College Degree 330,591 31.8 171,410 31.0
% Bachelor's High School Graduate or Higher 84.0 81.6
% Bachelor's Degree or Higher 25.8 25.4
Veteran Status
Civilian Veterans 152,989 13.0 80,969 12.7
Nativity
Foreign Born 54,343 3.4 39,386 4.6
Income
Median Household Income $45,548 $40,421
Median Family Income $55,191 $49,387
Poverty
Individuals in Poverty 134,618 8.6 95,827 11.4
Source: 2000 U.S. Census

2000 - 2010 Census Comparisons
2000 2010 Change % ChangeMSA 1,607,486 1,756,241 148,755 8.47Marion County Total Population 860,454 903,393 42,939 4.75White 606,502 566,853 -39,649 -6.99Black 207,964 240,975 33,011 13.70Hispanic 33,290 84,466 51,176 60.59Total Housing Units 387,183 417,862 30,679 7.34Occupied Units 352,164 366,176 14,012 3.83Vacant Units 35,019 51,686 16,667 32.25
Source: 2000 & 2010 U.S. Censuses
1840 1850 1860 1870 1880 1890 1900 1910 1920 1930 1940 1950 1960 1970 1980 1990 2000 20100
200,000
400,000
600,000
800,000
1,000,000
1,200,000
1,400,000
1,600,000
1,800,000
2,000,000
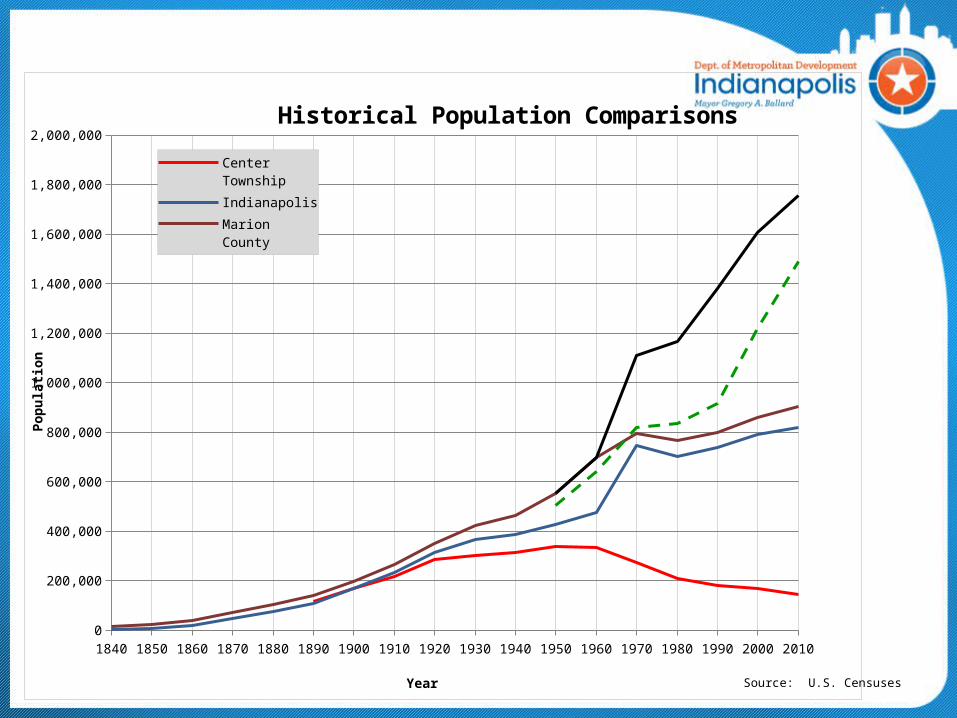
Center TownshipIndianapolisMarion CountyMSAUrbanized Area
Year
Popu
latio
n
Historical Population Comparisons
Source: U.S. Censuses
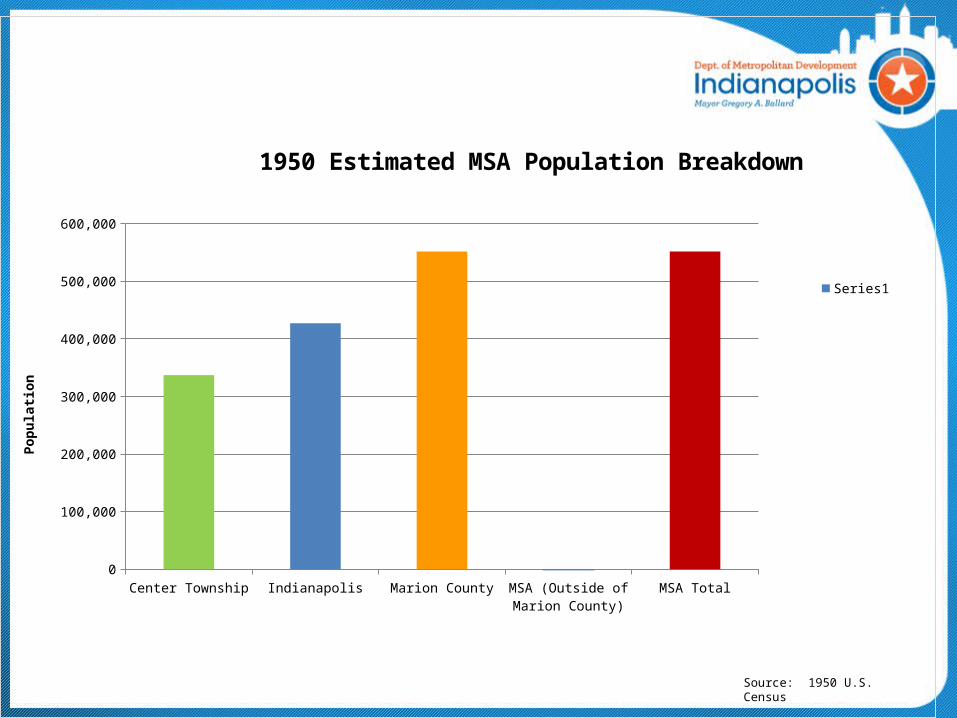
Center
Townsh
ip
Indianap
olis
Marion County
MSA (O
utside o
f Mari
on County)
MSA To
tal0
100,000
200,000
300,000
400,000
500,000
600,000
1950 Estimated MSA Population Breakdown
Series1
Popu
latio
n
Source: 1950 U.S. Census

Center Township Indianapolis Marion County MSA (Outside of Marion County)
MSATotal0
200,000
400,000
600,000
800,000
1,000,000
1,200,000
1,400,000
1,600,000
1,800,000
2,000,000
2010 MSA Population Breakdown
Series1
Popu
latio
n
Source: 2010 U.S. Census

Plainfield Westfield Greenwood Noblesville Indianapolis Fishers Carmel0
5,000
10,000
15,000
20,000
25,000
30,000
35,000
40,000
45,000
2000 - 2010 MSA City Population Growth
Series1
City
Popu
latio
n
50%
141% 38%
82%
3.6% 103%110%
Source: 2000 & 2010 U.S. Censuses

Indianapolis-Carmel MSA2010 Total Population by Township
Source: 2010 U.S. Census
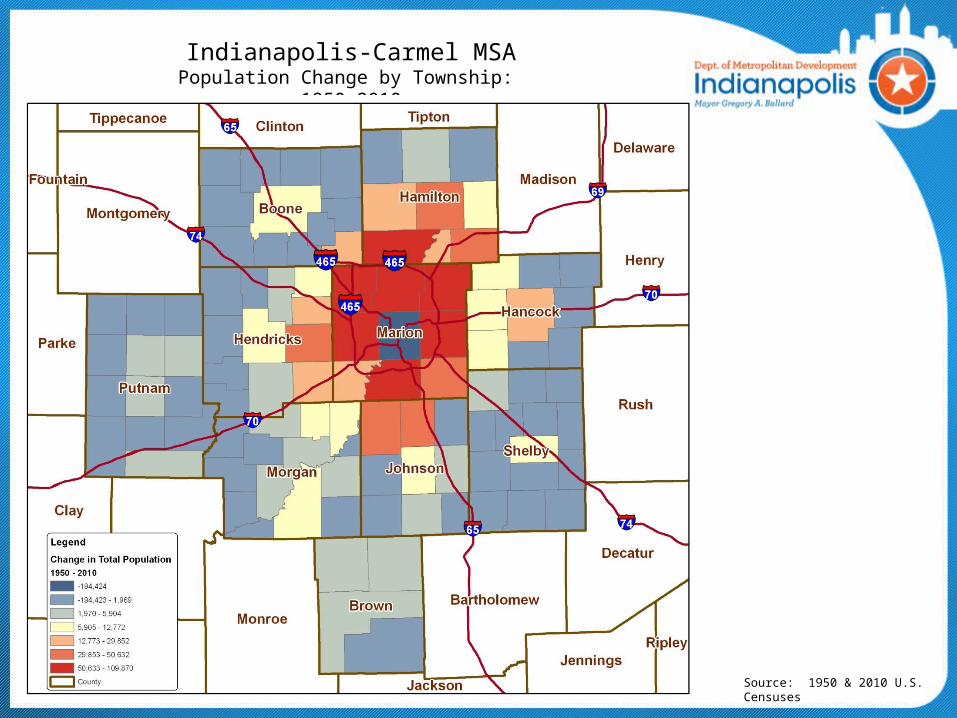
Indianapolis-Carmel MSAPopulation Change by Township: 1950-2010
Source: 1950 & 2010 U.S. Censuses

Indianapolis-Carmel MSA2010 Population Density by Township
Source: 2010 U.S. Census
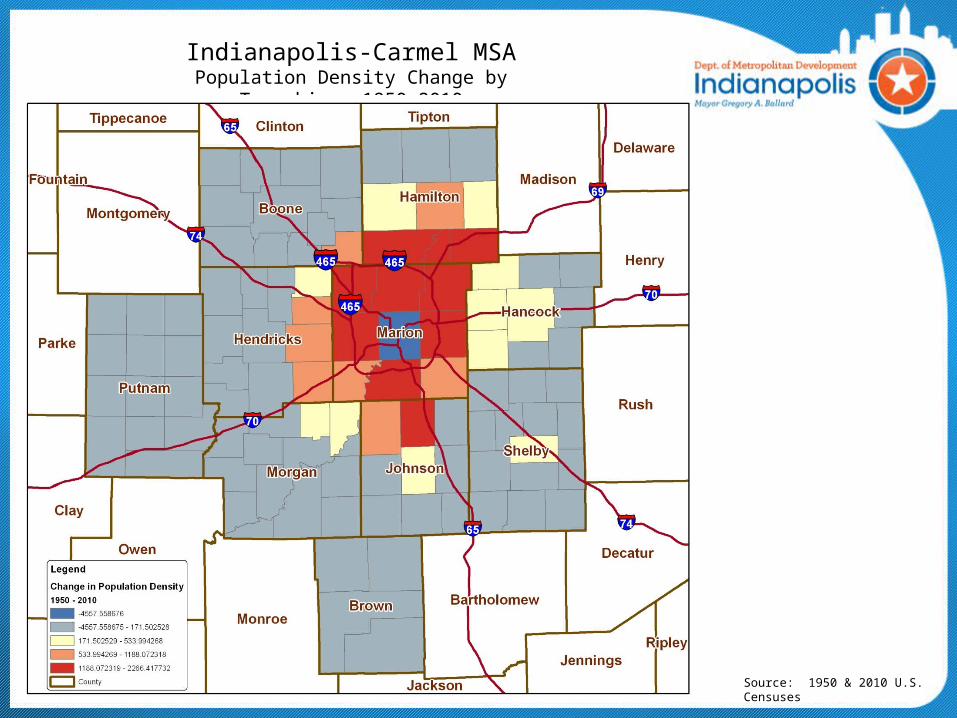
Indianapolis-Carmel MSAPopulation Density Change by Township: 1950-2010
Source: 1950 & 2010 U.S. Censuses
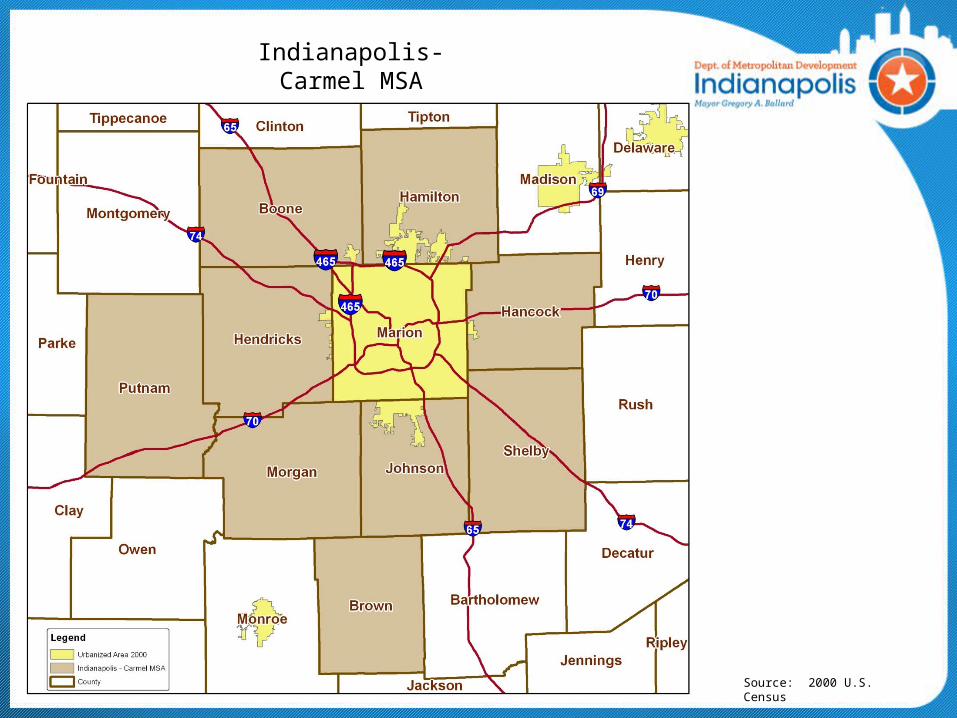
Indianapolis-Carmel MSA2000 Urbanized Area
Source: 2000 U.S. Census
Indianapolis-Carmel MSA2010 Urbanized Area
Source: 2010 U.S. Census

Indianapolis-Carmel MSA & Vicinity2010 Urbanized Areas & Urban Clusters
Source: 2010 U.S. Census
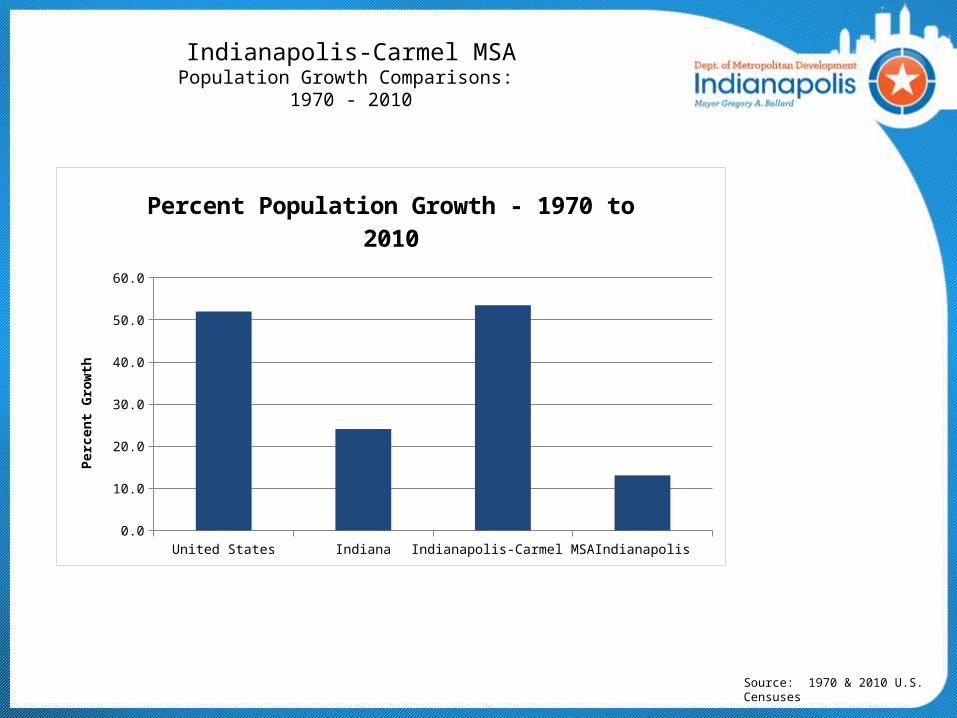
Indianapolis-Carmel MSAPopulation Growth Comparisons: 1970 - 2010
United States Indiana Indianapolis-Carmel MSA Indianapolis0.0
10.0
20.0
30.0
40.0
50.0
60.0
Percent Population Growth - 1970 to 2010
Perc
ent G
row
th
Source: 1970 & 2010 U.S. Censuses
Clevela
nd
Pittsburgh
Grand Rap
ids
Cincinnati
Des Moines
Minneapolis
Milwau
kee
St. Lo
uis
Louisv
ille
Indianap
olis
Memphis
Portlan
d
Kansas
City
Oklahoma C
ity
Denve
r
Columbus
Nashvil
le
Jackso
nville
Austin
Charlotte
-100,000
-50,000
0
50,000
100,000
150,000
200,000
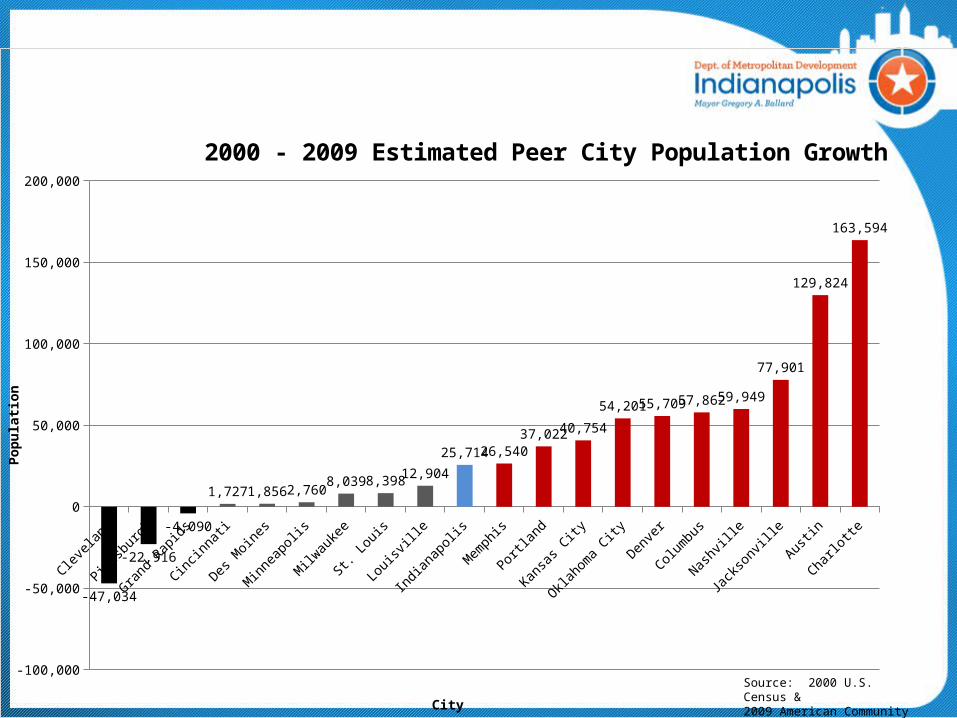
-47,034
-22,916
-4,090
1,727 1,856 2,7608,039 8,398 12,904
25,714 26,54037,022 40,754
54,201 55,709 57,862 59,949
77,901
129,824
163,594
2000 - 2009 Estimated Peer City Population Growth
City
Popu
latio
n
Source: 2000 U.S. Census & 2009 American Community Survey
Pittsburgh
Clevela
nd
Grand Rap
ids
Milwau
kee
Des Moines
Louisv
ille
Memphis
St. Lo
uis
Oklahoma C
ity
Cincinnati
Columbus
Jackso
nville
Indianap
olis
Kansas
Nashvil
le
Minneapolis
Portlan
d
Denve
r
Charlotte
Austin
-200,000
-100,000
0
100,000
200,000
300,000
400,000
500,000
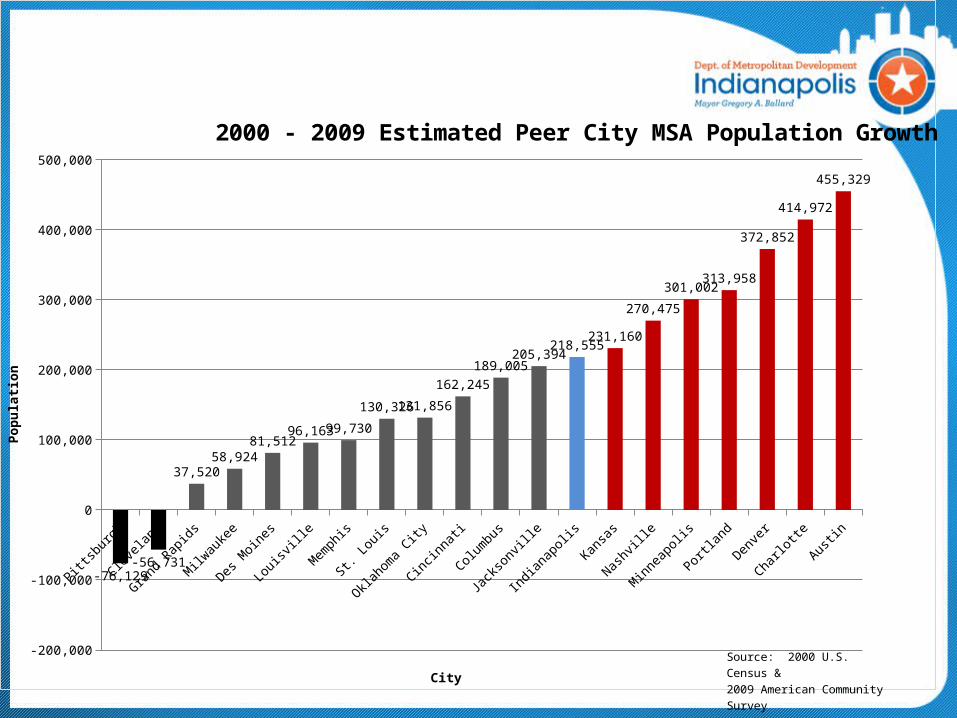
-76,129-56,731
37,52058,924
81,51296,16399,730
130,326131,856
162,245189,005
205,394218,555
231,160
270,475
301,002313,958
372,852
414,972
455,329
2000 - 2009 Estimated Peer City MSA Population Growth
City
Popu
latio
n
Source: 2000 U.S. Census & 2009 American Community Survey

Indianapolis-Carmel MSARacial Composition
White
African
American Asia
n
American
Indian
/Alas
kan Nati
ve
Native
Hawaii
an/P
acific Is
lander
Two or M
ore Race
sOther
0.0
10.0
20.0
30.0
40.0
50.0
60.0
70.0
80.0
90.0
U.S.IndianaMSAMarion County
Race
Perc
ent o
f Pop
ulati
on
Source: 2010 U.S. Census

Indianapolis-Carmel MSARacial Composition
Source: 2010 U.S. Census
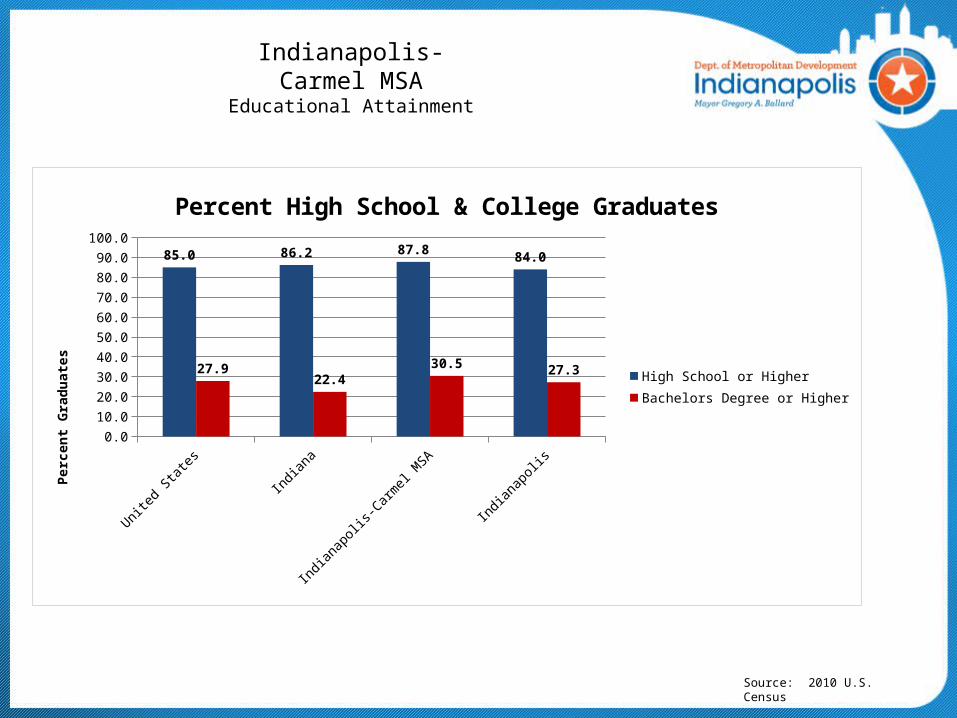
United States Indiana Indianapolis-Carmel MSA
Indianapolis0.0
10.0
20.0
30.0
40.0
50.0
60.0
70.0
80.0
90.0
100.0
85.0 86.2 87.884.0
27.922.4
30.527.3
Percent High School & College Graduates
High School or HigherBachelors Degree or Higher
Perc
ent G
radu
ates
Indianapolis-Carmel MSAEducational Attainment
Source: 2010 U.S. Census

Indianapolis-Carmel MSAEducational Attainment
Source: 2010 U.S. Census

Indianapolis-Carmel MSAAge Distribution
4 and Younger 5 to 17 18 to 24 25 to 44 45 to 64 65 and Older0.0
5.0
10.0
15.0
20.0
25.0
30.0
35.0
U.S.IndianaMSAMarion County
Age Cohort
Perc
ent o
f Pop
ulati
on
Source: 2010 U.S. Census
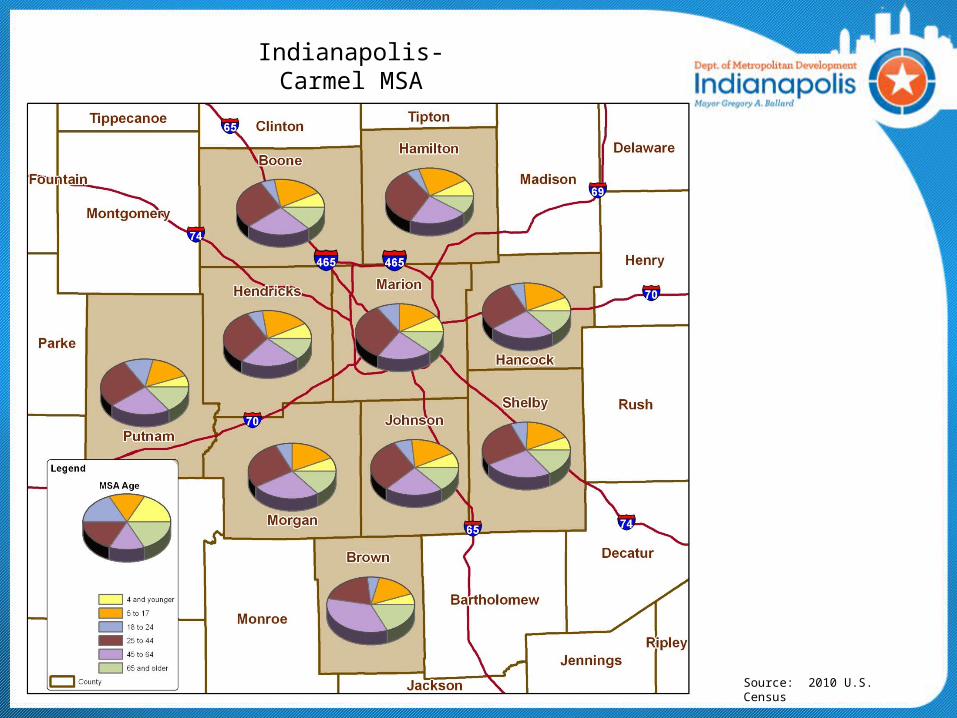
Indianapolis-Carmel MSAAge Distribution
Source: 2010 U.S. Census
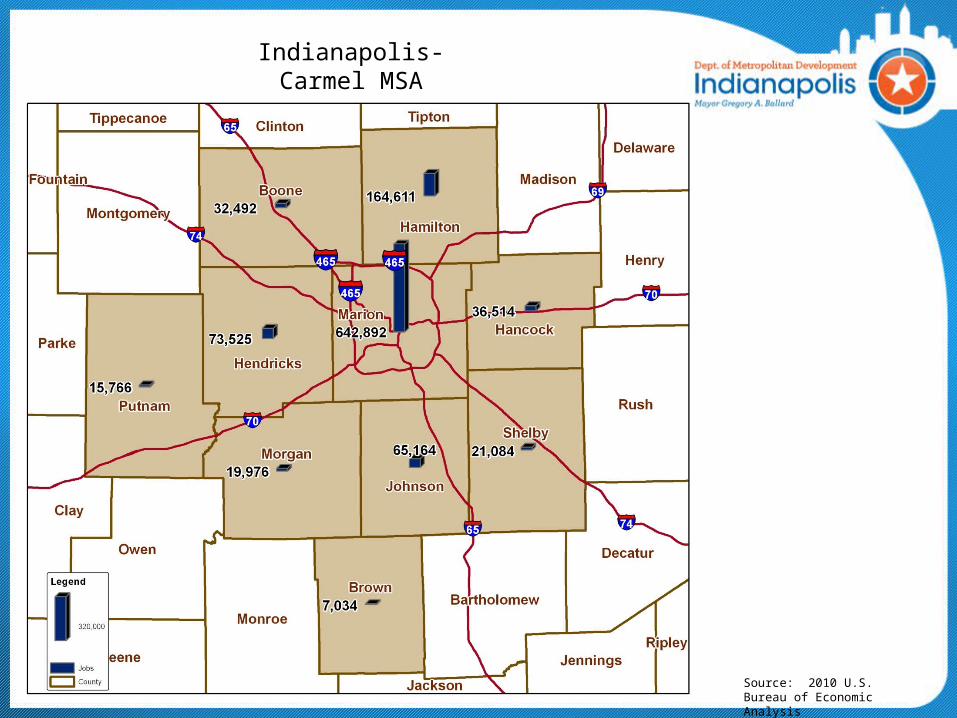
Indianapolis-Carmel MSAJobs
Source: 2010 U.S. Bureau of Economic Analysis
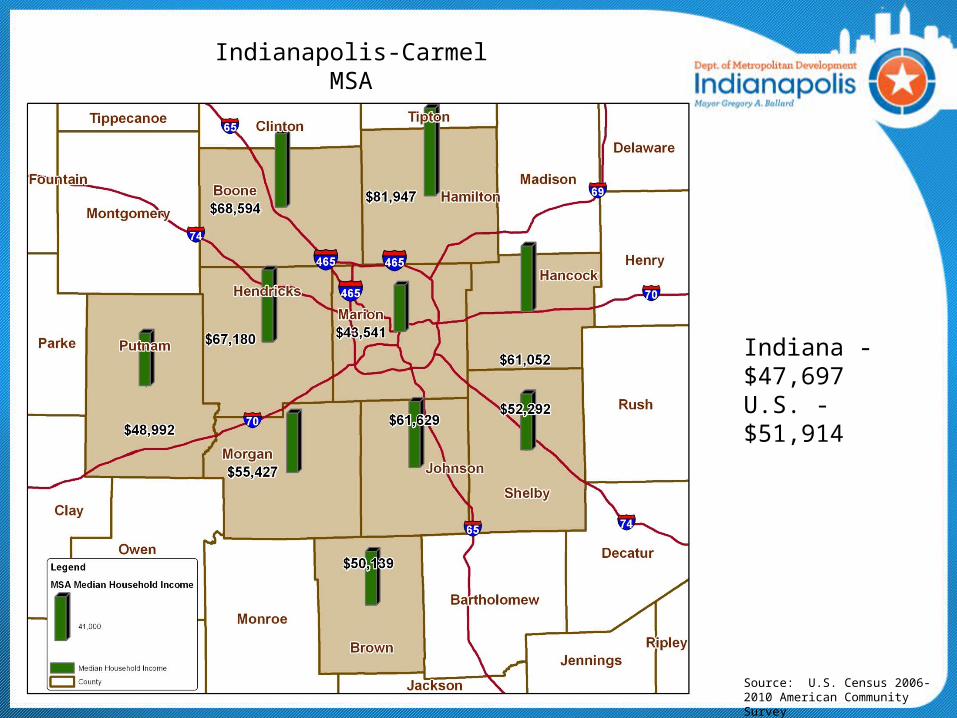
Indianapolis-Carmel MSA2006-2010 Median Household Income
Indiana - $47,697U.S. - $51,914
Source: U.S. Census 2006-2010 American Community Survey
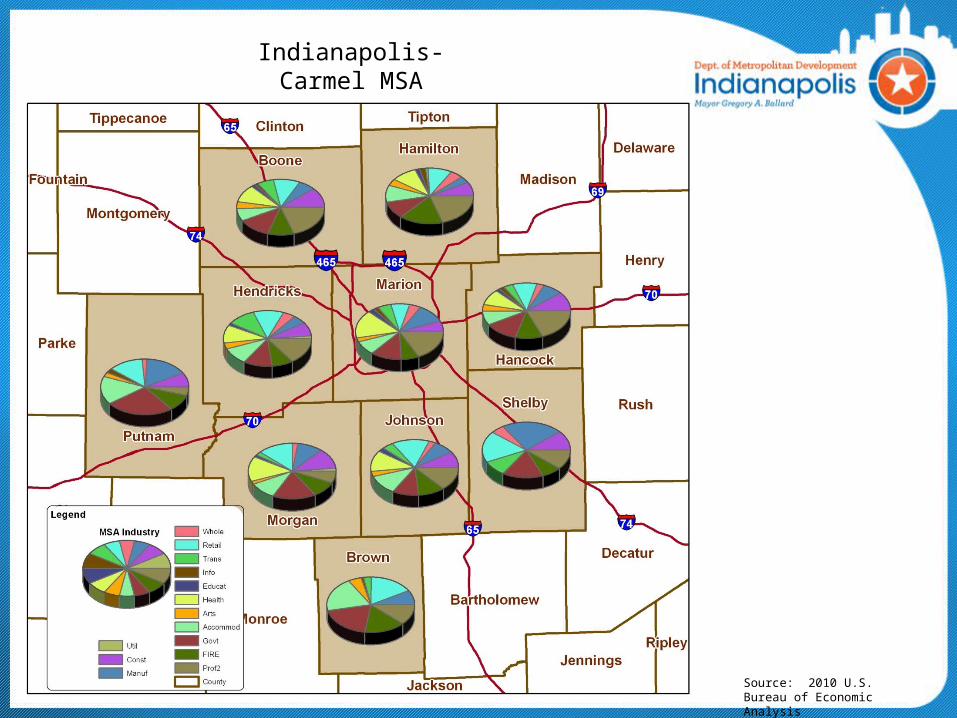
Indianapolis-Carmel MSAPercent of Jobs by Industry
Source: 2010 U.S. Bureau of Economic Analysis
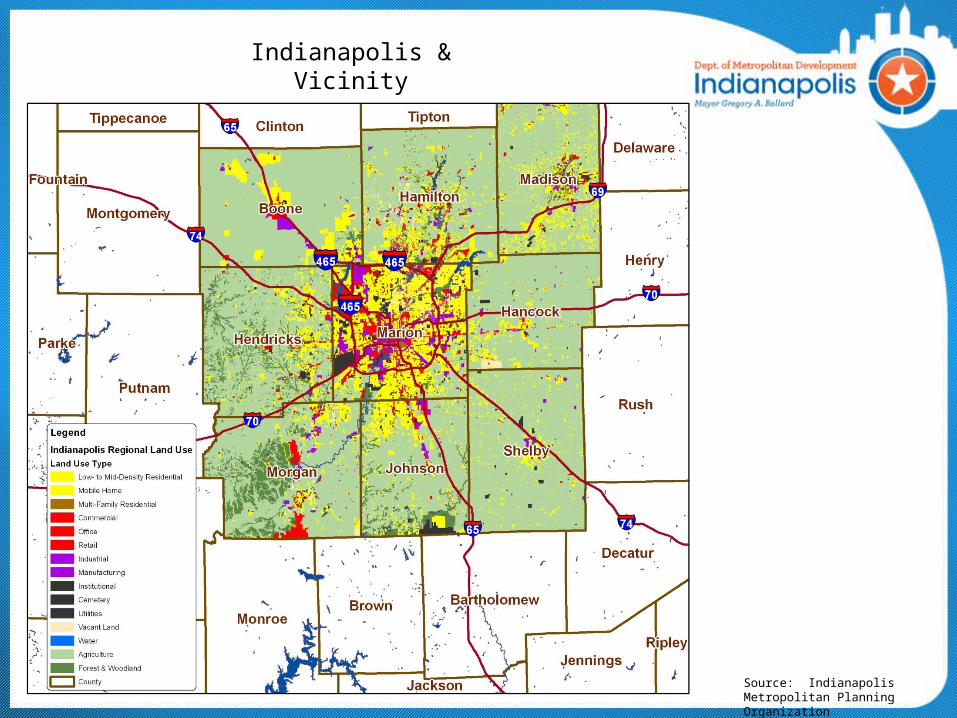
Indianapolis & VicinityLand Use
Source: Indianapolis Metropolitan Planning Organization
Jan. 97 Jan. 98 Jan. 99 Jan. 00 Jan. 01 Jan. 02 Jan. 03 Jan. 04 Jan. 05 Jan. 06 Jan. 07 Jan. 08 Jan. 09 Jan. 10 Nov. 100
10000
20000
30000
40000
50000
60000
70000
80000
90000
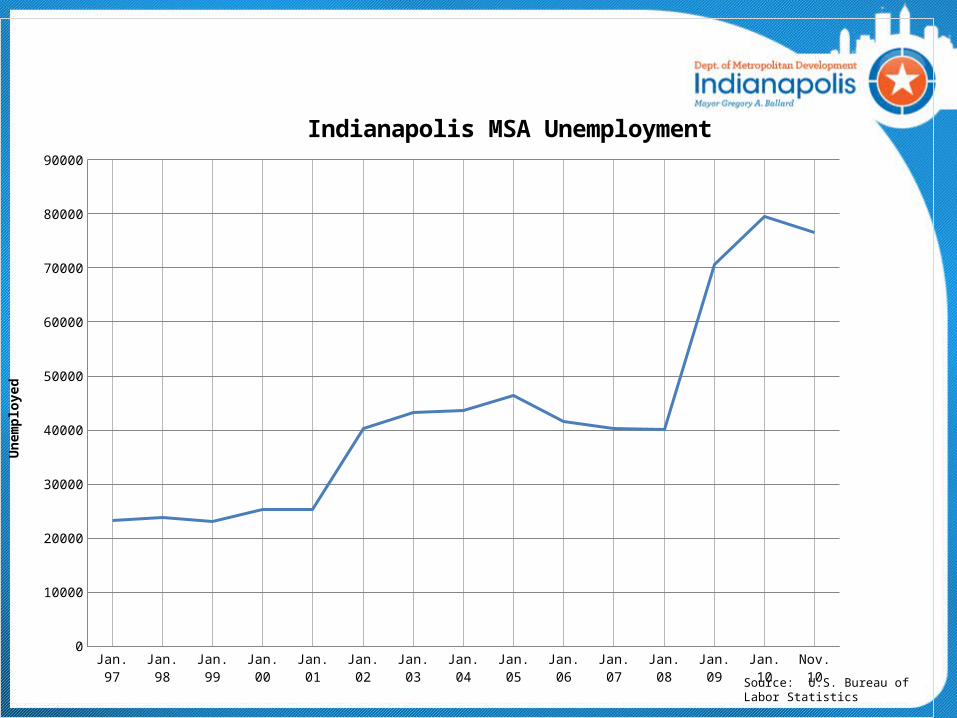
Indianapolis MSA Unemployment
Unem
ploy
ed
Source: U.S. Bureau of Labor Statistics

2000 2001 2002 2003 2004 2005 2006 2007 2008 2009 Dec. 20100.0
2.0
4.0
6.0
8.0
10.0
12.0
Unemployment Rate Comparisons
Indianapolis
MSA
Indiana
U.S.
Perc
ent U
nem
ploy
men
t
Source: U.S. Bureau of Labor Statistics

1998 1999 2000 2001 2002 2003 2004 2005 2006 2007 2008500,000
510,000
520,000
530,000
540,000
550,000
560,000
570,000
Marion County Employees (1998-2008)
Year
Empl
oyee
s
Source: U.S. Bureau of Economic Analysis
1996 1997 1998 1999 2000 2001 2002 2003 2004 2005 2006 2007 2008 20090
2000
4000
6000
8000
10000
12000
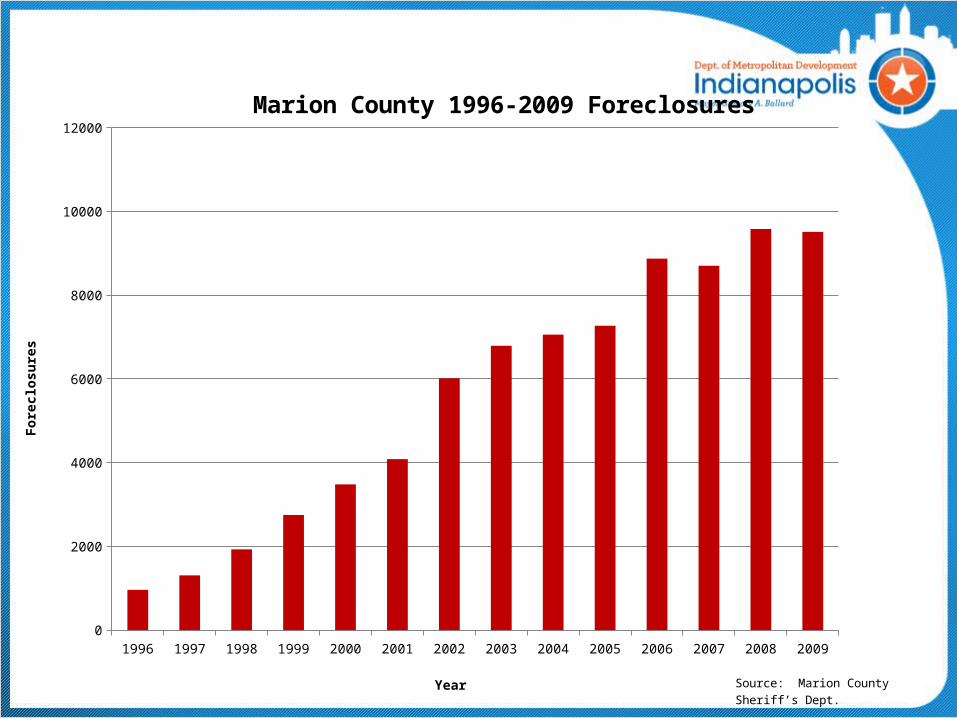
Marion County 1996-2009 Foreclosures
Year
Fore
closu
res
Source: Marion County Sheriff’s Dept.
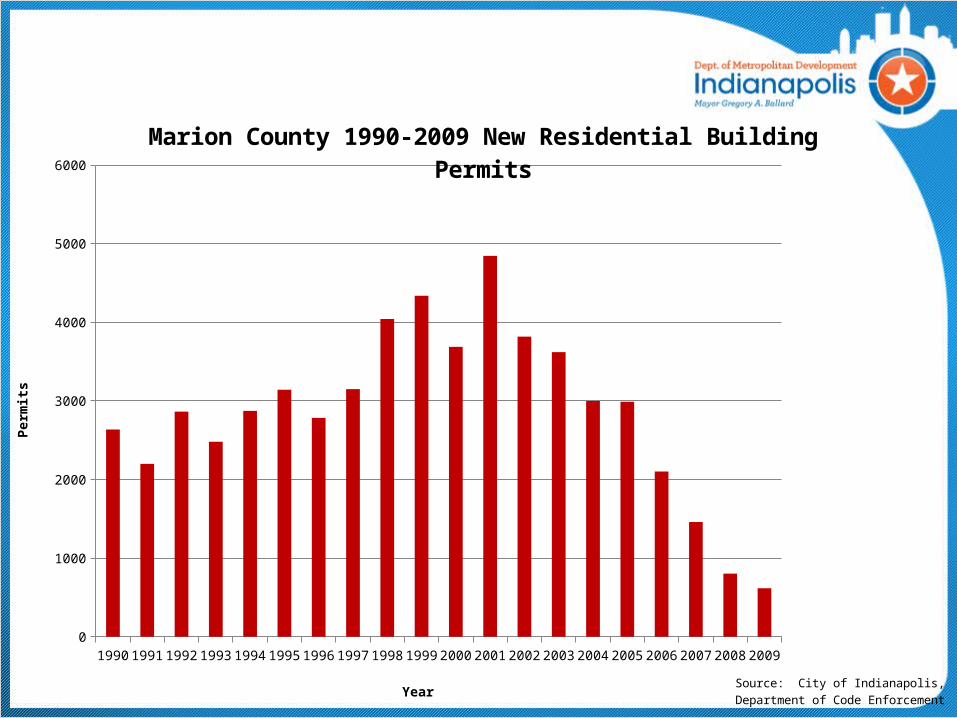
1990 1991 1992 1993 1994 1995 1996 1997 1998 1999 2000 2001 2002 2003 2004 2005 2006 2007 2008 20090
1000
2000
3000
4000
5000
6000
Marion County 1990-2009 New Residential Building Permits
Year
Perm
its
Source: City of Indianapolis, Department of Code Enforcement

1999 2000 2001 2002 2003 2004 2005 2006 2007 2008 20090
50
100
150
200
250
300
350
Marion County1999-2009 New Commercial & Industrial Building Permits
Industrial
Commercial
Year
Perm
its
Source: City of Indianapolis, Department of Code Enforcement
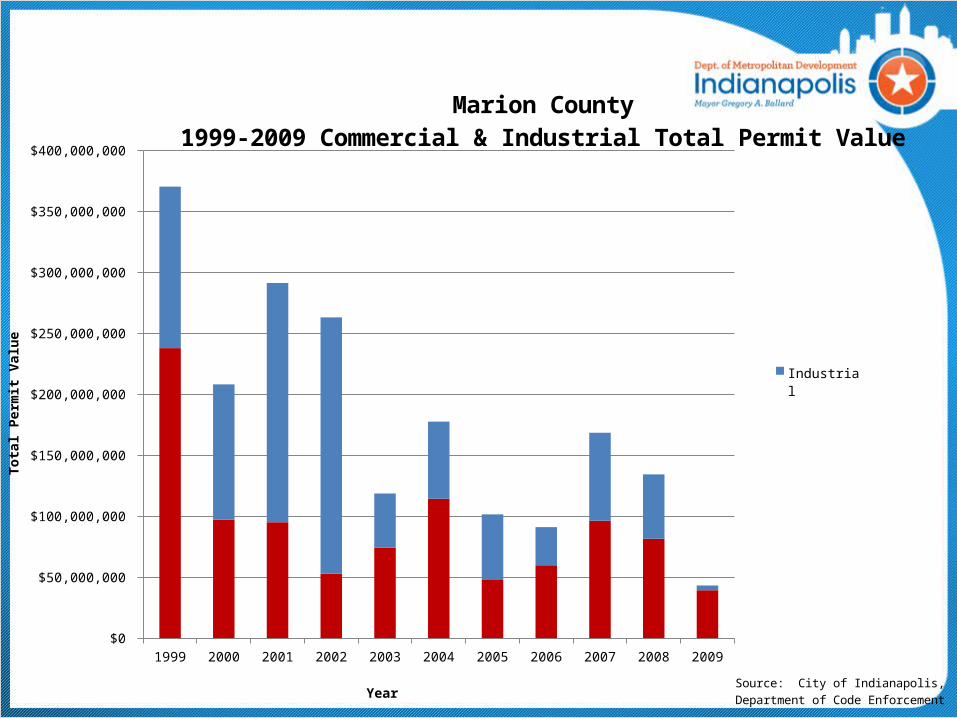
1999 2000 2001 2002 2003 2004 2005 2006 2007 2008 2009$0
$50,000,000
$100,000,000
$150,000,000
$200,000,000
$250,000,000
$300,000,000
$350,000,000
$400,000,000
Marion County1999-2009 Commercial & Industrial Total Permit Value
Industrial
Commercial
Year
Tota
l Per
mit
Valu
e
Source: City of Indianapolis, Department of Code Enforcement
Enqueries
Robert GlennPrincipal PlannerCity of IndianapolisDivision of Planning(317) 327-5112