demand management plan - bellingen shire · water demand trend tracking and climate correction...
TRANSCRIPT

OCTOBER 2012
Bell ingen Shire CouncilDemand Management Plan
Bellingen Shire Council
Job Number A408
A408 Bellingen Shire Demand Management Plan Rev3 HydroScience Consulting October 2012 Page 1
Demand Management Plan
HydroScience Consulting Pty Ltd
A.B.N. 79 120 716 887
Suite 4, Level 1, 189 Kent Street
Sydney, NSW, 2000
Telephone: 02 9249 5100
Facsimile: 02 9251 4011
Email: [email protected]
Document Control
Approved for Issue
Rev Author Reviewer Name Signature Date
3 SLA ARA Andrew Fraser
29 October 2012
© HydroScience Consulting 2012
This document shall remain the property of HydroScience Consulting. Unauthorised use
of this document in any form is prohibited.

A408 Bellingen Shire Demand Management Plan Rev3 HydroScience Consulting October 2012 Page 2
Executive Summary
This Demand Management Plan reviews Bellingen Shire Council’s (BSC) existing
demand management measures and recommends further actions that Council can
implement to achieve best-practice demand management.
The water demand analyses include climate corrected historical water production and
demand forecast analyses for the Lower Bellinger and Dorrigo water supply schemes.
The analyses for the Lower Bellinger water supply scheme were done using the
following models developed by NSW Office of Water:
Water Demand Trend Tracking and Climate Correction Model;
Demand Management Decision Support System (known as the DSS).
The outcomes of these analyses include:
Annual demand forecasts;
Peak Day Demand forecasts;
Unaccounted for Water Analyses;
Potential water demand management measures suitable to BSC.
A rainwater tank assessment was also undertaken to identify the benefits of using
rainwater to replace potable water. This assessment was done using the Rainwater
Tank Model developed by NSW Office of Water. It was performed for the Lower
Bellinger scheme water supply area. However the benefits identified from using
rainwater tanks could be applied to other localities within the Shire. The outcome of this
assessment is provided in Appendix C.
BSC has the following existing demand management measures in place:
Community Education;
System Water Loss Management.
The DSS model prepared for Lower Bellinger water supply scheme prioritised demand
management options based on benefit cost ratios. The outcomes of the model
indicate that the preferred potential demand management measures for BSC were, in
order of priority:
Conservation Pricing for Residential Users
Residential Washing Machine Rebate
National Mandatory Water Efficiency Labelling Scheme (WELS)
A408 Bellingen Shire Demand Management Plan Rev3 HydroScience Consulting October 2012 Page 3
Rainwater Tanks for all new Residential Development BASIX - Fixture Efficiency
with Rainwater Use
Residential Shower Retrofit
The existing and potential demand management measures have been analysed and
their benefits are provided in section 5 of the report. Section 5 of this report contains a
proposed implementation plan for the potential water demand management
measures identified for BSC.
The main aims of implementing the demand management measures recommended to
BSC are to:
Ensure water availability;
Project water demand to determine the need of water demand management
actions;
Satisfy the Best-Practice Management Guidelines requirement;
Reduce capital works (new reservoirs and sewerage treatment plant) costs.
It is expected that BSC will continue the implementation of the existing demand
management measures and where practical implement the potential water demand
management measures identified. If BSC decides to implement demand
management, it is recommended that an assessment process to monitor and evaluate
implementation be developed.
It is expected that the implementation of potential water demand management
actions will be considered by Council as opportunities arise and specifically as part of
its Annual Management Plan.

A408 Bellingen Shire Demand Management Plan Rev3 HydroScience Consulting October 2012 Page 4
Contents
Contents ...........................................................................................................................4
1 Introduction.......................................................................................................6
1.1 Project Background .......................................................................................................... 6
1.2 Context ............................................................................................................................... 6
2 Demand Monitoring ......................................................................................8
3 Demand Forecasting .................................................................................. 10
3.1 Approach ......................................................................................................................... 10
3.2 Demand Trend Tracking and Climate Correction Model ........................................ 10
3.3 Demand Side Management Decision Support System (DSS) Model ..................... 11
3.4 Demand Forecast Based on Growth Projections ...................................................... 12
3.5 Dorrigo Water Supply Scheme ...................................................................................... 12 3.5.1 Scheme Overview ................................................................................................................... 12 3.5.2 Annual Demand Analysis ....................................................................................................... 13 3.5.3 Per Capita Demand Analysis ................................................................................................ 14 3.5.4 Peak Day Demand Analysis................................................................................................... 15 3.5.5 Demand Forecast for Each Customer Category ............................................................... 16
3.6 Lower Bellinger Water Supply Scheme ........................................................................ 17 3.6.1 Scheme Overview ................................................................................................................... 17 3.6.2 Annual Demand Analysis ....................................................................................................... 19 3.6.3 Per Capita Demand Analysis ................................................................................................ 20 3.6.4 Peak Day Demand Analysis................................................................................................... 20 3.6.5 Demand Forecast for Each Customer Category ............................................................... 23
4 Demand Management Planning ........................................................... 25
4.1 Water Demand Management Drivers ......................................................................... 25 4.1.1 Impact of Climate Change ................................................................................................... 25 4.1.2 Non-revenue Water ................................................................................................................ 26
4.2 Demand Management Measures in Place ................................................................ 28 4.2.1 Community Education ........................................................................................................... 28 4.2.2 System Water Loss Management ......................................................................................... 29
4.3 Demand Management Scenarios ............................................................................... 29
4.4 Potential Demand Management Measures .............................................................. 31 4.4.1 Introduction .............................................................................................................................. 31 4.4.2 Conservation Pricing for Residential Users ........................................................................... 32 4.4.3 Residential Washing Machine Rebate Program ................................................................ 33 4.4.4 National Mandatory Water Efficiency Labelling Scheme (WELS) program ................... 33

A408 Bellingen Shire Demand Management Plan Rev3 HydroScience Consulting October 2012 Page 5
4.4.5 Residential Shower Retrofit ..................................................................................................... 34 4.4.6 BASIX - Fixture Efficiency with Rainwater Use ...................................................................... 34
4.5 Summary and Comparison ........................................................................................... 36
4.6 30 year projected Water Savings Outcomes ............................................................. 37 4.6.1 Lower Bellinger Water Supply Area ...................................................................................... 37 4.6.2 Dorrigo Water Supply Area .................................................................................................... 39
5 Proposed Implementation Plan ............................................................ 41
5.1 Overview ........................................................................................................................... 41
5.2 5 years Demand Management Implementation Outcomes .................................. 41
6 Reference ......................................................................................................... 43
Appendix A ................................................................................................................... 44
Appendix B ................................................................................................................... 54
Appendix C ................................................................................................................... 66
A408 Bellingen Shire Demand Management Plan Rev2 HydroScience Consulting October 2012 Page 6
1 Introduction
1.1 Project Background
All NSW Local Water Utilities (LWUs) are encouraged to improve their water supply
businesses in accordance with the Guidelines for Best-Practice Management of Water
Supply and Sewerage (2007) prepared by NSW Office of Water.
By developing this Demand Management Plan Bellingen Shire Council (BSC) aims to
ensure a safe and secure potable water supply in the future and to comply with the
Best-Practice guidelines.
For this study, demand analyses were performed for both the Lower Bellinger water
supply scheme (LBWSS) and the Dorrigo water supply scheme (DWSS). The demand
analyses for LBWSS included climate correction of historical demand and demand
forecasting using the Water Demand Trend Tracking and Climate Correction model
and the DSS model, both developed by NSW Office of Water. The main outcomes of
these models are presented in section 3.5 and details of the analyses are provided in
Appendix A and Appendix B.
1.2 Context
This Demand Management Plan was developed to ensure that water use in the BSC
service areas is efficient and appropriate.
According to the NSW Office of Water Best Practice Management Guidelines (2007)
water demand management and demand management plan must cover four
elements:
1. Demand monitoring
2. Demand forecasting
3. Demand management planning
4. Implementation
Element 1: demand monitoring is done by Council. BSC best-practice management
compliance status in regards to demand monitoring is provided in Section 2.
Element 2: this was completed during the preparation of this report. The demand
management plan provides a description of the existing Lower Bellinger and Dorrigo
water supply schemes and their historical and expected demand. The relevant
technical information about demand forecasting is provided in Appendix A and
Appendix B.

A408 Bellingen Shire Demand Management Plan Rev3 HydroScience Consulting October 2012 Page 7
Element 3: this is the main outcome of this report. It includes potential demand
management measures for BSC water supply schemes. BSC’s current water demand
management measures and potential measures were identified including their water
saving and financial benefits.
Element 4: BSC has already implemented some water demand management
measures. Other potential demand management measures are provided for Council’s
consideration and future implementation.
A demand management implementation plan including five years estimated costs is
detailed for Council’s consideration.

A408 Bellingen Shire Demand Management Plan Rev3 HydroScience Consulting October 2012 Page 8
2 Demand Monitoring
Best-practice water conservation and demand management are essential for efficient
management of a Local Water Utility water supply business and for efficient use for
water resources. Table 1 below presents Bellingen Shire Council’s demand monitoring
status.
Table 1: Water Demand Management Compliance with Best-Practice Requirements
Requirements Compliance Comments
Demand Monitoring
Bulk water production metered and
recorded on a daily basis
Yes
All free standing and multi-unit residential
developments (both strata and non-strata)
approved after 1 July 2004 must be
separately metered.
Yes
Customer water consumption billed at
least three times a year (and preferably
quarterly).
Yes Council bills water supply customers four
times a year: May, August, November and
February.
Customers classified in accordance with
the categories defined in the latest NSW
Water Supply and Sewerage Performance
Monitoring Report and consumptions
reported annually.
No Council’s customer categories are
breakdown into residential and non-
residential only. Consumption is recorded
in Council’s billing data base - Water and
Sewer Knowledge Centre.
The NSW Office of Water suggests that each LWU should review its demand
management measures every 2 years to ensure that it has an appropriate balance
between demand and supply-side investment.
The customer types are classified in accordance to the categories defined in the NSW
Water Supply and Sewerage Performance Monitoring Report and are detailed in Table
2 (source: Water Conservation & Demand Management Check List, NSW Office of
Water, Best-Practice Management of Water -Supply and Sewerage Guidelines, Aug
2007).
A408 Bellingen Shire Demand Management Plan Rev3 HydroScience Consulting October 2012 Page 9
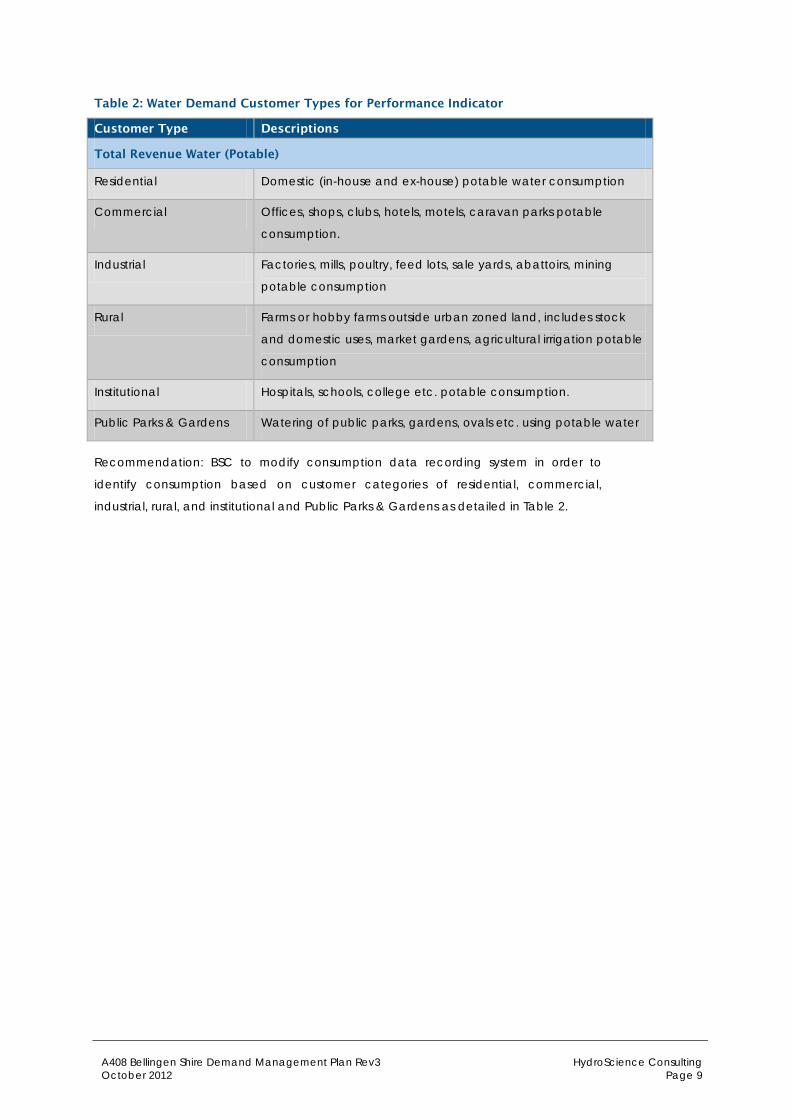
Table 2: Water Demand Customer Types for Performance Indicator
Customer Type Descriptions
Total Revenue Water (Potable)
Residential Domestic (in-house and ex-house) potable water consumption
Commercial Offices, shops, clubs, hotels, motels, caravan parks potable
consumption.
Industrial Factories, mills, poultry, feed lots, sale yards, abattoirs, mining
potable consumption
Rural Farms or hobby farms outside urban zoned land, includes stock
and domestic uses, market gardens, agricultural irrigation potable
consumption
Institutional Hospitals, schools, college etc. potable consumption.
Public Parks & Gardens Watering of public parks, gardens, ovals etc. using potable water
Recommendation: BSC to modify consumption data recording system in order to
identify consumption based on customer categories of residential, commercial,
industrial, rural, and institutional and Public Parks & Gardens as detailed in Table 2.
A408 Bellingen Shire Demand Management Plan Rev3 HydroScience Consulting October 2012 Page 10
3 Demand Forecasting
3.1 Approach
As a Local Water Utility, Bellingen Shire Council is responsible for the water supply
functions within the Bellingen Local Government Area. Council operates two water
supply schemes:
Dorrigo Water Supply Scheme (DWSS) and
Lower Bellinger Water Supply Scheme (LBWSS).
This section provides an overview of the demand analyses methods used to assess
these schemes and the result of these demand analyses for each of these schemes.
Water supply schemes with populations larger than 1,500 people are required to have
climate corrected historical demand analyses and forecasting demand analyses using
the models developed by the NSW Office of Water:
Water Demand Trend Tracking and Climate Correction Model: which tracks
past trends in water production on a climate corrected basis and provides
expected production figures based on the historical climate corrections.
Demand Management Decision Support System (known as the DSS): which
forecasts demand based on the climate corrected demand figures and
provides a preliminary evaluation of demand management measures.
The permanent population served by the LBWSS in 2009 was 8,334 excluding visitors
(BSC IWCM Strategy, Dec 2011). Water demand from the Lower Bellinger water supply
scheme has been analysed using the models developed by NSW Office of Water.
Major outcomes of this analysis in provided in section 3.6. Detailed analyses is provided
in Appendices A and B.
Dorrigo Township’s permanent population in 2009 was 1,223 people excluding visitors
(BSC IWCM Strategy, Dec 2011). DWSS demand forecasts were analysed applying the
growth rate to the daily water production operation records. This analysis is provided in
section 3.5.
3.2 Demand Trend Tracking and Climate Correction Model
This model is used to track past trends in water production on a climate corrected basis
and it estimates climate-corrected demand, based on per-capita demand and
population growth. By climate correcting the demand a more realistic estimate of the
water supplies normal demand can be ascertained.
A408 Bellingen Shire Demand Management Plan Rev3 HydroScience Consulting October 2012 Page 11
Climate has a significant impact on water demands. In examining long-term past
demand patterns it is essential to understand the effect of climate on water demand.
A Climate Correction Model is used to track past trends in water production on a
climate corrected basis. The model considers that the climatic conditions that affect
demand are temperature, rainfall and evaporation.
The model’s approach involves two main phases:
Model calibration and tracking of production against a defined baseline
period;
Trend tracking, where the departures of the observed demands from those
predicted by the baseline model are analysed.
The outcome is a climate-corrected demand forecast based on per-capita demand
and population growth. By climate correcting the demand a more realistic estimate of
the water supplies normal demand can be ascertained. Thereby it is not overreacting
to very dry or very wet years.
The approach and methodology used to run this model is outlined in NSW Office of
Water’s Water Demand Trend Tracking and Climate Correction (Version 10) Manual,
May 2002 (Reformatted June 2006).. A summary of the methodology and details of the
model outcomes are shown in Appendix A.
3.3 Demand Side Management Decision Support System (DSS) Model
The DSS model is a tool designed by the NSW Office of Water to develop demand
forecasts and preliminary evaluations of demand management measures.
This model uses the climate corrected historical demand data to develop demand
forecasts and preliminary evaluation of demand management measures as required
by the Best-Practice Management planning framework. The modelling includes the
development of demand management scenarios which test the impact of
implementing additional demand management measures on water demand.
Typically, the modelling includes development of the baseline forecast and four
demand management scenarios. The baseline forecast is the baseline scenario
calculated by the model assuming no change in Council’s existing demand
management approach. The four scenarios, determined by Council, test the impact of
implementing additional demand management measures.
The outcomes of the Water Demand Trend Tracking and Climate Correction Model are
used in the DSS model to forecast two main parameters:
Average annual demand: This is used to estimate the adequacy of the water
sources.

A408 Bellingen Shire Demand Management Plan Rev3 HydroScience Consulting October 2012 Page 12
Peak day demand: This is used to assess the required capacity of major system
assets such as treatment plants and service reservoirs.
The outcome of this model includes a series of graphs forecasting 30 year demand for
the various demand management scenarios and an estimation of the effectiveness of
the demand management initiatives.
The limitations of the model and the data available (e.g. uncertainty of growth rate
and potential errors in the historical data recorded) may have resulted in inaccurate
demand projections. This needs to be taken into consideration when analysing the
results of the model. The approach and methodology used to run this model are
detailed in the Demand Side Management Decision Support System – Simplified
(Version S1.1) Manual, July 2006, prepared by NSW Office of Water. A summary of the
methodology and data used in the model is provided in Appendix B.
3.4 Demand Forecast Based on Growth Projections
Council staff has advised that a shire wide population growth rate of 0.5% is should be
assumed for the purpose of the demand analyses. This growth rate has also been
applied for the calculation of demand management measures implementation costs.
The outcomes of these demand projection analyses are provided in the following
sections.
3.5 Dorrigo Water Supply Scheme
3.5.1 Scheme Overview
Dorrigo Water Supply Scheme (DWSS) serves the town of Dorrigo and the surrounding
rural residential, farming and commercial developments.
The DWSS sources water primarily from the Bielsdown River. However, when the River
flow is less than 20 ML/d at DNR Gauging Station 204017, Council is required to cease
extraction from the River. Instead, water is pumped from an on-stream storage on
Rocky Creek.
Raw water is transferred to the Dorrigo Bellingen Water Treatment Plan (WTP) which has
a capacity of 2.74 ML/d. Water undergoes pH correction, flocculation and sand
filtration processes before delivering to a clear water tank for storage. Treated water is
dosed with chlorine and lime before water is pumped to one of the two Dorrigo Town
reservoirs and gravitates to customers.
A historical water production analysis and a demand forecast analysis were
undertaken with the data provided as shown in Table 3
A408 Bellingen Shire Demand Management Plan Rev3 HydroScience Consulting October 2012 Page 13
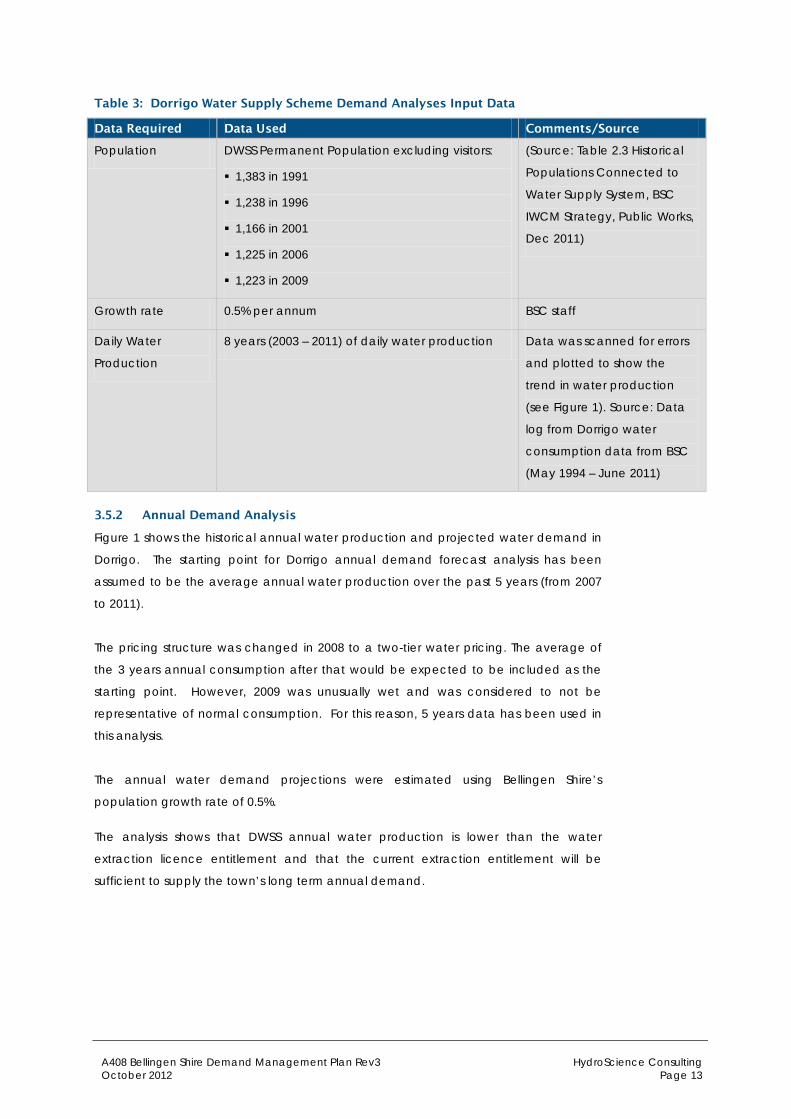
Table 3: Dorrigo Water Supply Scheme Demand Analyses Input Data
Data Required Data Used Comments/Source
Population DWSS Permanent Population excluding visitors:
1,383 in 1991
1,238 in 1996
1,166 in 2001
1,225 in 2006
1,223 in 2009
(Source: Table 2.3 Historical
Populations Connected to
Water Supply System, BSC
IWCM Strategy, Public Works,
Dec 2011)
Growth rate 0.5% per annum BSC staff
Daily Water
Production
8 years (2003 – 2011) of daily water production Data was scanned for errors
and plotted to show the
trend in water production
(see Figure 1). Source: Data
log from Dorrigo water
consumption data from BSC
(May 1994 – June 2011)
3.5.2 Annual Demand Analysis
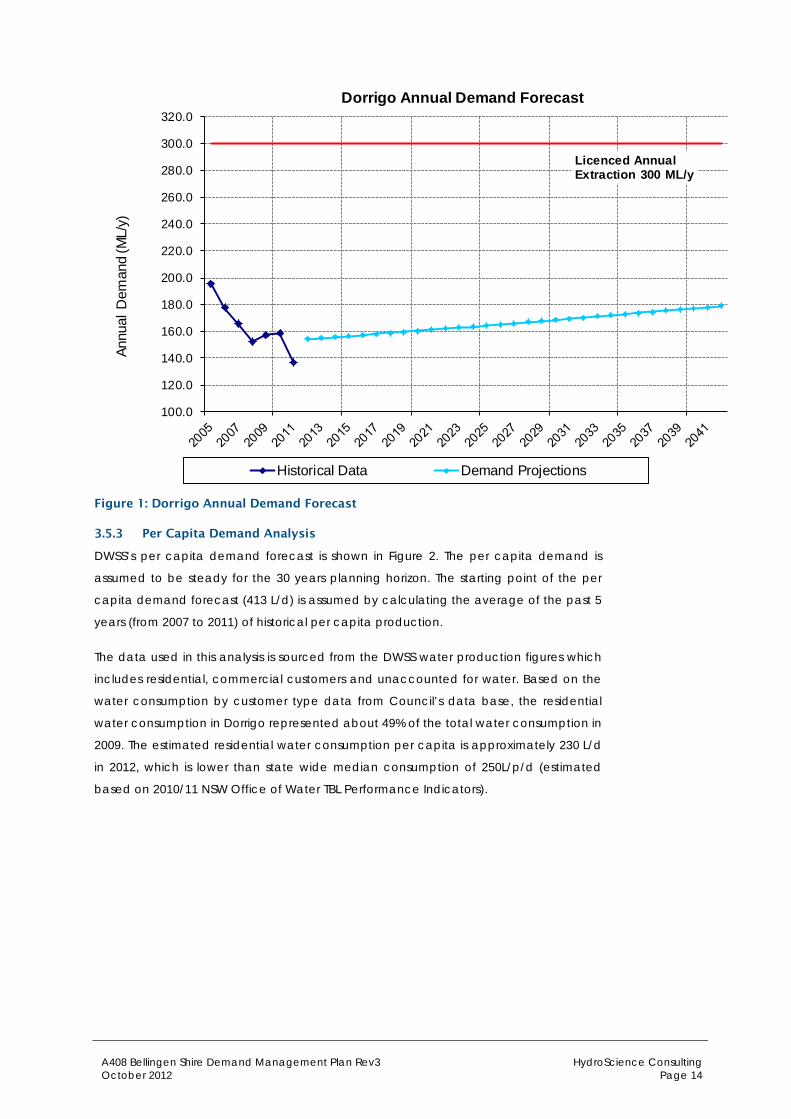
Figure 1 shows the historical annual water production and projected water demand in
Dorrigo. The starting point for Dorrigo annual demand forecast analysis has been
assumed to be the average annual water production over the past 5 years (from 2007
to 2011).
The pricing structure was changed in 2008 to a two-tier water pricing. The average of
the 3 years annual consumption after that would be expected to be included as the
starting point. However, 2009 was unusually wet and was considered to not be
representative of normal consumption. For this reason, 5 years data has been used in
this analysis.
The annual water demand projections were estimated using Bellingen Shire’s
population growth rate of 0.5%.
The analysis shows that DWSS annual water production is lower than the water
extraction licence entitlement and that the current extraction entitlement will be
sufficient to supply the town’s long term annual demand.
A408 Bellingen Shire Demand Management Plan Rev3 HydroScience Consulting October 2012 Page 14
Licenced Annual Extraction 300 ML/y
100.0
120.0
140.0
160.0
180.0
200.0
220.0
240.0
260.0
280.0
300.0
320.0An
nual
Dem
and
(ML/
y)Dorrigo Annual Demand Forecast
Historical Data Demand Projections
Figure 1: Dorrigo Annual Demand Forecast
3.5.3 Per Capita Demand Analysis
DWSS’s per capita demand forecast is shown in Figure 2. The per capita demand is
assumed to be steady for the 30 years planning horizon. The starting point of the per
capita demand forecast (413 L/d) is assumed by calculating the average of the past 5
years (from 2007 to 2011) of historical per capita production.
The data used in this analysis is sourced from the DWSS water production figures which
includes residential, commercial customers and unaccounted for water. Based on the
water consumption by customer type data from Council’s data base, the residential
water consumption in Dorrigo represented about 49% of the total water consumption in
2009. The estimated residential water consumption per capita is approximately 230 L/d
in 2012, which is lower than state wide median consumption of 250L/p/d (estimated
based on 2010/11 NSW Office of Water TBL Performance Indicators).

A408 Bellingen Shire Demand Management Plan Rev3 HydroScience Consulting October 2012 Page 15
200.0
250.0
300.0
350.0
400.0
450.0
500.0
550.0
600.0To
tal P
er C
apita
Wat
er D
eman
d (L
/d)
Dorrigo Per Capita Demand Analysis
Historical Demand Projections Actual Per capita demand (residential)
Figure 2: Dorrigo per Capita Demand Forecast
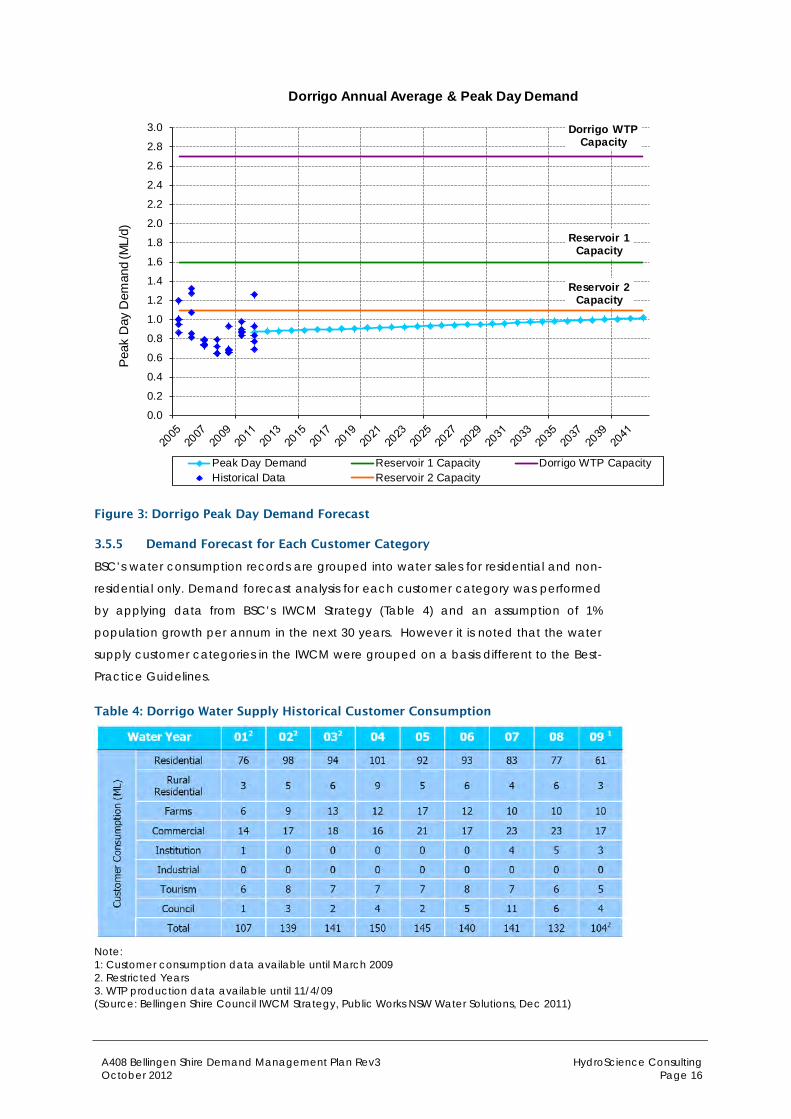
3.5.4 Peak Day Demand Analysis
An analysis of average daily demand has been undertaken to assess the adequacy of
DWSS’s infrastructure capacity to supply peak day demand (PDD) both current and in
30 years’ time. Dorrigo peak day demand has been calculated by applying the 99.5
percentile from the past 3 years daily production data as the starting point of the PDD
forecast.
The water access licence for Dorrigo water supply has no time or rate limits for such
extraction from the water source, there is therefore no restriction on DWSS’s headwork’s
peak day supply.
It is generally considered good practice that reservoirs have a capacity to supply no
less than 1 day of PDD. Dorrigo Town Reservoirs 1 and 2 capacities are 1.6 ML and 1.1
ML, respectively and the Dorrigo WTP’s capacity is 2.7 ML/d. These capacities are
above Dorrigo estimated long term PDD of approximately 1 ML/d.
The PDD analysis indicates that the current capacity of either one of the reservoirs and
of the WTP is sufficient to supply DWSS’s estimated peak day demand in 30 years as
shown in Figure 3.
A408 Bellingen Shire Demand Management Plan Rev3 HydroScience Consulting October 2012 Page 16
Reservoir 1 Capacity
Dorrigo WTP Capacity
Reservoir 2 Capacity
0.0
0.2
0.4
0.6
0.8
1.0
1.2
1.4
1.6
1.8
2.0
2.2
2.4
2.6
2.8
3.0P
eak
Day
Dem
and
(ML/
d)
Dorrigo Annual Average & Peak Day Demand
Peak Day Demand Reservoir 1 Capacity Dorrigo WTP CapacityHistorical Data Reservoir 2 Capacity
Figure 3: Dorrigo Peak Day Demand Forecast
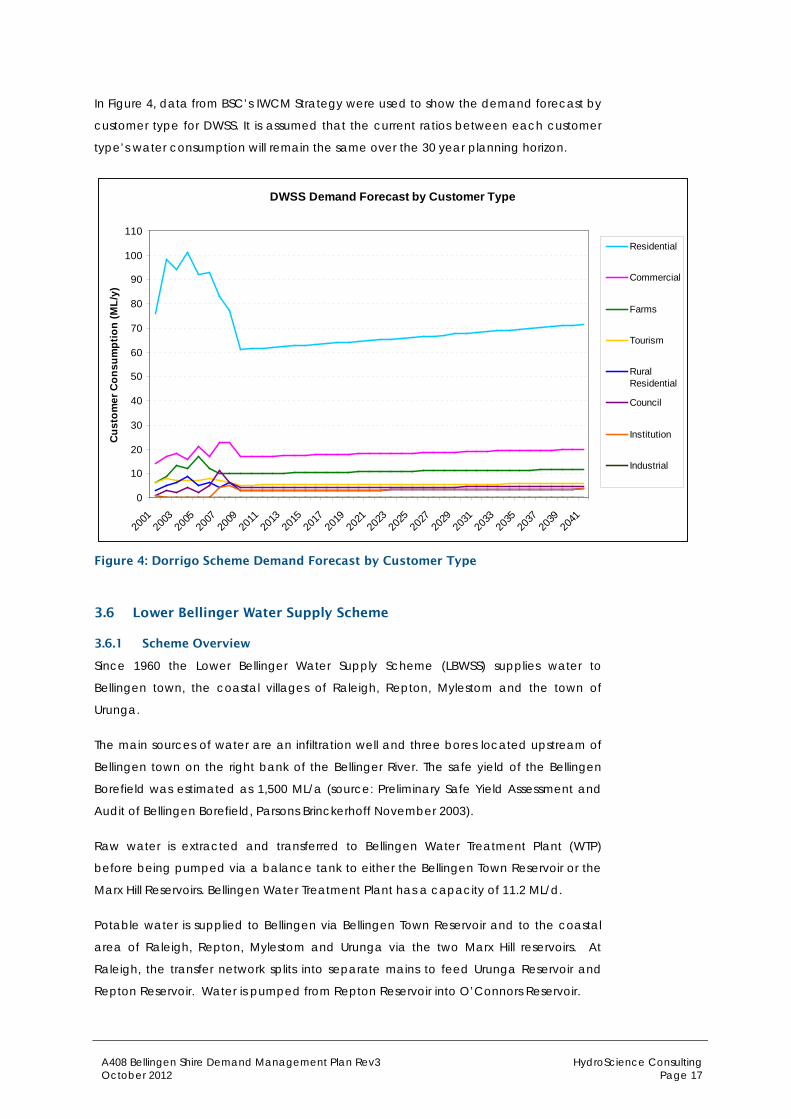
3.5.5 Demand Forecast for Each Customer Category
BSC’s water consumption records are grouped into water sales for residential and non-
residential only. Demand forecast analysis for each customer category was performed
by applying data from BSC’s IWCM Strategy (Table 4) and an assumption of 1%
population growth per annum in the next 30 years. However it is noted that the water
supply customer categories in the IWCM were grouped on a basis different to the Best-
Practice Guidelines.
Table 4: Dorrigo Water Supply Historical Customer Consumption
Note: 1: Customer consumption data available until March 2009 2. Restricted Years 3. WTP production data available until 11/4/09 (Source: Bellingen Shire Council IWCM Strategy, Public Works NSW Water Solutions, Dec 2011)
A408 Bellingen Shire Demand Management Plan Rev3 HydroScience Consulting October 2012 Page 17
In Figure 4, data from BSC’s IWCM Strategy were used to show the demand forecast by
customer type for DWSS. It is assumed that the current ratios between each customer
type’s water consumption will remain the same over the 30 year planning horizon.
DWSS Demand Forecast by Customer Type
0
10
20
30
40
50
60
70
80
90
100
110
2001
2003
2005
2007
2009
2011
2013
2015
2017
2019
2021
2023
2025
2027
2029
2031
2033
2035
2037
2039
2041
Cus
tom
er C
onsu
mpt
ion
(ML/
y)
Residential
Commercial
Farms
Tourism
RuralResidential
Council
Institution
Industrial
Figure 4: Dorrigo Scheme Demand Forecast by Customer Type
3.6 Lower Bellinger Water Supply Scheme
3.6.1 Scheme Overview
Since 1960 the Lower Bellinger Water Supply Scheme (LBWSS) supplies water to
Bellingen town, the coastal villages of Raleigh, Repton, Mylestom and the town of
Urunga.
The main sources of water are an infiltration well and three bores located upstream of
Bellingen town on the right bank of the Bellinger River. The safe yield of the Bellingen
Borefield was estimated as 1,500 ML/a (source: Preliminary Safe Yield Assessment and
Audit of Bellingen Borefield, Parsons Brinckerhoff November 2003).
Raw water is extracted and transferred to Bellingen Water Treatment Plant (WTP)
before being pumped via a balance tank to either the Bellingen Town Reservoir or the
Marx Hill Reservoirs. Bellingen Water Treatment Plant has a capacity of 11.2 ML/d.
Potable water is supplied to Bellingen via Bellingen Town Reservoir and to the coastal
area of Raleigh, Repton, Mylestom and Urunga via the two Marx Hill reservoirs. At
Raleigh, the transfer network splits into separate mains to feed Urunga Reservoir and
Repton Reservoir. Water is pumped from Repton Reservoir into O’Connors Reservoir.
A408 Bellingen Shire Demand Management Plan Rev3 HydroScience Consulting October 2012 Page 18
For the purpose of this demand management plan, the combined daily production
records from Marx Hill and Bellingen Town reservoirs were considered as daily
production data for the LBWSS.
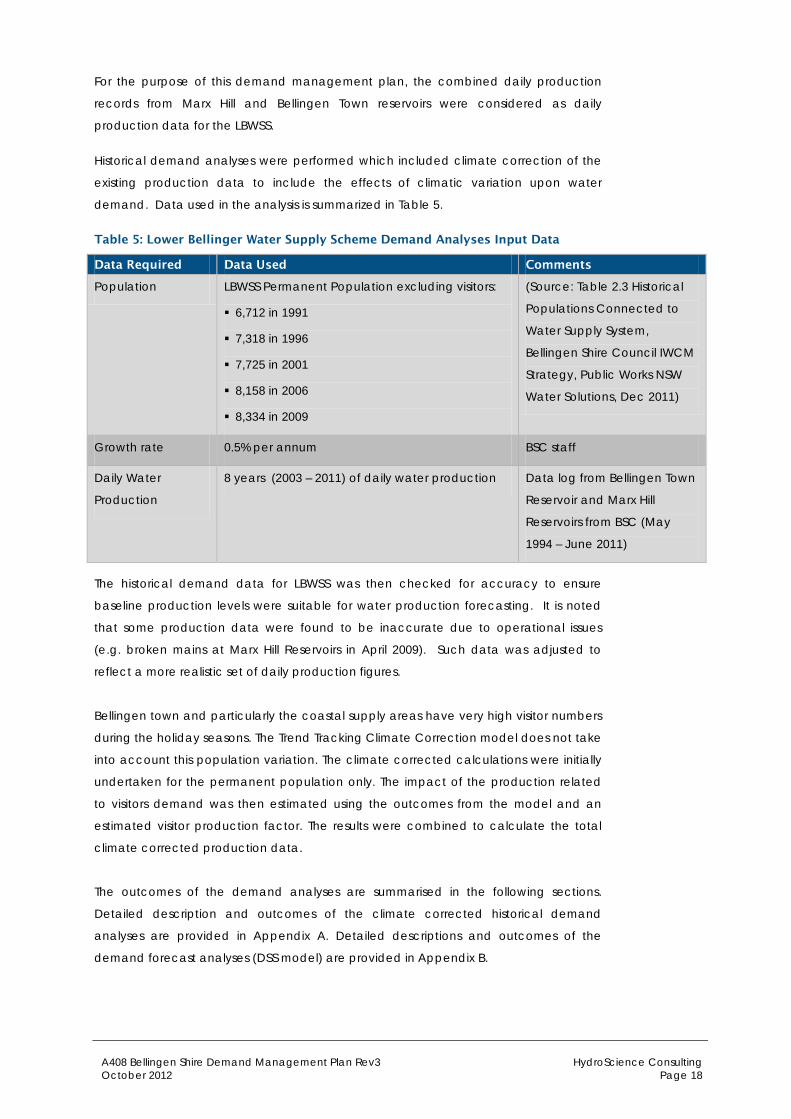
Historical demand analyses were performed which included climate correction of the
existing production data to include the effects of climatic variation upon water
demand. Data used in the analysis is summarized in Table 5.
Table 5: Lower Bellinger Water Supply Scheme Demand Analyses Input Data
Data Required Data Used Comments
Population LBWSS Permanent Population excluding visitors:
6,712 in 1991
7,318 in 1996
7,725 in 2001
8,158 in 2006
8,334 in 2009
(Source: Table 2.3 Historical
Populations Connected to
Water Supply System,
Bellingen Shire Council IWCM
Strategy, Public Works NSW
Water Solutions, Dec 2011)
Growth rate 0.5% per annum BSC staff
Daily Water
Production
8 years (2003 – 2011) of daily water production Data log from Bellingen Town
Reservoir and Marx Hill
Reservoirs from BSC (May
1994 – June 2011)
The historical demand data for LBWSS was then checked for accuracy to ensure
baseline production levels were suitable for water production forecasting. It is noted
that some production data were found to be inaccurate due to operational issues
(e.g. broken mains at Marx Hill Reservoirs in April 2009). Such data was adjusted to
reflect a more realistic set of daily production figures.
Bellingen town and particularly the coastal supply areas have very high visitor numbers
during the holiday seasons. The Trend Tracking Climate Correction model does not take
into account this population variation. The climate corrected calculations were initially
undertaken for the permanent population only. The impact of the production related
to visitors demand was then estimated using the outcomes from the model and an
estimated visitor production factor. The results were combined to calculate the total
climate corrected production data.
The outcomes of the demand analyses are summarised in the following sections.
Detailed description and outcomes of the climate corrected historical demand
analyses are provided in Appendix A. Detailed descriptions and outcomes of the
demand forecast analyses (DSS model) are provided in Appendix B.

A408 Bellingen Shire Demand Management Plan Rev3 HydroScience Consulting October 2012 Page 19
3.6.2 Annual Demand Analysis
Bellingen Shire is licensed to extract 1,613 ML per annum for the LBWSS. The starting
point for LBWSS annual demand forecast analysis was the average annual water
production over the past 5 years (from 2007 to 2012).
The pricing structure was changed in 2008 to a two-tier water pricing. The average of
the 3 years annual consumption after that would be expected to be included as the
starting point. However, 2009 was unusually wet and was considered to not be
representative of normal consumption. For this reason, 5 years data has been used in
this analysis.
The annual water demand projections were estimated using Bellingen Shire’s
population growth rate of 0.5%.
Figure 5 shows the LBWSS historical and projected annual water demand. This analysis
shows that the annual water production is lower than the water extraction licence
entitlement and that the current extraction entitlement will be sufficient to supply the
Lower Bellinger water supply area’s long term annual demand.
Licensed Extraction 1613ML/y
900
1000
1100
1200
1300
1400
1500
1600
Annu
al A
vera
ge D
eman
d (M
L/ye
ar)
Lower Bellinger Water Supply Scheme Annual Demand
LicensedExtraction
Historical
Climate Corrected
Baseline Forecast
Figure 5: LBWSS Annual Demand Baseline Forecast
A408 Bellingen Shire Demand Management Plan Rev3 HydroScience Consulting October 2012 Page 20
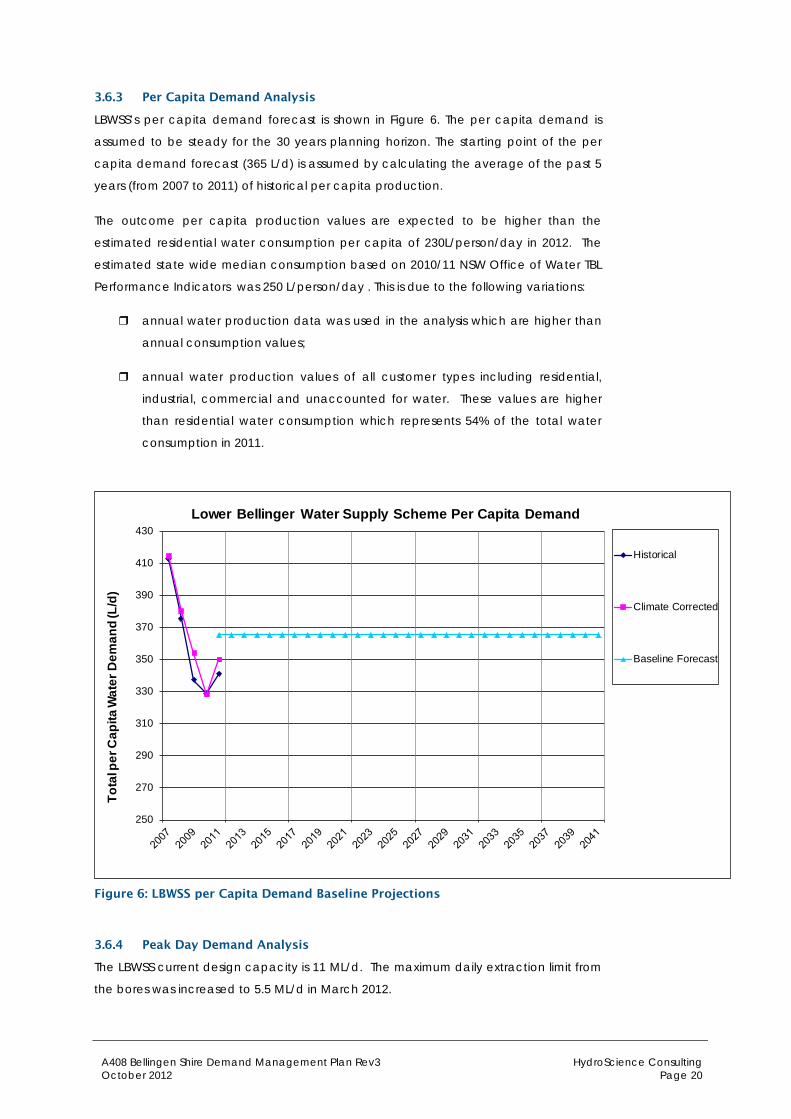
3.6.3 Per Capita Demand Analysis
LBWSS’s per capita demand forecast is shown in Figure 6. The per capita demand is
assumed to be steady for the 30 years planning horizon. The starting point of the per
capita demand forecast (365 L/d) is assumed by calculating the average of the past 5
years (from 2007 to 2011) of historical per capita production.
The outcome per capita production values are expected to be higher than the
estimated residential water consumption per capita of 230L/person/day in 2012. The
estimated state wide median consumption based on 2010/11 NSW Office of Water TBL
Performance Indicators was 250 L/person/day . This is due to the following variations:
annual water production data was used in the analysis which are higher than
annual consumption values;
annual water production values of all customer types including residential,
industrial, commercial and unaccounted for water. These values are higher
than residential water consumption which represents 54% of the total water
consumption in 2011.
250
270
290
310
330
350
370
390
410
430
Tota
l per
Cap
ita W
ater
Dem
and
(L/d
)
Lower Bellinger Water Supply Scheme Per Capita Demand
Historical
Climate Corrected
Baseline Forecast
Figure 6: LBWSS per Capita Demand Baseline Projections
3.6.4 Peak Day Demand Analysis
The LBWSS current design capacity is 11 ML/d. The maximum daily extraction limit from
the bores was increased to 5.5 ML/d in March 2012.
A408 Bellingen Shire Demand Management Plan Rev3 HydroScience Consulting October 2012 Page 21
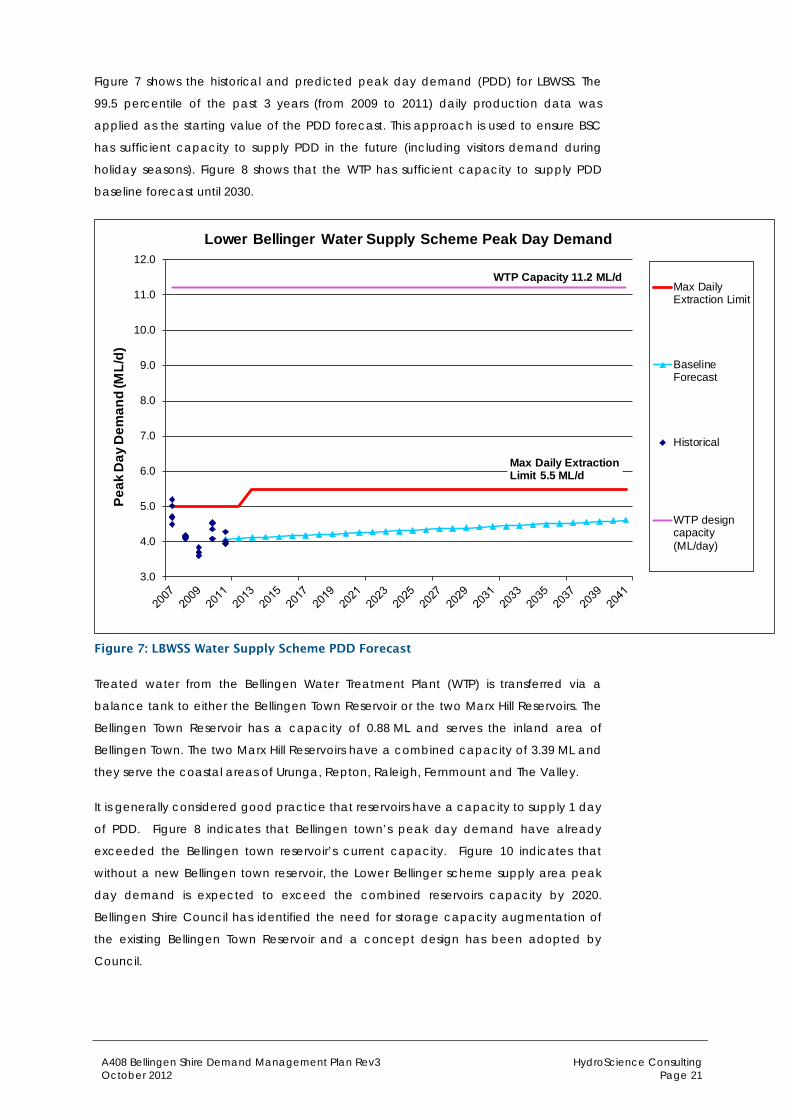
Figure 7 shows the historical and predicted peak day demand (PDD) for LBWSS. The
99.5 percentile of the past 3 years (from 2009 to 2011) daily production data was
applied as the starting value of the PDD forecast. This approach is used to ensure BSC
has sufficient capacity to supply PDD in the future (including visitors demand during
holiday seasons). Figure 8 shows that the WTP has sufficient capacity to supply PDD
baseline forecast until 2030.
Max Daily Extraction Limit 5.5 ML/d
WTP Capacity 11.2 ML/d
3.0
4.0
5.0
6.0
7.0
8.0
9.0
10.0
11.0
12.0
Peak
Day
Dem
and
(ML/
d)
Lower Bellinger Water Supply Scheme Peak Day Demand
Max DailyExtraction Limit
BaselineForecast
Historical
WTP designcapacity(ML/day)
Figure 7: LBWSS Water Supply Scheme PDD Forecast
Treated water from the Bellingen Water Treatment Plant (WTP) is transferred via a
balance tank to either the Bellingen Town Reservoir or the two Marx Hill Reservoirs. The
Bellingen Town Reservoir has a capacity of 0.88 ML and serves the inland area of
Bellingen Town. The two Marx Hill Reservoirs have a combined capacity of 3.39 ML and
they serve the coastal areas of Urunga, Repton, Raleigh, Fernmount and The Valley.
It is generally considered good practice that reservoirs have a capacity to supply 1 day
of PDD. Figure 8 indicates that Bellingen town’s peak day demand have already
exceeded the Bellingen town reservoir’s current capacity. Figure 10 indicates that
without a new Bellingen town reservoir, the Lower Bellinger scheme supply area peak
day demand is expected to exceed the combined reservoirs capacity by 2020.
Bellingen Shire Council has identified the need for storage capacity augmentation of
the existing Bellingen Town Reservoir and a concept design has been adopted by
Council.

A408 Bellingen Shire Demand Management Plan Rev3 HydroScience Consulting October 2012 Page 22
0.0
0.5
1.0
1.5
2.0
2.5Pe
ak D
ay D
eman
d (M
L/d)
LBWSS Peak Day Demand (Bellingen Town Reservoir)
Bellingen TownProposed NewReservoir Capacity
Annual PDDBellingen
Bellingen TownReservoir Capacity
Bellingen Town Proposed New Reservoir Capacity, 2 ML
Bellingen Town Reservoir Current Capacity, 0.88 ML
Figure 8: Bellingen Town Reservoir Capacity & Peak Day Demand
1.5
2.0
2.5
3.0
3.5
4.0
Peak
Day
Dem
and
(ML/
d)
LBWSS Peak Day Demand (Marx Hill Reservoirs)
Marx Hill ReservoirsCapacity
Annual PDD MarxHill
Marx Hill Reservoirs Capacity, 3.39 ML
Figure 9: Marx Hill Reservoirs Capacity & Peak Day Demand
A408 Bellingen Shire Demand Management Plan Rev3 HydroScience Consulting October 2012 Page 23
3.0
3.5
4.0
4.5
5.0
5.5
6.0Pe
ak D
ay D
eman
d (M
L/d)
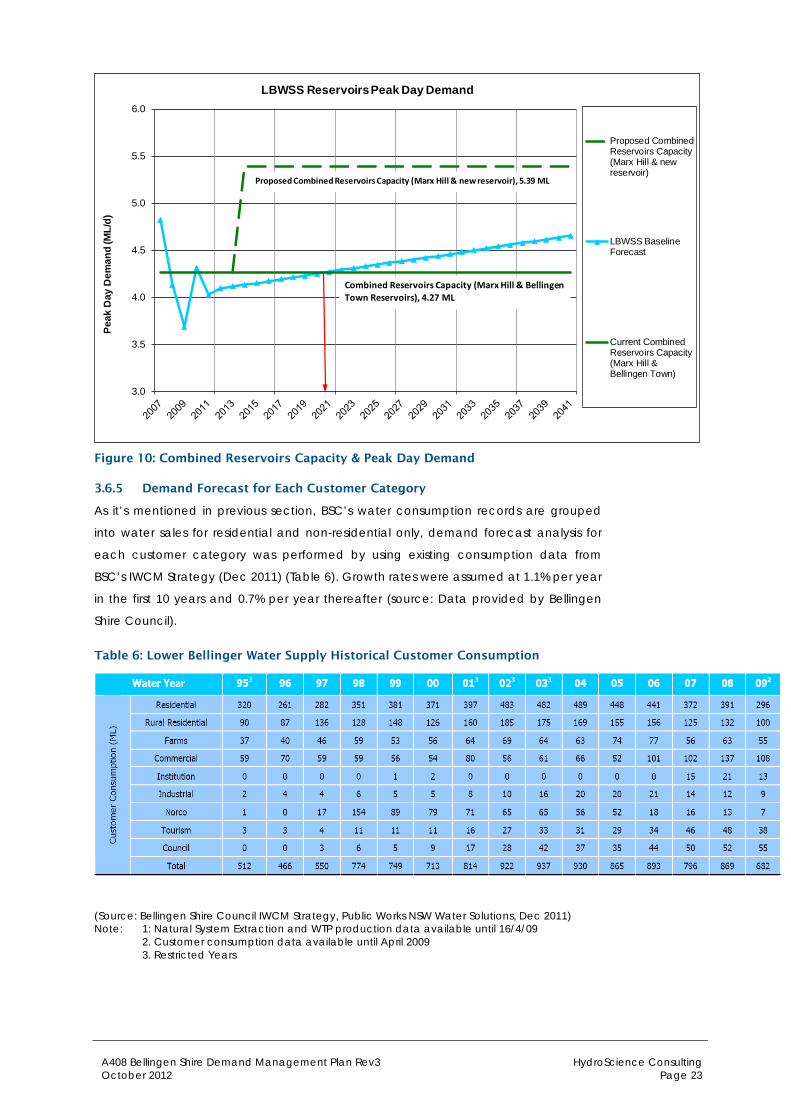
LBWSS Reservoirs Peak Day Demand
Proposed CombinedReservoirs Capacity(Marx Hill & newreservoir)
LBWSS BaselineForecast
Current CombinedReservoirs Capacity(Marx Hill &Bellingen Town)
Combined Reservoirs Capacity (Marx Hill & Bellingen Town Reservoirs), 4.27 ML
Proposed Combined Reservoirs Capacity (Marx Hill & new reservoir), 5.39 ML
Figure 10: Combined Reservoirs Capacity & Peak Day Demand
3.6.5 Demand Forecast for Each Customer Category
As it’s mentioned in previous section, BSC’s water consumption records are grouped
into water sales for residential and non-residential only, demand forecast analysis for
each customer category was performed by using existing consumption data from
BSC’s IWCM Strategy (Dec 2011) (Table 6). Growth rates were assumed at 1.1% per year
in the first 10 years and 0.7% per year thereafter (source: Data provided by Bellingen
Shire Council).
Table 6: Lower Bellinger Water Supply Historical Customer Consumption
(Source: Bellingen Shire Council IWCM Strategy, Public Works NSW Water Solutions, Dec 2011) Note: 1: Natural System Extraction and WTP production data available until 16/4/09
2. Customer consumption data available until April 2009 3. Restricted Years

A408 Bellingen Shire Demand Management Plan Rev3 HydroScience Consulting October 2012 Page 24
In the analyses of demand forecast by customer type for LBWSS as shown in Figure 11, it
is assumed that the current ratios between each customer type’s water consumption
will remain the same over the 30 year planning horizon.
LBWSS Demand Forecast by Customer Type
0
50
100
150
200
250
300
350
400
450
500
1995
1998
2001
2004
2007
2010
2013
2016
2019
2022
2025
2028
2031
2034
2037
2040
Cus
tom
er C
onsu
mpt
ion
(ML/
y)
Residential
Commercial
Farms
Tourism
RuralResidential
Council
Institution
Industrial
Figure 11: Lower Bellinger Scheme Demand Forecast by Customer Type

A408 Bellingen Shire Demand Management Plan Rev3 HydroScience Consulting October 2012 Page 25
4 Demand Management Planning
4.1 Water Demand Management Drivers
The main drivers for implementing demand management in Bellingen Shire considered
in this study are:
To ensure safe and secure potable water supply in Bellingen Shire;
To project water demand from Bellingen Shire Council water schemes in order
to determine if water demand management actions will be required;
To satisfy the Best-Practice Management of Water Supply and Sewerage
requirement to promote sustainable water conservation practices and water
demand management by developing a compliant water conservation
demand management plan;
To reduce capital works (new reservoirs and sewerage treatment plant) costs.
Other reasons for demand management in BSC were also considered in this study.
These are discussed in the following sections.
4.1.1 Impact of Climate Change
Based on the “Climate Change in the Northern River Catchment” Report prepared by
CSIRO in 2007, the projected changes from 2007 to 2030 and 2070 are summarised in
Table 7.
Table 7: Climate Change in the Northern River Catchment
Projected Climate Change 2030 2070
Average Temperature 0.2 to 1.8ºC 0.7 to 5.6ºC
Annual Average Rainfall ±7% ±20%
Extreme Rainfall -10 to +5% 5 to 10%
Evaporation 1 to 13% 4 to 40%
(Source: Climate Change in the Northern River Catchment, CSIRO 2007) The report also stated that “changes in rainfall and higher evaporation rates are likely
to lead to less water for streams and rivers in the Northern Rivers Catchment, which will
have downstream consequences for storages and place strains on the catchment’s
water resources. However, given increases in extreme rainfall events that periodically
deliver large volumes to storages, the effects of long term reductions in average rainfall
on storages may be moderate.”
A408 Bellingen Shire Demand Management Plan Rev3 HydroScience Consulting October 2012 Page 26
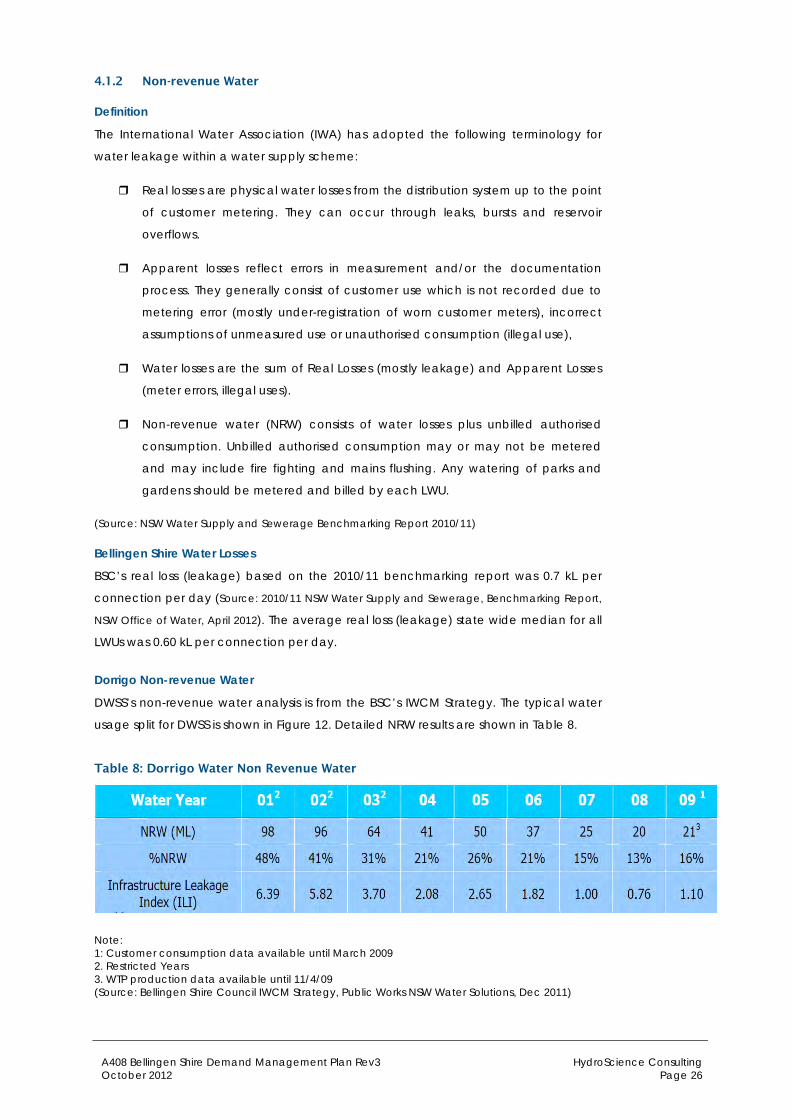
4.1.2 Non-revenue Water
Definition
The International Water Association (IWA) has adopted the following terminology for
water leakage within a water supply scheme:
Real losses are physical water losses from the distribution system up to the point
of customer metering. They can occur through leaks, bursts and reservoir
overflows.
Apparent losses reflect errors in measurement and/or the documentation
process. They generally consist of customer use which is not recorded due to
metering error (mostly under-registration of worn customer meters), incorrect
assumptions of unmeasured use or unauthorised consumption (illegal use),
Water losses are the sum of Real Losses (mostly leakage) and Apparent Losses
(meter errors, illegal uses).
Non-revenue water (NRW) consists of water losses plus unbilled authorised
consumption. Unbilled authorised consumption may or may not be metered
and may include fire fighting and mains flushing. Any watering of parks and
gardens should be metered and billed by each LWU.
(Source: NSW Water Supply and Sewerage Benchmarking Report 2010/11)
Bellingen Shire Water Losses
BSC’s real loss (leakage) based on the 2010/11 benchmarking report was 0.7 kL per
connection per day (Source: 2010/11 NSW Water Supply and Sewerage, Benchmarking Report,
NSW Office of Water, April 2012). The average real loss (leakage) state wide median for all
LWUs was 0.60 kL per connection per day.
Dorrigo Non-revenue Water
DWSS’s non-revenue water analysis is from the BSC’s IWCM Strategy. The typical water
usage split for DWSS is shown in Figure 12. Detailed NRW results are shown in Table 8.
Table 8: Dorrigo Water Non Revenue Water
Note: 1: Customer consumption data available until March 2009 2. Restricted Years 3. WTP production data available until 11/4/09 (Source: Bellingen Shire Council IWCM Strategy, Public Works NSW Water Solutions, Dec 2011)
A408 Bellingen Shire Demand Management Plan Rev3 HydroScience Consulting October 2012 Page 27
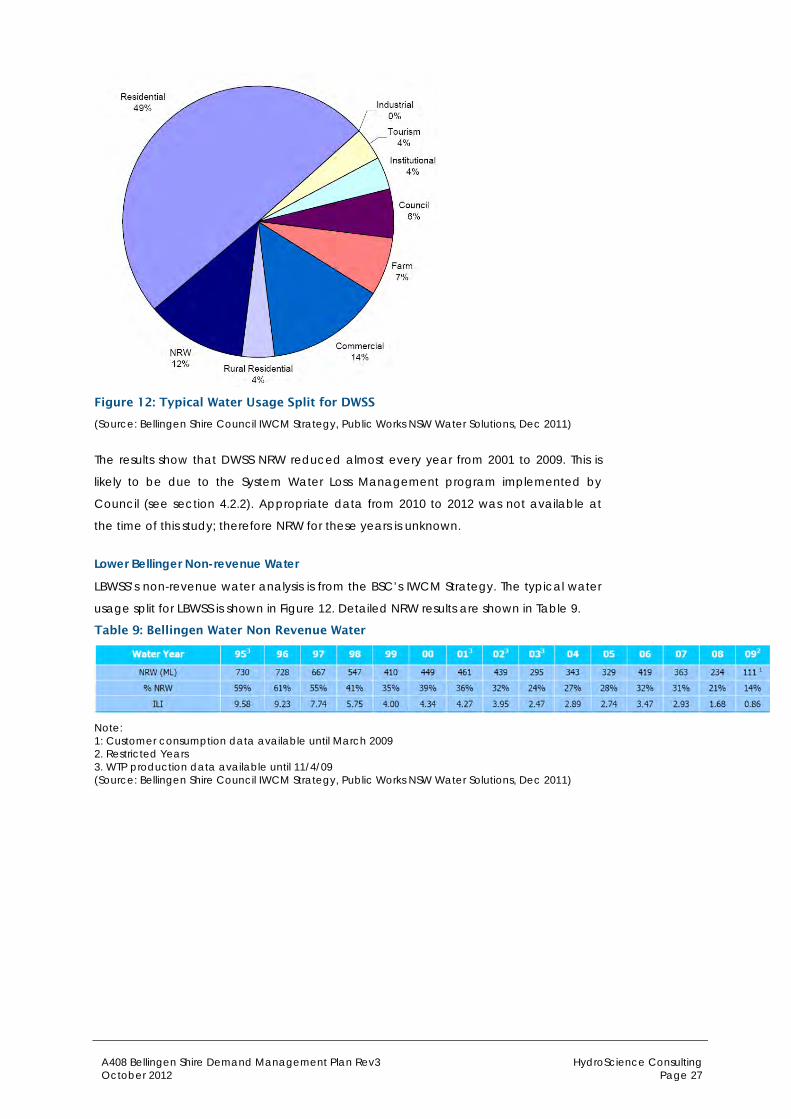
Figure 12: Typical Water Usage Split for DWSS
(Source: Bellingen Shire Council IWCM Strategy, Public Works NSW Water Solutions, Dec 2011)
The results show that DWSS NRW reduced almost every year from 2001 to 2009. This is
likely to be due to the System Water Loss Management program implemented by
Council (see section 4.2.2). Appropriate data from 2010 to 2012 was not available at
the time of this study; therefore NRW for these years is unknown.
Lower Bellinger Non-revenue Water
LBWSS’s non-revenue water analysis is from the BSC’s IWCM Strategy. The typical water
usage split for LBWSS is shown in Figure 12. Detailed NRW results are shown in Table 9.
Table 9: Bellingen Water Non Revenue Water
Note: 1: Customer consumption data available until March 2009 2. Restricted Years 3. WTP production data available until 11/4/09 (Source: Bellingen Shire Council IWCM Strategy, Public Works NSW Water Solutions, Dec 2011)
A408 Bellingen Shire Demand Management Plan Rev3 HydroScience Consulting October 2012 Page 28
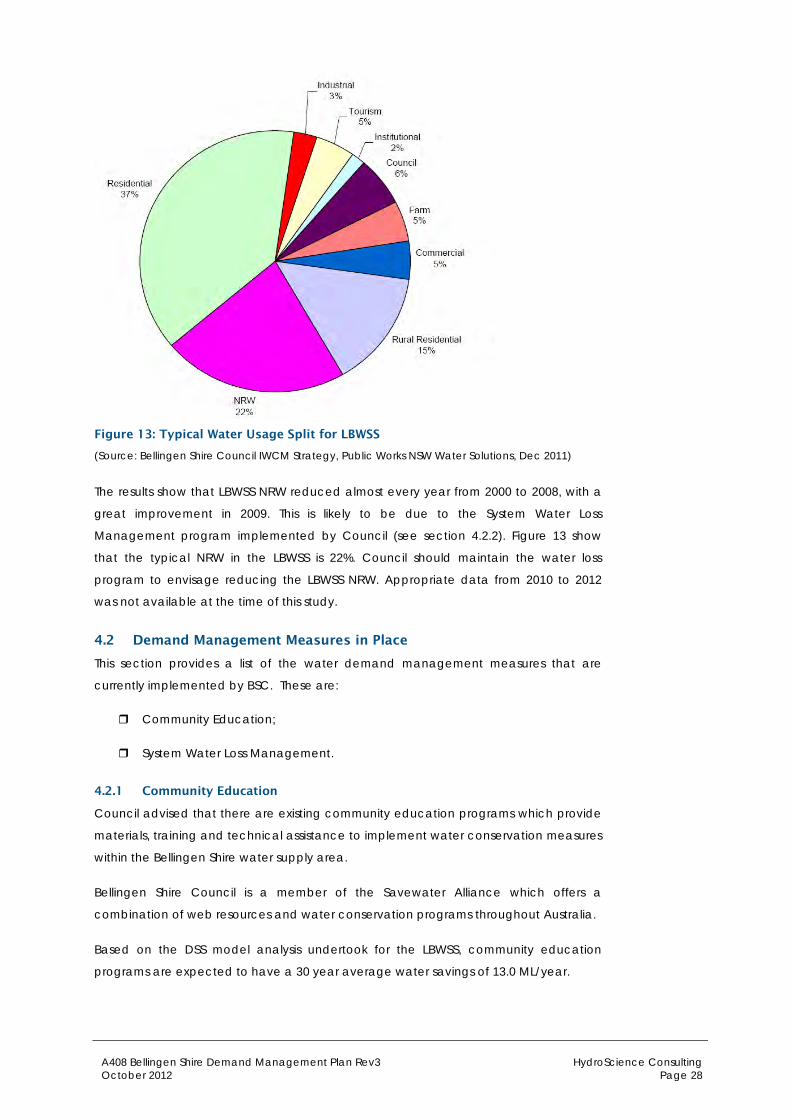
Figure 13: Typical Water Usage Split for LBWSS
(Source: Bellingen Shire Council IWCM Strategy, Public Works NSW Water Solutions, Dec 2011)
The results show that LBWSS NRW reduced almost every year from 2000 to 2008, with a
great improvement in 2009. This is likely to be due to the System Water Loss
Management program implemented by Council (see section 4.2.2). Figure 13 show
that the typical NRW in the LBWSS is 22%. Council should maintain the water loss
program to envisage reducing the LBWSS NRW. Appropriate data from 2010 to 2012
was not available at the time of this study.
4.2 Demand Management Measures in Place
This section provides a list of the water demand management measures that are
currently implemented by BSC. These are:
Community Education;
System Water Loss Management.
4.2.1 Community Education
Council advised that there are existing community education programs which provide
materials, training and technical assistance to implement water conservation measures
within the Bellingen Shire water supply area.
Bellingen Shire Council is a member of the Savewater Alliance which offers a
combination of web resources and water conservation programs throughout Australia.
Based on the DSS model analysis undertook for the LBWSS, community education
programs are expected to have a 30 year average water savings of 13.0 ML/year.

A408 Bellingen Shire Demand Management Plan Rev3 HydroScience Consulting October 2012 Page 29
4.2.2 System Water Loss Management
In May 2006, a project was carried out to evaluate the existing conditions of the
Bellingen Shire water distribution scheme. Water distribution losses and efficiency issues
were assessed and a Strategic Water Demand Management Program was developed.
The comprehensive water loss management project involves:
Leak detection and repairs;
Sectorisation of the system to create district metered areas or zones;
Pressure reduction in some of the high pressure areas.
The project implementation work was delayed significantly due to major floods in the
area in 2009 (source: Water Loss Management Program - Project and Investigation
Locations [updated 6 April 2010], Local Government and Shires Associations of NSW
website).
Council has advised that the implementation of the System Loss Management Plan
was completed in May 2011 and that the water savings from implementing the
program is 47 ML per year. The DSS model estimates water savings of 6 ML per annum
from implementing the system water loss management measure (source: Water Loss
Management Program – Project completion details, BSC May, 2012).
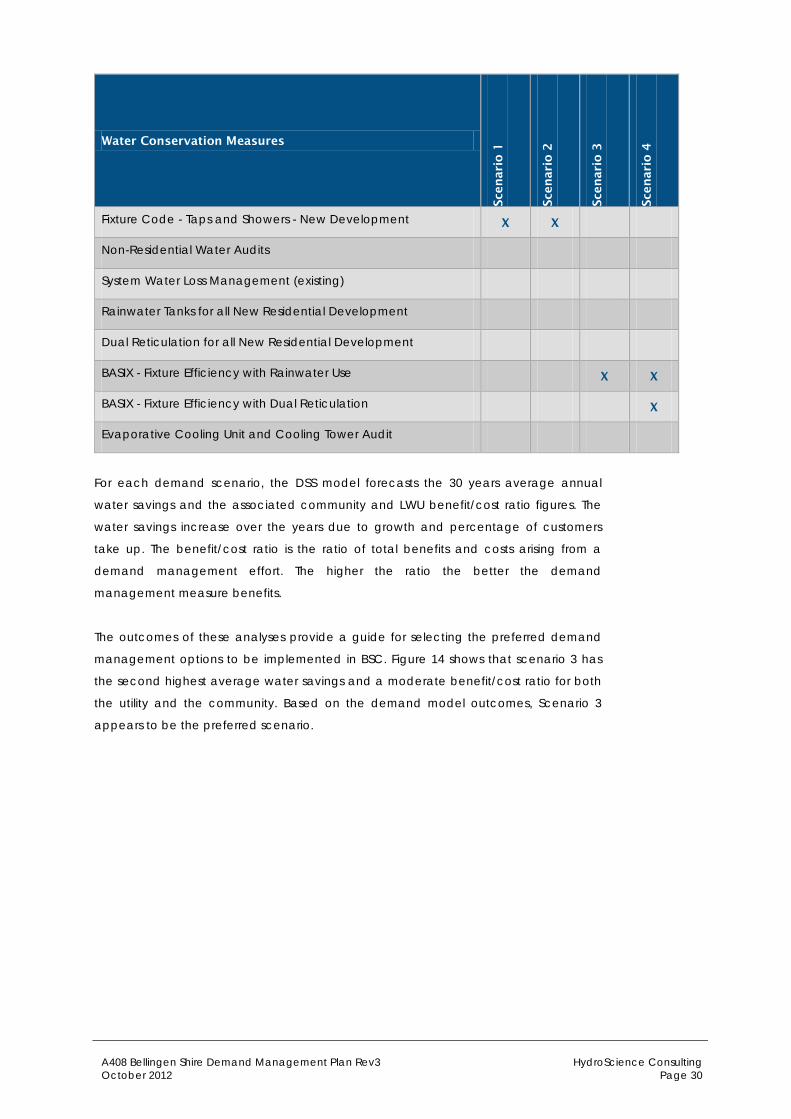
4.3 Demand Management Scenarios
Four demand management scenarios were developed with assistance from Bellingen
Shire Council and they are summarised in Table 10. The DSS model evaluates the
benefit-cost and water savings of implementing the scenarios. Detailed description
and outcomes from the DSS model for each scenario and individual water
conservation measure are provided in Appendix B.
Table 10: Water Demand Management Scenarios
Water Conservation Measures
Sce
nari
o 1
Sce
nari
o 2
Sce
nari
o 3
Sce
nari
o 4
National Mandatory Water Efficiency Labelling Scheme (WELS) X X X X
Community Education (existing)
Residential Shower Retrofit X X X X
Residential Washing Machine Rebate X X
Permanent Low Level Restrictions on Water Use
Conservation Pricing for Residential Users X X X
A408 Bellingen Shire Demand Management Plan Rev3 HydroScience Consulting October 2012 Page 30
Water Conservation Measures
Sce
nari
o 1
Sce
nari
o 2
Sce
nari
o 3
Sce
nari
o 4
Fixture Code - Taps and Showers - New Development X X
Non-Residential Water Audits
System Water Loss Management (existing)
Rainwater Tanks for all New Residential Development
Dual Reticulation for all New Residential Development
BASIX - Fixture Efficiency with Rainwater Use X X
BASIX - Fixture Efficiency with Dual Reticulation X
Evaporative Cooling Unit and Cooling Tower Audit
For each demand scenario, the DSS model forecasts the 30 years average annual
water savings and the associated community and LWU benefit/cost ratio figures. The
water savings increase over the years due to growth and percentage of customers
take up. The benefit/cost ratio is the ratio of total benefits and costs arising from a
demand management effort. The higher the ratio the better the demand
management measure benefits.
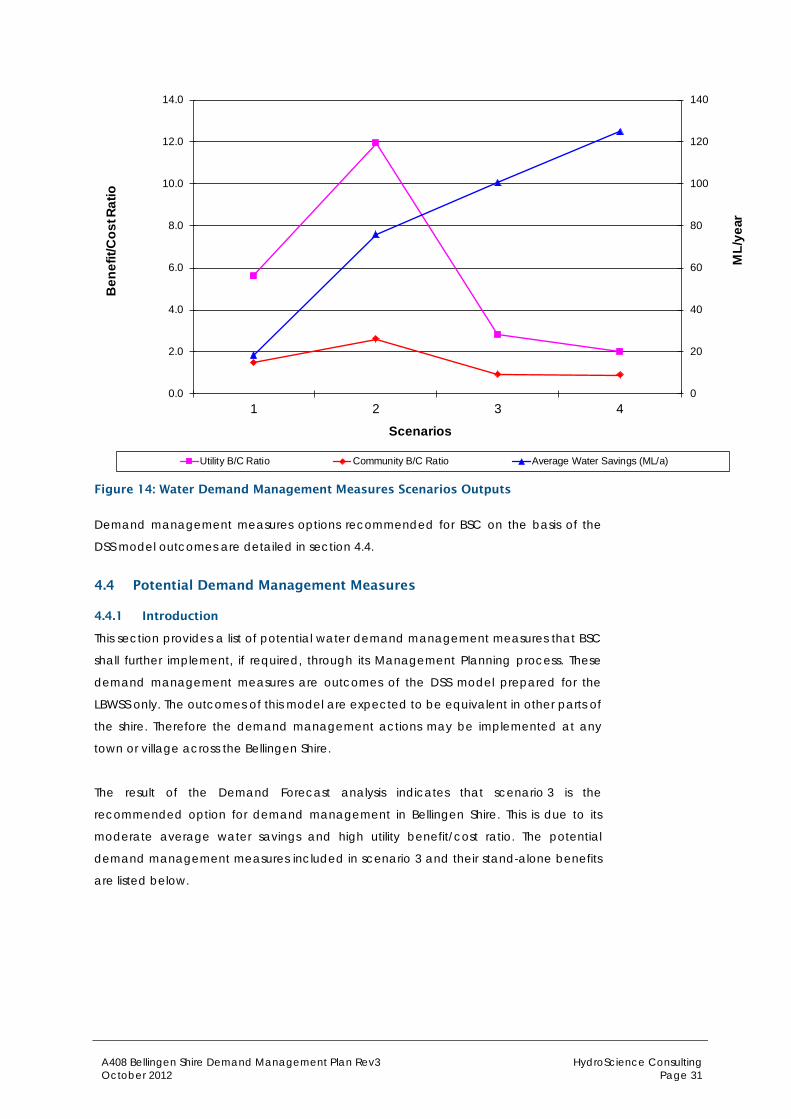
The outcomes of these analyses provide a guide for selecting the preferred demand
management options to be implemented in BSC. Figure 14 shows that scenario 3 has
the second highest average water savings and a moderate benefit/cost ratio for both
the utility and the community. Based on the demand model outcomes, Scenario 3
appears to be the preferred scenario.
A408 Bellingen Shire Demand Management Plan Rev3 HydroScience Consulting October 2012 Page 31
0
20
40
60
80
100
120
140
0.0
2.0
4.0
6.0
8.0
10.0
12.0
14.0
1 2 3 4
ML/
year
Ben
efit/
Cos
t Rat
io
Scenarios
Utility B/C Ratio Community B/C Ratio Average Water Savings (ML/a)
Figure 14: Water Demand Management Measures Scenarios Outputs
Demand management measures options recommended for BSC on the basis of the
DSS model outcomes are detailed in section 4.4.
4.4 Potential Demand Management Measures
4.4.1 Introduction
This section provides a list of potential water demand management measures that BSC
shall further implement, if required, through its Management Planning process. These
demand management measures are outcomes of the DSS model prepared for the
LBWSS only. The outcomes of this model are expected to be equivalent in other parts of
the shire. Therefore the demand management actions may be implemented at any
town or village across the Bellingen Shire.
The result of the Demand Forecast analysis indicates that scenario 3 is the
recommended option for demand management in Bellingen Shire. This is due to its
moderate average water savings and high utility benefit/cost ratio. The potential
demand management measures included in scenario 3 and their stand-alone benefits
are listed below.
A408 Bellingen Shire Demand Management Plan Rev3 HydroScience Consulting October 2012 Page 32
The following demand management measures are provided in priority order of utility
benefit/cost ratio for Council’s consideration. The following sections show the water
saving and utility and community savings from implementing these demand
management measures based on Council’s current usage charge and operational
costs. Appendix B provides details about the demand management measures
definition and assumptions used in the DSS model. The assumptions used to calculate
the benefits of the following water demand management measures are provided in
Table 20 in Appendix B.
4.4.2 Conservation Pricing for Residential Users
DSS model outcomes:
Utility B/C ratio: 120.1
Community B/C ratio: 120.2
30 year Average Water Savings: 57.4 ML/year
Conservation Pricing for Residential Users is an efficient demand measure for Lower
Bellinger supply scheme. It has the highest utility and community benefit/cost ratio and
highest average water savings.
The estimated 30 year average water savings is 57.4 ML/year. Based on the current first
tier water usage charge of $1.60/kL, the average annual savings for the BSC customers
is $91,808. The current Council’s potable water production operational costs is 1.10 $/kL
therefore the average annual savings for the utility is $63,118 (it does not include
savings from reduced sewerage operations).
Comments:
Based on the definitions of conservation pricing for residential users, the inclining block
tariff is applied to single family residential customers and the increase would result in an
effective 50% increase in price for residential external use and no change in price for
internal use.
Council advised that there was a change in water supply pricing structure in 2008. Two
tier water pricing was applied from 2008/09 onwards. In 2012/13, residential water
usage is charged on the basis of on an inclining block tariff. The consumption above
365 kL per year is charged at $2.52, i.e. one and a half times the standard rate of $1.68.
Current water usage is billed in the periods in May, August, November and February
each year.
From the Water Demand Trend Tracking and Climate Correction analyses, the average
annual residential indoor water use was estimated as 200 kL per property per annum.
A408 Bellingen Shire Demand Management Plan Rev3 HydroScience Consulting October 2012 Page 33
While Council’s existing pricing structure satisfies the conservation pricing inclining block
tariff structure of 50% increase in price for residential external use, the internal/external
use threshold appears to be not aligned with the demand measures definitions.
Implementation of this measure is therefore recommended.
4.4.3 Residential Washing Machine Rebate Program
DSS model outcomes:
Utility B/C ratio: 42.7
Community B/C ratio: 0.7
30 year Average Water Savings: 12.3 ML/year
Although this water conservation measure is assumed to be partly funded by the LWU
(20% rebates) it does not represent significant benefit to the community due the high
cost of the washing machine, installation and running costs. However the average
water saving is reasonably high and the utility benefit/cost ratio is relatively good when
compared to other water conservation measures.
If BSC decides to provide rebates for washing machine and implement this program,
the estimated 30 year average water savings is 12.3 ML/year. The current water usage
charge is 1.60 $/kL, therefore the average annual savings for the customers is $19,736.
The current Council’s potable water production operational costs is 1.10 $/kL therefore
the average annual savings for the utility is $13,569 (it does not include savings from
reduced sewerage operations).
Water savings from implementing residential washing machine rebates represents
about 1.1% of the LBWSS baseline forecast annual water production in of 1,111 ML in
2011.
4.4.4 National Mandatory Water Efficiency Labelling Scheme (WELS) program
WELS is Australia's water efficiency labelling Scheme that requires certain products to
be registered and labelled with their water efficiency in accordance with the standard
set under the national Water Efficiency Labelling and Standards Act 2005. Council’s
role in regards to demand management is to encourage customers to purchase
products labelled accordingly with the WELS program.
DSS model outcomes:
Utility B/C ratio: 8.4
Community B/C ratio: 0.7
30 year Average Water Savings: 7.8 ML/year
A408 Bellingen Shire Demand Management Plan Rev3 HydroScience Consulting October 2012 Page 34
The Water Efficiency Labelling Scheme was introduced in 2005. The program has made
water efficient products more accessible. The DSS model assumes that uptake of water
efficient products is continuing. However it does not seem to be a very efficient
demand measure for LBWSS. Also its community and utility benefit/cost ratio are low
compared to other demand measures in scenario 3.
The estimated 30 year average water savings is 7.8 ML/year. The current water usage
charge is 1.60 $/kL, therefore the average annual savings for the customers is $12,400.
The current Council’s potable water production operational costs is 1.10 $/kL therefore
the average annual savings for the utility is $8,525 (it does not include savings from
reduced sewerage operations).
Water savings from continuing using water efficient products represents about 0.7% of
the LBWSS baseline forecast annual water production in of 1,111 ML in 2011.
4.4.5 Residential Shower Retrofit
DSS model outcomes:
Utility B/C ratio: 7.6
Community B/C ratio: 21.1
30 year Average Water Savings: 0.8 ML/year
Residential shower retrofit program is not a very efficient demand measure for LBWSS.
Low flow shower heads reduce water usage, reducing water and energy bills.
The estimated 30 year average water saving is 0.8 ML/year. The current water usage
charge is 1.60 $/kL, therefore the average annual savings for the customers is $1,249.
The current Council’s potable water production operational costs is 1.10 $/kL therefore
the average annual savings for the utility is $859 (it does not include savings from
reduced sewerage operations).
Water savings from implementing residential shower retrofit represents about 0.07% of
the LBWSS baseline forecast annual water production in of 1,052 ML in 2011.
4.4.6 BASIX - Fixture Efficiency with Rainwater Use
The Building Sustainability Index (BASIX) is a NSW government requirement that affects
anyone building a new house, villa, townhouse or apartments. The purpose of BASIX is
to ensure that all new homes are built to be more energy and water efficient. BASIX sets
specific targets for energy and water reduction in new homes.
To meet these targets, simple design features and fixtures are needed. Because BASIX is
a flexible tool, there are a wide range of options in order to meet the targets. Fixture
efficiency with rainwater use is one of these tools. In this particular study, this tool was
recommended for BSC customers in order to reduce the demand consumption.
A408 Bellingen Shire Demand Management Plan Rev3 HydroScience Consulting October 2012 Page 35
This measure includes the installation of rainwater tanks in new developments.
DSS model outcomes:
Utility B/C ratio: 0.7
Community B/C ratio: 0.7
30 year Average Water Savings: 25.2 ML/year
According to the DSS model the implementation of efficient fittings with rainwater use
in new residential developments in Bellingen is a relatively beneficial water savings
demand management measure. However the utility and the community benefit/cost
ratio are low. This means that this demand management measure is a great water
savings measure however it does not comprise many benefits to the utility or to the
community.
Upon Council’s request, a 10 % take up rate was also considered for customer to retrofit
water efficient fixtures to the existing rainwater tank. There is no existing study on the
existing number of rainwater tank usage in Bellingen Shire. For the purpose of this
analysis, an assumption was made that the number of customer with existing rainwater
tank is approximately 15 % of the total number of existing residential accounts.
The estimated 30 year average water saving is 25.2 ML/year. The current water usage
charge is 1.60 $/kL, therefore the average annual savings for the customers is $40,310.
The current Council’s potable water production operational costs is 1.10 $/kL therefore
the average annual savings for the utility is $27,713 (it does not include savings from
reduced sewerage operations).
Water saving from installing efficient fittings with rainwater use in new developments
represents about 2.1% of the LBWSS baseline forecast annual water production of 1,111
ML in 2011.
Rainwater Tanks Assessment
Since July 2004 the NSW Government implemented the Building Sustainability Index
(commonly referred to as BASIX) with the purpose of reducing the use of potable water
and to produce less greenhouse gas emissions. One of the BASIX requirements is a
rainwater tank for all new developments.
Council staff has advised that 100% of the new developments BASIX certificates have a
commitment for a rainwater tank and that the current rainwater tanks take up in the
Shire is approximately 5% of the customers connected to the water supply scheme. This
is an assumption made by Council staff through observation; there is no study data on
the actual number of rainwater tanks currently used within the serviced area.
A408 Bellingen Shire Demand Management Plan Rev3 HydroScience Consulting October 2012 Page 36
The rainwater tank assessment indicates that installation of 3 kL tanks would be
beneficial to BSC to assist potable water consumption reduction. A rainwater tank
assessment also has been undertaken for the Lower Bellinger water supply area to
calculate the benefits of rainwater tanks to water demand and water bill saving per
residential household. A summary of the results (3 kL rainwater tank with outside usage
only) is listed below. See Appendix C for a detailed description of the rainwater tank
assessment.
Rainwater cost per kilolitre ($1.40/kL) compared to cost of town water supply
($1.60/kL in 2010/11);
If rainwater tanks uptake is 100% in 30 years, then mains water saving in Lower
Bellinger water supply area in 30 years will be 74%.
Based on the outcomes of the rainwater tank assessment it appears that using 3 kL
capacity rainwater tanks (outside usage only) would represent a considerable
demand reduction (average 83 kL/year) in LBWSS.
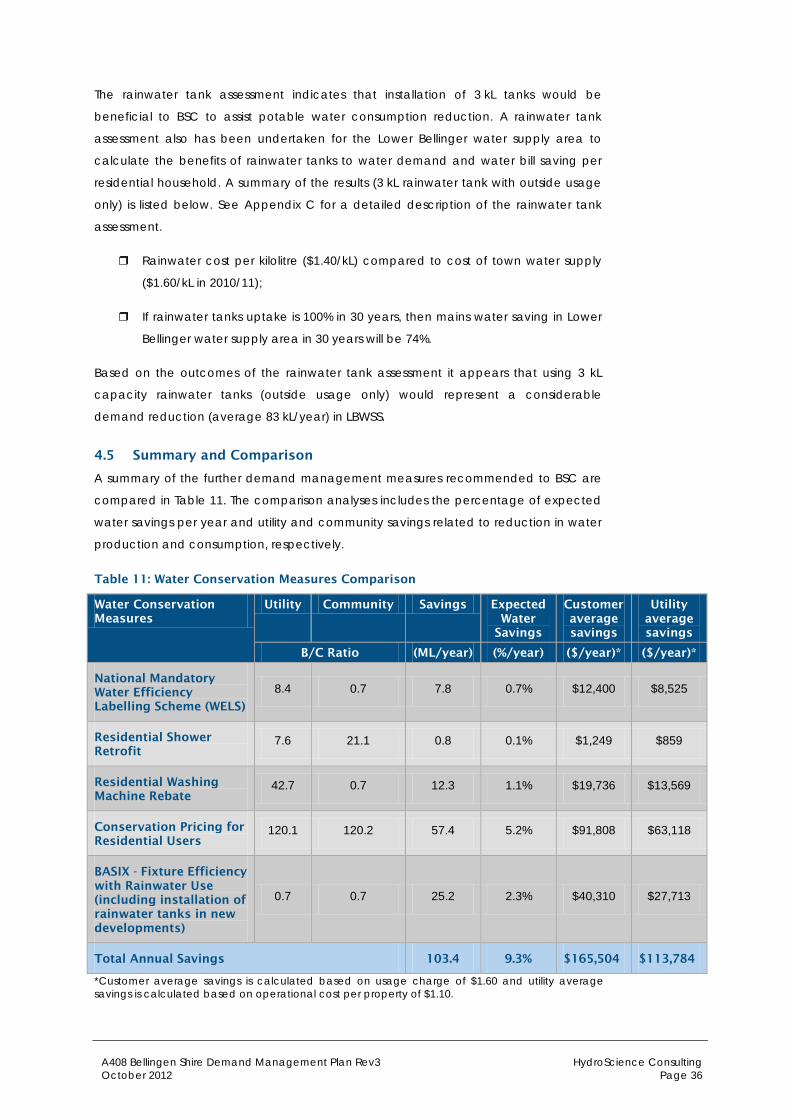
4.5 Summary and Comparison
A summary of the further demand management measures recommended to BSC are
compared in Table 11. The comparison analyses includes the percentage of expected
water savings per year and utility and community savings related to reduction in water
production and consumption, respectively.
Table 11: Water Conservation Measures Comparison
Water Conservation Measures
Utility Community Savings Expected Water
Savings
Customer average savings
Utility average savings
B/C Ratio (ML/year) (%/year) ($/year)* ($/year)*
National Mandatory Water Efficiency Labelling Scheme (WELS)
8.4 0.7 7.8 0.7% $12,400 $8,525
Residential Shower Retrofit
7.6 21.1 0.8 0.1% $1,249 $859
Residential Washing Machine Rebate
42.7 0.7 12.3 1.1% $19,736 $13,569
Conservation Pricing for Residential Users
120.1 120.2 57.4 5.2% $91,808 $63,118
BASIX - Fixture Efficiency with Rainwater Use (including installation of rainwater tanks in new developments)
0.7 0.7 25.2 2.3% $40,310 $27,713
Total Annual Savings 103.4 9.3% $165,504 $113,784
*Customer average savings is calculated based on usage charge of $1.60 and utility average savings is calculated based on operational cost per property of $1.10.
A408 Bellingen Shire Demand Management Plan Rev3 HydroScience Consulting October 2012 Page 37
If BSC decides to implement all the water conservation measures recommended
above, the 30 years average water savings per year in Lower Bellinger water supply
scheme will be approximately 99.6 ML per year, benefit cost ratios to the utility would
be 2.8 and BCRs to the community would be 0.9. The estimated costs for
implementation of each of the water demand management measures during first 5
years are summarised in section 5.
Figure 14 displays detailed demand analyses of the impact of demand scenarios on
each water supply scheme, Dorrigo and Lower Bellinger. The baseline demand
forecast and demand forecast including demand management measures are
provided in sections 3.5 and 3.5 respectively.
4.6 30 year projected Water Savings Outcomes
The following section provides the 30 years estimated water saving by implementing
demand management measures (preferred scenario 3) in the LBWSS and DWSS supply
areas.
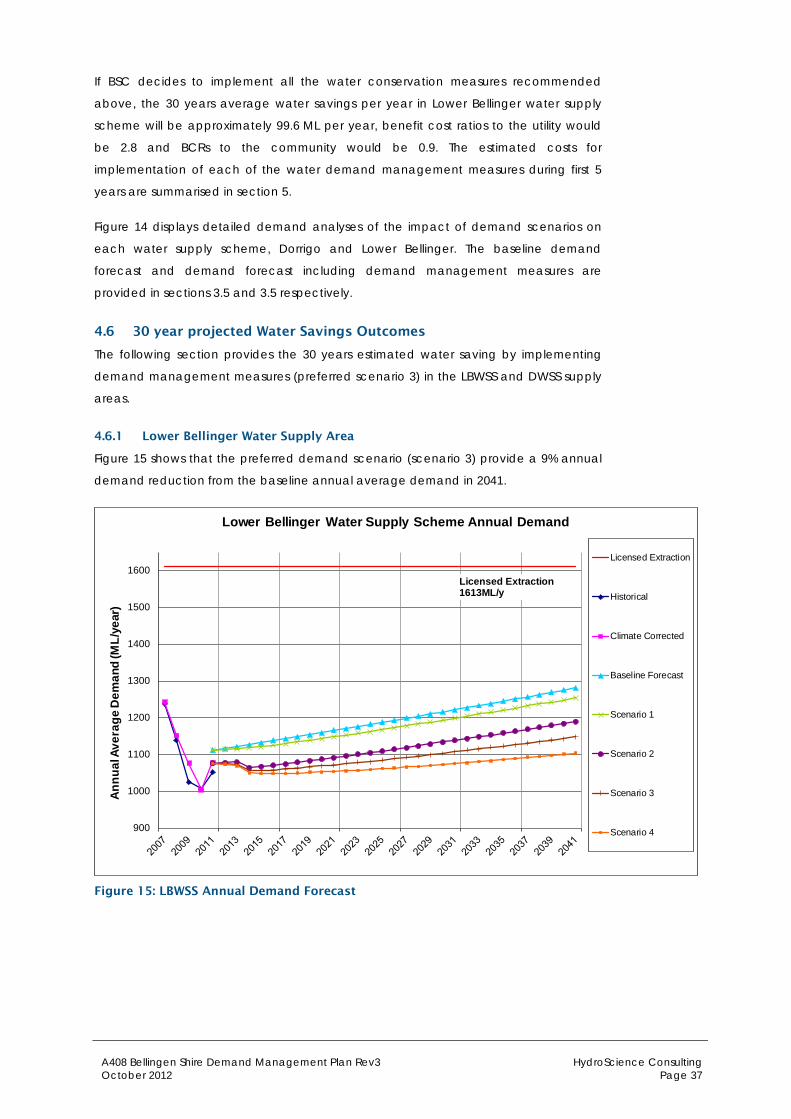
4.6.1 Lower Bellinger Water Supply Area
Figure 15 shows that the preferred demand scenario (scenario 3) provide a 9% annual
demand reduction from the baseline annual average demand in 2041.
Licensed Extraction 1613ML/y
900
1000
1100
1200
1300
1400
1500
1600
Annu
al A
vera
ge D
eman
d (M
L/ye
ar)
Lower Bellinger Water Supply Scheme Annual Demand
Licensed Extraction
Historical
Climate Corrected
Baseline Forecast
Scenario 1
Scenario 2
Scenario 3
Scenario 4
Figure 15: LBWSS Annual Demand Forecast
A408 Bellingen Shire Demand Management Plan Rev3 HydroScience Consulting October 2012 Page 38
The annual demand reductions in 30 years for each of the water demand scenario are
summarized in Table 12.
Table 12: LBWSS per Capita Demand Scenarios Comparison in 30 years
Scenario Reduction from Baseline Demand
in 2041 (ML/year) % of Reduction from Baseline Demand
1 26.8 2.1%
2 91.3 7.1%
3 132.8 10.4%
4 177.1 13.8%
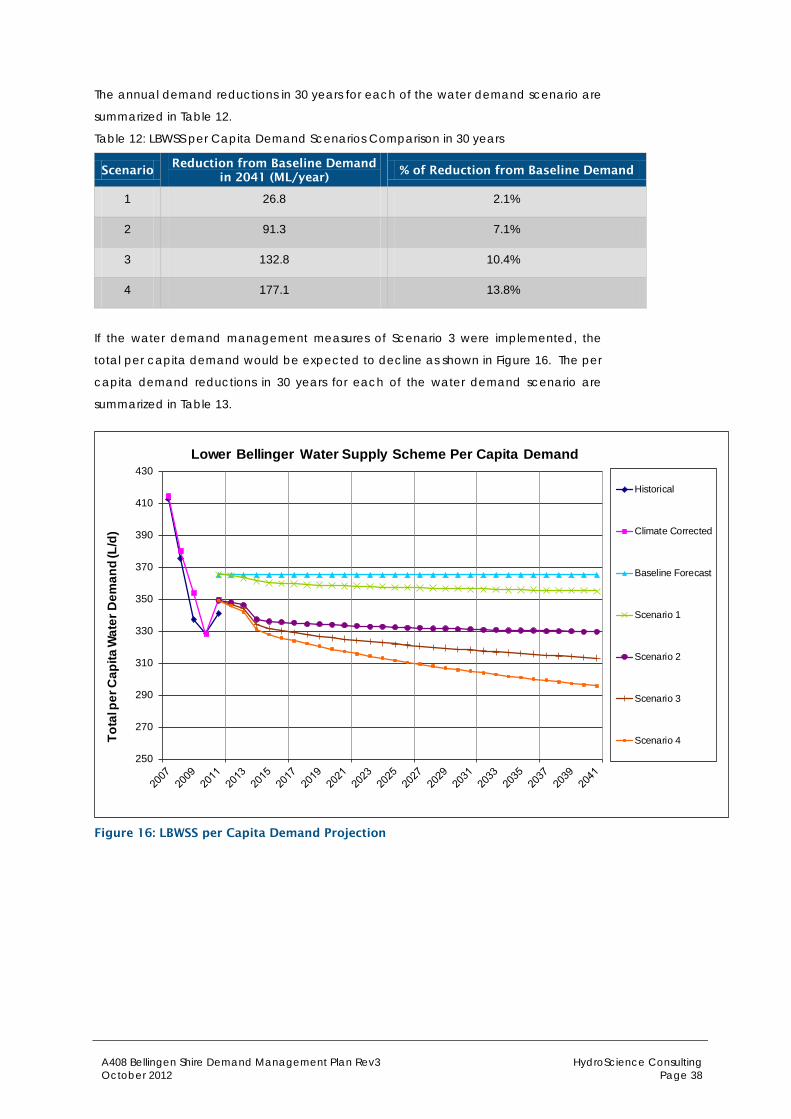
If the water demand management measures of Scenario 3 were implemented, the
total per capita demand would be expected to decline as shown in Figure 16. The per
capita demand reductions in 30 years for each of the water demand scenario are
summarized in Table 13.
250
270
290
310
330
350
370
390
410
430
Tota
l per
Cap
ita W
ater
Dem
and
(L/d
)
Lower Bellinger Water Supply Scheme Per Capita Demand
Historical
Climate Corrected
Baseline Forecast
Scenario 1
Scenario 2
Scenario 3
Scenario 4
Figure 16: LBWSS per Capita Demand Projection

A408 Bellingen Shire Demand Management Plan Rev3 HydroScience Consulting October 2012 Page 39
Table 13: LBWSS per Capita Demand Scenarios Comparison in 30 years
Scenario Reduction from Baseline Demand
in 2041 (L/person/day) % of Reduction from Baseline Demand
1 10.3 2.8%
2 35.8 9.8%
3 52.2 14.3%
4 69.7 19.1%
As shown in Figure 17 LBWSS peak day demand is unlikely to reach the capacity of the
maximum daily extraction limit by 2013. Implementing the preferred demand
management (scenario 3) will reduce PDD and enable Council to delay the need for
new infrastructure beyond 2041.
WTP Capacity 11.2 ML/d
3.0
4.0
5.0
6.0
7.0
8.0
9.0
10.0
11.0
12.0
Peak
Day
Dem
and
(ML/
d)
Lower Bellinger Water Supply Scheme Peak Day Demand
Historical
BaselineForecast
Scenario 1
Scenario 2
Scenario 3
Scenario 4
WTP Capacity
Figure 17: LBWSS PDD Forecast
4.6.2 Dorrigo Water Supply Area
Section 3.5.3 indicated that Dorrigo residential per capita demand can be further
reduced by implementing the recommended demand management measures in
scenario 3. The expected reduction percentage is assumed to be similar to LBWSS. The
results of per capita reduction are shown in Figure 18.

A408 Bellingen Shire Demand Management Plan Rev3 HydroScience Consulting October 2012 Page 40
300.0
350.0
400.0
450.0
500.0
550.0To
tal P
er C
apita
Wat
er D
eman
d (L
/d)
Dorrigo Per Capita Demand Analysis
Historical Demand Projections Scenario 3
Figure 18: DWSS per Capita Demand Analysis
A408 Bellingen Shire Demand Management Plan Rev3 HydroScience Consulting October 2012 Page 41
5 Proposed Implementation Plan
5.1 Overview
BSC demand management drivers are listed in section 4.1. Council has 2 demand
management measures in place. If Council decides to implement further demand
management measures, Council shall use this analysis as a guideline to select a
potential option.
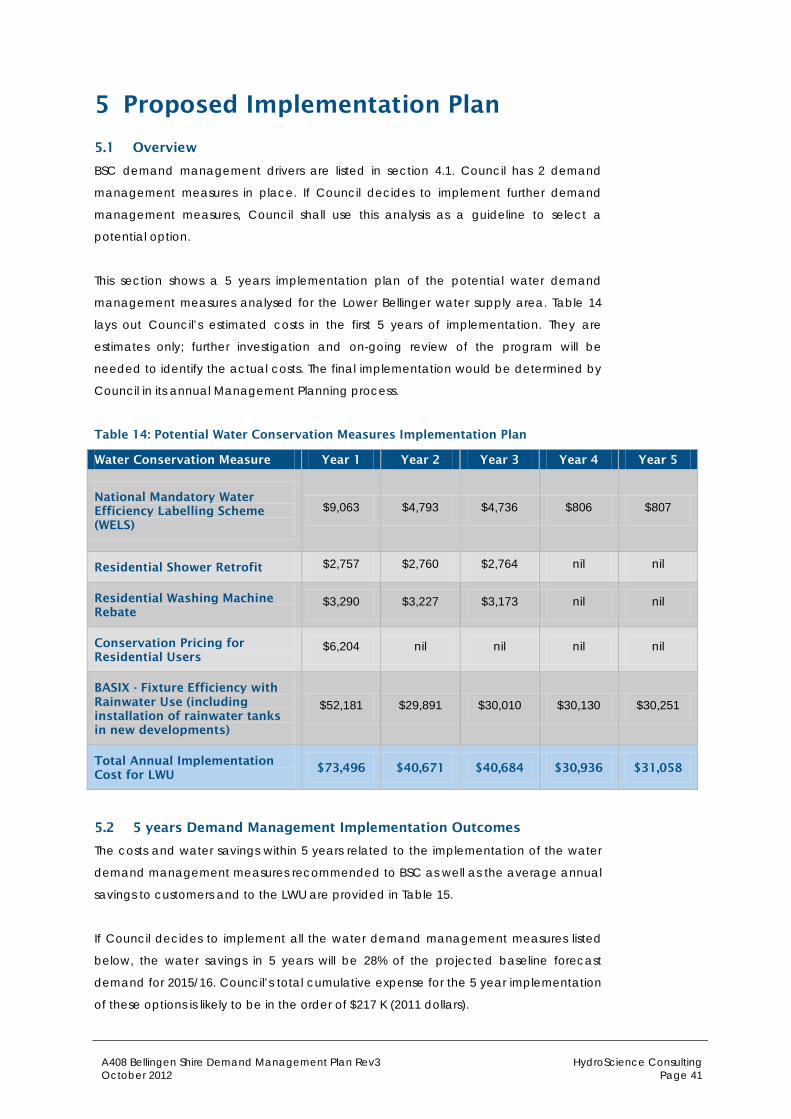
This section shows a 5 years implementation plan of the potential water demand
management measures analysed for the Lower Bellinger water supply area. Table 14
lays out Council’s estimated costs in the first 5 years of implementation. They are
estimates only; further investigation and on-going review of the program will be
needed to identify the actual costs. The final implementation would be determined by
Council in its annual Management Planning process.
Table 14: Potential Water Conservation Measures Implementation Plan
Water Conservation Measure Year 1 Year 2 Year 3 Year 4 Year 5
National Mandatory Water Efficiency Labelling Scheme (WELS)
$9,063 $4,793 $4,736 $806 $807
Residential Shower Retrofit $2,757 $2,760 $2,764 nil nil
Residential Washing Machine Rebate
$3,290 $3,227 $3,173 nil nil
Conservation Pricing for Residential Users
$6,204 nil nil nil nil
BASIX - Fixture Efficiency with Rainwater Use (including installation of rainwater tanks in new developments)
$52,181 $29,891 $30,010 $30,130 $30,251
Total Annual Implementation Cost for LWU
$73,496 $40,671 $40,684 $30,936 $31,058
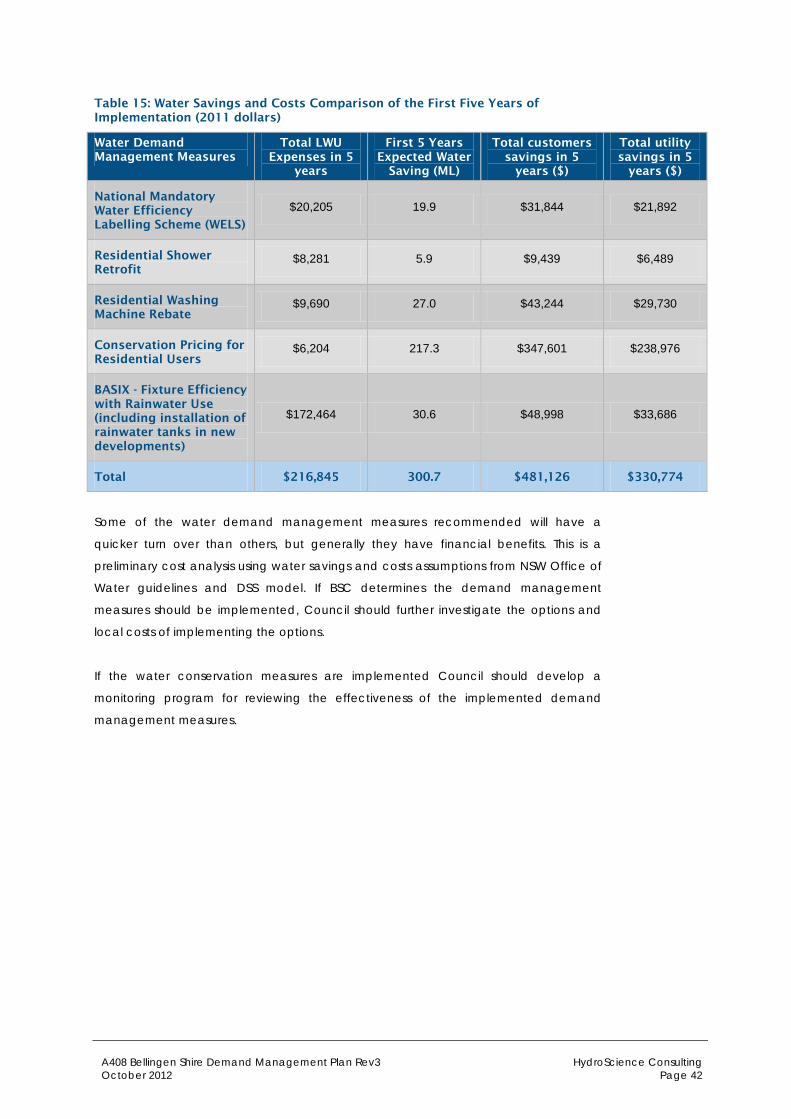
5.2 5 years Demand Management Implementation Outcomes
The costs and water savings within 5 years related to the implementation of the water
demand management measures recommended to BSC as well as the average annual
savings to customers and to the LWU are provided in Table 15.
If Council decides to implement all the water demand management measures listed
below, the water savings in 5 years will be 28% of the projected baseline forecast
demand for 2015/16. Council’s total cumulative expense for the 5 year implementation
of these options is likely to be in the order of $217 K (2011 dollars).
A408 Bellingen Shire Demand Management Plan Rev3 HydroScience Consulting October 2012 Page 42
Table 15: Water Savings and Costs Comparison of the First Five Years of Implementation (2011 dollars)
Water Demand Management Measures
Total LWU Expenses in 5
years
First 5 Years Expected Water
Saving (ML)
Total customers savings in 5
years ($)
Total utility savings in 5
years ($)
National Mandatory Water Efficiency Labelling Scheme (WELS)
$20,205 19.9 $31,844 $21,892
Residential Shower Retrofit
$8,281 5.9 $9,439 $6,489
Residential Washing Machine Rebate
$9,690 27.0 $43,244 $29,730
Conservation Pricing for Residential Users
$6,204 217.3 $347,601 $238,976
BASIX - Fixture Efficiency with Rainwater Use (including installation of rainwater tanks in new developments)
$172,464 30.6 $48,998 $33,686
Total $216,845 300.7 $481,126 $330,774
Some of the water demand management measures recommended will have a
quicker turn over than others, but generally they have financial benefits. This is a
preliminary cost analysis using water savings and costs assumptions from NSW Office of
Water guidelines and DSS model. If BSC determines the demand management
measures should be implemented, Council should further investigate the options and
local costs of implementing the options.
If the water conservation measures are implemented Council should develop a
monitoring program for reviewing the effectiveness of the implemented demand
management measures.
A408 Bellingen Shire Demand Management Plan Rev3 HydroScience Consulting October 2012 Page 43
6 Reference
1. Bureau of Meteorology -SILO data recorded at 30.45°S 152.90°E
2. Bellingen Shire Council IWCM Strategy, Public Works NSW Water Solutions, Dec
2011
3. NSW Office of Water, Best-Practice Management of Water -Supply and
Sewerage Guidelines, Aug 2007
4. Bellingen Shire Council IWCM Strategy – Concept Study, Public Works NSW
Water Solutions, Oct 2007
5. NSW Water Supply and Sewerage Benchmarking Report 2010/11
6. Water Demand and Trend Tracking Climate Correction Manual (Version 10)
Manual, May 2002
7. Bellingen Shire Council 2010/1 TBL Performance Reports for water supply and
sewerage
8. Data provided by Bellingen Shire Council
9. Bellingen Shire water access licence (WAL6426) for Dorrigo water supply, issued
May 2005
A408 Bellingen Shire Demand Management Plan Rev3 HydroScience Consulting October 2012 Page 44
Appendix A
Water Demand Trend Tracking and Climate Correction Methodology

A408 Bellingen Shire Demand Management Plan Rev3 HydroScience Consulting October 2012 Page 45
Introduction
The methodology for this analysis was performed according to the manual developed
by NSW Office of Water (May 2002). The methodology is described below.
Set up
The model tables were set according to the period of data available. The data
provided (population, daily water production and climate) was inserted into those
tables and estimated population and observed water production per capita (daily)
were calculated as well as soil moisture data.
Bellingen particularly in the coastal area has a very high visitor number during the
holiday seasons. The model does not take into account the population variation.
Therefore the climate corrected calculations are undertaken for the permanent
residing population only. The impact of the visitors’ production in the Lower Bellinger
Scheme water production is calculated using the outcomes of the model, which
provides an estimated visitors production factor. This is then added to the final climate
corrected production data.
Input Data
Table 16: Demand Trend Tracking and Climate Correction Model Input Data
Data Required
Data Used Comments
Population LBWSS Permanent Population excluding visitors:
6,712 in 1991
7,318 in 1996
7,725 in 2001
8,158 in 2006
8,334 in 2009
(Source: Table 2.3 Historical
Populations Connected to Water
Supply System, Bellingen Shire Council
IWCM Strategy, Public Works NSW
Water Solutions, Dec 2011)
Climate 60 years of daily rainfall, maximum temperature
and evaporation
Data from Bureau of Meteorology SILO
services recorded at 30 27°S 152 54°'E
Daily Water
Production
8 years of daily water production data were
selected from the records provided by Council
Data log from Bellingen Town Reservoir
and Marx Hill Reservoirs from BSC (May
1994 – June 2011)
Data was checked for accuracy and errors so that baseline production levels suitable
for forecasting could be prepared. Some of the production data was very high having
one or two previous days with blank data. Council has reviewed and confirmed missing
and unrealistic data to obtain a better model outcome.
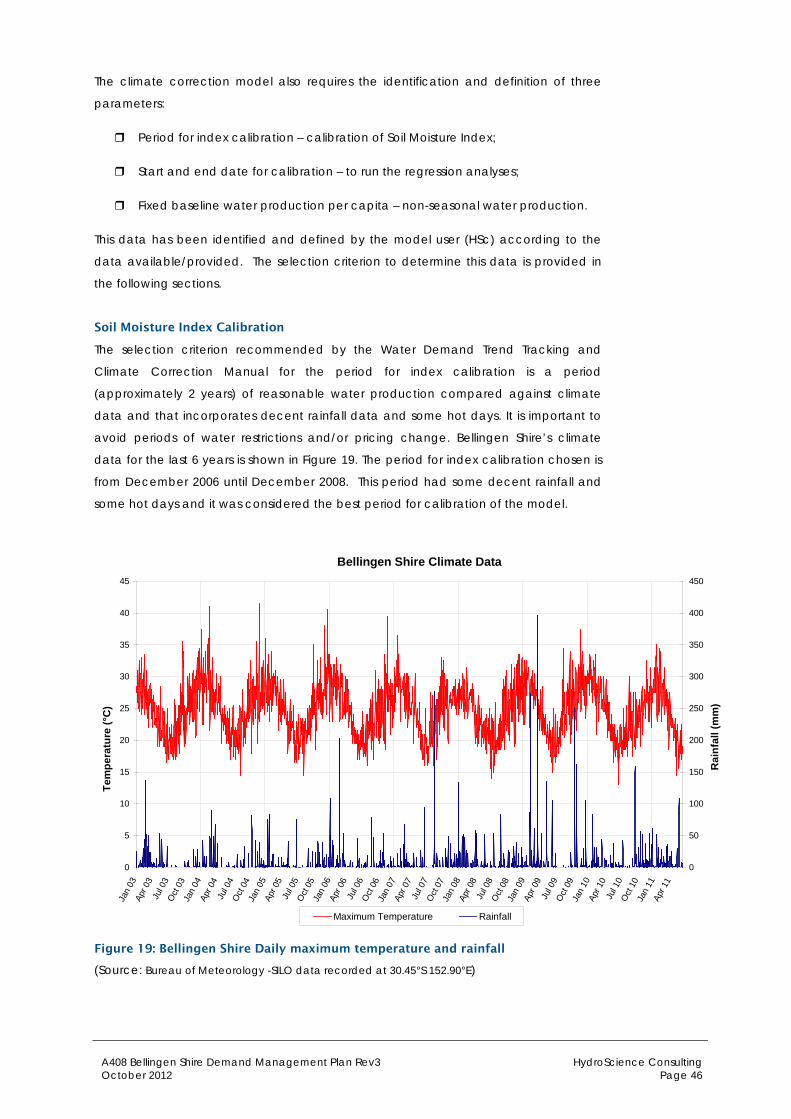
A408 Bellingen Shire Demand Management Plan Rev3 HydroScience Consulting October 2012 Page 46
The climate correction model also requires the identification and definition of three
parameters:
Period for index calibration – calibration of Soil Moisture Index;
Start and end date for calibration – to run the regression analyses;
Fixed baseline water production per capita – non-seasonal water production.
This data has been identified and defined by the model user (HSc) according to the
data available/provided. The selection criterion to determine this data is provided in
the following sections.
Soil Moisture Index Calibration
The selection criterion recommended by the Water Demand Trend Tracking and
Climate Correction Manual for the period for index calibration is a period
(approximately 2 years) of reasonable water production compared against climate
data and that incorporates decent rainfall data and some hot days. It is important to
avoid periods of water restrictions and/or pricing change. Bellingen Shire’s climate
data for the last 6 years is shown in Figure 19. The period for index calibration chosen is
from December 2006 until December 2008. This period had some decent rainfall and
some hot days and it was considered the best period for calibration of the model.
Bellingen Shire Climate Data
0
5
10
15
20
25
30
35
40
45
Jan
03Ap
r 03
Jul 0
3O
ct 03
Jan
04Ap
r 04
Jul 0
4O
ct 04
Jan
05Ap
r 05
Jul 0
5O
ct 05
Jan
06Ap
r 06
Jul 0
6O
ct 06
Jan
07Ap
r 07
Jul 0
7O
ct 07
Jan
08Ap
r 08
Jul 0
8O
ct 08
Jan
09Ap
r 09
Jul 0
9O
ct 09
Jan
10Ap
r 10
Jul 1
0O
ct 10
Jan
11Ap
r 11
Tem
pera
ture
(°C
)
0
50
100
150
200
250
300
350
400
450
Rai
nfal
l (m
m)
Maximum Temperature Rainfall
Figure 19: Bellingen Shire Daily maximum temperature and rainfall
(Source: Bureau of Meteorology -SILO data recorded at 30.45°S 152.90°E)
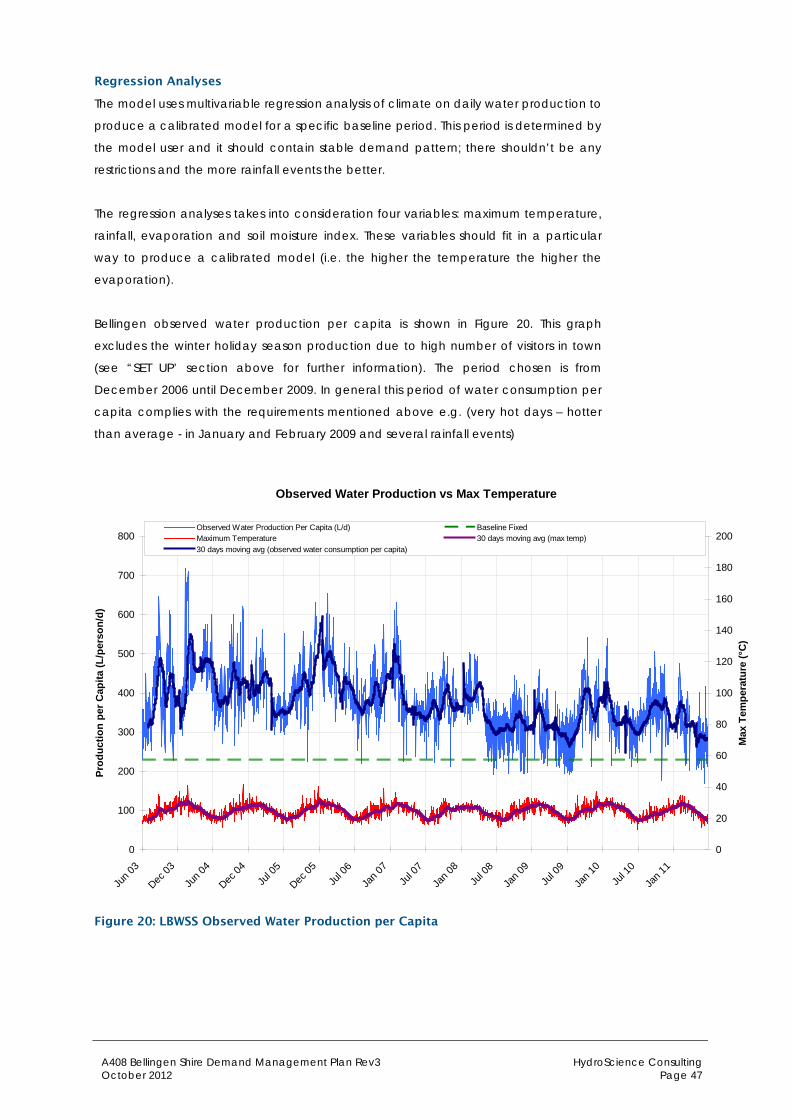
A408 Bellingen Shire Demand Management Plan Rev3 HydroScience Consulting October 2012 Page 47
Regression Analyses
The model uses multivariable regression analysis of climate on daily water production to
produce a calibrated model for a specific baseline period. This period is determined by
the model user and it should contain stable demand pattern; there shouldn’t be any
restrictions and the more rainfall events the better.
The regression analyses takes into consideration four variables: maximum temperature,
rainfall, evaporation and soil moisture index. These variables should fit in a particular
way to produce a calibrated model (i.e. the higher the temperature the higher the
evaporation).
Bellingen observed water production per capita is shown in Figure 20. This graph
excludes the winter holiday season production due to high number of visitors in town
(see “SET UP’ section above for further information). The period chosen is from
December 2006 until December 2009. In general this period of water consumption per
capita complies with the requirements mentioned above e.g. (very hot days – hotter
than average - in January and February 2009 and several rainfall events)
Observed Water Production vs Max Temperature
0
100
200
300
400
500
600
700
800
Jun 0
3
Dec 03
Jun 0
4
Dec 04
Jul 0
5
Dec 05
Jul 0
6
Jan 0
7Ju
l 07
Jan 0
8Ju
l 08
Jan 0
9Ju
l 09
Jan 1
0Ju
l 10
Jan 1
1
Prod
uctio
n pe
r Cap
ita (L
/per
son/
d)
0
20
40
60
80
100
120
140
160
180
200
Max
Tem
pera
ture
(°C
)
Observed Water Production Per Capita (L/d) Baseline FixedMaximum Temperature 30 days moving avg (max temp)30 days moving avg (observed water consumption per capita)
Figure 20: LBWSS Observed Water Production per Capita
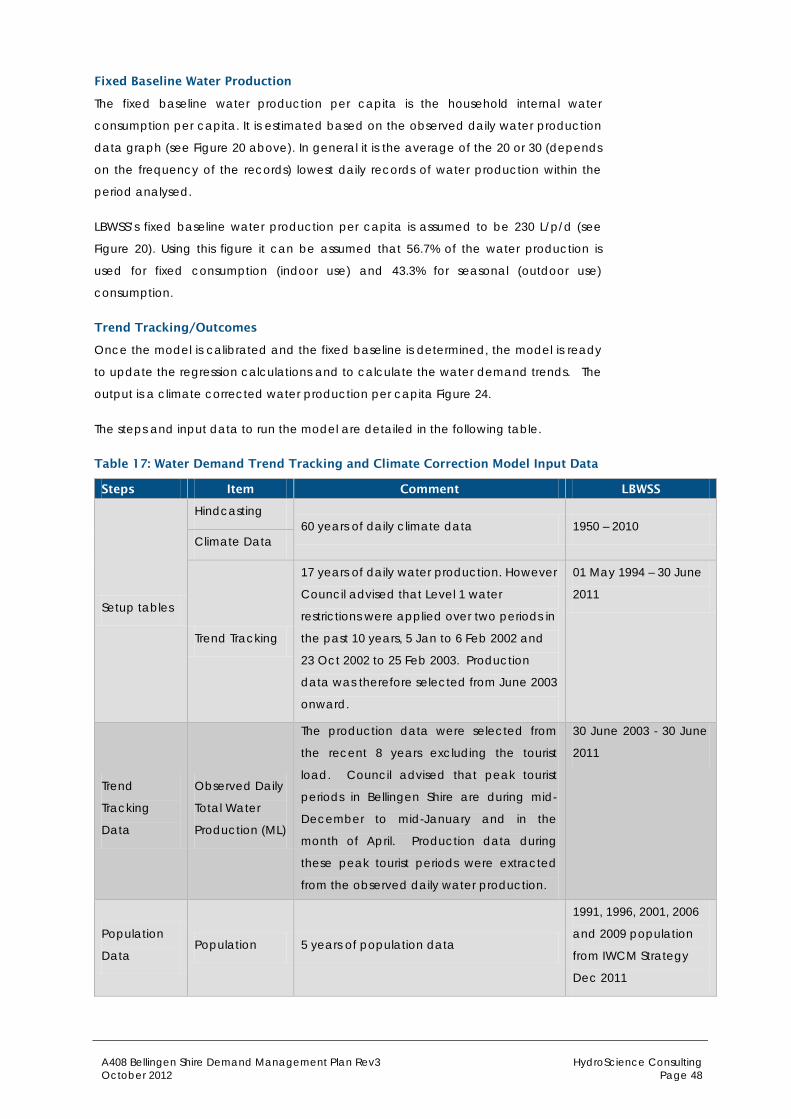
A408 Bellingen Shire Demand Management Plan Rev3 HydroScience Consulting October 2012 Page 48
Fixed Baseline Water Production
The fixed baseline water production per capita is the household internal water
consumption per capita. It is estimated based on the observed daily water production
data graph (see Figure 20 above). In general it is the average of the 20 or 30 (depends
on the frequency of the records) lowest daily records of water production within the
period analysed.
LBWSS’s fixed baseline water production per capita is assumed to be 230 L/p/d (see
Figure 20). Using this figure it can be assumed that 56.7% of the water production is
used for fixed consumption (indoor use) and 43.3% for seasonal (outdoor use)
consumption.
Trend Tracking/Outcomes
Once the model is calibrated and the fixed baseline is determined, the model is ready
to update the regression calculations and to calculate the water demand trends. The
output is a climate corrected water production per capita Figure 24.
The steps and input data to run the model are detailed in the following table.
Table 17: Water Demand Trend Tracking and Climate Correction Model Input Data
Steps Item Comment LBWSS
Setup tables
Hindcasting 60 years of daily climate data 1950 – 2010
Climate Data
Trend Tracking
17 years of daily water production. However
Council advised that Level 1 water
restrictions were applied over two periods in
the past 10 years, 5 Jan to 6 Feb 2002 and
23 Oct 2002 to 25 Feb 2003. Production
data was therefore selected from June 2003
onward.
01 May 1994 – 30 June
2011
Trend
Tracking
Data
Observed Daily
Total Water
Production (ML)
The production data were selected from
the recent 8 years excluding the tourist
load. Council advised that peak tourist
periods in Bellingen Shire are during mid-
December to mid-January and in the
month of April. Production data during
these peak tourist periods were extracted
from the observed daily water production.
30 June 2003 - 30 June
2011
Population
Data Population 5 years of population data
1991, 1996, 2001, 2006
and 2009 population
from IWCM Strategy
Dec 2011
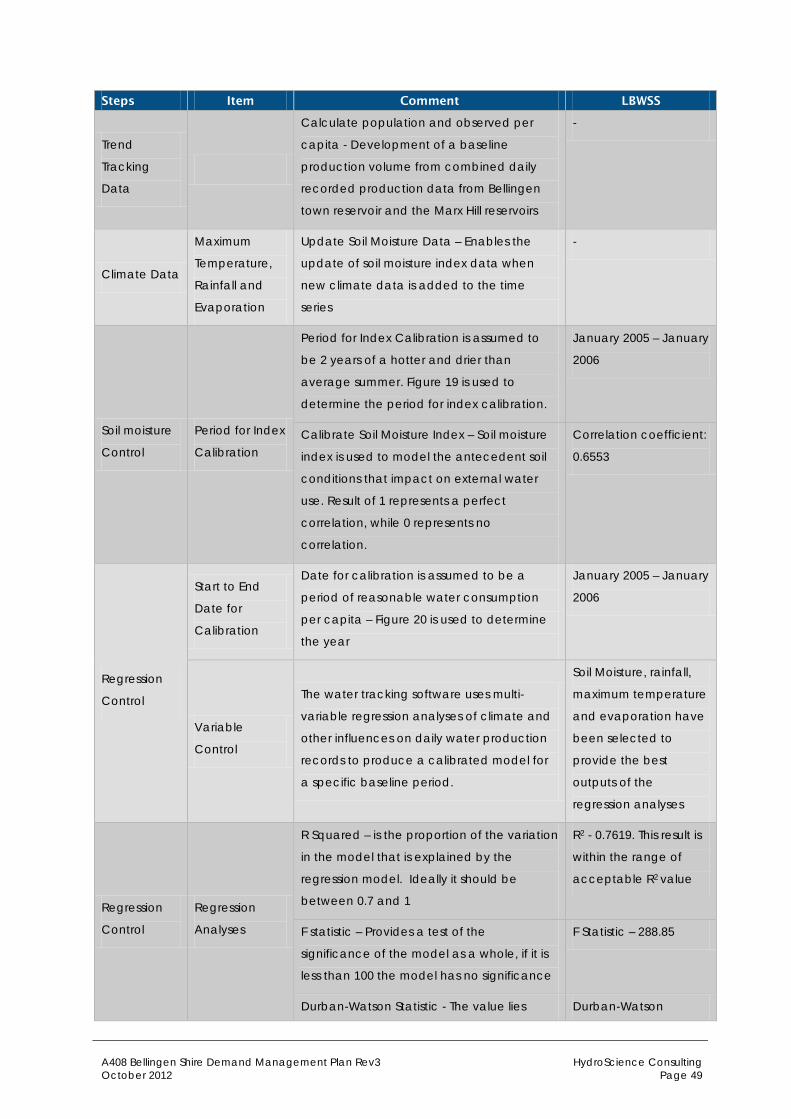
A408 Bellingen Shire Demand Management Plan Rev3 HydroScience Consulting October 2012 Page 49
Steps Item Comment LBWSS
Trend
Tracking
Data
Calculate population and observed per
capita - Development of a baseline
production volume from combined daily
recorded production data from Bellingen
town reservoir and the Marx Hill reservoirs
-
Climate Data
Maximum
Temperature,
Rainfall and
Evaporation
Update Soil Moisture Data – Enables the
update of soil moisture index data when
new climate data is added to the time
series
-
Soil moisture
Control
Period for Index
Calibration
Period for Index Calibration is assumed to
be 2 years of a hotter and drier than
average summer. Figure 19 is used to
determine the period for index calibration.
January 2005 – January
2006
Calibrate Soil Moisture Index – Soil moisture
index is used to model the antecedent soil
conditions that impact on external water
use. Result of 1 represents a perfect
correlation, while 0 represents no
correlation.
Correlation coefficient:
0.6553
Regression
Control
Start to End
Date for
Calibration
Date for calibration is assumed to be a
period of reasonable water consumption
per capita – Figure 20 is used to determine
the year
January 2005 – January
2006
Variable
Control
The water tracking software uses multi-
variable regression analyses of climate and
other influences on daily water production
records to produce a calibrated model for
a specific baseline period.
Soil Moisture, rainfall,
maximum temperature
and evaporation have
been selected to
provide the best
outputs of the
regression analyses
Regression
Control
Regression
Analyses
R Squared – is the proportion of the variation
in the model that is explained by the
regression model. Ideally it should be
between 0.7 and 1
R2 - 0.7619. This result is
within the range of
acceptable R2 value
F statistic – Provides a test of the
significance of the model as a whole, if it is
less than 100 the model has no significance
F Statistic – 288.85
Durban-Watson Statistic - The value lies Durban-Watson
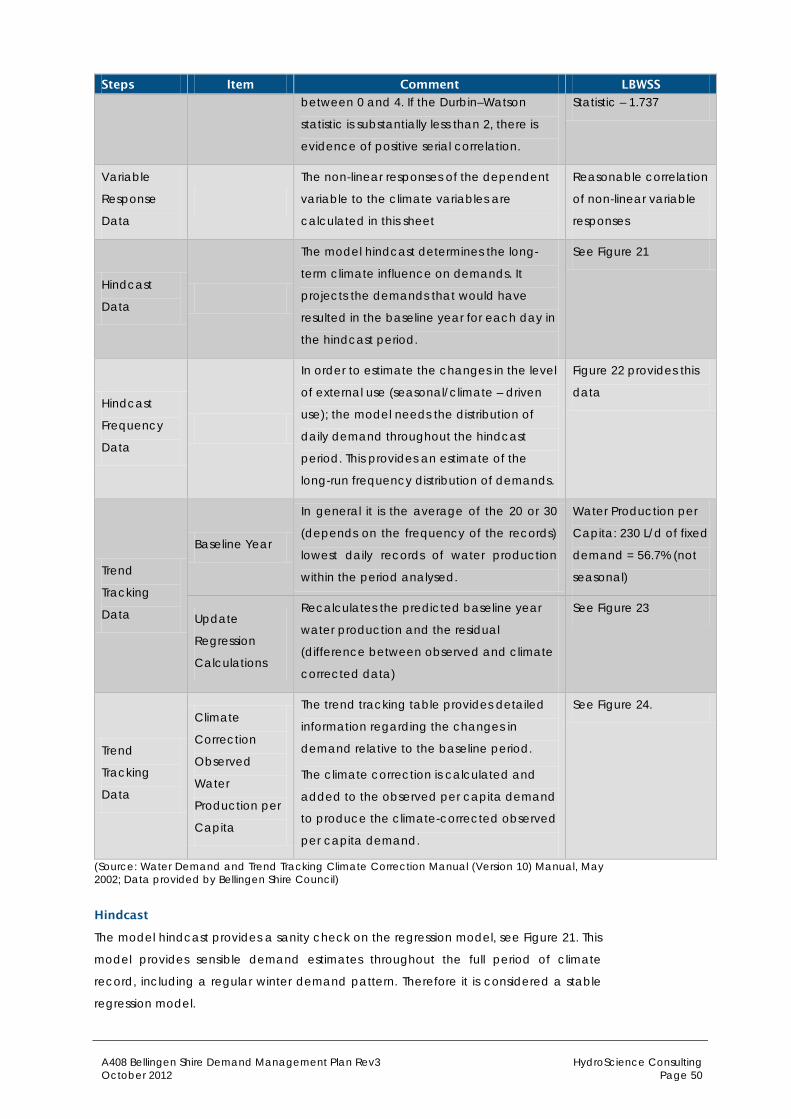
A408 Bellingen Shire Demand Management Plan Rev3 HydroScience Consulting October 2012 Page 50
Steps Item Comment LBWSS
between 0 and 4. If the Durbin–Watson
statistic is substantially less than 2, there is
evidence of positive serial correlation.
Statistic – 1.737
Variable
Response
Data
The non-linear responses of the dependent
variable to the climate variables are
calculated in this sheet
Reasonable correlation
of non-linear variable
responses
Hindcast
Data
The model hindcast determines the long-
term climate influence on demands. It
projects the demands that would have
resulted in the baseline year for each day in
the hindcast period.
See Figure 21
Hindcast
Frequency
Data
In order to estimate the changes in the level
of external use (seasonal/climate – driven
use); the model needs the distribution of
daily demand throughout the hindcast
period. This provides an estimate of the
long-run frequency distribution of demands.
Figure 22 provides this
data
Trend
Tracking
Data
Baseline Year
In general it is the average of the 20 or 30
(depends on the frequency of the records)
lowest daily records of water production
within the period analysed.
Water Production per
Capita: 230 L/d of fixed
demand = 56.7% (not
seasonal)
Update
Regression
Calculations
Recalculates the predicted baseline year
water production and the residual
(difference between observed and climate
corrected data)
See Figure 23
Trend
Tracking
Data
Climate
Correction
Observed
Water
Production per
Capita
The trend tracking table provides detailed
information regarding the changes in
demand relative to the baseline period.
The climate correction is calculated and
added to the observed per capita demand
to produce the climate-corrected observed
per capita demand.
See Figure 24.
(Source: Water Demand and Trend Tracking Climate Correction Manual (Version 10) Manual, May 2002; Data provided by Bellingen Shire Council)
Hindcast
The model hindcast provides a sanity check on the regression model, see Figure 21. This
model provides sensible demand estimates throughout the full period of climate
record, including a regular winter demand pattern. Therefore it is considered a stable
regression model.
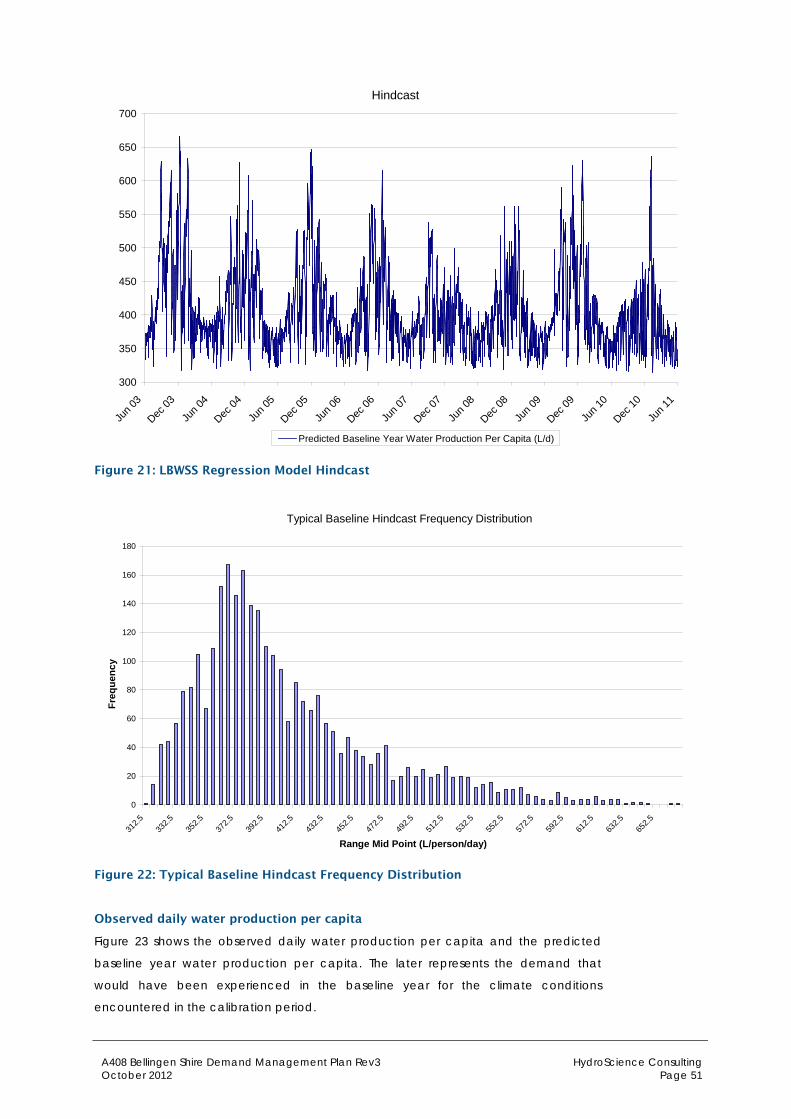
A408 Bellingen Shire Demand Management Plan Rev3 HydroScience Consulting October 2012 Page 51
Hindcast
300
350
400
450
500
550
600
650
700
Jun 0
3
Dec 03
Jun 0
4
Dec 04
Jun 0
5
Dec 05
Jun 0
6
Dec 06
Jun 0
7
Dec 07
Jun 0
8
Dec 08
Jun 0
9
Dec 09
Jun 1
0
Dec 10
Jun 1
1
Predicted Baseline Year Water Production Per Capita (L/d)
Figure 21: LBWSS Regression Model Hindcast
Typical Baseline Hindcast Frequency Distribution
0
20
40
60
80
100
120
140
160
180
312.5
332.5
352.5
372.5
392.5
412.5
432.5
452.5
472.5
492.5
512.5
532.5
552.5
572.5
592.5
612.5
632.5
652.5
Range Mid Point (L/person/day)
Freq
uenc
y
Figure 22: Typical Baseline Hindcast Frequency Distribution
Observed daily water production per capita
Figure 23 shows the observed daily water production per capita and the predicted
baseline year water production per capita. The later represents the demand that
would have been experienced in the baseline year for the climate conditions
encountered in the calibration period.

A408 Bellingen Shire Demand Management Plan Rev3 HydroScience Consulting October 2012 Page 52
The residual is the difference between the observed per capita and the predicted
baseline year per capita production.
Water Production per capita (L/d)
-200
-100
0
100
200
300
400
500
600
700
800
Dec
03
Jun
04
Dec
04
Jun
05
Dec
05
Jun
06
Dec
06
Jul 0
7
Dec
07
Jul 0
8
Dec
08
Jul 0
9
Jan
10
Jul 1
0
Jan
11
Observed Water Production Per Capita (L/d)Predicted Baseline Year Water Production Per Capita (L/d)Residual (L/d)
Two-tier pricing applied since 2008/09
Figure 23: Observed, Predicted and Residual Water Production per Capita
Outcomes
The main outcome of the model is the “climate corrected observed per capita
production”. The sum of the calculated climate correction and the observed per
capita demand is the climate-corrected observed per capita demand; this is shown in
Figure 24.
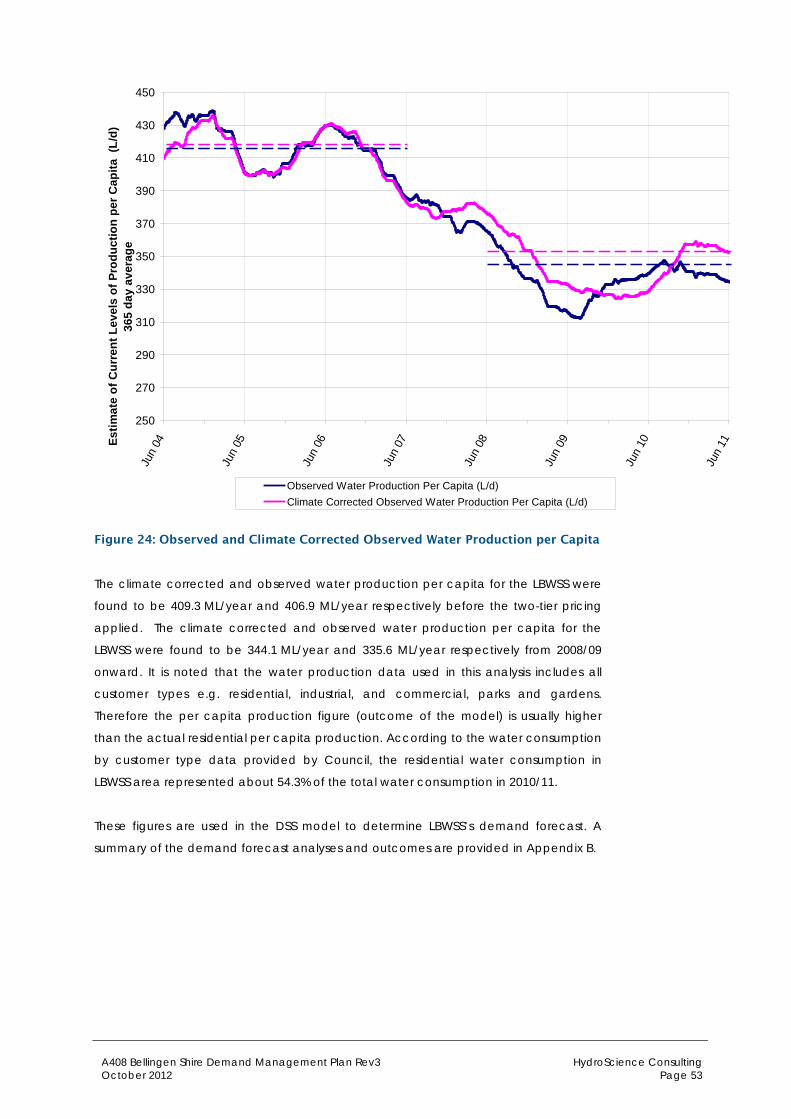
A408 Bellingen Shire Demand Management Plan Rev3 HydroScience Consulting October 2012 Page 53
250
270
290
310
330
350
370
390
410
430
450
Jun
04
Jun
05
Jun
06
Jun
07
Jun
08
Jun
09
Jun
10
Jun
11Estim
ate
of C
urre
nt L
evel
s of
Pro
duct
ion
per C
apita
(L/
d)
365
day
aver
age
Observed Water Production Per Capita (L/d)Climate Corrected Observed Water Production Per Capita (L/d)
Figure 24: Observed and Climate Corrected Observed Water Production per Capita
The climate corrected and observed water production per capita for the LBWSS were
found to be 409.3 ML/year and 406.9 ML/year respectively before the two-tier pricing
applied. The climate corrected and observed water production per capita for the
LBWSS were found to be 344.1 ML/year and 335.6 ML/year respectively from 2008/09
onward. It is noted that the water production data used in this analysis includes all
customer types e.g. residential, industrial, and commercial, parks and gardens.
Therefore the per capita production figure (outcome of the model) is usually higher
than the actual residential per capita production. According to the water consumption
by customer type data provided by Council, the residential water consumption in
LBWSS area represented about 54.3% of the total water consumption in 2010/11.
These figures are used in the DSS model to determine LBWSS’s demand forecast. A
summary of the demand forecast analyses and outcomes are provided in Appendix B.
A408 Bellingen Shire Demand Management Plan Rev3 HydroScience Consulting October 2012 Page 54
Appendix B
Demand Side Management Support System (DSS) Methodology
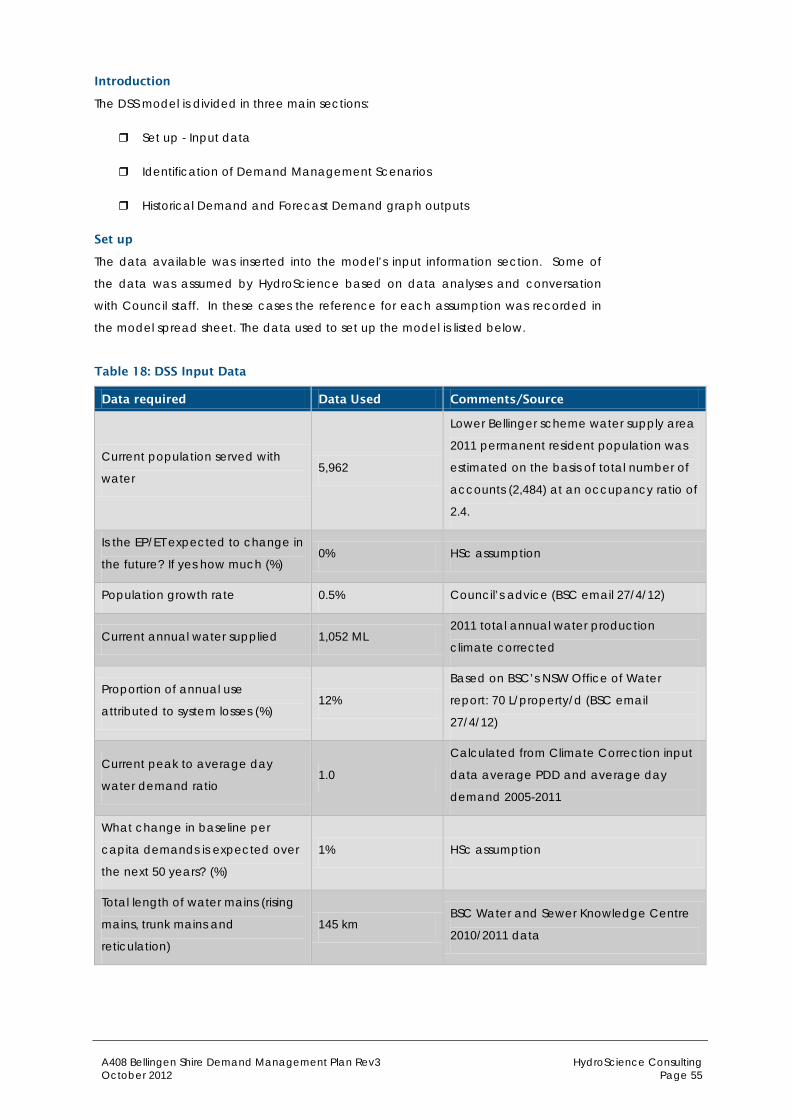
A408 Bellingen Shire Demand Management Plan Rev3 HydroScience Consulting October 2012 Page 55
Introduction
The DSS model is divided in three main sections:
Set up - Input data
Identification of Demand Management Scenarios
Historical Demand and Forecast Demand graph outputs
Set up
The data available was inserted into the model’s input information section. Some of
the data was assumed by HydroScience based on data analyses and conversation
with Council staff. In these cases the reference for each assumption was recorded in
the model spread sheet. The data used to set up the model is listed below.
Table 18: DSS Input Data
Data required Data Used Comments/Source
Current population served with
water 5,962
Lower Bellinger scheme water supply area
2011 permanent resident population was
estimated on the basis of total number of
accounts (2,484) at an occupancy ratio of
2.4.
Is the EP/ET expected to change in
the future? If yes how much (%) 0% HSc assumption
Population growth rate 0.5% Council’s advice (BSC email 27/4/12)
Current annual water supplied 1,052 ML 2011 total annual water production
climate corrected
Proportion of annual use
attributed to system losses (%) 12%
Based on BSC’s NSW Office of Water
report: 70 L/property/d (BSC email
27/4/12)
Current peak to average day
water demand ratio 1.0
Calculated from Climate Correction input
data average PDD and average day
demand 2005-2011
What change in baseline per
capita demands is expected over
the next 50 years? (%)
1% HSc assumption
Total length of water mains (rising
mains, trunk mains and
reticulation)
145 km BSC Water and Sewer Knowledge Centre
2010/2011 data
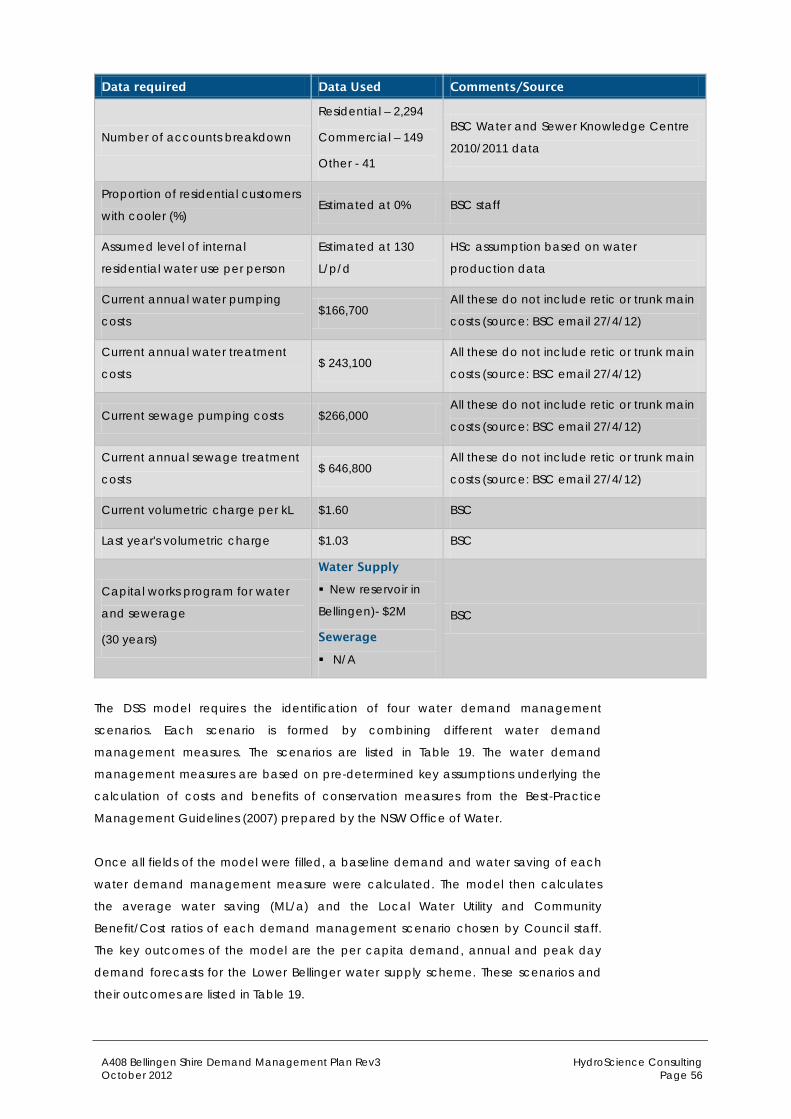
A408 Bellingen Shire Demand Management Plan Rev3 HydroScience Consulting October 2012 Page 56
Data required Data Used Comments/Source
Number of accounts breakdown
Residential – 2,294
Commercial – 149
Other - 41
BSC Water and Sewer Knowledge Centre
2010/2011 data
Proportion of residential customers
with cooler (%) Estimated at 0% BSC staff
Assumed level of internal
residential water use per person
Estimated at 130
L/p/d
HSc assumption based on water
production data
Current annual water pumping
costs $166,700
All these do not include retic or trunk main
costs (source: BSC email 27/4/12)
Current annual water treatment
costs $ 243,100
All these do not include retic or trunk main
costs (source: BSC email 27/4/12)
Current sewage pumping costs $266,000 All these do not include retic or trunk main
costs (source: BSC email 27/4/12)
Current annual sewage treatment
costs $ 646,800
All these do not include retic or trunk main
costs (source: BSC email 27/4/12)
Current volumetric charge per kL $1.60 BSC
Last year's volumetric charge $1.03 BSC
Capital works program for water
and sewerage
(30 years)
Water Supply
New reservoir in
Bellingen)- $2M
Sewerage
N/A
BSC
The DSS model requires the identification of four water demand management
scenarios. Each scenario is formed by combining different water demand
management measures. The scenarios are listed in Table 19. The water demand
management measures are based on pre-determined key assumptions underlying the
calculation of costs and benefits of conservation measures from the Best-Practice
Management Guidelines (2007) prepared by the NSW Office of Water.
Once all fields of the model were filled, a baseline demand and water saving of each
water demand management measure were calculated. The model then calculates
the average water saving (ML/a) and the Local Water Utility and Community
Benefit/Cost ratios of each demand management scenario chosen by Council staff.
The key outcomes of the model are the per capita demand, annual and peak day
demand forecasts for the Lower Bellinger water supply scheme. These scenarios and
their outcomes are listed in Table 19.
A408 Bellingen Shire Demand Management Plan Rev3 HydroScience Consulting October 2012 Page 57
Outcomes
For each demand scenario the model provides projected average annual water
saving and associated community and LWU benefit/cost ratios figures. The average
annual water saving is an average of the 30 years water saving calculated by the
model. The water saving increase over the years due to growth and percentage of
customers take up. The benefit/cost ratio is the ratios of total benefits and costs arising
from a demand management effort. This means, the higher the ratios the better the
demand management measure benefit to the Lower Bellinger scheme. The definitions
of the community and LWU benefit/cost ratios are:
Community Benefit/ Cost Ratios: This is the ratios of the combined benefits and
costs of the utility and customers. This community perspective provides an
overall assessment of cost-effectiveness given that saving costs and saving
accrued by the utility are ultimately passed on to consumers through rates and
charges.
Utility Benefit/ Cost Ratios: This is the ratios of the benefits and costs from the
perspective of the local water utility. Costs include the cost of implementation
incurred by the water utility for planning, administration and education
campaigns and additional investment required by the utility, including water
loss management, recycled water and rainwater harvesting infrastructure.
These benefits and costs do not include the costs to customers of additional
investment in water efficient fixtures and appliances and source substitution, nor
benefits arising to customers from hot water saving.
The demand management scenarios developed by BSC staff and the DSS model
outputs for each scenario and for each individual water conservation measure are
provided in the following table.
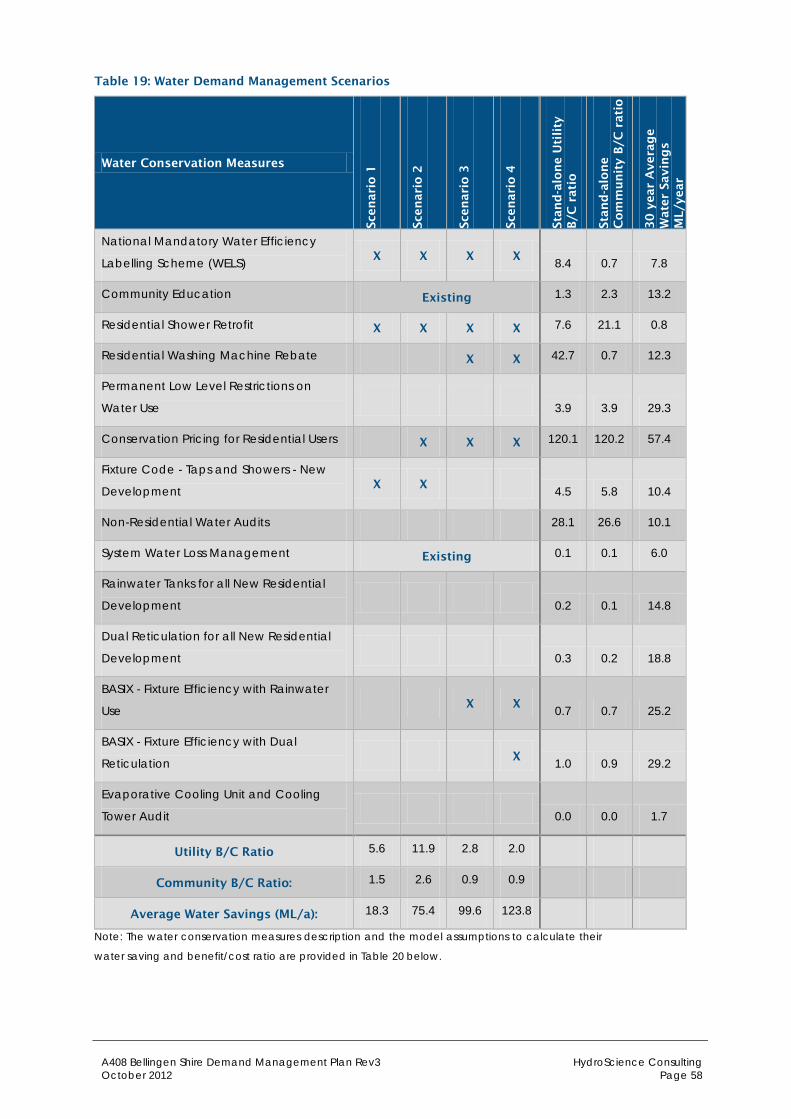
A408 Bellingen Shire Demand Management Plan Rev3 HydroScience Consulting October 2012 Page 58
Table 19: Water Demand Management Scenarios
Water Conservation Measures
Sce
nari
o 1
Sce
nari
o 2
Sce
nari
o 3
Sce
nari
o 4
Sta
nd
-alo
ne U
tili
ty
B/C
rati
o
Sta
nd
-alo
ne
Co
mm
un
ity B
/C r
ati
o
30
year
Avera
ge
Wate
r Savin
gs
ML/y
ear
National Mandatory Water Efficiency
Labelling Scheme (WELS) X X X X 8.4 0.7 7.8
Community Education Existing 1.3 2.3 13.2
Residential Shower Retrofit X X X X 7.6 21.1 0.8
Residential Washing Machine Rebate X X 42.7 0.7 12.3
Permanent Low Level Restrictions on
Water Use 3.9 3.9 29.3
Conservation Pricing for Residential Users X X X 120.1 120.2 57.4
Fixture Code - Taps and Showers - New
Development X X 4.5 5.8 10.4
Non-Residential Water Audits 28.1 26.6 10.1
System Water Loss Management Existing 0.1 0.1 6.0
Rainwater Tanks for all New Residential
Development 0.2 0.1 14.8
Dual Reticulation for all New Residential
Development 0.3 0.2 18.8
BASIX - Fixture Efficiency with Rainwater
Use X X 0.7 0.7 25.2
BASIX - Fixture Efficiency with Dual
Reticulation X 1.0 0.9 29.2
Evaporative Cooling Unit and Cooling
Tower Audit 0.0 0.0 1.7
Utility B/C Ratio 5.6 11.9 2.8 2.0
Community B/C Ratio: 1.5 2.6 0.9 0.9
Average Water Savings (ML/a): 18.3 75.4 99.6 123.8
Note: The water conservation measures description and the model assumptions to calculate their
water saving and benefit/cost ratio are provided in Table 20 below.
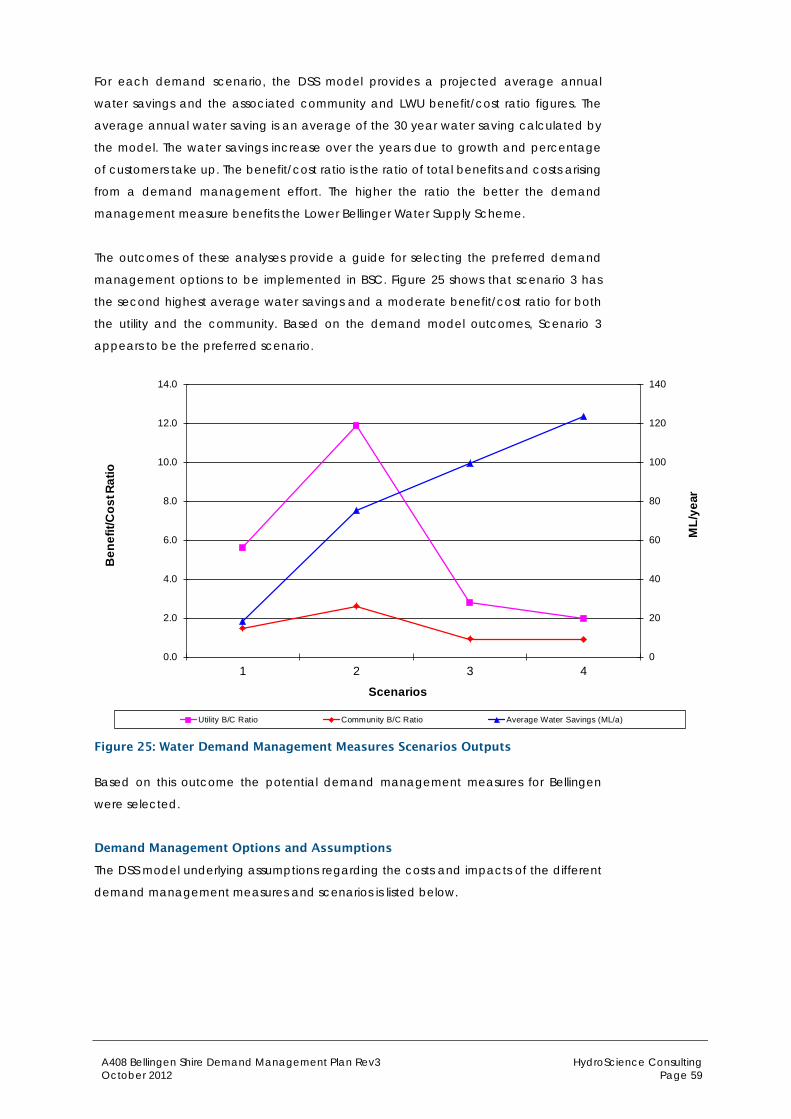
A408 Bellingen Shire Demand Management Plan Rev3 HydroScience Consulting October 2012 Page 59
For each demand scenario, the DSS model provides a projected average annual
water savings and the associated community and LWU benefit/cost ratio figures. The
average annual water saving is an average of the 30 year water saving calculated by
the model. The water savings increase over the years due to growth and percentage
of customers take up. The benefit/cost ratio is the ratio of total benefits and costs arising
from a demand management effort. The higher the ratio the better the demand
management measure benefits the Lower Bellinger Water Supply Scheme.
The outcomes of these analyses provide a guide for selecting the preferred demand
management options to be implemented in BSC. Figure 25 shows that scenario 3 has
the second highest average water savings and a moderate benefit/cost ratio for both
the utility and the community. Based on the demand model outcomes, Scenario 3
appears to be the preferred scenario.
0
20
40
60
80
100
120
140
0.0
2.0
4.0
6.0
8.0
10.0
12.0
14.0
1 2 3 4
ML/
year
Ben
efit/
Cos
t Rat
io
Scenarios
Utility B/C Ratio Community B/C Ratio Average Water Savings (ML/a)
Figure 25: Water Demand Management Measures Scenarios Outputs
Based on this outcome the potential demand management measures for Bellingen
were selected.
Demand Management Options and Assumptions
The DSS model underlying assumptions regarding the costs and impacts of the different
demand management measures and scenarios is listed below.

A408 Bellingen Shire Demand Management Plan Rev3 HydroScience Consulting October 2012 Page 60
Table 20: Demand Management Options and Assumptions
Description Assumed Market
Penetration Assumed Potable
Water Saving Assumed Implementation
Costs
Community Education
Council provides materials, training and technical assistance to implement a comprehensive on going communication program.
It is assumed that 20% of existing customers in each customer category are influenced by the community education effort.
On-going program. (Note: It is assumed that new customers are likely to be subject to BASIX)
Water saving vary dependent on the customer category and end use.
Expected savings from non-residential is 10%.
Costs to utility:
Set up (year 1): $10,000 plus 20 cents for each person in the supply area
Annual administration (from year 1): $3000 plus 5 cents for each person in the supply area
Permanent Low Level Restrictions on Water Use
The LWU would introduce a water waste regulation that would:
Prohibit irrigation during the times of the day with the highest evaporation
Mandate the use of a trigger nozzle when washing cars
Prohibit irrigation that fell on hard surfaces or hosing down of footpaths or driveways
It is assumed that 50% of all customers would adhere to the regulation.
On-going program
20% reduction in external use
The model assumes the following costs:
Setup (year 1): $10,000 plus 20 cents for each person in the supply area
Annual administration and enforcement (from year 1): $2000 plus 5 cents for each person in the supply area
Conservation Pricing for Residential Users
Council would introduce an inclining block tariff for single family residential customers. The increase would result in an effective 50% increase in price for residential external use and no change in price for internal use.
All residential customers would be affected.
Price elasticity for external use is assumed to be -0.2 and for internal use is -0.05.
Expected reduction of:
2% from internal use
10% from external use
Cost to LWU:
Set up: $5,000 plus 20 cents for each person in the supply area
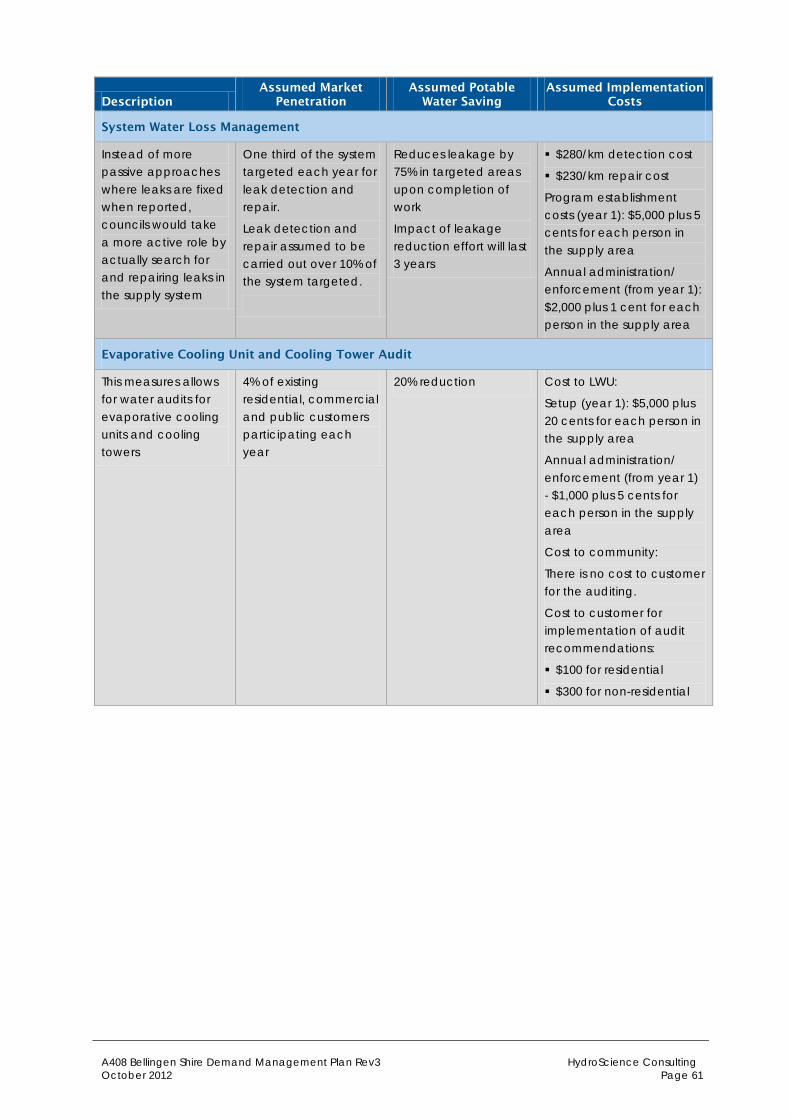
A408 Bellingen Shire Demand Management Plan Rev3 HydroScience Consulting October 2012 Page 61
Description Assumed Market
Penetration Assumed Potable
Water Saving Assumed Implementation
Costs
System Water Loss Management
Instead of more passive approaches where leaks are fixed when reported, councils would take a more active role by actually search for and repairing leaks in the supply system
One third of the system targeted each year for leak detection and repair.
Leak detection and repair assumed to be carried out over 10% of the system targeted.
Reduces leakage by 75% in targeted areas upon completion of work
Impact of leakage reduction effort will last 3 years
$280/km detection cost
$230/km repair cost
Program establishment costs (year 1): $5,000 plus 5 cents for each person in the supply area
Annual administration/ enforcement (from year 1): $2,000 plus 1 cent for each person in the supply area
Evaporative Cooling Unit and Cooling Tower Audit
This measures allows for water audits for evaporative cooling units and cooling towers
4% of existing residential, commercial and public customers participating each year
20% reduction Cost to LWU:
Setup (year 1): $5,000 plus 20 cents for each person in the supply area
Annual administration/ enforcement (from year 1) - $1,000 plus 5 cents for each person in the supply area
Cost to community:
There is no cost to customer for the auditing.
Cost to customer for implementation of audit recommendations:
$100 for residential
$300 for non-residential
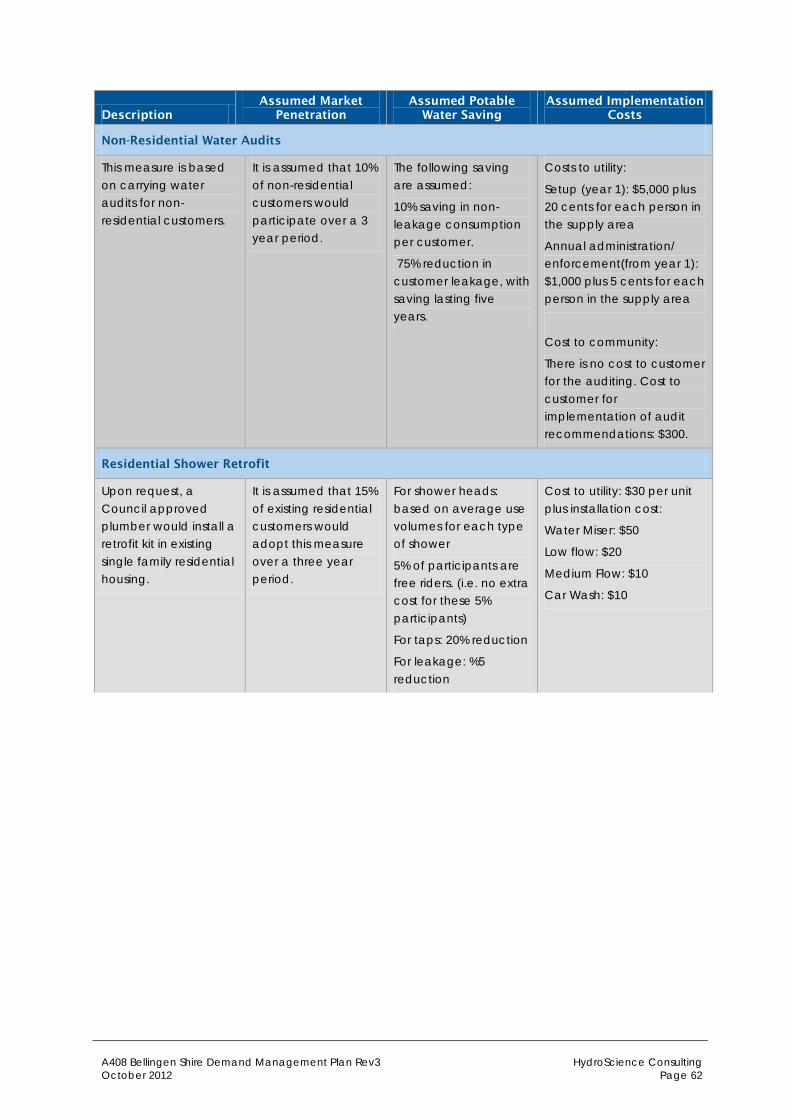
A408 Bellingen Shire Demand Management Plan Rev3 HydroScience Consulting October 2012 Page 62
Description Assumed Market
Penetration Assumed Potable
Water Saving Assumed Implementation
Costs
Non-Residential Water Audits
This measure is based on carrying water audits for non-residential customers.
It is assumed that 10% of non-residential customers would participate over a 3 year period.
The following saving are assumed:
10% saving in non-leakage consumption per customer.
75% reduction in customer leakage, with saving lasting five years.
Costs to utility:
Setup (year 1): $5,000 plus 20 cents for each person in the supply area
Annual administration/ enforcement(from year 1): $1,000 plus 5 cents for each person in the supply area
Cost to community:
There is no cost to customer for the auditing. Cost to customer for implementation of audit recommendations: $300.
Residential Shower Retrofit
Upon request, a Council approved plumber would install a retrofit kit in existing single family residential housing.
It is assumed that 15% of existing residential customers would adopt this measure over a three year period.
For shower heads: based on average use volumes for each type of shower
5% of participants are free riders. (i.e. no extra cost for these 5% participants)
For taps: 20% reduction
For leakage: %5 reduction
Cost to utility: $30 per unit plus installation cost:
Water Miser: $50
Low flow: $20
Medium Flow: $10
Car Wash: $10

A408 Bellingen Shire Demand Management Plan Rev3 HydroScience Consulting October 2012 Page 63
Description Assumed Market
Penetration Assumed Potable
Water Saving Assumed Implementation
Costs
Residential Washing Machine Rebate
This option is based on a residential rebate to convert to efficient 4 star washing machines.
The model assumes that approximately 15% of residential customers would take up the washing machine rebate scheme over a three year period.
Based on average use volumes for each type of washing machine. 5% of participants are free riders (i.e. no extra cost for these 5% participants)
Cost per unit (approximately 52% is utility cost): Convert inefficient top loader to efficient top loader - $350 Convert inefficient top loader to front loader - $120 Convert inefficient top loader to efficient front loader - $350 Convert efficient top loader to front loader - $120 Convert efficient top loader to efficient front loader - $350 Convert front loader to efficient front loader - $350 Extra cost to community; Installation cost: Efficient front loader: $1000/unit Front loader: $900/unit Efficient top loader: $700/unit
Fixture Code - Taps and Showers - New Development (BASIX)
New development will install the kit which contains a low-flow shower head and a tap flow restrictor.
It is assumed that 90% of new residential customers would adopt this measure.
On-going program
For shower heads: Based on average use volumes for each type of shower, with 5% of participants in the program are free riders.
For taps: 20% reduction in Taps/Sink uses per account
For leakage: 5% reduction lasting for 5 years
Cost to utility:
Setup: $10,000 plus 20 cents for each person in the supply area;
Annual administration (from year 1): $3000 plus 5 cents for each person in the supply area
Cost to community:
For showerhead: $30/unit + installation cost: (water miser: $50; low flow: $20; medium flow:$10 and car wash:$10)
For Taps: $10/unit (assume 4 units per household) (100% cost to customer)

A408 Bellingen Shire Demand Management Plan Rev3 HydroScience Consulting October 2012 Page 64
Description Assumed Market
Penetration Assumed Potable
Water Saving Assumed Implementation
Costs
Rainwater Tanks for all New Residential Development
All new residential development would fit a rainwater tank. Rainwater to be supplied for toilet flushing, cold water to the washing machine and outdoor use.
100% of new residential customers
60% reduction for toilets and external use and 45% reduction for washing machine in targeted water uses under average conditions
Costs to utility: Setup: $10,000 plus 20 cents for each person in the supply area. Annual administration (from year 1): $3,000 plus 5 cents for each person in the supply area. Tank cost & installation: local rainwater tank cost (Utility and customer pay 50% of the installation cost). Cost to community: $30 per year per customer for operation
Dual Reticulation for all New Residential Development
All new subdivisions will be fitted with dual reticulation system with recycled water to be used for toilet flushing and irrigation
90% of all new residential developments (assume 10% are infill and therefore not suitable for supply with dual reticulation)
100% reduction in targeted end uses
Costs to utility: Setup: $10,000 plus 20 cents for each person in the supply area. Annual administration (from year 1): $3,000 plus 5 cents for each person in the supply area. Utility and customer pay 50% of the installation cost: $3,000 net per account for additional costs of dual reticulation
BASIX - Fixture Efficiency & Rainwater Tanks or Fixture Efficiency & Dual Reticulation
The NSW Government’s BASIX (Building Sustainability Index) program has been implemented throughout
NSW. In terms of impact on water demand, BASIX requires, as a minimum, all new dwellings to have
water efficient fittings and either a rainwater tank or access to recycled water (dual reticulation).
The assumptions used are a combination of the assumptions described above and listed below:
• Fixture Code – Taps and Showers and Rainwater Tanks for all New Residential Developments or
• Fixture Code – Taps and Showers and Dual Reticulation for all New Residential Developments

A408 Bellingen Shire Demand Management Plan Rev3 HydroScience Consulting October 2012 Page 65
Description Assumed Market
Penetration Assumed Potable
Water Saving Assumed Implementation
Costs
National Mandatory Water Efficiency Labelling Scheme (WELS)
2005 saw the introduction of a mandatory Water Efficiency Labelling Scheme (WELS) for washing machines, shower, taps and dishwashers.
This measure assumes the following uptake:
efficient washing machines by 15% of customers over 3 years
low flow showerheads by 15% over 3 years
taps and dishwashers: 5% of new accounts and 1% of existing accounts
On-going program
The calculation is based on average use reductions of:
20% for taps
20% for dishwashers
30% for washing machines
30% for efficient showerheads
Costs to utility to enhance and promote scheme for three years:
Setup: $3000 plus 20 cents for each person in the supply area
Annual administration cost (from year 1 for 30 years): $500 plus 5 cents for each person in the supply area.
Utility also provides rebates to cover part of the cost of the washing machine:
same costs as per implementing Residential Washing Machines Rebate program

A408 Bellingen Shire Demand Management Plan Rev3 HydroScience Consulting October 2012 Page 66
Appendix C
Rainwater Tank Assessment Input Data and Methodology
A408 Bellingen Shire Demand Management Plan Rev3 HydroScience Consulting October 2012 Page 67
Introduction
This rainwater tank assessment has been prepared using the Rainwater Tank Model
provided by NSW Office of Water. The rainwater tank model calculates the benefits to
water usage and water bill savings per residential household. It assumes that a
rainwater tank provides potable water substitution. The model uses historical climate
data (from the last 20 years) to forecast the likely water savings under simulated
climate variability. This model provides a generic assessment of the benefits of
rainwater tanks as a source of water.
A rainwater tank analysis was undertaken for the Lower Bellinger water supply scheme,
as a representative location within the Shire; however it could be applied to other
localities in the Bellingen Shire.
Input Data and Assumptions
The input data is shown in the model calculation sheet provided below. The 20 years of
climate data is sourced from the Bureau of Meteorology SILO services. The climate
data was recorded in the vicinity of Bellingen town, at latitude and longitude 30.45°S
and 152.90°E respectively. Where no data was available, the typical (default) value of
the model has been used.
The local costs of rainwater tanks (see Table 21) were taken from quotations provided
by Bellingen local rainwater tank suppliers.
Council advised that the estimated current rainwater tanks take up in the Shire is
approximately 5% of the existing customers. This is an assumption made by Council
staff through observation; there is no study data on the actual number of rainwater
tanks currently used within the serviced area.
The annual average outside usage per household (526 L/d) was calculated from the
Bellingen town 2011 annual demand records. It is known that in 2011. Under the
conditions of large amount of rainfall, this would lead to the following considerations;
The existing rainwater tanks were expected to be full. Therefore reducing
potable water consumption.
External consumption would be expected to be reduced. In the long term the
526 L/d per household figure could be an under estimate.
The higher the outside usage the higher the benefits of installing rainwater tank
(in wet years). However during drought or periods of low rainfall it is likely that
the rainwater tanks won’t be full.
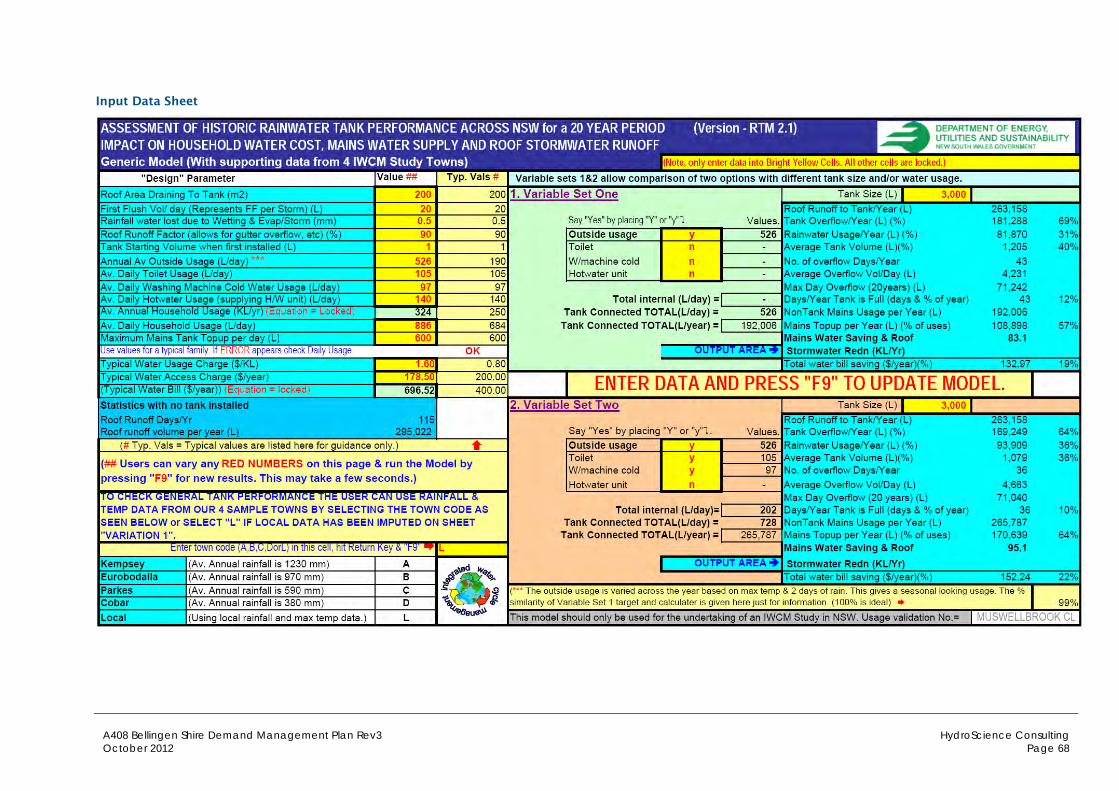
A408 Bellingen Shire Demand Management Plan Rev3 HydroScience Consulting October 2012 Page 68
Input Data Sheet
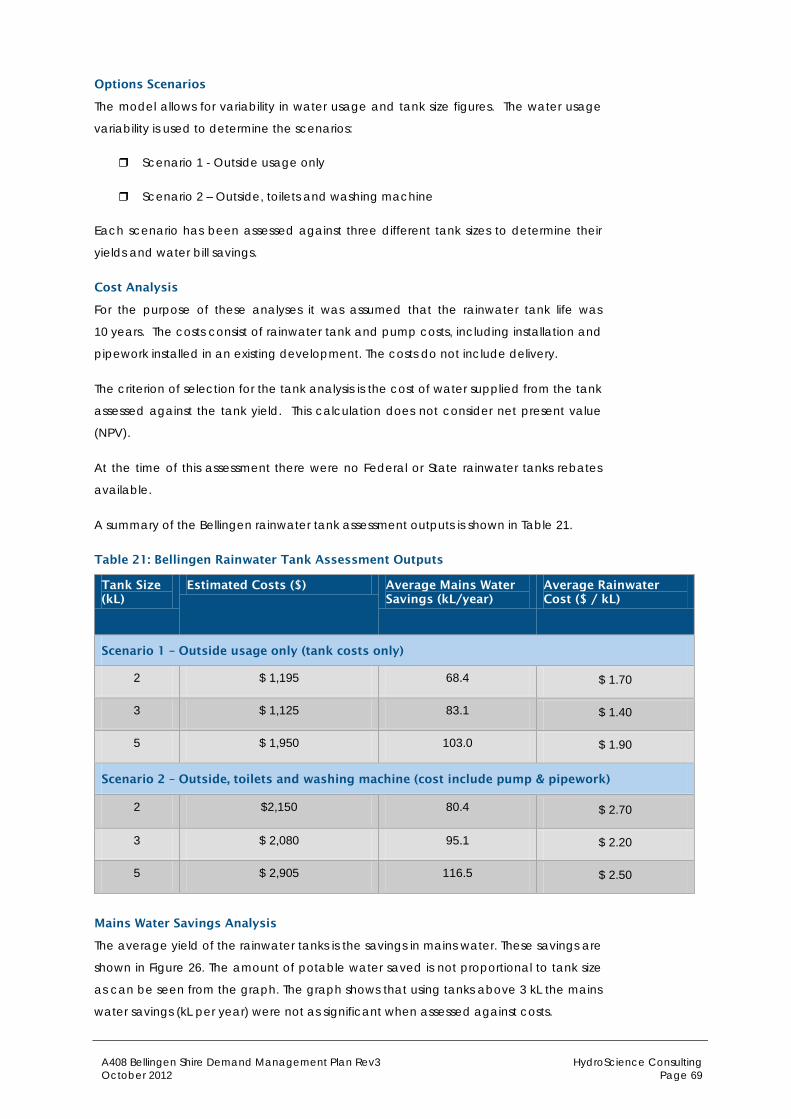
A408 Bellingen Shire Demand Management Plan Rev3 HydroScience Consulting October 2012 Page 69
Options Scenarios
The model allows for variability in water usage and tank size figures. The water usage
variability is used to determine the scenarios:
Scenario 1 - Outside usage only
Scenario 2 – Outside, toilets and washing machine
Each scenario has been assessed against three different tank sizes to determine their
yields and water bill savings.
Cost Analysis
For the purpose of these analyses it was assumed that the rainwater tank life was
10 years. The costs consist of rainwater tank and pump costs, including installation and
pipework installed in an existing development. The costs do not include delivery.
The criterion of selection for the tank analysis is the cost of water supplied from the tank
assessed against the tank yield. This calculation does not consider net present value
(NPV).
At the time of this assessment there were no Federal or State rainwater tanks rebates
available.
A summary of the Bellingen rainwater tank assessment outputs is shown in Table 21.
Table 21: Bellingen Rainwater Tank Assessment Outputs
Tank Size (kL)
Estimated Costs ($) Average Mains Water Savings (kL/year)
Average Rainwater Cost ($ / kL)
Scenario 1 – Outside usage only (tank costs only)
2 $ 1,195 68.4 $ 1.70
3 $ 1,125 83.1 $ 1.40
5 $ 1,950 103.0 $ 1.90
Scenario 2 – Outside, toilets and washing machine (cost include pump & pipework)
2 $2,150 80.4 $ 2.70
3 $ 2,080 95.1 $ 2.20
5 $ 2,905 116.5 $ 2.50
Mains Water Savings Analysis
The average yield of the rainwater tanks is the savings in mains water. These savings are
shown in Figure 26. The amount of potable water saved is not proportional to tank size
as can be seen from the graph. The graph shows that using tanks above 3 kL the mains
water savings (kL per year) were not as significant when assessed against costs.
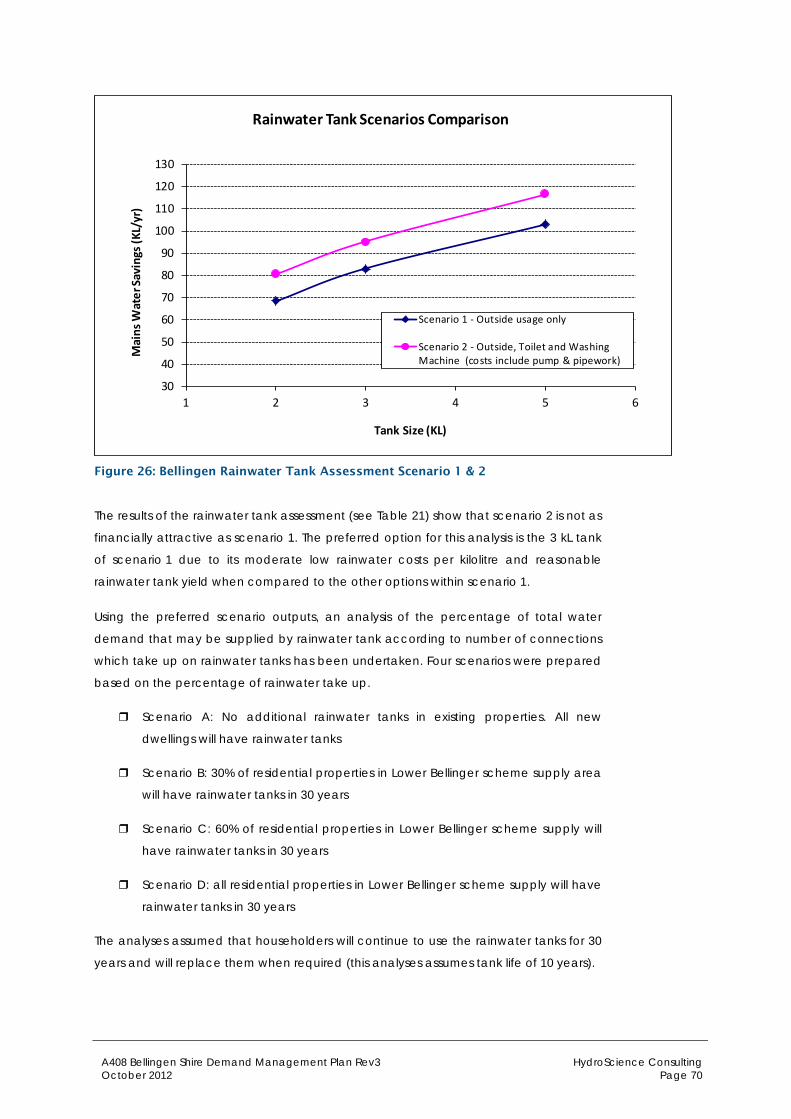
A408 Bellingen Shire Demand Management Plan Rev3 HydroScience Consulting October 2012 Page 70
30
40
50
60
70
80
90
100
110
120
130
1 2 3 4 5 6
Mai
ns W
ater
Savi
ngs (
KL/y
r)
Tank Size (KL)
Rainwater Tank Scenarios Comparison
Scenario 1 - Outside usage only
Scenario 2 - Outside, Toilet and WashingMachine (costs include pump & pipework)
Figure 26: Bellingen Rainwater Tank Assessment Scenario 1 & 2
The results of the rainwater tank assessment (see Table 21) show that scenario 2 is not as
financially attractive as scenario 1. The preferred option for this analysis is the 3 kL tank
of scenario 1 due to its moderate low rainwater costs per kilolitre and reasonable
rainwater tank yield when compared to the other options within scenario 1.
Using the preferred scenario outputs, an analysis of the percentage of total water
demand that may be supplied by rainwater tank according to number of connections
which take up on rainwater tanks has been undertaken. Four scenarios were prepared
based on the percentage of rainwater take up.
Scenario A: No additional rainwater tanks in existing properties. All new
dwellings will have rainwater tanks
Scenario B: 30% of residential properties in Lower Bellinger scheme supply area
will have rainwater tanks in 30 years
Scenario C: 60% of residential properties in Lower Bellinger scheme supply will
have rainwater tanks in 30 years
Scenario D: all residential properties in Lower Bellinger scheme supply will have
rainwater tanks in 30 years
The analyses assumed that householders will continue to use the rainwater tanks for 30
years and will replace them when required (this analyses assumes tank life of 10 years).
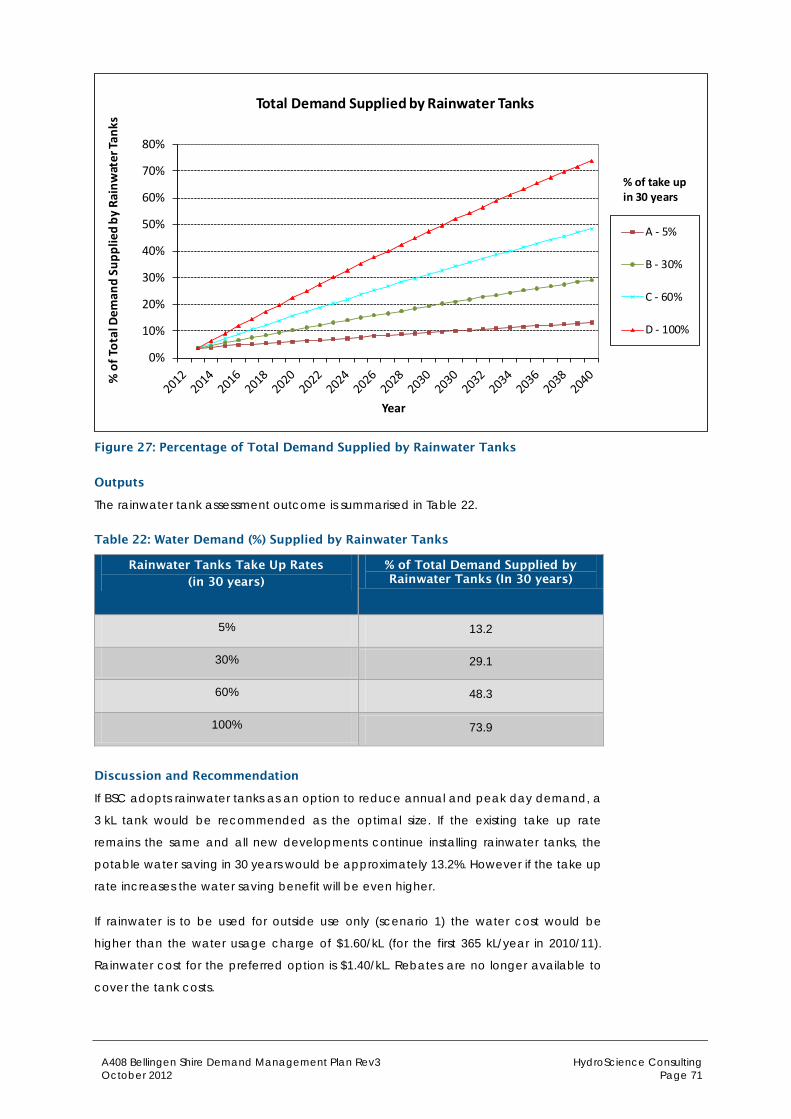
A408 Bellingen Shire Demand Management Plan Rev3 HydroScience Consulting October 2012 Page 71
0%
10%
20%
30%
40%
50%
60%
70%
80%
% o
f Tot
al D
eman
d Su
pplie
d by
Rai
nwat
er Ta
nks
Year
Total Demand Supplied by Rainwater Tanks
A - 5%
B - 30%
C - 60%
D - 100%
% of take up in 30 years
Figure 27: Percentage of Total Demand Supplied by Rainwater Tanks
Outputs
The rainwater tank assessment outcome is summarised in Table 22.
Table 22: Water Demand (%) Supplied by Rainwater Tanks
Rainwater Tanks Take Up Rates (in 30 years)
% of Total Demand Supplied by Rainwater Tanks (In 30 years)
5% 13.2
30% 29.1
60% 48.3
100% 73.9
Discussion and Recommendation
If BSC adopts rainwater tanks as an option to reduce annual and peak day demand, a
3 kL tank would be recommended as the optimal size. If the existing take up rate
remains the same and all new developments continue installing rainwater tanks, the
potable water saving in 30 years would be approximately 13.2%. However if the take up
rate increases the water saving benefit will be even higher.
If rainwater is to be used for outside use only (scenario 1) the water cost would be
higher than the water usage charge of $1.60/kL (for the first 365 kL/year in 2010/11).
Rainwater cost for the preferred option is $1.40/kL. Rebates are no longer available to
cover the tank costs.

A408 Bellingen Shire Demand Management Plan Rev3 HydroScience Consulting October 2012 Page 72
Should Council consider the water savings of the preferred scenario an advantage for
the water supply scheme, Council may consider providing extra support to the
households to ensure the rainwater tank take up rate remains the same or increase.
Such extra support may include:
Provide rebates
Identifying other rainwater tank suppliers in the area which could provide a
competitive price
Promoting the installation and use of rainwater tanks
Based on the CSIRO report (see section 4.1), the change in rainfall will affect the yield
of rainwater tanks. This will impact the output of the analysis.
Based in Sydney and Byron Bay, HydroScience Consulting (HSc) is an Australian consultancy
dedicated to serving the water industry in Australia.
HSc provides planning and design services to public and private sector clients throughout Australia.
We are committed to developing strong client relationships that become the foundation for
understanding our clients’ needs and exceeding their expectations.
Byron Bay
Unit 6
64 Centennial Circuit
Byron Bay, NSW, 2481
Tel: 02 6639 5600
Fax: 02 6680 9319
Sydney
Level 1
189 Kent Street
Sydney, NSW, 2000
Tel: 02 9249 5100
Fax: 02 9251 4011
Email: [email protected]