dell openmanage power center 3.0 user...
TRANSCRIPT
Dell OpenManage Power Center 3.0User Guide

Notes, Cautions, and WarningsNOTE: A NOTE indicates important information that helps you make better use of your computer.
CAUTION: A CAUTION indicates either potential damage to hardware or loss of data and tells you how to avoid the problem.
WARNING: A WARNING indicates a potential for property damage, personal injury, or death.
Copyright © 2014 Dell Inc. All rights reserved. This product is protected by U.S. and international copyright and intellectual property laws. Dell™ and the Dell logo are trademarks of Dell Inc. in the United States and/or other jurisdictions. All other marks and names mentioned herein may be trademarks of their respective companies.
2014 - 09
Rev. A00
Contents
1 Overview.................................................................................................................9Key features........................................................................................................................................... 9
Topology..............................................................................................................................................10
System requirements........................................................................................................................... 11
Hardware and software requirements for the server system.......................................................11
Hardware and software requirements for devices....................................................................... 12
2 Getting started.................................................................................................... 14Management console introduction.................................................................................................... 14
Home page.......................................................................................................................................... 16
Events............................................................................................................................................. 16
Events (Top 5 Groups)................................................................................................................... 16
Devices Discovered [Total: <number>].........................................................................................17
Energy Consumers (Top 5 Groups) [kwh].....................................................................................17
Peak Power Consumed................................................................................................................. 17
Top Offenders................................................................................................................................ 17
Underutilized Racks....................................................................................................................... 17
Top 10 (Most Recent) Critical and Warning Events...................................................................... 17
Common use cases............................................................................................................................. 17
Supported and unsupported devices................................................................................................. 18
3 Installing, uninstalling, and launching Power Center................................. 22Installing, uninstalling, launching, and upgrading Power Center in Windows................................. 22
Installing OpenManage Power Center on a Windows Server..................................................... 22
Installed directories in Windows...................................................................................................23
Power Center services in Windows..............................................................................................24
Upgrading in Windows..................................................................................................................24
Uninstalling OpenManage Power Center in Windows................................................................ 25
Launching OpenManage Power Center in Windows.................................................................. 25
Configuring Enhanced Security Configuration for Internet Explorer......................................... 25
Installing, uninstalling, launching, and upgrading Power Center in Linux........................................26
Installing Power Center on a Linux server....................................................................................26
Installed directories in Linux..........................................................................................................27
Power Center services in Linux.................................................................................................... 28
Uninstalling Power Center in Linux.............................................................................................. 28
Launching Power Center in Linux................................................................................................ 28
4 Command line interface................................................................................... 29
Command line interface error handling............................................................................................ 29
Command line interface commands................................................................................................. 30
help................................................................................................................................................ 30
add_profile.................................................................................................................................... 30
update_profile................................................................................................................................31
add_device.....................................................................................................................................31
update_device............................................................................................................................... 32
rediscover_device......................................................................................................................... 32
remove_profile.............................................................................................................................. 32
delete_device................................................................................................................................ 32
add_group..................................................................................................................................... 33
delete_group................................................................................................................................. 33
update_group................................................................................................................................34
add_device_to_group...................................................................................................................34
remove_device_from_group........................................................................................................35
move_device................................................................................................................................. 35
move_group..................................................................................................................................36
add_group_to_group................................................................................................................... 36
List commands.............................................................................................................................. 37
list_device_props...........................................................................................................................37
list_devices.....................................................................................................................................37
list_group_props........................................................................................................................... 37
list_groups..................................................................................................................................... 38
list_report_groups.........................................................................................................................38
list_reports.....................................................................................................................................38
run_report..................................................................................................................................... 38
discover_device.............................................................................................................................39
Command line interface error codes.................................................................................................39
5 Access control..................................................................................................... 41About authentication...........................................................................................................................41
Logging in............................................................................................................................................ 41
Logging in with a user name and password.................................................................................41
Logging in with Single Sign-on (SSO)...........................................................................................42
Multiple domain environment...................................................................................................... 44
Windows NT LAN Manager (NTLM) authentication limitation.................................................... 45
Logging out......................................................................................................................................... 45
Managing user roles and privileges.................................................................................................... 45
Adding a custom role....................................................................................................................45
Editing a role..................................................................................................................................46
Deleting a role...............................................................................................................................46
Privileges........................................................................................................................................46
Managing user accounts.................................................................................................................... 48
Adding a user account.................................................................................................................. 48
Adding a group account............................................................................................................... 49
Editing a user or group account...................................................................................................50
Deleting a user or group account................................................................................................ 50
Changing a user account password.............................................................................................50
Viewing current user information...................................................................................................... 50
6 Task management.............................................................................................. 52Discovery tasks....................................................................................................................................52
Creating discovery tasks............................................................................................................... 53
Viewing devices in a chassis......................................................................................................... 54
Re-running recent discovery tasks...............................................................................................54
Power control tasks............................................................................................................................ 54
Creating power tasks.................................................................................................................... 54
Protocol profile................................................................................................................................... 55
Adding a protocol..........................................................................................................................56
Editing a protocol.......................................................................................................................... 57
Deleting a protocol........................................................................................................................57
7 Device Management.......................................................................................... 58Adding a new device...........................................................................................................................58
Adding an existing group.................................................................................................................... 59
Adding a device from the network.....................................................................................................59
Filtering devices...................................................................................................................................59
Editing a device....................................................................................................................................61
Deleting devices using a filter............................................................................................................. 61
Sorting devices....................................................................................................................................62
Managing groups................................................................................................................................ 62
Mapping Group Structure Information.........................................................................................62
Creating a new group................................................................................................................... 63
Moving device groups or devices.................................................................................................63
Managing Racks............................................................................................................................ 64
Deleting a group............................................................................................................................66
Emergency Power Reduction.......................................................................................................66
8 Power Monitoring.............................................................................................. 68Power monitoring levels.....................................................................................................................68
Power thresholds................................................................................................................................ 68
Viewing power details.........................................................................................................................69
Power details for the current time window................................................................................. 69
Power details for a different time window...................................................................................69
Power details for racks..................................................................................................................70
Viewing Energy Consumption............................................................................................................70
Viewing a power history graph............................................................................................................71
Monitoring PDU Power....................................................................................................................... 72
Monitoring UPS Power........................................................................................................................72
9 Temperature Monitoring...................................................................................73Temperature Monitoring Level........................................................................................................... 73
Viewing Temperature Details..............................................................................................................73
Temperature Details for the Current Time Window.................................................................... 73
Temperature Details for a Different Time Window......................................................................74
Chassis Details............................................................................................................................... 74
Viewing a temperature history graph................................................................................................. 75
Monitoring the Temperature of the Chassis/Blade Server................................................................ 75
Applying circuit breaker limits to chassis........................................................................................... 75
Monitoring the Temperature of Devices/Groups.............................................................................. 76
10 Policies................................................................................................................77Dynamic power caps...........................................................................................................................77
Power Policy Capabilities....................................................................................................................78
Scenario 1 — The license expires or is not imported...................................................................78
Scenario 2 — You try to import a license on a device without a license imported....................79
Upgrading Device Power Policy Capability........................................................................................79
Creating a new policy......................................................................................................................... 79
Policy Priority Levels........................................................................................................................... 80
Policy Modes....................................................................................................................................... 81
Enabling or disabling a power policy..................................................................................................81
Viewing policies in the power details graph.......................................................................................81
Editing a power policy.........................................................................................................................81
Deleting a power policy......................................................................................................................82
Filtering power policies.......................................................................................................................82
11 Managing reports..............................................................................................83Viewing Report Details........................................................................................................................84
Creating reports.................................................................................................................................. 84
Editing reports.....................................................................................................................................85
Deleting reports.................................................................................................................................. 85
Adding report groups..........................................................................................................................86
Editing report groups..........................................................................................................................86
Deleting report groups....................................................................................................................... 86
12 Event Management...........................................................................................87
Pre-defined events..............................................................................................................................87
Custom events.................................................................................................................................... 90
Application log events.........................................................................................................................91
Supported PDU and UPS events.........................................................................................................92
Event severity levels............................................................................................................................ 93
Viewing events.................................................................................................................................... 93
Sorting events..................................................................................................................................... 94
Adding comments to events.............................................................................................................. 94
Deleting events................................................................................................................................... 94
Filtering events.................................................................................................................................... 95
Sending test events from an IPMI device...........................................................................................96
13 Security...............................................................................................................98Starting Services with a Windows operating system standard user account...................................98
Operating system hardening.............................................................................................................. 99
Audit log.............................................................................................................................................. 99
Managing certificates........................................................................................................................100
14 Configuring settings...................................................................................... 102General settings................................................................................................................................ 102
Configuring console session timeout........................................................................................ 102
Setting protocol timeout periods............................................................................................... 102
Monitoring settings........................................................................................................................... 103
Recommended sampling intervals for performance tuning and scaling................................. 103
When are the settings effective?................................................................................................ 103
Configuring the power and temperature sampling intervals.................................................... 104
Configuring the power and temperature monitoring units...................................................... 104
Configuring energy consumption cost settings........................................................................ 104
Database policy settings................................................................................................................... 104
Setting or editing the database policy........................................................................................105
Directory............................................................................................................................................105
Editing directory settings.............................................................................................................107
Viewing directory settings.......................................................................................................... 108
Alerts..................................................................................................................................................108
Setting SNMP traps......................................................................................................................108
Sending SNMP traps to a Third-Party Application..................................................................... 109
Editing email alert settings..........................................................................................................109
Viewing alert forward settings.....................................................................................................110
Editing SMTP settings........................................................................................................................ 110
Licensing............................................................................................................................................ 110
Importing a License..................................................................................................................... 110
Inventory.............................................................................................................................................111
Configuring inventory settings.................................................................................................... 111
15 Logs................................................................................................................... 112Sorting the logs display..................................................................................................................... 112
Setting the application log size......................................................................................................... 112
16 Backup and recovery......................................................................................113Power Center data files for backup and recovery............................................................................113
Backing up Power Center data......................................................................................................... 113
Recovering Power Center data.........................................................................................................114
17 Troubleshooting............................................................................................. 116Why am I being required to log in more than once by Power Center?..........................................116
Why can’t I access the Power Center management console from a Web browser, even
though the Power Center server is running normally?....................................................................116
Why was I automatically logged out of Power Center?.................................................................. 116
Why did my connection to Dell iDRAC6 devices (Dell PowerEdge Servers) fail, when the
network connection status is Connected?.......................................................................................117
Why can’t Power Center receive events sent from devices?...........................................................117
Why are previously-existing power policies (including EPR) still effective on devices when
Power Center is corrupted or has been uninstalled?.......................................................................117
Why do I see the PostgreSQL error log "FATAL: terminating connection due to administrator
command" in the Windows event log?.............................................................................................118
Why I can’t open power center login page when I access it through Firefox 31?..........................118
Why I encounter an error, “An internal error occurred. Contact Dell support for help:
subordinate error code: 0x8f0c1301”, the Home page when OpenManage Power Center
server is installed on SUSE Linux Enterprise Server 11 SP2?.............................................................119
Why do I encounter a network exception while adding a LDAP user?........................................... 119
Why do I encounter a network exception while adding a chassis to a group?.............................. 119
In the compare report, why is the average power value of a device different when the
service is stopped for a few hours?.................................................................................................. 119
Why is the “policy return to normal” event not displayed when the only device in the Chassis
Management Controller (CMC) is deleted?..................................................................................... 120
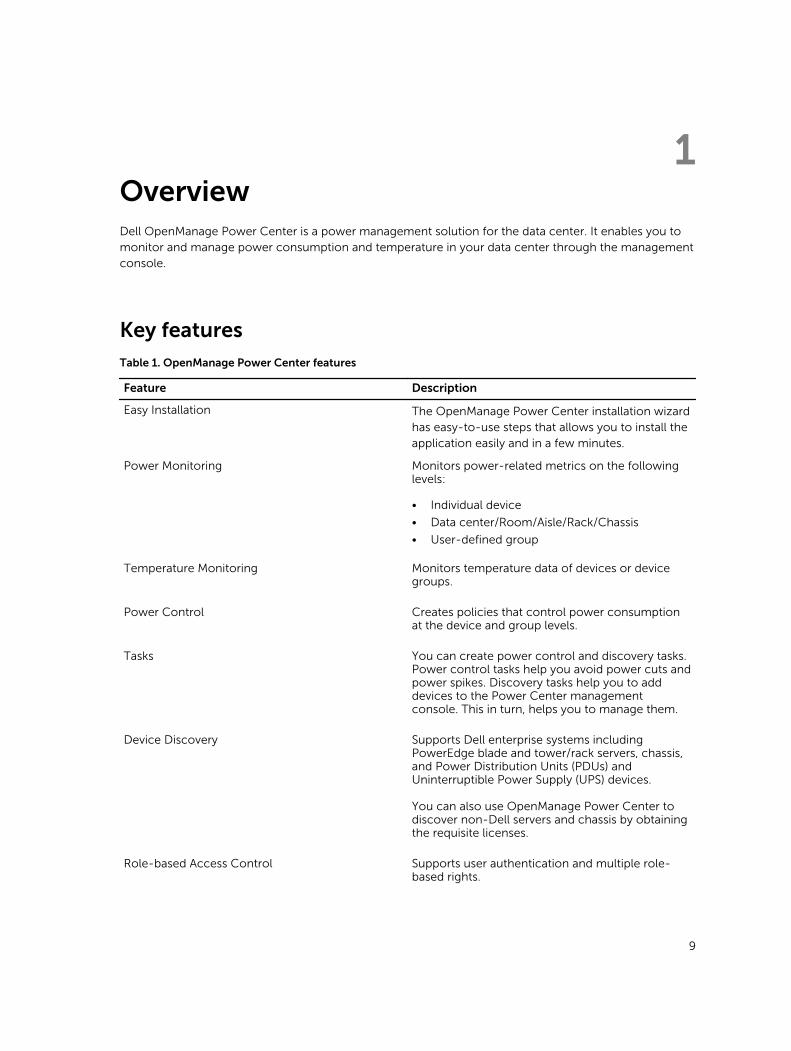
1OverviewDell OpenManage Power Center is a power management solution for the data center. It enables you to monitor and manage power consumption and temperature in your data center through the management console.
Key featuresTable 1. OpenManage Power Center features
Feature Description
Easy Installation The OpenManage Power Center installation wizard has easy-to-use steps that allows you to install the application easily and in a few minutes.
Power Monitoring Monitors power-related metrics on the following levels:
• Individual device
• Data center/Room/Aisle/Rack/Chassis
• User-defined group
Temperature Monitoring Monitors temperature data of devices or device groups.
Power Control Creates policies that control power consumption at the device and group levels.
Tasks You can create power control and discovery tasks. Power control tasks help you avoid power cuts and power spikes. Discovery tasks help you to add devices to the Power Center management console. This in turn, helps you to manage them.
Device Discovery Supports Dell enterprise systems including PowerEdge blade and tower/rack servers, chassis, and Power Distribution Units (PDUs) and Uninterruptible Power Supply (UPS) devices.
You can also use OpenManage Power Center to discover non-Dell servers and chassis by obtaining the requisite licenses.
Role-based Access Control Supports user authentication and multiple role-based rights.
9
Feature Description
Event Management Allows you to monitor and manage device and group events.
Report Management Allows you to generate reports for inventory and monitoring.
Stranded Power Information Stranded power, also known as headroom, is the excess power available for a device group. OpenManage Power Center helps you to calculate the stranded power for devices and device groups. The formula for calculating stranded power is:
Stranded Power(t) = Allocated Power(t) - Peak Power Consumption(t)where (t) is calculated as a function of time. You can specify a time range in the report. By default, (t) is the time range of monitored data.
Topology
The following figure shows how to use a web browser to access the Power Center server and manage the data center.
10
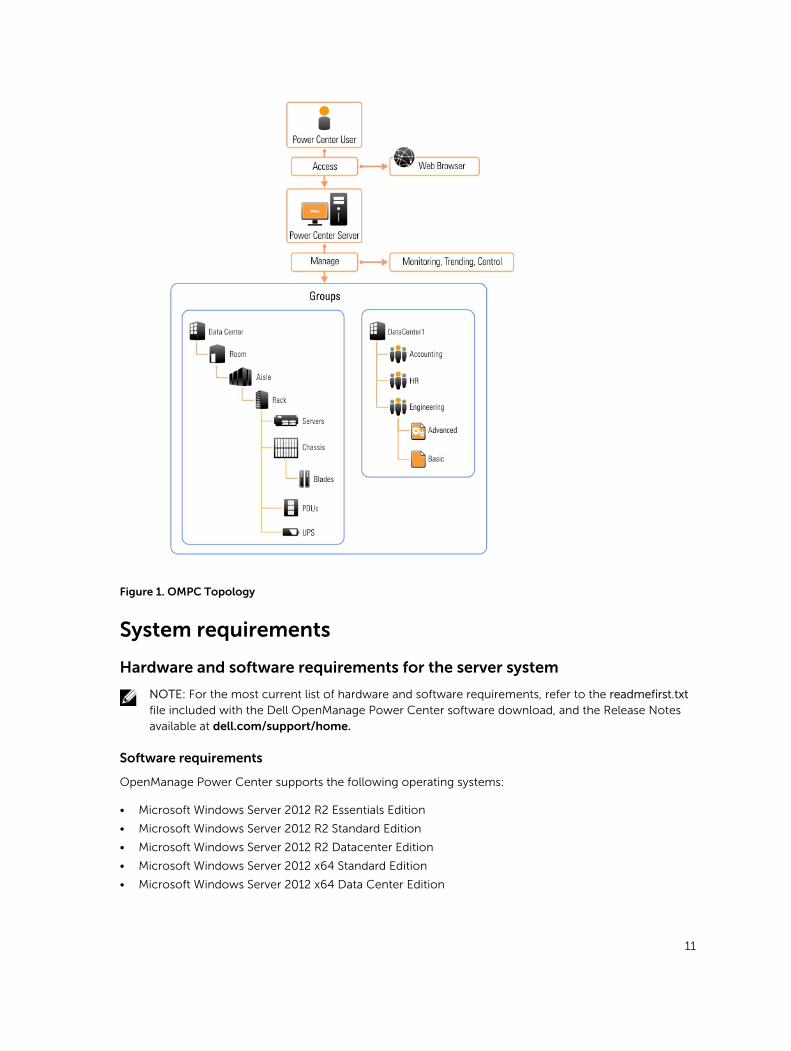
Figure 1. OMPC Topology
System requirements
Hardware and software requirements for the server system
NOTE: For the most current list of hardware and software requirements, refer to the readmefirst.txt file included with the Dell OpenManage Power Center software download, and the Release Notes available at dell.com/support/home.
Software requirements
OpenManage Power Center supports the following operating systems:
• Microsoft Windows Server 2012 R2 Essentials Edition
• Microsoft Windows Server 2012 R2 Standard Edition
• Microsoft Windows Server 2012 R2 Datacenter Edition
• Microsoft Windows Server 2012 x64 Standard Edition
• Microsoft Windows Server 2012 x64 Data Center Edition
11
• Microsoft Windows Server 2012 x64 Essential Edition
• Microsoft Windows Server 2008 x64 Enterprise Edition R2 SP1
• Microsoft Windows Server 2008 x64 Standard Edition R2 SP1
• Microsoft Windows Server 2011 x64 SBS
• Microsoft Windows 7 Professional and Enterprise
• Microsoft Windows 8 Professional and Enterprise (x64 recommended)
• Red Hat Enterprise Linux 5.10 x86_64
• Red Hat Enterprise Linux 6.4 x86_64
• Red Hat Enterprise Linux 6.5 x86_64
• Red Hat Enterprise Linux 7.0 x86_64
• SUSE Linux Enterprise Server 10 SP4 x86_64
• SUSE Linux Enterprise Server 11 SP2 x86_64
• SUSE Linux Enterprise Server 11 SP3 x86_64
OpenManage Power Center supports the following web browsers:
• Mozilla Firefox 30
• Microsoft Internet Explorer 10 and 11
The OpenManage Power Center installation includes the following major software tools:
• Sun Microsystems Java Runtime Environment (JRE) 7 Update 25
• Apache Tomcat application server 7.0.52
• PostgreSQL 8.3
Hardware requirements
You must install Power Center on a system with at least:
• A dual-core processor of 2.6Ghz or higher
• 4GB RAM
• 60GB free space of hard drive
• Gigabit bandwidth of network infrastructure
Hardware and software requirements for devices
• Managed servers must have an Integrated Dell Remote Access Controller (iDRAC) 6, 7, or 8. For iDRAC6, the latest version is recommended, for iDRAC7, the recommended version is 1.23.23 or later.
• Power Distribution Unit (PDU) and Uninterruptible Power Supply (UPS) devices must comply with the Management Information Base (MIB) the vendor provides through SNMP interface.
• Devices must provide exclusive access for Power Center because the policies set on the devices from other management software affect the Power Center power control function.
• The Baseboard Management Controller (BMC) user, through which Power Center communicates with devices, must be a local user account whose roles include Administrator. The device must be configured to allow the Administrator to use at least one of the cipher suite levels 0–3, and enable the IPMI over LAN setting.
• The WSman user, through which Power Center communicates with the chassis, must be a local user with the Administrator role. The chassis must be configured to enable the Web Server service.
• Chassis Management Controller (CMC) that supports all devices installed in your managed network.
12

NOTE: For a list of OpenManage Power Center-supported devices, see Supported devices and unsupported devices.
13
2Getting startedThis chapter introduces the Dell OpenManage Power Center management console, and presents several use cases that describe standard uses of OpenManage Power Center.
Management console introduction
To use Open Manage Power Center, you must open a Web browser and log in. The management console opens with a list of the available screens in the left navigation pane, and the currently-open screen in the right pane.
Table 2. Main OMPC Pages
Main Screen Available actions on the screen
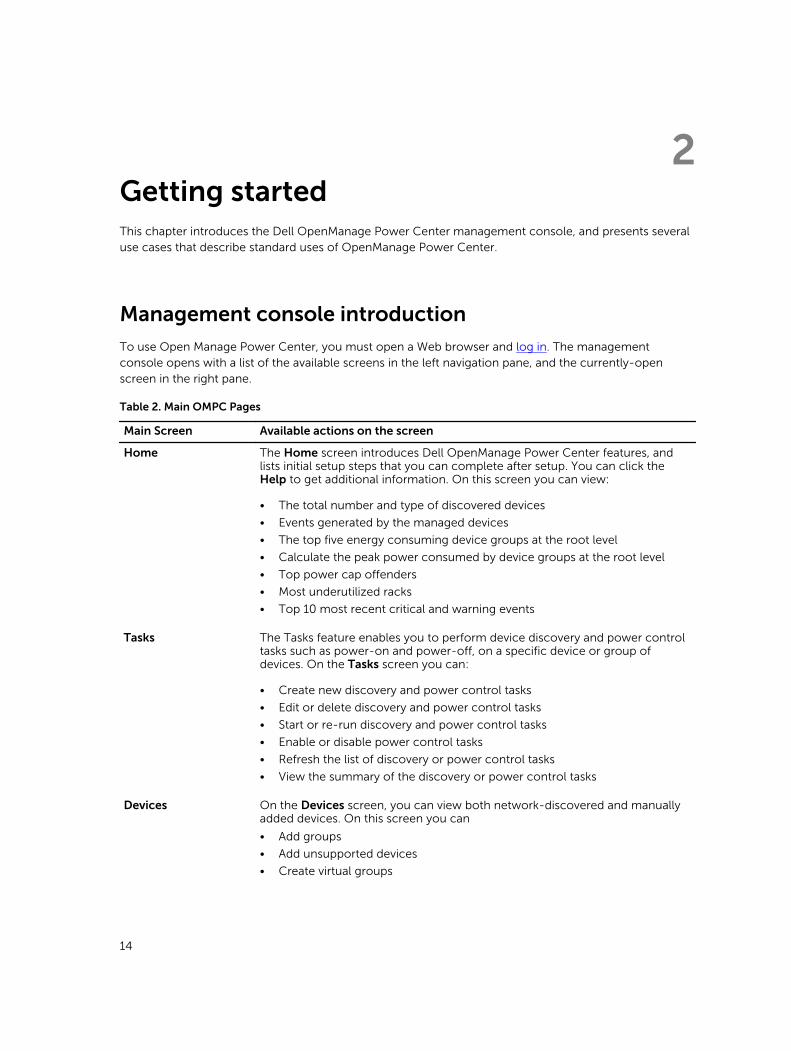
Home The Home screen introduces Dell OpenManage Power Center features, and lists initial setup steps that you can complete after setup. You can click the Help to get additional information. On this screen you can view:
• The total number and type of discovered devices
• Events generated by the managed devices
• The top five energy consuming device groups at the root level
• Calculate the peak power consumed by device groups at the root level
• Top power cap offenders
• Most underutilized racks
• Top 10 most recent critical and warning events
Tasks The Tasks feature enables you to perform device discovery and power control tasks such as power-on and power-off, on a specific device or group of devices. On the Tasks screen you can:
• Create new discovery and power control tasks
• Edit or delete discovery and power control tasks
• Start or re-run discovery and power control tasks
• Enable or disable power control tasks
• Refresh the list of discovery or power control tasks
• View the summary of the discovery or power control tasks
Devices On the Devices screen, you can view both network-discovered and manually added devices. On this screen you can
• Add groups
• Add unsupported devices
• Create virtual groups
14
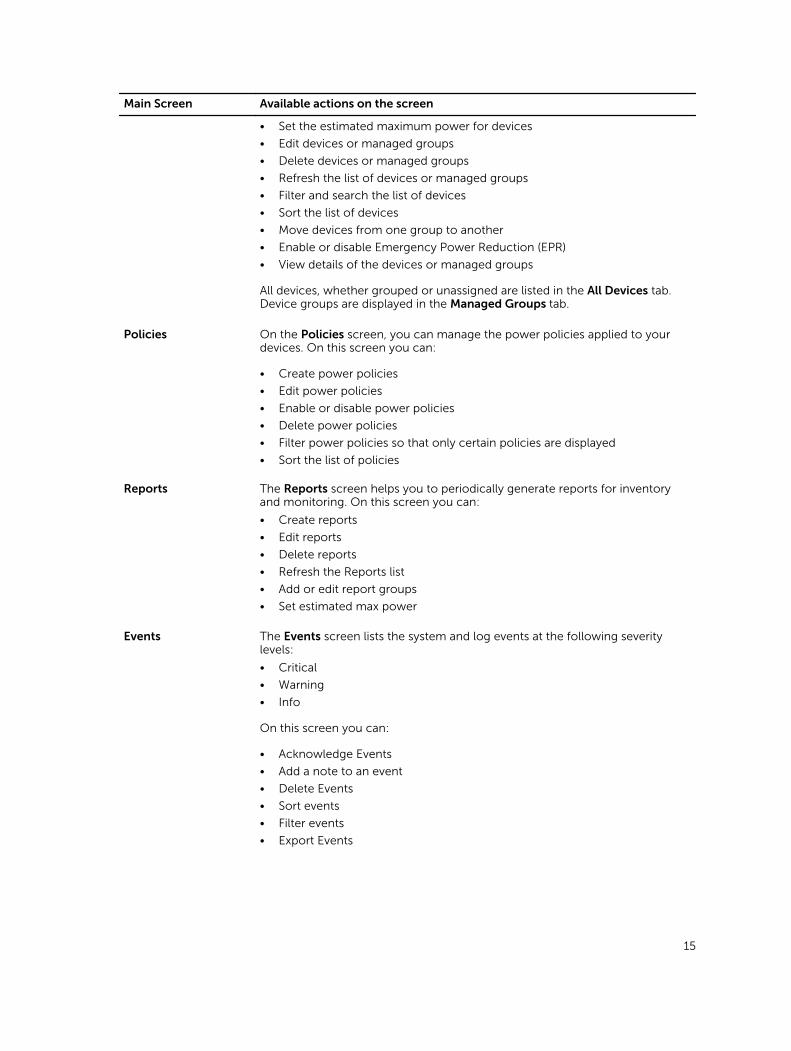
Main Screen Available actions on the screen
• Set the estimated maximum power for devices
• Edit devices or managed groups
• Delete devices or managed groups
• Refresh the list of devices or managed groups
• Filter and search the list of devices
• Sort the list of devices
• Move devices from one group to another
• Enable or disable Emergency Power Reduction (EPR)
• View details of the devices or managed groups
All devices, whether grouped or unassigned are listed in the All Devices tab. Device groups are displayed in the Managed Groups tab.
Policies On the Policies screen, you can manage the power policies applied to your devices. On this screen you can:
• Create power policies
• Edit power policies
• Enable or disable power policies
• Delete power policies
• Filter power policies so that only certain policies are displayed
• Sort the list of policies
Reports The Reports screen helps you to periodically generate reports for inventory and monitoring. On this screen you can:
• Create reports
• Edit reports
• Delete reports
• Refresh the Reports list
• Add or edit report groups
• Set estimated max power
Events The Events screen lists the system and log events at the following severity levels:
• Critical
• Warning
• Info
On this screen you can:
• Acknowledge Events
• Add a note to an event
• Delete Events
• Sort events
• Filter events
• Export Events
15
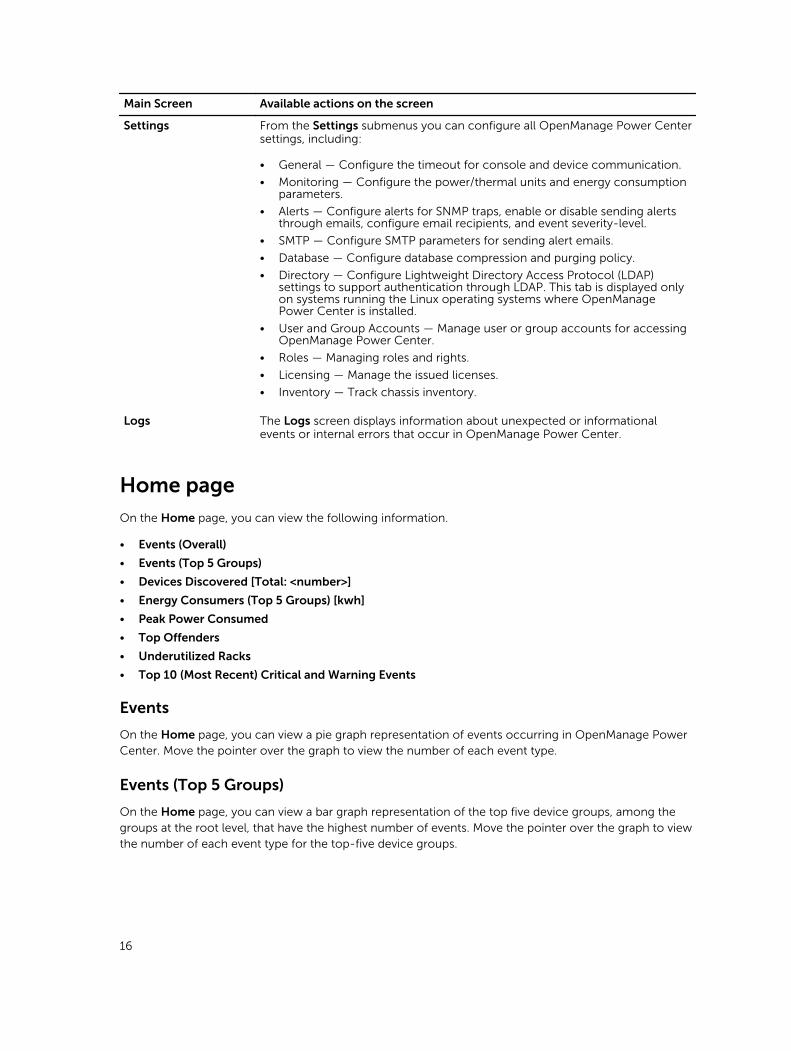
Main Screen Available actions on the screen
Settings From the Settings submenus you can configure all OpenManage Power Center settings, including:
• General — Configure the timeout for console and device communication.
• Monitoring — Configure the power/thermal units and energy consumption parameters.
• Alerts — Configure alerts for SNMP traps, enable or disable sending alerts through emails, configure email recipients, and event severity-level.
• SMTP — Configure SMTP parameters for sending alert emails.
• Database — Configure database compression and purging policy.
• Directory — Configure Lightweight Directory Access Protocol (LDAP) settings to support authentication through LDAP. This tab is displayed only on systems running the Linux operating systems where OpenManage Power Center is installed.
• User and Group Accounts — Manage user or group accounts for accessing OpenManage Power Center.
• Roles — Managing roles and rights.
• Licensing — Manage the issued licenses.
• Inventory — Track chassis inventory.
Logs The Logs screen displays information about unexpected or informational events or internal errors that occur in OpenManage Power Center.
Home page
On the Home page, you can view the following information.
• Events (Overall)
• Events (Top 5 Groups)
• Devices Discovered [Total: <number>]
• Energy Consumers (Top 5 Groups) [kwh]
• Peak Power Consumed
• Top Offenders
• Underutilized Racks
• Top 10 (Most Recent) Critical and Warning Events
Events
On the Home page, you can view a pie graph representation of events occurring in OpenManage Power Center. Move the pointer over the graph to view the number of each event type.
Events (Top 5 Groups)
On the Home page, you can view a bar graph representation of the top five device groups, among the groups at the root level, that have the highest number of events. Move the pointer over the graph to view the number of each event type for the top-five device groups.
16
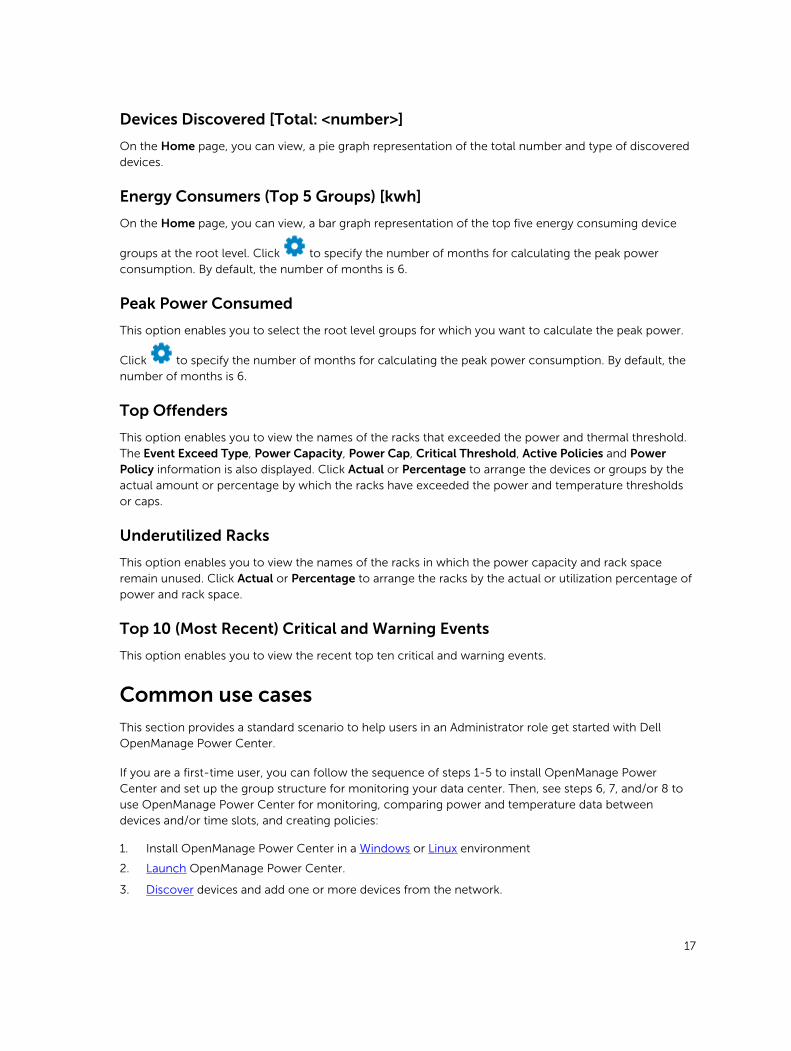
Devices Discovered [Total: <number>]
On the Home page, you can view, a pie graph representation of the total number and type of discovered devices.
Energy Consumers (Top 5 Groups) [kwh]
On the Home page, you can view, a bar graph representation of the top five energy consuming device
groups at the root level. Click to specify the number of months for calculating the peak power consumption. By default, the number of months is 6.
Peak Power Consumed
This option enables you to select the root level groups for which you want to calculate the peak power.
Click to specify the number of months for calculating the peak power consumption. By default, the number of months is 6.
Top Offenders
This option enables you to view the names of the racks that exceeded the power and thermal threshold. The Event Exceed Type, Power Capacity, Power Cap, Critical Threshold, Active Policies and Power Policy information is also displayed. Click Actual or Percentage to arrange the devices or groups by the actual amount or percentage by which the racks have exceeded the power and temperature thresholds or caps.
Underutilized Racks
This option enables you to view the names of the racks in which the power capacity and rack space remain unused. Click Actual or Percentage to arrange the racks by the actual or utilization percentage of power and rack space.
Top 10 (Most Recent) Critical and Warning Events
This option enables you to view the recent top ten critical and warning events.
Common use cases
This section provides a standard scenario to help users in an Administrator role get started with Dell OpenManage Power Center.
If you are a first-time user, you can follow the sequence of steps 1-5 to install OpenManage Power Center and set up the group structure for monitoring your data center. Then, see steps 6, 7, and/or 8 to use OpenManage Power Center for monitoring, comparing power and temperature data between devices and/or time slots, and creating policies:
1. Install OpenManage Power Center in a Windows or Linux environment
2. Launch OpenManage Power Center.
3. Discover devices and add one or more devices from the network.
17
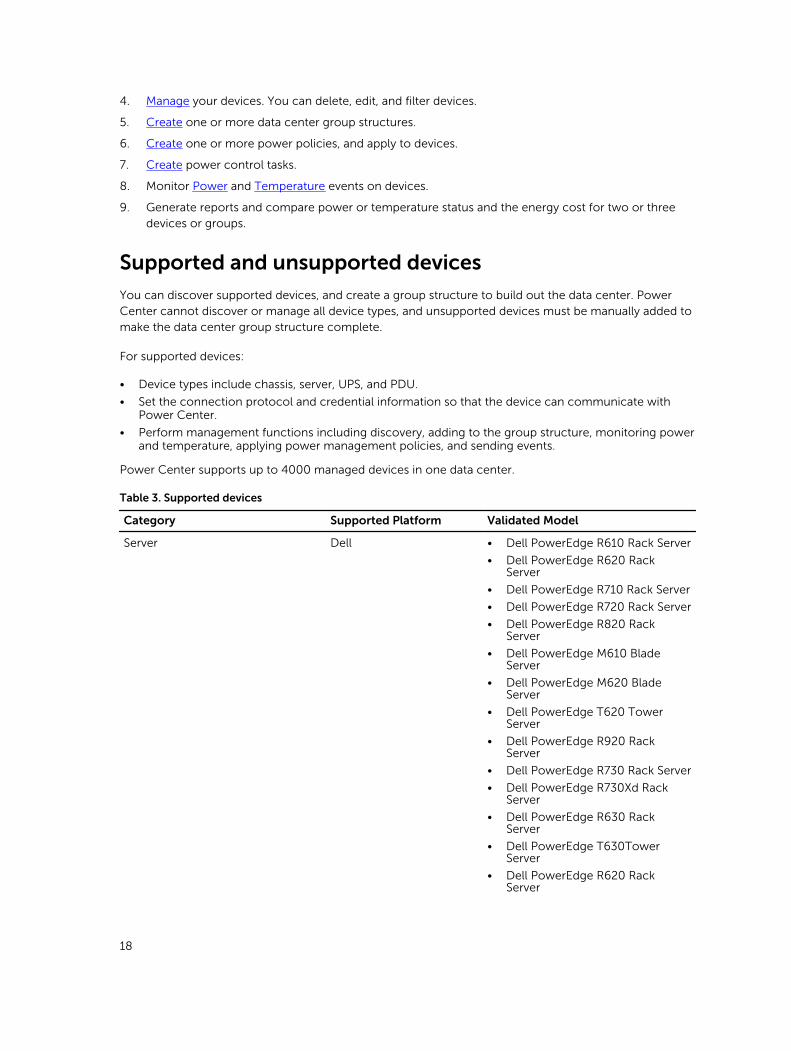
4. Manage your devices. You can delete, edit, and filter devices.
5. Create one or more data center group structures.
6. Create one or more power policies, and apply to devices.
7. Create power control tasks.
8. Monitor Power and Temperature events on devices.
9. Generate reports and compare power or temperature status and the energy cost for two or three devices or groups.
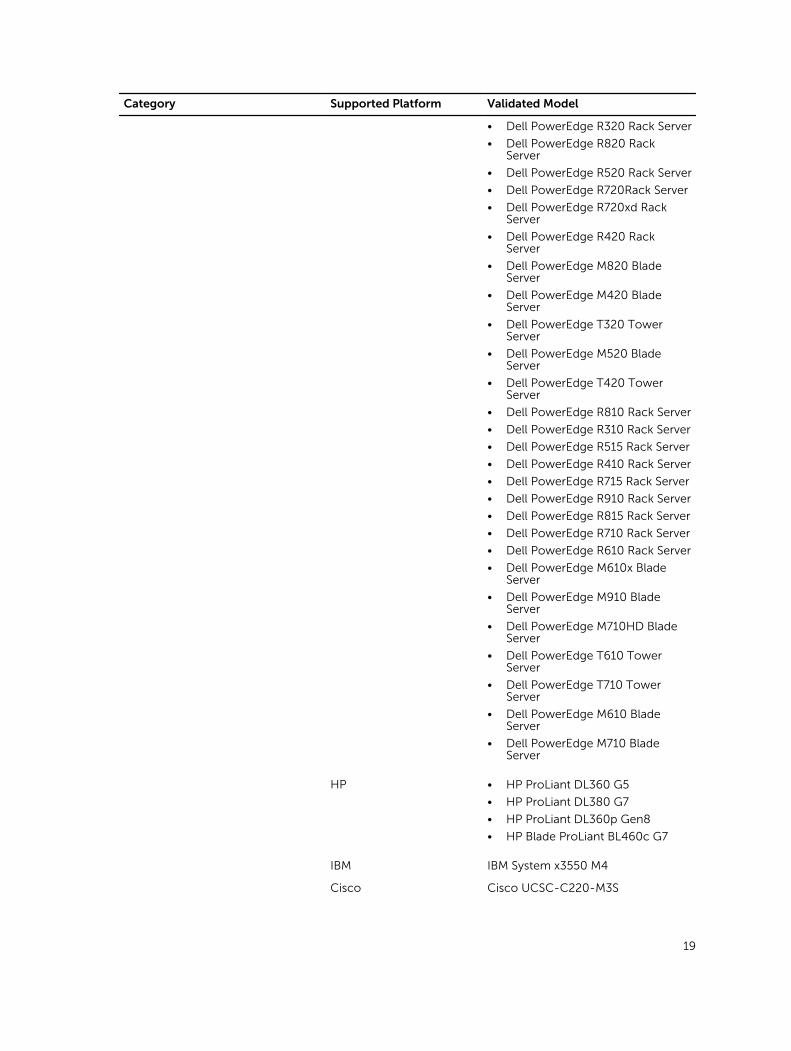
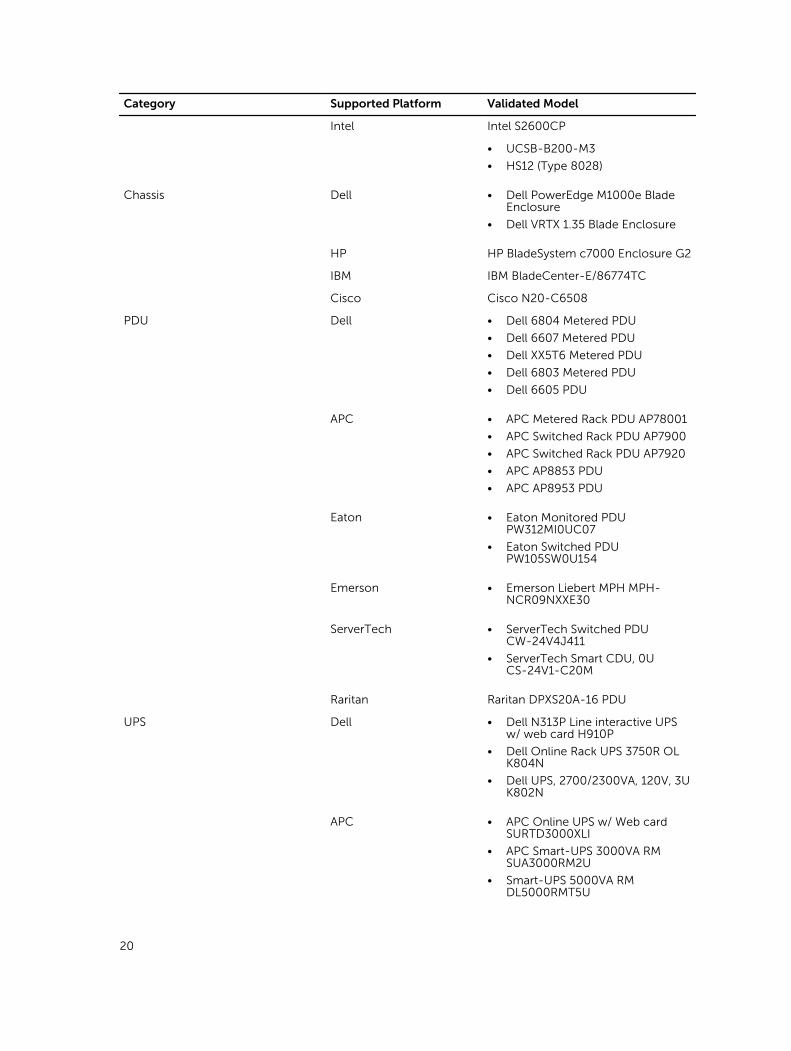
Supported and unsupported devices
You can discover supported devices, and create a group structure to build out the data center. Power Center cannot discover or manage all device types, and unsupported devices must be manually added to make the data center group structure complete.
For supported devices:
• Device types include chassis, server, UPS, and PDU.
• Set the connection protocol and credential information so that the device can communicate with Power Center.
• Perform management functions including discovery, adding to the group structure, monitoring power and temperature, applying power management policies, and sending events.
Power Center supports up to 4000 managed devices in one data center.
Table 3. Supported devices
Category Supported Platform Validated Model
Server Dell • Dell PowerEdge R610 Rack Server
• Dell PowerEdge R620 Rack Server
• Dell PowerEdge R710 Rack Server
• Dell PowerEdge R720 Rack Server
• Dell PowerEdge R820 Rack Server
• Dell PowerEdge M610 Blade Server
• Dell PowerEdge M620 Blade Server
• Dell PowerEdge T620 Tower Server
• Dell PowerEdge R920 Rack Server
• Dell PowerEdge R730 Rack Server
• Dell PowerEdge R730Xd Rack Server
• Dell PowerEdge R630 Rack Server
• Dell PowerEdge T630Tower Server
• Dell PowerEdge R620 Rack Server
18
Category Supported Platform Validated Model
• Dell PowerEdge R320 Rack Server
• Dell PowerEdge R820 Rack Server
• Dell PowerEdge R520 Rack Server
• Dell PowerEdge R720Rack Server
• Dell PowerEdge R720xd Rack Server
• Dell PowerEdge R420 Rack Server
• Dell PowerEdge M820 Blade Server
• Dell PowerEdge M420 Blade Server
• Dell PowerEdge T320 Tower Server
• Dell PowerEdge M520 Blade Server
• Dell PowerEdge T420 Tower Server
• Dell PowerEdge R810 Rack Server
• Dell PowerEdge R310 Rack Server
• Dell PowerEdge R515 Rack Server
• Dell PowerEdge R410 Rack Server
• Dell PowerEdge R715 Rack Server
• Dell PowerEdge R910 Rack Server
• Dell PowerEdge R815 Rack Server
• Dell PowerEdge R710 Rack Server
• Dell PowerEdge R610 Rack Server
• Dell PowerEdge M610x Blade Server
• Dell PowerEdge M910 Blade Server
• Dell PowerEdge M710HD Blade Server
• Dell PowerEdge T610 Tower Server
• Dell PowerEdge T710 Tower Server
• Dell PowerEdge M610 Blade Server
• Dell PowerEdge M710 Blade Server
HP • HP ProLiant DL360 G5
• HP ProLiant DL380 G7
• HP ProLiant DL360p Gen8
• HP Blade ProLiant BL460c G7
IBM IBM System x3550 M4
Cisco Cisco UCSC-C220-M3S
19
Category Supported Platform Validated Model
Intel Intel S2600CP
• UCSB-B200-M3
• HS12 (Type 8028)
Chassis Dell • Dell PowerEdge M1000e Blade Enclosure
• Dell VRTX 1.35 Blade Enclosure
HP HP BladeSystem c7000 Enclosure G2
IBM IBM BladeCenter-E/86774TC
Cisco Cisco N20-C6508
PDU Dell • Dell 6804 Metered PDU
• Dell 6607 Metered PDU
• Dell XX5T6 Metered PDU
• Dell 6803 Metered PDU
• Dell 6605 PDU
APC • APC Metered Rack PDU AP78001
• APC Switched Rack PDU AP7900
• APC Switched Rack PDU AP7920
• APC AP8853 PDU
• APC AP8953 PDU
Eaton • Eaton Monitored PDU PW312MI0UC07
• Eaton Switched PDU PW105SW0U154
Emerson • Emerson Liebert MPH MPH-NCR09NXXE30
ServerTech • ServerTech Switched PDU CW-24V4J411
• ServerTech Smart CDU, 0U CS-24V1-C20M
Raritan Raritan DPXS20A-16 PDU
UPS Dell • Dell N313P Line interactive UPS w/ web card H910P
• Dell Online Rack UPS 3750R OL K804N
• Dell UPS, 2700/2300VA, 120V, 3U K802N
APC • APC Online UPS w/ Web card SURTD3000XLI
• APC Smart-UPS 3000VA RM SUA3000RM2U
• Smart-UPS 5000VA RM DL5000RMT5U
20
Category Supported Platform Validated Model
• APC Smart-UPS 2200 RM
• APC Smart-UPS 3000
Eaton • Eaton Line interactive UPS w/ Web card PW5130I1750-XL2U
Emerson • Emerson Online UPS w/ Web card GXT2-2700RT208
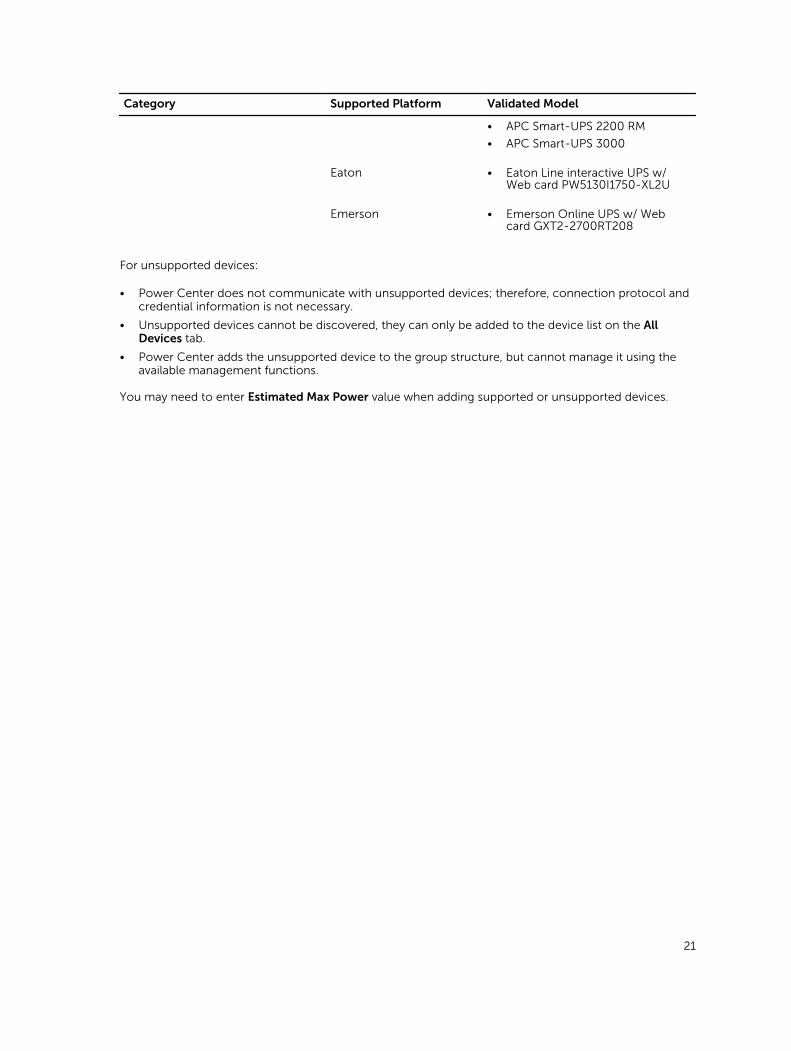
For unsupported devices:
• Power Center does not communicate with unsupported devices; therefore, connection protocol and credential information is not necessary.
• Unsupported devices cannot be discovered, they can only be added to the device list on the All Devices tab.
• Power Center adds the unsupported device to the group structure, but cannot manage it using the available management functions.
You may need to enter Estimated Max Power value when adding supported or unsupported devices.
21
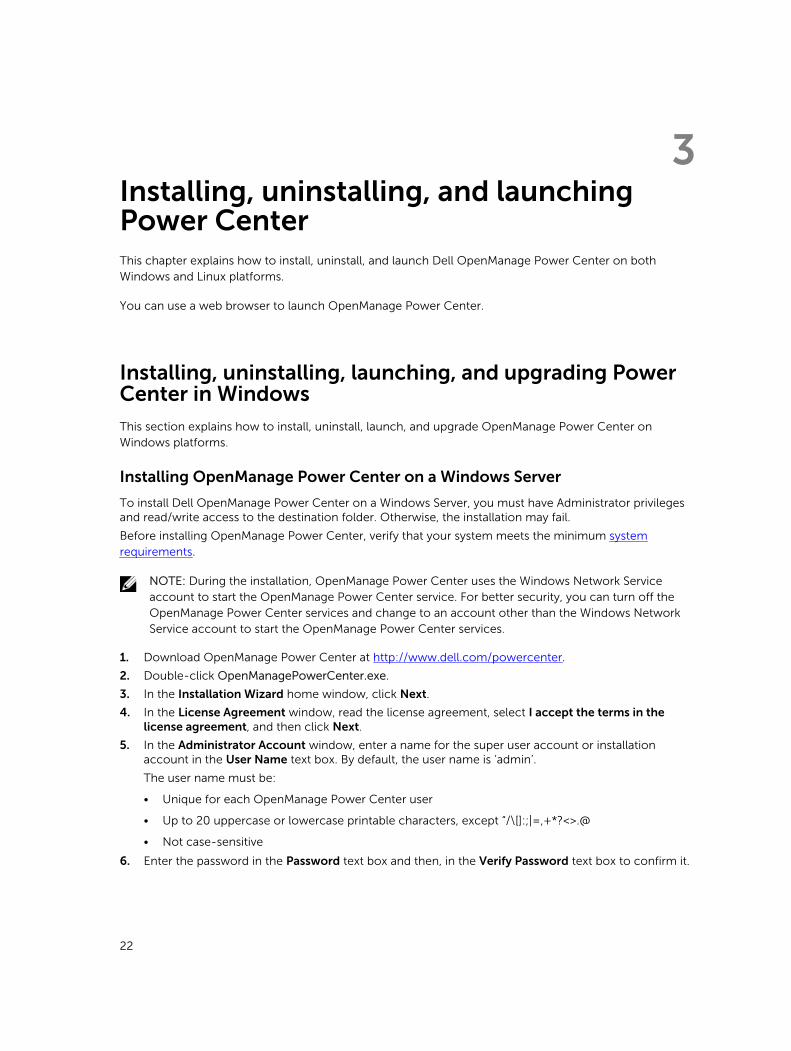
3Installing, uninstalling, and launching Power CenterThis chapter explains how to install, uninstall, and launch Dell OpenManage Power Center on both Windows and Linux platforms.
You can use a web browser to launch OpenManage Power Center.
Installing, uninstalling, launching, and upgrading Power Center in Windows
This section explains how to install, uninstall, launch, and upgrade OpenManage Power Center on Windows platforms.
Installing OpenManage Power Center on a Windows Server
To install Dell OpenManage Power Center on a Windows Server, you must have Administrator privileges and read/write access to the destination folder. Otherwise, the installation may fail.
Before installing OpenManage Power Center, verify that your system meets the minimum system requirements.
NOTE: During the installation, OpenManage Power Center uses the Windows Network Service account to start the OpenManage Power Center service. For better security, you can turn off the OpenManage Power Center services and change to an account other than the Windows Network Service account to start the OpenManage Power Center services.
1. Download OpenManage Power Center at http://www.dell.com/powercenter.
2. Double-click OpenManagePowerCenter.exe.
3. In the Installation Wizard home window, click Next.
4. In the License Agreement window, read the license agreement, select I accept the terms in the license agreement, and then click Next.
5. In the Administrator Account window, enter a name for the super user account or installation account in the User Name text box. By default, the user name is ‘admin’.
The user name must be:
• Unique for each OpenManage Power Center user
• Up to 20 uppercase or lowercase printable characters, except “/\[]:;|=,+*?<>.@
• Not case-sensitive
6. Enter the password in the Password text box and then, in the Verify Password text box to confirm it.
22
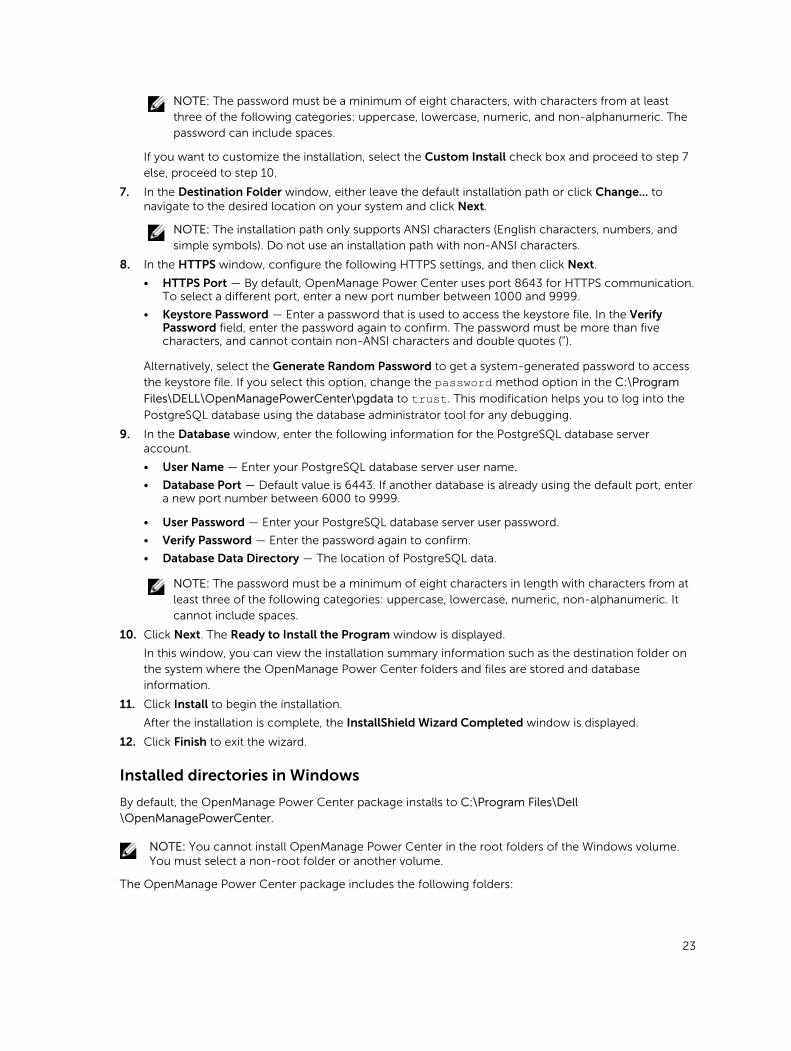
NOTE: The password must be a minimum of eight characters, with characters from at least three of the following categories: uppercase, lowercase, numeric, and non-alphanumeric. The password can include spaces.
If you want to customize the installation, select the Custom Install check box and proceed to step 7 else, proceed to step 10.
7. In the Destination Folder window, either leave the default installation path or click Change... to navigate to the desired location on your system and click Next.
NOTE: The installation path only supports ANSI characters (English characters, numbers, and simple symbols). Do not use an installation path with non-ANSI characters.
8. In the HTTPS window, configure the following HTTPS settings, and then click Next.
• HTTPS Port — By default, OpenManage Power Center uses port 8643 for HTTPS communication. To select a different port, enter a new port number between 1000 and 9999.
• Keystore Password — Enter a password that is used to access the keystore file. In the Verify Password field, enter the password again to confirm. The password must be more than five characters, and cannot contain non-ANSI characters and double quotes (").
Alternatively, select the Generate Random Password to get a system-generated password to access the keystore file. If you select this option, change the password method option in the C:\Program
Files\DELL\OpenManagePowerCenter\pgdata to trust. This modification helps you to log into the
PostgreSQL database using the database administrator tool for any debugging.
9. In the Database window, enter the following information for the PostgreSQL database server account.
• User Name — Enter your PostgreSQL database server user name.
• Database Port — Default value is 6443. If another database is already using the default port, enter a new port number between 6000 to 9999.
• User Password — Enter your PostgreSQL database server user password.
• Verify Password — Enter the password again to confirm.
• Database Data Directory — The location of PostgreSQL data.
NOTE: The password must be a minimum of eight characters in length with characters from at least three of the following categories: uppercase, lowercase, numeric, non-alphanumeric. It cannot include spaces.
10. Click Next. The Ready to Install the Program window is displayed.
In this window, you can view the installation summary information such as the destination folder on the system where the OpenManage Power Center folders and files are stored and database information.
11. Click Install to begin the installation.
After the installation is complete, the InstallShield Wizard Completed window is displayed.
12. Click Finish to exit the wizard.
Installed directories in Windows
By default, the OpenManage Power Center package installs to C:\Program Files\Dell\OpenManagePowerCenter.
NOTE: You cannot install OpenManage Power Center in the root folders of the Windows volume. You must select a non-root folder or another volume.
The OpenManage Power Center package includes the following folders:
23
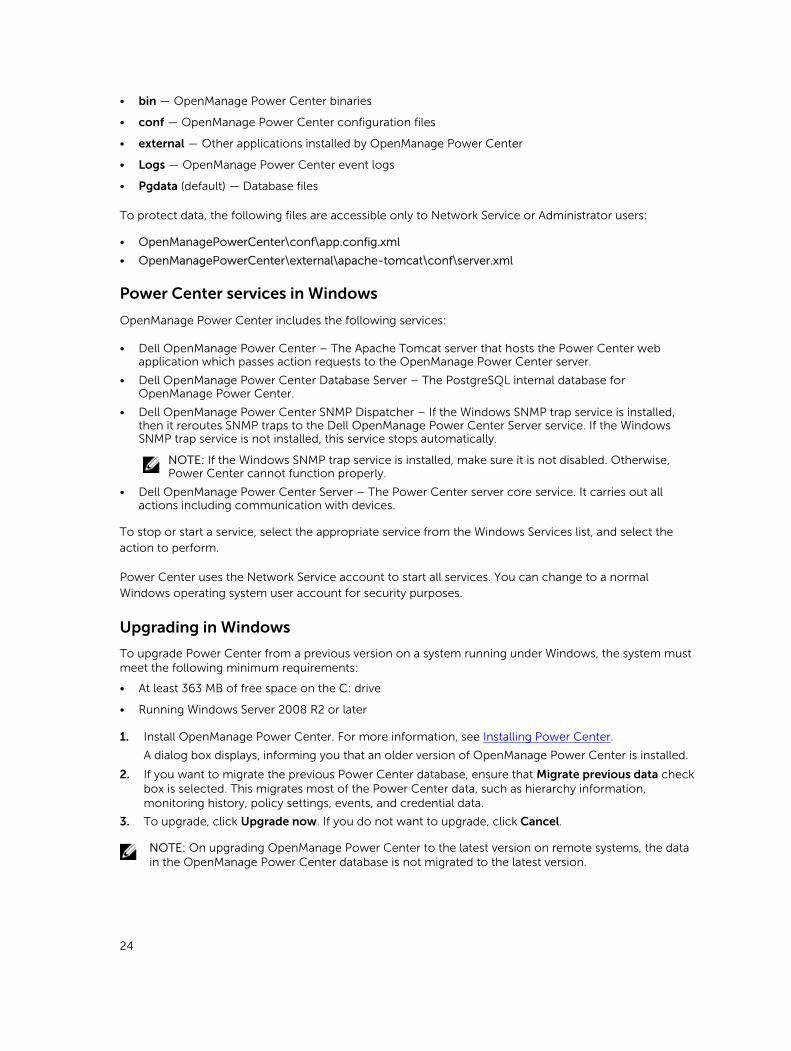
• bin — OpenManage Power Center binaries
• conf — OpenManage Power Center configuration files
• external — Other applications installed by OpenManage Power Center
• Logs — OpenManage Power Center event logs
• Pgdata (default) — Database files
To protect data, the following files are accessible only to Network Service or Administrator users:
• OpenManagePowerCenter\conf\app.config.xml
• OpenManagePowerCenter\external\apache-tomcat\conf\server.xml
Power Center services in Windows
OpenManage Power Center includes the following services:
• Dell OpenManage Power Center – The Apache Tomcat server that hosts the Power Center web application which passes action requests to the OpenManage Power Center server.
• Dell OpenManage Power Center Database Server – The PostgreSQL internal database for OpenManage Power Center.
• Dell OpenManage Power Center SNMP Dispatcher – If the Windows SNMP trap service is installed, then it reroutes SNMP traps to the Dell OpenManage Power Center Server service. If the Windows SNMP trap service is not installed, this service stops automatically.
NOTE: If the Windows SNMP trap service is installed, make sure it is not disabled. Otherwise, Power Center cannot function properly.
• Dell OpenManage Power Center Server – The Power Center server core service. It carries out all actions including communication with devices.
To stop or start a service, select the appropriate service from the Windows Services list, and select the action to perform.
Power Center uses the Network Service account to start all services. You can change to a normal Windows operating system user account for security purposes.
Upgrading in Windows
To upgrade Power Center from a previous version on a system running under Windows, the system must meet the following minimum requirements:
• At least 363 MB of free space on the C: drive
• Running Windows Server 2008 R2 or later
1. Install OpenManage Power Center. For more information, see Installing Power Center.
A dialog box displays, informing you that an older version of OpenManage Power Center is installed.
2. If you want to migrate the previous Power Center database, ensure that Migrate previous data check box is selected. This migrates most of the Power Center data, such as hierarchy information, monitoring history, policy settings, events, and credential data.
3. To upgrade, click Upgrade now. If you do not want to upgrade, click Cancel.
NOTE: On upgrading OpenManage Power Center to the latest version on remote systems, the data in the OpenManage Power Center database is not migrated to the latest version.
24
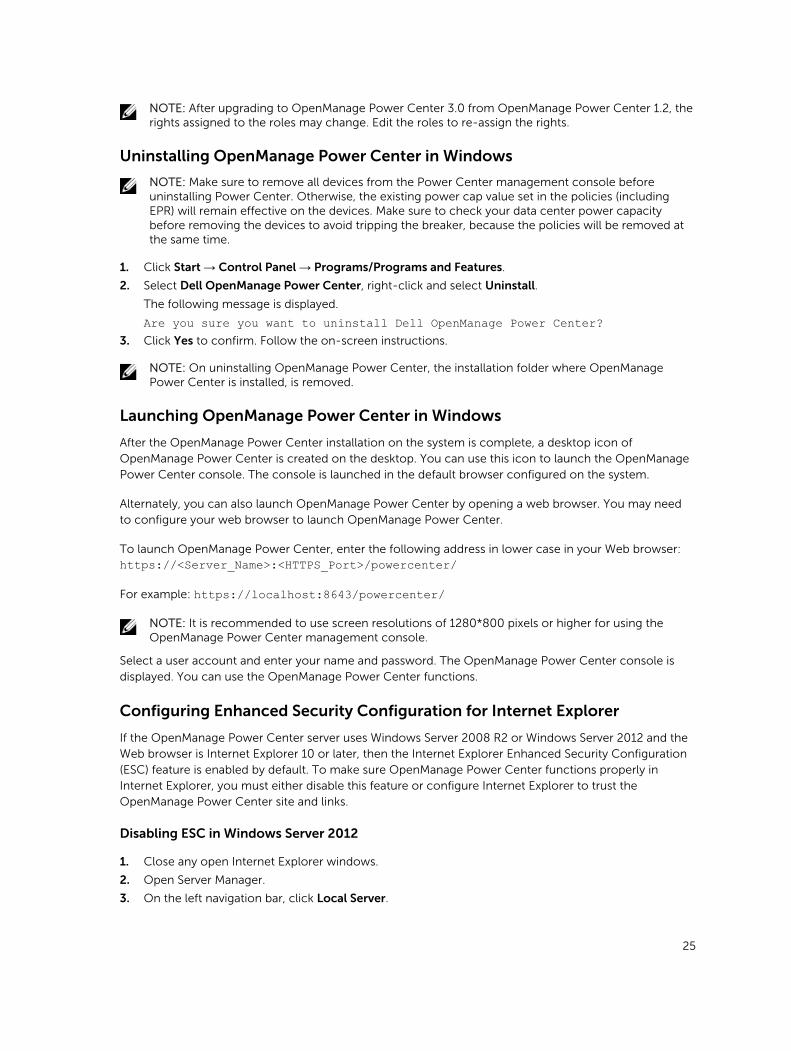
NOTE: After upgrading to OpenManage Power Center 3.0 from OpenManage Power Center 1.2, the rights assigned to the roles may change. Edit the roles to re-assign the rights.
Uninstalling OpenManage Power Center in Windows
NOTE: Make sure to remove all devices from the Power Center management console before uninstalling Power Center. Otherwise, the existing power cap value set in the policies (including EPR) will remain effective on the devices. Make sure to check your data center power capacity before removing the devices to avoid tripping the breaker, because the policies will be removed at the same time.
1. Click Start → Control Panel → Programs/Programs and Features.
2. Select Dell OpenManage Power Center, right-click and select Uninstall.
The following message is displayed.
Are you sure you want to uninstall Dell OpenManage Power Center?3. Click Yes to confirm. Follow the on-screen instructions.
NOTE: On uninstalling OpenManage Power Center, the installation folder where OpenManage Power Center is installed, is removed.
Launching OpenManage Power Center in Windows
After the OpenManage Power Center installation on the system is complete, a desktop icon of OpenManage Power Center is created on the desktop. You can use this icon to launch the OpenManage Power Center console. The console is launched in the default browser configured on the system.
Alternately, you can also launch OpenManage Power Center by opening a web browser. You may need to configure your web browser to launch OpenManage Power Center.
To launch OpenManage Power Center, enter the following address in lower case in your Web browser: https://<Server_Name>:<HTTPS_Port>/powercenter/
For example: https://localhost:8643/powercenter/
NOTE: It is recommended to use screen resolutions of 1280*800 pixels or higher for using the OpenManage Power Center management console.
Select a user account and enter your name and password. The OpenManage Power Center console is displayed. You can use the OpenManage Power Center functions.
Configuring Enhanced Security Configuration for Internet Explorer
If the OpenManage Power Center server uses Windows Server 2008 R2 or Windows Server 2012 and the Web browser is Internet Explorer 10 or later, then the Internet Explorer Enhanced Security Configuration (ESC) feature is enabled by default. To make sure OpenManage Power Center functions properly in Internet Explorer, you must either disable this feature or configure Internet Explorer to trust the OpenManage Power Center site and links.
Disabling ESC in Windows Server 2012
1. Close any open Internet Explorer windows.
2. Open Server Manager.
3. On the left navigation bar, click Local Server.
25
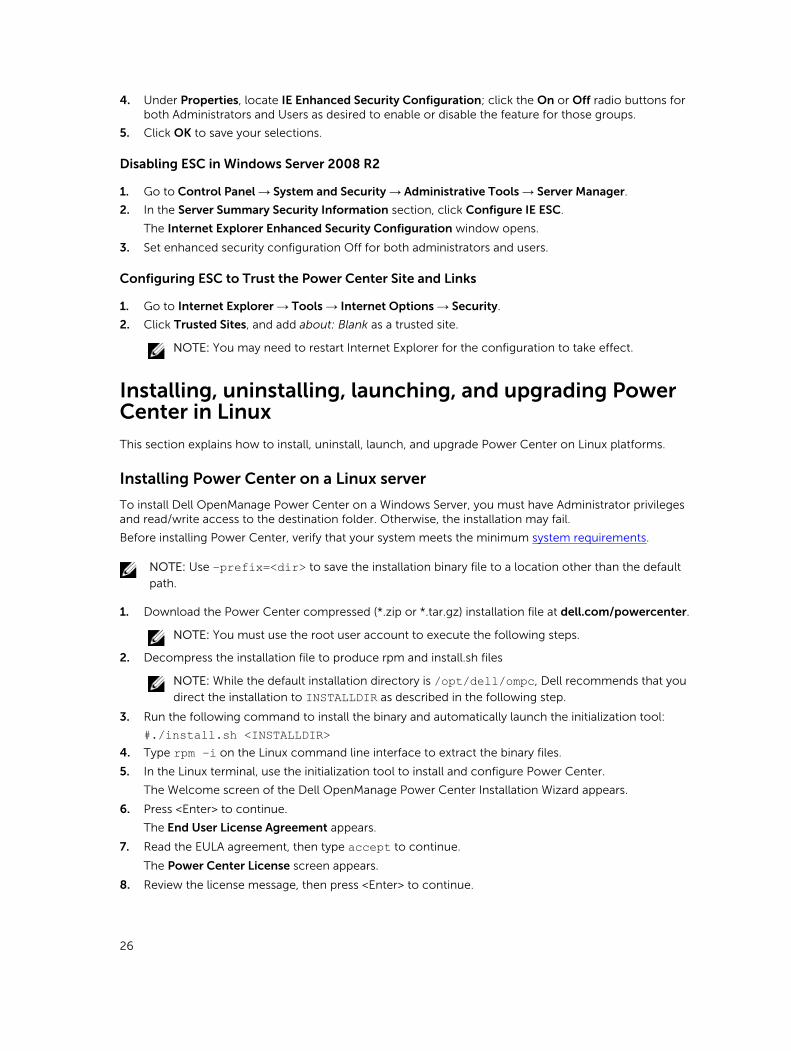
4. Under Properties, locate IE Enhanced Security Configuration; click the On or Off radio buttons for both Administrators and Users as desired to enable or disable the feature for those groups.
5. Click OK to save your selections.
Disabling ESC in Windows Server 2008 R2
1. Go to Control Panel → System and Security → Administrative Tools → Server Manager.
2. In the Server Summary Security Information section, click Configure IE ESC.
The Internet Explorer Enhanced Security Configuration window opens.
3. Set enhanced security configuration Off for both administrators and users.
Configuring ESC to Trust the Power Center Site and Links
1. Go to Internet Explorer → Tools → Internet Options → Security.
2. Click Trusted Sites, and add about: Blank as a trusted site.
NOTE: You may need to restart Internet Explorer for the configuration to take effect.
Installing, uninstalling, launching, and upgrading Power Center in Linux
This section explains how to install, uninstall, launch, and upgrade Power Center on Linux platforms.
Installing Power Center on a Linux server
To install Dell OpenManage Power Center on a Windows Server, you must have Administrator privileges and read/write access to the destination folder. Otherwise, the installation may fail.
Before installing Power Center, verify that your system meets the minimum system requirements.
NOTE: Use –prefix=<dir> to save the installation binary file to a location other than the default
path.
1. Download the Power Center compressed (*.zip or *.tar.gz) installation file at dell.com/powercenter.
NOTE: You must use the root user account to execute the following steps.
2. Decompress the installation file to produce rpm and install.sh files
NOTE: While the default installation directory is /opt/dell/ompc, Dell recommends that you
direct the installation to INSTALLDIR as described in the following step.
3. Run the following command to install the binary and automatically launch the initialization tool:
#./install.sh <INSTALLDIR>4. Type rpm –i on the Linux command line interface to extract the binary files.
5. In the Linux terminal, use the initialization tool to install and configure Power Center.
The Welcome screen of the Dell OpenManage Power Center Installation Wizard appears.
6. Press <Enter> to continue.
The End User License Agreement appears.
7. Read the EULA agreement, then type accept to continue.
The Power Center License screen appears.
8. Review the license message, then press <Enter> to continue.
26
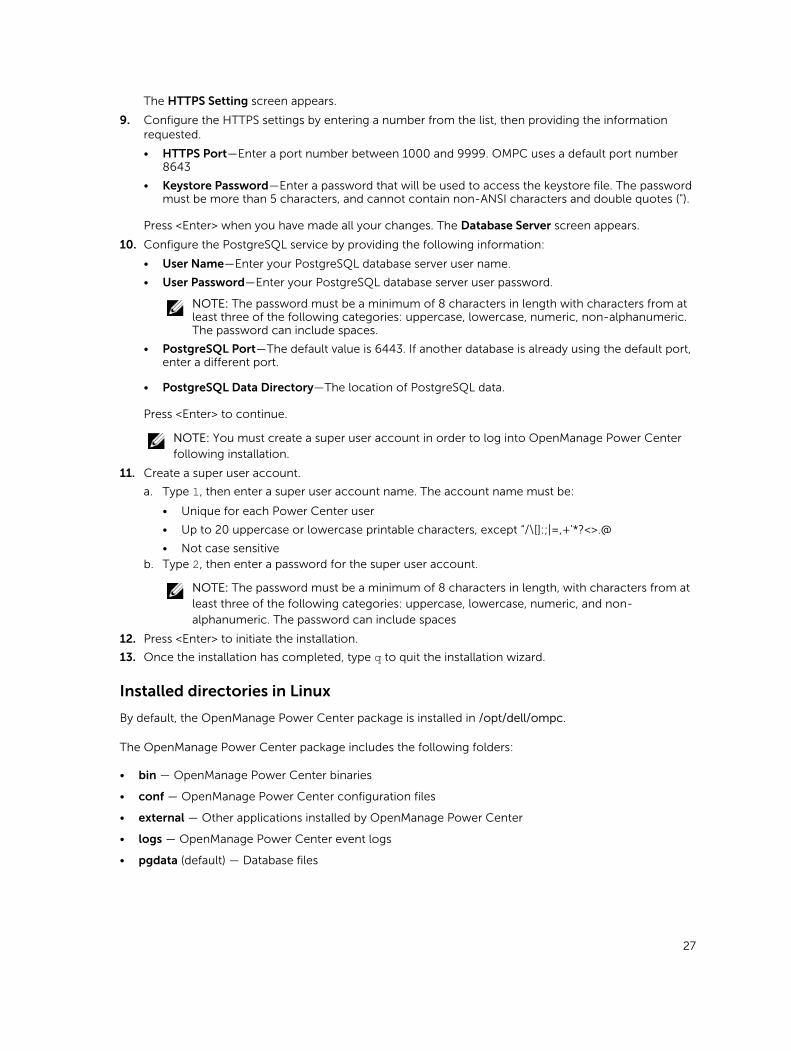
The HTTPS Setting screen appears.
9. Configure the HTTPS settings by entering a number from the list, then providing the information requested.
• HTTPS Port—Enter a port number between 1000 and 9999. OMPC uses a default port number 8643
• Keystore Password—Enter a password that will be used to access the keystore file. The password must be more than 5 characters, and cannot contain non-ANSI characters and double quotes (").
Press <Enter> when you have made all your changes. The Database Server screen appears.
10. Configure the PostgreSQL service by providing the following information:
• User Name—Enter your PostgreSQL database server user name.
• User Password—Enter your PostgreSQL database server user password.
NOTE: The password must be a minimum of 8 characters in length with characters from at least three of the following categories: uppercase, lowercase, numeric, non-alphanumeric. The password can include spaces.
• PostgreSQL Port—The default value is 6443. If another database is already using the default port, enter a different port.
• PostgreSQL Data Directory—The location of PostgreSQL data.
Press <Enter> to continue.
NOTE: You must create a super user account in order to log into OpenManage Power Center following installation.
11. Create a super user account.
a. Type 1, then enter a super user account name. The account name must be:
• Unique for each Power Center user
• Up to 20 uppercase or lowercase printable characters, except “/\[]:;|=,+'*?<>.@
• Not case sensitiveb. Type 2, then enter a password for the super user account.
NOTE: The password must be a minimum of 8 characters in length, with characters from at least three of the following categories: uppercase, lowercase, numeric, and non-alphanumeric. The password can include spaces
12. Press <Enter> to initiate the installation.
13. Once the installation has completed, type q to quit the installation wizard.
Installed directories in Linux
By default, the OpenManage Power Center package is installed in /opt/dell/ompc.
The OpenManage Power Center package includes the following folders:
• bin — OpenManage Power Center binaries
• conf — OpenManage Power Center configuration files
• external — Other applications installed by OpenManage Power Center
• logs — OpenManage Power Center event logs
• pgdata (default) — Database files
27
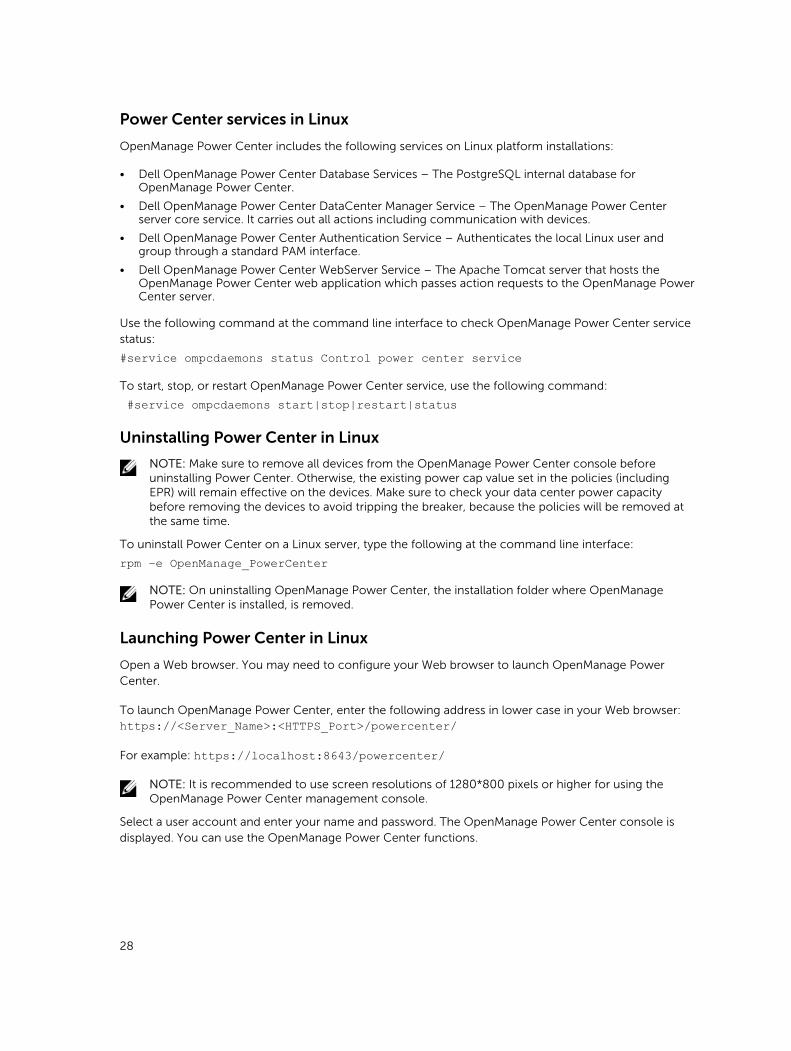
Power Center services in Linux
OpenManage Power Center includes the following services on Linux platform installations:
• Dell OpenManage Power Center Database Services – The PostgreSQL internal database for OpenManage Power Center.
• Dell OpenManage Power Center DataCenter Manager Service – The OpenManage Power Center server core service. It carries out all actions including communication with devices.
• Dell OpenManage Power Center Authentication Service – Authenticates the local Linux user and group through a standard PAM interface.
• Dell OpenManage Power Center WebServer Service – The Apache Tomcat server that hosts the OpenManage Power Center web application which passes action requests to the OpenManage Power Center server.
Use the following command at the command line interface to check OpenManage Power Center service status:
#service ompcdaemons status Control power center service
To start, stop, or restart OpenManage Power Center service, use the following command:
#service ompcdaemons start|stop|restart|status
Uninstalling Power Center in Linux
NOTE: Make sure to remove all devices from the OpenManage Power Center console before uninstalling Power Center. Otherwise, the existing power cap value set in the policies (including EPR) will remain effective on the devices. Make sure to check your data center power capacity before removing the devices to avoid tripping the breaker, because the policies will be removed at the same time.
To uninstall Power Center on a Linux server, type the following at the command line interface:
rpm –e OpenManage_PowerCenter
NOTE: On uninstalling OpenManage Power Center, the installation folder where OpenManage Power Center is installed, is removed.
Launching Power Center in Linux
Open a Web browser. You may need to configure your Web browser to launch OpenManage Power Center.
To launch OpenManage Power Center, enter the following address in lower case in your Web browser: https://<Server_Name>:<HTTPS_Port>/powercenter/
For example: https://localhost:8643/powercenter/
NOTE: It is recommended to use screen resolutions of 1280*800 pixels or higher for using the OpenManage Power Center management console.
Select a user account and enter your name and password. The OpenManage Power Center console is displayed. You can use the OpenManage Power Center functions.
28
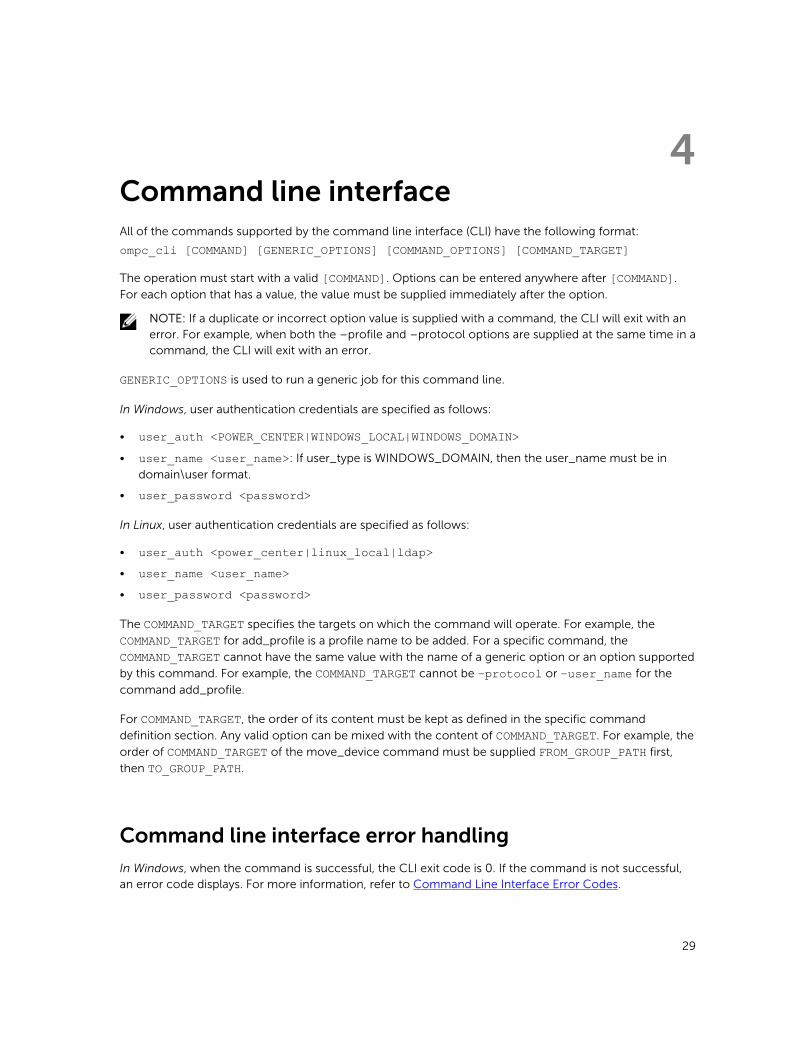
4Command line interfaceAll of the commands supported by the command line interface (CLI) have the following format:
ompc_cli [COMMAND] [GENERIC_OPTIONS] [COMMAND_OPTIONS] [COMMAND_TARGET]
The operation must start with a valid [COMMAND]. Options can be entered anywhere after [COMMAND].
For each option that has a value, the value must be supplied immediately after the option.
NOTE: If a duplicate or incorrect option value is supplied with a command, the CLI will exit with an error. For example, when both the –profile and –protocol options are supplied at the same time in a command, the CLI will exit with an error.
GENERIC_OPTIONS is used to run a generic job for this command line.
In Windows, user authentication credentials are specified as follows:
• user_auth <POWER_CENTER|WINDOWS_LOCAL|WINDOWS_DOMAIN>• user_name <user_name>: If user_type is WINDOWS_DOMAIN, then the user_name must be in
domain\user format.
• user_password <password>
In Linux, user authentication credentials are specified as follows:
• user_auth <power_center|linux_local|ldap>• user_name <user_name>• user_password <password>
The COMMAND_TARGET specifies the targets on which the command will operate. For example, the
COMMAND_TARGET for add_profile is a profile name to be added. For a specific command, the
COMMAND_TARGET cannot have the same value with the name of a generic option or an option supported
by this command. For example, the COMMAND_TARGET cannot be –protocol or –user_name for the
command add_profile.
For COMMAND_TARGET, the order of its content must be kept as defined in the specific command
definition section. Any valid option can be mixed with the content of COMMAND_TARGET. For example, the
order of COMMAND_TARGET of the move_device command must be supplied FROM_GROUP_PATH first,
then TO_GROUP_PATH.
Command line interface error handling
In Windows, when the command is successful, the CLI exit code is 0. If the command is not successful, an error code displays. For more information, refer to Command Line Interface Error Codes.
29
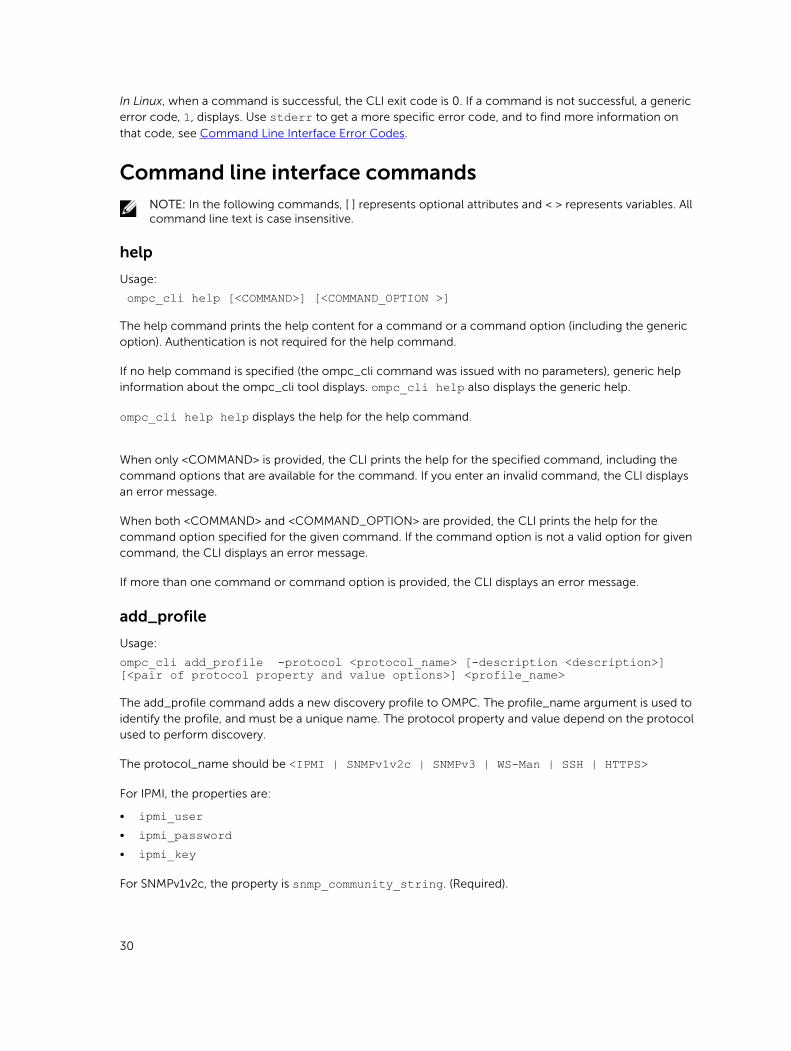
In Linux, when a command is successful, the CLI exit code is 0. If a command is not successful, a generic error code, 1, displays. Use stderr to get a more specific error code, and to find more information on
that code, see Command Line Interface Error Codes.
Command line interface commandsNOTE: In the following commands, [ ] represents optional attributes and < > represents variables. All command line text is case insensitive.
help
Usage:
ompc_cli help [<COMMAND>] [<COMMAND_OPTION >]
The help command prints the help content for a command or a command option (including the generic option). Authentication is not required for the help command.
If no help command is specified (the ompc_cli command was issued with no parameters), generic help information about the ompc_cli tool displays. ompc_cli help also displays the generic help.
ompc_cli help help displays the help for the help command.
When only <COMMAND> is provided, the CLI prints the help for the specified command, including the command options that are available for the command. If you enter an invalid command, the CLI displays an error message.
When both <COMMAND> and <COMMAND_OPTION> are provided, the CLI prints the help for the command option specified for the given command. If the command option is not a valid option for given command, the CLI displays an error message.
If more than one command or command option is provided, the CLI displays an error message.
add_profile
Usage:
ompc_cli add_profile -protocol <protocol_name> [-description <description>] [<pair of protocol property and value options>] <profile_name>
The add_profile command adds a new discovery profile to OMPC. The profile_name argument is used to identify the profile, and must be a unique name. The protocol property and value depend on the protocol used to perform discovery.
The protocol_name should be <IPMI | SNMPv1v2c | SNMPv3 | WS-Man | SSH | HTTPS>
For IPMI, the properties are:
• ipmi_user• ipmi_password• ipmi_key
For SNMPv1v2c, the property is snmp_community_string. (Required).
30
For SNMPv3, the properties are:
• snmp_user (Required)• snmp_authentication_password• snmp_encryption_password
For WS-Man, the properties are:
• wsman_port• wsman_user• wsman_password• wsman_validate_cert (its value must be true or false)
For HTTPS, the properties are:
• https_port• https_user• https_password• https_validate_cert (its value must be true or false)
For SSH, the properties are:
• ssh_port• ssh_user• ssh_password
update_profile
Usage:
ompc_cli update_profile [-description <description>] [<pair of protocol property and value options>] <profile_name> [<new_profile_name>]
The update_profile command updates an existing discovery profile identified by profile_name in
OMPC. The semantics of the command options are the same as those in add_profile. The protocol property set that can be updated depends on the protocol supported by this profile. If new_profile_name is provided, the profile_name is updated to the new_profile_name.
add_device
Usage:
ompc_cli add_device [-device_name <device_name>] [-description <description>] [-size <size>] [-estimated_max_power <estimated_max_power>] –device_type <SERVER | PDU | UPS | UNSUPPORTED|CHASSIS> [-model <model>] [–profile <profile-name>] [-protocol <protocol_name>] [<pair of protocol property and value options>] [host_name or ip]
The add_device command adds a device to OMPC by using the profile name-identified profile or by using related protocol information directly supplied through the command option. You cannot enter –profile and –protocol at the same time.
31
The device_name is optional, and if not provided, OMPC will generate a device_name (following the
same rule as in network discovery). For unsupported devices, the default auto-generated device_name is Unsupported. To ensure unique identifiers, OMPC appends numbers to the device name.
The [host_name or ip] option is required, except when the device_type is Unsupported.
The -model option is valid only when the type is Unsupported.
update_device
Usage:
ompc_cli update_device [-description <description>] [-size <size>] [-estimated_max_power <estimated_max_power>] [-host_name <host_name>] [-ip <ip>] [<pair of protocol property and value options>] <device_name > [<new_device_name>]
The update_device command updates device information identified by its device_name. If
new_device_name is provided, the device_name will also be updated to the new_device_name.
[<pair of protocol property and value options>] depends on the protocol supported by this
device.
rediscover_device
Usage:
ompc_cli rediscover_device [-service_tag <stag>] [<device_name>]
The rediscover_device command lets OMPC connect with the device and refresh properties that might be changed on the device side (for example, power capability and device model).
After rediscovery, the Time of Discovery is updated to the time of rediscovery.
For the Chassis Management Controller (CMC), if you are rediscovering it before adding it to the rack (in other words, the blades inside it are not enumerated), it will not trigger enumerating blades inside it. If rediscovering a CMC after it is added to rack (the blades inside it are enumerated), OMPC will enumerate blade changes inside it to reflect any changes.
You cannot use -service_tag and device_name at the same time.
If the device is an unsupported device (device_type is Unsupported), the CLI displays the error, “CLI does not allow rediscover for unsupported devices.”
remove_profile
Usage:
ompc_cli remove_profile <profile-name>
The remove_profile command removes a discovery profile.
delete_device
Usage:
ompc_cli delete_device [-service_tag <stag>] [<device_name>]
32

The delete_device command deletes a device. You cannot use –service_tag and device_name at the
same time.
If the device is a chassis, it is deleted like a group (if the blades in it are already enumerated). The chassis itself is also deleted from OMPC, and is no longer visible on the Devices page.
add_group
Usage:
ompc_cli add_group [-description <description>] -group_type <DC|ROOM|AISLE|RACK|CUSTOM > [-capacity <capacity>] [-total_power_capacity <power_capacity>] GROUP_PATH
The add_group command adds a new group identified by GROUP_PATH. If the type is RACK, you must supply the <capacity> option.
Forward slash (/) cannot be used as GROUP_PATH in the add_group command.
The chassis can be added to any group at any time. You can only add Chassis Management Console (CMC) to one rack; not multiple racks.
When you add CMC to any group, the blades inside it can be enumerated.
delete_group
Usage:
ompc_cli delete_group [-preview] GROUP_PATH
The delete_group command deletes a group identified by GROUP_PATH. All devices in this group will be removed from this group. The devices will still exist on the Devices page and in other groups that contain the devices.
All subgroups will be removed from this group. If a subgroup belongs to multiple parent groups, this subgroup will still exist in the other parent groups. If the subgroup no longer belongs to any parent group (after being removed from the current parent), this subgroup will be deleted from OMPC. This also applies to the group itself.
If the [-preview] option is given, a summary of the groups, devices, and policies impacted will display.
No deletion occurs.
• The summary includes the number of impacted devices, number of impacted groups, and number of impacted policies.
• All subgroups under the specified group path are counted in the summary whether they will be deleted from OMPC or not. (It is possible that a subgroup could be removed from the specified group path, but not be deleted from OMPC due to a reference from another parent group.)
• All devices and subgroups are counted in the summary (not only the direct children of a specified group).
• Any policies that you added to the impacted devices are not counted in the summary, because the device will not be deleted from OMPC, and these policies will remain on these devices.
33
Example Summary:
– Number of impacted devices: 5
– Number of impacted subgroups: 10
– Number of impacted policies: 3
You can delete a chassis as a group with the delete_group command. In this case, after successful
removal, the chassis will be kept on the Devices page as a device, but will no longer appear as a group if there is no other group containing this chassis (if there is no connection between the chassis and the blades inside it).
update_group
Usage:
ompc_cli update_group [-description <description>] [-group_type <DC|ROOM|AISLE|CUSTOM|RACK >] [-capacity <capacity>] [-total_power_capacity <power_capacity>] GROUP_PATH [new_group_name]
The update_group command updates the properties of an existing group identified by GROUP_PATH. The
–capacity and –total_power_capacity options are valid only when the group to be updated is a
rack. The –group_type of a rack cannot be updated, and no other type of group can be updated to be a
rack.
If new_group_name is provided, the CLI updates the name of the group to the new name. The group can
belong to another group. If this is the case, the rename operation may fail because of the name confliction.
The chassis can be regarded as group, so the CLI allows updates to the properties of the chassis through the update_group command. You can only update the chassis’ description and name through the update_group command. You cannot update other types of groups to be a chassis.
The name must be unique across devices and groups under the same parent group.
You cannot use “/” as GROUP_PATH in the update_group command.
add_device_to_group
Usage:
ompc_cli add_device_to_group [-slot <slot_num>] [-service_tag <stag>] [<device_name >] GROUP_PATH
The add_device_to_group command adds a device to a group. If a device is added to a rack, the slot_num option is used to specify into which slot the device will be added. If the value of the slot is -1,
the system will choose a slot automatically. When adding PDU/UPS, if you do not provide a slot option, the PDU/UPS will be attached to the rack. For adding a server or chassis to rack, -slot is allowed (when
not provided, the system will choose a slot automatically). If adding a server or chassis to other groups, -slot is not allowed (an error will display).
Slots start from 1 (0 is an invalid slot number).
PDU and UPS can only be added to a rack. For PDU and UPS in other types of groups in a previous OMPC release, if the you upgrade the data, you must remove PDU and UPS from those groups after upgrading.
34

The add_device_to_group command does not move a device from one group to another group. This is done by move_device.
If a device already belongs to a group, you can use the add_device_to_group command to add the device to another group. After successfully adding the device, this device belongs to both the old group and the new parent group. The exception is that devices can only belong to one rack (not multiple racks), and blades can only belong to one chassis (not multiple chassis). You cannot add blades to a chassis with the add_device_to_group command.
When a chassis is added to any group, the blades inside the chassis will be enumerated and the chassis becomes a group that contains all of the blades inside it.
remove_device_from_group
Usage:
ompc_cli remove_device_from_group [-service_tag <stag>] [<device_name >] GROUP_PATH
The remove_device_from_group command removes a device from a group identified by GROUP_PATH.
You can remove a chassis (as a device) from a group.
If a device belongs to multiple groups, after you remove it from one group, it will still belong to other groups.
A chassis can be removed through this command. In this case, the behavior is the same as removing a chassis by using the delete_group command.
move_device
Usage:
ompc_cli move_device [-service_tag <stag>] [<device_name >] [-slot <slot_num>] FROM_GROUP_PATH TO_GROUP_PATH
The move_device command moves a device from FROM_GROUP_PATH to TO_GROUP_PATH. After
successfully moving the device, the device no longer belongs to FROM_GROUP_PATH; it belongs to
TO_GROUP_PATH.
The slot option is applicable only when moving a device (including a chassis) to a rack. It specifies which slot the device should be moved into. If it is not provided when moving a device to a rack, the CLI identifies a slot.
When moving a PDU/UPS from one rack to another rack and the slot is not provided:
• If the PDU/UPS is in a slot of a previous rack, the CLI selects one slot in the new rack.
• If the PDU/UPS is attached in a previous rack, the CLI attaches it in the new rack.
When moving a PDU/UPS from one rack to another rack and you have specified the slot:
• If the PDU/UPS is in a slot of a previous rack, the CLI uses the specified slot in the new rack.
• If the PDU/UPS is attached in a previous rack, the CLI reports an error.
35

You cannot change the PDU/UPS properties between “slotted” and “attached” in Power Center. You can change between “slotted” and “attached” by removing the PDU/UPS from the rack, and re-adding it to the rack.
If the device to be moved is a chassis, the behavior will be the same as moving it through the move_group command.
You cannot use the attributes -service_tag and device_name at the same time.
If the move operation fails, the device stays in the original group. There are exceptions for critical situations such as power failures, crashes, network failures for the remote database, and local network failures.
move_group
Usage:
ompc_cli move_group FROM_GROUP_PATH TO_GROUP_PATH
The move_group command moves a group from FROM_GROUP_PATH to TO_GROUP_PATH.
You cannot use the same group path as FROM_GROUP_PATH to TO_GROUP_PATH. Also, you cannot use “/”
as FROM_GROUP_PATH.
After successfully moving a group, the group identified by FROM_GROUP_PATH will no longer belong to its
original parent in FROM_GROUP_PATH. It will belong to TO_GROUP_PATH.
When moving a chassis to a rack, the CLI chooses one available slot (if a slot is available). If you want to specify a slot for the chassis in the new rack, you must use the move_device command.
If the move operation fails, the device stays in the original group. There are exceptions for critical situations such as power failures, crashes, network failures for the remote database, and local network failures.
add_group_to_group
Usage:
ompc_cli add_group_to_group GROUP_PATH TO_ _GROUP_PATH
The add_group_to_group command adds a group identified by GROUP_PATH to TO_GROUP_PATH. If the
source group path also belongs to another parent group, after successfully adding the group, the source group belongs to both the old group and the new parent group. The exception is that a chassis can only belong to one rack (not multiple racks).
You cannot add groups to a rack (except for the chassis, which is a device before it is added to a rack, then a group after it is added to a rack).
When adding a chassis to a rack, the CLI will choose one available slot (if there is one available). If you want to specify a slot for the chassis in the rack, you must use the add_device_to_group command.
36
List commands
The following are generic rules for list commands:
• The output of list commands is a simple table-like structure, where a comma-delimited list of column names will be output first, followed by the data, in comma-delimited format. There is one line per record. If a piece of data is not applicable or available, that data is represented by two commas next to each other (NULL field).
• Line breaks (CRLF) in the output fields must be replaced with spaces.
• Fields containing double quotes and commas must be enclosed in double quotes.
• If a double quote appears inside a field, it must be escaped by preceding it with another double quote. For example: “aaa”, “b””bb”, “ccc”.
list_device_props
Usage:
ompc_cli list_device_props [-service_tag <servtag>] [<device_name>]
The list_device_props command lists all properties for the device identified by servtag or
device_name. Properties include service_tag, protocol, protocol properties, device name, address (IP or
host name), model, and device type (device name is the first column).
Secret data (password/key) is not listed as a protocol property.
list_devices
Usage:
ompc_cli list_devices [GROUP_PATH]
The list_devices command lists all devices immediately under the GROUP_PATH. If no GROUP_PATH is
supplied, then the CLI will list all devices, connected or not, that are managed by OMPC. Properties include all properties of the list_device_props command, except for protocol information (device name will be the first column).
If “/” is provided as GROUP_PATH, the CLI will list the devices at the root level.
list_group_props
Usage:
ompc_cli list_group_props GROUP_PATH
The list_group_props command lists all properties for a group identified by GROUP_PATH. Properties
include group_type (DC, room, rack, aisle, etc.), description, and additional properties unique to that group type. For example, for rack, the additional properties include capacity and total power capacity.
This command does not apply to “/”.
37

list_groups
Usage:
ompc_cli list_groups [-unique] [GROUP_PATH]
The list_groups command lists all child groups for the GROUP_PATH (immediate only). If no GROUP_PATH is supplied, the CLI lists all group paths or all unique groups in OMPC. Properties include the fully-qualified group name, group type, and member_count. The member_count property is the number of devices and groups immediately under the child group.
[-unique] has no impact if GROUP_PATH is provided.
If “/” is provided as GROUP_PATH, then the CLI lists the groups at root level.
A group might have multiple fully-qualified group names. When [-unique] is provided, the CLI lists all
unique groups; otherwise, the CLI will list all group paths.
Example output for list_groups:
group_name, group_type, member_count
myservers/mygroup, Room, 20
list_report_groups
Usage:
ompc_cli list_report_groups
The list_report_groups command is used to list all report groups. Each report group is output in one row containing these fields: report_group_name, description and created_by.
list_reports
Usage:
ompc_cli list_reports [REPORT_GROUP]
The list_reports command is used to list user defined reports. REPORT_GROUP is the name of a report
group. If no REPORT_GROUP is supplied, all reports are listed. Else, only those belonging to the specified
REPORT_GROUP are listed.
Each report is output in one row containing these fields: report_name, description, format,
report_group_name, created_by and status (running or not).
run_report
Usage:
ompc_cli run_report [-start_date <start_date>] [-end_date <end_date>] [-format <CSV|XML>] [-file_name <file_name>] [-detail] REPORT_NAME
The run_report command is used to run a saved report and export the result to the console or to a file.
38

The REPORT_NAME is mandatory and specifies which saved report are run.
The options -start_date and -end_date are optional: When supplied, they are used to run the report
in precedence to the time range saved with the original report setting. If only -start_date is supplied,
the current time is used as the end of the time range. If only -end_date is supplied, the earliest time of
monitoring data is used as the beginning of the time range.
If -file_name is not supplied, the result is displayed in the console in CSV format, ignoring whatever
format setting saved with the report or specified by the -format option.
If –file_name is supplied, the result is saved to the file in the format specified by the option –format. If
-format is not supplied, the format saved with the report is used.
The –detail option is only applied to a “Power HeadRoom” report for exporting the calculation details
of the stranded power.
After a report is run successfully, the report result is displayed in the console or saved to a file specified by <file_name>. Else, an error message is displayed.
discover_device
Usage:
ompc_cli discover_device -profile <profile-name> [-ip <ip>] [-host_name <host_name>] [-network_mask <network_mask>] [-end_ip <end_ip>]
The discover_device command is used to discover devices and automatically add the discovered
devices to OMPC. This command supports only HTTPS profile.
The -ip and -host_name options must be supplied.
When -ip is supplied, the -network_mask must be supplied. The -end_ip is only acceptable when -ip is supplied.
If -end_ip is supplied, the discovery is performed for the IP range of <ip>-<end_ip>. Else, the
discovery is performed for the single address <ip>.
After a discovery is complete, the discovered devices are added to OpenManage Power Center automatically and the count is displayed in the console. If the device discovery fails, an error message is displayed.
Command line interface error codes
An error code appears when one of the following two conditions occurs:
• The CLI identified an error, such as a command or command option validation error. The error code is generated by the CLI. The module number for the CLI is 0xEE. An error number for each command and option will display.
• An OpenManage Power Center back-end error occurs. In this situation, the error code from the server is returned by the CLI.
39

The error codes use the following format:
8E|Module|Related Module (Optional)|Detail (Optional)
OMPC modules and error codes:
• OMPC Database — 0x01
• DCM SDK — 0x02
• OMPC UI asset — 0x03
• DC Modeling — 0x04
• Overview — 0x05
• Monitoring — 0x06
• User Accounts — 0x07
• Setting — 0x08
• Event — 0x09
• Discovery — 0x0A
• License — 0x0B
• Policy — 0x0C
• Connection Pool — 0x0D
• Role/ Privilege — 0x0E
• Login/ Logout — 0x0F
• Profile — 0x10
• Available List — 0x11
• Security — 0x12
• Paging/Sorting/Filtering — 0x13
• Configuration — 0x14
• Unit Handler — 0x15
• Infrastructure — 0x16
• Unknown — 0xFF
40
5Access controlThis chapter provides information about access control in Dell OpenManage Power Center, including:
• Log in/Log out — Log into OpenManage Power Center by entering user account credentials.
• User/Role/Privilege Management — After logging in, you can manage user accounts from the Settings → Users screen of the management console. OpenManage Power Center provides role-based access control; to use these controls, set up roles first, and then define the privileges for each role. Then, you can set up OpenManage Power Center accounts and assign them to different roles.
• Licensing — OpenManage Power Center requires a valid license. Once the trial license expires, you will be required to import a permanent license.
About authentication
OpenManage Power Center supports both OpenMange Power Center users and Windows and Linux users.
For cross-domain authentication, domains must be two-way transitively trusted by the domain in which the OpenMange Power Center server is installed. Authentication of user accounts in domains that are one-way trusted or not trusted by the domain in which the OpenManage Power Center server is installed is not supported and may fail.
Logging in
Dell OpenManage Power Center supports both OpenManage Power Center-managed users and authenticated Windows and Linux users.
Logging in with a user name and password
To log into Dell OpenManage Power Center with a user name and password, use one of the following accounts:
• Power Center Account — You can create this account in OpenManage Power Center. When logging into OpenManage Power Center for the first time, you must use the Power Center user account created during installation.
NOTE: Before logging into OpenManage Power Center using either the Windows domain or the Windows local account, you must add the account into OpenManage Power Center by accessing the Settings → Users screen. For further information, see Adding A User Account.
NOTE: You cannot log into OpenManage Power Center using SSO on the OpenManage Power Center server. You only can log into OpenManage Power Center using SSO remotely.
NOTE: You must add the SSO user account to OpenManage Power Center before you can log in using SSO. You will skip the login page and enter the Home page directly using SSO.
41
• Windows Domain Account — Windows domain account.
• Windows Local Account — Windows local account on the OpenManage Power Center server.
• Linux Local Account — Linux local account on the OpenManage Power Center server.
NOTE: OpenManage Power Center requires that SSL is enabled at the LDAP server, otherwise authentication attempts will fail.
NOTE: LDAP authentication must be enabled in the Directory Settings screen. See Editing Directory Settings.
• LDAP Account
For more information on how to open the OpenManage Power Center management console, see Launching Power Center In Windows or Launching Power Center In Linux.
Logging in with a Power Center account
1. Enter the User Name and Password of the OpenManage Power Center account.
2. Select OMPC Account (default) from the Login using drop-down list.
3. Click Login.
Logging in with a Windows domain account
1. Enter the User Name and Password of the Windows domain account.
2. Select Windows Domain Account from the Login using drop-down list.
3. Enter the Domain name for the Windows domain account.
4. Click Login.
Logging in with a Windows local account
1. Enter the User Name and Password of the Windows local account.
2. Select Windows Local Account from the Login using drop-down list.
3. Click Login.
Logging in with a Linux local account
1. Enter the User Name and Password of the Linux local account.
2. Select Linux Local Account from the Login using drop-down list.
3. Click Login.
Logging in with an LDAP account
NOTE: The LDAP Account type is only available when LDAP authentication has been enabled in Directory Settings.
1. Enter the User Name and Password of the LDAP account.
2. Select LDAP Account from the Login using drop-down list.
3. Click Login.
Logging in with Single Sign-on (SSO)
SSO uses centralized authentication servers that other applications and systems use for authentication purposes together with other techniques to ensure that users do not actively have to enter their credentials more than once. Kerberos SSO requires specific settings for web browsers. Configure your web browser for SSO support. For more information, see configuration steps for Internet Explorer 10 in
42
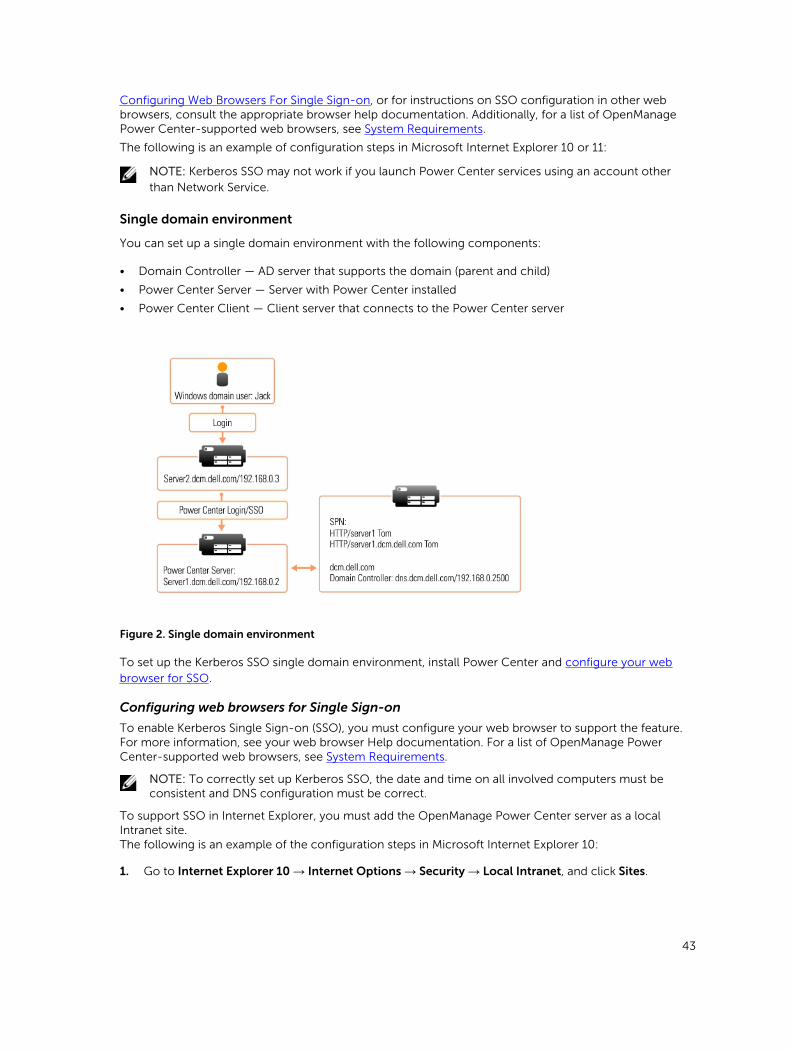
Configuring Web Browsers For Single Sign-on, or for instructions on SSO configuration in other web browsers, consult the appropriate browser help documentation. Additionally, for a list of OpenManage Power Center-supported web browsers, see System Requirements.
The following is an example of configuration steps in Microsoft Internet Explorer 10 or 11:
NOTE: Kerberos SSO may not work if you launch Power Center services using an account other than Network Service.
Single domain environment
You can set up a single domain environment with the following components:
• Domain Controller — AD server that supports the domain (parent and child)
• Power Center Server — Server with Power Center installed
• Power Center Client — Client server that connects to the Power Center server
Figure 2. Single domain environment
To set up the Kerberos SSO single domain environment, install Power Center and configure your web browser for SSO.
Configuring web browsers for Single Sign-on
To enable Kerberos Single Sign-on (SSO), you must configure your web browser to support the feature. For more information, see your web browser Help documentation. For a list of OpenManage Power Center-supported web browsers, see System Requirements.
NOTE: To correctly set up Kerberos SSO, the date and time on all involved computers must be consistent and DNS configuration must be correct.
To support SSO in Internet Explorer, you must add the OpenManage Power Center server as a local Intranet site.The following is an example of the configuration steps in Microsoft Internet Explorer 10:
1. Go to Internet Explorer 10 → Internet Options → Security → Local Intranet, and click Sites.
43
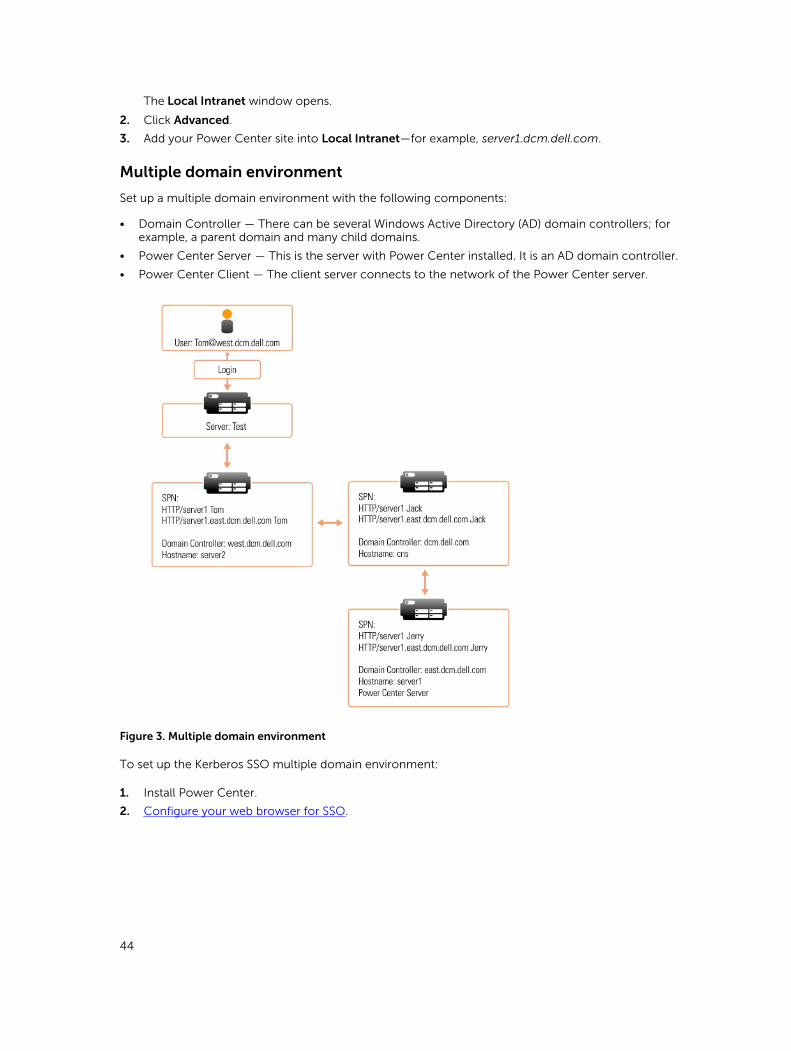
The Local Intranet window opens.
2. Click Advanced.
3. Add your Power Center site into Local Intranet—for example, server1.dcm.dell.com.
Multiple domain environment
Set up a multiple domain environment with the following components:
• Domain Controller — There can be several Windows Active Directory (AD) domain controllers; for example, a parent domain and many child domains.
• Power Center Server — This is the server with Power Center installed. It is an AD domain controller.
• Power Center Client — The client server connects to the network of the Power Center server.
Figure 3. Multiple domain environment
To set up the Kerberos SSO multiple domain environment:
1. Install Power Center.
2. Configure your web browser for SSO.
44
Windows NT LAN Manager (NTLM) authentication limitation
Dell OpenManage Power Center supports Kerberos SSO for Windows domain user authentication. To enable this feature, OpenManage Power Center is configured to support the Windows integrated authentication option which includes two authentication mechanisms: Kerberos and NTLM .
NTLM is not supported in OpenManage Power Center. If the client’s web browser uses NTLM to authenticate domain users for OpenManage Power Center, there are some limitations.
The web browser displays a message box requiring a Windows user name and password.
• If you click OK after entering a user name and password, whether the information is correct or not, the OpenManage Power Center login page displays and requires you to authenticate through the login page.
• If you click Cancel, an HTTP Status 401 failure displays, and you cannot log into Power Center.
See Troubleshooting for more information on how to handle this issue.
Logging out
To log out of Dell OpenManage Power Center when not logged in through Kerberos SSO, click Logout at the upper right corner of the management console.
When logged in through Kerberos SSO, close the web browser or the OpenManage Power Center management console to log out. Clicking Logout will not work.
Managing user roles and privileges
Dell OpenManage Power Center supports three pre-defined roles:
• Administrator: All privileges
• Power User: All privileges except Manage role/user and Manage license
• Guest: View device/group privileges only
These pre-defined roles cannot be edited or deleted.
NOTE: Only users with the Role/User Management privilege can add, edit, or delete a role or user or group account.
Adding a custom role
1. In the left pane, click Settings → Roles.
2. Click Add a Role.
The Add Role window is displayed.
3. Enter a name for the role in the Role Name text box. Make sure that the name does not exceed 50 characters.
4. Enter a description for the role in the Role Description text box. Make sure that the description does not exceed 1024 characters. This field is optional.
5. Under Select Privileges, select the check box next to the rights that you want to assign to the role. The available options are:
45
• Global Configuration
• Manage Role/User
• View Device/Group
• Manage Device/Group
• Manage Policy
• Manage Event/Log
• Manage License
• Manage Report
• Execute Power Task
• Manage Power Task
6. Click Save to add the custom role, or click Cancel to discard your changes and return to the Roles tab.
Editing a role
NOTE: You cannot edit a predefined role.
1. In the left pane, click Settings → Roles.
2. Select the check box next to the role you want to edit and click Edit.
The Edit Role window is displayed.
3. Make the required changes to the Role Name, Role Description, and Select Privileges fields for this role.
4. Click Save to save your changes, or click Cancel to discard them and return to the Roles tab.
Deleting a role
1. In the left pane, click Settings → Roles.
2. Select the check box next to the role you want to delete and click Delete.
The following message is displayed.
Are you sure you want to delete the selected item(s)?3. Click Yes to confirm the deletion, or click No to discard the delete task.
Privileges
Each pre-defined role is associated with a set of specific privileges. Additionally, you can create custom roles with one or more of the following privileges:
• Global Configuration
• Manage Role/User
• View Device/Group
• Manage Device/Group
• Manage Policy
• Manage Event/Log
• Manage License
• Manage Report
• Execute Power Task
46
• Manage Power Task
Every Power Center screen functions differently depending on the privilege level assigned to a user account:
• Fully functional—User can view and edit all.
• Partially functional—User can partially view or edit.
• Not functional—User sees a blank page.
Global Configuration
The Global Configuration privilege enables a user to change the Power Center global configuration—for example, the sampling interval and database settings. Users without this privilege can only view part of the Settings page, and cannot make any changes (the Edit option is not available).
Manage Role/User
Users with the Manage Role/User privilege can:
• Create roles
• Delete roles
• Update roles
• Create users
• Delete users
• Update users
Users without this privilege can only view their own user account information and update the password.
View Device/Group
The View Device/Group privilege enables a user to view all device and group information. Users without this privilege cannot view device or group information; they can only view the Settings page.
Users with only the View Device/Group privilege have the following restrictions:
• The Run Discovery task is not available.
• Add/Edit/Delete functionality is disabled on the Devices screen.
Manage Device/Group
The Manage Device/Group privilege enables a user to:
• Create groups
• Create a Data Center/Room/Aisle/Rack/Device
• Associate Data Center/Room/Aisle/Rack/Device/Group
• Manage a device
• Remove a device/group from the Device List
NOTE: When you assign the Manage Device/Group privilege to a user, Power Center automatically assigns the View Device/Group privilege to this user as well.
47
Users without this privilege can view all devices and group information, but cannot add/delete/edit/manage the devices and groups.
Manage Policy
The Manage Policy privilege enables a user to:
• Add/remove a policy
• Update a policy
• Start/stop Emergency Power Reduction on a device or group
NOTE: To manage a policy, you must also have the View Device/Group privilege.
Users without this privilege cannot see the Policies screen.
Manage Event
The Manage Event privilege enables a user to:
• Add/Remove an event condition (threshold)
• Update an event condition (threshold)
• Remove an event
NOTE: To manage an event, you must also have the View Device/Group privilege.
Users without this privilege can view event information and add comments to events, but cannot delete events or see the Thresholds values from the Devices screen.
Managing user accounts
You can create users and assign them to different roles.
If you have the Manage Role/User privilege, you can add, edit, or delete a user in OpenManage Power Center.
Adding a user account
1. In the left pane, click Settings → Users.
NOTE: If OpenManage Power Center is installed on a Windows Active Domain Controller server, every user account added on this server should be a Windows Domain Account.
2. Click Add a User/Group.
The Add a User or Group Account window is displayed.
3. Select the A user option.
4. Select Account Type and enter the required credentials:
The available options are:
For both Windows and Linux installations:
• OMPC Account
48
– Enter a unique User Name for the account.
– Enter a Password that is at least eight characters long and includes characters from at least three of the following categories: uppercase, lowercase, numeric, and nonalphanumeric.
– Re-enter the password in the Verify Password text box to confirm.
For a Windows installation:
• Windows Local Account — Enter a unique User Name for the account.
NOTE: If Power Center is installed on a Windows 2012 Essential server and the server is configured as a Domain controller, all user accounts on the server must be Windows Domain Accounts, and not Windows Local Accounts.
• Windows Domain Account
– Enter a unique User Name for the account.
– Enter a valid Windows Domain Name.
For a Linux installation:
• Linux Local Account — Enter a unique User Name for the account.
NOTE: While Linux Local Accounts can be changed from the Linux server, these changes are not mirrored in the same local account that was added to Power Center, and Power Center authentication attempts on this account fails. To keep the Linux Local Account in sync between Power Center and the Linux server when the local account is changed from Linux, the original account must be deleted from Power Center and the changed account must be created in Power Center as a new Linux Local Account.
• LDAP Account — Enter a unique User Name for the account.
NOTE: A user description is useful when there are two users with the same user name. Two user accounts with the same user name are only possible where the user types are different.
5. Enter a description of this user account (optional) in the Description text box.
6. From the Roles drop-down list, select the user and group roles. If the role you want is not available in the drop-down list, click Create New to open the Add Role wizard. For more information, see Dell OpenManage Power Center User’s Guide.
7. Click Save to add the user account, or click Cancel to discard your changes.
Adding a group account
1. In the left pane, click Settings → Users.
2. Click Add a User/Group.
The Add a User or Group Account window is displayed.
3. Select the A group option.
4. Select a group Account Type.
The available options are:
• Windows Local Group
• Windows Domain Group
5. Enter a unique group user name in the User Name text box.
6. Enter a description of the group account (optional).
7. If you select the Windows Domain Group account type, enter a valid Windows domain name in the Domain name text box.
49
8. Select between one and four user roles and privileges. If the role you want is not available in the drop-down list, click Create New to open the Add Role wizard. For more information, see Dell OpenManage Power Center User’s Guide.
9. Click Save to add the new group, or click Cancel to discard your changes.
Editing a user or group account
1. In the left pane, click Settings → Users.
2. Select the check box next to the user or group account that you want to edit, then click Edit.
The Edit a User or Group Account window is displayed.
3. Make the required changes, then click Save to save your changes, or click Cancel to discard them and return to the Users tab.
Deleting a user or group account
NOTE: You cannot delete the Power Center managed user (super user) created during installation.
1. In the left pane, click Settings → Users.
2. Select the check box next to the user or group account you want to delete.
3. Click Delete.
The following message is displayed
Are you sure you want to remove the selected item(s)?4. Click Yes to proceed or No to return to the Users tab.
Changing a user account password
Do one of the following:
• Change the password of the current user.
a. In the top right hand-side of the OpenManage Power Center screen, click the user account name with which you are currently logged in. The Current User window is displayed.
b. Enter the current password in the Current Password text box.
c. Enter the new password in the New Password text box.
d. Enter the new password again in the Verify Password text box to confirm.
e. Click Save to apply the new password or click Cancel to discard your changes.
• Change any user or group account password on the Settings → Users screen.
1. Click Settings → Users and select the check box next to the user account whose password you want to change.
2. In the task menu, click Edit.
3. Enter the new password in the Password text box.
4. Enter the new password again in the Verify Password text box to confirm.
5. Click Save to change the password, or click Cancel to discard your changes.
Viewing current user informationYou can view current user information and update the current user’s password.
To view current user information, click the login user name in the upper-right corner of the OpenManage
Power Center screen, or go to Settings → Users.
50

To change the current user password, see Changing A User Or Group Account Password.
51
6Task managementThe Tasks feature enables you to perform device discovery and power control tasks such as power-on and power-off, on a specific device or group of devices.
In the left pane, click Tasks. The Tasks screen comprises the following tabs:
• Discovery Tasks
• Power Control Tasks
By default, the Discovery Tasks tab is displayed.
On the Tasks screen you can:
• Create new discovery and power control tasks
• Edit or delete discovery and power control tasks
• Start or re-run discovery and power control tasks
• Enable or disable power control tasks
• Refresh the list of discovery or power control tasks
• View the summary of the discovery or power control tasks
NOTE: If you schedule a task at a non-existent time when the daylight saving is effective, the Web browsers align themselves to the accurate time.
Discovery tasks
The Device Discovery privilege enables you to discover network devices. Users without this privilege can view the Devices screen, but cannot make any changes.
To manage devices in Dell OpenManage Power Center, you must have Manage Device/Group privileges, and you must first add the devices to the OpenManage Power Center management console. OpenManage Power Center discovers devices using IP ranges and collects basic information about each device, such as:
• Device name
• Connection status
• Device type
• Device model
• IP address
• Hostname
52
This information enables you to track device status and data center information. You can also manage these discovered devices in Power Center. If there is a new or changed device in your data center, you can use the device discovery function to rediscover the devices.
There are two ways to add a device in Power Center:
• Using a single IP address or IP ranges or host names to discover devices on the network, at the scheduled time.
• Using the OpenManage Power Center management console to specify device properties and discover devices.
NOTE: If you use a network security policy, the discovery function may not work properly.
NOTE: When you use multiple IPMI protocols to discover Dell’s 13th generation PowerEdge systems, make sure that the IP addresses for the protocols are correct. In case you enter an incorrect IP address, wait for sometime before running the discovery task again.
After a device is discovered, it is automatically added to the Devices → All Devices tab. The device can be assigned to a group and managed by OpenManage Power Center.
After you have created a discovery task, you can also re-run the task when needed. Discovery tasks can also be scheduled to run later or run immediately.
Creating discovery tasks
You can create discovery tasks using the New Discovery Task wizard.
1. In the left pane, click Tasks → Discovery Tasks → New Discovery.
The New Discovery Task wizard is displayed.
2. In the Discovery tab, enter a name for the discovery task.
3. If you want the discovery to cover a range of systems, select the IP-Address Range and specify the Subnet Mask. Else, select the Single Device option to run the discovery task for a single device and specify the IP address or host name of the device.
You can add multiple ranges or host names (devices).
NOTE: The Subnet Mask is not required for single devices.
4. Click Add. The IP address range is specified at the bottom part of the screen.
5. Click Next to view the Connection Protocol tab.
6. Select the check box next to a protocol profile from the list for the discovery task or click Add to create a profile and click Next. For more information, see Protocols.
7. In the Schedule Task tab, select the Run Now option to start the discovery task immediately.
Alternately, you can select the Set Schedule option to start the discovery task at a specific interval. The possible options are:
• Run Once — Specify the date and time when you want the discovery task to begin.
• Periodic — Specify if you want the discovery task to start hourly, daily, weekly, or at a specific interval.
a. Select or clear the Activate check box to enable or disable the scheduling of the task. By default, the check box is selected. You can save an inactive task, but it will not be scheduled to run.
NOTE: You can edit the task to clear or select the Activate check box and view the status of the task in the Discovery Tasks tab.
b. Under the Range of recurrence option, select the start and end date for the task, or select the No End Date option to run the task for an unlimited period.
53
c. Click Next to view the summary of the discovery task in the Summary tab.
The summary comprises the name of the task, protocol used, IP ranges, and schedule.
NOTE: Make sure that the browsers used for scheduling discovery tasks are daylight saving-compliant.
8. Click Finish to create the discovery task and return to the Discovery Tasks tab.
Viewing devices in a chassis
Dell OpenManage Power Center allows you to view the installed devices in a chassis. Further, if you have physically added, removed, or changed the devices in a chassis, you can update the device information in Power Center.
1. In the left pane, click Devices → All Devices or Devices → Managed Group.
2. From the list of devices, select a chassis.
The details of the chassis are displayed in the <Device> Details → Summary tab.
Re-running recent discovery tasks
1. In the left pane, click Tasks.
a. Click Run Discovery in the task menu, and then click Next to select a discovery task.
2. Click the Re-run Recent Discovery Job radio button, and then click Next..
The Re-run Discovery Jobs screen appears.
3. Select one or more recent discovery jobs from the list; use the right-facing caret to expand and view details of each job.
4. Click Back to return to the Connection Protocol screen, click Next to continue, or click Cancel to discard your discovery job.
5. In the Schedule Job screen, determine when you want your discovery job to run. You can choose between running the job now, or scheduling the job to run at a future time.
6. Click Back to select a different job to re-run, click Finish to continue, or click Cancel to discard your discovery task.
7. Click Jobs in the left navigation pane to view your discovery job.
8. After the discovery job completes, go to the Devices screen, and make sure the correct devices are listed.
Power control tasks
Power control tasks help you to mange the power-on or power-off of devices. You can schedule the time at which the power control tasks must be performed on the devices or device groups.
Creating power tasks
You can create power tasks using the Power Task wizard.
1. In the left pane, click Tasks → Power Control Tasks → New Task.
The Power Task wizard is displayed.
2. In the Power Task tab, enter a name for the power control task and select one of the following options:
• Power On
54
• Power Off
• Graceful Shutdown
• Reset System (warm boot)
• Power Cycle System (cold boot)
Restarting a system forcefully is called ‘warm boot’ while closing all the programs and shutting down a system is called ‘cold boot’.
3. Select the Perform random power on commands check box, specify the interval (in minutes) and the number of devices to which you want to apply the power task, and click Next.
4. In the Associated Devices/Groups tab, select the devices in the All Devices tab or in the Grouped Devices tab, select the device groups that you want to manage and click Next.
5. In the Schedule Task tab, select the Run Now option to start the power control task immediately.
Alternately, you can select the Set Schedule option to start at a specific interval. The possible options are:
• Run Once — Specify the date and time when you want the power control task to begin.
• Period — Specify if you want the power control task to run the power control task daily, weekly, or at a specific period.
a. Select or clear the Activate check box to enable or disable the task. By default, the check box is selected. You can save a disabled task, but cannot run it.
b. Under the Range of recurrence option, select the start and end date for the task, or select the No End Date option to run the task for an unlimited period.
c. Click Next. Enter the iDRAC/IPMI user name and password of the device on which you want to run the power control task.
6. Click Finish to create the power control task and return to the Power Control Tasks tab.
Protocol profile
Power Center server uses a protocol profile to communicate with devices. The protocol profile specifies the connection protocol and credential information of a device. You select a protocol profile when you discover a new device.
You can set up multiple protocol profiles for each device. Additionally, you can add a profile, edit an existing profile, or delete a profile.
Power Center supports the following connection protocol types, and includes several optional settings:
NOTE: Get the correct protocol type and credential information from your system administrator. The user name and password for the IPMI/WS-MAN protocol must be the same as those used for the iDRAC/CMC Web console.
• IPMI: Select IPMI protocol for the server.
– IPMI User Name — Maximum length is 16 characters.
– IPMI Password — Maximum length is 255 characters.
– IPMI Key — A string of 40 hex digits.
• WS-MAN: Select WS-MAN protocol for the chassis.
– WS-MAN User Name — HTTP basic user name; maximum length is 255 characters.
– WS-MAN Password — HTTP basic password; maximum length is 255 characters.
– WS-MAN Port — Default value is 443, or enter a port number from 1 to 65535.
55
– WS-MAN Validate Certificate — (Optional) Enables device certificate validation.
NOTE: A trusted certificate must be imported into the system before the WS-MAN Validate Certificate option is enabled, or communication may fail. For more information on how to install the certificate using the Dell Chassis Management Controller, see the white paper Using Windows Remote Management (WinRM) to Remotely Manage Dell PowerEdge M1000e Using the Chassis Management Controller (CMC) located at http://www.delltechcenter.com/page/dcim.modular.cmc.winrm. For more information on how to import the certificate to Power Center, see Managing Certificates.
• SNMP v1v2c (UPS/PDU): Select an SNMP protocol version from SMMPv1 or SNMP v2/v2c for the PDU or UPS.
– SNMP Community string – (Required) Maximum length is 255 characters.
• SNMP v3 (UPS/PDU): Select SNMP v3 for the PDU or UPS.
– SNMP User Name — (Required) Maximum length is 255 characters.
– SNMP Authentication Password — (Required) Maximum length is 16 characters.
– SNMP Encryption Password — Maximum length is 255 characters. When the SNMP Authentication Password is empty, the SNMP Encryption Password is also empty.
• HTTPs — Select the HTTPs based device communication for managing third-party enclosures.
– HTTPs User Name — The user name for HTTPs-based device communication. Maximum length is 255 characters.
– HTTPs Password — The password for HTTPs-based device communication. Maximum length is 255 characters.
– HTTPs Port — The port for HTTPs-based device communication. Enter a port number from 1 to 65535. The default port 443.
• SSH — Select the SSH based device communication for managing third-party enclosures.
– SSH User Name — The user name for SSH-based device communication for managing third-party enclosures. Maximum length is 255 characters.
– SSH Password — The password for SSH-based device communication. Maximum length is 255 characters.
– SSH Port — The port for SSH-based device communication. Enter a port number from 1 to 65535. The default port is 22.
NOTE: You can change the protocol timeout settings in the Settings → General tab.
Adding a protocol
1. In the left pane, expand Tasks, and click Protocols.
The Select Connection Protocol screen is displayed.
2. In the task menu, click Add.
The Add Protocol window is displayed.
3. Enter a name for the protocol in the Profile Name text box.
4. Enter a description for the protocol in the Description text box.
5. Under Protocol Information, select one of the following options:
• IPMI (Server)
• WS-MAN (Chassis)
• SNMPv1v2c (UPS/PDU)
• SNMPv3 (UPS/PDU)
56

• HTTPS
• SSH
Editing a protocol
You can edit the protocol information of a device.
1. In the left pane, expand Tasks and click Protocols.
The Select Connection Protocol screen is displayed.
2. Select the check box next to the protocol you want to edit.
3. In the task menu, click Edit.
The Edit Protocol window is displayed.
4. Make the required changes.
5. Click Finish to save your changes, or click Cancel to discard them.
Deleting a protocol
1. In the left pane, expand Tasks, and click Protocols.
The Select Connection Protocol screen is displayed.
2. Select the check box next to the connection protocol that you want to delete.
3. In the task menu, click Delete.
The following message is displayed.
Are you sure you want to delete the selected protocol(s)?4. Click Yes.
57
7Device ManagementThe Devices feature enables you to view and manage the network-discovered devices and devices added manually. You can also categorize the devices into groups.
In the left pane, click Devices. The Devices screen is displayed and comprises the following tabs:
• All Devices
• Managed Groups
By default, the All Devices tab is displayed.
You can also view the details of a specific device or device group at the bottom section of the Devices screen. The details are categorized into the following tabs:
• Summary
• Events
• Policies
• Power & Thermal
Adding a new deviceThe Add New Device window allows you to manually add a new device to the device list. You can add only unsupported devices and create a group structure to build the data center.Dell OpenManage Power Center cannot discover or manage all device types, and you must manually add unsupported devices to complete the data center group structure. For supported devices:
• Discover and add a supported device to the system.
• Perform management functions including discovery, adding to the group structure, monitoring power and temperature, applying power management policies, and sending events.
For unsupported devices:
• Dell OpenManage Power Center does not communicate with unsupported devices, therefore connection protocol and credential information is not necessary.
• Unsupported devices cannot be discovered; they can only be added manually to the system.
• Dell OpenManage Power Center adds the unsupported device to the group structure, but cannot manage it using the available management functions.
1. In the left pane, click Devices → All Devices → Add New.
The Add New Device window is displayed.
2. Enter the name of the device you want to add in the Device Name text box.
3. Enter a valid IP address in the IP Address text box or a host name for the device in the Hostname text box.
58
4. Specify the model of the device in the Model text box.
5. From Additional Information → Size of Device (U) drop-down list, select the size of the device you want to add, in rack units (U).
6. Enter a description for the device in the Description text box.
7. Enter the maximum power estimate, in watts, for the device in the Estimated Max Power text box.
8. Click Finish to add the device, or click Cancel to discard your changes.
The device is displayed in the All Devices tab.
Adding an existing groupYou can use the Managed Groups feature to add sub-groups to an existing group. The sub-groups can be new or existing ones.
1. In the left pane, click Devices → Managed Groups.
2. Click the group to which you want to add a sub-group.
3. In the task menu, click Add New.
The Add New Device/Group window is displayed. For more information on adding a new group to an existing group, see Creating A New Group
4. Click the Add Existing Group tab and select the option button next to the group to which you want to add the existing group.
By default, the group in the recent hierarchy navigation is selected.
5. In the list of existing groups, select the check box next to existing groups you want to add.
6. Click Finish to add the group or click Cancel to return to the Devices → Managed Groups screen without saving the changes.
Adding a device from the networkYou can use the Power Center management console to discover a device from the network.
NOTE: Power Center server tries to get device names from the DNS server specified in the network configuration of the operating system. This may cause the device name to be different from the actual one if the DNS server resolves the device IP address to a different device name.
Before adding a device from the network, make sure the DNS server is set up correctly. Specifically, make sure that:
• There is a DNS server running on the Power Center network.
• The specified DNS server has a reverse DNS zone for the network on which you are trying to discover the devices.
To manually add a device to the Power Center, see Adding A New Device
Filtering devicesThe filter feature in the All Devices tab helps you to view devices that share a certain attribute. For example, you can view devices of a certain device type or devices that share an IP range.
1. In the left pane, click Devices.
59
The All Devices tab is displayed by default.
2. In the task menu, click Filter.
The Device Filter window is displayed.
3. Do one of the following:
• Select the IP Range check box and enter the start and end IP address of devices.
• Select the Device Type check box and select the device type from the drop-down list. The available options are:
– Server
– Chassis
– PDU
– UPS
– Unsupported
You can select multiple device types.
• Select the Power Capability check box and select the power capability of the device from the drop-down list. The available options are:
– Unknown — Indicates that the power capability of the device is unknown.
– None — Indicates that the device does not have power capability.
– Monitor — Indicates that the device has aggregate power monitoring capability.
– Monitor and capping — Indicates that device has aggregate power monitoring and power capping capability.
– Monitor, upgradeable — Indicates that the device can be upgraded with the iDRAC enterprise license for power capping.
– Instantaneous power — Indicates that the device has instantaneous power monitoring capability.
– Monitor disabled — Indicates that the monitoring capability of the device is disabled due to expiry or absence of “non-dell system monitoring” license.
You can select multiple power capabilities.
• Select the Protocol check box and select the protocols used for communication. The available options are:
– IPMI (Server)
– WS-MAN (Chassis)
– SNMPv1v2c (UPS/PDU)
– SNMPv3 (UPS/PDU)
– HTTPS
– SSH
You can select multiple protocols.
• Select the Status check box and select device status from the drop-down list. The available options are:
– Connected
– Lost Connection
– Unknown
You can select multiple statuses.
60
• Select the Date Range check box and enter the start and end date of device discovery. Enter the dates manually following the format MM/DD/YYYY, or select the dates from the calendar. Devices discovered from 00:00:00 of start date to 00:00:00 of the next day after the end date are displayed. For example, if you enter the filtering option 01/01/2013 as both start date and end date, all devices discovered between 00:00:00 of 01/01/2013 and 00:00:00 of 01/02/2013 are displayed.
• Select the Device Model check box and enter the model of the device. The device model is the specific model information of a device type, for example, Dell PowerEdge M610. If you select both Device Type and Device Model, make sure that the device type and the device model match. Else, the results are not displayed.
• Select the Estimated Max Power (W) check box and enter the maximum power for device. The estimated max power is considered as the peak power consumption by a device.
4. Enter a name for the filter in the Filter Name (Optional) text box, and click Save and Run to save the filter and sort the devices based on the filter criteria.
OR
• Click Run Once to view a filtered list of devices.
OR
• Click Cancel to return to the All Devices tab.
You can use the saved filters later.
Editing a deviceYou can edit devices or device groups from the Devices screen.
1. In the left pane, click Devices.
2. Select the check box next to the device or device group that you want to edit.
3. Click Edit.
The Edit Entity screen is displayed.
4. Make the required changes.
For devices, you can edit the name of the device, device description, size of the device, and estimated maximum power. For device groups, you can edit the group type, group name, group description, and power capacity.
5. Click Finish to save your changes, or click Cancel to return to the Devices screen without saving your changes.
Deleting devices using a filterYou can also delete devices using the Filter feature.
1. In the left pane, click Devices.
2. In the task menu, click Filter.
The Device Filter window is displayed.
3. Select the filter by which you want to sort the devices list.
4. Select the check boxes next to the devices that you want to delete.
5. In the task menu, click Delete.
61
The following message is displayed.
Are you sure you want to delete the selected item(s)?6. Click Yes to proceed with the deletion.
Sorting devicesBy default, the devices In the All Devices tab, are listed by Name in alphabetical order (A-Z). But you can sort the list as per your requirement.
1. In the left pane, click Devices to view the list of all devices.
2. To sort the devices, click the ‘up’ or ‘down’ arrow next to one of the following column headers:
• Status
• Device
• Device Type
• Device Size
• Device Model
The ‘up’ or ‘down’ arrow is displayed next to the column header by which the display is sorted.
Managing groups
OpenManage Power Center enables you to create groups for organizing devices, so that you can manage them more efficiently. The groups can be of the following types:
• Datacenter
• Room
• Aisle
• Rack
• Custom
In the left pane, click Devices → Managed Groups. In this tab, you can:
• View details of a specific device group
• Add groups
• Edit groups
• Delete groups
• Refresh the list of device groups
• Move devices from one group to another
• Manage racks
• Enable or disable Emergency Power Reduction (EPR)
• View rack utilization graphs
Mapping Group Structure Information
Dell OpenManage Power Center supports group structure mapping for Dell PowerEdge rack servers and tower servers.
62
After you create or update the group structure, Power Center automatically updates the location information in the firmware of supported devices using the following mapping structure:
• Data Center — Data center and room information in Power Center; format: <Data Center - Room>
• Aisle — Aisle information in Power Center
• Rack — Rack information in Power Center
• Rack Slot — Rack slot information in Power Center
• Custom — Customize the device group
NOTE: To view updated location information on supported device, you must make sure the device status has a Connected status in Power Center. It may take a few minutes for location information to update in device firmware.
Creating a new group
A group can represent the actual structure of a data center, room, aisle, rack, or custom. You can nest groups in parent-child relationships to represent how the devices in your data center are physically configured.
1. In the left pane, click Devices → Managed Group.
2. In the task menu, click Add New.
The Add New Device/Group window is displayed. By default, the Root devices group is selected.
3. Enter a name for the group in the Name text box.
NOTE: The name must be unique across groups and devices under the parent group.
4. From the Type drop-down list, select the group type.
The available options are:
• Datacenter
• Room
• Aisle
• Rack
• Custom
For racks,
• Select the space capacity from the Space Capacity (U) drop-down list.
• Enter the power capacity in the Power Capacity (W) text box. The power capacity is determined by the power distribution to the rack.
• (Optional) Select the Use PDU Power Consumption check box. By default, this check box is cleared.
5. Enter a description for the group in the Description text box.
6. Click Finish to save the new group or click Cancel to return to the Devices → Managed Group screen without saving the changes.
Moving device groups or devices
You can move a manually added device to an existing group as well as move groups of devices from one group or rack to another. You can also move a group of devices from one slot to another slot in a rack.To move a device from one slot to another within a rack, see Manage Racks.
63
NOTE: Any power policies in effect will be recalculated after moving a group.
1. In the left pane, click Devices → Managed Groups.
2. Select the device group you want to move.
3. In the task menu, click Move.
The Move To Group window is displayed with the list of groups. The Current Entity field displays the name of the group with which the devices are currently associated.
The Move To displays the Other option that is selected by default.
4. Select the group to which you want to move the group or device.
5. Click Finish to return to the Devices screen, or click Cancel to discard your changes.
6. Confirm the move:
a. Click the Devices → Managed Groups.
b. Using the device tree, select the group to which you added the group or device, and check to make sure that the device is listed as expected.
Managing Racks
Dell OpenManage Power Center allows you to manage racks and the slotted and associated devices that have been added to the Power Center system.
The Manage Rack wizard comprises of the following tabs.
• Rack Contents
• Associated Devices
In the Rack Contents tab you can configure a rack selected in the Devices screen in the following ways:
• Add devices to rack slots
• Rearrange devices within rack slots
• Remove devices from rack slots
• Edit devices
In the Associated Devices tab you can manage devices such as PDUs that are not added to a rack slot, but are associated with the rack, in the following ways:
• Add an associated device to the rack
• Edit an associated device that has already been added to the rack
• Remove an associated device from the rack
Adding a device to a rack slot
1. In the left pane, click Devices → Managed Groups.
2. From the list of devices, select a rack device.
3. From the devices menu, click Manage Rack.
The Manage Rack window is displayed. By default, the Rack Contents tab is displayed.
4. In the Rack Contents tab, click Add to Rack Slot.
The Add to Rack Slots wizard is displayed.
5. Select the check boxes next to the devices you want to add to the rack and click Next.
6. From the Select drop-down list next to the devices you want to add to the rack, select the slots into which you want to place the devices.
64
7. Click Finish to return to the Manage Rack screen and review your changes.
Adding an associated device to a rack
1. In the left pane, click Devices → Managed Groups.
2. From the list of devices select a rack device.
3. In the task menu, click Manage Rack → Associated Devices → Add To Rack.
The Associate a Device with a Rack window is displayed.
4. Select the check box next to the device that you want to associate with the rack.
5. Click Finish to return to the Manage Rack screen and review your changes, or click Cancel to return to the previous screen.
Editing a rack-associated device
1. In the left pane, click Devices → Managed Groups.
2. From the list of devices select a rack device.
3. In the task menu, click Manage Rack → Associated Devices → Add To Rack.
4. From the list of devices, select the device you want to edit, and click Edit.
5. Make the desired changes.
6. Click Finish to return to the Manage Rack screen and review your changes, or click Cancel to return to the previous screen.
Rearranging devices in a rack
1. In the left pane, click Devices → Managed Groups.
2. From the list of devices select a rack device.
3. In the task menu, click Manage Rack.
The Manage Rack window is displayed. By default, the Rack Contents tab is displayed.
4. In the Rack Contents tab, click Rearrange Rack.
The Move In Rack window is displayed with the list of slotted devices.
5. From the Slot drop-down list next to the devices you want rearrange, select the slots into which you want to move the devices.
6. Click Finish to return to the Manage Rack screen and review your changes.
Removing a rack-associated device
1. In the left pane, click Devices → Managed Groups.
2. From the list of devices select a rack device.
3. In the task menu, click Manage Rack → Associated Devices.
4. Click the Associated Devices tab.
5. Click Remove, and then provide the requested information.
6. Click Finish to return to the Manage Rack screen and review your changes, or click Cancel to return to the previous screen.
Removing slotted devices from a rack
1. In the left pane, click Devices → Managed Groups.
2. From the list of devices select a rack device.
3. In the task menu, click Manage Rack.
65
The Manage Rack window is displayed. By default, the Rack Contents tab is displayed.
4. From the list of devices in the rack slots, select the device you want to remove and click Remove from Rack.
NOTE: The device is immediately removed from the rack when you click Remove from Rack, but you can add the device back if you make a mistake.
Viewing a rack utilization graph
Dell OpenManage Power Center allows you to view a graphical representation of different aspects of rack utilization for custom and physical entitles within the Power Center system. This information can help you determine the availability of space and power within specific racks to add new devices.
1. In the left pane, click Devices → Managed Group.
2. From the list of device groups, select a group that contains a rack device.
The details of the device are displayed in the <Device> Details section.
3. Click Power & Thermal → View Rack Utilization.
Alternately, you can also click Summary → View Rack Utilization.
The Utilization window is displayed.
NOTE: The View Rack Utilization option is available only for groups of the types — datacenter, room, and aisle.
4. Click the Power Utilization or Space Utilization, and Actual or Percentage options to change the data viewed.
5. Click X in the upper-right corner to return to the Managed Groups tab.
A rack may not be displayed in the rack utilization graph if:
• the actual power of a device or devices in the rack exceeds the specified power capacity.
• the estimated maximum power for a device in the rack is not set.
Deleting a group
1. In the left pane, click Devices → Managed Groups.
2. In the Managed Groups tab, select the group that you want to delete.
3. In the task menu, click Delete.
The Delete Group window is displayed with the details of the managed group that you want to delete.
4. Click Confirm to proceed with the deletion.
Emergency Power Reduction
When there is an emergency situation—for example, a power failure and your devices are running on UPS, you can initiate Emergency Power Reduction to reduce the power consumption of your managed devices.
CAUTION:
Applying emergency power reduction will throttle power on the devices down to an extremely low level, which will impact performance. All devices with Monitor & Capping power capability are impacted. Use this only in an emergency situation.
66
All of the devices with the Monitor & Capping power capability within this group are set to the minimal power consumption state. The Emergency Power Reduction button appears in the upper-right corner of all pages. The devices impacted by emergency power reduction are marked with EPR in the Devices screen.
Enabling Emergency Power Reduction
1. In the left pane, click Devices → All Devices or Devices → Managed Groups.
2. From the list of devices, select the device (data center, room, aisle, rack, or chassis) to which you will apply the Emergency Power Reduction.
3. In the task menu, click Enable EPR.
The following message is displayed.
Applying Emergency Power Reduction will throttle power down to an extremely low level, and impact performance. Do you want to continue?
4. Click Yes to proceed.
Disabling Emergency Power Reduction
Disabling Emergency Power Reduction (EPR) restores device power to its full state.
NOTE: For instructions on applying EPR to an entity, see Enabling Emergency Power Reduction.
NOTE: It may take a few moments for the Power Center console to reflect the disabling of EPR. You can manually refresh your screen to see the updated EPR status notification in the upper right corner of the screen.
NOTE: The red EPR status notification icon only appears in the upper right corner of the screen when EPR has been applied to a device.
1. From any screen within Power Center, click the red EPR status notification in the upper right corner of the screen or in the left pane, click Devices → All Devices, or Devices → Managed Groups.
NOTE: If the devices on which you enabled EPR do not appear on the list, click Refresh.
A pop-up window opens listing the Name of the entity under EPR and a Timestamp reflecting the time EPR went into effect.
2. Click the View EPR button.
The Emergency Power Reduction window is displayed.
3. Select the entity (data center, room, aisle, rack, or chassis) for which you want to disable EPR.
4. In the task menu, click Disable EPR.
67
8Power MonitoringPower Center enables the monitoring of current or historical power-related metrics (for example, power consumption or cost). This can help you understand the power status in the data center and plan for additional power infrastructure, cooling, and facility needs.
You can monitor power at different device and/or group levels. You can configure power monitoring settings to meet your monitoring needs, and you can print the power status graph.
Power monitoring levels
OpenManage Power Center provides power monitoring at the following levels for groups:
• Rack
• Aisle
• Room
• Data center
• Custom
Power thresholdsIt is useful to monitor thresholds when you want to be notified when the power of a group and/or device exceeds the set limits.
1. In the left pane, Click Devices.
2. From the All Devices or the Managed Groups tab, select the group or device for which you want to set the threshold.
3. In the details section of the screen, click Power & Thermal.
4. Under Power Alert Thresholds (W)
5. Enter values in the Upper Warning and Upper Critical text boxes.
When the power exceeds the upper warning value, a warning-level event alert is sent. When the power exceeds the upper critical value, a critical-level event alert is sent.
6. Click Save.
For more information on configuring the device/group range and sampling interval, see Monitoring Settings.
For more information on configuring default units and energy consumption, see Configuring Energy Consumption Cost Settings.
68
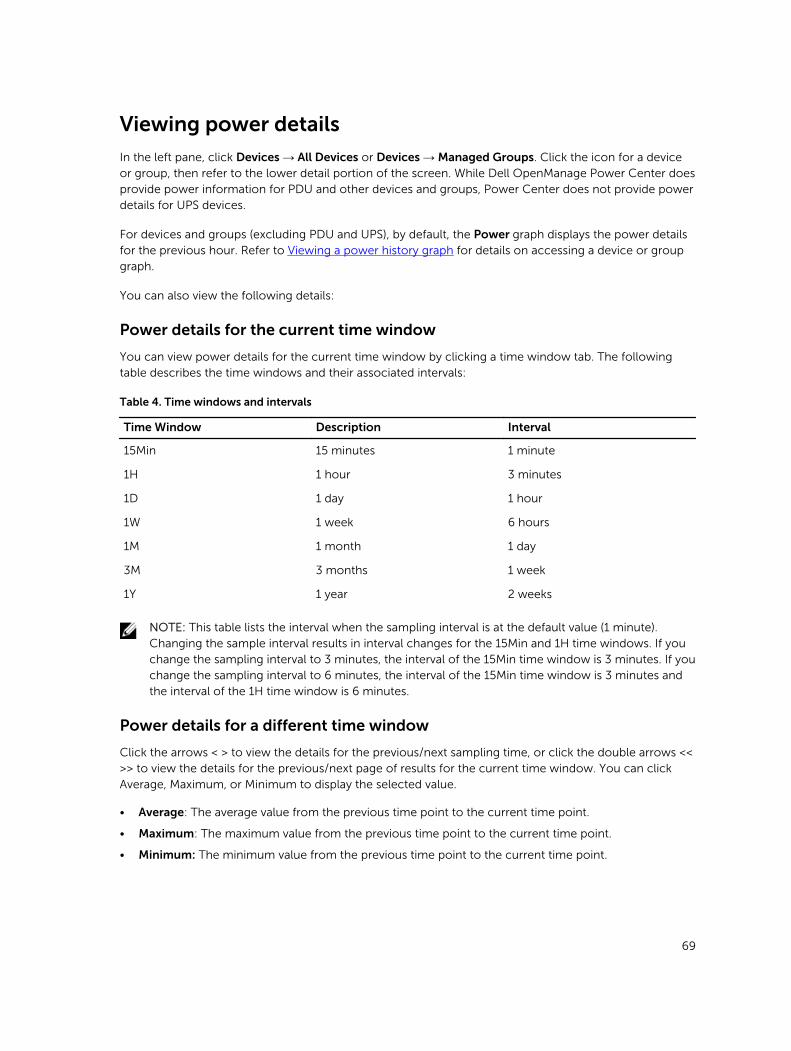
Viewing power details
In the left pane, click Devices → All Devices or Devices → Managed Groups. Click the icon for a device or group, then refer to the lower detail portion of the screen. While Dell OpenManage Power Center does provide power information for PDU and other devices and groups, Power Center does not provide power details for UPS devices.
For devices and groups (excluding PDU and UPS), by default, the Power graph displays the power details for the previous hour. Refer to Viewing a power history graph for details on accessing a device or group graph.
You can also view the following details:
Power details for the current time window
You can view power details for the current time window by clicking a time window tab. The following table describes the time windows and their associated intervals:
Table 4. Time windows and intervals
Time Window Description Interval
15Min 15 minutes 1 minute
1H 1 hour 3 minutes
1D 1 day 1 hour
1W 1 week 6 hours
1M 1 month 1 day
3M 3 months 1 week
1Y 1 year 2 weeks
NOTE: This table lists the interval when the sampling interval is at the default value (1 minute). Changing the sample interval results in interval changes for the 15Min and 1H time windows. If you change the sampling interval to 3 minutes, the interval of the 15Min time window is 3 minutes. If you change the sampling interval to 6 minutes, the interval of the 15Min time window is 3 minutes and the interval of the 1H time window is 6 minutes.
Power details for a different time window
Click the arrows < > to view the details for the previous/next sampling time, or click the double arrows << >> to view the details for the previous/next page of results for the current time window. You can click Average, Maximum, or Minimum to display the selected value.
• Average: The average value from the previous time point to the current time point.
• Maximum: The maximum value from the previous time point to the current time point.
• Minimum: The minimum value from the previous time point to the current time point.
69

For example, you view power details in the 1H (1 hour) window and the maximum value at 15:00 shows 500W and the time interval is 6 minutes. This value would represent that the maximum power consumption from 14:54 to 15:00 is 500W.
NOTE: It is common to see some instantaneous values exceed the Power Cap value in the Maximum line. Power Center monitors this value and controls it to the normal power range with this happens. You only need to pay attention when the Average power value exceeds the Power Cap value.
NOTE: You can set the time interval (the period from a time point to the next time point) in the Settings page. For information on configuring the interval, see Monitoring Settings.
Power details for racks
For racks, you can click Power Consumption to display PDU power consumption for all rack PDUs.
You can also click Power Policies to change a power policy.
NOTE: The Power Policies button is only enabled if you have configured a power policy in the Policies page.
You can view the following power details of PDU devices. For more information on supported PDU devices, see System Requirements.
• PDU device information, including PDU name, model, and IP address.
• PDU outlet information, including outlet number, power (W), voltage (V), amps (A), and the time of the information recorded, following the format <YYYY-MM-DD HH:MM:SS>. The table lists the information for each outlet and the total power consumption for all outlets.
NOTE: For PDU outlet information, Power Center only supports the Dell Managed Rack PDU 6605.
Viewing Energy Consumption
Details of each device and device group power consumption are available on all tabs of the Devices screen.
• IT Equipment Energy — The total energy consumption and cost for all managed devices in the selected device or device group.
NOTE: Power Center can read the power consumption of a device when it as at S0 (On) state. For devices in S4/S5 state, Power Center uses a fixed value (30W) to calculate the power consumption.
• Cooling Energy — The estimated energy consumption and cost needed to cool the selected device/group.
Cooling Energy = IT Equipment Energy * Cooling Multiplier
You can configure the cooling multiplier on the Settings → Monitoring screen, in the Energy Consumption Cost section.
• Energy Consumed (Total) — The combined energy consumption and costs for the IT equipment and cooling energy. The formula is:
70

Cost = (IT Equipment Energy T1*Cooling Multiplier) *Flat Rate T1+(IT Equipment Energy T2*Cooling Multiplier) *Flat Rate T2+°¦+(IT Equipment Energy Tn*Cooling Multiplier) *Flat Rate Tn
NOTE: T1/T2/.../Tn is the time period (in hours) at a certain flat rate.
NOTE: By default, the Cost column displays 0. You must configure the cost rate to see the cost.
The rate is a global setting, and can be set on the Settings → Monitoring page.
NOTE: The Energy Consumption Cost section displays information based on the values configured in the Settings screen. This information should be used as an estimate only.
NOTE: When a device or group is newly-added or created in Power Center, the power and energy consumption data displayed in the "1W" and "1M" time windows are different if the monitored time is less than 1 week, and the data displayed in the "1H" and "1D" time windows are different if the monitored time is less than 1 day. This occurs because Power Center uses different sampling intervals for different time windows. For example, a device is added into Power Center at 2011-10-15 09:00, and the current time is 2011-10-17 11:10. For the 1M time window (sampling interval is 1 day), the power and energy consumption is calculated from 2011-09-17 00:00 to 2011-10-17 00:00. For the 1W time window (sampling time is 1 hour), the power and energy consumption is calculated from 2011-10-10 11:00 to 2011-10-17 11:00. There is an 11 hour gap; therefore, the data displayed in the two time windows are not the same.
Viewing a power history graphDell OpenManage Power Center provides a visual representation of the temperature history of the system devices.
1. In the left pane, click Devices → All Devices or Devices → Managed Group.
2. From the list of devices, select a device.
The details of the device are displayed in the <Device> Details section.
3. In the <Device> Details section, click the Power & Thermal tab.
Alternately, you can also click Power Utilization in the Summary tab.
4. Click View History next to Power Alert Thresholds.
The power history graph is displayed in a new window.
5. Select the time period and attributes displayed:
a. To select the time period represented in the graph, click the buttons along the top of the graph.
b. To add or delete attributes, select from the listed options; click the option to toggle its addition or removal from the graph:
• Minimum
• Maximum
• Average
• Power Policy
• Upper Warning
• Upper Critical
NOTE: To view specific numbers related to each attribute displayed in any section of the graph, move the pointer over the graph.
6. To move along the data stream over time, click the navigation arrows below the graph.
71

Monitoring PDU Power
To monitor PDU power, click Devices in the left pane, navigate to the PDU, and refer to the details section of the screen.
The instantaneous power value of the PDU is displayed, and the details section of the screen also lists the PDU details read from the device. It displays NA when the data is not provided on the PDU device.
Monitoring UPS Power
To monitor UPS power, click Devices in the left pane, and then navigate to and select the UPS. The UPS details are displayed in the detail portion of the screen.
The instantaneous power value of the UPS is shown, as well as the UPS details read from the device. It displays NA when the data is not provided on the UPS.
72
9Temperature MonitoringDell OpenManage Power Center enables monitoring of the current or historical temperature of the data centers in Power Center. This can help you understand the temperature status and identify hot spots in the data center.
You can monitor the temperature status at different device/group levels. You can configure the temperature monitoring settings to meet your monitoring needs, and you can print the temperature status graph.
Temperature Monitoring Level
Power Center provides temperature monitoring at the following levels:
• Device level — You can monitor temperature-related metrics for devices.
• Physical group level — You can monitor temperature-related metrics at the physical group level (data center, room, aisle, chassis modular).
• Logical group level — You can monitor temperature-related metrics at the logical group level.
Viewing Temperature Details
Click Devices in the left navigation pane, then select the Grouped Devices or Unassigned Devices tab. Click the icon for the group or device, then refer to the lower detail portion of the screen.
Click View History under the Present Power heading to access the Temperature Details graph. By default, the Temperature Details graph displays the temperature details for the previous hour.
You can also view the following details:
Temperature Details for the Current Time Window
You can view temperature details for the current time window by clicking a time window tab. The following table describes the time windows and their associated intervals:
Table 5. Time Windows and Intervals
Time Window Description Interval
15Min 15 minutes 1 minute
1H 1 hour 3 minutes
1D 1 day 1 hour
73
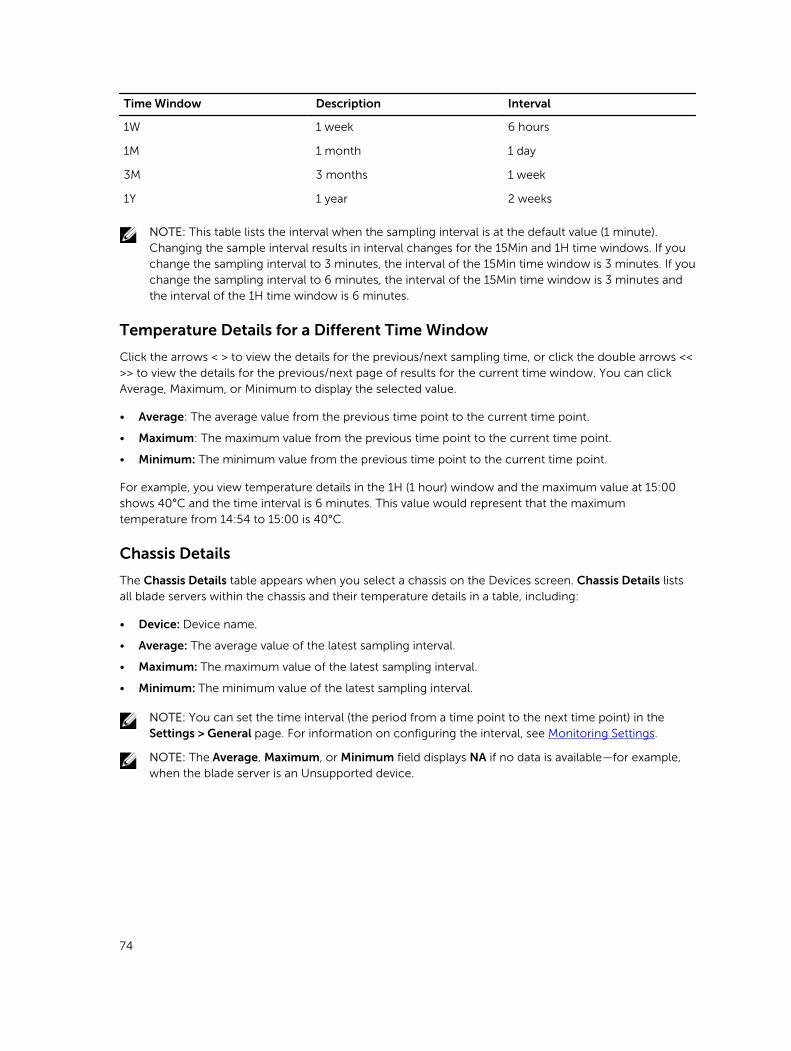
Time Window Description Interval
1W 1 week 6 hours
1M 1 month 1 day
3M 3 months 1 week
1Y 1 year 2 weeks
NOTE: This table lists the interval when the sampling interval is at the default value (1 minute). Changing the sample interval results in interval changes for the 15Min and 1H time windows. If you change the sampling interval to 3 minutes, the interval of the 15Min time window is 3 minutes. If you change the sampling interval to 6 minutes, the interval of the 15Min time window is 3 minutes and the interval of the 1H time window is 6 minutes.
Temperature Details for a Different Time Window
Click the arrows < > to view the details for the previous/next sampling time, or click the double arrows << >> to view the details for the previous/next page of results for the current time window. You can click Average, Maximum, or Minimum to display the selected value.
• Average: The average value from the previous time point to the current time point.
• Maximum: The maximum value from the previous time point to the current time point.
• Minimum: The minimum value from the previous time point to the current time point.
For example, you view temperature details in the 1H (1 hour) window and the maximum value at 15:00 shows 40°C and the time interval is 6 minutes. This value would represent that the maximum temperature from 14:54 to 15:00 is 40°C.
Chassis Details
The Chassis Details table appears when you select a chassis on the Devices screen. Chassis Details lists all blade servers within the chassis and their temperature details in a table, including:
• Device: Device name.
• Average: The average value of the latest sampling interval.
• Maximum: The maximum value of the latest sampling interval.
• Minimum: The minimum value of the latest sampling interval.
NOTE: You can set the time interval (the period from a time point to the next time point) in the Settings > General page. For information on configuring the interval, see Monitoring Settings.
NOTE: The Average, Maximum, or Minimum field displays NA if no data is available—for example, when the blade server is an Unsupported device.
74
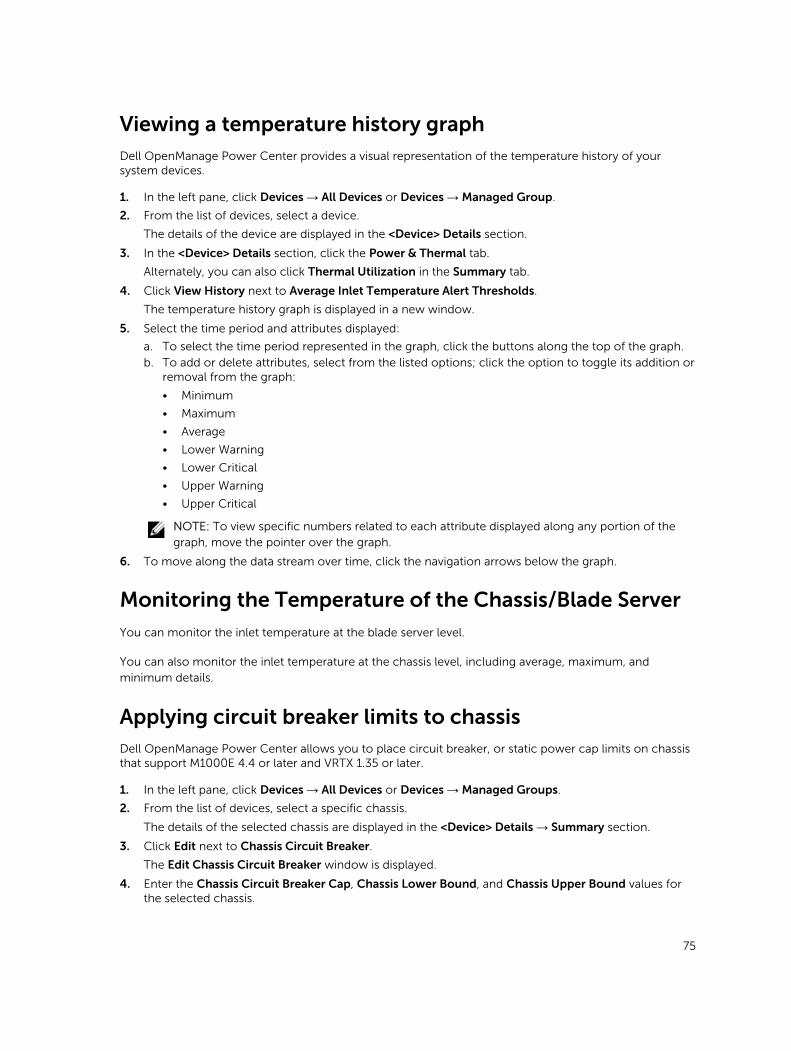
Viewing a temperature history graphDell OpenManage Power Center provides a visual representation of the temperature history of your system devices.
1. In the left pane, click Devices → All Devices or Devices → Managed Group.
2. From the list of devices, select a device.
The details of the device are displayed in the <Device> Details section.
3. In the <Device> Details section, click the Power & Thermal tab.
Alternately, you can also click Thermal Utilization in the Summary tab.
4. Click View History next to Average Inlet Temperature Alert Thresholds.
The temperature history graph is displayed in a new window.
5. Select the time period and attributes displayed:
a. To select the time period represented in the graph, click the buttons along the top of the graph.b. To add or delete attributes, select from the listed options; click the option to toggle its addition or
removal from the graph:
• Minimum
• Maximum
• Average
• Lower Warning
• Lower Critical
• Upper Warning
• Upper Critical
NOTE: To view specific numbers related to each attribute displayed along any portion of the graph, move the pointer over the graph.
6. To move along the data stream over time, click the navigation arrows below the graph.
Monitoring the Temperature of the Chassis/Blade Server
You can monitor the inlet temperature at the blade server level.
You can also monitor the inlet temperature at the chassis level, including average, maximum, and minimum details.
Applying circuit breaker limits to chassisDell OpenManage Power Center allows you to place circuit breaker, or static power cap limits on chassis that support M1000E 4.4 or later and VRTX 1.35 or later.
1. In the left pane, click Devices → All Devices or Devices → Managed Groups.
2. From the list of devices, select a specific chassis.
The details of the selected chassis are displayed in the <Device> Details → Summary section.
3. Click Edit next to Chassis Circuit Breaker.
The Edit Chassis Circuit Breaker window is displayed.
4. Enter the Chassis Circuit Breaker Cap, Chassis Lower Bound, and Chassis Upper Bound values for the selected chassis.
75

NOTE: By default, the lower bound chassis circuit breaker for VRTX 1.35 and earlier versions is '0'. Update the firmware to the latest version.
5. Click Save to apply your changes, or click Cancel to discard your changes.
Monitoring the Temperature of Devices/Groups
Power Center supports temperature monitoring of the inlet temperature span for devices and groups. The inlet temperature span is the average inlet temperature differential between the maximum and minimum temperature reading for a device in a group (Celsius or Fahrenheit). You can calculate this value according to the maximum and minimum temperature from the Temperature Details graph.
76
10PoliciesA power policy is a set of configurations to manage the power cap for a device or group. A policy is useful for power management in different situations. For example, you can create a policy to:
• Power Cap — Make sure that power consumption does not exceed the capacity of the circuit.
• Control Power Usage — Schedule power usage according to the workload of the device or group. For example, you can set an aggressive cap when the workload is low, enabling a reduction of power use for your data center.
• Increase rack density — For example, monitor the current power consumption of a rack with 10 devices to estimate how many more devices you can add to the rack. Then, establish a power policy to cap the total power consumption of the rack after the devices are added.
Power Center supports two power cap policy types:
• Static — Manually set the power cap for each device in a rack or chassis.
• Dynamic — Power Center dynamically allocates the power cap for each device in a group (data center, room, aisle, rack, or chassis).
From the Policies screen, you can:
• Create a power policy
• Edit a power policy
• Enable or disable a power policy
• Delete a power policy
• Refresh the list of policies
• Filter power policies so only certain policies are displayed
• Sort the list of policies
Dynamic power caps
The following terms are helpful for understanding how a dynamic power cap works:
• Consumption — The amount of power a device is using.
• Power Cap — The maximum amount of power that a device is allowed to consume (may not be equal to its demand).
• Headroom — The difference between rack power capacity (specified by the user when the rack is added to the Dell OpenManage Power Center system) and rack power consumption (determined by the actual power consumption by PDUs added or associated with the rack).
77

• Demand — Amount of power a device requests to accommodate its workload.
• Estimated maximum power (Estimated max power) — The maximum power consumption allocation estimated for a device. The estimated max power is considered the peak power consumption by a device.
Dynamic power caps enable all devices to execute workloads without requiring more power than the overall power cap assigned to the group. When choosing a dynamic power cap, remember:
• If lower-priority devices require more power to maintain their cap, they may receive more power than higher-priority devices.
• If the power cap is too restrictive and the group power consumption exceeds the power cap, an error event occurs for the policy. If this occurs frequently, reconsider your power allocations, or adjust workloads accordingly.
• If fluctuations in device power requirements occur after the power cap is successfully established, then a device that requires more power may not receive it if the power cap of another device in the policy would be violated. To force one or more devices in a policy to a lower cap, create a static power policy for the device at a lower level (rack or chassis). The most restrictive power cap of the overlapping policies is applied to the device.
• If there is excess available power (known as headroom) after all power capping requirements are met, the excess power is dynamically allocated according to the priority and demand of each device in the power policy.
Power Policy Capabilities
Power Center defines the following statuses of power policy capabilities for the devices:
• Unknown — Shown for unsupported devices or devices that were never connected to Power Center.
• None — No power policy capability. You cannot set any policy on the device.
• Monitor — With power monitoring capability only.
• Monitor & Capping — With power monitoring and capping capabilities.
• Monitor and Upgradable — With power monitoring capability, and can be upgraded to have power capping capability.
You can find this power policy capability status in the Power Capability column of the Devices page.
For servers that comply with Dell iDRAC7, when there is a power policy capability change due to a license change, Power Center will change its information in the management console within 24 hours. There are two scenarios:
Scenario 1 — The license expires or is not imported
In this case, the following happens:
• If a policy exists on the devices, you will receive a "Server Capabilities Changed" event.
• The Policies tab of the devices is set to disabled in the Groups page.
• The power capability status of the devices is set to "None" in the Devices page.
78
• You cannot edit the policy of this device from the Policies page; you can only delete it.
Scenario 2 — You try to import a license on a device without a license imported
In this case, the following happens:
• If a policy exists on the devices, you will receive a "Server Capabilities Changed" event.
• The Policies tab of the devices is set to Enabled in the Groups page.
The power capability status of the devices is changed in the Devices page.
The policy of the devices is editable. You can access it from the Policies page.
Upgrading Device Power Policy Capability
The power policy capability of some devices can be upgraded to include capping of power consumption—for example, Dell PowerEdge M620. These devices show Monitor and Upgradable. To upgrade the device so that its power consumption can be capped, go to the Devices page and click Upgrade next to the device, then follow the instructions on the pop-up help page to upgrade the device power capability. Once the upgrade is completed, the power capability status changes to Monitor & Capping within 24 hours.
Creating a new policyYou can create static power policies for a rack, chassis, or device, and create dynamic power policies for any group or device. Power policies apply only to the groups and devices that have monitoring and capping power capabilities.
NOTE: You can also create policies from the Devices → All Devices → Policies or Devices → Managed Groups → Policies tabs.
1. In the left pane, click Policies.
The Policies screen is displayed.
2. In the task menu, click New Policy.
The Create New Policy wizard is displayed.
3. In the Select a Group or Device window, enter a name for the policy in the Policy Name text box. The name should be fewer than 25 characters in length.
4. In the Grouped Devices tab, select the device group or in the Unassigned tab, select the devices to which you want to apply the policy.
5. Click Next to continue, or click Cancel to return to the Policies screen.
6. In the Power Cap Values window, select the type of the policy from the Policy Type drop-down list.
The available options are:
• STATIC
• DYNAMIC
NOTE: This step is applicable only to racks and chassis.
7. From the Power monitoring values are for a fixed time period drop-down list, select the power cap values.
The possible options are:
79
• Previous hour
• Previous day
• Previous week
• Previous month
• Previous quarter
8. Enter a value in the Power Cap Value text box.
9. Click Next to continue, click Back to return to the previous screen, or click Cancel to discontinue the task.
10. In the Power Cap Priorities window, select an option from the Priority drop-down list to set the capping priority for each device in the group.
The available options are:
• Low
• Medium
• High
NOTE: The Power Cap Priorities window is accessible only when you select a device group.
11. Click Next to continue, click Back to return to the previous screen, or click Cancel to discontinue the task.
12. In the Power Policy Schedule window, set the monitoring schedule for the policy.
• Time Span — Always or a range (enter start and end time in the format hh:mm using 24–hour time)
• Recurrence Pattern — Always or specific days of the week
• Recurrence Range — Always or a range (enter start and end dates)
13. Click Next to view the summary of the policy you created.
14. In the Summary window, click Finish to save the policy, click Back to review the policy information, or click Cancel to discard the changes.
The new policy is effective immediately.
Policy Priority Levels
When you create or update a policy, you can select different priority levels for each device/group. For example, you can set priority levels based on the service level agreements associated with workloads running on a device/group.
Power Center tends to reserve more power to the devices/groups with higher priority when the power cap for devices/groups is not fully utilized.
For each device/group, you can set one of the three priority levels:
• Low
• Medium (Default)
• High
Priority lists are policy-specific; however, a device/group may have different priority levels in different policies. A higher-priority value of a device/group in a policy overrides the lower-priority value of the same node in another policy.
80
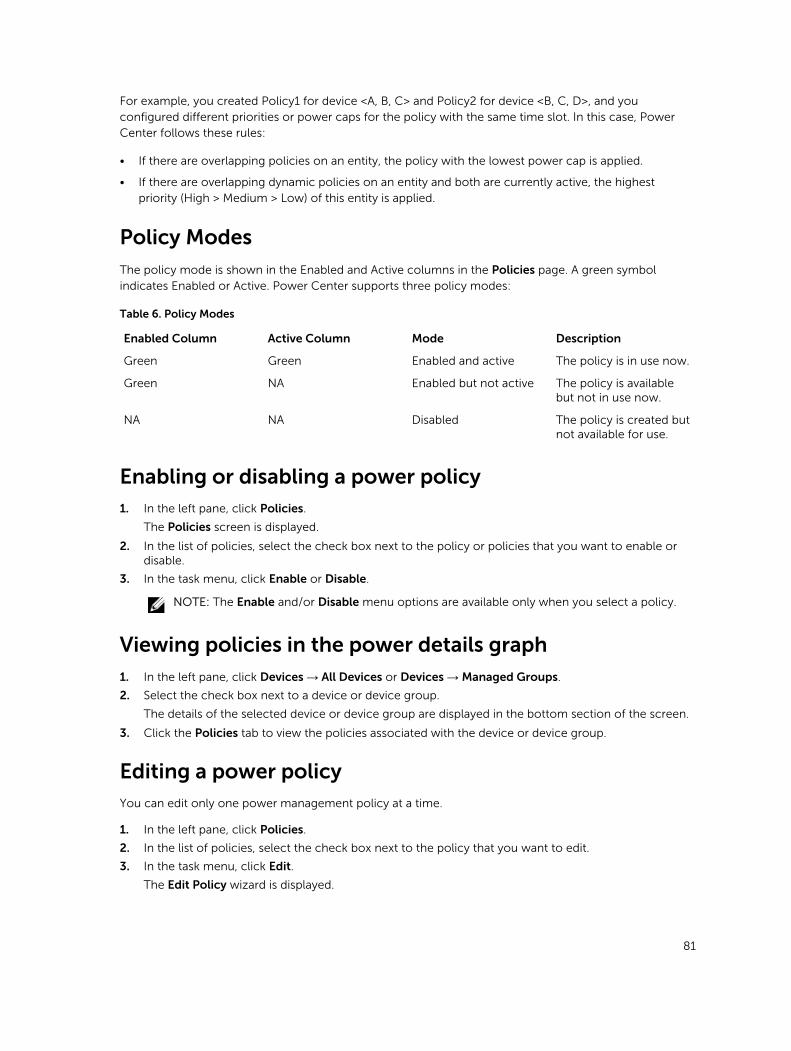
For example, you created Policy1 for device <A, B, C> and Policy2 for device <B, C, D>, and you configured different priorities or power caps for the policy with the same time slot. In this case, Power Center follows these rules:
• If there are overlapping policies on an entity, the policy with the lowest power cap is applied.
• If there are overlapping dynamic policies on an entity and both are currently active, the highest priority (High > Medium > Low) of this entity is applied.
Policy Modes
The policy mode is shown in the Enabled and Active columns in the Policies page. A green symbol indicates Enabled or Active. Power Center supports three policy modes:
Table 6. Policy Modes
Enabled Column Active Column Mode Description
Green Green Enabled and active The policy is in use now.
Green NA Enabled but not active The policy is available but not in use now.
NA NA Disabled The policy is created but not available for use.
Enabling or disabling a power policy1. In the left pane, click Policies.
The Policies screen is displayed.
2. In the list of policies, select the check box next to the policy or policies that you want to enable or disable.
3. In the task menu, click Enable or Disable.
NOTE: The Enable and/or Disable menu options are available only when you select a policy.
Viewing policies in the power details graph1. In the left pane, click Devices → All Devices or Devices → Managed Groups.
2. Select the check box next to a device or device group.
The details of the selected device or device group are displayed in the bottom section of the screen.
3. Click the Policies tab to view the policies associated with the device or device group.
Editing a power policyYou can edit only one power management policy at a time.
1. In the left pane, click Policies.
2. In the list of policies, select the check box next to the policy that you want to edit.
3. In the task menu, click Edit.
The Edit Policy wizard is displayed.
81
4. Make the required changes.
NOTE: You cannot change the selected device or group while editing a policy.
5. In the Summary screen, review the changes and click Finish to save the changes, click Back to return to the previous screen, or click Cancel to discard the changes.
Deleting a power policy1. In the left pane, click Policies.
The Policies screen is displayed.
2. In the list of policies, select the check box next to the policy that you want to delete.
NOTE: You can select more than one policy to at a time.
3. In the task menu, click Delete.
The following message is displayed.
Are you sure you want to delete the selected item(s)?4. Click Yes.
Filtering power policiesYou can filter power policies so they display according to type, power cap, and/or status.
1. In the left pane, click Policies.
The Policies screen is displayed.
2. In the task menu, click Filter.
The Policy Filter window is displayed.
NOTE: The Policy Filter wizard is displayed only if you have at least one policy.
3. Select an existing filter from the Select Filter drop-down list and run it or proceed to step 4.
4. Under Quick View, select the Policy Type check box and then select the Static or Dynamic option.
5. Select one or more of the following options:
• Select the Power Cap check box and then enter values in the Minimum and/or Maximum text boxes.
• Select the Policy Enabled check box and then select the Yes or No option.
• Select the Policy Activated check box and select the Yes or No option.
NOTE: Policy filters stay in effect until they are cleared or until you close the session.
6. Click Run Once to view a filtered list of policies.
OR
• Enter a name for the filter in the Filter Name (Optional) text box and click Save and Run to save the filter and sort the policies based on the filter criteria.
OR
• Click Cancel to discard the selections and return to the Policies screen.
You can use the saved filters later.
82
11Managing reportsThis chapter provides information on periodically generating reports for inventory and monitoring and managing the reports.
Pre-defined templates are provided to help you generate the reports. By default, the reports are generated in HTML format. You can download the reports in XML or CSV format.
In the left pane, click Reports. The Reports screen is displayed. On this screen, you can:
• View report details
• Create reports
• Edit reports
• Delete reports
• Refresh the reports list
• Add or edit report groups
• Set estimated max power
The following types of reports can be generated using OpenManage Power Center:
• Power Hoarders — The Power Hoarder report displays the devices that are the largest consumers of power. The result is calculated considering the highest average power consumption of the devices over a specific time period.
• Power Frugal — The Power Frugal report displays the devices that are the least consumers of power. The result is calculated considering the lowest average power consumption of the devices over a specific time period.
• Power Data — The Power Data report displays the power consumption data for the selected devices or device groups. The data comprises of the minimum, maximum, highest or lowest average power consumption.
• Power Headroom — The Power Headroom report displays the total power consumption and the unused power data for the selected devices or device groups.
• General Inventory — The General Inventory report displays the inventory data for the selected devices or device groups.
• Power Hoarders Rack — The Power Hoarders Rack report displays the rack devices that are the maximum power consumers. The result is calculated considering the lowest headroom of the devices over a specific time period.
• Power Frugal Rack — The Power Frugal Rack report displays the rack devices that are the least power consumers. The result is calculated considering the highest headroom of the devices over a specific time period.
• Raw Monitoring Data — The Raw Monitoring Data report displays the monitoring data for the selected devices or device groups.
• Comparison Report — The Comparison report displays the result obtained on comparing a minimum of two or a maximum of three devices or device groups.
83

Viewing Report Details
You can view the details of a particular report in the Reports list, in the bottom section of the Reports screen.
On the Reports screen, click the report name whose details you want to view. The details are displayed in the following tabs.
• Summary — Displays information such as the name, description, report group, and selected attributes of the report.
• Results — Displays the results for the attributes that were selected while creating the report.
You can export the report in CSV or XML format to the required location on your system.
Creating reports1. In the left pane, click Reports → New Reports.
2. Select a report type from the drop-down list. The available options are:
• Power Hoarders
• Power Frugal
• Power Data
• Power Headroom
• General Inventory
• Power Hoarders Rack
• Power Frugal Rack
• Raw Monitoring Data
• Comparison Report
The New Report wizard is displayed.
3. Enter a name for the report in the Name text box.
4. Under Duration, select one of the following options
• Last One — Select one of the following options from the drop-down list:
– Hour(s)
– Day(s)
– Week(s)
– Month(s)
• Last — Enter the number of days in the past for which you want to create the report.
• Date Range — Enter the start and end dates of the range for which you want to create the report.
5. Select the Report Aggregation Period check box to collate power-related data from the database for a specific period.
NOTE: This option is available only for Power Data, Power Headroom, and Raw Monitoring data report types.
NOTE: The power aggregation value for a device or group is calculated accurately, only if the power data for the specified Report Aggregation Period is available in the database.
6. Select an option from the Report Aggregation Type drop-down list. The available options are:
84
• Hour
• Day
• Week
• Month
NOTE: This option is available only for Power Data, Power Headroom, and Raw Monitoring data report types.
7. Enter the report aggregate value in the Report Aggregation Value text box and click Next.
NOTE: This option is available only for Power Data, Power Headroom, and Raw Monitoring data report types.
8. In the Associated Devices/Groups tab, select the devices or groups for which you want to generate the report.
a. Click the ‘plus’ icon to add them to the Selected Devices/Groups list and click Next.
NOTE: This option is displayed only for Power Headroom, General Inventory, Raw monitoring data, and Comparison report types.
9. In the Report Attributes tab, select one or more attributes that you want to include in the report. The attributes displayed are based on the report type you select.
a. From the Limit Output to drop-down list, select the output limit for the report. The available options are:
• 10
• 50
• 100
• Allb. From the Sort by drop-down list, select an attribute by which you want the sort the report. Select
the Ascending or Descending option to sort the report in that order and click Next.
10. In the Save/Run tab, do one of the following:
• Select the Save Only option to save the report.
• Select the Save and Run option to save and run the report and select the CSV or XML format to export the report in the selected format.
11. Click Finish to save the report or save and run the report.
Editing reports1. In the left pane, click Reports.
2. Select the check box next to the report that you want to edit.
3. In the task menu, click Edit.
The Edit Report wizard is displayed.
4. Make the required changes.
5. Click Finish to save the changes or click Cancel to return to the Reports screen without saving the changes.
Deleting reports1. In the left pane, click Reports.
2. Select the check box next to the report that you want to delete. To delete multiple reports, select the check box next to the Name header.
85
3. In the task menu, click Delete.
The following message is displayed.
Are you sure you want to delete the selected report(s)? All instances that belong to the report(s) will be deleted.
4. Click Yes.
Adding report groupsThe Report Groups feature allows you to classify the reports into different groups. For example, you can create two reports based on the available power data and add them to different groups. This helps you filter and find specific reports.
1. Click Reports → Report Group.
The Add/Edit/Delete Report Groups window is displayed.
2. To create a report group, select New from the Group drop-down list.
3. Enter a name for the report group in the Name text box.
4. Enter a description for the report group in the Description text box.
5. Click Save to save the group or click Cancel to return to the Reports screen.
Editing report groups1. Click Reports → Report Group.
The Add/Edit/Delete Report Groups window is displayed.
2. Select the group that you want to edit from the Group drop-down list.
You can edit the name and description of the report group.
3. Click Save to save the changes or click Cancel to return to the Reports screen without saving the changes.
Deleting report groups1. Click Reports → Report Group.
The Add/Edit/Delete Report Groups window is displayed.
2. Select the group that you want to delete from the Group drop-down list.
3. Click Delete. The following message is displayed.
Are you sure you want to delete this group? If you delete the group, all reports under this group will be deleted.
4. Click Yes to proceed.
86
12Event ManagementThis chapter provides information on event types, severity levels, supported PDU/UPS events, and how to manage Power Center events.
You can receive events indicating an abnormal power/temperature situation in the data center. Power Center detects:
• Pre-defined events
• Custom events
Power Center uses port 6553 to listen for internal events. If another application is configured to use port 6553, you must change it to reserve port 6533 for Power Center.
Power Center uses port 162 to listen for events from external devices. If the SNMP Trap service exists and uses port 162, Power Center automatically uses port 1162 to receive external events forwarded by the SNMP trap service.
In the left pane, click Events. The Events screen is displayed. On this screen, you can:
• Acknowledge Events
• Add a note to an event
• Delete events
• Sort events
• Filter events
• Export events
Pre-defined events
A predefined event is an event that Power Center defines based on system conditions. Device support for events includes:
• PDU/UPS devices – To receive events, you must subscribe to the event from the console of that PDU or UPS.
• Dell PowerEdge tower and rack servers – Support all IPMI events (IPMI Power Unit, IPMI Power Supply, IPMI Processor Temperature Trip, IPMI Fan).
• Dell PowerEdge blade servers – Only support IPMI Processor Temperature Trip events.
• Integrated Dell Remote Access Controller (iDRAC) – Only supports the IPMI trap format. To receive events from an iDRAC device, make sure the alert function is enabled and the IPMI trap format is selected for all Power Center-supported events in the iDRAC management console (IPMI Power Unit, IPMI Power Supply, IPMI Processor Temperature Trip, IPMI Fan). For example, in the iDRAC7 management console, you must select IPMI trap for all PWR/PSU/CPU/Fan-related alerts.
87
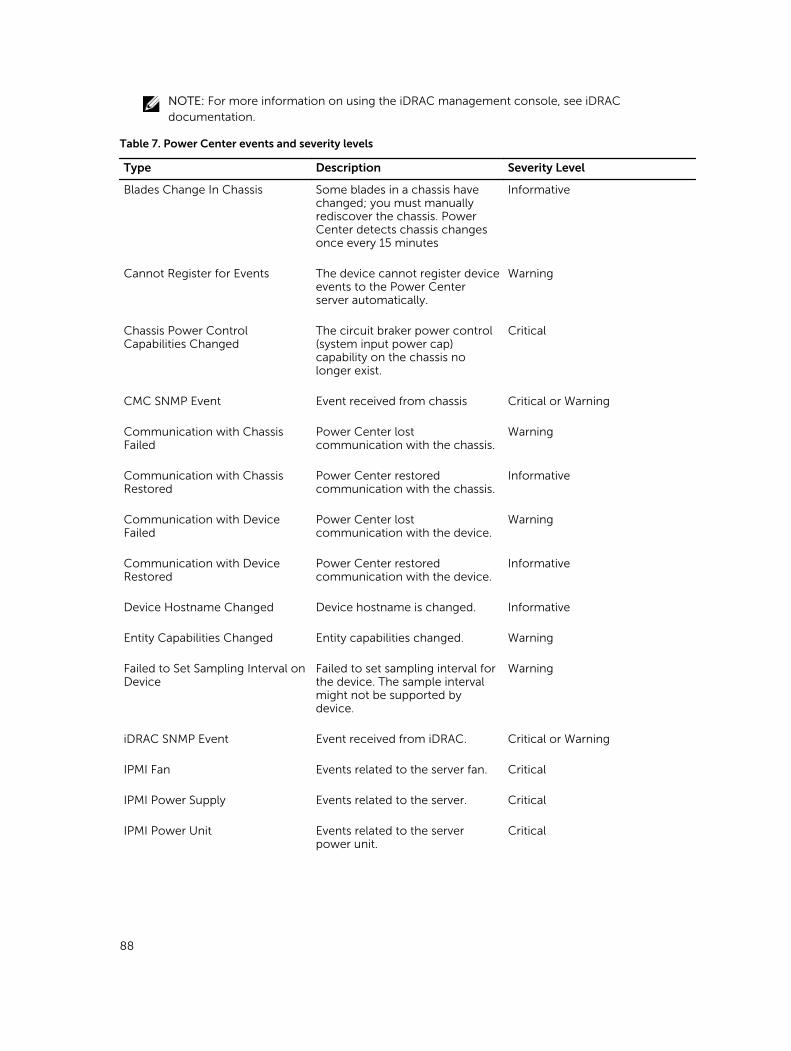
NOTE: For more information on using the iDRAC management console, see iDRAC documentation.
Table 7. Power Center events and severity levels
Type Description Severity Level
Blades Change In Chassis Some blades in a chassis have changed; you must manually rediscover the chassis. Power Center detects chassis changes once every 15 minutes
Informative
Cannot Register for Events The device cannot register device events to the Power Center server automatically.
Warning
Chassis Power Control Capabilities Changed
The circuit braker power control (system input power cap) capability on the chassis no longer exist.
Critical
CMC SNMP Event Event received from chassis Critical or Warning
Communication with Chassis Failed
Power Center lost communication with the chassis.
Warning
Communication with Chassis Restored
Power Center restored communication with the chassis.
Informative
Communication with Device Failed
Power Center lost communication with the device.
Warning
Communication with Device Restored
Power Center restored communication with the device.
Informative
Device Hostname Changed Device hostname is changed. Informative
Entity Capabilities Changed Entity capabilities changed. Warning
Failed to Set Sampling Interval on Device
Failed to set sampling interval for the device. The sample interval might not be supported by device.
Warning
iDRAC SNMP Event Event received from iDRAC. Critical or Warning
IPMI Fan Events related to the server fan. Critical
IPMI Power Supply Events related to the server. Critical
IPMI Power Unit Events related to the server power unit.
Critical
88
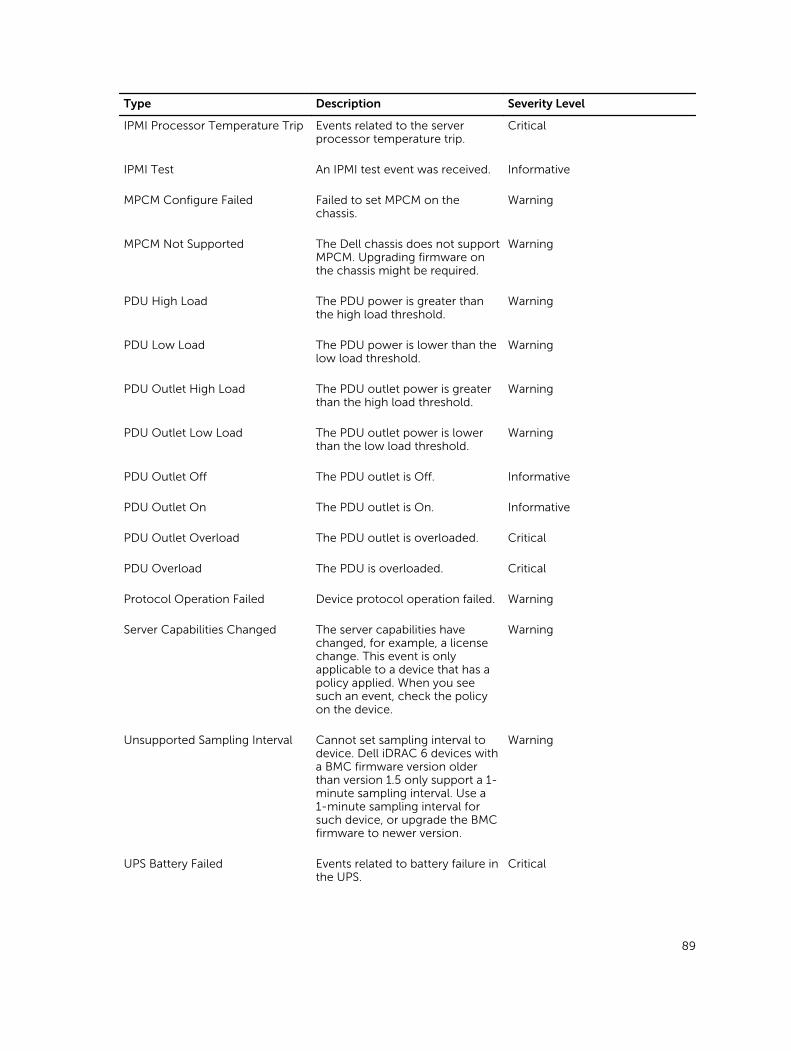
Type Description Severity Level
IPMI Processor Temperature Trip Events related to the server processor temperature trip.
Critical
IPMI Test An IPMI test event was received. Informative
MPCM Configure Failed Failed to set MPCM on the chassis.
Warning
MPCM Not Supported The Dell chassis does not support MPCM. Upgrading firmware on the chassis might be required.
Warning
PDU High Load The PDU power is greater than the high load threshold.
Warning
PDU Low Load The PDU power is lower than the low load threshold.
Warning
PDU Outlet High Load The PDU outlet power is greater than the high load threshold.
Warning
PDU Outlet Low Load The PDU outlet power is lower than the low load threshold.
Warning
PDU Outlet Off The PDU outlet is Off. Informative
PDU Outlet On The PDU outlet is On. Informative
PDU Outlet Overload The PDU outlet is overloaded. Critical
PDU Overload The PDU is overloaded. Critical
Protocol Operation Failed Device protocol operation failed. Warning
Server Capabilities Changed The server capabilities have changed, for example, a license change. This event is only applicable to a device that has a policy applied. When you see such an event, check the policy on the device.
Warning
Unsupported Sampling Interval Cannot set sampling interval to device. Dell iDRAC 6 devices with a BMC firmware version older than version 1.5 only support a 1-minute sampling interval. Use a 1-minute sampling interval for such device, or upgrade the BMC firmware to newer version.
Warning
UPS Battery Failed Events related to battery failure in the UPS.
Critical
89
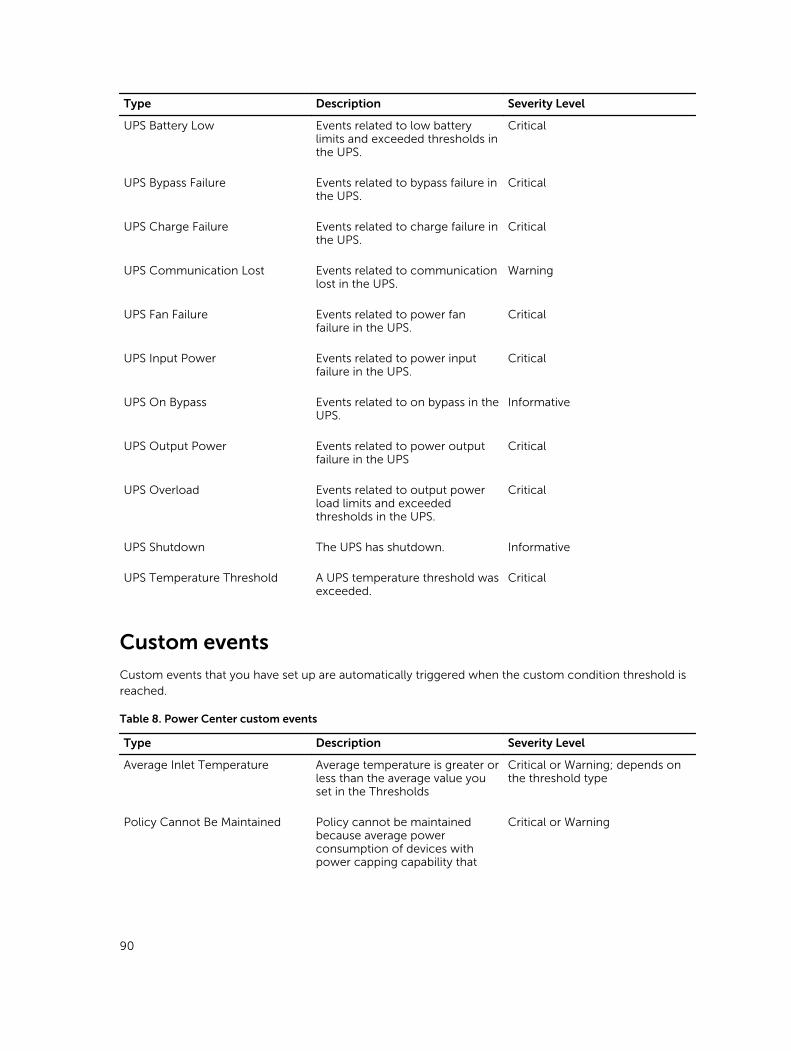
Type Description Severity Level
UPS Battery Low Events related to low battery limits and exceeded thresholds in the UPS.
Critical
UPS Bypass Failure Events related to bypass failure in the UPS.
Critical
UPS Charge Failure Events related to charge failure in the UPS.
Critical
UPS Communication Lost Events related to communication lost in the UPS.
Warning
UPS Fan Failure Events related to power fan failure in the UPS.
Critical
UPS Input Power Events related to power input failure in the UPS.
Critical
UPS On Bypass Events related to on bypass in the UPS.
Informative
UPS Output Power Events related to power output failure in the UPS
Critical
UPS Overload Events related to output power load limits and exceeded thresholds in the UPS.
Critical
UPS Shutdown The UPS has shutdown. Informative
UPS Temperature Threshold A UPS temperature threshold was exceeded.
Critical
Custom events
Custom events that you have set up are automatically triggered when the custom condition threshold is reached.
Table 8. Power Center custom events
Type Description Severity Level
Average Inlet Temperature Average temperature is greater or less than the average value you set in the Thresholds
Critical or Warning; depends on the threshold type
Policy Cannot Be Maintained Policy cannot be maintained because average power consumption of devices with power capping capability that
Critical or Warning
90
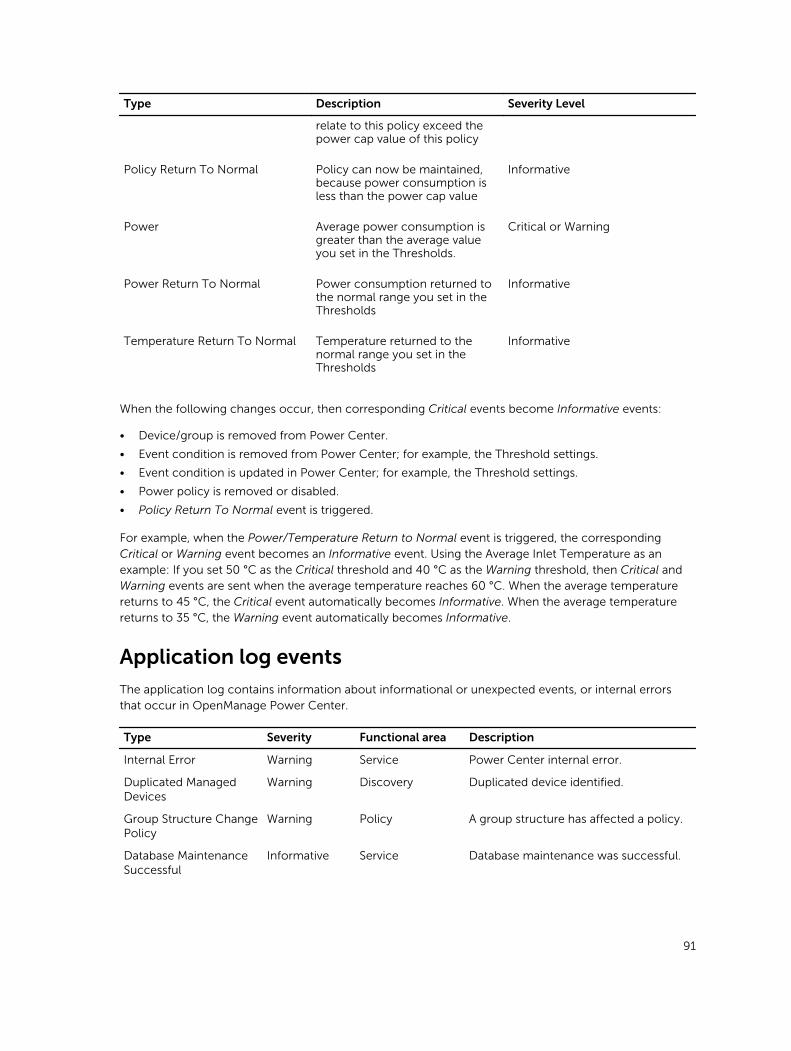
Type Description Severity Level
relate to this policy exceed the power cap value of this policy
Policy Return To Normal Policy can now be maintained, because power consumption is less than the power cap value
Informative
Power Average power consumption is greater than the average value you set in the Thresholds.
Critical or Warning
Power Return To Normal Power consumption returned to the normal range you set in the Thresholds
Informative
Temperature Return To Normal Temperature returned to the normal range you set in the Thresholds
Informative
When the following changes occur, then corresponding Critical events become Informative events:
• Device/group is removed from Power Center.
• Event condition is removed from Power Center; for example, the Threshold settings.
• Event condition is updated in Power Center; for example, the Threshold settings.
• Power policy is removed or disabled.
• Policy Return To Normal event is triggered.
For example, when the Power/Temperature Return to Normal event is triggered, the corresponding Critical or Warning event becomes an Informative event. Using the Average Inlet Temperature as an example: If you set 50 °C as the Critical threshold and 40 °C as the Warning threshold, then Critical and Warning events are sent when the average temperature reaches 60 °C. When the average temperature returns to 45 °C, the Critical event automatically becomes Informative. When the average temperature returns to 35 °C, the Warning event automatically becomes Informative.
Application log events
The application log contains information about informational or unexpected events, or internal errors that occur in OpenManage Power Center.
Type Severity Functional area Description
Internal Error Warning Service Power Center internal error.
Duplicated Managed Devices
Warning Discovery Duplicated device identified.
Group Structure Change Policy
Warning Policy A group structure has affected a policy.
Database Maintenance Successful
Informative Service Database maintenance was successful.
91
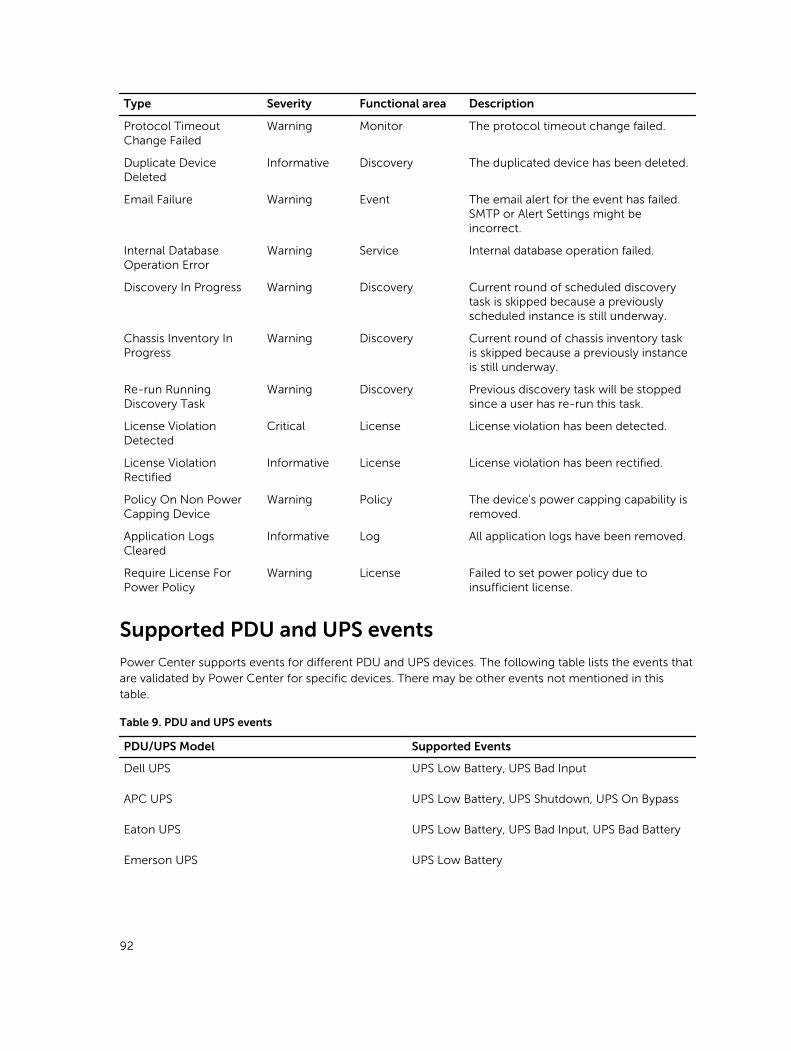
Type Severity Functional area Description
Protocol Timeout Change Failed
Warning Monitor The protocol timeout change failed.
Duplicate Device Deleted
Informative Discovery The duplicated device has been deleted.
Email Failure Warning Event The email alert for the event has failed. SMTP or Alert Settings might be incorrect.
Internal Database Operation Error
Warning Service Internal database operation failed.
Discovery In Progress Warning Discovery Current round of scheduled discovery task is skipped because a previously scheduled instance is still underway.
Chassis Inventory In Progress
Warning Discovery Current round of chassis inventory task is skipped because a previously instance is still underway.
Re-run Running Discovery Task
Warning Discovery Previous discovery task will be stopped since a user has re-run this task.
License Violation Detected
Critical License License violation has been detected.
License Violation Rectified
Informative License License violation has been rectified.
Policy On Non Power Capping Device
Warning Policy The device's power capping capability is removed.
Application Logs Cleared
Informative Log All application logs have been removed.
Require License For Power Policy
Warning License Failed to set power policy due to insufficient license.
Supported PDU and UPS events
Power Center supports events for different PDU and UPS devices. The following table lists the events that are validated by Power Center for specific devices. There may be other events not mentioned in this table.
Table 9. PDU and UPS events
PDU/UPS Model Supported Events
Dell UPS UPS Low Battery, UPS Bad Input
APC UPS UPS Low Battery, UPS Shutdown, UPS On Bypass
Eaton UPS UPS Low Battery, UPS Bad Input, UPS Bad Battery
Emerson UPS UPS Low Battery
92
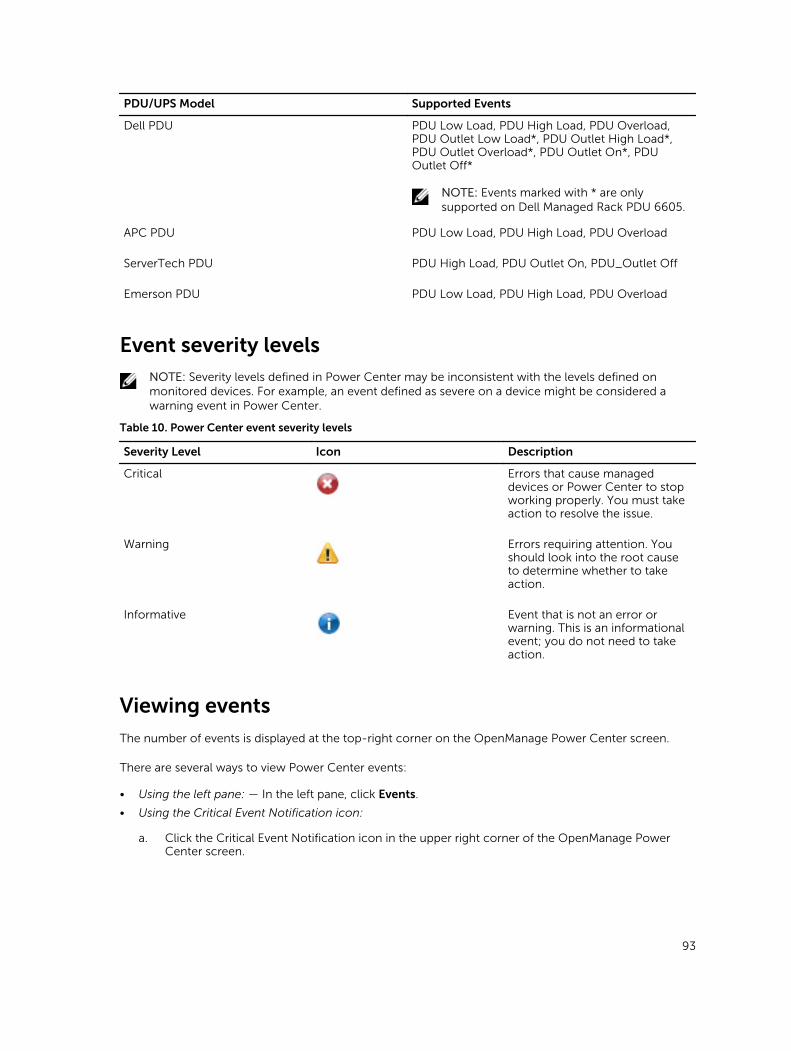
PDU/UPS Model Supported Events
Dell PDU PDU Low Load, PDU High Load, PDU Overload, PDU Outlet Low Load*, PDU Outlet High Load*, PDU Outlet Overload*, PDU Outlet On*, PDU Outlet Off*
NOTE: Events marked with * are only supported on Dell Managed Rack PDU 6605.
APC PDU PDU Low Load, PDU High Load, PDU Overload
ServerTech PDU PDU High Load, PDU Outlet On, PDU_Outlet Off
Emerson PDU PDU Low Load, PDU High Load, PDU Overload
Event severity levelsNOTE: Severity levels defined in Power Center may be inconsistent with the levels defined on monitored devices. For example, an event defined as severe on a device might be considered a warning event in Power Center.
Table 10. Power Center event severity levels
Severity Level Icon Description
Critical Errors that cause managed devices or Power Center to stop working properly. You must take action to resolve the issue.
Warning Errors requiring attention. You should look into the root cause to determine whether to take action.
Informative Event that is not an error or warning. This is an informational event; you do not need to take action.
Viewing events
The number of events is displayed at the top-right corner on the OpenManage Power Center screen.
There are several ways to view Power Center events:
• Using the left pane: — In the left pane, click Events.
• Using the Critical Event Notification icon:
a. Click the Critical Event Notification icon in the upper right corner of the OpenManage Power Center screen.
93
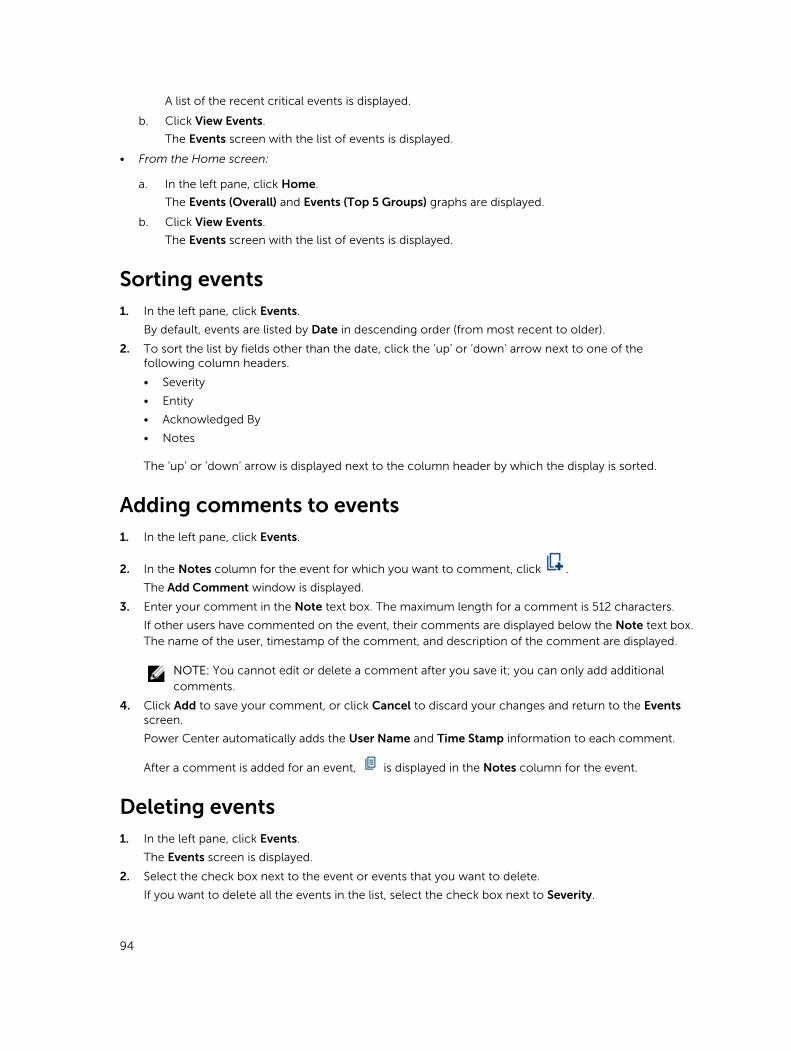
A list of the recent critical events is displayed.
b. Click View Events.
The Events screen with the list of events is displayed.
• From the Home screen:
a. In the left pane, click Home.
The Events (Overall) and Events (Top 5 Groups) graphs are displayed.
b. Click View Events.
The Events screen with the list of events is displayed.
Sorting events1. In the left pane, click Events.
By default, events are listed by Date in descending order (from most recent to older).
2. To sort the list by fields other than the date, click the ‘up’ or ‘down’ arrow next to one of the following column headers.
• Severity
• Entity
• Acknowledged By
• Notes
The ‘up’ or ‘down’ arrow is displayed next to the column header by which the display is sorted.
Adding comments to events1. In the left pane, click Events.
2. In the Notes column for the event for which you want to comment, click .
The Add Comment window is displayed.
3. Enter your comment in the Note text box. The maximum length for a comment is 512 characters.
If other users have commented on the event, their comments are displayed below the Note text box. The name of the user, timestamp of the comment, and description of the comment are displayed.
NOTE: You cannot edit or delete a comment after you save it; you can only add additional comments.
4. Click Add to save your comment, or click Cancel to discard your changes and return to the Events screen.
Power Center automatically adds the User Name and Time Stamp information to each comment.
After a comment is added for an event, is displayed in the Notes column for the event.
Deleting events1. In the left pane, click Events.
The Events screen is displayed.
2. Select the check box next to the event or events that you want to delete.
If you want to delete all the events in the list, select the check box next to Severity.
94
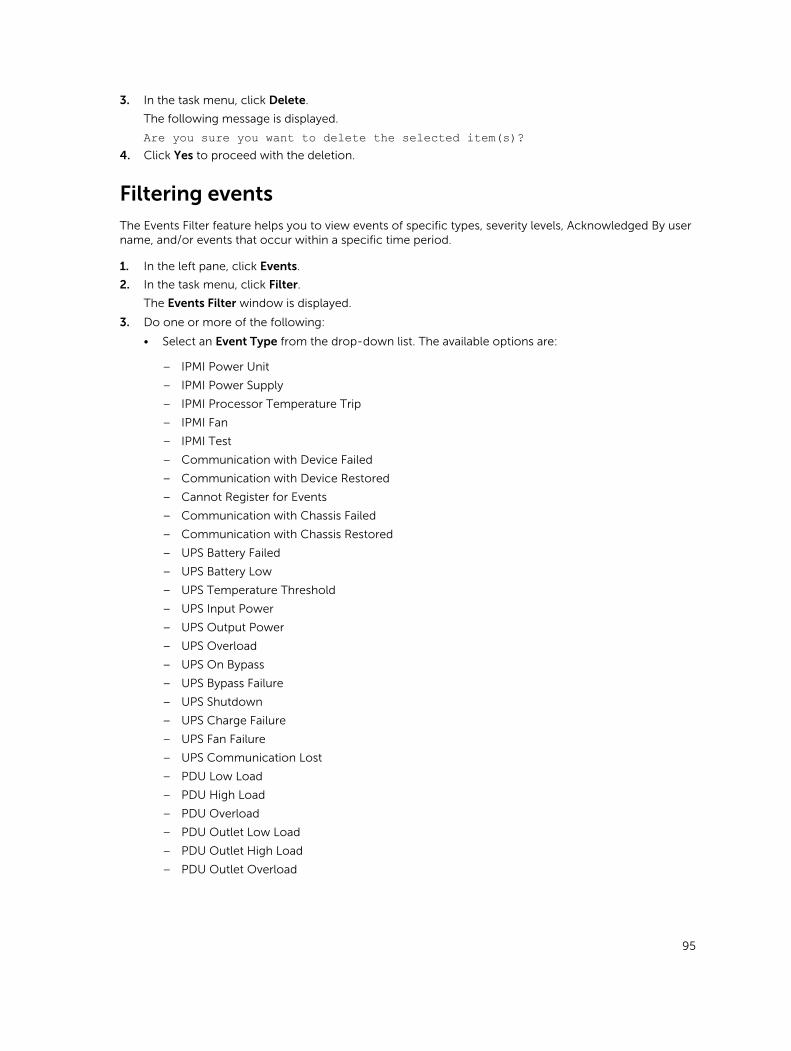
3. In the task menu, click Delete.
The following message is displayed.
Are you sure you want to delete the selected item(s)?4. Click Yes to proceed with the deletion.
Filtering eventsThe Events Filter feature helps you to view events of specific types, severity levels, Acknowledged By user name, and/or events that occur within a specific time period.
1. In the left pane, click Events.
2. In the task menu, click Filter.
The Events Filter window is displayed.
3. Do one or more of the following:
• Select an Event Type from the drop-down list. The available options are:
– IPMI Power Unit
– IPMI Power Supply
– IPMI Processor Temperature Trip
– IPMI Fan
– IPMI Test
– Communication with Device Failed
– Communication with Device Restored
– Cannot Register for Events
– Communication with Chassis Failed
– Communication with Chassis Restored
– UPS Battery Failed
– UPS Battery Low
– UPS Temperature Threshold
– UPS Input Power
– UPS Output Power
– UPS Overload
– UPS On Bypass
– UPS Bypass Failure
– UPS Shutdown
– UPS Charge Failure
– UPS Fan Failure
– UPS Communication Lost
– PDU Low Load
– PDU High Load
– PDU Overload
– PDU Outlet Low Load
– PDU Outlet High Load
– PDU Outlet Overload
95
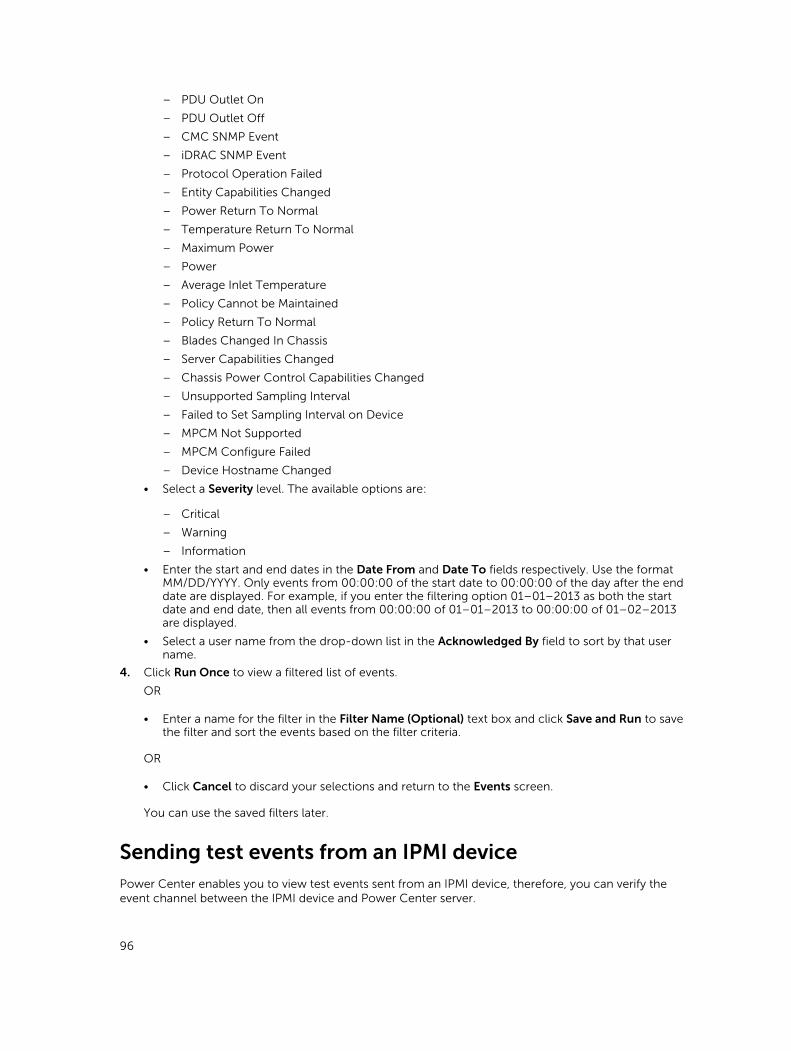
– PDU Outlet On
– PDU Outlet Off
– CMC SNMP Event
– iDRAC SNMP Event
– Protocol Operation Failed
– Entity Capabilities Changed
– Power Return To Normal
– Temperature Return To Normal
– Maximum Power
– Power
– Average Inlet Temperature
– Policy Cannot be Maintained
– Policy Return To Normal
– Blades Changed In Chassis
– Server Capabilities Changed
– Chassis Power Control Capabilities Changed
– Unsupported Sampling Interval
– Failed to Set Sampling Interval on Device
– MPCM Not Supported
– MPCM Configure Failed
– Device Hostname Changed
• Select a Severity level. The available options are:
– Critical
– Warning
– Information
• Enter the start and end dates in the Date From and Date To fields respectively. Use the format MM/DD/YYYY. Only events from 00:00:00 of the start date to 00:00:00 of the day after the end date are displayed. For example, if you enter the filtering option 01–01–2013 as both the start date and end date, then all events from 00:00:00 of 01–01–2013 to 00:00:00 of 01–02–2013 are displayed.
• Select a user name from the drop-down list in the Acknowledged By field to sort by that user name.
4. Click Run Once to view a filtered list of events.
OR
• Enter a name for the filter in the Filter Name (Optional) text box and click Save and Run to save the filter and sort the events based on the filter criteria.
OR
• Click Cancel to discard your selections and return to the Events screen.
You can use the saved filters later.
Sending test events from an IPMI devicePower Center enables you to view test events sent from an IPMI device, therefore, you can verify the event channel between the IPMI device and Power Center server.
96

Before sending a test event, make sure:
• The IPMI device is added on the Devices page.
• The network connection status of the IPMI device is Connected.
• The Power Center server address is added in the event destination list of the IPMI device.
To send a test event from an IPMI device, see the following example for a Dell PowerEdge M610 server:
1. Open the iDRAC management console of the M610, and go to the page related to SNMP trap settings.
2. Click Send next to the Power Center server address to send a test event.
3. Open the Power Center management console, and click Event Logs in the left pane.
The informative event IPMI Test appears on the Event Logs page.
NOTE: For more information on steps 1 and 2, see the IPMI device documentation.
97
13SecurityPower Center is designed to ensure data confidentiality, data integrity, and the security of user authentication. Power Center not only provides authentication and access control to user accounts (see Access Control), but also protects all of the communication channels to the Power Center server and the stored sensitive data (for example, passwords) on the Power Center server.
To enhance security for your Power Center system:
• Start services with a normal Windows operating system (OS) user account: After installation, Power Center services are logged on with the Network Service account by default. You can use a normal Windows OS user account instead of the Network Service account to provide better security.
• OS hardening: You can apply OS hardening on the system where Power Center is installed. By doing so, the minimum security foundation is set up for Power Center security-related configurations.
• Audit log: Power Center tracks the action log for critical user operations, including user login/logout, emergency power reduction, start/stop network discovery, security configuration, and policy change.
• Certificate management: To enforce communication confidentiality and data integrity, Power Center enables SSL/TLS communication between the Power Center management console and the Power Center server and between the Power Center server and managed chassis. The SSL/TLS authentication is certificate-based. Power Center uses a Keystore file to manage certificates.
Starting Services with a Windows operating system standard user accountTo configure a standard Windows user account, follow these steps:
1. Stop all Power Center services.
2. Go to Control Panel → User Accounts → Manage User Accounts, and add a new standard user (either local or domain), or select an existing standard user.
3. Grant Full Control permission of the following directories or files to the user account.
Directory:
• Dell\OpenManagePowerCenter\bin
• Dell\OpenManagePowerCenter\external\apache-tomcat
• Dell\OpenManagePowerCenter\external\pgsql\bin
• Dell\OpenManagePowerCenter\logs
• Dell\OpenManagePowerCenter\pgdata
File:
• Dell\OpenManagePowerCenter\conf\user.config.xml
• Dell\OpenManagePowerCenter\conf\app.config.xml
98
• Dell\OpenManagePowerCenter\external\apache-tomcat\conf\context.xml
• Dell\OpenManagePowerCenter\external\apache-tomcat\conf\server.xml
• Dell\OpenManagePowerCenter\external\apache-tomcat\conf\tomcat-users.xml
• Dell\OpenManagePowerCenter\external\apache-tomcat\conf\web.xml
• Dell\OpenManagePowerCenter\external\jre\lib\security\krb5.conf
• Dell\OpenManagePowerCenter\keystore.ssl
• Dell\OpenManagePowerCenter\pgdata\pg_hba.conf
• Dell\OpenManagePowerCenter\pgdata\postgresql.conf
4. Delete all content under Dell\OpenManagePowerCenter\external\apache-tomcat\work.
5. Update the Properties of the Power Center services to use the normal user account to log into the service. When the system notifies that "The account .\A has been granted the Log On As A Service right," click OK to confirm.
6. Start all Power Center services for these changes to take effect.
Operating system hardening
Before deploying OpenManage Power Center on a virtual appliance, you must configure the operating system (OS) as follows to prevent data conflicts and errors:
• Installation Settings
– Do not install Power Center and its database in the system volume or domain controller.
• Service Pack and Hotfix Settings
– Install all critical or important service packs and hot fixes.
• Hardening requirements recommended by Center for Internet Security (CIS)
– Apply the hardening requirements recommended by CIS for OpenManage Power Center supported Windows OS. For more information on CIS benchmark, visit www.cisecurity.org.
Audit log
Power Center tracks critical operations and stores related information in a log file for auditing purposes. Each log includes the following basic information:
• User name
• Time
• Action
• Details (Depends on the action; see the following table for audit log details).
Table 11. Audit log details
Action Tracked Information
Successful/failed user login/logout Source IP
Add/remove emergency power reduction Impacted single device/group
Set/update/remove power policy Impacted single device/group
99
Action Tracked Information
Start/stop network discovery Network discovery information; includes protocol profile, IP range
Change session timeout Old/new value of timeout
Change password for Power Center managed user User name
Update role privilege Role name, old/new value of privileges
Add/remove user to role User name, old/new value of role name
Add/remove user User name
The event logs are kept in the log file. You can find the log file(s) in: <InstallDir>\OpenManagePowerCenter\logs\Audit.log.x. Where x is the incremental number, if applicable (shown below.)
The total size of all audit log files is limited to 20 MB. Power Center keeps up to three audit log files of approximately 6.67 MB each. If a new log causes the file size to exceed the limitation for a single log file, Power Center renames the log file to a new name and stores the new log in a new log file with the original file name.
When generating an audit log file, the naming rules are as follows:
• audit.log — The first audit log file name. This file always logs the latest actions.
• audit.log.1 — The second audit log file name. This is copied from audit.log when it exceeds the file size limitation.
• audit.log.2 — The third audit log file name. This is copied from audit.log.1 when audit.log exceeds the file size limitation.
Managing certificates
Power Center uses Keytool— a key and certificate management utility from the Java Runtime Environment (JRE)—to generate a key pair (a public key and an associated private key) that is used to create a self-signed certificate during installation.
Keytool is installed at <InstallDir>\external\jre\bin\keytool.exe. The private key and the self-signed certificate are stored in the keystore file at <InstallDir>\keystore.ssl. The self-signed certificate expires three months after installation.
NOTE: It is strongly recommended to update the private key and self-signed certificate.
You can manage Power Center certificates in Keytool. Common scenarios include:
• Scenario 1 — Generate a key pair and self-signed certificate. During Power Center installation, a key pair and self-signed certificate are generated for the Power Center server.
NOTE: When you delete an entry from the keystore file, make sure you leave at least one key pair entry in the keystore file; otherwise, Power Center will not work.
• Scenario 2 – Replace the self-signed certificate with a signed certificate issued by a Certification Authority (CA). A certificate signed by a CA is more likely to be trusted by the Web browsers. To sign your certificate by a CA, do the following:
– Generate a Certificate Signing Request (CSR) and submit to the CA.
100

– Import a certificate for your CA.
– Import the Certificate Reply from the CA.
• Scenario 3 – Import a new Trust Certificate. Some devices (for example, chassis and the exposed management interface through WS-MAN) or web service providers may provide a certificate for Power Center validation when establishing communication. If you validate the certificate and Power Center fails to verify it by building a trust path from the trust certificate in the keystore file, then communication will fail. In this scenario, you may need to import a new trust certificate to make sure a trust path can be built to verify the certificate.
For more information on how to manage certificates, see Keytool documentation.
101
14Configuring settingsYou configure the OpenManage Power Center settings in the Settings screen. The Settings screen comprises the following tabs:
• General — Configure the timeout for console and device communication.
• Monitoring — Configure the power/thermal units and energy consumption parameters.
• Alerts — Configure alerts for SNMP traps, enable or disable sending alerts through emails, configure email recipients, and event severity-level.
• SMTP — Configure SMTP parameters for sending alert emails.
• Database — Configure database compression and purging policy.
• Directory — Configure Lightweight Directory Access Protocol (LDAP) settings to support authentication through LDAP. This tab is displayed only on systems running the Linux operating systems where OpenManage Power Center is installed.
• Users — Manage user or group accounts for accessing OpenManage Power Center.
• Roles — Managing roles and rights.
• Licensing — Manage the issued licenses.
• Inventory — Track chassis inventory.
Some settings will take effect immediately; some will not. See the following sections for more specific information.
General settings
In the left pane, click Settings. By default the Settings → General tab is displayed.
In the General tab, you can view and configure the timeout of console sessions and protocols.
Configuring console session timeout
1. In the left pane, click Settings.
The General tab of the Settings screen is displayed.
2. Under Console Session Timeout, enter the time, in minutes, after which you want the console session to expire, in the Session Timout text box.
The default time is 20 minutes.
3. Click Save to save the changes or click Reset to revert to the previously saved settings.
Setting protocol timeout periods
1. In the left pane, click Settings.
102
By default, the General settings screen is displayed.
2. In the Protocols Timeout section, enter the time in seconds for the specified communication protocol (IPMI, SNMP, WS-MAN, HTTPS, or SSH).
OpenManage Power Center considers the device not reachable if it cannot get any response from the device within the timeout period.
3. Click Save to apply your settings, Reset to revert to the previously saved settings.
The new settings take effect the next time when Power Center communicates with the device.
Monitoring settings
These settings are used to enable/disable monitoring and set the sampling interval:
• Monitor all devices and groups – Enables or disables monitoring of all devices and groups. By default, the check box is selected. If you clear the check box, you cannot view the device or group power and temperature details.
– Power sampling interval – Power Center gets power data according to the sampling interval you set (1, 3, 6, or 10 minutes). You can view power data on the Power Details page. The default is 1 minute.
– Temperature sampling interval – Power Center gets temperature data according to the sampling interval you set (1, 3, 6, or 10 minutes). You can view temperature data on the Temperature Details page. The default is 1 minute.
• Monitoring Units
– Power Units — The power consumption of a device or device group is displayed in the unit option you select (Watts or BTU/hr). By default, the power consumption is displayed in Watts.
– Temperature Units — The temperature data of a device or device group is displayed in the unit option you select (Celsius, Farenheit). By default, the temperature data is displayed in Celsius.
• Energy Consumption Cost — The power consumption cost comprises the following components:
– Flat Rate — It is the cost of power used per kilowatt hour in the specified currency.
– Cooling Multiplier — It is used to estimate the energy required to cool the device or device group.
– Currency — Select the currency in which you want to calculate the energy consumption cost from the drop-down list.
Recommended sampling intervals for performance tuning and scaling
It is important to configure appropriate Power and Temperature Sampling Intervals in Power Center, because sampling intervals impact the system performance and footprint significantly, including network bandwidth consumption, database size, and trend graph display latency.
The default power and temperature intervals in Power Center are 1 minute. This value is appropriate for small- or medium-sized environments where the device number is less than 1000; however, when the environment has more managed devices, it is recommended to adjust the values to 3 or 6 minutes.
NOTE: The device number includes only supported devices. Unsupported devices are not counted.
When are the settings effective?
• Monitor all devices and groups — Immediately
103
• Power/Temperature sampling interval — Every 30 minutes, for example, 08:00, 08:30, 09:00, and so on.
Configuring the power and temperature sampling intervals
1. On the Settings screen, click the Monitoring tab. Select the Monitoring all devices and groups check box to enable the power and thermal monitoring of all devices and groups.
2. Enter values in the Power Sampling Interval and Temperature Sampling Interval text boxes.
The default power and temperature sampling interval is one minute.
3. Click Save to apply the settings, or click Reset to revert to the previously saved settings.
Configuring the power and temperature monitoring units
1. Under Monitoring → Power Units settings, select the unit of measurement in which the power consumption must be displayed.
The available options are:
• Watts
• BTU/hr
2. Under Temperature Units, select one of the following options in which the temperature monitoring must be displayed.
The available options are:
• Celsius
• Fahrenheit
3. Click Save to apply the settings, or click Reset to revert to the previously saved settings.
Configuring energy consumption cost settings
1. In the left pane, click Settings → Monitoring.
2. In the Energy Consumption Cost section, enter values in the Flat Rate and Cooling Multiplier text boxes.
Flat rate is the cost of power used per kWh in the specified currency.
Cooling Multiplier is used to estimate the energy needed to cool the device or device group.
3. From the Currency drop-down list, select the currency in which the energy consumption cost must be displayed.
4. Click Save to apply your settings, or click Reset to revert to the previously saved settings.
NOTE: Changes to the Cooling Multiplier take effect immediately. But, changes to the Flat Rate take effect at the beginning of the next hour.
Database policy settings
Database policy settings are used to configure the database maintenance policy.
OpenManage Power Center stores monitoring data for your data center in a database file, using compressed power/temperature data to optimize for higher query performance and smallest database size. It stores both power/temperature compressed data and non-compressed data in the database. Data compression helps improve data query efficiency by aggregating and saving monitoring data using a bigger granularity (hourly or daily), but not the original granularity decided by the Sampling Interval.
104
By default, OpenManage Power Center keeps compressed power/temperature data and event data up to 365 days and non-compressed power/temperature data up to 14 days. You can configure the duration for which OpenMange Power Center retains compressed and non-compressed data using the Data compression and Purge data (older than) fields. Data that exceeds its duration or is older than the purge date is deleted. This improves the efficiency of the data query. You can automatically purge data by using the Schedule Purge field, or you can trigger it manually to start purging data immediately (see “Purge Database Now,” below).
You can set the following for database maintenance:
• Data compression — Set the number of the days (1-14) to keep the non-compressed data. The default is 7 days.
• Purge data (older than) — Set the number of the days (1-365) to keep the compressed data and the event logs. The default is 365 days.
• Schedule Purge — Set the time of day to start database purging (00:00:00 - 23:00:00). The default is 23:00:00. You can also purge the data immediately by clicking Purge Now. Power Center immediately purges the database based on the settings in Purge data (older than). After the data is purged an informative event, Database Maintenance Success, is displayed on the Events screen.
• Application Logs Settings — Enter the maximum size for the OpenManage Power Center application log stored in the database, in the Maximum log size text box. The default is 100000 entries. After reaching the specified log size, a new application log is created.
• Events Logs Settings — Enter the maximum size for the OpenManage Power Center event log stored in the database, in the Maximum log size text box. The default is 100000 entries. After reaching the specified log size, a new event log is created.
Setting or editing the database policy
1. In the left pane, click Settings → Database.
2. From the Data compression drop-down list, select the number of days (1-14) for which you want to keep the non-compressed data (the default is 7 days).
3. From the Schedule Purge drop-down list, select the time at which the data must be purged. The default time is 23:00.
4. In the Purge data (older than) text box, enter the number of days to remove the data automatically from the database after the specified period. The default is 365 days.
5. In the Applications Logs Settings → Maximum log size text box, enter the maximum number of entries for the application log. The default size is 100000 entries.
6. In the Events Logs Settings → Maximum log size text box, enter the maximum number of entries for the event log. The default size is 100000 entries.
7. Click Save to apply your changes, or click Reset to revert to the previously saved settings.
DirectoryNOTE: The Directory settings screen is available only in the Linux environment.
On the Directory settings screen, you can configure LDAP settings to manage user authentication and certificate validation on systems running Linux, where OpenManage Power Center is installed. The following table lists the options available on this screen.
105
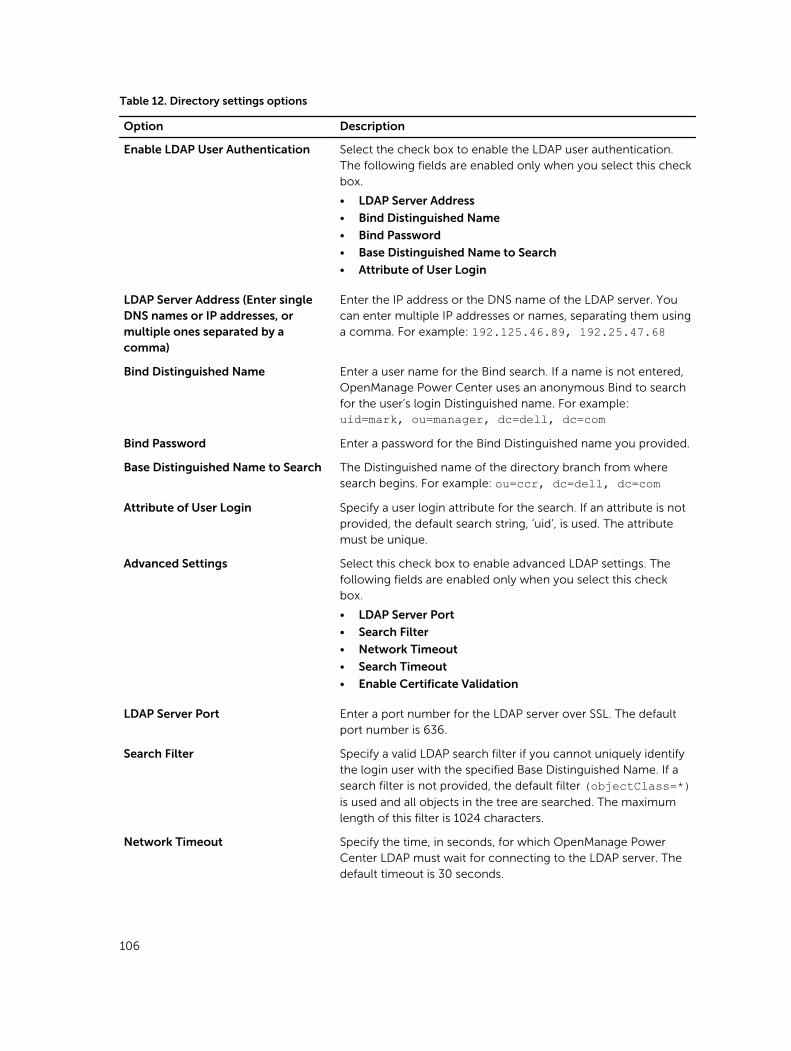
Table 12. Directory settings options
Option Description
Enable LDAP User Authentication Select the check box to enable the LDAP user authentication. The following fields are enabled only when you select this check box.
• LDAP Server Address
• Bind Distinguished Name
• Bind Password
• Base Distinguished Name to Search
• Attribute of User Login
LDAP Server Address (Enter single DNS names or IP addresses, or multiple ones separated by a comma)
Enter the IP address or the DNS name of the LDAP server. You can enter multiple IP addresses or names, separating them using a comma. For example: 192.125.46.89, 192.25.47.68
Bind Distinguished Name Enter a user name for the Bind search. If a name is not entered, OpenManage Power Center uses an anonymous Bind to search for the user’s login Distinguished name. For example: uid=mark, ou=manager, dc=dell, dc=com
Bind Password Enter a password for the Bind Distinguished name you provided.
Base Distinguished Name to Search The Distinguished name of the directory branch from where search begins. For example: ou=ccr, dc=dell, dc=com
Attribute of User Login Specify a user login attribute for the search. If an attribute is not provided, the default search string, ‘uid’, is used. The attribute must be unique.
Advanced Settings Select this check box to enable advanced LDAP settings. The following fields are enabled only when you select this check box.
• LDAP Server Port
• Search Filter
• Network Timeout
• Search Timeout
• Enable Certificate Validation
LDAP Server Port Enter a port number for the LDAP server over SSL. The default port number is 636.
Search Filter Specify a valid LDAP search filter if you cannot uniquely identify the login user with the specified Base Distinguished Name. If a search filter is not provided, the default filter (objectClass=*) is used and all objects in the tree are searched. The maximum length of this filter is 1024 characters.
Network Timeout Specify the time, in seconds, for which OpenManage Power Center LDAP must wait for connecting to the LDAP server. The default timeout is 30 seconds.
106
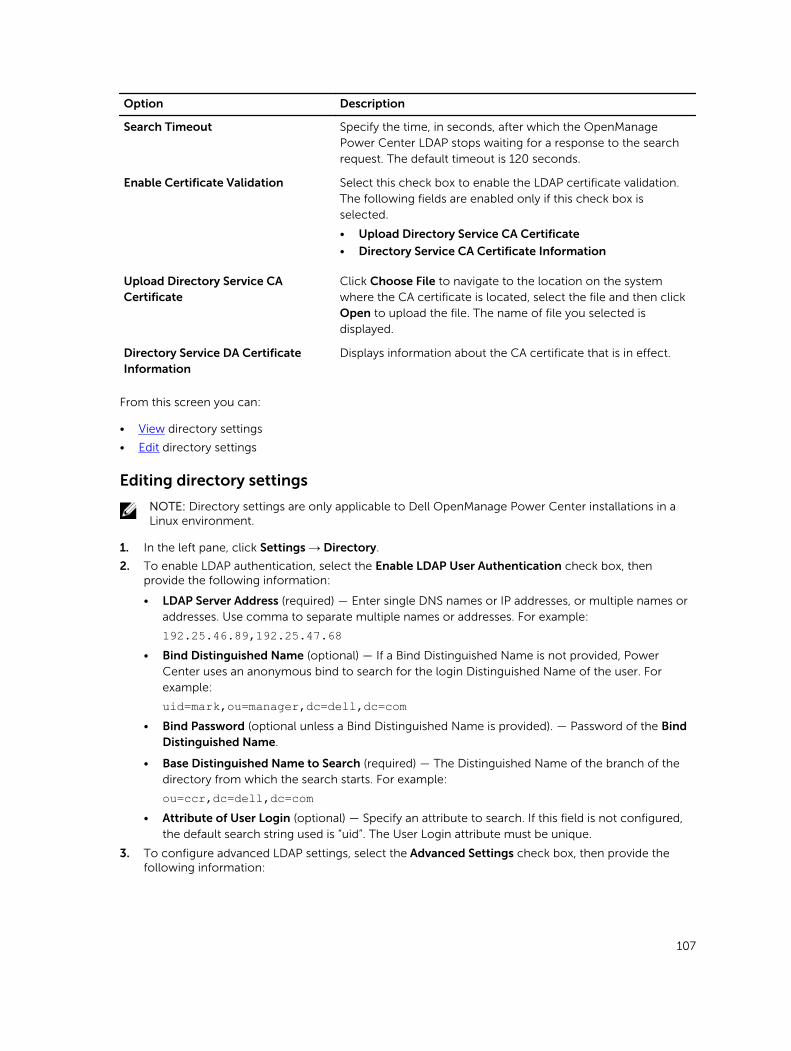
Option Description
Search Timeout Specify the time, in seconds, after which the OpenManage Power Center LDAP stops waiting for a response to the search request. The default timeout is 120 seconds.
Enable Certificate Validation Select this check box to enable the LDAP certificate validation. The following fields are enabled only if this check box is selected.
• Upload Directory Service CA Certificate
• Directory Service CA Certificate Information
Upload Directory Service CA Certificate
Click Choose File to navigate to the location on the system where the CA certificate is located, select the file and then click Open to upload the file. The name of file you selected is displayed.
Directory Service DA Certificate Information
Displays information about the CA certificate that is in effect.
From this screen you can:
• View directory settings
• Edit directory settings
Editing directory settings
NOTE: Directory settings are only applicable to Dell OpenManage Power Center installations in a Linux environment.
1. In the left pane, click Settings → Directory.
2. To enable LDAP authentication, select the Enable LDAP User Authentication check box, then provide the following information:
• LDAP Server Address (required) — Enter single DNS names or IP addresses, or multiple names or addresses. Use comma to separate multiple names or addresses. For example:
192.25.46.89,192.25.47.68• Bind Distinguished Name (optional) — If a Bind Distinguished Name is not provided, Power
Center uses an anonymous bind to search for the login Distinguished Name of the user. For example:
uid=mark,ou=manager,dc=dell,dc=com• Bind Password (optional unless a Bind Distinguished Name is provided). — Password of the Bind
Distinguished Name.
• Base Distinguished Name to Search (required) — The Distinguished Name of the branch of the directory from which the search starts. For example:
ou=ccr,dc=dell,dc=com• Attribute of User Login (optional) — Specify an attribute to search. If this field is not configured,
the default search string used is “uid”. The User Login attribute must be unique.
3. To configure advanced LDAP settings, select the Advanced Settings check box, then provide the following information:
107
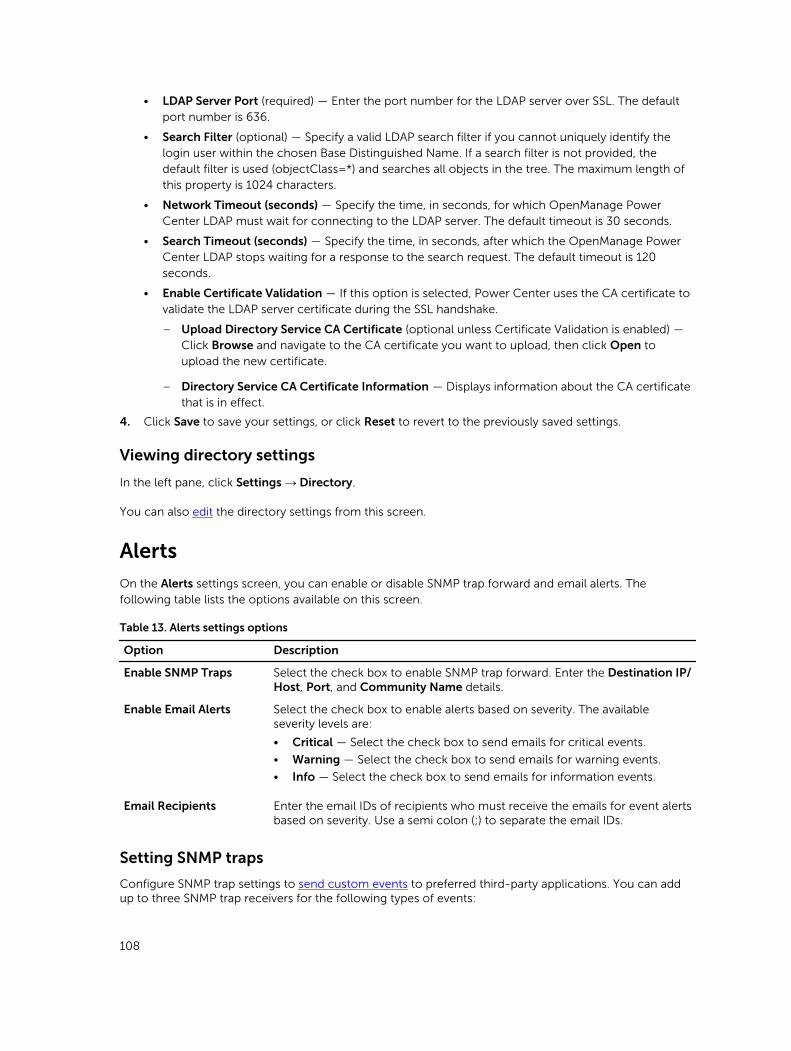
• LDAP Server Port (required) — Enter the port number for the LDAP server over SSL. The default port number is 636.
• Search Filter (optional) — Specify a valid LDAP search filter if you cannot uniquely identify the login user within the chosen Base Distinguished Name. If a search filter is not provided, the default filter is used (objectClass=*) and searches all objects in the tree. The maximum length of this property is 1024 characters.
• Network Timeout (seconds) — Specify the time, in seconds, for which OpenManage Power Center LDAP must wait for connecting to the LDAP server. The default timeout is 30 seconds.
• Search Timeout (seconds) — Specify the time, in seconds, after which the OpenManage Power Center LDAP stops waiting for a response to the search request. The default timeout is 120 seconds.
• Enable Certificate Validation — If this option is selected, Power Center uses the CA certificate to validate the LDAP server certificate during the SSL handshake.
– Upload Directory Service CA Certificate (optional unless Certificate Validation is enabled) — Click Browse and navigate to the CA certificate you want to upload, then click Open to upload the new certificate.
– Directory Service CA Certificate Information — Displays information about the CA certificate that is in effect.
4. Click Save to save your settings, or click Reset to revert to the previously saved settings.
Viewing directory settings
In the left pane, click Settings → Directory.
You can also edit the directory settings from this screen.
Alerts
On the Alerts settings screen, you can enable or disable SNMP trap forward and email alerts. The following table lists the options available on this screen.
Table 13. Alerts settings options
Option Description
Enable SNMP Traps Select the check box to enable SNMP trap forward. Enter the Destination IP/Host, Port, and Community Name details.
Enable Email Alerts Select the check box to enable alerts based on severity. The available severity levels are:
• Critical — Select the check box to send emails for critical events.
• Warning — Select the check box to send emails for warning events.
• Info — Select the check box to send emails for information events.
Email Recipients Enter the email IDs of recipients who must receive the emails for event alerts based on severity. Use a semi colon (;) to separate the email IDs.
Setting SNMP traps
Configure SNMP trap settings to send custom events to preferred third-party applications. You can add up to three SNMP trap receivers for the following types of events:
108
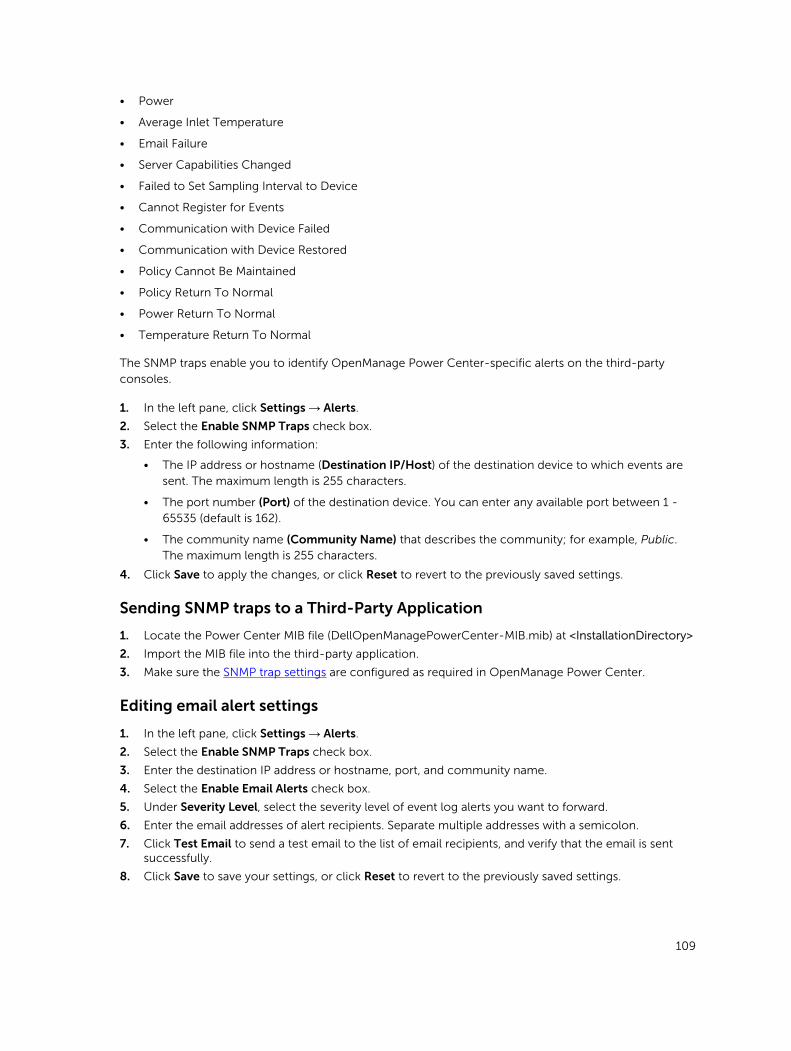
• Power
• Average Inlet Temperature
• Email Failure
• Server Capabilities Changed
• Failed to Set Sampling Interval to Device
• Cannot Register for Events
• Communication with Device Failed
• Communication with Device Restored
• Policy Cannot Be Maintained
• Policy Return To Normal
• Power Return To Normal
• Temperature Return To Normal
The SNMP traps enable you to identify OpenManage Power Center-specific alerts on the third-party consoles.
1. In the left pane, click Settings → Alerts.
2. Select the Enable SNMP Traps check box.
3. Enter the following information:
• The IP address or hostname (Destination IP/Host) of the destination device to which events are sent. The maximum length is 255 characters.
• The port number (Port) of the destination device. You can enter any available port between 1 - 65535 (default is 162).
• The community name (Community Name) that describes the community; for example, Public. The maximum length is 255 characters.
4. Click Save to apply the changes, or click Reset to revert to the previously saved settings.
Sending SNMP traps to a Third-Party Application
1. Locate the Power Center MIB file (DellOpenManagePowerCenter-MIB.mib) at <InstallationDirectory>
2. Import the MIB file into the third-party application.
3. Make sure the SNMP trap settings are configured as required in OpenManage Power Center.
Editing email alert settings
1. In the left pane, click Settings → Alerts.
2. Select the Enable SNMP Traps check box.
3. Enter the destination IP address or hostname, port, and community name.
4. Select the Enable Email Alerts check box.
5. Under Severity Level, select the severity level of event log alerts you want to forward.
6. Enter the email addresses of alert recipients. Separate multiple addresses with a semicolon.
7. Click Test Email to send a test email to the list of email recipients, and verify that the email is sent successfully.
8. Click Save to save your settings, or click Reset to revert to the previously saved settings.
109
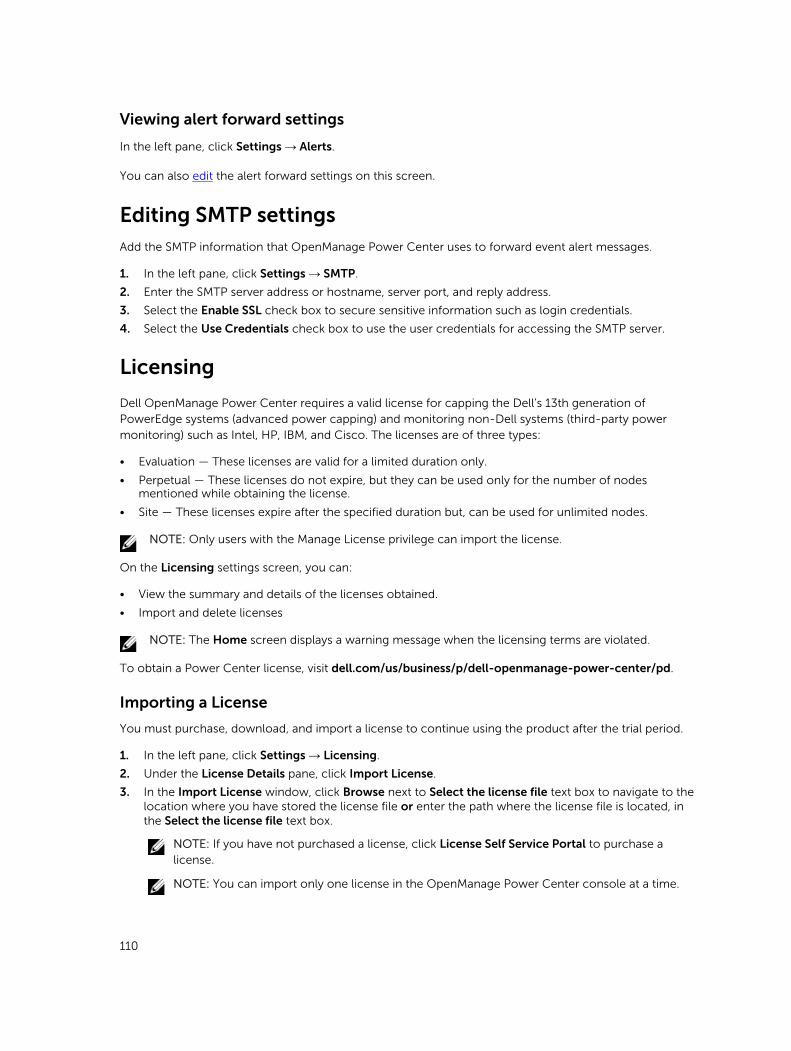
Viewing alert forward settings
In the left pane, click Settings → Alerts.
You can also edit the alert forward settings on this screen.
Editing SMTP settingsAdd the SMTP information that OpenManage Power Center uses to forward event alert messages.
1. In the left pane, click Settings → SMTP.
2. Enter the SMTP server address or hostname, server port, and reply address.
3. Select the Enable SSL check box to secure sensitive information such as login credentials.
4. Select the Use Credentials check box to use the user credentials for accessing the SMTP server.
Licensing
Dell OpenManage Power Center requires a valid license for capping the Dell’s 13th generation of PowerEdge systems (advanced power capping) and monitoring non-Dell systems (third-party power monitoring) such as Intel, HP, IBM, and Cisco. The licenses are of three types:
• Evaluation — These licenses are valid for a limited duration only.
• Perpetual — These licenses do not expire, but they can be used only for the number of nodes mentioned while obtaining the license.
• Site — These licenses expire after the specified duration but, can be used for unlimited nodes.
NOTE: Only users with the Manage License privilege can import the license.
On the Licensing settings screen, you can:
• View the summary and details of the licenses obtained.
• Import and delete licenses
NOTE: The Home screen displays a warning message when the licensing terms are violated.
To obtain a Power Center license, visit dell.com/us/business/p/dell-openmanage-power-center/pd.
Importing a License
You must purchase, download, and import a license to continue using the product after the trial period.
1. In the left pane, click Settings → Licensing.
2. Under the License Details pane, click Import License.
3. In the Import License window, click Browse next to Select the license file text box to navigate to the location where you have stored the license file or enter the path where the license file is located, in the Select the license file text box.
NOTE: If you have not purchased a license, click License Self Service Portal to purchase a license.
NOTE: You can import only one license in the OpenManage Power Center console at a time.
110
After the license is uploaded the following message is displayed.
File uploaded successfully4. Click Browse to upload more licenses or click Close to close the Import License window and return
to the Licensing tab.
You can view the license information in the Licensing tab.
Inventory
On the Inventory settings screen, you can track the inventory of a chassis. By default, the inventory check is run every 30 minutes. But, you can trigger the inventory immediately by clicking Run Now on the Inventory settings screen.
Configuring inventory settings
1. In the left pane, click Settings → Inventory.
2. In the Schedule chassis inventory search on every text box, enter the interval, in minutes, at which you want to run the chassis inventory check.
The default interval is 30 minutes.
3. Click Run Now to run the inventory check immediately.
The Last search for chassis inventory run at displays the timestamp at which the inventory check was last run.
4. Click Save to apply your changes or click Reset to revert to the previously saved settings.
111
15LogsThe Logs feature displays information about unexpected or informational events, or internal errors that occur in OpenManage Power Center. The latest application log is displayed on the top of the list. A log can have a maximum of 1,00,000 entries.
In the left pane, click Logs. The Application Logs screen is displayed. On this screen you can:
• Delete logs
• Export logs
• Refresh the logs list
• Filter logs
• Clear existing filters
• Sort the logs list
• Specify the maximum number of logs
Sorting the logs display1. In the left pane, click Logs to view the list of application logs.
2. To sort the logs, click the ‘up’ or ‘down’ arrow next to the following column headers:
• Severity
• Time
• Entity Name
• Entity Type
• Source/Feature
The ‘up’ or ‘down’ arrow is displayed next to the column header by which the display is sorted.
Setting the application log size
1. On the Application Logs screen, click .
The Application Log Settings window is displayed.
2. Enter the number of entries for the log file in the Maximum log size text box. The default value is 1,00,000.
3. Click Save to save the changes or click Cancel to return to the Application Logs screen without saving the changes.
112
16Backup and recoveryYou can back up and recover data in OpenManage Power Center. To support OpenManage Power Center recovery, you must first back up OpenManage Power Center data. OpenManage Power Center only supports complete backup and recovery. It does not support incremental backup and recovery.
NOTE: You should back up OpenManage Power Center data on a regular basis.
You may need to start or stop OpenManage Power Center services during backup and recovery. For more information on OpenManage Power Center services, see Power Center Services. For more information on how to start or stop OpenManage Power Center services, see your Windows Help.
Power Center data files for backup and recoveryTable 14. Power Center data files
Category Files Description
Configuration files • app.config.xml
• user.config.xml
• web.config.xml
• server.xml
Key store file keystore.ssl
Database data file pgdata Pgdata is a standard PostgreSQL data folder that Power Center uses PostgreSQL to store data.
For a Power Center installation that is located in C:\Program Files\Dell\OpenManagePowerCenter, the data files are located as follows:
• C:\Program Files\Dell\OpenManagePowerCenter\conf\app.config.xml
• C:\Program Files\Dell\OpenManagePowerCenter\conf\user.config.xml
• C:\Program Files\Dell\OpenManagePowerCenter\conf\web.config.xml
• C:\Program Files\Dell\OpenManagePowerCenter\external\apache-tomcat\conf\server.xml
• C:\Program Files\Dell\OpenManagePowerCenter\keystore.ssl
• C:\Program Files\Dell\OpenManagePowerCenter\pgdata
Backing up Power Center data1. Stop all OpenManage Power Center services.
2. Back up all OpenManage Power Center data.
113
a. You must add your operating system user with Read privilege for the files listed in the OpenManage Power Center Data table. Also, you must add Read privileges to all of the sub-contents of the pgdata folder. Refer to your operating system’s documentation for instructions on how to change file privileges.
b. Copy all of the OpenManage Power Center data files to your backup location.
NOTE: For the PostgreSQL database file pgdata, if you want to do customized database backup/recovery, such as incremental backup/recovery, see the PostgreSQL backup and recovery Web page at: www.postgresql.org/docs/8.3/interactive/backup.html.
3. Start all OpenManage Power Center services.
The OpenManage Power Center backup is completed.
Recovering Power Center data1. Install OpenManage Power Center with the same version and user inputs as the original installation.
2. Stop all OpenManage Power Center services.
3. Recover all OpenManage Power Center data files.
a. Refer to your operating system documentation for instructions on how to change file privileges; you must add your operating system user with the Read and Write privileges for the files listed in the OpenManage Power Center Data table.
NOTE: Record your actions, because these privileges will be removed later.
b. Replace all of the Power Center data files with your backup files, except server.xml and java.security. For best results, rename these files for backup, and copy backup files to this location).
c. For server.xml, you must manually update its parameters with the parameters in the original server.xml backup file. These parameters are:
• Update the SSL port:
Replace the value in bold below with the value in the server.xml backup file.
<Connector port="8688" protocol="HTTP/1.1" server="localhost" maxHttpHeaderSize="8192" connectionTimeout="60000" xpoweredBy="false" allowTrace="false" scheme="http" redirectPort="8643"/>
<Connector protocol="org.apache.coyote.http11.Http11Protocol" port="8643" minSpareThreads="5" maxSpareThreads="75" maxHttpHeaderSize="8192" enableLookups="true" disableUploadTimeout="true" connectionTimeout="60000" acceptCount="100" maxThreads="200" server="localhost" allowTrace="false" scheme="https" secure="true" SSLEnabled="true" xpoweredBy="false" keystoreFile="E:\Program Files\Dell\OpenManagePowerCenter\keystore.ssl" keystorePass="DCM10!pass" clientAuth="false" sslProtocol="TLS"/>
• Update the Keystore path:
Replace the value in bold below with the actual location of the recovered keystore.ssl file.
<Connector protocol="org.apache.coyote.http11.Http11Protocol" port="8643" minSpareThreads="5" maxSpareThreads="75" maxHttpHeaderSize="8192" enableLookups="true" disableUploadTimeout="true" connectionTimeout="60000"
114
acceptCount="100" maxThreads="200" server="localhost" allowTrace="false" scheme="https" secure="true" SSLEnabled="true" xpoweredBy="false" keystoreFile="E:\Program Files\Dell\OpenManagePowerCenter\keystore.ssl" keystorePass="DCM10!pass" clientAuth="false" sslProtocol="TLS"/>
• Update the Keystore password:
Replace the value in bold below with the value in the server.xml backup file.
<Connector protocol="org.apache.coyote.http11.Http11Protocol" port="8643" minSpareThreads="5" maxSpareThreads="75" maxHttpHeaderSize="8192" enableLookups="true" disableUploadTimeout="true" connectionTimeout="60000" acceptCount="100" maxThreads="200" server="localhost" allowTrace="false" scheme="https" secure="true" SSLEnabled="true" xpoweredBy="false" keystoreFile="E:\Program Files\Dell\OpenManagePowerCenter\keystore.ssl" keystorePass="DCM10!pass" clientAuth="false" sslProtocol="TLS"/>
d. Refer to your operating system’s documentation for instructions on how to remove file privileges. You must remove the privileges that you have added for the files.
NOTE: Make sure the account that Power Center services is logged on with the Full Control privilege to the Power Center data files (see Backing up Power Center Data). Otherwise, the recovery may fail. For example, if Power Center services are logged on with the Network Service (default) account, and this account has no Full Control privilege to the recovered pgdata folder, then the Dell OpenManage Power Center Database Server service will not start and recovery will fail.
4. Start all Power Center services.
The Power Center recovery is completed.
NOTE: To verify the backup or recovery was successful, double-check the Read/Write privileges for the files listed in the Power Center Data Files table before proceeding.
115
17TroubleshootingThis chapter lists some of the known issues you may encounter when working with Power Center.
Why am I being required to log in more than once by Power Center?
Possible Cause: This occurs when one of the following elements of Kerberos SSO is not correctly configured: the Power Center server, the web browser, or the AD domain controller configuration.
Resolution: Correctly configure your Power Center server and web browser for Kerberos SSO. For more information, see your web browser’s Help documentation.
Why can’t I access the Power Center management console from a Web browser, even though the Power Center server is running normally?
Possible Cause: A proxy setting may prevent the browser from accessing the Power Center server on the network.
Resolution: Check your proxy server settings to make sure they are properly configured.
Why was I automatically logged out of Power Center?
Possible Cause: The network connection was lost.
Resolution: Check your network connection status; make sure that it is connected to the Power Center server.
Possible Cause: The console session timed out.
Resolution: Check the Settings → General → Console Sessions Timeout settings.
Possible Cause: Your user account was deleted.
Resolution: Check your user account status to make sure it was not deleted by another user with higher privileges.
116
Why did my connection to Dell iDRAC6 devices (Dell PowerEdge Servers) fail, when the network connection status is Connected?
Possible Cause: Dell iDRAC6 devices are limited to three concurrent connection sessions, and you have reached the limit. There are various reasons that may cause the session to be occupied for a while until it is relinquished—for example, you used incorrect credential information to connect with Dell iDRAC6 devices for three times or more within a short period.
Resolution: Wait one minute or more for Dell iDRAC6 devices to release the connection sessions, then try again.
Why can’t Power Center receive events sent from devices?
Possible Cause: Power Center is not the destination host of the events sent from devices.
Resolution: Make sure the Power Center server’s IP address is registered on the device as the destination for events.
Possible Cause: There is a network connection problem.
Resolution: Make sure the device network and the Power Center server are connected and packets can be routed.
Possible Cause: Essential services are not started.
Resolution: Make sure that if the Windows SNMP trap service is installed on the Power Center server, this service and the Dell OpenManage Power Center SNMP Dispatcher are started on the Power Center server.
Why are previously-existing power policies (including EPR) still effective on devices when Power Center is corrupted or has been uninstalled?
Possible Cause: Even if Power Center is corrupted or uninstalled, the Power Cap Values of existing power policies (including EPR) on the devices still remain effective.
Resolution:
NOTE: Check your data center power capacity to avoid tripping the breaker before performing the following steps.
• If you intend to uninstall Power Center, make sure to remove all devices first.
• If Power Center is corrupted, do one of the following to remove the power policies:
– If the device number is small, access the Dell iDRAC management console, and manually remove the power policies.
117
– If the device number is large, perform the following steps. Power Center will remove the policies first, and then remove the devices.
1. Install Power Center.
2. Add all the devices to the Power Center management console.
3. Create a logical group that contains all of the devices, and then create a power policy for this group.
4. Remove all of these devices from the Power Center management console.
Why do I see the PostgreSQL error log "FATAL: terminating connection due to administrator command" in the Windows event log?
Possible Cause: This error is caused by Power Center server shutdown. Normally, the Power Center database service (Dell OpenManage Power Center Database Server service) will stop after other Power Center services; however, if the Power Center server has been shut down quickly, the Power Center database service will be forced to stop when other Power Center services are not yet stopped. In this case, the database connection sessions that cannot be closed by other Power Center services will be closed by the Power Center database service, and this error is generated. Since such an error is caused by Windows when it shuts down the services quickly, Power Center will protect its important data through transaction; therefore, this kind of error does not impact Power Center.
Resolution: No action is required.
Why I can’t open power center login page when I access it through Firefox 31?
Possible Cause: During the installation of power center, a self-signed certificate is created for power center. If end user has replaced this self-signed certificate with a certificate signed by a well-known CA(Firefox recognize this CA), then end user will not encounter this issue. Mozilla has improved its certificate verification process. For more information, visit www.wiki.mozilla.org/SecurityEngineering/Certificate_Verification. As a consequence of this improvement, when end users access power center through Firefox 31, they may get an “sec_error_ca_cert_invalid” error.
Resolution: Following are the solutions recommended to handle this issue:
1. Use a different web browser
2. Replace power center’s self signed certificate with a well-known CA signed certificate.
3. Search Mozilla Firefox official documents for solution.
If the above solutions do not work, you can try the following procedure.
1. Delete all Firefox 31 remembered self-signed certificates.
2. Delete all Firefox 31 remembered histories.
3. Restart Firefox31.
4. Try open power center again.
118
Why I encounter an error, “An internal error occurred. Contact Dell support for help: subordinate error code: 0x8f0c1301”, the Home page when OpenManage Power Center server is installed on SUSE Linux Enterprise Server 11 SP2?
Possible Cause: SUSE Linux Enterprise Server 11 SP2 has a known time zone issue which cause power center fail to get the right time zone of server. For more information, visit www.suse.com/support/update/announcement/2012/suse-ru-20121258-1.html.
Resolution: To handle this issue, it is recommended that you install the patch provided by SUSE Linux.
Why do I encounter a network exception while adding a LDAP user?
Possible Cause: If a wrong LDAP server address is set, OpenManage Power Center tries to connect to the LDAP server till network time out. But, if the web server timeout occurs before the network timeout, the network exception is displayed.
Resolution: To handle this issue, it is recommended that you provide the correct LDAP server address.
Why do I encounter a network exception while adding a chassis to a group?
Possible Cause: The chassis platform response could be slow. The web server may timeout before the chassis responds to OpenManage Power Center, resulting in the network exception.
Resolution: The chassis is added to the group at the back-end, but the GUI times out before the chassis responds to OpenManager Power Center.
In the compare report, why is the average power value of a device different when the service is stopped for a few hours?
Possible Cause: There may be an inconsistency in the logic for All Devices and Managed Groups.
Resolution: You can select the device from the Managed Groups where the power value calculation is more accurate.
119

Why is the “policy return to normal” event not displayed when the only device in the Chassis Management Controller (CMC) is deleted?
Possible Cause: When the last blade in the chassis is deleted, the power value returns to “–1” as there is no device in the chassis. The comparison between the power value and the policy capping fails and the “policy return to normal” event is not triggered.
Resolution: You can add a blade to the chassis if the power value does not exceed the power capping value. The “policy return to normal” event is triggered.
120