dell hybrid cloud system for microsoft cps standard ... hcs for microsoft cps... · abstract:...
TRANSCRIPT

Dell Hybrid Cloud System for Microsoft CPS Standard
Delivers Best Price-to-Performance
Published by: Value Prism Consulting
Sponsored by: Dell Corporation
Publish date: December 2015
Abstract: Converged infrastructure systems market has seen new offerings emerge from large technology vendors to
startups, each trying to grab a piece of the fast growing multi-billion dollar market. Each of the vendors offer
customizable yet proprietary compute, storage, and networking configurations, combined with their preferred systems
and management software stack. This makes it difficult to compare the systems on a price-to-performance scale. Value
Prism Consulting, a management consulting firm, was engaged by Dell® Corporation to review and contrast converged
infrastructure offerings from four leading vendors based on publicly-available costs and specification data. On a price-to-
performance scale, Dell’s Hybrid Cloud System for Microsoft CPS Standard was seen as the most cost-effective solution
providing high performance and great value.

ii
Disclaimer Every organization has unique considerations for economic analysis, and significant
business investments should undergo a rigorous economic justification to comprehensively
identify the full business impact of those investments. This analysis report is for informational
purposes only. VALUE PRISM CONSULTING MAKES NO WARRANTIES, EXPRESS,
IMPLIED OR STATUTORY, AS TO THE INFORMATION IN THIS DOCUMENT.
©2015 Value Prism Consulting, LLC. All rights reserved.
Product names, logos, brands, and other trademarks featured or referred to within this report
are the property of their respective trademark holders in the United States and/or other
countries.
Complying with all applicable copyright laws is the responsibility of the user. Without limiting
the rights under copyright, no part of this report may be reproduced, stored in or introduced
into a retrieval system, or transmitted in any form or by any means (electronic, mechanical,
photocopying, recording, or otherwise), or for any purpose, without the express written
permission of Microsoft Corporation.
Dell may have patents, patent applications, trademarks, copyrights, or other intellectual
property rights covering subject matter in this analysis. Except as expressly provided in any
written license agreement from Dell, the furnishing of this analysis does not give you any
license to these patents, trademarks, copyrights, or other intellectual property of Dell.

iii
CONTENTS
Executive Summary ............................................................................................... 1
Introduction ........................................................................................................... 2
System Costs .......................................................................................................... 3
Appliance ........................................................................................................... 3
Deployment ....................................................................................................... 4
Maintenance and Support................................................................................. 4
Price-to-Performance Comparisons ...................................................................... 5
Price per VM ...................................................................................................... 6
Price per Capacity Core ..................................................................................... 7
Price per Capacity Memory ............................................................................... 8
Price per Usable Storage ................................................................................... 8
Other VM Performance Indicators .................................................................... 9
Conclusion ........................................................................................................... 10
Appendix .............................................................................................................. 11

1
EXECUTIVE SUMMARY Converged infrastructure systems include an integrated portfolio of compute, storage,
and networking hardware along with the required systems and management software.
Offered as an “integrated” package, these systems aim at accelerating time to value and
reducing datacenter cost of ownership.
This whitepaper is aimed at organizations’ IT decision makers looking to compare and
contrast converged infrastructure system offerings from leading technology vendors.
Entry level systems from VCE, HP, FlexPod Solutions (NetApp and Cisco), and Dell were
reviewed and compared. Except Dell that uses Microsoft Hyper-V for virtualization, all
remaining vendors were considered running a VMware hypervisor. Price-to-
performance1 comparisons have been collected and summarized across each vendor
based on a price-per-Virtual Machine (VM) metric. Three additional price-to-
performance metrics – price-per-capacity core, price-per-capacity memory, and price-
per-usable storage; and two other VM workload performance metrics – available
memory-per-core and available storage-per-core were also examined.
In Figure 1 results closer to the center show lower price-per-specification. The results
show that Dell’s Hybrid Cloud System for Microsoft CPS Standard (“Dell HCS”) has the
lowest price-per-VM for a standard VM profile. Dell’s 4-node configuration is also better
than the competition in the rest of the price-performance metrics, thus demonstrating
that it is a high-performing and economical converged infrastructure offering. In
addition to providing the lowest out-of-the gate price-per-VM for a single rack, Dell HCS
continues to deliver even greater economic advantage as customers’ needs scale to
multiple racks.
This comparison is based on publicly available list price and specification metrics.
Individual vendors offer different discounts and volume price breaks, so the actual
results may be lower than the ones listed here.
1 Refers to the three-year net present value (NPV) of system purchase price. This includes upfront costs of hardware, software licenses, installation, and prepaid maintenance and support; and recurring costs of maintenance and support agreements. All prices are list prices and exclude any vendor and volume specific discounts.
$-
$10
$20
Price per MixedVM
Price perCapacity Core
Price perCapacityMemory
Price perUsable Storage
Thousands
Dell HCS
HP
VCE
FlexPodFigure 1: Price-to-Performance Ratios across Multiple Converged Infrastructure Systems (Costs in U.S. dollars, in Thousands)

2
INTRODUCTION
Many modern data centers have transitioned from their legacy infrastructure or
considering moving their application and database workloads to a virtualized
environment. However even with a self-service and virtualized environment,
considerable amounts of time and effort are invested in design and provisioning of basic
cloud services, scaling out (adding new servers, storage, and application workloads), and
integrating various non-standard hardware and software components. Customers desire
a consistent cloud experience that supports business agility and reduces infrastructure
and management costs; bringing into play the Converged Infrastructure System.
According to IDC, the converged infrastructure system sales grew 16% year over year by
the end of 2Q 2015, exceeding U.S. $1.5 billion in sales.i In October 2014, Dell
announced their entry into the converged infrastructure marketplace with their Hybrid
Cloud System for Microsoft CPS Standard.
Along with Dell, most vendors offer their converged infrastructure solutions as pre-
configured, pre-optimized, and scalable units, which include: ii iii iv
Hardware components required to run the system, including the rack, servers,
storage, and networking devices that support the organization’s virtualization
workloads;
Software required to run the system, including server operating system,
virtualization hypervisor, and management software used for monitoring and
provisioning of datacenter workloads; and
Installation and deployment services for system and software.
Combined, these end-to-end systems provide organizations an opportunity to get up
and running quickly with their cloud initiatives, lower their IT costs, and deploy their
revenue generating applications and services much faster. Customers can often pick a
system and expect it will be nearly ready to plug-and-play with much less setup and
configuration than a custom or build-it-yourself solution, which could take many
months. By-and-large, purchase of the system is also a simple process that involves
buying a fixed set of software and hardware. However with a pre-packaged model, it has
also become harder to compare and contrast similar solutions.
In this study commissioned by Dell, several converged infrastructure systems, as listed in
the sidebar, have been reviewed, summarized, and compared. Each vendor provides via
its Website datasheets, architecture guidelines, and bill-of-material (BOM) lists that
have been used as the primary source for specification data (such as cores, memory,
storage, etc.). List pricing and other annual costs details are cited specifically, and are
also taken from public sources. Four-or-five-node pricing and specifications were used
for each vendor to ensure consistent comparison.
Data Warehouse Appliances
included:
Dell HCS
VCE Vblock System 240ii
HP ConvergedSystem 250
(CS250)iii with VMware
FlexPod Express Systemiv (from
Cisco & NetApp) with VMware
* Vendor provided pricing (list price)
and specifications data for Dell HCS.

3
SYSTEM COSTS
The system costs over a three-year period were calculated to include upfront
investments in hardware, software licenses, deployment, maintenance and support; and
recurring annual investments in appliance maintenance and support agreements. The
summary of the total price for converged infrastructure systems is presented as a three
year NPV, which assumes a discount rate of 10%.
NOTE: This comparison is based on the list price and publicly available price and specification metrics. Each unique customer discount situation will be different, and more information (and customization) is likely available from each vendor so the comparison may be different than the one using only list prices and specifications. All prices are listed in U.S. dollars and rounded to the nearest hundreds for sub-categories and nearest thousands for totals.
Costs Dell HCS VCE Vblock
System 240 HP CS250
(with VMware) FlexPod
(with VMware)
System Nodes2 (and Cores) 4 (64) 5 (96) 5 (88) 4 (64)
Appliance $114,000 $391,500 $120,100 $219,800
Deployment $10,0003 $0 $1,000 $500
Maintenance/Subscription $4,5004 $35,000 $24,100 $33,000
Support $0 $20,900 $9,300 $5,200
Total Y1 (Upfront) $128,000 $447,000 $155,000 $259,000
Total Y2- Y3 (Annual) $4,000 $56,000 $33,000 $38,000
3 Year NPV of Costs* $135,000 $544,000 $212,000 $325,000
Price-per-VM** $1,610 $3,890 $6,630 $8,780
* Calculated based on list prices over 3 years. Negotiated prices after vendor discounts will likely be lower.
** Total supported VMs was limited either by capacity cores, memory, or usable storage available for hosting a
standard VM with 1.6 CPUs, 2.8GB RAM, and 240GB storage space. See Price per VM section for more details.
Appliance
The total price of each appliance is based on publicly-available information directly from
the vendor price lists or pricing tools, from a reseller that has listed vendor list pricing,
or if necessary from news or blog articles that have published price estimates. Total
retail price for each appliance, along with the pricing source, is listed below.
Dell’s pricing of U.S. $114,000 is based on Dell hardware for a mixed rack appliance with 4 system nodes (64 cores). Software pricing (System Center and Windows Server) was also included in the above price. The costs also included onsite deployment services from Dell. The pricing was furnished by the vendor for the purpose of this whitepaper.
VCE provides an architecture overview v document for the Vblock system 240 that lists the recommended BOM for the appliance with 5 system nodes (96 cores). Vblock System 240 contains server and networking hardware from Cisco,vi storage
2 Includes capacity and management nodes. 3 Only Microsoft Installation Services cost is considered. Deployment cost is included in Dell hardware price. 4 Enterprise Subscription includes cost of license and software maintenance (Microsoft Software Assurance) for fabric and guest VMs.
Table 1: Costs summary for Converged Infrastructure Systems (Costs in U.S. dollars)

4
hardware from EMC,vii and virtualization software from VMware.viii ix Additional software add-ons from Ciscox (for network switches), EMC (for storage solution), and Microsoftxi (OS and database) were also considered as recommended in the architecture guidelines. The hardware and software costs from the sources cited above are U.S. $238,400 and U.S. $153,100 respectively for the 5-node full rack appliance.
HP provides a quick specsiii document and a technical system guidexii that lists the BOM for an HP CS250 with 5 system nodes (88 cores). Hardware prices were derived from HP’s configuration and pricing tool on their online store and totals to U.S. $85,100.xiii Software pricing includes components from HPxiv VMware (for virtualization), and Microsoft (OS and database) totaling to U.S. $35,000.
FlexPod Express Technical Specifications by NetAppxv was used to determine the complete BOM for the configuration, which has 4 system nodes (64 cores). The hardware price was determined by building out the required configuration on Cisco’s online build and price tool.vii The hardware list price comes out to U.S. $88,300. The software costs also included VMware (for virtualization), Cisco (for network switches) and Microsoft (OS and database) licenses, totaling to U.S. $131,400.
Deployment
The deployment costs are one-time professional services costs related to system and
software installation and start up.
NOTE: This is only part of the overall deployment cost considerations. Customers should
carefully evaluate overall project management, workload migration, and testing costs,
which are highly variable and may not be similar across platforms.
Dell’s cost of U.S. $10,000 only includes the Microsoft Installation Services fee.
Additional onsite deployment services costs are already included in the Dell
hardware pricing.5
VCE offers Deployment and Implementation Services for the Vblock System 240
which is included in the cost for the hardware.
HP’s installation and deployment costs were obtained from HP’s online SMB store,
which listed these at U.S. $1,000. xvi
FlexPod’s installation and deployment costs were similarly obtained from NetApp,
which had these costs at U.S. $500 which is 3.0% of the storage price for the
FlexPod system.
Maintenance and Support
Most vendors require customers to pay an annual hardware and software support fee
as a percentage of the initial acquisition costs. The table below summarizes these costs
along with the source and assumptions:
5 Vendor furnished pricing data for the whitepaper.

5
Dell’s annual maintenance and support costs for three years are already included in
the price above. Software assurance (SA) costs for the Microsoft stack amounts to
$4,490 per year. Support pricing were furnished by the vendor.
VCE’s annual software maintenance costs of U.S. $35,000 includes VMware Support
and Subscription (SnS),viii ix Microsoft SA,xi and additional EMC software support
costs, which ranges 7% to 23% of the list price.vii Since VCE’s premier support
pricing was not available publicly, we estimated the annual support price by
including Cisco’s SmartNet 24x7x2xvii and EMC’s Optional Maintenance Costsvii for
hardware. These support levels are fairly representative of Microsoft’s PMC
support; and at U.S. $34,800, estimated to be lower than VCE’s premier support
agreement.
HP’s annual software maintenance costs of U.S. $24,100 includes HP software
support at approximately $15,156,xiii VMware SnS,viii ix and Microsoft SA.xi The total
hardware support price of U.S. $9,300 was calculated using the HP SMB store
website.xviii
FlexPod’s annual software maintenance costs at 5% of the list price,xix added to the
VMware SnSviii ix and Microsoft SAxi totals to U.S. $33,000. Hardware support
includes Net App and Cisco Smart net of $5,200 per year.Error! Bookmark not
efined.
PRICE-TO-PERFORMANCE COMPARISONS
The Table 2 below summarizes key specifications of the converged infrastructure
systems as obtained from their spec sheets, along with the three-year cost. Refer to
Appendix C for more detailed specifications.
As seen in the table, the systems have varying numbers of cores, memory, and user
storage, so simply looking at total price is not a reasonable comparison. To provide a
more accurate comparison, scaled price-to-performance and VM performance metrics
have been calculated and presented.
Specifications Dell HCS VCE Vblock
System 240 HP CS250
(with VMware) FlexPod
(with VMware)
Total System Cores6 64 96 88 64
Total System Memory (GB)6 512 640 640 448
RAW Storage (TB)7 80 64 19.2 10.8
Usable Space Estimate (%)8 55% 80% 40% 80%
Usable Storage (TB) 44 51.2 7.6 8.6
3 Year NPV of Costs* $135,000 $544,000 $212,000 $325,000
Price-per-VM** $1,610 $3,890 $6,630 $8,780
* Calculated based on list prices over 3 years. Negotiated prices after vendor discounts will likely be lower.
6 Includes compute and management nodes. 7 Includes storage from storage nodes / racks only. Does not count the disk space available within system nodes. 8 Discounted for RAID and fault tolerance.
Table 2: Converged Infrastructure Systems Specifications and 3 Year NPV of Costs (Costs in U.S. dollars)

6
** Total supported VMs was limited either by capacity cores, memory, or usable storage available for hosting a
standard VM with 2 CPUs, 3.5GB RAM, and 260GB storage space. See Price per VM section for more details.
Performance Metrics:
Price-per-VM as a key performance metric that shows the price for hosting a single
standard VM across each vendor appliance. A lower value for a vendor indicates
that, at the same available budget, a customer can set up a much denser
environment hosting larger number of VM workloads compared to other vendors.
Price-per-system core as a measure of system performance at a given price. More
cores provide capacity for more concurrent compute tasks. Lower price indicates
better system performance at a given price.
Price-per-system memory as a second measure of system performance. Since
memory is able to store information in a quickly-accessible place, more memory
means more information can be stored without having to write to a disk. Again,
lower price indicates better system performance at a given price.
Price-per-usable storage space as a storage value approximation that can help
provide more comparison details when the amount of usable space is not the same
across all vendor appliances. Lower price for a vendor indicates availability of more
space for VM workloads compared to rest of the vendors, at the same price point.
Available memory-per-core and available storage-per-core as VM performance
indicators. A larger number indicates more system memory and storage space is
available for a given VM profile.
Price per VM
For calculating the price-per-VM, we started off by defining the VM profile. We used the
following VM profile for the metric calculations.
CPU RAM (GB) Disk Size (GB)
1.6 2.8 240
Most datacenter virtual environments are oversubscribed and stacked, meaning the
number of VMs multiplied by the available CPU cores is greater than the total CPU GHz
purchased. This is required to make sure that the datacenter resources are not under-
utilized. There are varying arguments on what should be considered an acceptable
oversubscription factor; estimates point 1:1 to 3:1 as an acceptable range without a
visible loss in performance. We considered a no oversubscription.
Given hosters and cloud datacenters advertise vCPUs at 1GHz, we considered an
additional stacking factor equal to the clock speed of the processors used in each
configuration for our supported VM calculations. Finally, no memory oversubscription
was considered as this is seen to adversely affect VM performance.
Supported VM Calculations:
Table 3: “Mixed workload” VM Profile

7
Appliance Capacity Cores Capacity RAM
(GB)9
Usable Disk
Space (TB)
Total Supported
VMs
Dell HCS 56 392 44 68
VCE Vblock 240 80 448 51 112
HP CS250 64 448 8 30
FlexPod 56 392 9 33
Total number of supported VMs was limited either by total capacity cores, memory, or
usable storage available for hosting the standard VM.
Appliance Supported VMs 3Yr NPV of
Costs*
Dell HCS 68 $135,000
VCE Vblock 240 112 $544,000
HP CS250 30 $212,000
FlexPod 33 $325,000
* Calculated based on list prices over 3 years. Negotiated prices after vendor discounts will likely be lower.
As seen in Figure 2, Dell HCS has the lowest price-per-VM metric. HP and FlexPod were
limited by their low available storage, although the recommended and maximum
supported disk size as per the architecture guidance was selected for each vendor.
Price per Capacity Core
Appliance processors and cores provide the engines for running the VM workloads and
associated management functionality. Dedicated management nodes ensure robust
systems and private cloud management capabilities. Dell HCS and FlexPod require 0.5
management nodes. While both HP and VCE systems require 1.0 management nodes.
With more cores virtual machines run more efficiently; meaning they can handle larger
workloads, while still providing high performance results. More is better, but with
appliances that can scale by adding more nodes, chassis, or racks, even more important
is the price per system core. Note that the number of cores is not directly correlated
with the price – some licenses are not required for every core, but price-per-system core
provides a view into the performance of each appliance as a factor of total costs. When
viewed in relation to the price, all vendors except Dell HCS were in the U.S. $3,000 -
$7,000 per core range. VCE was the most expensive at U.S. $6,800 per capacity core.
9 A further 16GB of RAM was reduced per capacity node to accommodate OS partition and hypervisor functions.
$1,610
$6,630
$3,890
$8,780
$-
$2,000
$4,000
$6,000
$8,000
$10,000
Price per Mixed Workload VM
Dell HCS HP CS250 VCE Vblock FlexPod
Figure 2: Price per VM Comparison for Each Appliance (Costs in U.S. dollars)
Table 4: Supported VM Calculations for Each Appliance (Costs in U.S. dollars)

8
Appliance System Cores 3Yr NPV of
Costs*
Dell HCS 64 $135,000
VCE Vblock
240 96 $544,000
HP CS250 88 $212,000
FlexPod 64 $325,000
* Calculated based on list prices over 3 years. Negotiated prices after vendor discounts will likely be lower.
Price per Capacity Memory
Like cores, the amount of memory included in an appliance is a significant indicator of
potential performance. Large amounts of memory allow for faster operation of
workloads by keeping more information to be processed in memory, instead of having
to make read/write calls to the hard drive. Memory is much more expensive than disk
drives (for equal units of storage), so in addition to the storage metric considered below,
it is important to include price-per-memory ratio comparison as well. As seen in Figure
4, Dell HCS fared better than the competition and was almost 3 times lower compared
to VCE.
Appliance System
Memory
3Yr NPV of
Costs*
Dell HCS 512 GB $135,000
VCE Vblock
240 640 GB $544,000
HP CS250 640 GB $212,000
FlexPod 448 GB $325,000
* Calculated based on list prices over 3 years. Negotiated prices after vendor discounts will likely be lower.
Price per Usable Storage
Usable storage for each appliance is included to provide perspective of total storage
provided for VM workloads after discounting for RAID and fault tolerance. For each
vendor, we selected the recommended and maximum supported disk size as per the
architecture guidance. On the price-per-usable storage metric, Dell HCS led the pack, HP
and FlexPod appliances performed poorly owing to their low available storage space.
$2,410
$3,310
$6,800
$5,800
$-
$1,000
$2,000
$3,000
$4,000
$5,000
$6,000
$7,000
$8,000
Price per Capacity Core
Dell HCS HP CS250 VCE Vblock FlexPod
$340 $470
$1,210
$830
$-
$500
$1,000
$1,500
Price per Capacity Memory
Dell HCS HP CS250 VCE Vblock FlexPod
Figure 3: Price per Capacity Core Comparison for Each Appliance (Costs in U.S. dollars)
Figure 4: Price per Capacity Memory (GB) Comparison for Each Appliance (Costs in U.S. dollars)

9
Appliance Usable Storage 3Yr NPV of
Costs*
Dell HCS 44 TB $135,000
VCE Vblock
240 51 TB $544,000
HP CS250 8 TB $212,000
FlexPod 9 TB $325,000
* Calculated based on list prices over 3 years. Negotiated prices after vendor discounts will likely be lower.
Other VM Performance Indicators
Low memory allocation is one of the most common causes of performance issues in
VMs. Techniques such as memory compression and memory swapping can be used to
get “more” out of the available RAM, but when overcommitted, these often lead to a
severe degradation of VM performance. Similarly, storage oversubscription using
techniques such as thin provisioning can often improve organization’s storage capacity
utilization. However, if not managed properly VMs may be forced to believe there is
space available when it actually isn’t, resulting in serious data losses.
The safest approach therefore, is to have enough memory and storage space in the
system for supporting the VMs reliably. Thus, available memory-per-core and available
storage-per-core are key VM performance indicators. Figure 6 and 7 show that Dell HCS
is either comparable or better than the rest of the vendor appliances for both these
metrics.
Appliance Capacity Cores Capacity
Memory
Dell HCS 56 392 GB
VCE Vblock
240 80 448 GB
HP CS250 64 448 GB
FlexPod 56 392 GB
$3,070
$27,890
$10,630
$37,620
$-
$10,000
$20,000
$30,000
$40,000
Price per Usable Storage
Dell HCS HP CS250 VCE Vblock FlexPod
7 7
6
7
0
2
4
6
8
Effective Memory (GB) per Core
Dell HCS HP CS250 VCE Vblock FlexPod
Figure 5: Price per Usable Storage (TB) Comparison for Each Appliance (Costs in U.S. dollars)
Figure 6: Memory (GB) per Capacity Core Comparison for Each Appliance
10
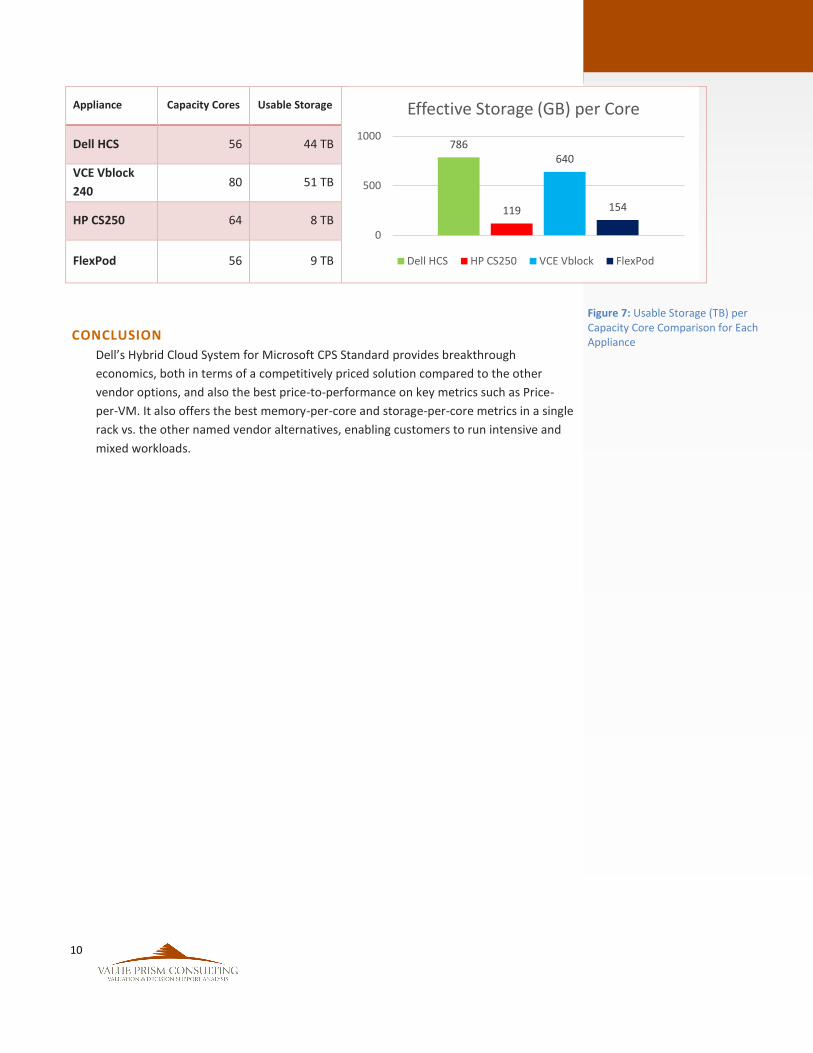
Appliance Capacity Cores Usable Storage
Dell HCS 56 44 TB
VCE Vblock
240 80 51 TB
HP CS250 64 8 TB
FlexPod 56 9 TB
CONCLUSION
Dell’s Hybrid Cloud System for Microsoft CPS Standard provides breakthrough
economics, both in terms of a competitively priced solution compared to the other
vendor options, and also the best price-to-performance on key metrics such as Price-
per-VM. It also offers the best memory-per-core and storage-per-core metrics in a single
rack vs. the other named vendor alternatives, enabling customers to run intensive and
mixed workloads.
786
119
640
154
0
500
1000
Effective Storage (GB) per Core
Dell HCS HP CS250 VCE Vblock FlexPod
Figure 7: Usable Storage (TB) per Capacity Core Comparison for Each Appliance

11
APPENDIX
A: Methodology
In a study commissioned by Dell, similar converged infrastructure systems from four
leading vendors have been reviewed, summarized, and compared, based on publicly-
available price and specification information. The four vendors compared in this study
were:
Dell
VCE
HP
FlexPod (NetApp and Cisco)
Entry level appliances for each vendor were compared, to ensure standard comparisons
across appliances. Summary metrics and total price were compared. Price-per-VM is
used as a price/value approximation that can help provide more accurate comparison
details when the amount of cores, memory, and usable space is not the same across all
appliances.
Comparisons are based on the list price and publicly available cost and specification
metrics. In addition to the appliance price, which is only part of the cost considerations,
the analysis included installation, maintenance, and support costs.
Each discussion with vendors and their customer discount situation will be different,
and more information (and customization) is likely available from the vendors.
Individual results may thus be lower than the ones listed here. Customer should
carefully evaluate deployment, migration, and on-going management costs specific to
their solution requirements before making a decision.
B: About Value Prism Consulting
Value Prism Consulting is a valuation and management consulting firm that provides
services to a broad range of clients worldwide. Our Management Consulting Practice
assists clients with business case development and decision support analysis. Our
solutions measure the results of various options related to business process
improvement, capital and major budget-spending decisions, including infrastructure
upgrades, and the value of new product introductions. Visit www.valueprism.com for
more information.

12
C: Converged Infrastructure System Specifications
Vendor: Dell VCE HP FlexPod
Product: Dell HCS
VCE Vblock System
240
HP CS250 with
VMware
FlexPod Express
Unit Considered: 4 node
configuration
4 node system
with 1 dedicated
management node
4 node system
with 1 dedicated
management node
4 node medium
configuration
Hypervisor: Windows Server
2012R2 VMware vSphere VMware vSphere VMware vSphere
Management:
System Center
2012R2, Windows
Azure
VMware vCenter,
VMware vRealize,
EMC and Cisco
Management Tools
VMware vCenter +
HP Helion
CloudSystem 9.0
VMware vCenter,
VMware vRealize,
NetApp and Cisco
Management Tools
Capacity Nodes: 3.5 4 4 3.5
Processors: 7 8 8 7
Cores: 56 80 64 56
Memory (GB): 392 448 448 392
Clock Speed (GHz): 2.4 2.8 2.6 2.6
Management Nodes: 0.5 1 1 0.5
Processors: 1 2 2 1
Cores: 8 16 24 8
Memory (GB): 64 128 128 64
Clock Speed (GHz): 2.4 2.6 2.6 2.6
System Nodes: 4 5 5 4
Processors: 8 10 10 8
Cores: 64 96 88 64
Memory (GB): 512 640 640 448
Storage Units: 1 1 4 1
Number of HDs: 20 16 16 12
HDD Size (TB): 4 4 1.2 0.9
RAW Storage (TB): 80 64 19.2 10.8
Usable space 55% 80% 40% 80%
Usable Storage (TB): 44 51.2 7.6 8.64
13
D: Sources i IDC Press Release. (2015, September 24). Worldwide Integrated Infrastructure and Platforms Market Sees 1.7% Year-Over-Year Growth on Revenues of $2.4 Billion in the Second Quarter of 2015, According to IDC. http://bit.ly/1jEj8Ca ii VCE. (2014). VblcokTM System 240 At-A-Glance. http://bit.ly/1Gqrlng iii HP. (2014, September 15). QuickSpecs: HP ConvergedSystem 250 for Virtualization. http://bit.ly/1OTw1mZ iv NetApp FlexPod. (2015, April). FlexPod Express Technical Specifications: . http://nt-ap.com/1RpcZUI v VCE. (2015, August). VCE Vblock® System 240 Gen 3.1 Architecture Overview. Revision 1.1. http://bit.ly/1NUWa6h vi Cisco. (Accessed 2015, October 7). Cisco Build and Price tool. http://bit.ly/1sispgW vii EMC. (Accessed 2015, September 28). EMC Price List – State of Florida – (list price considered). http://bit.ly/1qxanpF viii VMware. (Accessed 2015, September 25). VMware vSphere Pricing. http://vmw.re/1ssiUgM ix VMware. (Accessed 2015, September 25). VMware vCenter Pricing. http://vmw.re/1np6jvW x Cisco Pricing. (Accessed 2015, October 6). Cisco DCNM SAN license price – (list price considered). http://bit.ly/1LPiQ5I xi Microsoft. (Accessed 2015, September 25). Microsoft Licensing Advisor. http://mla.microsoft.com/ xii HP. (2015, September). QuickSpecs: HP Converged System 250-HC. http://bit.ly/1OTw1mZ xiii HP. (Accessed 2015, October 6). HP Small & Medium Business Store. http://h30094.www3.hp.com xiv Neobits. (Accessed 2015, October 6). neobits online store. http://shop.neobits.com/ xv NetApp. (2015, April). FlexPod Express Technical Specifications. http://nt-ap.com/1RpcZUI xvi HP. (Accessed 2015, October 6). HP Small & Medium Business Store. http://h30094.www3.hp.com xvii Cisco. (Accessed 2015, September 28). Cisco Global Price List – September 2013. http://bit.ly/1rd8zli xviii HP. (Accessed 2015, October 6). HP Small & Medium Business Store. http://bit.ly/1GXaZgM xix NetApp SME. (Accessed 2015, October 6). Premium Edge 4hr support is 7% of list price, SW Support 5% of list price, install at 3% of storage price.