(delivery agent of the great bubble)s... · 9 does an asset allocation program or robo-advisor tool...
TRANSCRIPT

© 2016 Horizon Kinetics LLC.™
October 4, 2016 - Prepared Exclusively For:
Indexation: Capitalist Tool (Delivery agent of The Great Bubble)

© 2016 Horizon Kinetics LLC.™
A Valuation Sobriety Test
2
Major holdings in the iShares Emerging Markets High Yield Bond ETF
Benchmark Yield YTM Sobriety Test Yield YTM
U.S. Treasury 10-Year Note 1.7% Russian Federation, BB+, 14-year bond ??
IBM Bond, AA-, 10-Year Note 2.5% Petrobras, BB , 4-year note ??
Wendy’s Bond, CCC+, 10-Year Note 6.9% Lebanese Republic, B-, 5-year note ??
iShares High Yield Corp. Bond ETF 5.6% iShares Emerging Mkts High Yield Bond ETF 6.3%Data as of 9/13/2016Source: Bloomberg
Question: What price for the extra risk?

© 2016 Horizon Kinetics LLC.™
A Sobriety Test: The Answers
3
Why Wendy’s should reincorporate and refinance in Lebanon
Benchmark Yield YTM Sobriety Test Yield YTM
U.S. Treasury 10-Year Note 1.7% Russian Federation, BB+, 14-year bond 2.3%
IBM Bond, AA-, 10-Year Note 2.5% Petrobras, BB , 4-year note 6.4%
Wendy’s Bond, CCC+, 10-Year Note 6.9% Lebanese Republic, B-, 5-year note 6.2%
iShares High Yield Corp. Bond ETF 5.6% iShares Emerging Mkts High Yield Bond ETF 6.3%Source: Bloomberg. Data as of 9/13/2016
Would anyone seriously argue that these yields are adequatecompensation for the risk assumed? (That is, could you sell a LebaneseRepublic bond in the open market at 6.2%?) If not, do the prices resultfrom some other factor, such as artificial supply-and-demand pressures?
In EMHY, new money is allocated based on float. In other words, themore debt a nation issues, the greater the allocation to its bondsbecause it has a greater capitalization. That is the mathematical model,and that is entirely logical – to a point.
There is, really, no price discovery. And if there’s no price discovery, isthere really a market? In which case, what is EMHY really worth?

© 2016 Horizon Kinetics LLC.™
The Yield Famine
4
A generation unprepared for rising rates
0
2
4
6
8
10
12
14
16
10 Y
ear R
ate
(%)
10-Yr Treasury Rate
Source: Federal Reserve Bank of St. Louis
In the 35 years leading up to1981, an entire generation offinancial professionals wastrained that knew no realityother than rising interest ratesand inflation. They wereunprepared for the reversalthat eventually occurred.
We are now in the opposite circumstance:the current generation of financialprofessionals has lived 35 years of,essentially, only falling interest rates. If theirfirst Wall Street job was at 22, they areapproaching 60. They, too, have known noother reality, but the consequences ofbeing unprepared are much more grave.

© 2016 Horizon Kinetics LLC.™
The Forgotten Value of Cash
5
Cash: Asset or Liability?
Source: Market Volatility, R. Shiller, MIT Press, 1989, and Irrational Exuberance, Princeton 2015.
For the first time since the late 1940s, stocks and bondyields have converged. Once upon a time – say forthe prior 80 years – investors demanded higher yieldsfrom stocks since the risk was greater. Could bothasset classes be overvalued? If nothing else, cautionis in order, and investors should be very thoughtful,perhaps more than at any other time in their careers,about where capital is being put at risk and why.
In this historically low return environment, meaning inthe last 5,000 years, we are most certainly in untestedterritory. The cash-as-a-liability mentality is very likelycreating balance sheet bubbles. Many investors wishfor the cash on the balance sheet to be “spent” –through share repurchases, dividends, or acquisitions.But this is only a productive use of cash if thetransactions are done at attractive valuations, andwithout taking on more leverage than appropriate.
Those who still believe that cash is a valuable assetand a protector against financial difficulty and a wellof investment possibilities when the tide turns couldbe rewarded in the years to come.
0%
2%
4%
6%
8%
10%
12%
14%
16%
1871
1878
1885
1892
1899
1906
1913
1920
1927
1934
1941
1948
1955
1962
1969
1976
1983
1990
1997
2004
2011
S&P Dividend Yield vs. 10-Yr Rate
S&P 500 Dividend Yield 10-Yr Treasury Rate

© 2016 Horizon Kinetics LLC.™
The Long Road to the Great Mismatch
6
And its unintended distortions
-800
-600
-400
-200
0
200
400
600
800
1,000
Cum
ula
tiive
Net
Flo
ws (
$B)
Index domestic equity mutual funds Index domestic equity ETFs Actively managed domestic equity mutual funds
Annual Fund Flows and Volatility Phobia ($mill)
Year
Index domestic equity mutual
funds
Index domestic equity ETFs
Actively Managed Equity
Mutual Funds2007 38 88 -622008 41 129 -1492009 35 31 -272010 24 47 -702011 30 46 -1252012 31 81 -1402013 69 103 -22014 83 141 -842015 74 64 -176
Cumulative $425 $730 ($835)
The Exodus: $1.1 trillion+ into indexed equities, $0.8 trillion+ out of active management.
In 2005 there were 204 ETFs in the U.S.; in 2015, 1,594 – even as the number of listed stocks declined.
Source: Investment Company Institute
© 2016 Horizon Kinetics LLC.™
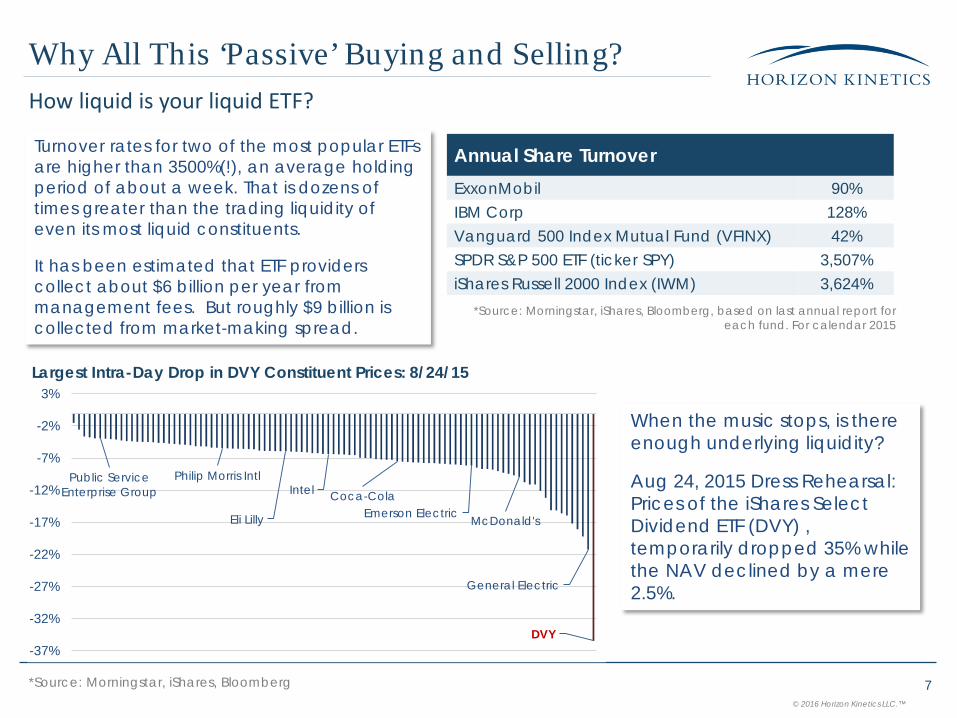
Why All This ‘Passive’ Buying and Selling?How liquid is your liquid ETF?
7
*Source: Morningstar, iShares, Bloomberg, based on last annual report for each fund. For calendar 2015
Annual Share TurnoverExxonMobil 90%IBM Corp 128%Vanguard 500 Index Mutual Fund (VFINX) 42%SPDR S&P 500 ETF (ticker SPY) 3,507%iShares Russell 2000 Index (IWM) 3,624%
Turnover rates for two of the most popular ETFs are higher than 3500%(!), an average holding period of about a week. That is dozens of times greater than the trading liquidity of even its most liquid constituents.
It has been estimated that ETF providers collect about $6 billion per year from management fees. But roughly $9 billion is collected from market-making spread.
Public Service Enterprise Group
Philip Morris Intl
Eli Lilly
Intel Coca-ColaEmerson Electric McDonald's
General Electric
DVY-37%
-32%
-27%
-22%
-17%
-12%
-7%
-2%
3%Largest Intra-Day Drop in DVY Constituent Prices: 8/24/15
When the music stops, is there enough underlying liquidity?
Aug 24, 2015 Dress Rehearsal: Prices of the iShares Select Dividend ETF (DVY) , temporarily dropped 35% while the NAV declined by a mere 2.5%.
*Source: Morningstar, iShares, Bloomberg

© 2016 Horizon Kinetics LLC.™
Indexation’s Top-Heaviness Problem Self-defeating paradox: the formulaic pursuit of diversification creates a new form of idiosyncratic risk
8
IShares US. Energy ETF (IYE)Exxon Mobil Corp 25.0%Chevron Corp 13.1%Schlumberger Ltd 7.6%Occidental Petroleum Corp 4.1%Total Weight of Largest 4 Holdings 49.8%
Do investors in the iShares U.S. Energy ETF, who presume to be buying a diversified portfolio – who were fleeing idiosyncratic risk – know that 50% of the fund is held in 4 holdings, that they are actually buying idiosyncratic risk?
*As of 6/30/2016. Source: Morningstar, iShares, Bloomberg
IShares MSCI Spain Index ETF (EWP)Banco Santander SA 13.1%Telefonica SA 9.0%Banco Bilbao Vizcaya Argentaria 7.6%Iberdrola SA 7.1%Industria De Diseno Textil Inditex 6.8%Amadeus IT Holding SA 4.9%Repsol SA 4.8%Red Electrica Corporacion SA 3.8%Aena SA 3.6%Ferrovial SA 3.5%Weight of Largest 10 Holdings 64.3%
The same top-heaviness problem exists in the iShares MSCI Spain Index ETF (EWP). The top 10 companies are a 64% weight.

© 2016 Horizon Kinetics LLC.™
The Semantic Mis-Investing Problem in IndexationHow to NOT Invest in the Dynamism of Foreign Markets: Through Your Foreign Markets ETF
9
Does an asset allocation program or robo-advisor tool seeking foreign market exposureknow that 6 of the top 10 holdings of theiShares MSCI Spain Index get 70% or more oftheir revenues from outside of Spain? That apurchase of the ETF is, essentially, investingoutside Spain? The same holds true foremerging markets ETFs.
There is also valuation as a consideration.These relatively few companies of sufficientstock market value and trading volume are ingreat demand, simply as raw material forinclusion in the index funds. Might these mega-cap global stocks have outperformed trulylocal, stocks in Spain due to their automaticbid? Might global multi-nationals pose theirown particular systemic risk?
So what does manager relative performancemeasure? What does country allocationmeasure?
Source: Companies’ 2015 annual reports, Bloomberg
IShares MSCI Spain Index ETF (EWP)% of Revenue NOT in SpainBanco Santander SA 88.0%Telefonica SA 73.7%Banco Bilbao Vizcaya Argentaria 71.6%Iberdrola SA 55.0%Industria De Diseno Textil Inditex 82.3%Amadeus IT Holding SA 96.2%Repsol SA 47.6%Red Electrica Corporacion SA 2.1%Aena SA 5.9%Ferrovial SA 72.2%

© 2016 Horizon Kinetics LLC.™
A Security Exercise in LevitationThe Exxon Conundrum – Or, The Problem of the Automatic Bid
10
*As of 6/30/2016. Source: Morningstar, iShares, Bloomberg
As early as 2005, Standard & Poor’s moved to a market cap float-adjusted weighting methodology (so that Wal-Mart and Microsoft’s weightings, among others’, would be reduced by their roughly 40% insider ownership). Itimproved SPY’s scalability for additional AUM. Did they adjust the historical S&P 500 returns to be comparable to thepost-2005 index returns? If not, did the asset allocation modelers adjust their historical return ‘facts’?Ever since, the business demand of ETF organizers for liquid stocks has only increased, with the influx of fundsdirected into the same limited population of liquid stocks.ExxonMobil is one of the most liquid. Ergo, it will be found almost anywhere one can imagine that it can be placed.It’s Growth, It’s Value, Its’ a Bird, It’s a Plane…
It’s Exxon, a Stock for Every Strategy:QUAL iShares USA Quality Factor ETFDGRO iShares Core Dividend Growth ETFHDV iShares Core High Dividend ETFIWD iShares Russell 1000 Value ETFEXT WisdomTree Total Earnings ETFPBP PowerShares S&P 500 BuyWrite ETFTILT FlexShares Morningstar US Market Factors Tilt ETFQUS SPDR MSCI USA Quality Mix ETFGSLC Goldman Sachs ActiveBeta US Large Cap Equity ETFJHML John Hancock Multifactor Large Cap ETFTOK iShares MSCI Kokusai ETFACWI iShares MSCI ACWI ETFMMTM SPDR S&P 1500 Momentum Tilt ETFDVP Deep Value ETFUSWD WisdomTree Weak Dollar US Equity ETF
ExxonMobil: An Exercise in Levitation
$ in bill., except per share data Q2 2013 Q2 2016 Change
Revenue $106.47 $57.69 -46%EPS $1.55 $0.41 -74%
Payout Ratio 41% 183% 350%
BV/Share $37.63 $41.14 9.3%
(Net Expenditures on Stock buybacks/share) $5.52 14.7%
Total Debt $19.40 $44.50 129%
Share price $90.35 $93.74 4%

© 2016 Horizon Kinetics LLC.™
Have a Hunch, Buy a Bunch!Self-defeating paradox: The failed search for diversification in ETFs
11
The popular side of the ETF Divide,witnessed in the ExxonMobil phenomenon,can be seen in almost any large S&P 500constituent. Money has been structurallychanneled into the most liquid securities.
It alters correlation statistics, risk statistics.
The correlation of the largest members ofthe S&P 500 with the index has aboutdoubled from 20 years ago.
Even Mexico and Japan are now morecorrelated with the S&P 500 than the topS&P 500 companies were 20 years ago!
The same holds true for Procter & Gamble,Coca Cola and most of the rest. Where’sthe price discovery?
Correlation with S&P 500* (12/31/07-06/30/16)
IYW iShares US Technology 0.903BJK Market Vectors Gaming 0.807IYH iShares US Health Care 0.815IYE iShares US Energy 0.755ITB iShares US Home Construction 0.681IYT iShares Transportation Avg 0.858EWW iShares Mexico Capped ETF 0.826EWJ iShares MSCI Japan ETF 0.739
Correlation with S&P 500*Security 1995 2015 ChangeApple Inc 0.160 0.662 313.75%Chevron 0.291 0.686 135.74%General Electric 0.522 0.692 32.57%Johnson & Johnson 0.311 0.790 154.02%Microsoft 0.465 0.684 47.10%Pfizer 0.191 0.717 275.39%Procter & Gamble 0.368 0.735 99.73%AT&T 0.428 0.711 66.12%Verizon 0.439 0.721 64.24%ExxonMobil 0.350 0.732 109.14%
Source: Bloomberg, monthly returns, Horizon Kinetics Research*Selected non-fin’l S&P 500 constituents that have existed for 20 years Using Bloomberg correlation matrix (12 months daily return)

© 2016 Horizon Kinetics LLC.™
The ETF Divide: More of The Popular SortsEndless examples of the automatic bid in basket-based investing
12
Source: Company Research, Bloomberg, through 6/16*Selected S&P 500 constituents that have existed for 20 years
12-Mo Change in Revenue30 Largest S&P 500 Companies
Apple Inc. -2.05% Pfizer 9.72%Microsoft -8.83 Chevron -32.71
Exxon Mobil -30.70 Merck -2.00Johnson & Johnson 1.15 Intel 2.47
Amazon.com 25.91 Coca-Cola -5.38Facebook 51.38 Bank of America -4.55
General Electric 2.19 Home Depot 7.70Berkshire Hathaway 4.83 Comcast 6.83
AT&T 16.64 Cisco Systems 0.17JPMorgan Chase -3.22 Visa Inc. 6.31
Procter & Gamble -7.70 Philip Morris Int'l. -8.68Alphabet Inc. Cl. A 17.45 PepsiCo -4.80Alphabet Inc. Cl. C 17.45 Citigroup Inc. -6.49
Wells Fargo 3.02 Walt Disney 9.08Verizon 0.88 I.B.M. -7.65
Average change: 1.93%
Excluding Amazon, Facebook, Google: -2.20%
Which Coca-Cola is More Expensive?
1970s Present
P/EEPS
Growth P/EEPS
Growth Rev.
Growth 1969 36.0x -- 2013 21.23x -3.00% -2.42%1970 30.5x 16.98% 2014 20.63x -1.92% -1.96%1971 36.7x 13.71% 2015 20.98x -1.96% -3.81%1972 41.1x 13.48% 2016E 22.20x -4.50% -6.04%1973 36.9x 12.50%1974 26.3x -8.89%1975 18.3x 21.95%1976 17.7X 19.00%1977 14.3X 12.18%1978 13.6X 13.48%
McDonald’s, Another Case of Automatic Daily Bid($ in billions) 2008 2015 ChangeRevenue $23.52 $25.41 8.0%Net Income $4.31 $4.53 5.0%Long Term Debt $10.19 $24.12 136.8%Equity $13.38 $7.09 -47.0%Weighted Avg. Shares 1.146 0.939 -18.1%
Share price, end of yr. $ 62.19 $ 118.14 90.0%P/E ratio, yr-end px 16.9x 24.6x 45.3%
Source: Historical data from Moody’s Handbook of Common Stocks; 2014-2016 data from Bloomberg

© 2016 Horizon Kinetics LLC.™
The Most Crowded Trade?
13
Year 2015Top 10 Contributors to S&P Return
TotalReturn
Amazon.com Inc 117.8%Microsoft Corp 22.7Alphabet Inc Class A 46.6Alphabet Inc Class C 44.6General Electric Co 27.5Facebook Inc Class A 34.1Home Depot Inc 28.5Starbucks Corp 48.2Netflix Inc 134.4McDonald's Corp 30.4
Weighted average return: 44%Contribution to S&P return: 245%
S&P 500 Index return: 1.4%S&P return without Top 10: -2.7%
Revenue growth (simple avg.) 9.9%
Source: Factset, using iShares Core S&P 500 ETF as a proxy for the S&P 500 Index
As the saying goes, once everyone’s in,there’s only one place to go.
One would do well to remember thatthis state of affairs is not a newphenomenon. In prior eras, it was knownas go-go investing, or trend following.
Now it takes the guise of index-basedasset allocation. All such phenomenahave ended unpleasantly.
The index universe has become, simply,a big momentum trade (or, perhaps, aninterest rate momentum trade). It is themost crowded trade in the history ofinvesting.
And crowded trades eventually attractshort sellers.

© 2016 Horizon Kinetics LLC.™
The Pursuit of Low BetaThe misuse & abuse of historical statistics in the ETF creation process
14
A rhetorical question: Would an activemanager of a low-risk strategy be permittedthe risk of a near-50% weighting infinancials?
A reality: A new ETF cannot be launchedwithout a low Beta.
A result: These largest-in-class ETFs canlegitimately be characterized as lowvolatility, since of late the financial sectorhas not been volatile. And the highweighting enables the ETF to attain itsadvertised low Beta.
Another rhetorical question: Is low volatilityan inherent attribute of companies in thefinancial sector? Or is it perhaps simply thatthe central banks of the world havemaintained an artificially low-rateenvironment for a very long time?
Would anyone legitimately assert that theseETFs will remain non-volatile if rates rise? TheETFs can’t trade out of a low-Beta security;but they can once the Beta rises.
Sample 10 Low Volatility ETFs
BetaWhat is
ThisColumn?
USMV iShares MSCI USA Minimum Volatility ETF 0.72 9.8%SPLV PowerShares S&P Low Volatility ETF 0.72 18.7%EFAV iShares MSCI EAFE Minimum Volatility ETF 0.75 11.8%EEMV iShares MSCI Emerging Markets Min Vol ETF 0.90 24.3%ACWViShares MSCI All Country World Min Vol ETF 0.68 16.7%ONEV SPDR Russell 1000 Low Volatility ETF 0.78 22.4%XMLV PowerShares S&P MidCap Low Volatility ETF 0.76 48.6%XSLV PowerShares S&P SmallCap Low Volatility ETF 0.80 49.2%IDLV PowerShares S&P Intl. Developed Low Vol ETF 0.75 35.8%EELV PowerShares S&P Emerging Mkts Low Vol ETF 0.86 30.9%
Source: Various ETF Factsheets, Bloomberg. Beta from inception of each ETF through August 31, 2016

© 2016 Horizon Kinetics LLC.™
The Alpha ProducersAre Active Managers the Anomaly, or is the Market?
15
Were these active managers theanomaly for underperforming?And is it reasonable to believethat they all lost their touch at thesame time?
Or was it the S&P 500 that was theanomaly for outperforming? Thatalways sounds nonsensical untilafter the fact.All one can say is that if a schoolconsistently gave exams that 98%of the students would fail, at leastsome attention would be paid tothe teachers.
Fund or Holding Company
2015Underperformance
in % Points (net)
2014Underperformance
in % Points (net)Fairholme -12.90% -16.40%Gabelli Value -10.89% -12.10%Wintergreen -8.32% -15.40%Longleaf Partners -20.18% -8.80%Berkshire Hathaway 1 -13.90% 14.00%Pershing Square Hldgs2 -21.90% 27.40%Icahn Enterprises2 -16.80% -27.35%Greenlight Reinsurance2 -21.60% -4.30%Royce Micro-Cap -13.10% -9.50%
1Share price return; book value per share return +8.3% for 2014, +6.4% for 20152 NAV per share change
Source: Company Reports, Horizon Kinetics Research

© 2016 Horizon Kinetics LLC.™
Central Banks, Equities and, Of Course, IndexationStill believe in price discovery?
16
How can a free enterprise systemfunction as such if price discovery is to beinfluenced by agencies of governmentwith infinite supplies of money?
An equity portfolio manager is no longercompeting in the market auction processwith other buyers with limited capital,however vast that sum of capital mightbe. The government is not motivated byordinary considerations of fair value. Oneis entitled to presume, in the absence ofevidence to the contrary, that the aim ofthe Central Bank is to elevate prices. Ifthis is the case, what can be themeaning of the benchmark?
Without price discovery unimpeded byintervention, there can be no rationalallocation of capital. Furthermore,without rational allocation of capital, it isimpossible to properly evaluate the skill ofthe managers.
Q2 2015 Q2 2016
Market value of holdings $38.6 B $61.8 BNumber of positions 2,581 2,581
Top 10% by weight, # of positions 258 258
Largest 10% as share of portfolio 74% 76%
Average market cap of largest 10% (billions)
$60.4 $62.7
* From the Swiss National Bank: “The SNB does not engage in equity selection; it only invests passively. It first decides in which markets it wants to invest, and then replicates appropriate broad equity indices. If the equity portfolio were managed actively, this could send undesirable signals to the market, and might also lead to the politicization of investment decisions.”
Some Unexpected HoldingsName Headqtrs Name Headqtrs
B Communications Ltd Ramat Gan Kornit Digital Ltd Rosh Ha'ayin
Caesarstone Ltd Haifa Mellanox Tech Ltd Yokneam
Cellcom Israel Ltd Netanya Neuroderm Ltd Rehovot
Check Point Software Tech Tel Aviv-Yafo Orbotech Ltd Yavne
Cyberark Software Ltd Petah Tikva Radware Ltd Tel Aviv-Yafo
Elbit Sys Ltd Haifa Taro Pharma Inds Haifa
Gazit Globe Ltd Tel Aviv-Yafo Tower Semicond. Migdal Ha'emek
Israel Chemicals Ltd Tel Aviv-Yafo Wix Com Ltd Tel Aviv-Yafo
Ituran Location & Control Azour
Source: sec.gov 13F Filings
Q: Which Index Fund Would Be the 4th Largest ETF in the U.S.?

© 2016 Horizon Kinetics LLC.™
I Robot: The Age of Machine Investing
17
Does the Swiss National Bank have a special affinity for Israel? Or a subtle asset allocation sub-strategy? Why does it hold 17 Israeli stocks in its U.S. equity portfolio?
Like any analysis, information is revealed by thoughtful examination of facts and relationships.
The Bank’s 2,581 different stocks are not chosen by actual analysts. They’re chosen by machine.
The machine must be programmed.
Do the programmers in Zurich know that a CUSIP that begins with a letter, as opposed to anumber, signifies a foreign company? Why would they?
So, the Swiss National Bank affects the clearing prices of Israeli as well as U.S. stocks.
And they don’t even seem to know it.
What else don’t the machines know?
Largest 5 Holdings (Cusip) Largest 5 Israeli Holdings (Cusip)
Apple Inc (037833100) Check Point Software Tech LT (M22465104)
Exxon Mobil Corp (30231G102) Taro Pharmaceutical Inds Ltd (M8737E108)
Microsoft Corp (594918104) Israel Chemicals Ltd (M5920A109)
Johnson & Johnson (478160104) Elbit Sys Ltd (M3760D101)
AT&T Inc (00206R102) Mellanox Technologies Ltd (M51363113)
* From the Swiss National Bank: “The SNB does not engage in equity selection; it only invests passively. It first decides in which markets it wants to invest, and then replicates appropriate broad equity indices. If the equity portfolio were managed actively, this could send undesirable signals to the market, and might also lead to the politicization of investment decisions.”
Source: sec.gov 13F Filings, Factset

© 2016 Horizon Kinetics LLC.™
The New Division
18
Real Estate / Land
Simon Property Group
Howard Hughes Corp. Dream Unlimited
Market Cap ($ bill.) $65.46 $4.54 $0.44 Inside Ownership* 7.09% 13.80% 35.65%30 Day Avg Vol. (000) 1,279 142 6Price/Book Value 14.3x 1.8x 1.0xFor Howard Hughes, management warrants would add 6.7% to insider holdings
Source: Company reports, Bloomberg. Data as of 9/12/16.
Between Liquid (Index Filler) and Less Liquid
ShippingAP Moller-
Maersk Subsea 7 Stolt-Nielsen Siem Industries
Market Cap ($ bill.) $29.17 $3.25 $0.85 $1.06Inside Ownership 70.3%* 21.3% 58.2%* 79.2%3-mo Avg Vol. (000) 93.056 27.432 1.257 0.895Price/Book Value 0.87x 0.59x 0.53x 0.37x*Voting rights Source: Company reports, Bloomberg. Data as of 9/27/16 or most recent company report.

© 2016 Horizon Kinetics LLC.™
Disclosures & DefinitionsPast performance is not indicative of future results. The information contained herein is subject to explanation during a presentation.
Note that indices are unmanaged and the figures shown herein do not reflect any investment management fee or transaction costs.Investors cannot directly invest in an index. References to market or composite indices or other measures of relative market performance(a “Benchmark”) over a specific period are provided for your information only. Reference to a Benchmark may not reflect the manner inwhich a portfolio is constructed in relation to expected or achieved returns, portfolio guidelines, correlation, concentrations, volatility ortracking error targets, all of which are subject to change over time.
The S&P 500 Index (“SPX”) is a broad based index widely considered as a proxy for overall market performance. It is the property ofStandard & Poor’s ®.
All ETFs mentioned have fees and expenses. You should read their prospectus before investing. All material presented is compiled fromsources believed to be reliable, but no guarantee is given as to its accuracy.
iShares® and Blackrock® are registered trademarks of BlackRock, Inc.
PowerShares® is a registered trademark of Invesco PowerShares Capital Management LLC, investment adviser. Invesco PowerSharesCapital Management LLC (Invesco PowerShares) and Invesco Distributors, Inc., ETF distributor, are indirect, wholly owned subsidiaries ofInvesco Ltd.
This is not an offer to sell or a solicitation to invest. Opinions and estimates offered constitute the judgment of Horizon Kinetics LLC (“HorizonKinetics”) and are subject to change without notice, as are statements of financial market trends, which are based on current marketconditions. Under no circumstances does the information contained within represent a recommendation to buy, hold or sell any security,and it should not be assumed that the securities transactions or holdings discussed were or will prove to be profitable.
Subsidiaries of Horizon Kinetics LLC manage separate accounts and pooled products that may hold certain of the individual securitiesmentioned herein. For more information on Horizon Kinetics, you may visit our website at www.horizonkinetics.com. No part of the researchanalysts’ compensation was, is, or will be, directly or indirectly, related to the specific recommendations or views expressed by theresearch analysts in this report.
No part of this material may be copied, photocopied, or duplicated in any form, by any means, or redistributed without Horizon Kinetics’prior written consent.
©2016 Horizon Kinetics LLC ® All rights reserved.