delivering on financial targets | ing investor day 2016
TRANSCRIPT
Patrick Flynn, CFO ING Group
ING Group Investor Day 2016
Amsterdam • 3 October 2016
Delivering on financial targets
2
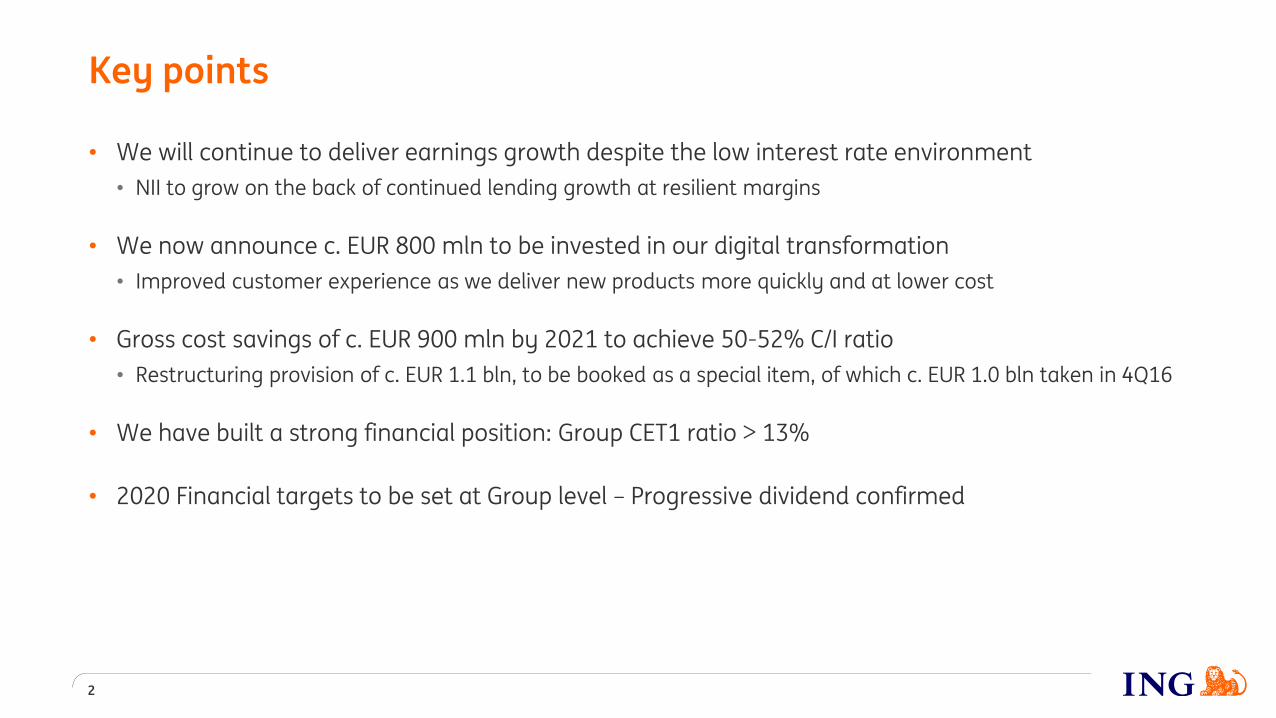
• We will continue to deliver earnings growth despite the low interest rate environment
• NII to grow on the back of continued lending growth at resilient margins
• We now announce c. EUR 800 mln to be invested in our digital transformation
• Improved customer experience as we deliver new products more quickly and at lower cost
• Gross cost savings of c. EUR 900 mln by 2021 to achieve 50-52% C/I ratio
• Restructuring provision of c. EUR 1.1 bln, to be booked as a special item, of which c. EUR 1.0 bln taken in 4Q16
• We have built a strong financial position: Group CET1 ratio > 13%
• 2020 Financial targets to be set at Group level – Progressive dividend confirmed
Key points
ING is on track to deliver on our Ambition 2017
3
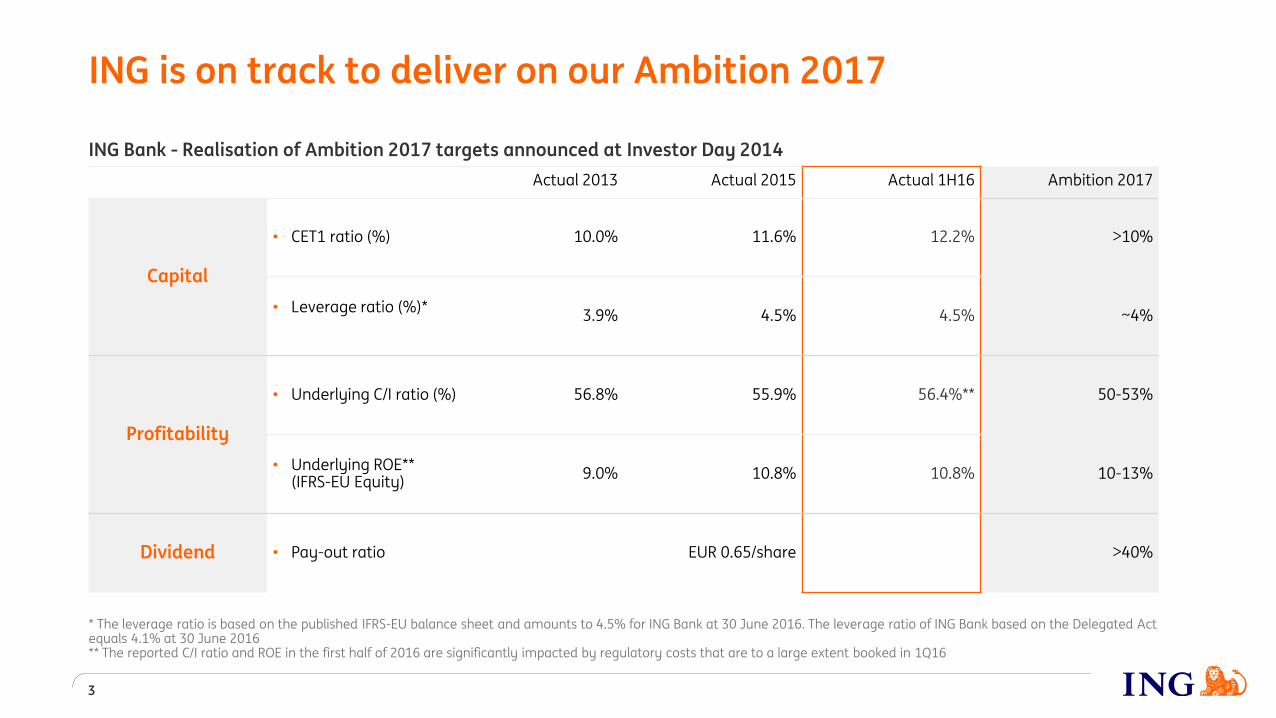
ING Bank - Realisation of Ambition 2017 targets announced at Investor Day 2014
Actual 2013 Actual 2015 Actual 1H16 Ambition 2017
Capital
• CET1 ratio (%) 10.0% 11.6% 12.2% >10%
• Leverage ratio (%)*3.9% 4.5% 4.5% ~4%
Profitability
• Underlying C/I ratio (%) 56.8% 55.9% 56.4%** 50-53%
• Underlying ROE** (IFRS-EU Equity)
9.0% 10.8% 10.8% 10-13%
Dividend • Pay-out ratio EUR 0.65/share >40%
* The leverage ratio is based on the published IFRS-EU balance sheet and amounts to 4.5% for ING Bank at 30 June 2016. The leverage ratio of ING Bank based on the Delegated Act equals 4.1% at 30 June 2016** The reported C/I ratio and ROE in the first half of 2016 are significantly impacted by regulatory costs that are to a large extent booked in 1Q16
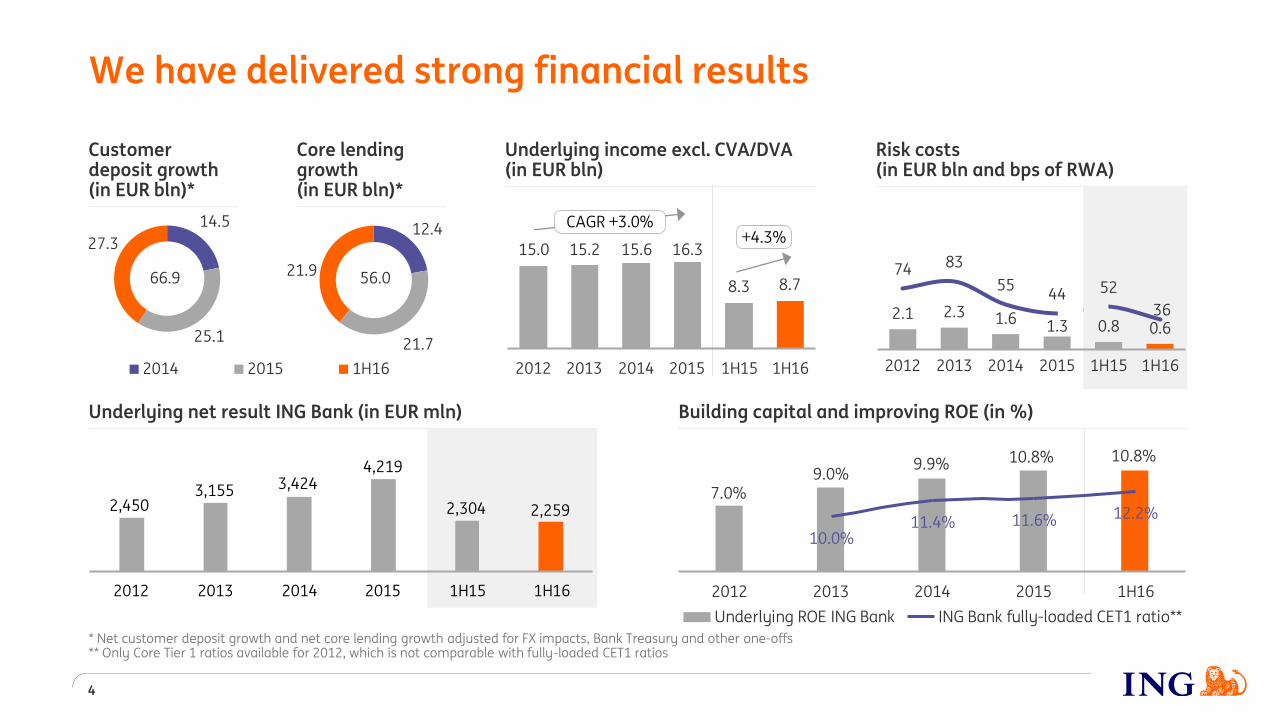
Underlying net result ING Bank (in EUR mln)
2,2592,3042,4503,155 3,424
4,219
2012 2013 2014 2015 1H15 1H16
Customer deposit growth (in EUR bln)*
Core lending growth (in EUR bln)*
12.4
21.7
21.9
2014 2015 1H16
14.5
25.1
27.3
We have delivered strong financial results
4
15.0 15.2 15.6
8.3
16.3
8.7
2012 2013 2014 2015 1H15 1H16
Risk costs (in EUR bln and bps of RWA)
Underlying income excl. CVA/DVA(in EUR bln)
2.1 2.3 1.6 1.3 0.8 0.6
74 83
5544 52
36
2012 2013 2014 2015 1H15 1H16
Building capital and improving ROE (in %)
7.0%9.0%
9.9% 10.8% 10.8%
10.0%11.4% 11.6% 12.2%
2012 2013 2014 2015 1H16
Underlying ROE ING Bank ING Bank fully-loaded CET1 ratio**
* Net customer deposit growth and net core lending growth adjusted for FX impacts, Bank Treasury and other one-offs** Only Core Tier 1 ratios available for 2012, which is not comparable with fully-loaded CET1 ratios
56.066.9
CAGR +3.0%+4.3%
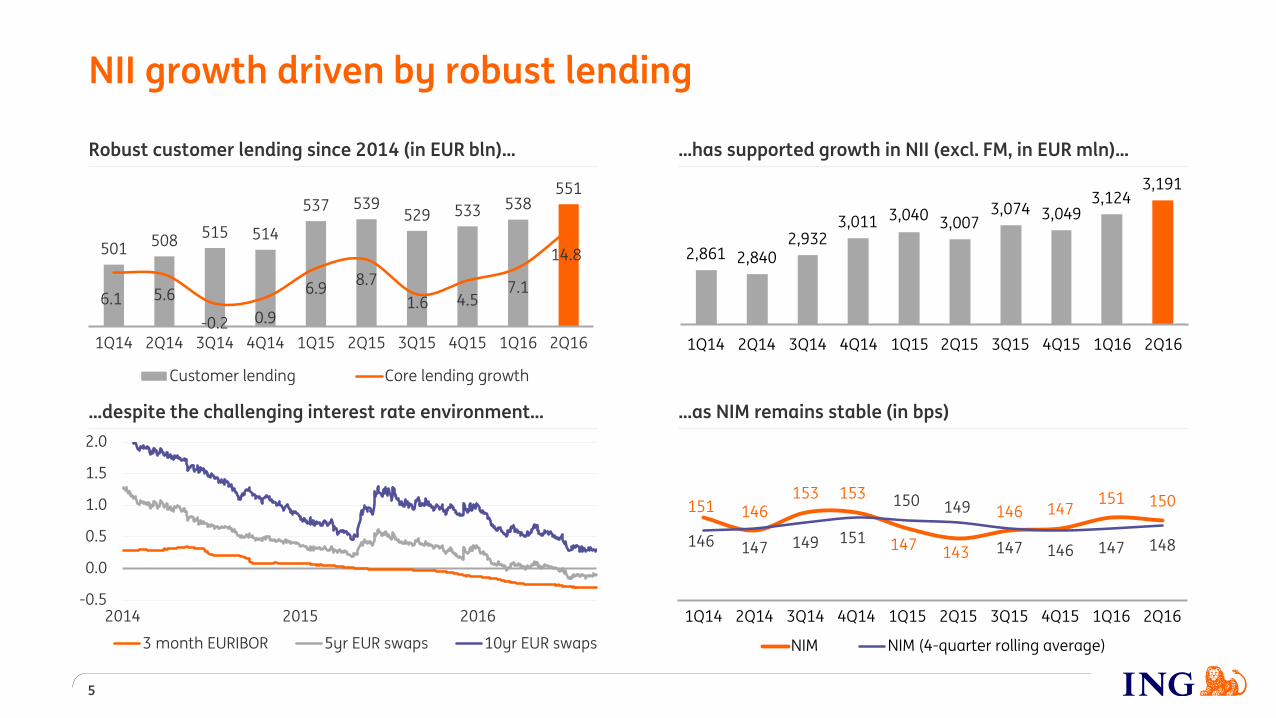
NII growth driven by robust lending
5
3,0073,074 3,049
3,1243,191
2,861 2,8402,932
3,011 3,040
1Q14 2Q14 3Q14 4Q14 1Q15 2Q15 3Q15 4Q15 1Q16 2Q16
-0.5
0.0
0.5
1.0
1.5
2.0
2014 2015 2016
3 month EURIBOR 5yr EUR swaps 10yr EUR swaps
151 146153 153
147 143
146 147151 150
146 147 149 151
150 149
147 146 147 148
1Q14 2Q14 3Q14 4Q14 1Q15 2Q15 3Q15 4Q15 1Q16 2Q16
NIM NIM (4-quarter rolling average)
Robust customer lending since 2014 (in EUR bln)… …has supported growth in NII (excl. FM, in EUR mln)…
…as NIM remains stable (in bps)…despite the challenging interest rate environment…
501508
515 514
537 539529 533 538
551
6.1 5.6
-0.2 0.9
6.98.7
1.6 4.57.1
14.8
1Q14 2Q14 3Q14 4Q14 1Q15 2Q15 3Q15 4Q15 1Q16 2Q16
Customer lending Core lending growth
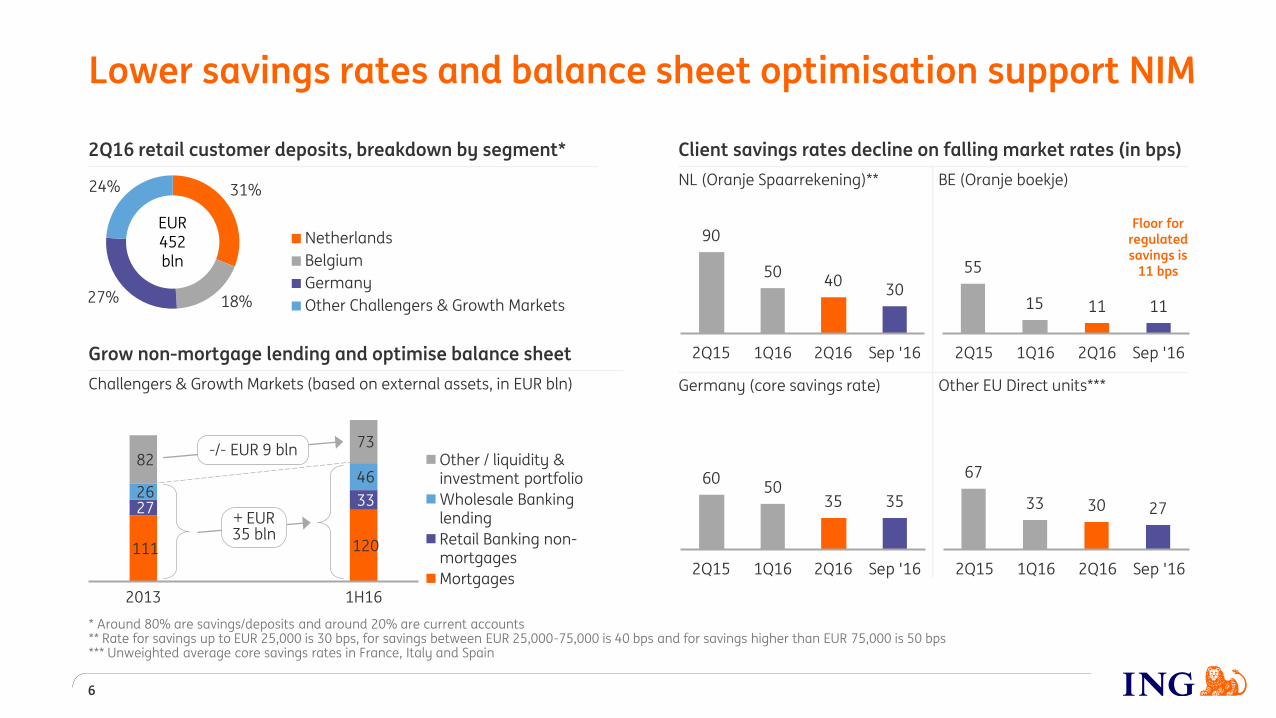
Client savings rates decline on falling market rates (in bps)
NL (Oranje Spaarrekening)** BE (Oranje boekje)
Germany (core savings rate) Other EU Direct units***
90
5040
30
2Q15 1Q16 2Q16 Sep '16
55
15 11 11
2Q15 1Q16 2Q16 Sep '16
6050
35 35
2Q15 1Q16 2Q16 Sep '16
67
33 30 27
2Q15 1Q16 2Q16 Sep '16
111 120
27 33 26
46 82
73
2013 1H16
Other / liquidity & investment portfolio
Wholesale Banking lending
Retail Banking non-mortgages
Mortgages
Lower savings rates and balance sheet optimisation support NIM
6
31%
18%27%
24%
Netherlands
Belgium
Germany
Other Challengers & Growth Markets
EUR452 bln
-/- EUR 9 bln
* Around 80% are savings/deposits and around 20% are current accounts** Rate for savings up to EUR 25,000 is 30 bps, for savings between EUR 25,000-75,000 is 40 bps and for savings higher than EUR 75,000 is 50 bps *** Unweighted average core savings rates in France, Italy and Spain
+ EUR 35 bln
2Q16 retail customer deposits, breakdown by segment*
Grow non-mortgage lending and optimise balance sheet
Challengers & Growth Markets (based on external assets, in EUR bln)
Floor for regulated savings is
11 bps
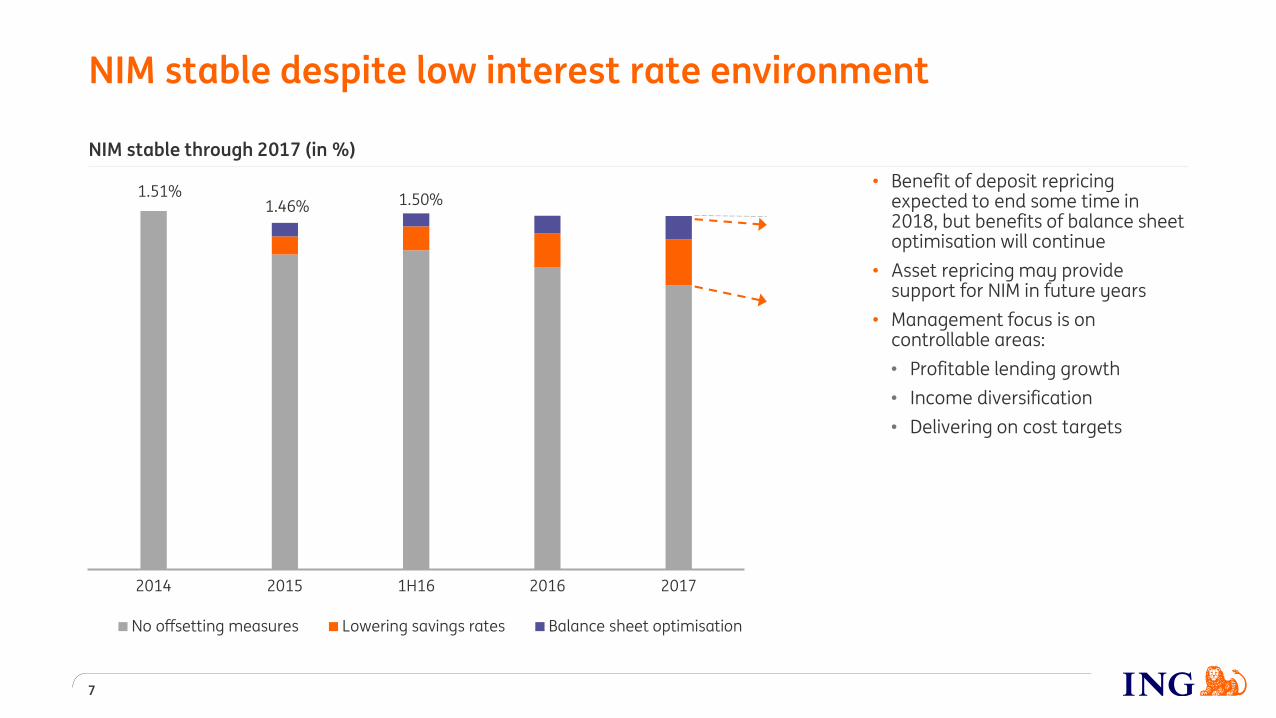
NIM stable despite low interest rate environment
7
NIM stable through 2017 (in %)
• Benefit of deposit repricingexpected to end some time in 2018, but benefits of balance sheet optimisation will continue
• Asset repricing may provide support for NIM in future years
• Management focus is on controllable areas:
• Profitable lending growth
• Income diversification
• Delivering on cost targets
2014 2015 1H16 2016 2017
No offsetting measures Lowering savings rates Balance sheet optimisation
1.46%1.51%
1.50%
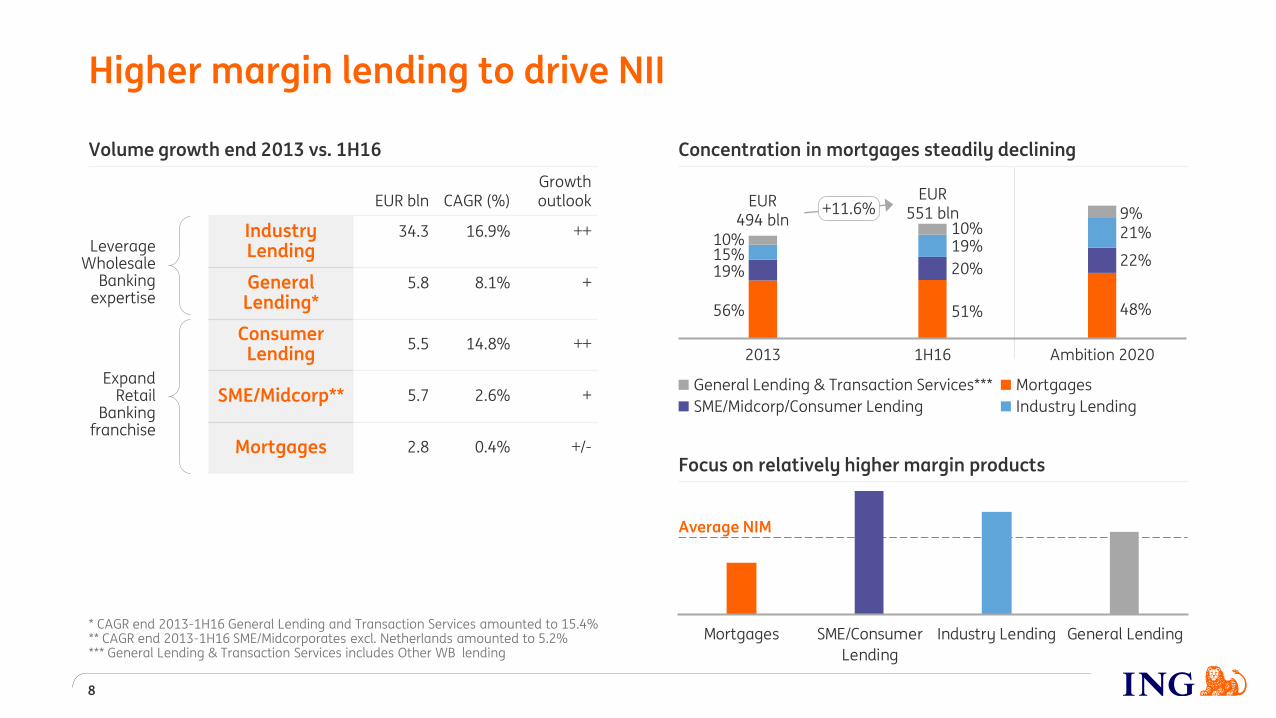
2013 1H16 Ambition 2020
Concentration in mortgages steadily declining
Higher margin lending to drive NII
8
Average NIM
Mortgages SME/Consumer
Lending
Industry Lending General Lending
Volume growth end 2013 vs. 1H16
EUR bln CAGR (%)Growth outlook
Industry Lending
34.3 16.9% ++
General Lending*
5.8 8.1% +
Consumer Lending
5.5 14.8% ++
SME/Midcorp** 5.7 2.6% +
Mortgages 2.8 0.4% +/-
+11.6%EUR
551 blnEUR
494 bln10%15%19%
56%
10%19%
20%
51%
Focus on relatively higher margin products
Leverage Wholesale
Banking expertise
Expand Retail
Banking franchise
* CAGR end 2013-1H16 General Lending and Transaction Services amounted to 15.4% ** CAGR end 2013-1H16 SME/Midcorporates excl. Netherlands amounted to 5.2%*** General Lending & Transaction Services includes Other WB lending
48%
22%
21%9%
Industry Lending
General Lending & Transaction Services***
SME/Midcorp/Consumer Lending
Mortgages
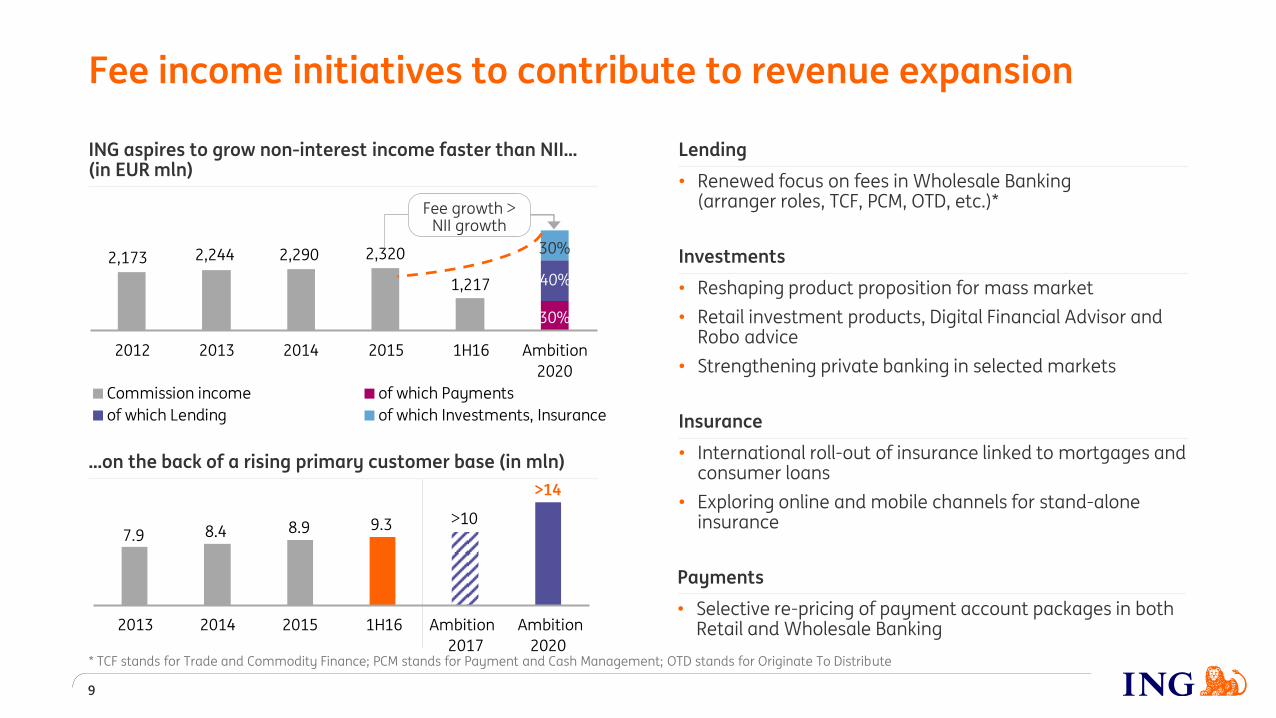
>14
9.37.9 8.4 8.9
>10
2013 2014 2015 1H16 Ambition
2017
Ambition
2020
…on the back of a rising primary customer base (in mln)
2,2902,2442,173
1,217
2,320
2012 2013 2014 2015 1H16 Ambition
2020
Commission income of which Payments
of which Lending of which Investments, Insurance
ING aspires to grow non-interest income faster than NII…(in EUR mln)
Fee income initiatives to contribute to revenue expansion
9
Payments
• Selective re-pricing of payment account packages in both Retail and Wholesale Banking
Investments
• Reshaping product proposition for mass market
• Retail investment products, Digital Financial Advisor and Robo advice
• Strengthening private banking in selected markets
Lending
• Renewed focus on fees in Wholesale Banking (arranger roles, TCF, PCM, OTD, etc.)*
Insurance
• International roll-out of insurance linked to mortgages and consumer loans
• Exploring online and mobile channels for stand-alone insurance
Fee growth > NII growth
30%
30%
40%
* TCF stands for Trade and Commodity Finance; PCM stands for Payment and Cash Management; OTD stands for Originate To Distribute
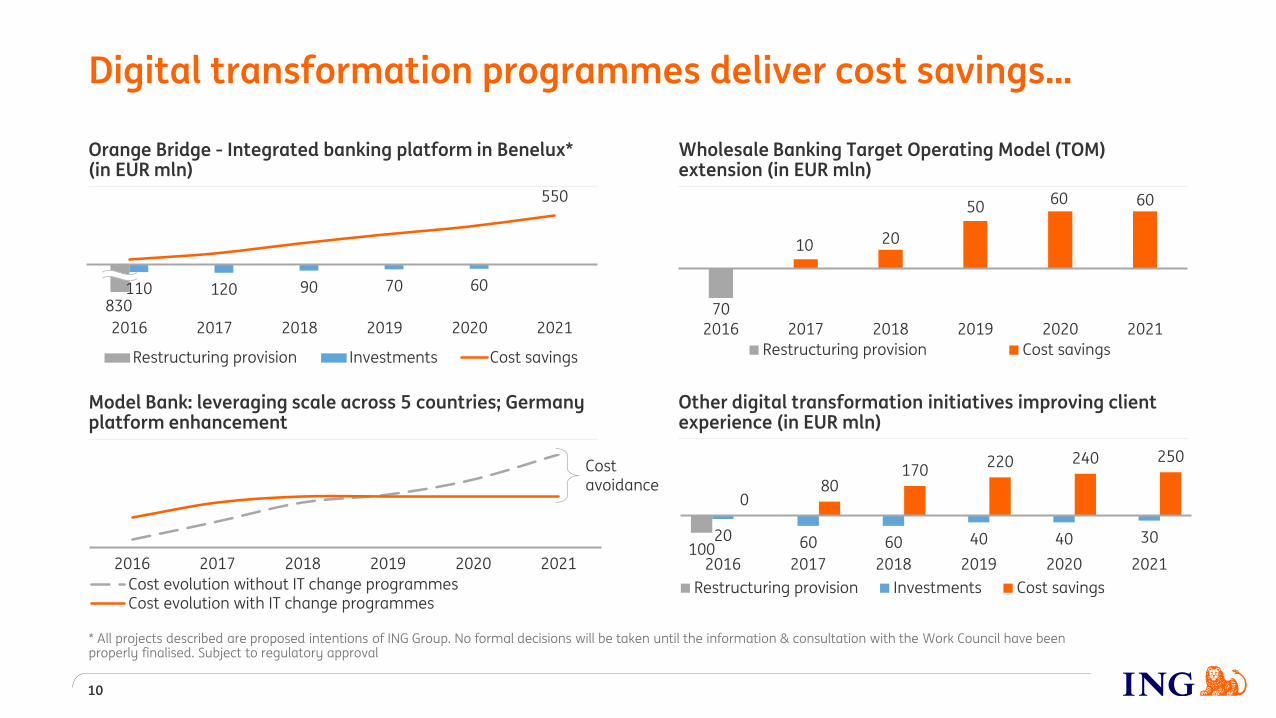
10020 60 60 40 40 30
080
170220 240 250
2016 2017 2018 2019 2020 2021
Restructuring provision Investments Cost savings
Digital transformation programmes deliver cost savings…
10
Other digital transformation initiatives improving client experience (in EUR mln)
Model Bank: leveraging scale across 5 countries; Germany platform enhancement
2016 2017 2018 2019 2020 2021
Cost evolution without IT change programmesCost evolution with IT change programmes
Costavoidance
10 20
5060 60
2016 2017 2018 2019 2020 2021
Restructuring provision Cost savings
* All projects described are proposed intentions of ING Group. No formal decisions will be taken until the information & consultation with the Work Council have been properly finalised. Subject to regulatory approval
Orange Bridge - Integrated banking platform in Benelux*(in EUR mln)
Wholesale Banking Target Operating Model (TOM) extension (in EUR mln)
110 120 90 70 60
550
2016 2017 2018 2019 2020 2021
Restructuring provision Investments Cost savings
830 70
150210 170
120 11040
100
300
550
700
900
2016 2017 2018 2019 2020 2021
Restructuring provision Investments** Accumulated savings
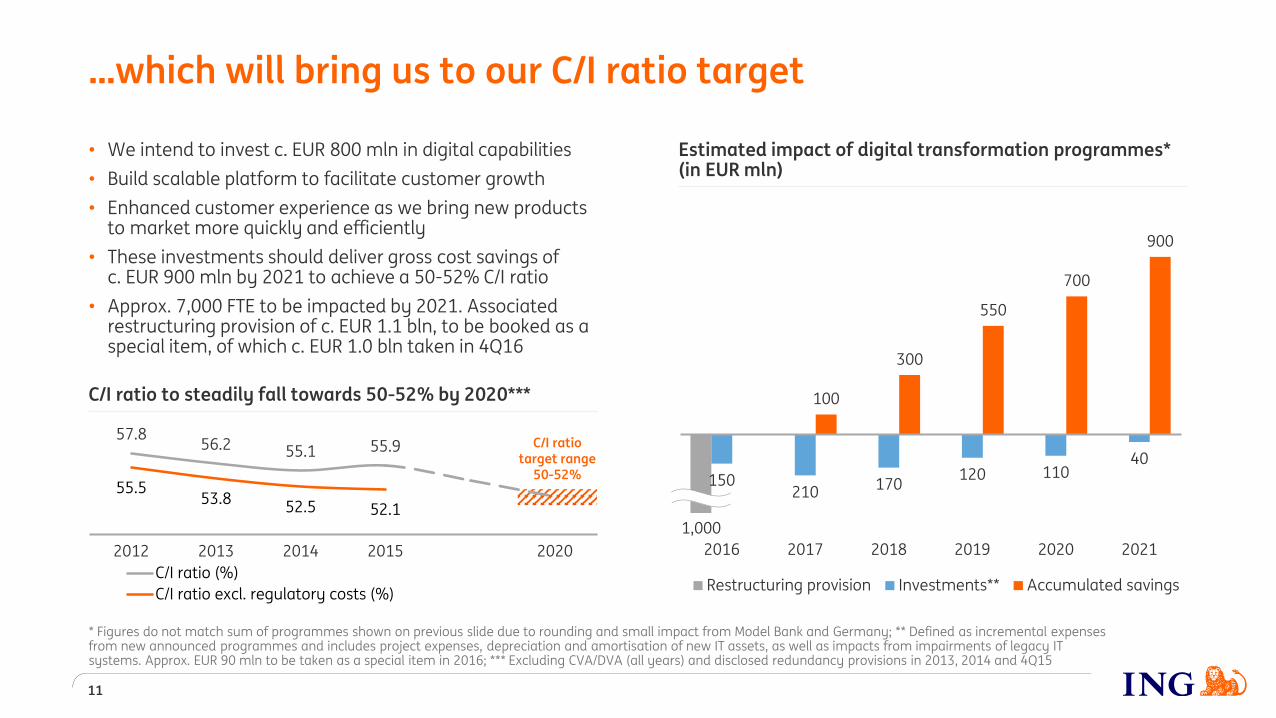
…which will bring us to our C/I ratio target
• We intend to invest c. EUR 800 mln in digital capabilities
• Build scalable platform to facilitate customer growth
• Enhanced customer experience as we bring new products to market more quickly and efficiently
• These investments should deliver gross cost savings of c. EUR 900 mln by 2021 to achieve a 50-52% C/I ratio
• Approx. 7,000 FTE to be impacted by 2021. Associated restructuring provision of c. EUR 1.1 bln, to be booked as a special item, of which c. EUR 1.0 bln taken in 4Q16
11
57.856.2 55.1 55.9
55.553.8
52.5 52.1
2012 2013 2014 2015 2020
C/I ratio (%)
C/I ratio excl. regulatory costs (%)
C/I ratio to steadily fall towards 50-52% by 2020***
1,000
C/I ratiotarget range
50-52%
Estimated impact of digital transformation programmes*(in EUR mln)
* Figures do not match sum of programmes shown on previous slide due to rounding and small impact from Model Bank and Germany; ** Defined as incremental expenses from new announced programmes and includes project expenses, depreciation and amortisation of new IT assets, as well as impacts from impairments of legacy IT systems. Approx. EUR 90 mln to be taken as a special item in 2016; *** Excluding CVA/DVA (all years) and disclosed redundancy provisions in 2013, 2014 and 4Q15
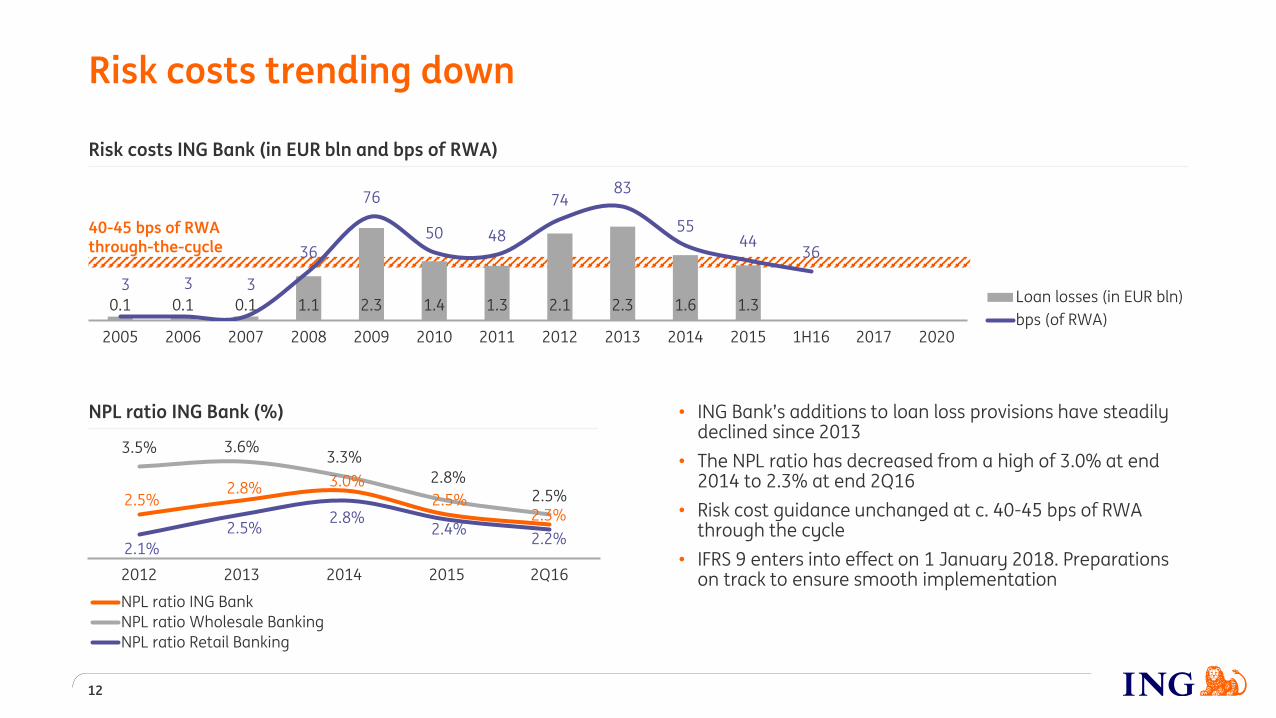
Risk costs trending down
12
0.1 0.1 0.1 1.1 2.3 1.4 1.3 2.1 2.3 1.6 1.3
3 3 3
36
76
50 48
7483
5544
36
2005 2006 2007 2008 2009 2010 2011 2012 2013 2014 2015 1H16 2017 2020
Loan losses (in EUR bln)
bps (of RWA)
2.5%2.8% 3.0%
2.5%2.3%
3.5% 3.6%3.3%
2.8%2.5%
2.1%
2.5%2.8%
2.4%2.2%
2012 2013 2014 2015 2Q16
NPL ratio ING Bank
NPL ratio Wholesale Banking
NPL ratio Retail Banking
Risk costs ING Bank (in EUR bln and bps of RWA)
NPL ratio ING Bank (%) • ING Bank’s additions to loan loss provisions have steadily declined since 2013
• The NPL ratio has decreased from a high of 3.0% at end 2014 to 2.3% at end 2Q16
• Risk cost guidance unchanged at c. 40-45 bps of RWA through the cycle
• IFRS 9 enters into effect on 1 January 2018. Preparations on track to ensure smooth implementation
40-45 bps of RWA through-the-cycle
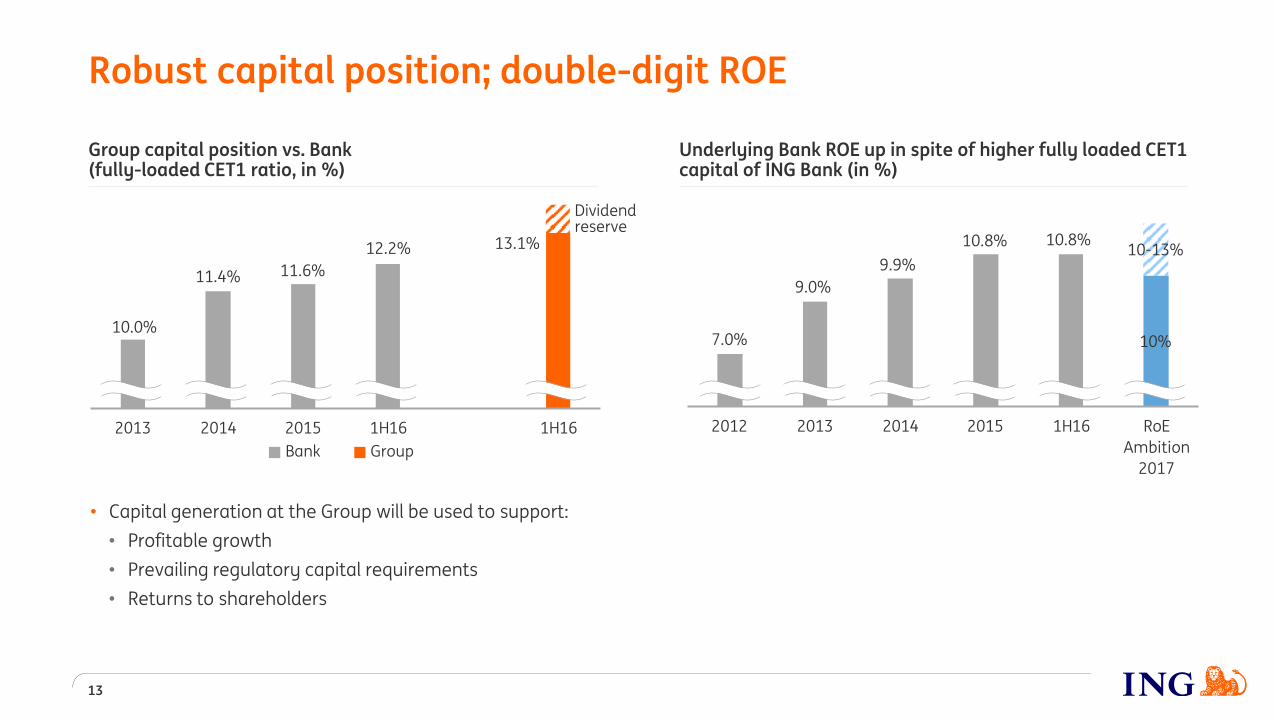
Underlying Bank ROE up in spite of higher fully loaded CET1 capital of ING Bank (in %)
Robust capital position; double-digit ROE
13
• Capital generation at the Group will be used to support:
• Profitable growth
• Prevailing regulatory capital requirements
• Returns to shareholders
7.0%
9.0%
9.9%
10.8% 10.8%
10%
10-13%
2012 2013 2014 2015 1H16 RoE
Ambition
2017
Group capital position vs. Bank (fully-loaded CET1 ratio, in %)
10.0%
11.4% 11.6%
12.2% 13.1%
2013 2014 2015 1H16 1H16
Dividend reserve
Bank Group
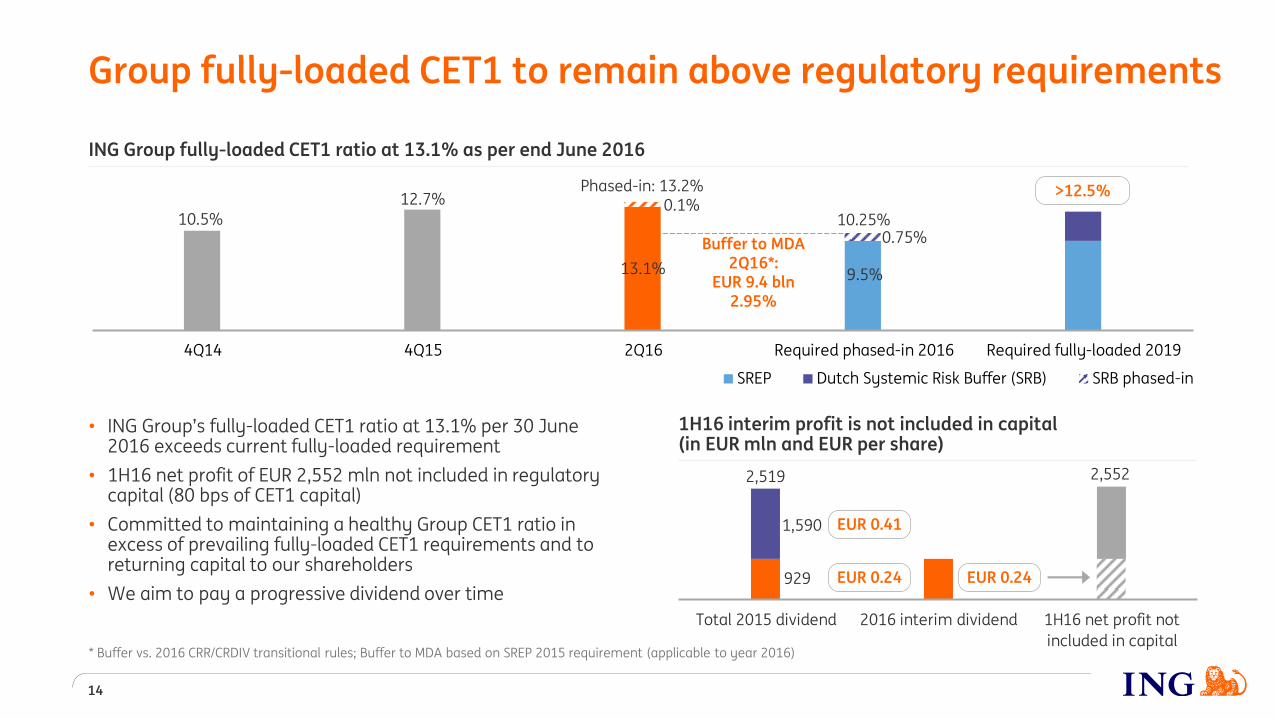
1H16 interim profit is not included in capital(in EUR mln and EUR per share)
13.1%
12.7%
10.5%
9.5%
0.1%
0.75%
4Q14 4Q15 2Q16 Required phased-in 2016 Required fully-loaded 2019
Group fully-loaded CET1 to remain above regulatory requirements
14
>12.5%
SREP Dutch Systemic Risk Buffer (SRB) SRB phased-in
929
1,590
Total 2015 dividend 2016 interim dividend 1H16 net profit not
included in capital
EUR 0.41
EUR 0.24 EUR 0.24
2,519
• ING Group’s fully-loaded CET1 ratio at 13.1% per 30 June 2016 exceeds current fully-loaded requirement
• 1H16 net profit of EUR 2,552 mln not included in regulatory capital (80 bps of CET1 capital)
• Committed to maintaining a healthy Group CET1 ratio in excess of prevailing fully-loaded CET1 requirements and to returning capital to our shareholders
• We aim to pay a progressive dividend over time
* Buffer vs. 2016 CRR/CRDIV transitional rules; Buffer to MDA based on SREP 2015 requirement (applicable to year 2016)
ING Group fully-loaded CET1 ratio at 13.1% as per end June 2016
Phased-in: 13.2%
10.25%
Buffer to MDA 2Q16*:
EUR 9.4 bln2.95%
2,552
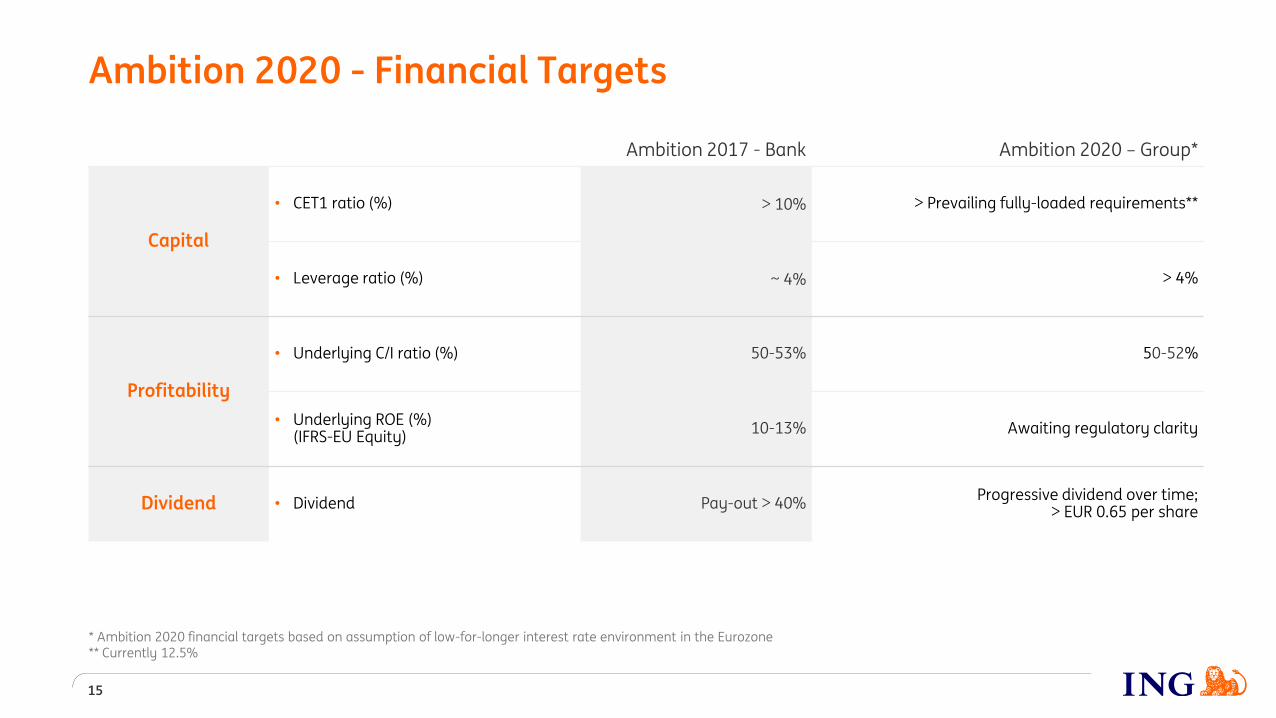
Ambition 2020 - Financial Targets
15
Ambition 2017 - Bank Ambition 2020 – Group*
Capital
• CET1 ratio (%) > 10% > Prevailing fully-loaded requirements**
• Leverage ratio (%) ~ 4% > 4%
Profitability
• Underlying C/I ratio (%) 50-53% 50-52%
• Underlying ROE (%)(IFRS-EU Equity)
10-13% Awaiting regulatory clarity
Dividend • Dividend Pay-out > 40%Progressive dividend over time;
> EUR 0.65 per share
* Ambition 2020 financial targets based on assumption of low-for-longer interest rate environment in the Eurozone** Currently 12.5%
Appendix
16
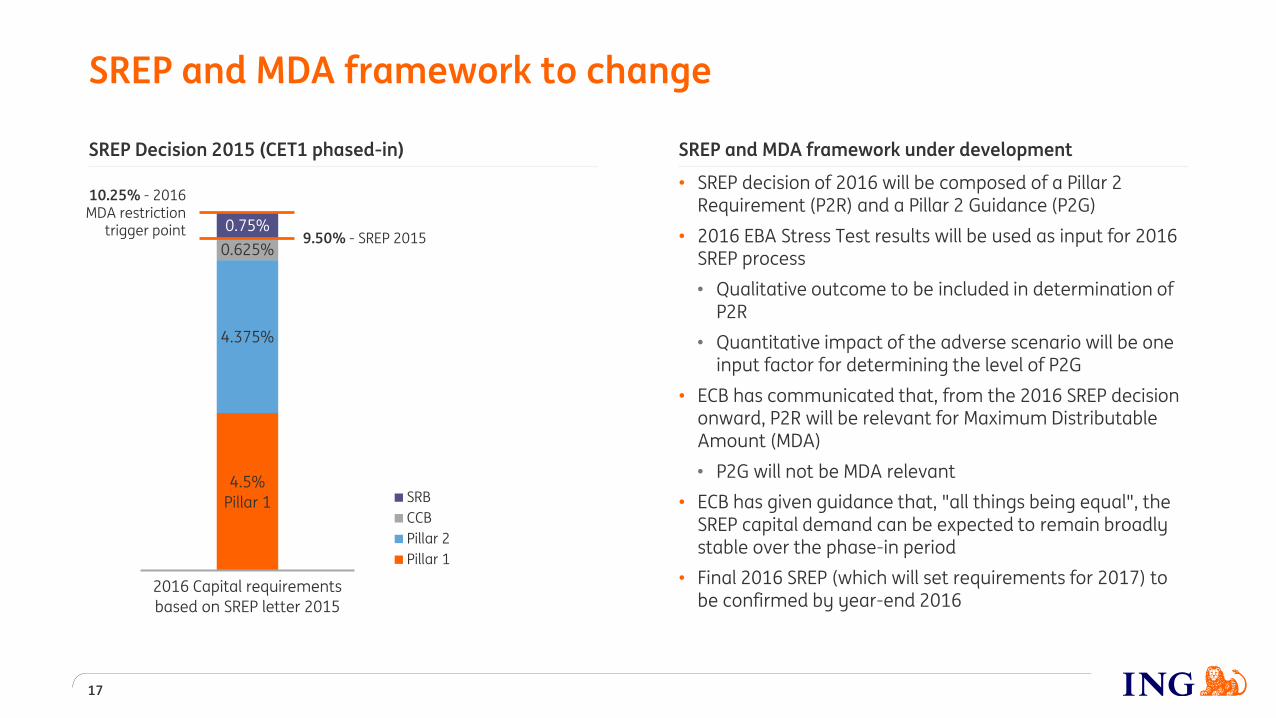
4.5%
Pillar 1
4.375%
0.625%
0.75%
2016 Capital requirements
based on SREP letter 2015
SRB
CCB
Pillar 2
Pillar 1
SREP and MDA framework to change
17
10.25% - 2016 MDA restriction
trigger point9.50% - SREP 2015
SREP and MDA framework under development
• SREP decision of 2016 will be composed of a Pillar 2 Requirement (P2R) and a Pillar 2 Guidance (P2G)
• 2016 EBA Stress Test results will be used as input for 2016 SREP process
• Qualitative outcome to be included in determination of P2R
• Quantitative impact of the adverse scenario will be one input factor for determining the level of P2G
• ECB has communicated that, from the 2016 SREP decision onward, P2R will be relevant for Maximum Distributable Amount (MDA)
• P2G will not be MDA relevant
• ECB has given guidance that, "all things being equal", the SREP capital demand can be expected to remain broadly stable over the phase-in period
• Final 2016 SREP (which will set requirements for 2017) to be confirmed by year-end 2016
SREP Decision 2015 (CET1 phased-in)
ING Group 2Q16Assumed requirements
Flexibility to comply with expected TLAC and MREL requirements
18
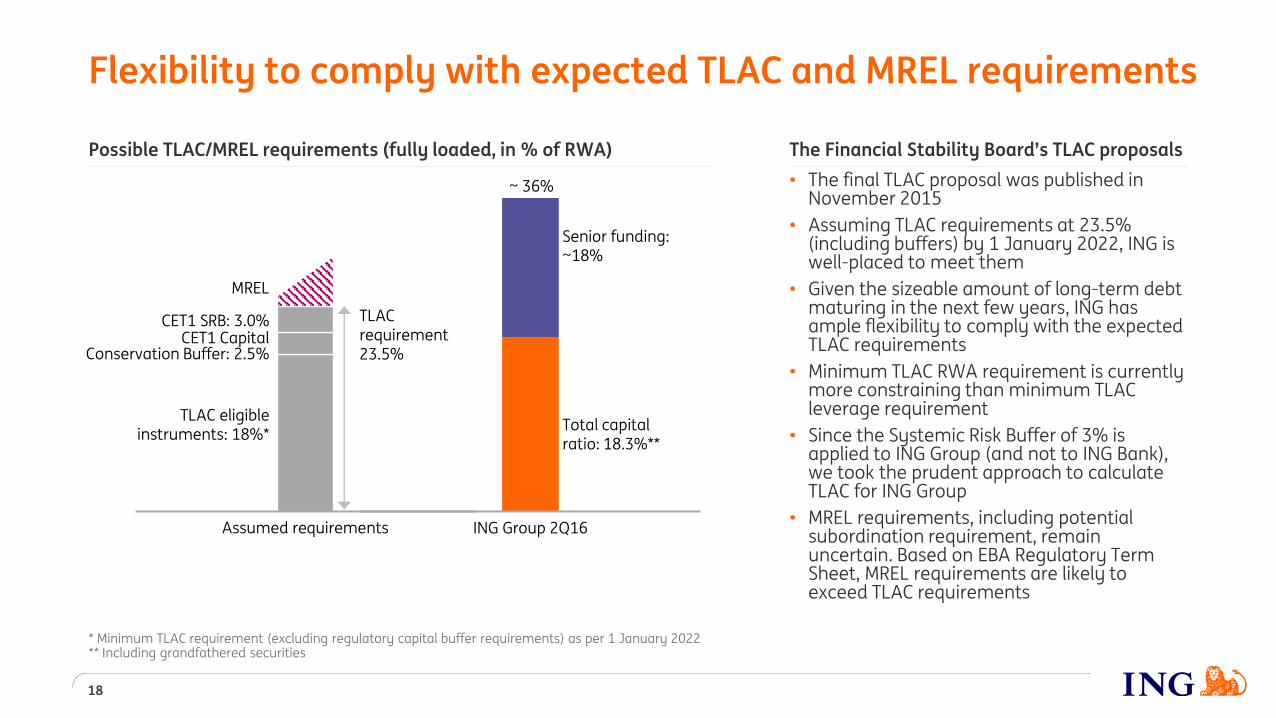
CET1 Capital Conservation Buffer: 2.5%
TLAC eligibleinstruments: 18%*
TLAC requirement23.5%
The Financial Stability Board’s TLAC proposals
• The final TLAC proposal was published in November 2015
• Assuming TLAC requirements at 23.5% (including buffers) by 1 January 2022, ING is well-placed to meet them
• Given the sizeable amount of long-term debt maturing in the next few years, ING has ample flexibility to comply with the expected TLAC requirements
• Minimum TLAC RWA requirement is currently more constraining than minimum TLAC leverage requirement
• Since the Systemic Risk Buffer of 3% is applied to ING Group (and not to ING Bank), we took the prudent approach to calculate TLAC for ING Group
• MREL requirements, including potential subordination requirement, remain uncertain. Based on EBA Regulatory Term Sheet, MREL requirements are likely to exceed TLAC requirements
* Minimum TLAC requirement (excluding regulatory capital buffer requirements) as per 1 January 2022** Including grandfathered securities
Senior funding: ~18%
Total capital ratio: 18.3%**
~ 36%
MREL
CET1 SRB: 3.0%
Possible TLAC/MREL requirements (fully loaded, in % of RWA)
Important legal information
19
ING Group’s annual accounts are prepared in accordance with International Financial Reporting Standards as adopted by the European Union (‘IFRS-EU’). In preparing the financial information in this document, except as described otherwise, the same accounting principles are applied as in the 2015 ING Group consolidated annual accounts. All figures in this document are unaudited. Small differences are possible in the tables due to rounding.
Certain of the statements contained herein are not historical facts, including, without limitation, certain statements made of future expectations and other forward-looking statements that are based on management’s current views and assumptions and involve known and unknown risks and uncertainties that could cause actual results, performance or events to differ materially from thoseexpressed or implied in such statements. Actual results, performance or events may differ materially from those in such statements due to, without limitation: (1) changes in general economic conditions, in particular economic conditions in ING’s core markets, (2) changes in performance of financial markets, including developing markets, (3) consequences of a potential (partial) break-up of the euro, (4) potential consequences of European Union countries leaving the European Union, (5) changes in the availability of, andcosts associated with, sources of liquidity such as interbank funding, as well as conditions in the credit markets generally, including changes in borrower and counterparty creditworthiness, (6) changes affecting interest rate levels, (7) changes affecting currency exchange rates, (8) changes in investor and customer behaviour, (9) changes in general competitive factors, (10) changes in lawsand regulations, (11) changes in the policies of governments and/or regulatory authorities, (12) conclusions with regard to purchase accounting assumptions and methodologies, (13) changes in ownership that could affect the future availability to us of net operating loss, net capital and built-in loss carry forwards, (14) changes in credit ratings, (15) ING’s ability to achieve projected operational synergies and (16) the other risks and uncertainties detailed in the most recent annual report of ING Groep N.V. (including the Risk Factors contained therein) and ING’s more recent disclosures, including press releases, which are available on www.ING.com. Any forward-looking statements made by or on behalf of ING speak only as of the date they are made, and, ING assumes no obligation to publicly update or revise any forward-looking statements, whether as a result of new information or forany other reason.
This document does not constitute an offer to sell, or a solicitation of an offer to purchase, any securities in the United States or any other jurisdiction.
www.ing.com