deliverable d3.3 report on final report on system architecture
DESCRIPTION
This deliverable concludes the work on architectural concepts as a central task of the work package WP3 of the SmartenIT project and presents the final architecture design.TRANSCRIPT
Version 1.0 Page 1 of 43 © Copyright 2014, the Members of the SmartenIT Consortium
Socially-aware Management of New Overlay Application Traffic with
Energy Efficiency in the Internet
European Seventh Framework Project FP7-2012-ICT- 317846-STREP
Deliverable D3.3
Final Report on System Architecture
The SmartenIT Consortium
Universität Zürich, UZH, Switzerland
Athens University of Economics and Business - Research Center, AUEB, Greece
Julius-Maximilians Universität Würzburg, UniWue, Germany
Technische Universität Darmstadt, TUD, Germany
Akademia Gorniczo-Hutnicza im. Stanislawa Staszica w Krakowie, AGH, Poland
Intracom SA Telecom Solutions, ICOM, Greece
Alcatel Lucent Bell Labs, ALBLF, France
Instytut Chemii Bioorganicznej PAN, PSNC, Poland
Interoute S.P.A, IRT, Italy
Telekom Deutschland GmbH, TDG, Germany
© Copyright 2014, the Members of the SmartenIT Consortium For more information on this document or the SmartenIT project, please contact:
Prof. Dr. Burkhard Stiller
Universität Zürich, CSG@IFI
Binzmühlestrasse 14
CH—8050 Zürich
Switzerland
Phone: +41 44 635 4331
Fax: +41 44 635 6809
E-mail: [email protected]
D3.3 – Final Architecture Seventh Framework STREP No. 317846
Public
Page 2 of 43 Version 1.0 © Copyright 2014, the Members of the SmartenIT Consortium
Document Control
Title: Final Report on System Architecture
Type: Public
Editor: Gerhard Hasslinger
E-mail: [email protected]
Authors: Matteo Biancani, Thomas Bocek, Daniel Dönni, Zbigniew Dulinski, Jakub
Gutkowski, Gerhard Hasslinger, David Hausheer, Fabian Kaup, Roman Lapacz,
Andri Lareida, Lukasz Lopatowski, Guilherme Sperb Machado, Antonis Makris,
George Petropoulos, Patrick Poullie, Alessandro Predieri, Sabine Randriamasy,
Julius Rückert, Grzegorz Rzym, Sergios Soursos, Rafal Stankiewicz, Krzysztof
Wajda, Matthias Wichtlhuber, Piotr Wydrych
Doc ID: D3.3
Amendment History
Version Date Editor Description/Comments
V0.01 July 4, 2013 Gerhard Haßlinger First version with initial structure
V0.1 Dec. 20, 2013 Input from several partners Major updates of the architecture;
new section on interfaces
V0.2 Sept. 8, 2014 David Hausheer Update architecture based on Varhati general meeting discussions
V0.3-V0.7 Sept.- Oct., 2014 Input from several partners Updates of the architecture, interfaces and deployment diagrams
(ICOM, TUD),
Subsections on new components, interfaces and services
(AGH, ALBLF),
Main input to new Section on mechanisms mapping
(UZH, AGH, ALBLF,TUD)
V0.8-V1.0 Oct.20-30, 2014 Input from several partners Final consolidation after review phase
Legal Notices
The information in this document is subject to change without notice.
The Members of the SmartenIT Consortium make no warranty of any kind with regard to this document,
including, but not limited to, the implied warranties of merchantability and fitness for a particular purpose.
The Members of the SmatenIT Consortium shall not be held liable for errors contained herein or direct,
indirect, special, incidental or consequential damages in connection with the furnishing, performance, or use
of this material.
Version 1.0 Page 3 of 43 © Copyright 2014, the Members of the SmartenIT Consortium
Table of Contents
1 Executive Summary 5
2 Introduction 6 2.1 Purpose of the Document D3.3 6 2.2 Document Outline 6
3 SmartenIT Architecture 7 3.1 Terminology 8 3.2 Components 8 3.3 Entities 10
3.3.1 Network and End User Entities 10 3.3.2 Data Centers and uNaDas 11 3.3.3 The SmartenIT Box (S-Box) 12
4 Interfaces 14 4.1 Energy Analyzer – Energy Monitor (ene1) 14 4.2 Network Analyzer – Topology Proximity Monitor (top1,2) 15 4.3 QoS/QoE Analyzer – QoS Monitor (qos1) 18 4.4 QoS/QoE Analyzer – QoE Monitor (qoe1) 19 4.5 Social Analyzer – Social Monitor (soc1,2,3) 20 4.6 Economics Analyzer – Billing/Accounting (eco1) 21 4.7 Overlay Manager – DC – S-Box (ove1) 23 4.8 Inter S-Box Communication Service (iscs1) 24 4.9 SDN Controller – Switching-/Forwarding Component (ntm2) 24 4.10 Traffic Manager Interfaces (ntm1) 25
5 Deployment of Mechanisms on the Architecture 26 5.1 Dynamic Traffic Management (DTM) 27
5.1.1 SmartenIT components involved in DTM 27 5.1.2 Deployment Scenario 28
5.2 RB-HORST (RBH) 29 5.2.1 SmartenIT components involved in RBH 29 5.2.2 Deployment Scenario 29
5.3 RBH++ 31 5.4 Integration of MUCAPS 32
5.4.1 The MUCAPS added value to application traffic management and SmartenIT 32 5.4.2 Integration with the SmartenIT architecture 32 . 33 5.4.3 Required SmartenIT components and entities 33 5.4.4 Embedding MUCAPS on the SmartenIT architecture 34
5.5 MRA Mechanism 36 5.5.1 Components Involvement 36 5.5.2 Deployment Scenario 37
6 Summary and Conclusions 38
7 Smart Objectives Addressed 39
8 References 41
9 Abbreviations 42
10 Acknowledgements 43
D3.3 – Final Architecture Seventh Framework STREP No. 317846
Public
Page 4 of 43 Version 1.0 © Copyright 2014, the Members of the SmartenIT Consortium
(This page is left blank intentionally.)
Version 1.0 Page 5 of 43 © Copyright 2014, the Members of the SmartenIT Consortium
1 Executive Summary
This deliverable concludes the work on architectural concepts as a central task of the work
package WP3 of the SmartenIT project and presents the final architecture design. It is based
on a continued development beyond the initial architecture approach documented in
Deliverable D3.1 [2] by including experience from the specification and deployment of
mechanisms from work package WP2. The provided representation of the final architecture
is fairly independent of employed network and server technologies below and
mechanisms to be applied on top of it,
serves as a main reference framework for the implementation, evaluation and validation
of mechanisms,
and provides inter-domain interfaces and communication services to exchange
information with control units of external overlays and servers.
In particular, the main results of this deliverable include:
The concise representation of the overall structure, definition of components and main
entities composed of basic components (Section 3). The set of SmartenIT entities
includes the network entity, end system entity, entities for cloud based data centers and
user controlled nano data centers as well as the SmartenIT box (S-Box) for control of a
domain. The entities are represented with a full set of components to support all
requirements of considered mechanisms, but can be reduced in the deployment of a
mechanism to a limited set of necessary components.
The specification of interfaces between the components (Section 4). Interfaces are
relevant between analysis and monitoring components, where the latter may be part of
other SmartenIT entities or they may be accessible through external interfaces. In this
way, the SmartenIT analyzer components are provided with required input regarding
traffic, topology, QoS/QoE and energy status as well as social monitor data.
The mapping and embedding of selected mechanism onto the system architecture
(Section 5). The examples include the dynamic traffic management and RB-HORST
mechanism, which are currently developed towards implemented prototypes, and the
MUlti-Criteria Application endPoint Selection (MUCAPS) mechanism, which incorpo-
rates elements of the application layer traffic optimization (ALTO) protocol. A generic
deployment diagram is provided.
D3.3 – Final Architecture Seventh Framework STREP No. 317846
Public
Page 6 of 43 Version 1.0 © Copyright 2014, the Members of the SmartenIT Consortium
2 Introduction
The system architecture has been developed during the first two years of the SmartenIT
project in two main steps. First an initial architecture has been worked out and documented in
Delivery D3.1 [2], in order to have a preliminary model from the start of the implementation
phase for mechanisms. This first phase already included a comparison of related alternative
concepts known from other projects and from standardization bodies.
The architecture has been consolidated in a second phase together with the development of
the mechanisms in work package WP2 and their specification in Deliverables D2.2 [1] and
D2.4 [4]. Moreover, first experience from the prototyping and evaluation of mechanisms as the
main task of work package WP4 also have influenced on the final architecture specification.
The updated and complete picture of the SmartenIT architecture which is described in this
document will serve as a basic reference for the deployment of mechanisms and their
evaluation and validation during the third year of the SmartenIT project.
2.1 Purpose of the Document D3.3
The final SmartenIT architecture serves as the basis for the implementation and deployment of
mechanisms and applications. It provides a framework from the definition of required
components and the specification of their internal interfaces to the boundary to external
components. The architecture finally is deployed on networking, server and end system
devices but the description is done on an abstraction layer independent of the technology in
use and the mechanisms being established on top.
2.2 Document Outline
The main part of this document is subdivided into three Sections.
Section 3 starts with a component diagram giving an overview of the architecture concept. All
involved components are briefly described. Then a set of entities is introduced as the main
building blocks of the architecture, each of which is composed of basic components.
Section 4 describes the interfaces between the components, starting from an overview
diagram. Interfaces are specified between internal components as well as external interfaces
between control entities in different domains.
In Section 5 the architecture is considered from the perspective of mechanism deployment.
The embedding of a set of mechanisms on the architecture is described as a validation that
the architecture approach is suitable for their requirements and the mapping of the specific
functions of each mechanism is shown.
Version 1.0 Page 7 of 43 © Copyright 2014, the Members of the SmartenIT Consortium
3 SmartenIT Architecture
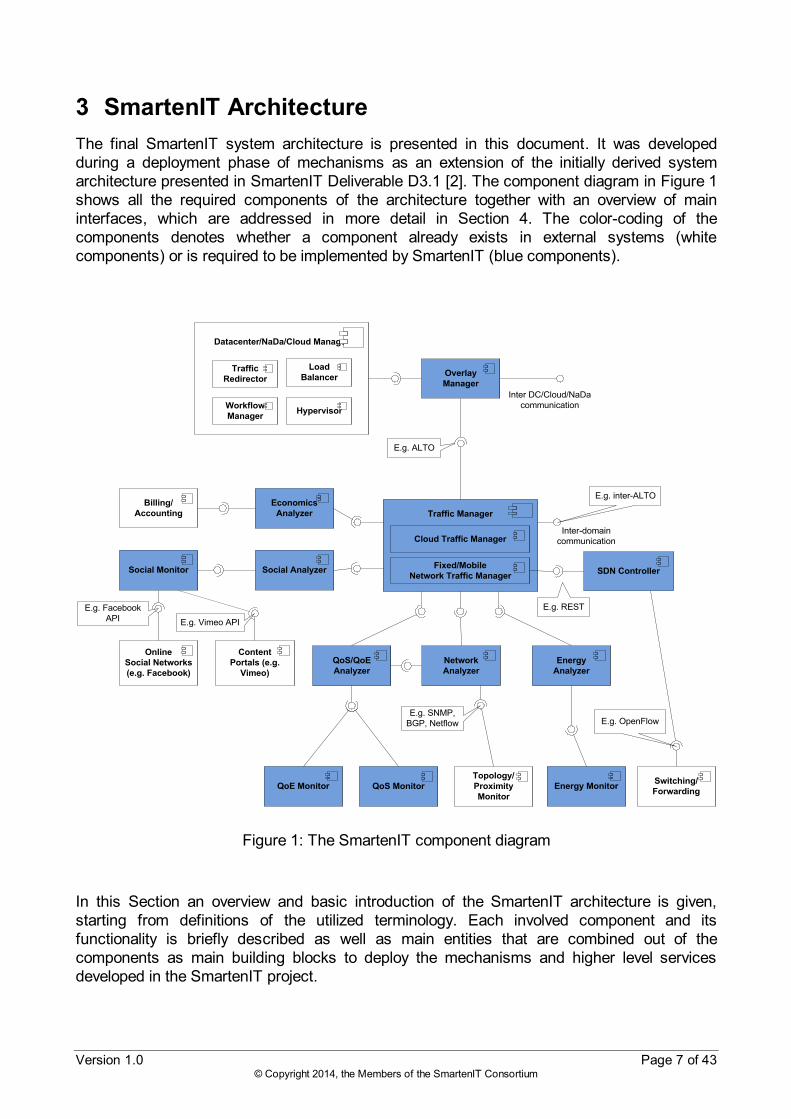
The final SmartenIT system architecture is presented in this document. It was developed
during a deployment phase of mechanisms as an extension of the initially derived system
architecture presented in SmartenIT Deliverable D3.1 [2]. The component diagram in Figure 1
shows all the required components of the architecture together with an overview of main
interfaces, which are addressed in more detail in Section 4. The color-coding of the
components denotes whether a component already exists in external systems (white
components) or is required to be implemented by SmartenIT (blue components).
E.g. ALTO
E.g. inter-ALTO
E.g. OpenFlowE.g. SNMP,
BGP, Netflow
Inter DC/Cloud/NaDa
communication
Datacenter/NaDa/Cloud Manager
Workflow
Manager
Load
BalancerTraffic
Redirector
Hypervisor
Overlay
Manager
Social Analyzer
Economics
Analyzer
QoS/QoE
Analyzer
Energy
Analyzer
Network
Analyzer
Traffic Manager
Cloud Traffic Manager
Fixed/Mobile
Network Traffic Manager
Inter-domain
communication
QoE Monitor QoS MonitorSwitching/
ForwardingEnergy Monitor
Topology/
Proximity
Monitor
Social Monitor
Billing/
Accounting
Online
Social Networks
(e.g. Facebook)
SDN Controller
E.g. Facebook
API
Content
Portals (e.g.
Vimeo)
E.g. REST
E.g. Vimeo API
Figure 1: The SmartenIT component diagram
In this Section an overview and basic introduction of the SmartenIT architecture is given,
starting from definitions of the utilized terminology. Each involved component and its
functionality is briefly described as well as main entities that are combined out of the
components as main building blocks to deploy the mechanisms and higher level services
developed in the SmartenIT project.
D3.3 – Final Architecture Seventh Framework STREP No. 317846
Public
Page 8 of 43 Version 1.0 © Copyright 2014, the Members of the SmartenIT Consortium
3.1 Terminology
Component A software module that performs a specific functionality. It can be further
divided into sub-components.
Entity A collection of components that, when grouped together, perform a complex
task. The grouping of components is logical, not physical.
Device The hardware on which an entity resides. A single device can host more than
one entity. Also, an entity can be deployed in more than one devices, but still
acting as a single entity in distributed deployment.
3.2 Components
The Data Center/NaDa/Cloud Manager is an abstraction of the functionalities provided by a
Data Center (DC) or a Cloud or a Nano Data Center (NaDa). It may include among others the
hypervisor engine, load balancing and traffic redirection mechanisms as well as a workflow
manager to orchestrate the use of cloud resources.
The Overlay Manager (OM) allows the formation of overlays between remote (Nano-)Data
Centers or even small Clouds. It resides at each peer and is responsible for the
communication between peers to advertise offered resources, ask for resources, etc. through
the interface provided, see “inter-DC/Cloud/NaDa communication” interface in Figure 1. A
peer can be represented by a DC or a uNaDa in an overlay of DCs, uNaDas or even Clouds.
The Billing/Accounting component refers to the system of a provider, e.g., Data
Center/Cloud operator or ISP that keeps records of the transactions of its customers so as to
charge them for the used services. SmartenIT mainly interacts with such systems through its
EcA component.
The Economics Analyzer (EcA) interacts with the Billing/Accounting System, in order to
attain certain economic parameters that will be considered during the decision-taking process.
Additionally, EcA also takes economic-related decisions without interacting with Billing/
Accounting.
The Social Monitor (SM) gathers information about the social interactions of groups of
users. It can be provided by the application provider itself (through the appropriate APIs), by a
uNaDa or it can be implemented as an add-on on a user device. Hence, though it is colored
with blue, there might be cases that existing solutions are used. The Social Monitor has an
interface to Online Social Networks (OSNs). For example, this can be the Facebook API in
case of Facebook.
The Social Analyzer (SA) will analyze social information from OSNs that might be useful in
predicting the traffic or the impact of traffic management policies.
The QoE Monitor (QoEM) gathers information about the perceived quality of experience by
the end user.
The QoS Monitor (QoSM) gathers information about the quality of the data transmission (i.e.,
throughput, packets dropped, delay, jitter, etc.) at network and/or end user entities.
Version 1.0 Page 9 of 43 © Copyright 2014, the Members of the SmartenIT Consortium
The QoS/QoE Analyzer (QA) offers an interface to collect QoE-based measurements from
end users and QoS metrics from network entities, and then process them so as to enhance
the decision-taking process with QoS/QoE optimization goals. To further enhance this, an
interface with Network Analyzer is foreseen (see below).
The Topology/Proximity Monitor (TPM) provides information about the distance of a
network entity from a destination, e.g., hop count from BGP. Depending on the context, it may
also gather information about location (from GPS-enabled devices) or estimated location (from
mobile network entities, signal strength, etc).
The Network Analyzer (NA) primarily collects network-related information from network
entities along the content/service delivery path. It may also collect such information from end
user devices. Some of this information is also provided to the QoS/QoE Analyzer.
The Energy Monitor (EM) gathers information about the energy consumption of an end user
device, a network entity or even a DC/NaDa/Cloud.
The Energy Analyzer (EA) offers an interface for devices to provide information about their
energy status so as to be able to consider energy efficiency in the decisions taken.
The Switching/Forwarding (SF) component resides at the network level (i.e., at a network
entity) and receives instructions from the Traffic Manager, see below. These instructions refer,
for example, to the configuration of paths for content delivery across the core network, or to the
switching to a different mobile cell (hand-over). For example, DA and BG routers can be an
instantiation of the switching/forwarding element.
A Software-defined Networking (SDN) Controller (SDNC) is used for the communication
between the Fixed/Mobile Network Traffic Manager and the Switching/Forwarding elements.
More specifically, the SDN Controller uses the OpenFlow protocol to communicate with the
switches, e.g., to send or modify rules or getting notified about the network state.
Finally, the Traffic Manager (TM) encompasses all the decision-taking functionality. Hence,
the Traffic Manager is the umbrella component for the Cloud Traffic Manager and the
Fixed/Mobile Network Traffic Manager components.
The Cloud Traffic Manager (CTM) makes high-level decisions, such as, for example, the
caching of specific content to specific places, the redirection of a user request to another
(Nano-)Data Center, etc. Those decisions are communicated to the Overlay Manager that in
turn informs the affected peers.
The Fixed/Mobile Network Traffic Manager (NTM)more low-level decisions, like what QoS
class should be assigned to a specific flow, which MPLS tags to be used, etc. In other words,
it takes those decisions that should be materialized by the Switching/Forwarding component.
The Network Traffic Manager also includes the functionality to control connection scheduling
and interface selection on the mobile handset. These decisions include information from the
QoE, Topology/Proximity, and Energy Monitor to control the Switching/Forwarding component
on the mobile device.
Finally, note that in Figure 1 only the core components are displayed. Moreover, there are
some supporting components like the Database (DB) and the User Interface (UI) that are not
depicted in Figure 1. However, depending on the deployment, these components will be
introduced and appear in the following section wherever needed.
D3.3 – Final Architecture Seventh Framework STREP No. 317846
Public
Page 10 of 43 Version 1.0 © Copyright 2014, the Members of the SmartenIT Consortium
3.3 Entities
In the previous section, it was made obvious that specific functionality (i.e., components) can
be present at different layers, i.e., the application layer, the (Nano-)Data Center/Cloud layer
and the network layer. In this section, components are grouped in the same layer to build an
entity. For clarity reasons we omit the related interfaces, since they are the same as before.
3.3.1 Network and End User Entities
Network Entity
Energy Monitor QoS Monitor
Topology/
Proximity
Monitor
Switching/
Forwarding
End User Entity
QoE Monitor
Topology/
Proximity
Monitor
Switching/
Forwarding
DB UIALTO
Energy Monitor
Social Monitor
QoS Monitor
Mobile Traffic
Manager
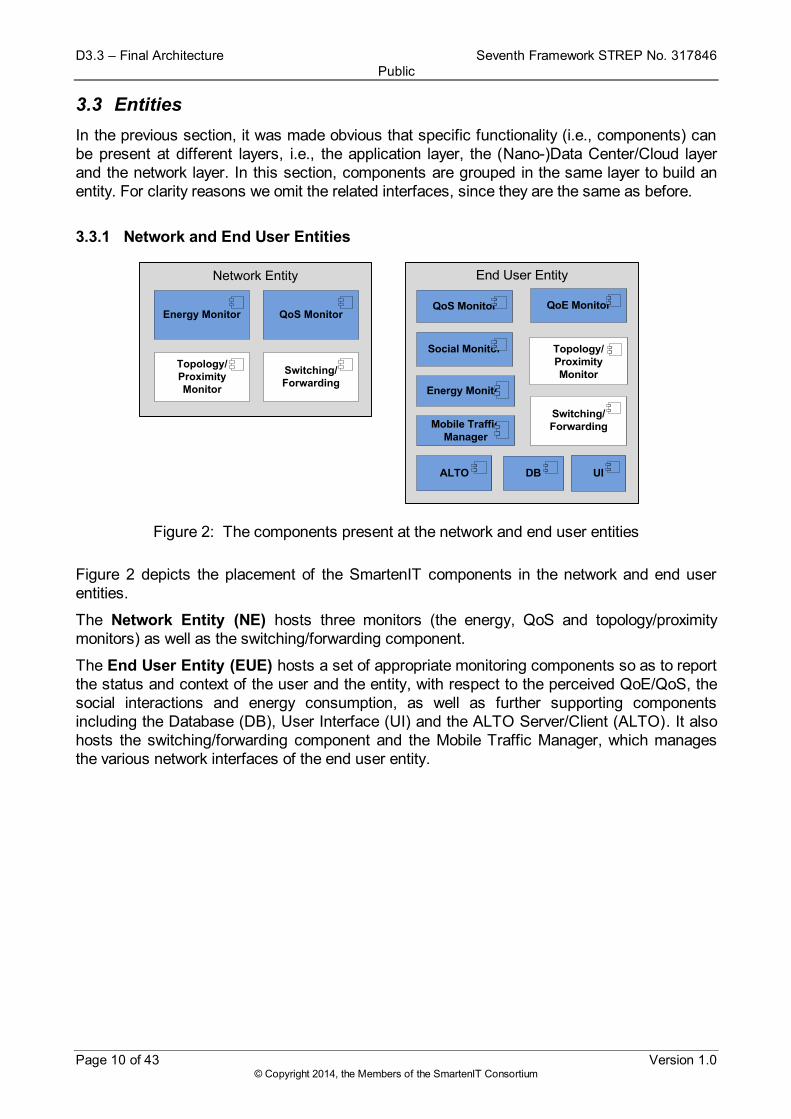
Figure 2: The components present at the network and end user entities
Figure 2 depicts the placement of the SmartenIT components in the network and end user
entities.
The Network Entity (NE) hosts three monitors (the energy, QoS and topology/proximity
monitors) as well as the switching/forwarding component.
The End User Entity (EUE) hosts a set of appropriate monitoring components so as to report
the status and context of the user and the entity, with respect to the perceived QoE/QoS, the
social interactions and energy consumption, as well as further supporting components
including the Database (DB), User Interface (UI) and the ALTO Server/Client (ALTO). It also
hosts the switching/forwarding component and the Mobile Traffic Manager, which manages
the various network interfaces of the end user entity.
Version 1.0 Page 11 of 43 © Copyright 2014, the Members of the SmartenIT Consortium
3.3.2 Data Centers and uNaDas
Datacenter
Overlay
Manager
Datacenter Manager
Workflow
Manager
Load
Balancer
Traffic
Redirector
Hypervisor
Energy
Monitor
ALTO
uNaDa
Overlay Manager
Energy Monitor EnergyAnalyzer
QoS/QoE Analyzer
Social Analyzer
Cloud Traffic Manager
Topology/Proximity Monitor
DBUI ALTO
Social Monitor
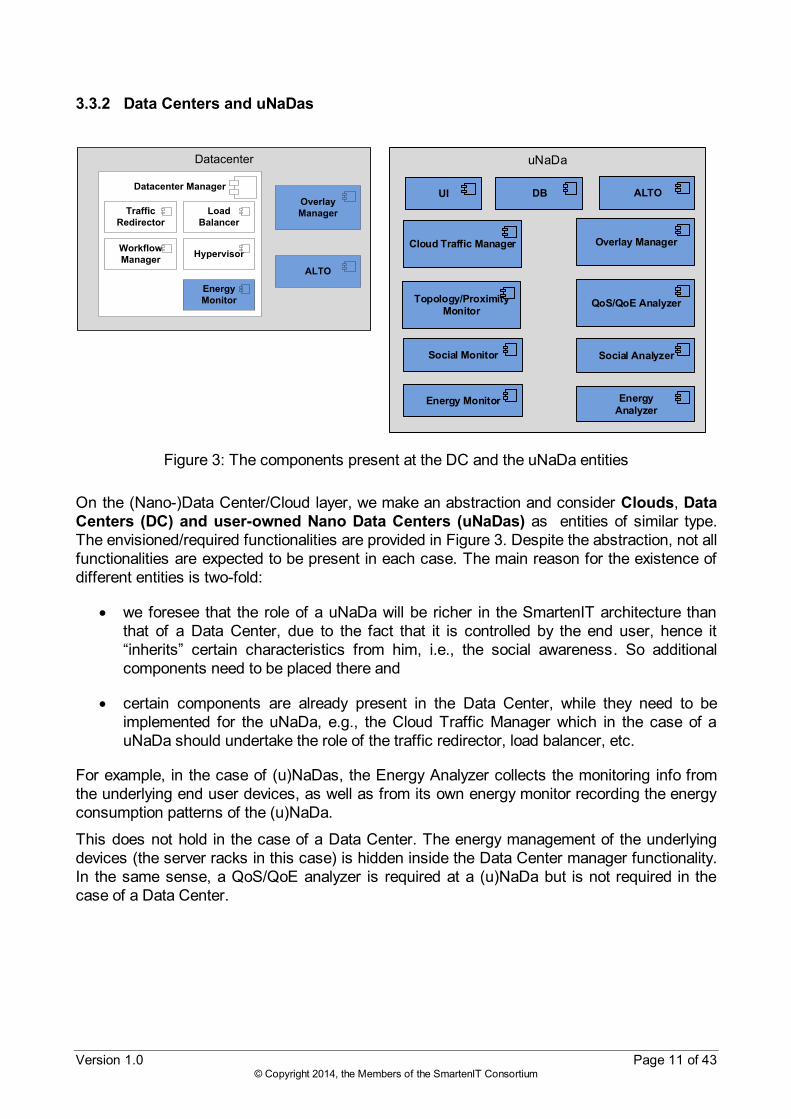
Figure 3: The components present at the DC and the uNaDa entities
On the (Nano-)Data Center/Cloud layer, we make an abstraction and consider Clouds, Data
Centers (DC) and user-owned Nano Data Centers (uNaDas) as entities of similar type.
The envisioned/required functionalities are provided in Figure 3. Despite the abstraction, not all
functionalities are expected to be present in each case. The main reason for the existence of
different entities is two-fold:
we foresee that the role of a uNaDa will be richer in the SmartenIT architecture than
that of a Data Center, due to the fact that it is controlled by the end user, hence it
“inherits” certain characteristics from him, i.e., the social awareness. So additional
components need to be placed there and
certain components are already present in the Data Center, while they need to be
implemented for the uNaDa, e.g., the Cloud Traffic Manager which in the case of a
uNaDa should undertake the role of the traffic redirector, load balancer, etc.
For example, in the case of (u)NaDas, the Energy Analyzer collects the monitoring info from
the underlying end user devices, as well as from its own energy monitor recording the energy
consumption patterns of the (u)NaDa.
This does not hold in the case of a Data Center. The energy management of the underlying
devices (the server racks in this case) is hidden inside the Data Center manager functionality.
In the same sense, a QoS/QoE analyzer is required at a (u)NaDa but is not required in the
case of a Data Center.
D3.3 – Final Architecture Seventh Framework STREP No. 317846
Public
Page 12 of 43 Version 1.0 © Copyright 2014, the Members of the SmartenIT Consortium
3.3.3 The SmartenIT Box (S-Box)
The functionality to be present in a Data Center is related to the existence of an S-Box in the
cloud or ISP premises As mentioned, this entity takes decisions on a high-level on which
content to cache, where to redirect users, etc. Additional functionality of the S-Box includes
low-lever decisions, such as the management of network traffic, the configuration of network
entities, etc. Hence, the S-Box operates at two levels, as it is explained later in this subsection.
S-Box
Social Analyzer
Economics
Analyzer
QoS/QoE
Analyzer
Energy
Analyzer
Network
Analyzer
Traffic Manager
Cloud Traffic
Manager
Fixed/Mobile
Network Traffic Manager
Inter-SBox
Communication Service
DB UI
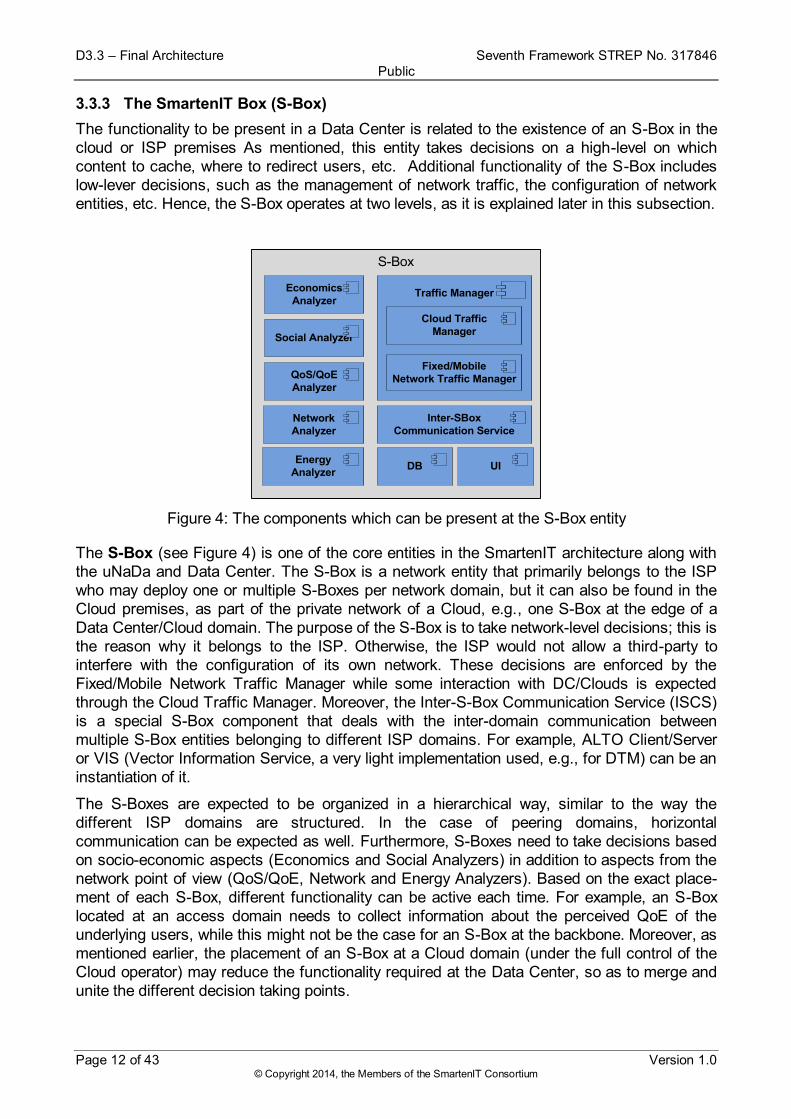
Figure 4: The components which can be present at the S-Box entity
The S-Box (see Figure 4) is one of the core entities in the SmartenIT architecture along with
the uNaDa and Data Center. The S-Box is a network entity that primarily belongs to the ISP
who may deploy one or multiple S-Boxes per network domain, but it can also be found in the
Cloud premises, as part of the private network of a Cloud, e.g., one S-Box at the edge of a
Data Center/Cloud domain. The purpose of the S-Box is to take network-level decisions; this is
the reason why it belongs to the ISP. Otherwise, the ISP would not allow a third-party to
interfere with the configuration of its own network. These decisions are enforced by the
Fixed/Mobile Network Traffic Manager while some interaction with DC/Clouds is expected
through the Cloud Traffic Manager. Moreover, the Inter-S-Box Communication Service (ISCS)
is a special S-Box component that deals with the inter-domain communication between
multiple S-Box entities belonging to different ISP domains. For example, ALTO Client/Server
or VIS (Vector Information Service, a very light implementation used, e.g., for DTM) can be an
instantiation of it.
The S-Boxes are expected to be organized in a hierarchical way, similar to the way the
different ISP domains are structured. In the case of peering domains, horizontal
communication can be expected as well. Furthermore, S-Boxes need to take decisions based
on socio-economic aspects (Economics and Social Analyzers) in addition to aspects from the
network point of view (QoS/QoE, Network and Energy Analyzers). Based on the exact place-
ment of each S-Box, different functionality can be active each time. For example, an S-Box
located at an access domain needs to collect information about the perceived QoE of the
underlying users, while this might not be the case for an S-Box at the backbone. Moreover, as
mentioned earlier, the placement of an S-Box at a Cloud domain (under the full control of the
Cloud operator) may reduce the functionality required at the Data Center, so as to merge and
unite the different decision taking points.
Version 1.0 Page 13 of 43 © Copyright 2014, the Members of the SmartenIT Consortium
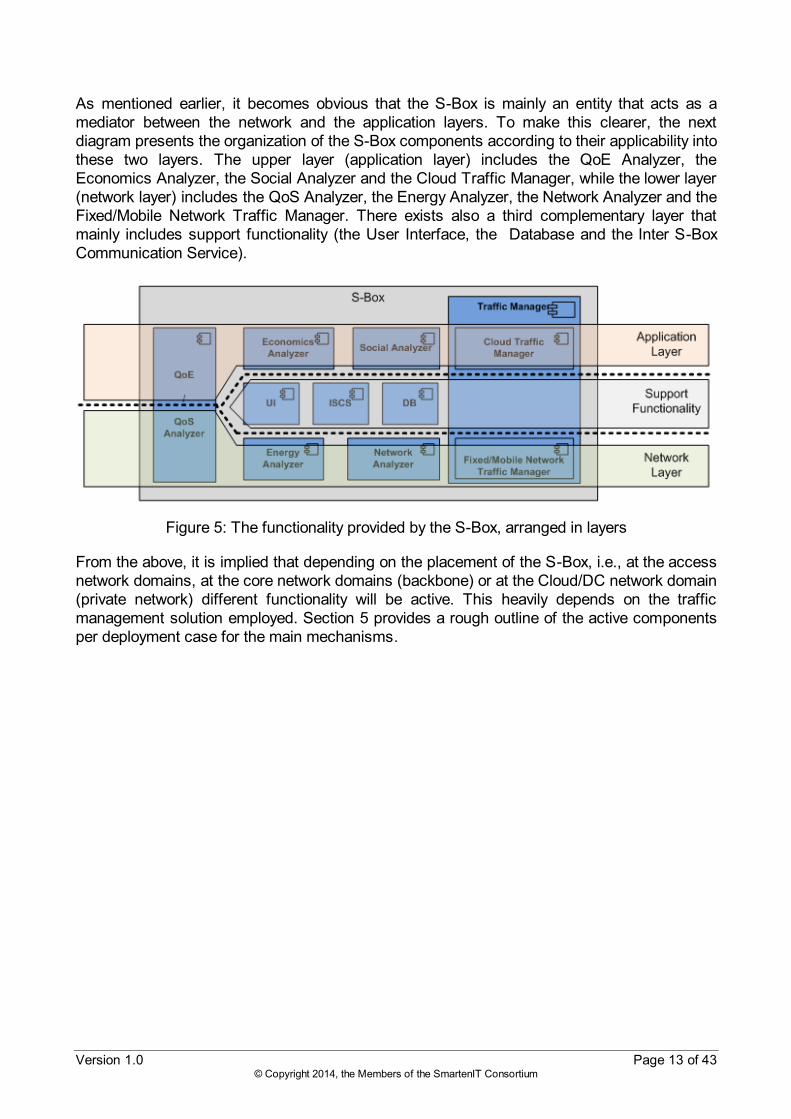
As mentioned earlier, it becomes obvious that the S-Box is mainly an entity that acts as a
mediator between the network and the application layers. To make this clearer, the next
diagram presents the organization of the S-Box components according to their applicability into
these two layers. The upper layer (application layer) includes the QoE Analyzer, the
Economics Analyzer, the Social Analyzer and the Cloud Traffic Manager, while the lower layer
(network layer) includes the QoS Analyzer, the Energy Analyzer, the Network Analyzer and the
Fixed/Mobile Network Traffic Manager. There exists also a third complementary layer that
mainly includes support functionality (the User Interface, the Database and the Inter S-Box
Communication Service).
Figure 5: The functionality provided by the S-Box, arranged in layers
From the above, it is implied that depending on the placement of the S-Box, i.e., at the access
network domains, at the core network domains (backbone) or at the Cloud/DC network domain
(private network) different functionality will be active. This heavily depends on the traffic
management solution employed. Section 5 provides a rough outline of the active components
per deployment case for the main mechanisms.
D3.3 – Final Architecture Seventh Framework STREP No. 317846
Public
Page 14 of 43 Version 1.0 © Copyright 2014, the Members of the SmartenIT Consortium
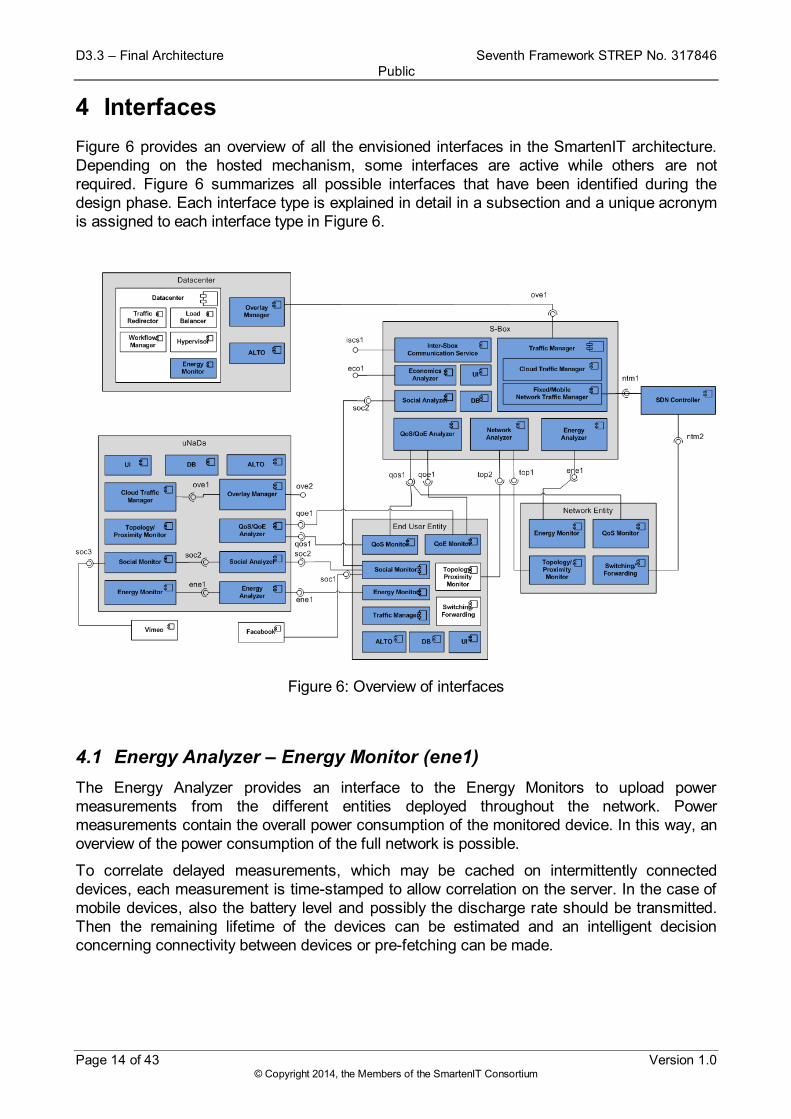
4 Interfaces
Figure 6 provides an overview of all the envisioned interfaces in the SmartenIT architecture.
Depending on the hosted mechanism, some interfaces are active while others are not
required. Figure 6 summarizes all possible interfaces that have been identified during the
design phase. Each interface type is explained in detail in a subsection and a unique acronym
is assigned to each interface type in Figure 6.
Figure 6: Overview of interfaces
4.1 Energy Analyzer – Energy Monitor (ene1)
The Energy Analyzer provides an interface to the Energy Monitors to upload power
measurements from the different entities deployed throughout the network. Power
measurements contain the overall power consumption of the monitored device. In this way, an
overview of the power consumption of the full network is possible.
To correlate delayed measurements, which may be cached on intermittently connected
devices, each measurement is time-stamped to allow correlation on the server. In the case of
mobile devices, also the battery level and possibly the discharge rate should be transmitted.
Then the remaining lifetime of the devices can be estimated and an intelligent decision
concerning connectivity between devices or pre-fetching can be made.

Version 1.0 Page 15 of 43 © Copyright 2014, the Members of the SmartenIT Consortium
The resulting power consumption message consists of:
String: deviceId
Array: measurements
o Long: timestamp
o Double: current power consumption [W]
o optional Byte: battery level [%, 0-100]
o optional Double: battery drain [%/h]
The deviceId is unique and consistent within the system, such that power measurements can
be mapped to the topology as observed by the Network Analyzer and Topology Proximity
Monitor. Connecting the power measurements to the topology allows finding the cheapest
paths through the network in terms of power consumption. Further, the different content
placement options can be evaluated by comparing a request served by the Cloud to a request
served by a uNaDa.
The power measurement interface also listens to device information messages. This allows
the Energy Analyzer to make more sophisticated decisions. Based on the device type and
model, internal power consumption models can be used to derive future states of the network
and evaluate the effect of network management decisions beforehand. If, for example,
different paths through the network are available, and the energy models of the devices on the
different paths are known, the Energy Analyzer can predict the energy consumption on each
path using the current device states, energy models, and the additionally generated network
load.
For this, additional information is transmitted to the Energy Analyzer. The device information
message consists of:
String: deviceId
String: name
String: deviceType
String: model
Bool: batteryPowered
optional Byte: batteryState (i.e., charging, discharging)
Array: interfaces
o Interface
String: ipAddress
String: macAddress
String/Enum: interfaceType (WLAN, 1 G, 100 M, ..)
Bool: active
4.2 Network Analyzer – Topology Proximity Monitor (top1,2)
The Topology/Proximity Monitor provides information about topology of a local AS and selected
information about the Internet topology. The local topology means that this information is
available only for clients operating within an AS where the S-Box is deployed. In this section
we present a vision of the Topology Proximity Monitor operation.
D3.3 – Final Architecture Seventh Framework STREP No. 317846
Public
Page 16 of 43 Version 1.0 © Copyright 2014, the Members of the SmartenIT Consortium
A few approaches has been considered in the scope of SmartenIT system. W e do not claim
that all of them are to be used in the final version of implemented system.
The Topology/Proximity Monitor operates using three instances. The central instance
(subcomponent) is a part of the Network Analyzer. The client instance works on an end user
device. The third instance is a part of software or hardware residing in the network device. The
central instance is responsible for querying network devices and gathering topology
information from them. For these purposes the instance of Topology/Proximity Monitor
deployed in a network device provides the top1 interface. This instance is a software existing
on a network device (switch or router operating system). The communication between
instances may use following protocols:
Simple Mail Transfer Protocol (SMTP),
Border Gateway Protocol (BGP),
Open Shortest Path First (OSPF),
Link Layer Discovery Protocol (LLDP)
depending on performed operations.
The central instance is also responsible for responding to client’s requests. This information is
delivered via the top2 interface provided by a central instance. A client must deploy the Topo-
logy/Proximity Monitor instance (client version) if it requires information about topology. A client
may be an end user device, a uNaDa, another S-Box or even a network device. The S-Box
must also offer an interface for communication with S-Boxes located in other ASes. Some part
of information related to the Internet topology is collected from a remote AS. This
communication will be done via the inter-ALTO protocol [7][8]. This interface will be
implemented on the S-Box level providing communication for other S-Box components. We
consider separately topology discovery functionalities related to the inter AS and intra AS
communication. The interfaces are presented in Figure 6.
We predict also another version of Proximity/Topology Monitor deployed in an end user device
or in a uNaDa. The simple query method will be used in which the simple Proximity/Topology
Monitor performs traceroute operation and stores IP addresses being on the path toward
destination IP address. Relying on this information traversed autonomous system numbers are
discovered and information is presented in form of an AS-path. Any client (end user device or
uNaDa) which wants to download some files or obtain a data stream from some location may
acquire information about the download path. This client asks a node, which is candidate for
being a source of data, to perform this traceroute operation providing an AS-path. The
candidate source sends this AS-path to the requesting client.
This method is not reliable because some nodes may not respond to the traceroute query.
Inter AS topology/proximity
The interface named top1 will be used for the inter AS topology discovery. A topology will be
provided on request for each single communication (planned or running), separately for
outbound and inbound traffic. The Topology/Proximity Monitor offers the top2 interface which
responds with information for the downstream and upstream path. The information is based on
the AS_path BGP attribute. In order to provide a downstream path, the local S-Box should
communicate with the remote S-Box in the AS where a source of data is located. Sufficient
BGP information will be sent by the remote S-Box using the inter ALTO protocol. Because
some BGP information may be considered as confidential, we predict the access limit for
Version 1.0 Page 17 of 43 © Copyright 2014, the Members of the SmartenIT Consortium
selected clients depending on an ISP’s confidentiality policy. We propose three forms of such
information delivered by the Topology/Proximity Monitor to clients:
AS_path hop number – accessible by any client,
full AS_path – accessible only by carefully selected clients,
AS number of the neighbor AS (a neighbor AS to an AS in which a client resides) and
AS_path hop number – accessible by selected clients.
The same information will be exchanged by S-Boxes via the inter ALTO protocol and next will
be passed to clients. The semantics of inter ALTO protocol is much wider and this protocol
will be used for other information delivery.
Internal AS topology/proximity
The interfaces top1 and top2 are also used for the local AS topology discovery. The topology
information will be gathered from an AS in which a client operates. The first version of the
Topology/Proximity Monitor will offer only limited functionalities. It requires usage of OSPF as
a routing protocol in an AS. It exploits information offered by the OSPF link state database. In
the next step the information from the link state database will be supplemented by information
from MIBs by SNMP. The top1 interface will deliver this information from network devices. The
S-Box will be equipped with router functionality running OSPF and forming adjacency relations
on the top1 interface. Also this interface will be used for SNMP communication between the
S-Box and network devices. The top2 interface will be used by a client for requesting topology
information from the S-Box. Some sets of information are foreseen but it is not yet decided
which will be required by chosen management mechanisms. The proposed sets of information
will offer:
Info set 1 (OSPF based information in an area where the S-Box forms an adjacency relation):
routers IDs, (ABR and ASBR identification),
link ID and cost (based on OSPF).
Info set 2 (OSPF and SNMP based information in all OSPF areas):
routers IDs, (ABR and ASBR identification),
link ID and cost (based on OSPF),
link throughput (SNMP).
SmartenIT also considers other types of information offered by the Topology/Proximity Monitor
deployed on end devices. In case of energy efficiency aspects the download time influences
energy consumption of end devices, which is especially important for mobile devices. An exact
localization of the data source (IP address and distance measured as path cost) is not a
proper parameter. A parameter should rather be used expressing propagation time. So the
RTT parameter can be used for this purposes and the Topology/Proximity Monitor (client
version) should offer this parameter. The functionality may be also integrated with the Energy
Monitor and not be a part of Topology/Proximity Monitor.
The presented information sets offered by interfaces may not be fully used. Depending on the
project progress the information sets may be extended and new interfaces can be defined. In
the present stage of the project it is not decided if the local AS topology information is
required. Perhaps only RTT will be needed.
D3.3 – Final Architecture Seventh Framework STREP No. 317846
Public
Page 18 of 43 Version 1.0 © Copyright 2014, the Members of the SmartenIT Consortium
4.3 QoS/QoE Analyzer – QoS Monitor (qos1)
The QoS/QoE Analyzer-QoS Monitor interface will allow retrieving monitoring data and instruct
the measurement tools to run monitoring actions. The information about the current and
archived status of the network is usually a crucial input to the mechanisms which optimize or
predict network traffic. The complete or as much as possible accurate and relevant set of
information how the network behaves is needed and what parameters are expected.
Since the project considers the communication that spans multiple network domains it is a
must to take into account multi-domain characteristics, e.g., distributed monitoring data
archives, different access policies, abstraction levels of topology representations shared
among domains, data aggregation to disguise raw data, etc. Nevertheless, according to the
architecture design the exchange of monitoring information between domains is done on
dedicated inter-domain interfaces. The assumption is made that the QoS/QoE Analyzer
collects data from Monitors located in its local domain only.
Following is a set of basic network metrics that can be monitored:
Throughput [Mbps],
Link utilization [%][Mbps],
Packet loss (one way / round trip) [%],
Round trip time [ms],
One way delay [ms],
Packet delay variation (jitter) [ms].
The monitoring data sent between the Monitor and Analyzer can be in a raw format as
collected from the monitoring tool or initially processed to conform to a common format. The
exchanged information may also be abstracted and/or aggregated. The latter option could be
used in the case when the ISP does not want to reveal the exact information about the
underlying resources. This could be also applied in the situation where the QoS Monitor
instance monitors resources located in remote network domains, although this is not the case
according to the assumption made.
Depending on the selected mechanisms’ requirements, the measurements may be performed
on different granularity levels, i.e., per interface, per link or per path, e.g., between domain
border routers, whereby for each level a different set of metrics may be available.
The QoS/QoE Analyzer-QoS Monitor interface is a bidirectional communication channel. The
QoS/QoE Analyzer component will be sending requests to the QoS Monitor component in
order to:
check if a network element is monitored,
ask what monitoring data (metrics) are available,
ask what formats of data are available,
ask what monitoring capabilities (tools, active measurements) are available,
fetch monitoring data,
command to run monitoring actions (active measurements).

Version 1.0 Page 19 of 43 © Copyright 2014, the Members of the SmartenIT Consortium
The QoS Monitor component will be sending responses to the QoS/QoE Analyzer component
in order to provide requested (meta-)information and monitoring data.
The communication described above is synchronous. Apart from that, the asynchronous
communication may be needed to inform that a component has some internal problems and
thus cannot receive and process correctly the subsequent messages. In such a case, the
communication may be stopped and restarted after some period of time. Another example of
asynchronous communication is the situation when the QoS/QoE Analyzer instructs the QoS
Monitor to perform regular tasks like informing whether the monitoring data of certain network
element (port or link) or needed capabilities became available. The QoS Monitor component
then repeatedly executes defined tasks and sends a message to the QoS/QoE Analyzer when
the conditions are met.
4.4 QoS/QoE Analyzer – QoE Monitor (qoe1)
The QoS/QoE Analyzer-QoE Monitor interface will allow retrieving monitoring data and instruct
the measurement tools to run monitoring actions.
The QoE Monitoring module measures different metrics during the playout of multimedia
sessions, and is able to respond to requests about these metrics. It can also start/stop the
analysis process, either passively, whenever a session is started by a user or actively by itself.
Different levels of detail can be selected depending on the configuration (host type, CPU load,
capacities …).
The QoE Analyzer processes measured data (statistics, mean values, standard deviation…) in
order to prepare them for the module using the QoE results. It can put into relation the QoS
parameters, time parameters (depending on what day, what time it is) with the QoE results.
The QoE Monitoring module can answer measurement requests for the following parameters:
VQS (Video Quality Score, MOS estimator)
Audio MOS (Mean Opinion Score, through E-model)
Freezes (number and durations)
Audio and video bitrates (average and standard deviation)
Frames per second
Video resolution
Audio and video codecs
Audio sampling rate
Video motion activity
Blurriness, blockiness, noise level
etc.
Depending on the conditions, some of these measurements could be unavailable and will
result in a special response by the QoE monitor (such as N/A).
As for its relations to QoS Monitor, the QoS/QoE Analyzer component can send the following
requests to the QoE Monitor component in order to:
D3.3 – Final Architecture Seventh Framework STREP No. 317846
Public
Page 20 of 43 Version 1.0 © Copyright 2014, the Members of the SmartenIT Consortium
check if a network element is monitored,
ask what monitoring data (metrics) are available,
ask what monitoring capabilities (tools, active measurements) are available,
fetch monitoring data,
set level details for monitoring actions (both passive and active measurements),
command to run monitoring actions (active measurements).
The QoE Monitor component will be sending responses to the QoS/QoE Analyzer component
in order to provide requested information and monitoring data. The communication described
above is synchronous.
4.5 Social Analyzer – Social Monitor (soc1,2,3)
The Social Analyzer and Monitor are used to collect data from social networks such as
Facebook, Twitter, and others. These social networks typically provide a public API that can
be used to query personal data. Since these sites deal with private and sensitive data, it is
required to login via OAuth to get a token. Furthermore the user has to allow such a monitor to
access private data, thus, the approval of the respective user is always required. Once such
an approval is granted, the monitor can collect data. Such data can include:
Public posts with no authorization
Private posts with authorization
Location of posts (if feature enabled)
Likes on posts
Comments
etc.
The social sites put a limit on the frequency of access, thus, setting a limit to the monitor. The
reason for this is to prevent crawling of data. Therefore, an important requirement for the
social monitor is to respect those limits, otherwise the IP gets blacklisted. Facebook, for
example, limits the requests per token and the total requests. Moreover, the queries can take
up several seconds to complete, making real-time analysis difficult. Thus, the monitor will need
to pre-fetch data in the respective intervals. The following requirements for a social monitor
need to be met:
Respect time interval for accessing social networks with automated APIs
Consider the time for a query to return results
The analyzer may need to relay on pre-fetched data to do an analysis. Thus, it is important to
fetch a complete set of data. If analyzing relies on fetching more data from the social networks
via its APIs, then the restrictions mentioned above apply as well. If a token from the user is
stored and the user agreed that certain data can be accessed, then it is possible to fetch data
at a later stage until the token expires or the user revokes the token. If the analyzer processes
lots of data and still needs to query for more data, then runtime of the analyzer may be within
Version 1.0 Page 21 of 43 © Copyright 2014, the Members of the SmartenIT Consortium
days or weeks. For fewer data and without the requirement to fetch additional data, the runtime
may be within seconds. Thus, depending on the method of analyzing, the following runtime
characteristics can be identified:
Seconds: analyze on pre-fetched data, no further queries required
Days: analyze on live and/or pre-fetched data, with further API calls that may require
user permission, or may be subject to API call limit restrictions.
If the methods for analyzing are defined beforehand, collection and processing can be
performed more efficiently. The more flexibility is required, the more time-consuming
processing can become. An additional aspect is that the user agrees that the social monitor
and analyzer access certain private data (e.g., friend list, private posts). If the analysis requires
access to other private data (e.g., location of posts) then the user has to be asked to grant
access to the social analyzer again.
4.6 Economics Analyzer – Billing/Accounting (eco1)
The Billing/Account-Economics Analyzer interface will provide all the necessary
billing/economics information to the SmartenIT prototype to take all the required traffic
management decisions. At the moment, two sources of information are identified, the billing
platforms of
(a) the Data Center/Cloud operator, and
(b) the network service provider (ISP).
In the case of the cloud operator, two main types of information will be provided to the
SmartenIT system,
(a) the terms of service contracted in service level agreements SLAs with its customers
(usually application providers), including its obligations, failure credits, and services’ and
resources’ billing and
(b) operational costs.
An SLA between a cloud operator/provider and a customer defines all the obligations of a
cloud operator/provider to a customer, including terms of performance for certain resources,
thresholds and metrics, as well as credits in case of failure to meet required standards. More
specifically, the following information is mutually agreed:
Server uptime (usually expressed in percentage, e.g., 100%),
Internal network performance metrics, defining the required standards for the network
connecting cloud operator’s virtual resources:
o Jitter (e.g., < 0.5 ms),
o Maximum jitter (e.g. < 10 ms),
o Latency (e.g., < 5 ms),
o Packet loss (in percentage, e.g., < 0.1%),
o Network uptime (in percentage, e.g., 100%)
D3.3 – Final Architecture Seventh Framework STREP No. 317846
Public
Page 22 of 43 Version 1.0 © Copyright 2014, the Members of the SmartenIT Consortium
External network performance metrics, defining the required network performance
standards towards specific geographical regions (but not access networks):
o Latency (e.g., < 200 ms latency to Australia),
o Packet loss,
o Maximum jitter
Load balancing metrics:
o Load balancers uptime (e.g., 100%)
o Load balancers’ performance thresholds, such as concurrent connections and
transactions per second (e.g., 1000 concurrent connections per second)
For all the aforementioned metrics, additional information with regards to the credits -in case of
failure- would be required. For instance, in case that a cloud service does not meet the server
uptime target, but faces a failure lasting for a couple of hours, then the cloud operator would
be required to pay a specified amount per hour, usually related to the respective resource
billing specified below.
Cloud resources’ billing is performed based on several criteria, usually per instance, and per
hour (in case of dynamic pricing)1, 2, 3
:
Number, type and usage of CPUs,
Server type (depending on its required availability),
Storage type and capacity,
Memory,
Network capabilities, such as ingress/egress traffic,
Disk read/writes rate,
OS (due to copyright requirements),
Number of load balancers.
With regards to resources billing, most cloud operators offer different prices per instance type,
e.g., “micro”, “small”, “medium”, “large”, etc., where each type represents a set of the
aforementioned resources of different volume. For instance, a “micro” instance would
represent an instance with 512 MB of RAM, 1 CPU, and 10 GB of storage, and would have
different pricing per usage hour than a “medium” instance with 2 GB RAM, 2 CPUs and 40 GB
of storage. Other requirements, such as the instance’s OS or its network capabilities would
also affect its pricing. Certain information related to the energy costs would be provided; more
specifically the total consumed power and the consumed power by the IT infrastructure, or the
energy costs per router, server or server rack.
The information provided by the network service provider (ISP) would also be divided in the
same categories,
1 Amazon EC2 pricing: <http://aws.amazon.com/ec2/pricing/>
2 Google Cloud pricing: <https://cloud.google.com/pricing/>
3 Microsoft Azure pricing: <http://azure.microsoft.com/en-us/pricing/details/cloud-services/>
Version 1.0 Page 23 of 43 © Copyright 2014, the Members of the SmartenIT Consortium
(a) SLA-related and
(b) operational costs.
In the first case, SLAs between network providers would provide intra-domain and inter-
domain network metrics, including:
Network availability,
Maximum latency,
Packet loss
as well as the agreed credits in case of failure.
The billing information would mainly provide information on the type of pricing, e.g., flat, 95%
percentile, inter-domain traffic tariffs and customers’ categorization and services’ pricing.
Finally, the operational costs include data centers, servers, routers, etc. maintenance and
energy costs.
4.7 Overlay Manager – DC – S-Box (ove1)
The interface between Overlay Manager and Data Center/Cloud Traffic Manager involves the
bi-directional communication between the two specified components, for
(a) providing monitoring information that could be used in the traffic management decision
algorithms and
(b) instructing the cloud to perform required actions.
Regarding monitoring information, the Overlay Manager will provide the Cloud Traffic Manager
with certain information related to overall available and in use (absolute and relative values):
CPU,
Memory,
Storage (primary and/or secondary),
Network capacity.
Additional information could be provided, with specific details per network, zone, cluster, virtual
machine ID or list of IDs, but this will be dependent to the cloud management platform that is
deployed.
After the execution of the applied traffic management algorithms, the Cloud Traffic Manager
may need to instruct the Overlay Manager to perform some required actions, utilizing the
Cloud’s resources.
Such functions would be related to the creation, modification and deletion of
Virtual machine,
Cluster,
Network,
Load balancer,
Router,
Disk volume
including additional information for the required rules and conditions of operation.
D3.3 – Final Architecture Seventh Framework STREP No. 317846
Public
Page 24 of 43 Version 1.0 © Copyright 2014, the Members of the SmartenIT Consortium
4.8 Inter S-Box Communication Service (iscs1)
The interface to exchange information between S-Boxes is implemented in the Inter S-Box
Communication Service (ISCS). The service may be e.g., a Cloud Service Provider - ISP
interface for exchanges on SLA, an application layer - ISP interface for exchanges on provider
network topology information, an ISP-ISP interface to redirect traffic flows, or some other
specific interface. The ISCS communication mechanisms may range from simple IP sockets
to transport means such as ALTO.
The ISCS instance currently specified in SmartenIT is an ISP-ISP interface called Vector
Information Service (VIS). The VIS performs information exchange between Network Traffic
Managers (NTMs) in distant S-Boxes residing in partner network domains. It conveys
information, describes link traffic patterns and volumes regarding traffic flows between Data
Centers. This service is meant to be supported by light communication such as IP sockets.
Another possible instance of the ISCS is communication between the ALTO Servers of distant
S-Boxes. The goal can be either to update a local ALTO Server with topology and path cost
information on distant network topology or to use the latter information to better plan inter-
domain application traffic. This communication may be done by using the ALTO protocol, via
an ALTO client of the S-Box communicating with the ALTO Server of another S-Box.
4.9 SDN Controller – Switching-/Forwarding Component (ntm2)
In the SmoothIT4 project the Switching/Forwarding component is considered as a software
and hardware part of a network device.
In the scope of SmartenIT, we use routers, switches and access points. This component is
used by all proposed management mechanisms described in SmartenIT Deliverable D2.4 [4].
In most cases, the network device configuration is done by a command line interface (CLI).
Alternatively, a graphical interface offered by particular device or SNMP can be used.
In the considered system we rely on the SDN management paradigm for traffic flow control.
An SDN controller is sending instructions as flow rules to the switches. A software based
switch - Ovswitch5 - is used in the first stage of implementation and deployment. Later we plan
to use hardware switches. All mentioned switches (software and hardware) must support
OpenFlow6 protocol for communication between switch and SDN controller (southbound SDN
controller interface). FloodLight7 is adopted as SDN controller in the SmartenIT system.
The OpenFlow Interface is offered by the Switching/Forwarding component. In the language of
SDN, this protocol works on the southbound interface. This component has to work in the flow
based switching mode. The interface is used by the SDN controller for sending flow rules to
switches. The flow rules are established by the SDN controller. These rules are based on
information delivered by the Fixed/Mobile Network Traffic Manager and the
Switching/Forwarding component. Data from selected switch counters is retrieved from
switches supporting the OpenFlow protocol. This data is delivered to the SDN controller
through an OpenFlow protocol and used for rule setup. For the proposed mechanisms in
SmartenIT Deliverable D2.4 [4] it is sufficient to use OpenFlow 1.0.
4 SmoothIT: <www.smoothit.org>
5 Ovswitch: <openvswitch.org>
6 OpenFlow: <www.opennetworking.org>
7 FloodLight: <www.projectfloodlight.org>
Version 1.0 Page 25 of 43 © Copyright 2014, the Members of the SmartenIT Consortium
4.10 Traffic Manager Interfaces (ntm1)
The Traffic Manager also provides a number of interfaces:
an interface towards the Overlay Manager, which can follow the ALTO approach,
an interface towards remote Traffic Managers, to enable the interoperability across
domains and moreover it will allow for a cascading traffic managers to collaborate.
For this interface, proposals such as the inter-ALTO approach [7][8], VIS Information Service,
or the SDN east-west interface can be adopted. Another simplified method of communication
using a dedicated SmartenIT solution is also considered.
interfaces towards the Economics and Social Analyzers to capture the socio-economic
related aspects during the decision-taking process,
interfaces towards the QoS/QoE, Network and Energy Analyzers so as to consider all
the parameters required in the decision-taking process.
The Traffic Manager will use the interface provided by the Switching/Forwarding component
so that the decisions taken will be materialized at the network layer. Through this interface, the
decisions taken by the Traffic Manager will be translated to lower-level commands so as to be
handled by the network layer. The level of interactions between the Traffic Manager and the
Switching/Forwarding component differ, based on type of the network entity (router, switch,
mobile nodes such as GGSN (Gateway GPRS Support Node), SGSN (Serving GPRS
Support Node), etc.).
The diagram in Figure 1 shows only a typical type of interaction that follows the SDN
approach, where the Traffic Manager, acting as the “Controller” using the SDN terminology,
instructs the Switching/Forwarding component of a router to follow a specific routing rule for
certain type of network traffic. Note that the internals of the Traffic Manager are not further
discussed, since they depend on the actual mechanisms to be implemented. For sure, there
will be more than one interface between the Cloud Traffic Manager and the Network Traffic
Manager.
The SDN controller offers an interface for communication to the Fixed/Mobile Network Traffic
Manager. In our implementation employs the Floodlight SDN controller. This interface should
be considered as a northbound interface in the SDN terminology. The HTTP-REST
communication is a standard communication paradigm offered by the mentioned SDN
controller.
The Fixed/Mobile Network Traffic Manager provides the compensation and reference vectors
to the SDN controller described in SmartenIT Deliverables D2.2 and D2.4 [1][4]. After
receiving these vectors the SDN controller starts working on flow rules. When new flow rules
has been established, they are send to a Switching/Forwarding component.
In case of the inbound DTM, a remote Fixed/Mobile Network Traffic Manager communicates
with an SDN controller described in SmartenIT Deliverables D2.4 [4]. When the outbound
DTM is used, a local Fixed/Mobile Network Traffic Manager transfers compensation and
reference vectors to an SDN controller.
D3.3 – Final Architecture Seventh Framework STREP No. 317846
Public
Page 26 of 43 Version 1.0 © Copyright 2014, the Members of the SmartenIT Consortium
5 Deployment of Mechanisms on the Architecture
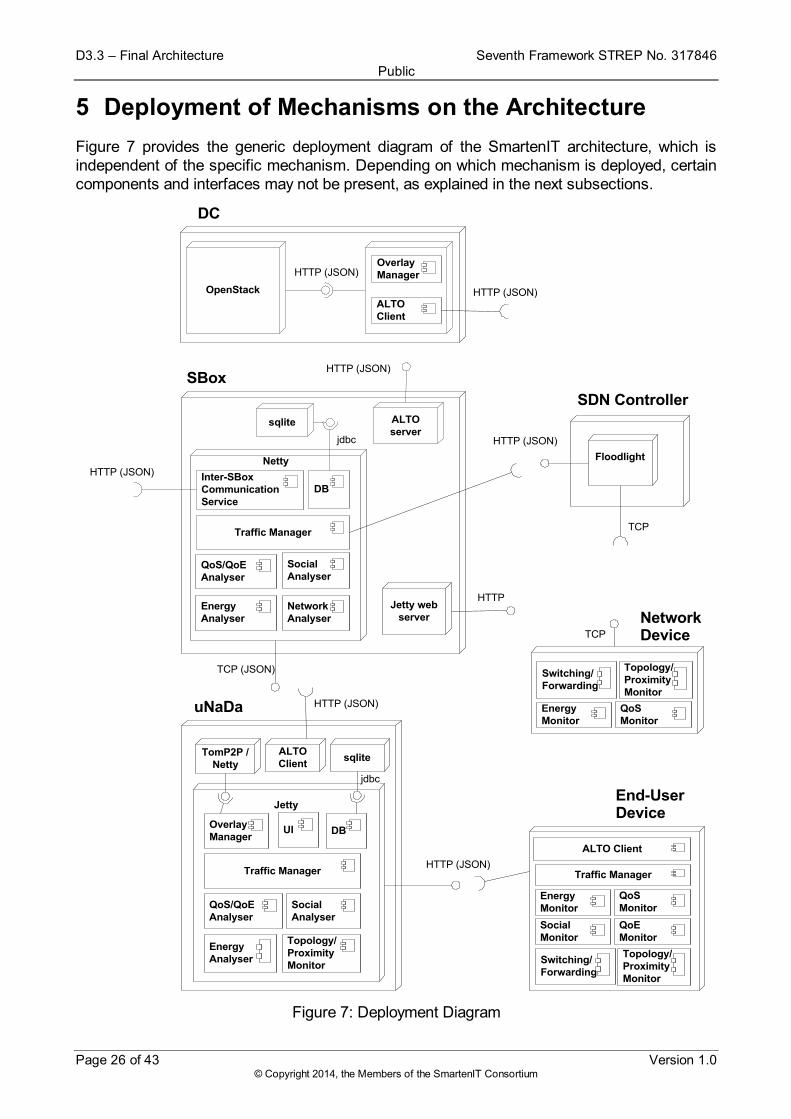
Figure 7 provides the generic deployment diagram of the SmartenIT architecture, which is
independent of the specific mechanism. Depending on which mechanism is deployed, certain
components and interfaces may not be present, as explained in the next subsections.
Netty
sqlite
Floodlight
HTTP (JSON)
TCP (JSON)
TCP
Jetty web
server
HTTP
DB
Network
Analyser
jdbc
Energy
Analyser
SBox
OpenStack
HTTP (JSON)
Jetty
sqlite
HTTP (JSON)
DB
Topology/
Proximity
Monitor
Energy
Analyser
QoS/QoE
Analyser
Social
Analyser
uNaDa
Overlay
Manager
jdbc
Network Device
Switching/
Forwarding
Topology/
Proximity
Monitor
Energy
Monitor
QoS
Monitor
End-User Device
QoE
Monitor
Social
Monitor
ALTO Client
DC
HTTP (JSON)
ALTO
Client
Overlay
Manager
ALTO
server
Inter-SBox
Communication
Service
TomP2P /
Netty
HTTP (JSON)
SDN Controller
QoS/QoE
Analyser
Social
Analyser
Traffic Manager
UI
Traffic Manager
ALTO
Client
HTTP (JSON)
HTTP (JSON)
Traffic Manager
Switching/
Forwarding
Topology/
Proximity
Monitor
Energy
Monitor
QoS
Monitor
TCP
Figure 7: Deployment Diagram
Version 1.0 Page 27 of 43 © Copyright 2014, the Members of the SmartenIT Consortium
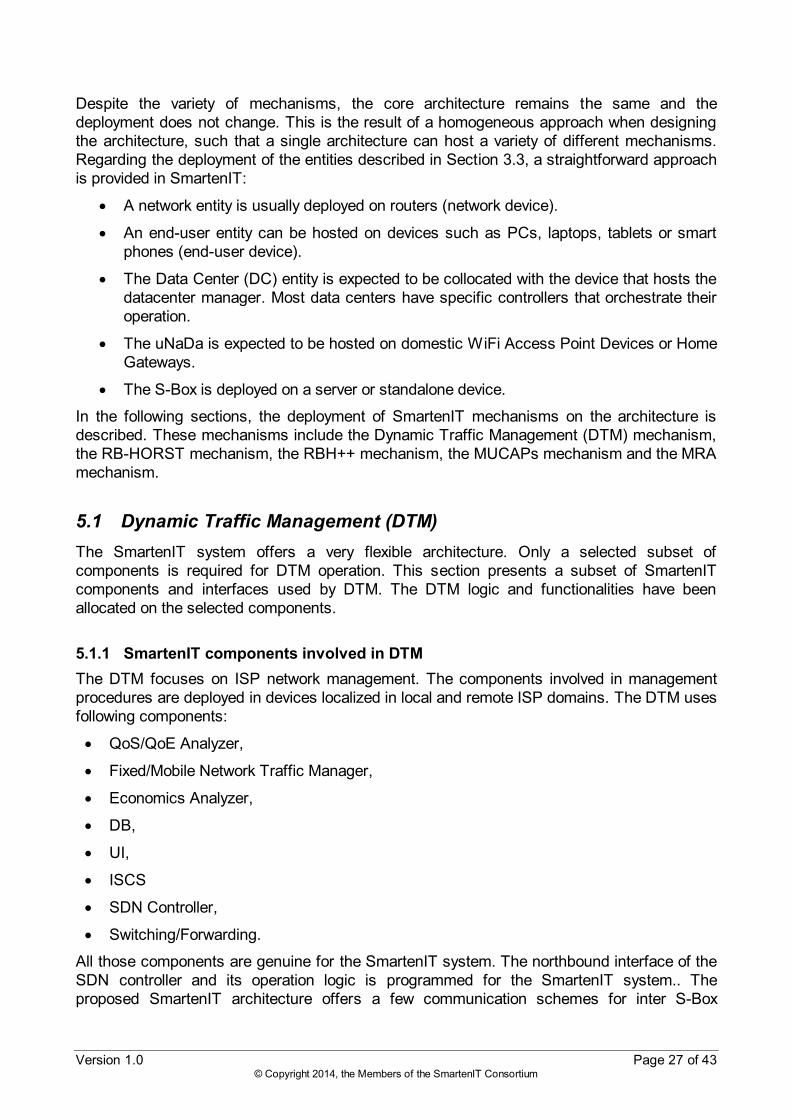
Despite the variety of mechanisms, the core architecture remains the same and the
deployment does not change. This is the result of a homogeneous approach when designing
the architecture, such that a single architecture can host a variety of different mechanisms.
Regarding the deployment of the entities described in Section 3.3, a straightforward approach
is provided in SmartenIT:
A network entity is usually deployed on routers (network device).
An end-user entity can be hosted on devices such as PCs, laptops, tablets or smart
phones (end-user device).
The Data Center (DC) entity is expected to be collocated with the device that hosts the
datacenter manager. Most data centers have specific controllers that orchestrate their
operation.
The uNaDa is expected to be hosted on domestic WiFi Access Point Devices or Home
Gateways.
The S-Box is deployed on a server or standalone device.
In the following sections, the deployment of SmartenIT mechanisms on the architecture is
described. These mechanisms include the Dynamic Traffic Management (DTM) mechanism,
the RB-HORST mechanism, the RBH++ mechanism, the MUCAPs mechanism and the MRA
mechanism.
5.1 Dynamic Traffic Management (DTM)
The SmartenIT system offers a very flexible architecture. Only a selected subset of
components is required for DTM operation. This section presents a subset of SmartenIT
components and interfaces used by DTM. The DTM logic and functionalities have been
allocated on the selected components.
5.1.1 SmartenIT components involved in DTM
The DTM focuses on ISP network management. The components involved in management
procedures are deployed in devices localized in local and remote ISP domains. The DTM uses
following components:
QoS/QoE Analyzer,
Fixed/Mobile Network Traffic Manager,
Economics Analyzer,
DB,
UI,
ISCS
SDN Controller,
Switching/Forwarding.
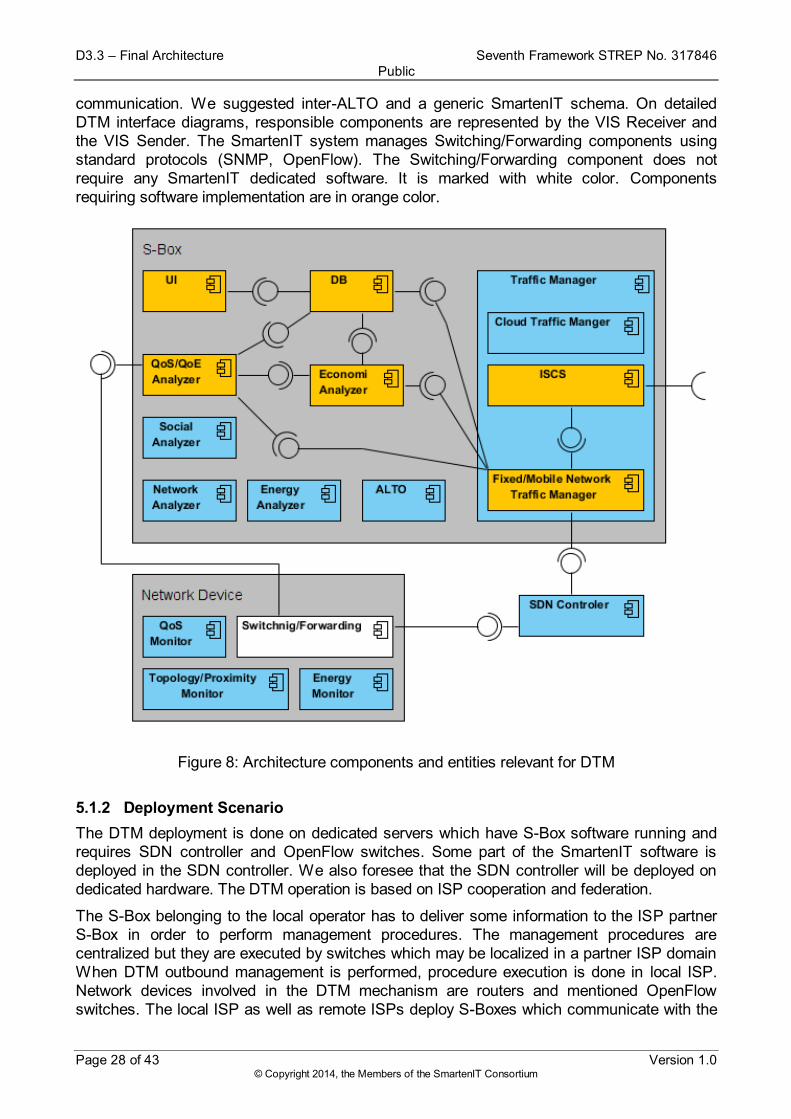
All those components are genuine for the SmartenIT system. The northbound interface of the
SDN controller and its operation logic is programmed for the SmartenIT system.. The
proposed SmartenIT architecture offers a few communication schemes for inter S-Box
D3.3 – Final Architecture Seventh Framework STREP No. 317846
Public
Page 28 of 43 Version 1.0 © Copyright 2014, the Members of the SmartenIT Consortium
communication. We suggested inter-ALTO and a generic SmartenIT schema. On detailed
DTM interface diagrams, responsible components are represented by the VIS Receiver and
the VIS Sender. The SmartenIT system manages Switching/Forwarding components using
standard protocols (SNMP, OpenFlow). The Switching/Forwarding component does not
require any SmartenIT dedicated software. It is marked with white color. Components
requiring software implementation are in orange color.
Figure 8: Architecture components and entities relevant for DTM
5.1.2 Deployment Scenario
The DTM deployment is done on dedicated servers which have S-Box software running and
requires SDN controller and OpenFlow switches. Some part of the SmartenIT software is
deployed in the SDN controller. We also foresee that the SDN controller will be deployed on
dedicated hardware. The DTM operation is based on ISP cooperation and federation.
The S-Box belonging to the local operator has to deliver some information to the ISP partner
S-Box in order to perform management procedures. The management procedures are
centralized but they are executed by switches which may be localized in a partner ISP domain
When DTM outbound management is performed, procedure execution is done in local ISP.
Network devices involved in the DTM mechanism are routers and mentioned OpenFlow
switches. The local ISP as well as remote ISPs deploy S-Boxes which communicate with the
Version 1.0 Page 29 of 43 © Copyright 2014, the Members of the SmartenIT Consortium
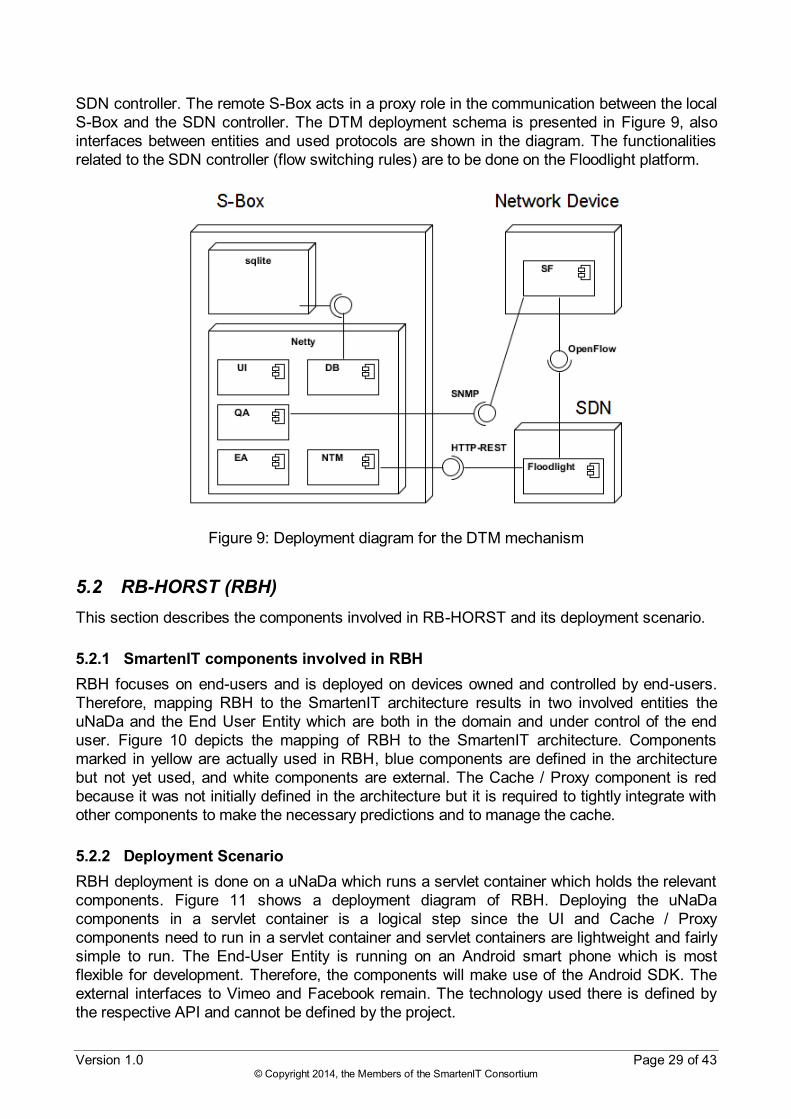
SDN controller. The remote S-Box acts in a proxy role in the communication between the local
S-Box and the SDN controller. The DTM deployment schema is presented in Figure 9, also
interfaces between entities and used protocols are shown in the diagram. The functionalities
related to the SDN controller (flow switching rules) are to be done on the Floodlight platform.
Figure 9: Deployment diagram for the DTM mechanism
5.2 RB-HORST (RBH)
This section describes the components involved in RB-HORST and its deployment scenario.
5.2.1 SmartenIT components involved in RBH
RBH focuses on end-users and is deployed on devices owned and controlled by end-users.
Therefore, mapping RBH to the SmartenIT architecture results in two involved entities the
uNaDa and the End User Entity which are both in the domain and under control of the end
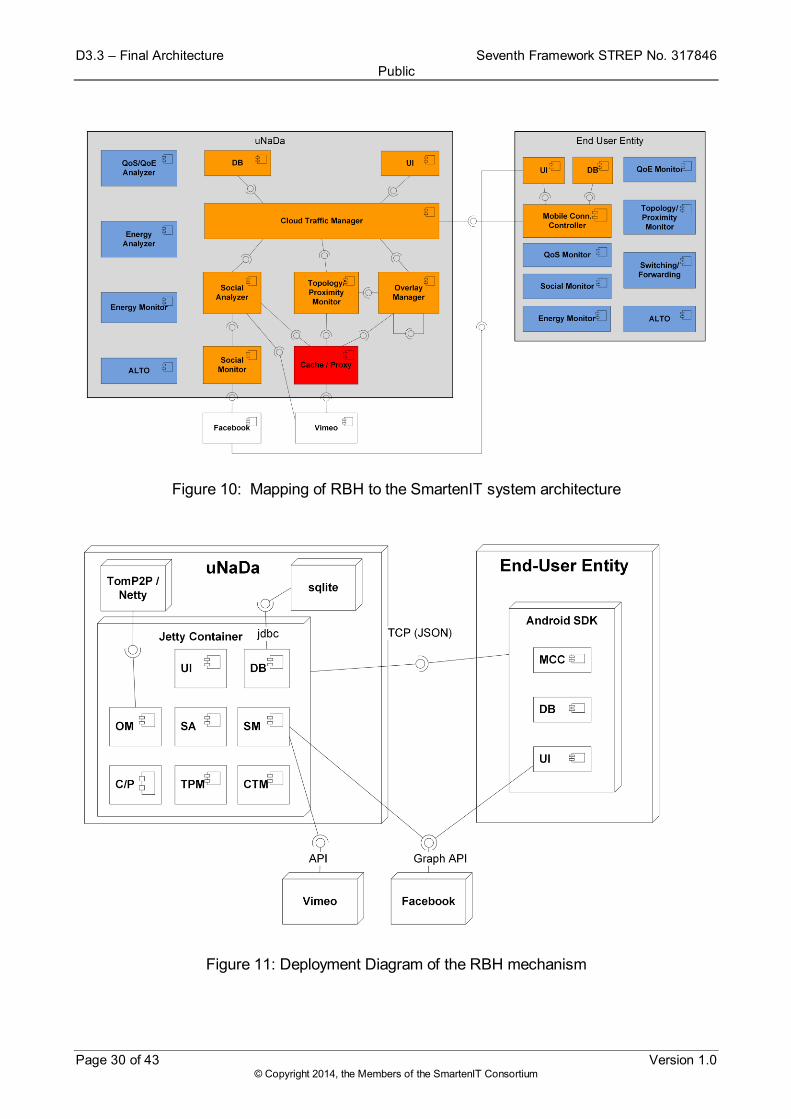
user. Figure 10 depicts the mapping of RBH to the SmartenIT architecture. Components
marked in yellow are actually used in RBH, blue components are defined in the architecture
but not yet used, and white components are external. The Cache / Proxy component is red
because it was not initially defined in the architecture but it is required to tightly integrate with
other components to make the necessary predictions and to manage the cache.
5.2.2 Deployment Scenario
RBH deployment is done on a uNaDa which runs a servlet container which holds the relevant
components. Figure 11 shows a deployment diagram of RBH. Deploying the uNaDa
components in a servlet container is a logical step since the UI and Cache / Proxy
components need to run in a servlet container and servlet containers are lightweight and fairly
simple to run. The End-User Entity is running on an Android smart phone which is most
flexible for development. Therefore, the components will make use of the Android SDK. The
external interfaces to Vimeo and Facebook remain. The technology used there is defined by
the respective API and cannot be defined by the project.
D3.3 – Final Architecture Seventh Framework STREP No. 317846
Public
Page 30 of 43 Version 1.0 © Copyright 2014, the Members of the SmartenIT Consortium
Figure 10: Mapping of RBH to the SmartenIT system architecture
Figure 11: Deployment Diagram of the RBH mechanism
Version 1.0 Page 31 of 43 © Copyright 2014, the Members of the SmartenIT Consortium
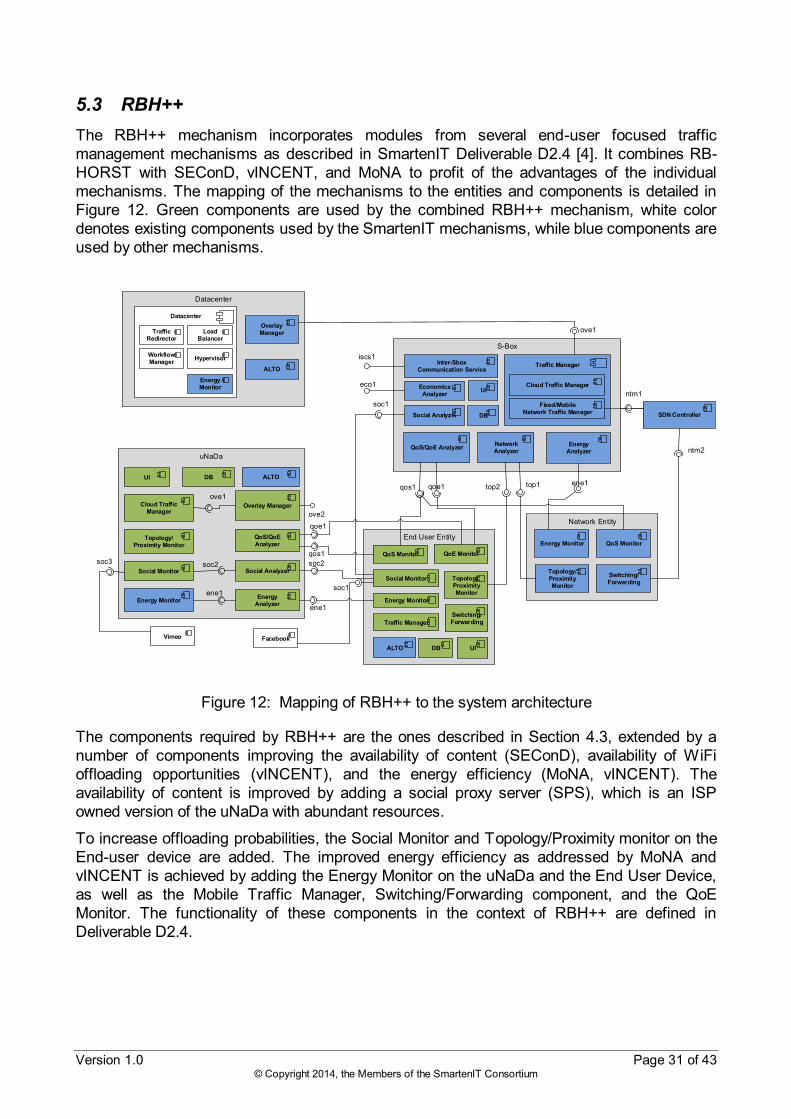
5.3 RBH++
The RBH++ mechanism incorporates modules from several end-user focused traffic
management mechanisms as described in SmartenIT Deliverable D2.4 [4]. It combines RB-
HORST with SEConD, vINCENT, and MoNA to profit of the advantages of the individual
mechanisms. The mapping of the mechanisms to the entities and components is detailed in
Figure 12. Green components are used by the combined RBH++ mechanism, white color
denotes existing components used by the SmartenIT mechanisms, while blue components are
used by other mechanisms.
End User Entity
Energy Monitor
QoS Monitor
Social Monitor
QoE Monitor
Topology/Proximity Monitor
Switching/Forwarding
ALTO DB UI
Traffic Manager
S-Box
Social Analyzer
EconomicsAnalyzer
QoS/QoE AnalyzerEnergy
Analyzer
Network Analyzer
DB
UI
Network Entity
Energy Monitor QoS Monitor
Topology/Proximity Monitor
Switching/Forwarding
Datacenter
Overlay Manager
Datacenter
WorkflowManager
Load Balancer
Traffic Redirector
Hypervisor
Energy Monitor
soc1
qoe1qos1 top1 ene1
ntm1
ntm2
eco1
ALTO
top2
uNaDa
Overlay Manager
Energy MonitorEnergy
Analyzer
QoS/QoEAnalyzer
Social Analyzer
Cloud Traffic Manager
Topology/Proximity Monitor
DBUI ALTO
ove1
ene1soc1
ene1
qos1
qoe1
ove2
Social Monitorsoc2
Traffic Manager
Cloud Traffic Manager
Fixed/Mobile Network Traffic Manager
ove1
Inter-Sbox Communication Service
SDN Controller
Vimeo Facebook
iscs1
soc2soc3
Figure 12: Mapping of RBH++ to the system architecture
The components required by RBH++ are the ones described in Section 4.3, extended by a
number of components improving the availability of content (SEConD), availability of WiFi
offloading opportunities (vINCENT), and the energy efficiency (MoNA, vINCENT). The
availability of content is improved by adding a social proxy server (SPS), which is an ISP
owned version of the uNaDa with abundant resources.
To increase offloading probabilities, the Social Monitor and Topology/Proximity monitor on the
End-user device are added. The improved energy efficiency as addressed by MoNA and
vINCENT is achieved by adding the Energy Monitor on the uNaDa and the End User Device,
as well as the Mobile Traffic Manager, Switching/Forwarding component, and the QoE
Monitor. The functionality of these components in the context of RBH++ are defined in
Deliverable D2.4.
D3.3 – Final Architecture Seventh Framework STREP No. 317846
Public
Page 32 of 43 Version 1.0 © Copyright 2014, the Members of the SmartenIT Consortium
5.4 Integration of MUCAPS
MUCAPS stands for "MUlti-Criteria Application endPoint Selection" and has been specified in
Section 4.11 of Deliverables D2.2 and D2.4 [1][4]. ALTO is integrated in the SmartenIT
architecture: the ALTO Server stores and provides abstracted transport network information to
requesting ALTO Clients associated to applications. However, the ALTO Client alone cannot
automatically decide what information to request and how to process it once received.
MUCAPS builds the decision making around the ALTO Client. It assists the choice of the
location from which to download content. Locations can be various entities including Video
Server, Data Center, uNaDa and Peers. Content covers video streams as well as computing
resources for virtualized or distributed applications. MUCAPS is suitable for applications
having the choice among several feasible Application Endpoints (AEPs) and supports multi
layer and multi party incentive decision making by involving the following aspects in the AEP
selection:
Topology distance: number of hops (inter or intra AS), impacting delay,
Routing cost: reflecting the ISP policy in terms of AS peering agreements,
ISP preferences in terms of resources availability (e.g., path bandwidth). .
5.4.1 The MUCAPS added value to application traffic management and SmartenIT
MUCAPS contributes to overlay application traffic optimization by improving the initial overlay
Endpoints selection by involving awareness on the underlying network topology and on
transport network information not available by traditional end to end on-line measurement
mechanisms. The selection criteria used in MUCAPS are an abstraction of end to end
performances on application paths. This abstraction relies itself on an ISP centric abstraction
of the Internet topology, that is available to applications via the IETF ALTO protocol,
documented in RFC 7285 [5]. MUCAPS leverages proposed ALTO protocol extensions,
extending the base protocol set of ALTO metrics and allowing ALTO transactions with multiple
metrics and constraints combined with multiple logical operators allowing richer compromises.
So MUCAPS can help out any SmartenIT mechanism that supports applications having
multiple candidate resources locations and that have no awareness of the underlying network.
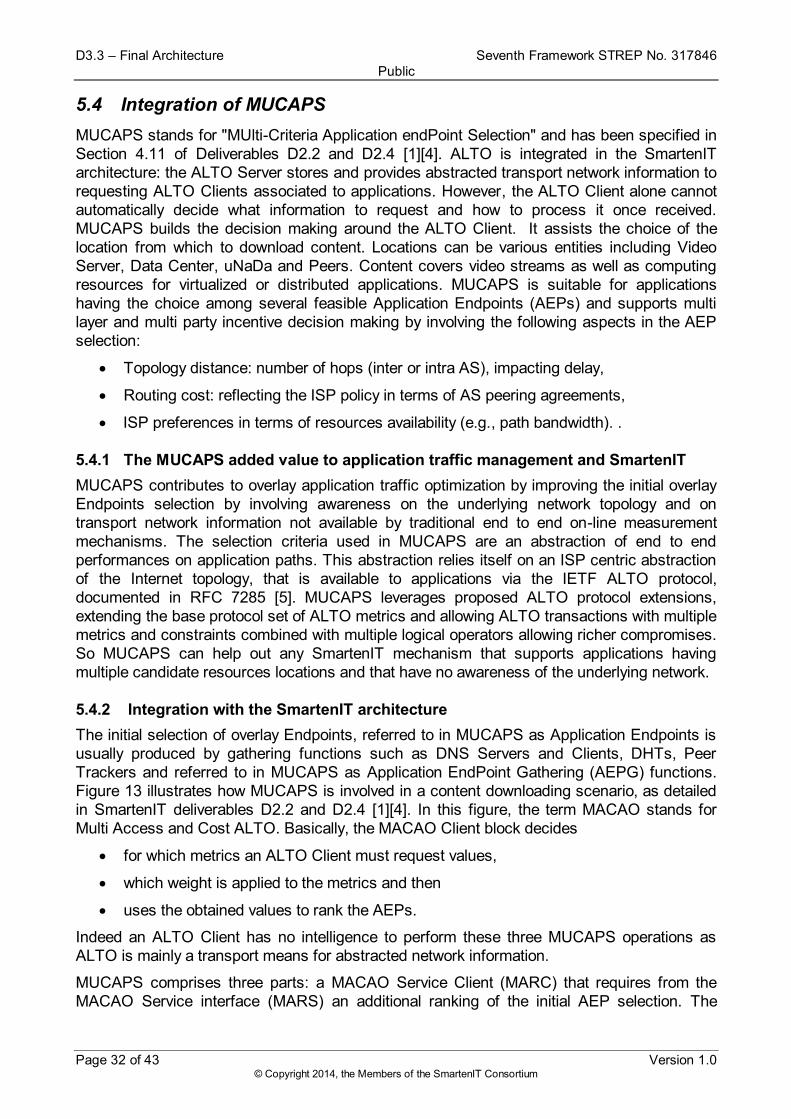
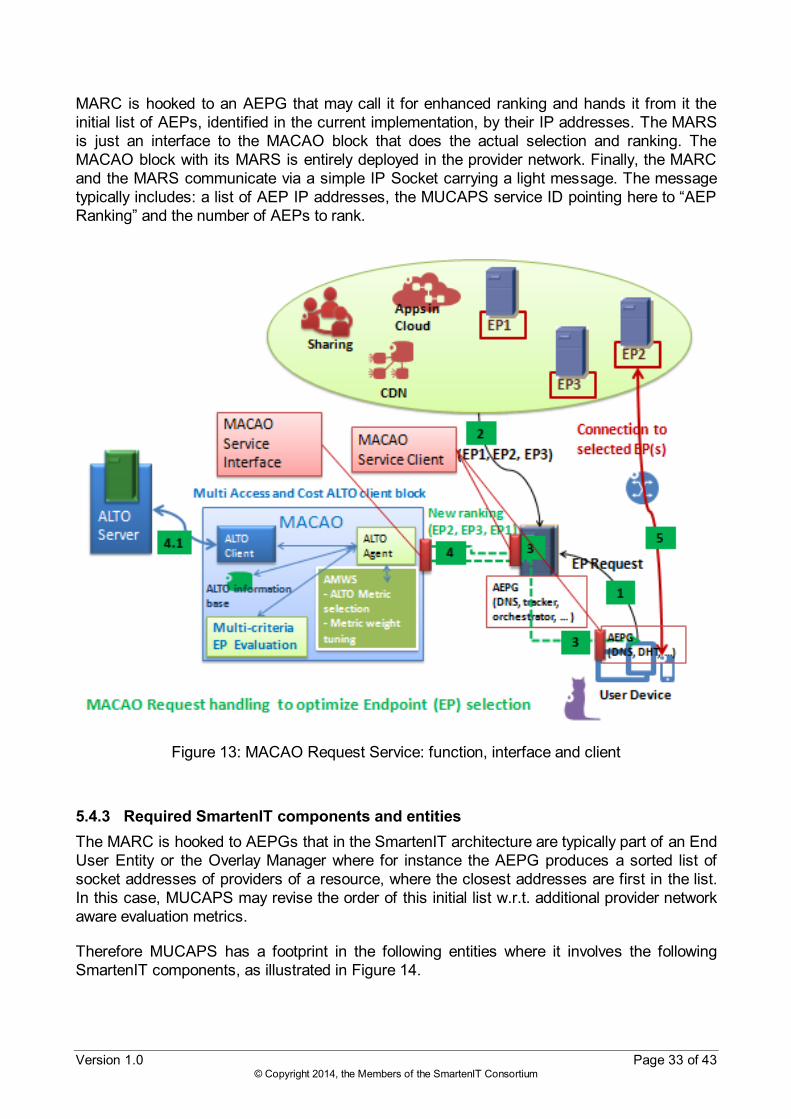
5.4.2 Integration with the SmartenIT architecture
The initial selection of overlay Endpoints, referred to in MUCAPS as Application Endpoints is
usually produced by gathering functions such as DNS Servers and Clients, DHTs, Peer
Trackers and referred to in MUCAPS as Application EndPoint Gathering (AEPG) functions.
Figure 13 illustrates how MUCAPS is involved in a content downloading scenario, as detailed
in SmartenIT deliverables D2.2 and D2.4 [1][4]. In this figure, the term MACAO stands for
Multi Access and Cost ALTO. Basically, the MACAO Client block decides
for which metrics an ALTO Client must request values,
which weight is applied to the metrics and then
uses the obtained values to rank the AEPs.
Indeed an ALTO Client has no intelligence to perform these three MUCAPS operations as
ALTO is mainly a transport means for abstracted network information.
MUCAPS comprises three parts: a MACAO Service Client (MARC) that requires from the
MACAO Service interface (MARS) an additional ranking of the initial AEP selection. The
Version 1.0 Page 33 of 43 © Copyright 2014, the Members of the SmartenIT Consortium
MARC is hooked to an AEPG that may call it for enhanced ranking and hands it from it the
initial list of AEPs, identified in the current implementation, by their IP addresses. The MARS
is just an interface to the MACAO block that does the actual selection and ranking. The
MACAO block with its MARS is entirely deployed in the provider network. Finally, the MARC
and the MARS communicate via a simple IP Socket carrying a light message. The message
typically includes: a list of AEP IP addresses, the MUCAPS service ID pointing here to “AEP
Ranking” and the number of AEPs to rank.
Figure 13: MACAO Request Service: function, interface and client
.
5.4.3 Required SmartenIT components and entities
The MARC is hooked to AEPGs that in the SmartenIT architecture are typically part of an End
User Entity or the Overlay Manager where for instance the AEPG produces a sorted list of
socket addresses of providers of a resource, where the closest addresses are first in the list.
In this case, MUCAPS may revise the order of this initial list w.r.t. additional provider network
aware evaluation metrics.
Therefore MUCAPS has a footprint in the following entities where it involves the following
SmartenIT components, as illustrated in Figure 14.
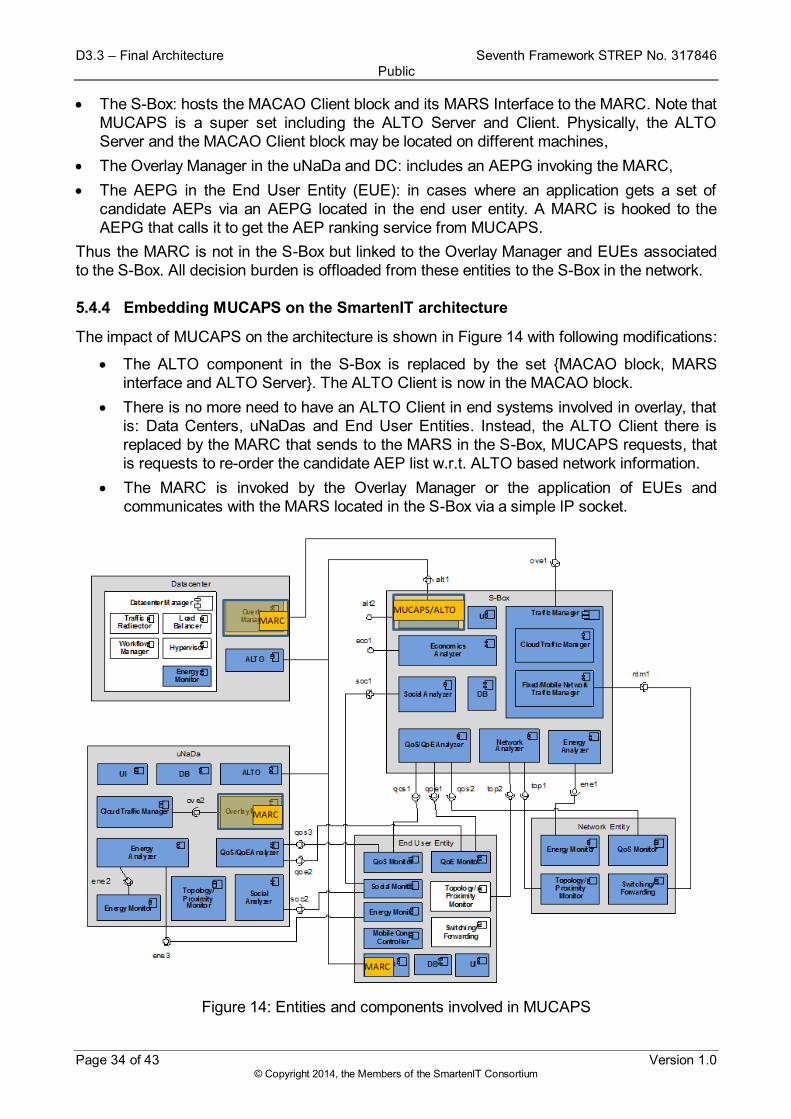
D3.3 – Final Architecture Seventh Framework STREP No. 317846
Public
Page 34 of 43 Version 1.0 © Copyright 2014, the Members of the SmartenIT Consortium
The S-Box: hosts the MACAO Client block and its MARS Interface to the MARC. Note that
MUCAPS is a super set including the ALTO Server and Client. Physically, the ALTO
Server and the MACAO Client block may be located on different machines,
The Overlay Manager in the uNaDa and DC: includes an AEPG invoking the MARC,
The AEPG in the End User Entity (EUE): in cases where an application gets a set of
candidate AEPs via an AEPG located in the end user entity. A MARC is hooked to the
AEPG that calls it to get the AEP ranking service from MUCAPS.
Thus the MARC is not in the S-Box but linked to the Overlay Manager and EUEs associated
to the S-Box. All decision burden is offloaded from these entities to the S-Box in the network.
5.4.4 Embedding MUCAPS on the SmartenIT architecture
The impact of MUCAPS on the architecture is shown in Figure 14 with following modifications:
The ALTO component in the S-Box is replaced by the set {MACAO block, MARS
interface and ALTO Server}. The ALTO Client is now in the MACAO block.
There is no more need to have an ALTO Client in end systems involved in overlay, that
is: Data Centers, uNaDas and End User Entities. Instead, the ALTO Client there is
replaced by the MARC that sends to the MARS in the S-Box, MUCAPS requests, that
is requests to re-order the candidate AEP list w.r.t. ALTO based network information.
The MARC is invoked by the Overlay Manager or the application of EUEs and
communicates with the MARS located in the S-Box via a simple IP socket.
Figure 14: Entities and components involved in MUCAPS
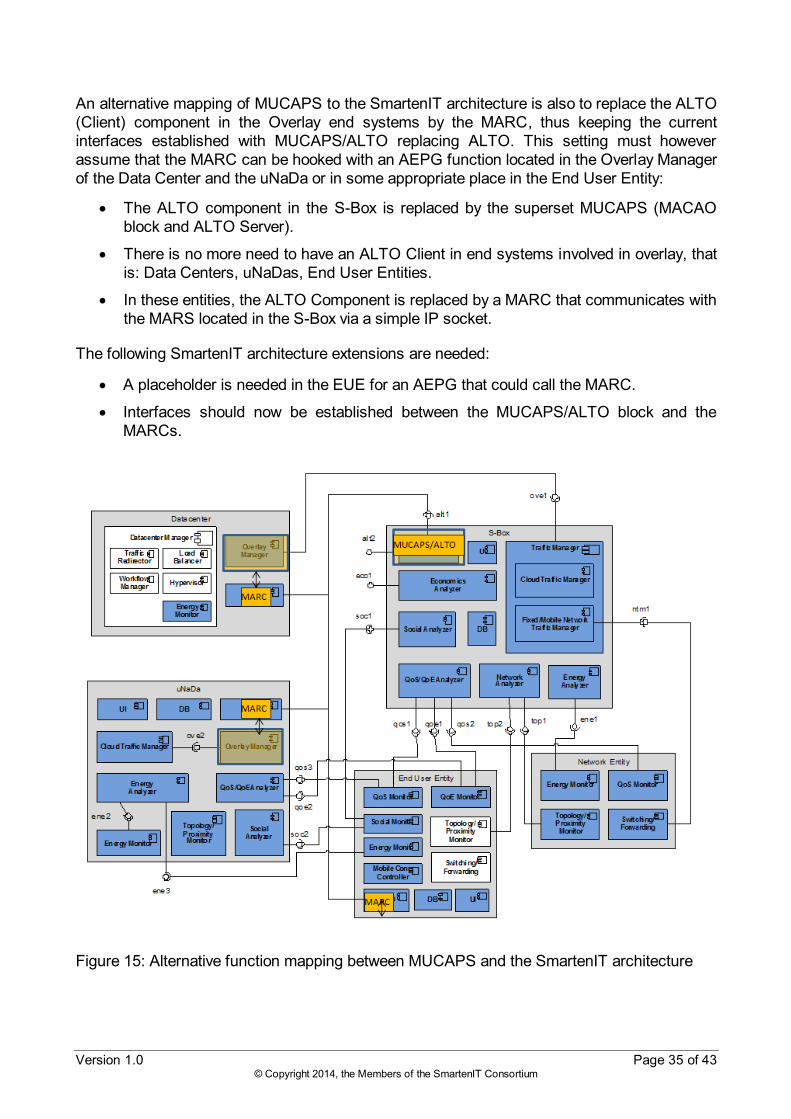
Version 1.0 Page 35 of 43 © Copyright 2014, the Members of the SmartenIT Consortium
An alternative mapping of MUCAPS to the SmartenIT architecture is also to replace the ALTO
(Client) component in the Overlay end systems by the MARC, thus keeping the current
interfaces established with MUCAPS/ALTO replacing ALTO. This setting must however
assume that the MARC can be hooked with an AEPG function located in the Overlay Manager
of the Data Center and the uNaDa or in some appropriate place in the End User Entity:
The ALTO component in the S-Box is replaced by the superset MUCAPS (MACAO
block and ALTO Server).
There is no more need to have an ALTO Client in end systems involved in overlay, that
is: Data Centers, uNaDas, End User Entities.
In these entities, the ALTO Component is replaced by a MARC that communicates with
the MARS located in the S-Box via a simple IP socket.
The following SmartenIT architecture extensions are needed:
A placeholder is needed in the EUE for an AEPG that could call the MARC.
Interfaces should now be established between the MUCAPS/ALTO block and the
MARCs.
Figure 15: Alternative function mapping between MUCAPS and the SmartenIT architecture
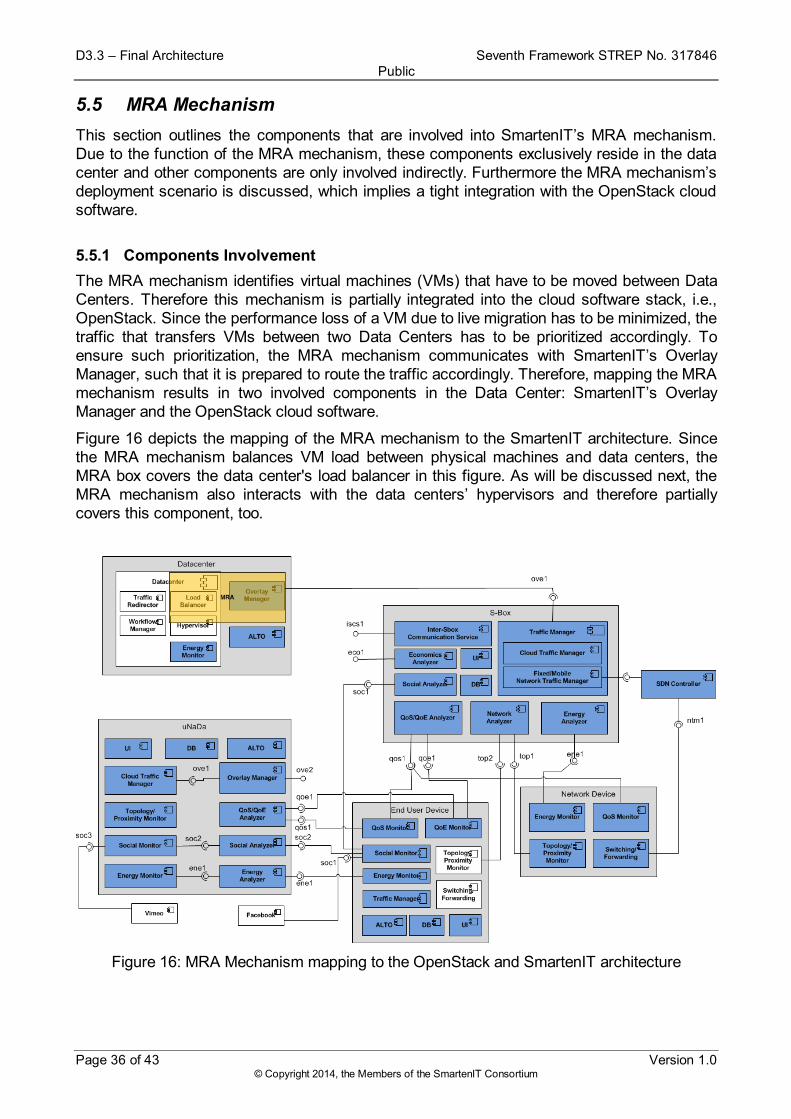
D3.3 – Final Architecture Seventh Framework STREP No. 317846
Public
Page 36 of 43 Version 1.0 © Copyright 2014, the Members of the SmartenIT Consortium
5.5 MRA Mechanism
This section outlines the components that are involved into SmartenIT’s MRA mechanism.
Due to the function of the MRA mechanism, these components exclusively reside in the data
center and other components are only involved indirectly. Furthermore the MRA mechanism’s
deployment scenario is discussed, which implies a tight integration with the OpenStack cloud
software.
5.5.1 Components Involvement
The MRA mechanism identifies virtual machines (VMs) that have to be moved between Data
Centers. Therefore this mechanism is partially integrated into the cloud software stack, i.e.,
OpenStack. Since the performance loss of a VM due to live migration has to be minimized, the
traffic that transfers VMs between two Data Centers has to be prioritized accordingly. To
ensure such prioritization, the MRA mechanism communicates with SmartenIT’s Overlay
Manager, such that it is prepared to route the traffic accordingly. Therefore, mapping the MRA
mechanism results in two involved components in the Data Center: SmartenIT’s Overlay
Manager and the OpenStack cloud software.
Figure 16 depicts the mapping of the MRA mechanism to the SmartenIT architecture. Since
the MRA mechanism balances VM load between physical machines and data centers, the
MRA box covers the data center's load balancer in this figure. As will be discussed next, the
MRA mechanism also interacts with the data centers’ hypervisors and therefore partially
covers this component, too.
Figure 16: MRA Mechanism mapping to the OpenStack and SmartenIT architecture
Version 1.0 Page 37 of 43 © Copyright 2014, the Members of the SmartenIT Consortium
5.5.2 Deployment Scenario
The MRA mechanism fetches VM usage information from OpenStack's Ceilometer8
component and information which VM belongs to which cloud costumer from OpenStack's
Keystone9 component. Based on this information, fairness and efficiency of the current
resource allocation is calculated. If improvement is possible, either resources of physical
machines are reallocated between hosted VMs or VMs are live migrated. In order to reallocate
resources, the MRA mechanism interfaces the Nova API, which is a component of
OpenStack, as this allows instructing the physical machines' hypervisors to reallocate
resources between VM processes. To live migrate VMs efficiently between Data Centers, the
MRA mechanism deploys SmartenIT's Overlay Manager to announce and conduct efficient
VM transfers between Data Centers.
8 Ceilometer: <wiki.openstack.org/wiki/Ceilometer>
9 Keystone: <wiki.openstack.org/wiki/Keystone>
D3.3 – Final Architecture Seventh Framework STREP No. 317846
Public
Page 38 of 43 Version 1.0 © Copyright 2014, the Members of the SmartenIT Consortium
6 Summary and Conclusions
This deliverable describes the final architecture adopted for the SmartenIT system as a main
reference for the implementation, deployment and validation of mechanisms and applications
on top of it. The consolidated approach includes and finishes the preparation work of the initial
architecture draft with regard to the requirements arising during the first implementation phase
of mechanisms.
Section 3 presents the overall structure, defines all included components, groups them
together to form the main entities, including the network entity, end system entity, entities for
cloud based data centers and user controlled nano data centers. Finally, the SmartenIT box is
introduced as a control unit of a domain. Those entities include all components that are
relevant for the considered mechanisms, although not all of them need to be present in the
instances supporting one of the mechanisms. Therefore the architecture concept of Section 2
embraces all considered mechanisms without depending on their specific functions or
implementation.
Section 4 gives an overview of the interfaces between the components and specifies the main
interfaces in detail. Interfaces are relevant between analysis and monitoring components,
where the latter may be part of other SmartenIT entities or they may be accessible through
external interfaces. In this way, the SmartenIT analyzer components are provided with required
input regarding traffic, topology, QoS/QoE and energy status as well as social monitor data.
Moreover, interfaces are specified between SmartenIT boxes in different domains via the Inter
S-Box Communication Service and to external overlay controllers. SDN controllers are
integrated with interfaces to traffic management and routing systems.
In Section 5, the mechanisms are embedded and mapped onto the system architecture. A
generic deployment diagram is provided. For both implemented mechanisms, the dynamic
traffic management and RB-HORST, their suitable interrelation with the architecture is
demonstrated. Moreover, the MUlti-Criteria Application endPoint Selection (MUCAPS)
mechanism is considered with two different variants for deployment on the SmartenIT
architecture, which also incorporates elements of the application layer traffic optimization
(ALTO) protocol [6] developed by the IETF standardization.
Concluding, the SmartenIT architecture is specified in this document in order to have main
components and entities with their interface relationships settled in an overall structure that is
validated as being suitable for the considered set of mechanisms. In this way the architecture
serves as a basis for further development of mechanism prototypes and their evaluation and
validation. Interfaces are provided not only between internal components but also for
communication between different domains and to external control elements. The architectural
concept is held at a level of abstraction that is still open and flexible to incorporate new
mechanisms and for communication to other applications.
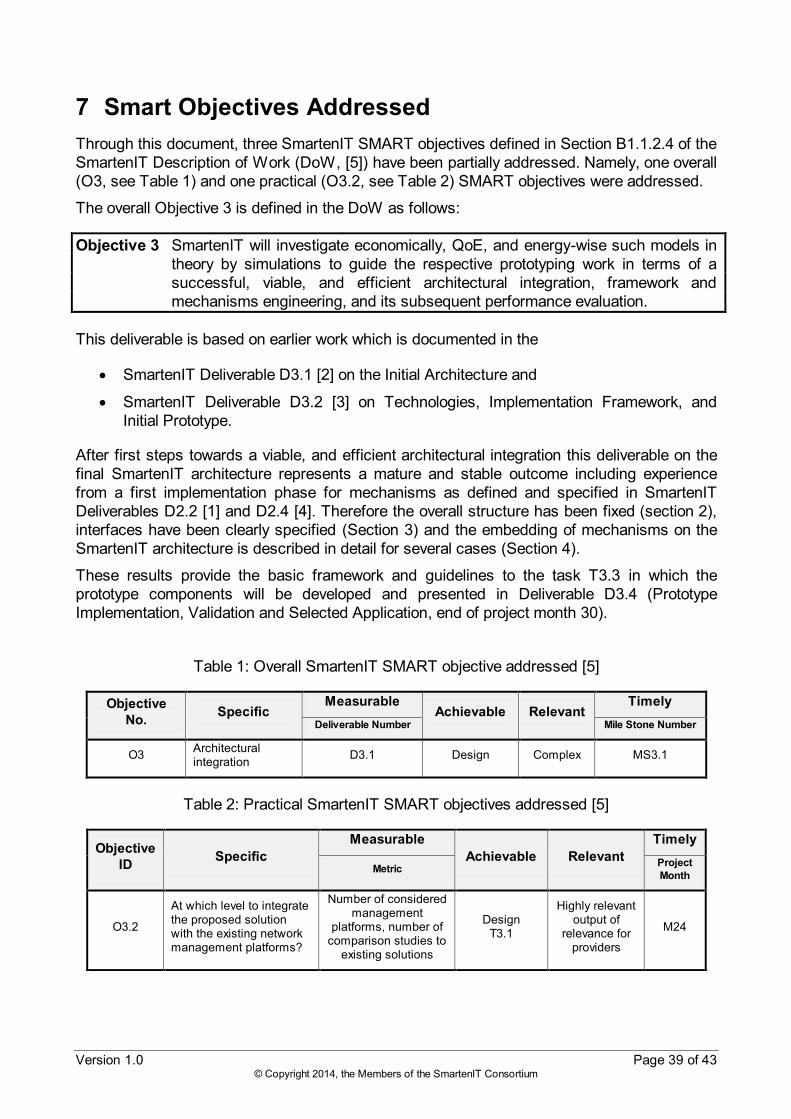
Version 1.0 Page 39 of 43 © Copyright 2014, the Members of the SmartenIT Consortium
7 Smart Objectives Addressed
Through this document, three SmartenIT SMART objectives defined in Section B1.1.2.4 of the
SmartenIT Description of Work (DoW, [5]) have been partially addressed. Namely, one overall
(O3, see Table 1) and one practical (O3.2, see Table 2) SMART objectives were addressed.
The overall Objective 3 is defined in the DoW as follows:
Objective 3 SmartenIT will investigate economically, QoE, and energy-wise such models in
theory by simulations to guide the respective prototyping work in terms of a
successful, viable, and efficient architectural integration, framework and
mechanisms engineering, and its subsequent performance evaluation.
This deliverable is based on earlier work which is documented in the
SmartenIT Deliverable D3.1 [2] on the Initial Architecture and
SmartenIT Deliverable D3.2 [3] on Technologies, Implementation Framework, and
Initial Prototype.
After first steps towards a viable, and efficient architectural integration this deliverable on the
final SmartenIT architecture represents a mature and stable outcome including experience
from a first implementation phase for mechanisms as defined and specified in SmartenIT
Deliverables D2.2 [1] and D2.4 [4]. Therefore the overall structure has been fixed (section 2),
interfaces have been clearly specified (Section 3) and the embedding of mechanisms on the
SmartenIT architecture is described in detail for several cases (Section 4).
These results provide the basic framework and guidelines to the task T3.3 in which the
prototype components will be developed and presented in Deliverable D3.4 (Prototype
Implementation, Validation and Selected Application, end of project month 30).
Table 1: Overall SmartenIT SMART objective addressed [5]
Objective
No. Specific
Measurable Achievable Relevant
Timely
Deliverable Number Mile Stone Number
O3 Architectural integration
D3.1 Design Complex MS3.1
Table 2: Practical SmartenIT SMART objectives addressed [5]
Objective
ID Specific
Measurable
Achievable Relevant
Timely
Metric Project
Month
O3.2
At which level to integrate the proposed solution with the existing network management platforms?
Number of considered management
platforms, number of comparison studies to
existing solutions
Design T3.1
Highly relevant output of
relevance for providers
M24
D3.3 – Final Architecture Seventh Framework STREP No. 317846
Public
Page 40 of 43 Version 1.0 © Copyright 2014, the Members of the SmartenIT Consortium
This deliverable provides a generic structure and is focusing on the integration of the
components and entities through clearly defined interfaces. It also considers the embedding of
mechanisms and their deployment scenarios as first steps towards a validation, which are
continuing in Task 3.5 on Integration of Prototype and Validation and in Work Package 4 on
Evaluations and Prototype. In this way this deliverable mainly contributes to the overall
objective O.3 of architectural integration and meets the objectives set within the SmartenIT
DoW.
The Objective O3.2: "At which level to integrate the proposed solution with the existing
network management platforms?" has already been addressed during the preparation phase
of the initial architecture design and is documented in Section 3 of SmartenIT Deliverable
D3.1. It will be addressed further in Task T3.2, which will perform the technology scouting and
define the implementation framework, as well as Task T3.3, which will develop the prototype
components.
Version 1.0 Page 41 of 43 © Copyright 2014, the Members of the SmartenIT Consortium
8 References
[1] V. Burger (Ed.): SmartenIT Deliverable D2.2: Report on Definitions of Traffic Management
Mechanisms and Initial Evaluation Results (2013) <www.smartenit.eu/publications>
[2] D. Hausheer, J. Rückert (Eds.): SmartenIT Deliverable D3.1: Report on initial system architecture
(2013) <www.smartenit.eu/publications>
[3] G. Petropoulos (Ed.): SmartenIT Deliverable D3.2: Technologies, Implementation Framework, and
Initial Prototype <www.smartenit.eu/publications>
[4] I. Papafili, G.D. Stamoulis (Eds.): SmartenIT Deliverable D2.4: Report on Final Specifications of Traffic
Management Mechanisms and Evaluation Results (2014) <www.smartenit.eu/publications>
[5] The SmartenIT Consortium, Grant Agreement for STREP: Annex I – Description of Work (DoW) (2012)
[6] R. Alimi et al.: Application-Layer Traffic Optimization (ALTO) Protocol, RFC 7285, Standards Track
Document of the Internet Engineering Task Force (IETF) (2014)
[7] Z. Dulinski, R. Stankiewicz, P. Cholda, P. Wydrych and B. Stiller, Inter-ALTO communication protocol,
IETF Draft draft-dulinski-alto-inter-alto-protocol-00.txt (2010)
[8] Z. Dulinski, P. Wydrych and R. Stankiewicz, Inter-ALTO communication problem statement, IETF
Draft draft-dulinski-alto-inter-problem-statement-01.txt (2011)
D3.3 – Final Architecture Seventh Framework STREP No. 317846
Public
Page 42 of 43 Version 1.0 © Copyright 2014, the Members of the SmartenIT Consortium
9 Abbreviations
ABR Area Boundary Router
AEP(G) Application End Point (Gathering)
ALTO Application Layer Traffic Optimization,
Working group of the Internet Engineering Task Force
API Application Interface
AS Autonomous System
ASBR Autonomous System Boundary Router
BG(P) Border Gateway (Protocol)
CTM Cloud Traffic Manager *
D2D Device to Device
DA Data Center Attachment
DB Data Base
DC Data Center **
EA Energy Analyzer *
EM Energy Monitor *
EUE End User Entity **
GGSN Gateway GPRS Support Node,
GPS Global Positioning System
GPRS General Packet Radio Service
ISCS Inter S-Box Communication Server
ISP Internet Service Provider
JSON JavaScript Object Notation
MACAO Multi Access and Cost ALTO
MIB Management Information Base
MCC Mobile Connectivity Controller *
MPLS Multiprotocol Label Switching
MRA Multi-Resource Allocation
MUCAPS MUlti-Criteria Application endPoint Selection
NA Network Analyzer *
NE Network Entity **
NaDa Nano Data Center **
NTM (Fixed/Mobile) Network Traffic Manager *
OM Overlay Manager *
OS Open Source, Open Stack or Operating System
OSN Online Social Network
Version 1.0 Page 43 of 43 © Copyright 2014, the Members of the SmartenIT Consortium
OSPF Open Shortest Path First
PoP Point of Presence
RTT Round Trip Time
QA QoS/QoE Analyzer *
QoE Quality of Experience
QoEM QoE Monitor *
QoS Quality of Service
QoSM QoS Monitor *
REST Representational State Transfer
S-Box SmartenIT Box **
SA Social Analyzer *
SDN Software Defined Networks
SDNC SDN Controller *
SGSN Serving GPRS Support Node
SF Switching/Forwarding component *
SLA Service Level Agreement
SmartenIT Socially-aware Management of New Overlay Application Traffic with Energy
Efficiency in the Internet, EU STREP (Specific Targeted Research Project)
SM Social Monitor *
SNMP Simple Network Management Protocol
TCP Transmission Control Protocol
TPM Topology-/Proximity Monitor *
UI User Interface
uNaDa User controlled Nano Data Center **
VIS Vector Information Service
VM Virtual Machine ______________________________________________
* SmartenIT component
** SmartenIT entity
10 Acknowledgements
This deliverable was made possible due to the large and open help of the WP3 team of the
SmartenIT team within this STREP. Many thanks to all of them, especially to the internal
reviewers Michael Seufert, Roman Łapacz, Sergios Soursos and Burkhard Stiller as well as
the members of the SmartenIT advisory board.