degree and certificate completion … state... · this degree and certificate completion report...
TRANSCRIPT
Minnesota State is an affirmative action, equal opportunity employer and educator.
January 15, 2018
Academic and Student Affairs
DEGREE AND CERTIFICATE COMPLETION REPORT TO THE LEGISLATURE
Minnesota State
CONTENTS
EXECUTIVE SUMMARY ............................................................................................................. 3Completion Goals and Plan .............................................................................................................. 3Developmental Education ................................................................................................................ 4Opportunity Gaps and Equity ........................................................................................................... 4Minnesota State Completion Measures ........................................................................................... 5
BACKGROUND ......................................................................................................................... 9Legislation ....................................................................................................................................... 9
MINNESOTA STATE DEGREE COMPLETION AND DEVELOPMENTAL EDUCATION .................... 10Completion Goals .......................................................................................................................... 10
Challenges of Degree/Certificate Completion ................................................................................... 10 Ongoing Completion Efforts and Completion Plan ............................................................................ 11
Developmental Education .............................................................................................................. 12Challenges of College Readiness and Developmental Education ...................................................... 13 Ongoing Innovations and Developmental Education Plan ................................................................. 14
Opportunity Gaps and Equity ......................................................................................................... 15
MINNESOTA STATE COMPLETION MEASURES ....................................................................... 17Students, Measures, Disaggregations and Data Suppression .......................................................... 17
Students Reported ............................................................................................................................. 17 Measures ............................................................................................................................................ 17 Disaggregations .................................................................................................................................. 19 Data Suppression................................................................................................................................ 20
Completion Measures .................................................................................................................... 20Developmental Education Enrollment Rate ....................................................................................... 20 Developmental Education Completion Rate ...................................................................................... 22 College Level Course Completion Rate .............................................................................................. 24 Credit Completion Rate ...................................................................................................................... 26 Student Persistence and Completion Rate ........................................................................................ 27 Completion Rate ................................................................................................................................. 28 Credits Earned at Graduation ............................................................................................................. 29
CONCLUSIONS ....................................................................................................................... 32
REFERENCES .......................................................................................................................... 36
APPENDIX A: RELATED LEGISLATION ...................................................................................... 382015 Minnesota Session Law Chapter 69, Senate File 5, Article 3, Section 23 ................................. 382017 Minnesota Session Law Chapter 89, Article 2, Section 25 ....................................................... 39
APPENDIX B: Completion Measure Report by College and University .................................... 40
2
LIST OF TABLES
Table 1: Fall Entering Undergraduate Degree and Certificate‐Seeking Students………………….. 17 Table 2: Measures and Definitions ………………..………………..………………..………………..……………… 18 Table 3: Fall Entering Students That Took Developmental Courses………………..……………………. 21 Table 4: Developmental Education Enrollment Rate by Subject………………..…………………………. 21 Table 5: Developmental Education Enrollment Rate by Student Group………………..……………… 22 Table 6: Developmental Education Completion Rate by Subject………………..………………………… 23 Table 7: Developmental Education Completion Rate by Student Group and Subject……………. 24 Table 8: College Level Course Completion Rate by Subject………………..………………..………………. 24 Table 9: College Level Course Completion Rate by Student Group and Subject……………………. 25 Table 10: Twenty and Thirty Credit Completion Rates………………..………………..……………………… 26 Table 11: Twenty and Thirty Credit Completion Rates by Student Group…………………………….. 27 Table 12: Second Fall Persistence and Completion Rate by Student Group………………………….. 28 Table 13: Completion Rate by Sector and Student Group………………..………………..…………….…… 29 Table 14: Average Credits Earned at Graduation by Award and Student Group……………….…… 30
3
EXECUTIVE SUMMARY
The Minnesota legislature has passed three pieces of legislature relating to completion and developmental education. They include:
Completion Plan: The 2015 Minnesota legislature passed legislation related to degree completion and the Minnesota State Colleges and Universities (Minnesota State) submitted a report in January 15, 2016 that detailed the system’s plan to encourage and assist students to complete credentials.
Completion Measures: The 2015 Higher Education Appropriations Act (2015 Minnesota Session Law, Chapter 3, Article 3, Section 16) requires the Minnesota State Board of Trustees, beginning in January of 2018, to submit a report on its activities and achievements related to improving timely completion, including seven completion measures.
Developmental Education Plan: The 2017 Minnesota legislature passed legislation that required the Minnesota State Board of Trustees to prepare a plan that reforms developmental education offerings and the Developmental Education Plan report will be submitted to the legislature by February 15, 2018.
This Degree and Certificate Completion report meets the second requirement and includes reporting of the seven completion measures. It also serves as a supplement to the 2016 College Completion Plan report and the upcoming 2018 Developmental Education Plan report.
Completion Goals and Plan One of the core commitments of the 37 colleges and universities of Minnesota State is providing access to higher education for all Minnesotans. The system has been very successful in providing this access, while acknowledging that there is still work to be done. Nonetheless, many students leave our colleges and universities without earning a credential. Degree and certificate completion is important not only for the individual student and his or her family, but also for the state to meet its talent needs. Minnesota State has implemented a number of efforts to improve completion rates.
While Minnesota State is committed to improving degree and certificate completion rates, we recognize that there are several challenges as we seek to assist more students in reaching their educational goals in a timely manner. The challenges include Minnesota State’s open door mission, college affordability and the states’ low unemployment rate. The system’s open access mission means that it enrolls substantial numbers of students who face financial and academic challenges that are associated with lower rates of college completion. Minnesota State has been actively working to improve completion rates through a variety of initiatives that have demonstrated promising outcomes. The initiatives include systemwide and local partnerships with K‐12 school district associations, adult basic education, business and industries, and non‐profit organizations, as well as a variety of campus based initiatives. The system’s completion plan capitalizes on the initiatives that are demonstrating success while
4
promoting practices and policies that have been shown to have a positive impact on completion.
Developmental Education Since many of our students come to college with readiness gaps, they require additional academic preparation to be successful in college. Minnesota State colleges and universities offer developmental education including precollege‐level courses in reading, writing, mathematics, and English for Speakers of Other Languages (ESOL), as well as academic support services and interventions designed to develop students’ skills and prepare them for college‐level coursework. Throughout this report, the term “developmental education”, rather than “remedial education”, is used because it is a broader term that encompasses coursework and support services. The Minnesota State system is the primary provider of developmental education in the state. While the system is committed to meeting students where they are in terms of their level of academic preparation and helping them to achieve their educational goals, the challenges of open admissions policies, assessment testing and course placement, traditional developmental education curriculum, and need to examine students holistically impact our developmental education programs. Most Minnesota State institutions are currently implementing innovations in developmental education to increase student retention, persistence and completion rates. The Minnesota State Colleges and Universities have created a Developmental Education Strategic Roadmap (DESR) to guide our systemwide work on developmental education redesign with clearly identified strategic goals, key action steps, targeted timelines for implementation, and measureable outcomes. The details of the developmental education plan will be outlined in the 2018 Developmental Education Plan report.
Opportunity Gaps and Equity
National, state, and Minnesota State data show the opportunity gaps that exist between underrepresented and majority students in higher education. Minnesota State is deeply committed to addressing the gaps evident in our colleges and universities. Our data show that gaps are evident and persistent by race and ethnicity and by income. There are gaps between Students of Color and American Indian students in comparison to white and nonresident alien students and between students who are Pell eligible in comparison to students who are not Pell eligible. Students of Color and American Indian students are compared throughout this report to white students and nonresident alien students. The nonresident alien category consists primarily of international students and students who are not permanent residents of the United States. Federal, state and system reporting standards specify that these students should not be included in a racial‐ethnic group, but rather reported as nonresident students.
5
Since addressing the opportunity gaps is a key priority for Minnesota State, the system has been collecting and reporting data with disaggregations by student demographics. Minnesota State colleges and universities and the system office have been engaging in collective discussions, strategic planning, and implementation of evidence‐based policies, programs and practices toward eliminating the gaps. These discussions, strategic planning, and implementations have also occurred in our developmental education work and redesign.
Minnesota State Completion Measures The completion measures presented in this report were generated from a longitudinal analysis of fall entering undergraduate degree and certificate seeking students. The student records used to prepare the completion measures are classified as private educational data under both the U. S. Family Education Rights and Privacy Act (FERPA) and the Minnesota Government Data Practices Act (MGDPA) and consequently, may not be disclosed. The prohibition on disclosure extends to summary data prepared from the student records when the number of students reported is small and it may be possible to identify individual students. Data suppression was used to minimize the risk of disclosing data about individual students. Summaries of key points on each of the seven legislative completion measures are presented, including system level trends for each measure. For each measure, descriptions of any differences between Students of Color and American Indian students compared to white students and nonresident students and differences between Pell grant eligible students and students who are not eligible for Pell grants are also included. The Minnesota State Colleges and Universities have made substantial progress on all seven of the completion measures presented in this report. The key points of progress on each measure include:
Developmental Education Enrollment Rate:
The number of fall entering undergraduate degree and certificate seeking students that took developmental courses during their first two years decreased by 37.5 percent between Fall 2009 and Fall 2015.
The percent of undergraduate students enrolled in developmental courses in their first two years decreased from 41.8 percent to 33.0 percent between Fall 2009 and Fall 2015.
The percentage of Students of Color and American Indian students that took developmental courses decreased by 9.4 percent and the percent of Pell grant eligible students that took developmental courses also decreased by 9.8 percent since Fall 2009, but both groups had higher developmental course taking rates relative to their comparison groups of white and nonresident students and students who are not eligible for Pell grants.
Much of this developmental education enrollment decline is due to the curricular and support innovations that have been implemented across our campuses. It is anticipated that with the implementation of the DESR, Minnesota State will see continued enrollment declines in developmental education courses.
6
Developmental Completion Rate:
The percent of students completing developmental education requirements in their first year increased in math, reading and writing between Fall 2009 and Fall 2015.
The percentage of Students of Color and American Indian students that completed their developmental courses in the first year has increased in all three subjects since Fall 2009, but they had lower course completion rates relative to white and nonresident students.
The gaps between Students of Color and American Indian students relative to white and nonresident students in course completion decreased in developmental math and reading courses.
The percentage of Pell grant eligible students that completed their developmental courses in the first year has increased in all three subjects and the gap with students who were not eligible decreased in math and reading courses.
Across Minnesota State campuses, faculty members, departments, and academic and student
affairs divisions have been innovating both in and out of the classroom to support students
enrolled in developmental education. As campuses improve, scale, and/or add new innovative
practices and programs across campuses, it is anticipated that there will be additional increases
of student completion of developmental education courses in their first year.
College Level Course Completion Rate:
The percent of students completing a college level math course or a college level writing course in their first year increased between Fall 2009 and Fall 2015.
The percentage of Students of Color and American Indian students and of Pell grant eligible students that completed a college level course in their first year has increased in both subjects since Fall 2009, but both groups had lower college level course completion rates relative to their comparison groups of white and nonresident students and of students who are not eligible for Pell grants.
The gap between Students of Color and American Indian students as compared to white and nonresident students in completion of college level writing decreased substantially between Fall 2009 and Fall 2015.
As innovations in developmental education and college‐level gateway courses have been underway across Minnesota State colleges and universities, the impact of these innovations is seen in increased student completion of college‐level mathematics and writing courses. The increases in college‐level course completion rates for Students of Color and American Indian students and for Pell eligible students also reflect the innovations in curricular and student supports that have been implemented at Minnesota State campuses.
Credit Completion Rate
The percent of students that completed 20 and 30 semester credits during their first year increased between Fall 2009 and Fall 2016.
The percentage of Students of Color and American Indian students that earned twenty credits in their first year increased more than it did for white and nonresident students between Fall 2009 and Fall 2016, reducing the gap between the two groups.
7
Since less than one‐third of Minnesota State degree and certificate seeking students take 15 credits each semester, the percentage of students completing 20 credits during the first year has been much higher than the percentage that completed 30 credits. Many of our students have work and family commitments which impact their ability to take a full course load each semester.
Student Persistence and Completion Rate
The second fall persistence rate decreased during the recession and has increased by 2.1 percent since the low for Fall 2012 entering students.
The persistence rate for Students of Color and American Indian students has increased by 3.2 percent since the low for Fall 2010 entering students, but are lower than the rates for white and nonresident students.
Student success (i.e., persistence and completion rate and completion rate) is the primary focus of all Minnesota State colleges and universities. Minnesota State campuses has been actively working to improve completion rates through a variety of initiatives that have demonstrated promising outcomes. In addition to expanding evidence‐based programs, practices, and initiatives, campuses are focusing on increasing students’ engagement and their sense of belonging and creating positive campus climates.
Completion Rate
The state college completion rate decreased during the recession and has increased by 2.8 percent since the low for Fall 2011 entering students.
The state college completion rates for Students of Color and American Indian students and for Pell eligible students also has increased, but are lower than the rates for comparison groups of white and nonresident students and students who are not eligible for a Pell grant.
The completion rate for the state universities increased for entering students between Fall 2009 and Fall 2011.
Completion rates for Students of Color and American Indian students at the state universities are lower than the completion rates for white and nonresident students and have decreased between Fall 2009 and Fall 2011.
The completion rates for Pell eligible students at the state universities also decreased between Fall 2009 and Fall 2011 and were lower than the rate for students who are not Pell eligible.
Degree and certificate completion continues to be an imperative and constant agenda and a primary commitment of Minnesota State. In addition, eliminating the opportunity gaps between Student of Color and American Indian completion rates and white and nonresident student completion rates, as well as eliminating the gaps between Pell eligible students and students who are not Pell eligible, is one of the most important priorities of Minnesota State.
Credits Earned at Graduation
The average cumulative credits at graduation has decreased for certificate, and associate and bachelor’s degrees graduates.
There are no gaps between underrepresented students and majority students in the credits at graduation measure.
8
Students of Color and American Indian students and Pell eligible students who earn Minnesota State certificates or degrees complete with similar or fewer credits than students in their comparison groups of white and nonresident students and students who are not Pell eligible.
The goal is to reduce the number of credits that students need to complete a certificate or degree. The declining number of credits at graduation reflects credit caps that Minnesota State has implemented for the vast majority of its programs during the last decade. There are many factors that impact cumulative credits at graduation including students taking additional courses due to interest or changing their major and having to meet new major or degree program requirements.
9
BACKGROUND
Legislation
The Minnesota legislature has passed three pieces of legislature relating to completion and developmental education. They include: The 2015 Minnesota legislature passed legislation to address completion rates for all Minnesota’s public colleges and universities (see Appendix A). Minnesota State submitted a report in January 15, 2016 that detailed the system’s comprehensive plan to encourage students to complete degrees, diplomas, or certificates in their chosen field of study. This 2016 College Completion Plan report can be accessed at https://www.leg.state.mn.us/docs/2016/mandated/160011.pdf. The 2015 Higher Education Appropriations Act (2015 Minnesota Session Law, Chapter 69, Article 3, Section 16) includes the following language: Beginning in 2018, the Board (of Trustees), report to the chairs and ranking minority members of the legislature with primary jurisdiction over higher education on its activities and achievements related to the goal of improving timely completion of degrees and certificates. The report must, at a minimum, include for the previous academic year: (1) the percent of students placed in remedial education; (2) the percent of students who complete remediation within one academic year; (3) the percent of students that complete college‐level gateway courses in one academic year; (4) the percent of students who complete 30 semester credits per academic year; (5) the student retention rate; (6) time to complete a degree or certificate; and (7) credits earned by those completing a degree or certificate or other program. The report must disaggregate data for each college and university by race and ethnicity, Pell Grant eligibility, and age and provide aggregate data. The 2017 Minnesota legislature passed legislation that required the Board of Trustees of Minnesota State to prepare a plan that reforms developmental education offerings at system campuses aimed at reducing the number of students placed into developmental education (see Appendix A). The Developmental Education Plan report will be submitted to the Minnesota legislature by February 15, 2018. This Degree and Certificate Completion report meets the second requirement and includes comprehensive reporting and discussion of the seven completion measures. It also serves as a supplement to the 2016 College Completion Plan and the upcoming 2018 Developmental Education Plan report but does not provide the detailed context that are included in those two reports. Appendix B of this report presents data on the seven measures that are disaggregated for each college and university and by race, ethnicity, Pell Grant eligibility, and age. Trends for up to five years are reported for the measures.
10
MINNESOTA STATE DEGREE COMPLETION AND DEVELOPMENTAL EDUCATION
Completion Goals
One of the core commitments of the 37 colleges and universities of Minnesota State is providing access to higher education for all Minnesotans. As stated in the 2016 College Completion Plan, Minnesota State has been very successful in providing this access, with acknowledgement that there is still work to be done. In fiscal year 2017, over 370,000 students enrolled at Minnesota State College and University campuses in both credit and non‐credit courses. Minnesota State institutions continue to be the first choice in higher education for the majority of Minnesotans and especially students of color, low‐income students, adult learners, and those pursuing technical careers. Minnesota State educates more college graduates than any other provider of higher education in the state, and its graduates include the majority of the state’s K‐12 school teachers, law enforcement professionals, and healthcare professionals. Although Minnesota State continues to provide widespread access to higher education, there is also recognition that many students leave the colleges and universities without earning a credential. Approximately half of degree and certificate seeking students in the Minnesota State system (53.5% at the colleges and 53.7% at the universities) complete a credential and/or transfer within the 150 percent benchmark timeframe of three years for an associate degree and six years for a bachelor’s degree. The lack of a credential has significant negative consequences for the student, the college that enrolled him or her, and our economy (Bill and Melinda Gates Foundation, 2015). Degree and certificate attainment increases average earnings over the course of a lifetime, decreases likelihood of unemployment, and increases contributions to communities and our society (Trostel, 2015; U.S. Department of Education, 2015). Current estimates indicate that 74% of the jobs in Minnesota will require some postsecondary education by 2020 (Georgetown University, 2014). Thus degree and certificate completion is important not only for the individual student and his or her family, but also for the state to meet its talent needs. With a commitment to providing access and degree attainment, Minnesota State has implemented efforts to improve completion rates, at every level of award from certificates and diplomas to associate, bachelors and graduate degrees.
Challenges of Degree and Certificate Completion While Minnesota State is committed to improving degree and certificate completion rates, we recognize that there are several challenges as we seek to assist more students in reaching their educational goals in a timely manner. National trends and the existing literature indicate that these challenges are not unique to Minnesota, but are significant factors across all institutions that must be addressed in order for a comprehensive completion plan to be successful.
11
A detailed discussion of these challenges can be found in the 2016 Degree Completion Plan and are summarized briefly here:
Open Door Mission: Minnesota State’s mission as the public‐serving post‐secondary education system for the state of Minnesota plays a critical role in this context. Minnesota State colleges have open admission policies and admit all students with a high school diploma, regardless of academic preparation levels, which results in attracting students with a broad range of preparedness. Consequently, Minnesota State institutions enroll many students who are not prepared to succeed at the college level. Thirty‐one percent of Minnesota high school graduates who took the ACT in 2017 had a college ready score (ACT, 2017).
Affordability: The cost of obtaining a college credential continues to be a barrier for many students. Thirty‐one percent of Minnesota State students were Pell grant eligible in 2017. Fully 57 percent of our students received some form of financial aid in 2017. In addition, the majority of Minnesota State graduates complete their credentials with some modest debt.
Low Unemployment: Finally, the comparative strength of Minnesota’s economy and lower than average unemployment rates is good news for the state but a challenge to increasing college completion rates. Given that many Minnesota State students are working adults, many with families, the ability to find gainful employment can mean that they will opt to take fewer credit hours or stop‐out entirely because they have found a job.
The access and inclusiveness that Minnesota State provides to Minnesota residents means that we enroll a substantial population of students who face financial and academic challenges that lead to lower rates of college completion. Current data indicate that among the Minnesota State student population:
Thirty‐one percent are Pell grant eligible, a rate that has increased from 24 percent 10 years ago;
Fifty‐two percent of students are enrolled on a part‐time basis in Fall 2016, up from 44 percent in Fall 2007;
The average age of our students is 26 and 38 percent are age 25 or older;
Over half of our students (54 percent) are first‐generation by the federal definition that the student’s parents have not earned a bachelor’s degree;
Twenty‐six percent of our students are American Indian or Students of Color, up from 17 percent in 2008;
Forty‐nine percent are from underrepresented groups, including students of color or American Indian students, first generation students, and/or low income students;
Over 9,000 students seek educational accommodations related to a physical or cognitive disability.
Ongoing Completion Efforts and Completion Plan Minnesota State has been actively working to improve completion rates through a variety of initiatives that demonstrate promising outcomes. Initiatives include a variety of campus‐based activities and systemwide and local partnerships with K‐12 school district associations, adult basic education, business and industries, and non‐profit organizations. A summary list of
12
ongoing completion efforts is provided in the 2016 Degree Completion Plan. Examples include, learning communities, emergency grant programs, early alerts systems, advising programs, first‐year‐experience courses, cohort models, grants to parenting students, and intrusive support services. Minnesota State’s comprehensive completion plan capitalizes on the initiatives that are already demonstrating success while also promoting practices and policies that have been shown on a national level to have a positive impact on completion rates.
Developmental Education
Since many students arrive to college with readiness gaps, they require more academic preparation to be successful in their college‐level gateway courses and academic programs. Minnesota State colleges and universities offer developmental education to support the success of these students by delivering pre‐collegiate courses and providing a variety of optional and/or mandatory student support services. Given that academic preparation is a significant predictor of persistence and completion, we must effectively bridge the gap between the academic readiness of our new entering students and the skills needed for college success. Developmental education serves as that critical bridge. Developmental education consists of precollege‐level courses in reading, writing, mathematics, and English for Speakers of Other Languages (ESOL), as well as academic support services and interventions, offered by postsecondary institutions designed to develop students’ skills and prepare them for college‐level coursework. Throughout this report, the term “developmental education”, rather than “remedial education”, is used because it is a broader term that encompasses precollege‐level coursework and other academic support services that prepare students for success in college. “Remedial education” or “remediation,” the term used in 2015 Minnesota Session Law, Chapter 3, Article 3, Section 16, can imply courses that repeat material taught earlier that the student did not learn adequately the first time. Although developmental education courses are offered for credit, the credits do not count toward the requirements of degrees, diplomas or certificates. Students who are eligible for need‐based financial aid can use that aid for developmental ESOL courses and for up to thirty credits of developmental reading, writing, and mathematics coursework. Although postsecondary institutions typically assess the academic readiness of new entering students for college level academic coursework, students can enroll in a variety of technical programs that do not require college‐level skills in reading, writing and/or math. Many students are able to graduate with postsecondary occupational certificates or diplomas and obtain a living wage job without taking developmental courses. Twenty‐six percent of Minnesota’s 2013 public high school graduates enrolled in one or more developmental courses within two years of graduating high school, as presented by the Getting Prepared 2016 report (Fergus, 2016). Across all Minnesota postsecondary institutions, the percent of recent high school graduates who enrolled in developmental education within two years of graduating has decreased from 29 to 26 percent between 2007 and 2013. As a result
13
of our colleges’ open door mission, Minnesota State Colleges and Universities enroll 97 percent of the public high school graduates that take developmental education courses within two years of graduating high school.
Challenges of College Readiness and Developmental Education While Minnesota State is committed to meeting students at their level of academic preparation and helping them to achieve their educational goals in a timely manner, there is acknowledgement that challenges persist. These challenges are consistent with national trends and the existing literature and many of them are currently being addressed by the system and campuses. Some of the challenges are significant and must be addressed systemically. A detailed discussion of these challenges can be found in the 2018 Developmental Education report and summarized briefly here:
Open Admissions: The open admissions policies of Minnesota State mean that many of the students admitted to our colleges and universities are not academically prepared for college and need options for developmental education. The type and availability of offerings of developmental education often reflect an institution’s student demographics and selectivity. Nationally, 80 percent of public colleges and 98 percent of community colleges offer developmental courses (Bettinger & Long, 2006).
Assessment Testing and Course Placement: Course placement practices have traditionally utilized single, high‐stake tests to identify students’ knowledge and skills in reading, writing and mathematics and to place them into college‐level or developmental‐level courses based on those levels of college readiness. There is concern that the use of a single placement test results in some students being placed into courses that are not well matched to their needs or academic abilities. Minnesota State is working to increase the accuracy and effectiveness of the course placement process by implementing a comprehensive multiple measures program that includes the use of more than one measure for placement, as well as full pre‐and post‐assessment processes.
Developmental Education Curriculum: Traditional developmental‐level curricula is offered in a sequential fashion in which students with the highest levels of under‐preparedness may enroll in two or three semesters of coursework before being able to take a college‐level course in the corresponding subject area. Studies have illustrated that the more courses students are required to take before beginning their college‐level coursework, the less likely they are to persist and complete. Minnesota State is working to implement multiple options for students that can include the traditional model and accelerated model(s) that addresses students’ needs and reduce the time to completion of developmental coursework
Holistic Students: When considering how to best support students, postsecondary institutions must address students holistically. In addition to academic knowledge and skills, factors that more often impact the college readiness of recent high school graduates are prior college‐knowledge and college‐going high school environments. In addition, factors that more often impact student persistence are outside of curricular factors, such as financial and college affordability, external commitments such as work and family obligations, and other factors such as health and poverty. Current efforts are focusing on
14
supporting students through a comprehensive and integrated academic and student support model.
Ongoing Innovations and Developmental Education Plan Most of Minnesota State institutions are currently implementing innovations in developmental education to increase student retention, persistence and completion rates. These innovations vary from institution to institution as programs are customized to meet the needs of students within their local context. Developmental education innovations have been implemented in the areas of reading, English, and mathematics. Reading: Ninety‐three percent of our campuses that offer reading curriculum have one or more innovations in place including:
Integrated reading and writing curriculum that provides students a more comprehensive learning of reading and writing.
Reading courses offered as paired courses or in learning communities, where a cohort of students take two or more courses to allow them to learn within a community, experience an integrated learning environment, and apply knowledge and learning across disciplines.
English: Eighty‐four percent of our campuses have implemented one or more innovations in their English curriculum. In addition to integrated reading and writing curriculum and learning communities or paired courses, campuses are offering:
Accelerated models designed to increase students’ progress through developmental education over a shorter period of time and include:
o Enrolling students immediately into college‐level courses while providing supplemental supports and co‐requisite models such as the Accelerated Learning Program (ALP) are being implemented by several campuses.
o Combining content from multiple developmental education levels into a single course in which students can complete within one semester.
o Compressing the course content over a shorter period of time, allowing students to complete two fast‐track or compressed courses within one semester.
Mathematics: Eighty‐six percent of our campuses have one or more mathematics innovations in place, including:
Accelerated models described in reading and English are also used in mathematics.
Multiple pathways in math provide different developmental course sequences for students pursuing different degree pathways. While one pathway may lead to college‐level courses in algebra, others focus on preparing students for statistics and/or quantitative reasoning.
Technical program mathematics requirements are tailored to needs of the program and may not require college‐level mathematics.
Wrap‐Around Strategies: Campuses have implemented wrap‐around academic and student support strategies that are critical to increasing the success of students in developmental education courses including:
15
Early alert systems,
Academic advising,
Academic support centers,
Tutors embedded into courses (supplemental academic instruction), and/or
Peer and professional tutoring. Developmental Education Roadmap: The Minnesota State Colleges and Universities have created a Developmental Education Strategic Roadmap (DESR) to guide our systemwide work on developmental education redesign. The DESR includes clearly identified strategic goals, key action steps, targeted timelines for implementation, and measureable outcomes. The Developmental Education Workgroup, comprised of Minnesota State faculty, staff, students, administrators, and system office leadership, led the creation of the DESR. The Workgroup has been reviewing and promoting national, systemwide, and campus efforts to redesign developmental education. In 2016‐2017, to advance the system’s collective work on developmental education redesign, the Workgroup developed a draft strategic roadmap. Campus stakeholders had opportunities to provide input on the draft DESR during 2017. The Minnesota State DESR was finalized in January 2018 and provides our redesign “roadmap” for the next four years. The details of the developmental education plan is outlined in the 2018 Developmental Education Plan report. The DESR includes the seven strategic goals:
Strategic Goal 1: Improve student completion of developmental education and entry into college‐level courses by redesigning developmental education curricula to include an acceleration option.
Strategic Goal 2: Improve the accuracy of course placement by implementing a multiple measures placement program at all colleges and universities.
Strategic Goal 3: Improve student success in developmental education by developing a comprehensive student support system for students in developmental education programs.
Strategic Goal 4: Increase college readiness of high school graduates attending Minnesota State campuses by partnering with secondary partners.
Strategic Goal 5: Increase college affordability for students by implementing student‐cost‐saving approaches.
Strategic Goal 6: Improve student success in developmental education by expanding and strengthening professional development for faculty, staff, and administrators.
Strategic Goal 7: Improve student success in developmental education by strengthening evaluation and continuous improvement efforts.
Opportunity Gaps and Equity
National, state, and Minnesota State data show the opportunity gaps that exist between underrepresented and majority students in higher education and Minnesota State deeply committed to addressing the gaps evident in our colleges and universities. Our data show that gaps are evident and persistent by race and ethnicity and by income, between Students of Color and American Indian students in comparison to white and nonresident students and
16
between students who are Pell eligible in comparison to students who are not Pell eligible. These gaps are illustrated in financial resources, as measured by median income of students and Pell‐Eligibility, and in academic preparation, as measured by student enrollment in developmental education courses and assessment test scores. The gaps also are evident in second fall persistence and completion rates and subsequent completion rates. Students of Color and American Indian students are compared throughout this report to white students and nonresident alien students. The nonresident alien category consists primarily of international students and students who are not permanent residents of the United States. Federal, state and system reporting standards specify that these students should not be included in a racial‐ethnic group, but rather reported as nonresident students. Since addressing the opportunity gaps is a key priority for Minnesota State, the system has been collecting and reporting data with disaggregations by student demographics. Minnesota State colleges and universities and the system office has been engaging in collective discussions, strategic planning, and implementation of evidence‐based policies, programs and practices toward eliminating the gaps. These discussions, strategic planning, and implementations have also occurred in our developmental education work and redesign. Systemwide strategies to close the opportunity gaps include:
Affordability: Addressing financial barriers by increasing need‐based scholarships, increasing the use of Open Education Resources, and committing to affordability in tuition and fees for students.
Academic Preparation: Addressing academic preparedness by redesigning developmental education, enhancing the course placement process, increasing summer bridge programs and other pre‐college experiences to ensure academic preparedness, and expanding our K‐12 partnerships to ensure more students graduate high school ready for college‐level coursework.
System Strategies: Other system strategies include: o Enhancing predictive analytics to identify what works to enable scaling of best
practices; o Supporting the work of faculty members who are taking measures to revise
curriculum and pedagogy; o Assessing and addressing campus climate; and o Strengthening non‐academic support services.
Campus Strategies: Many campuses have implemented additional policies, practices, and programs aimed to support the success of Students of Color, American Indian students and Pell eligible or low‐income students, as indicated in campus diversity and inclusion plans:
o Redesign first year experience for all students; o Deploy best practices on culturally responsive pedagogy; o Complete PACE climate survey and act upon the results; o Provide the Intercultural Development Inventory (IDI) and unconscious bias training
for search advisory committees; and o Provide professional development around equity and inclusion.
17
MINNESOTA STATE COMPLETION MEASURES
The 2015 Higher Education Appropriations Act requires Minnesota State to report data on seven completion measures for each college and university with disaggregations by race‐ethnicity, Pell grant eligibility and age. Trends are presented for each measure in order to illustrate any changes during the last several years. The detailed reports on the measures for each college and university with the disaggregations are presented in Appendix B.
Students, Measures, Disaggregations and Data Suppression
This section of the report describes the student population for whom the measures are reported, defines the measures, describes the measure disaggregations, and outlines the data suppression that was used in the detailed reports.
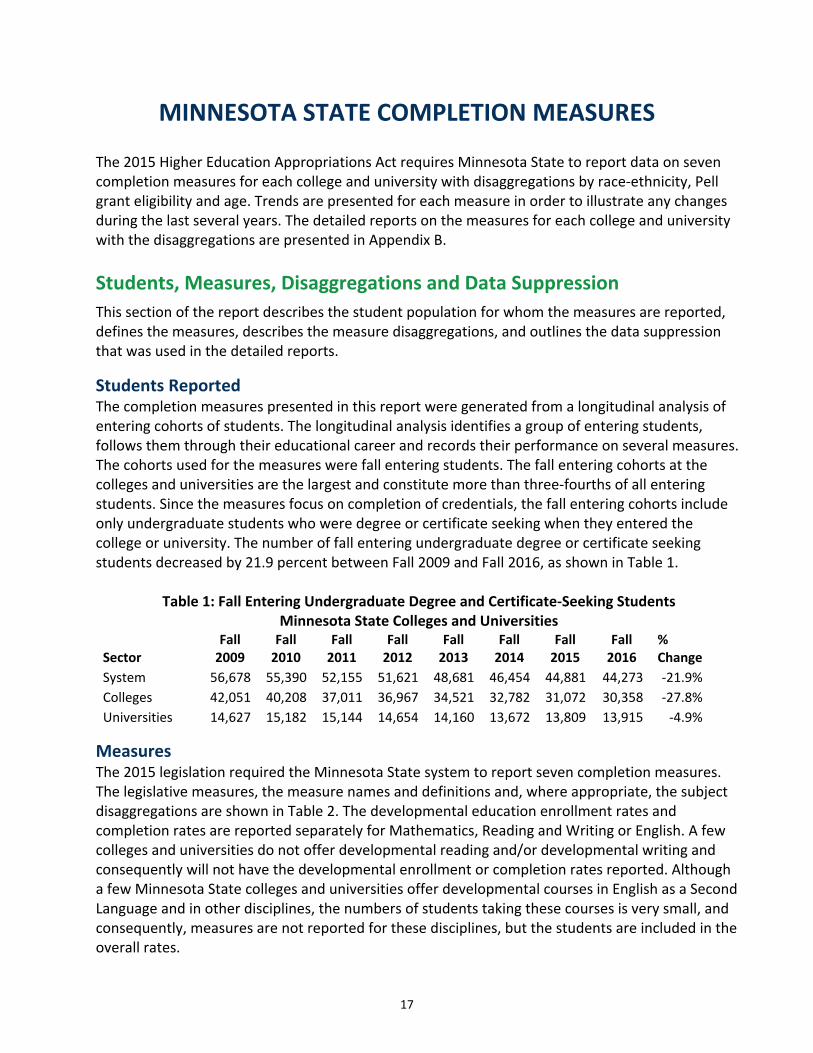
Students Reported The completion measures presented in this report were generated from a longitudinal analysis of entering cohorts of students. The longitudinal analysis identifies a group of entering students, follows them through their educational career and records their performance on several measures. The cohorts used for the measures were fall entering students. The fall entering cohorts at the colleges and universities are the largest and constitute more than three‐fourths of all entering students. Since the measures focus on completion of credentials, the fall entering cohorts include only undergraduate students who were degree or certificate seeking when they entered the college or university. The number of fall entering undergraduate degree or certificate seeking students decreased by 21.9 percent between Fall 2009 and Fall 2016, as shown in Table 1.
Table 1: Fall Entering Undergraduate Degree and Certificate‐Seeking Students Minnesota State Colleges and Universities
Sector Fall 2009
Fall 2010
Fall 2011
Fall 2012
Fall 2013
Fall 2014
Fall 2015
Fall 2016
% Change
System 56,678 55,390 52,155 51,621 48,681 46,454 44,881 44,273 ‐21.9%
Colleges 42,051 40,208 37,011 36,967 34,521 32,782 31,072 30,358 ‐27.8%
Universities 14,627 15,182 15,144 14,654 14,160 13,672 13,809 13,915 ‐4.9%
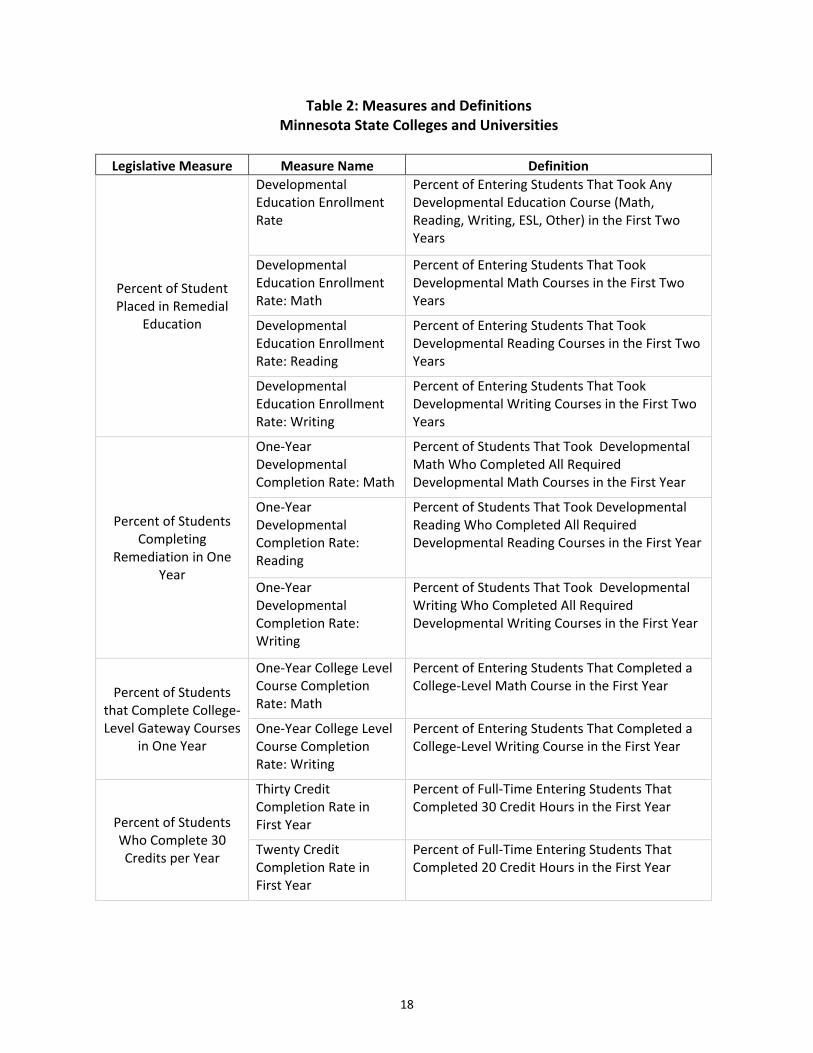
Measures The 2015 legislation required the Minnesota State system to report seven completion measures. The legislative measures, the measure names and definitions and, where appropriate, the subject disaggregations are shown in Table 2. The developmental education enrollment rates and completion rates are reported separately for Mathematics, Reading and Writing or English. A few colleges and universities do not offer developmental reading and/or developmental writing and consequently will not have the developmental enrollment or completion rates reported. Although a few Minnesota State colleges and universities offer developmental courses in English as a Second Language and in other disciplines, the numbers of students taking these courses is very small, and consequently, measures are not reported for these disciplines, but the students are included in the overall rates.
18
Table 2: Measures and Definitions Minnesota State Colleges and Universities
Legislative Measure Measure Name Definition
Percent of Student Placed in Remedial
Education
Developmental Education Enrollment Rate
Percent of Entering Students That Took Any Developmental Education Course (Math, Reading, Writing, ESL, Other) in the First Two Years
Developmental Education Enrollment Rate: Math
Percent of Entering Students That Took Developmental Math Courses in the First Two Years
Developmental Education Enrollment Rate: Reading
Percent of Entering Students That Took Developmental Reading Courses in the First Two Years
Developmental Education Enrollment Rate: Writing
Percent of Entering Students That Took Developmental Writing Courses in the First Two Years
Percent of Students Completing
Remediation in One Year
One‐Year Developmental Completion Rate: Math
Percent of Students That Took Developmental Math Who Completed All Required Developmental Math Courses in the First Year
One‐Year Developmental Completion Rate: Reading
Percent of Students That Took Developmental Reading Who Completed All Required Developmental Reading Courses in the First Year
One‐Year Developmental Completion Rate: Writing
Percent of Students That Took Developmental Writing Who Completed All Required Developmental Writing Courses in the First Year
Percent of Students that Complete College‐Level Gateway Courses
in One Year
One‐Year College Level Course Completion Rate: Math
Percent of Entering Students That Completed a College‐Level Math Course in the First Year
One‐Year College Level Course Completion Rate: Writing
Percent of Entering Students That Completed a College‐Level Writing Course in the First Year
Percent of Students Who Complete 30 Credits per Year
Thirty Credit Completion Rate in First Year
Percent of Full‐Time Entering Students That Completed 30 Credit Hours in the First Year
Twenty Credit Completion Rate in First Year
Percent of Full‐Time Entering Students That Completed 20 Credit Hours in the First Year
19
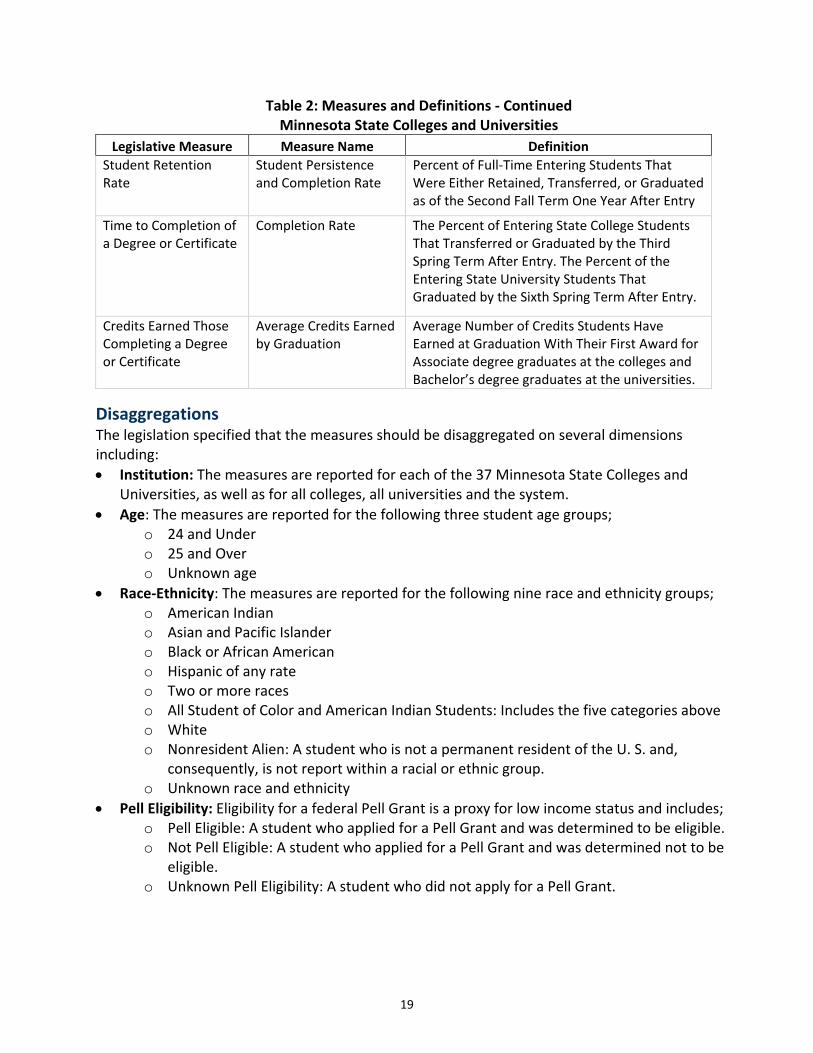
Table 2: Measures and Definitions ‐ Continued Minnesota State Colleges and Universities
Legislative Measure Measure Name Definition
Student Retention Rate
Student Persistence and Completion Rate
Percent of Full‐Time Entering Students That Were Either Retained, Transferred, or Graduated as of the Second Fall Term One Year After Entry
Time to Completion of a Degree or Certificate
Completion Rate The Percent of Entering State College Students That Transferred or Graduated by the Third Spring Term After Entry. The Percent of the Entering State University Students That Graduated by the Sixth Spring Term After Entry.
Credits Earned Those Completing a Degree or Certificate
Average Credits Earned by Graduation
Average Number of Credits Students Have Earned at Graduation With Their First Award for Associate degree graduates at the colleges and Bachelor’s degree graduates at the universities.
Disaggregations The legislation specified that the measures should be disaggregated on several dimensions including:
Institution: The measures are reported for each of the 37 Minnesota State Colleges and Universities, as well as for all colleges, all universities and the system.
Age: The measures are reported for the following three student age groups; o 24 and Under o 25 and Over o Unknown age
Race‐Ethnicity: The measures are reported for the following nine race and ethnicity groups; o American Indian o Asian and Pacific Islander o Black or African American o Hispanic of any rate o Two or more races o All Student of Color and American Indian Students: Includes the five categories above o White o Nonresident Alien: A student who is not a permanent resident of the U. S. and,
consequently, is not report within a racial or ethnic group. o Unknown race and ethnicity
Pell Eligibility: Eligibility for a federal Pell Grant is a proxy for low income status and includes; o Pell Eligible: A student who applied for a Pell Grant and was determined to be eligible. o Not Pell Eligible: A student who applied for a Pell Grant and was determined not to be
eligible. o Unknown Pell Eligibility: A student who did not apply for a Pell Grant.
20
Data Suppression The student records and data elements that were used to prepare the completion measures presented in this report are classified as private educational data under both the U. S. Family Education Rights and Privacy Act (FERPA) and the Minnesota Government Data Practices Act (MGDPA) and consequently, may not be disclosed. The prohibition on disclosure extends to summary data prepared from the student records when the number of students reported is small and it therefore may be possible to identify individual students from the summary data. Data suppression is a method used to minimize the risk of disclosing data about individual students. Suppression takes the form of removing data from cells rather than reporting the actual number of students. The goals of suppression are to ensure that reporting does not reveal, directly or indirectly, personally identifiable private data about an individual student and to ensure that cells are of sufficient size to yield statistically reliable information. The data suppression method used for the completion measures in this report is based on a technical brief published by the U. S. Department of Education in 2012 (NCES). The approach includes the following three components:
First‐Order: Suppress any numerator, denominator and rate where the denominator is less than 10 students.
Second‐Order: Suppress very high and low rates when the denominator is small enough or the rates are high or low enough to reveal something about all of the students in the cell.
Complementary: Suppress a second cell in the same column at the same institution and at another institution to prevent the calculation of the first suppressed cell.
Completion Measures
This section of the report presents data on each of the seven legislative completion measures. Each section describes the measure, presents system level trends in the measure, and describes any differences between Students of Color and American Indian students compared to white and nonresident alien students and differences between Pell grant eligible students and students who are not eligible for Pell grants.
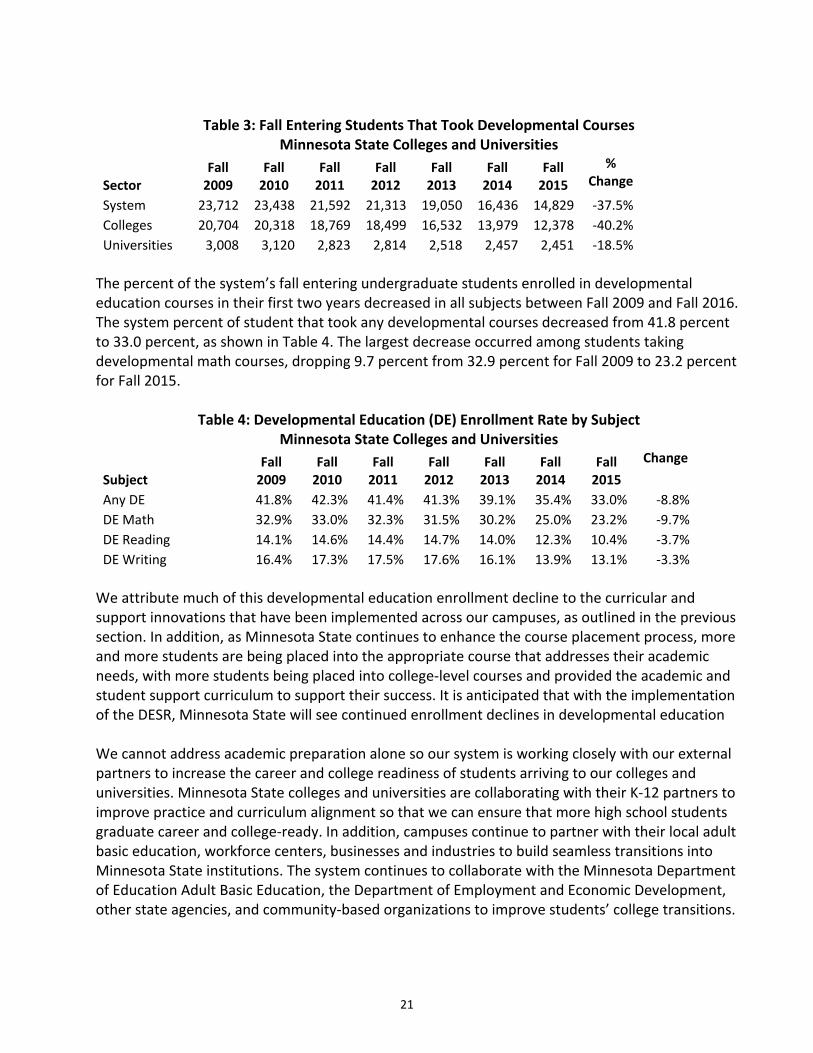
Developmental Education Enrollment Rate The developmental education enrollment rate was measured by student enrollment in one or more courses that are identified as developmental‐level during the first two years after entry. The developmental education enrollment rate is reported for full and part‐time fall entering undergraduate degree and certificate seeking students. The number of fall entering students that took developmental courses during their first two years decreased by 37.5 percent between Fall 2009 and Fall 2015, as shown in Table 3. The decrease at the colleges was 40.2 percent and at the universities was 18.5 percent. The total number of fall entering students taking developmental courses declined from 23,719 to 14,830.
21
Table 3: Fall Entering Students That Took Developmental Courses
Minnesota State Colleges and Universities
Sector Fall 2009
Fall 2010
Fall 2011
Fall 2012
Fall 2013
Fall 2014
Fall 2015
% Change
System 23,712 23,438 21,592 21,313 19,050 16,436 14,829 ‐37.5%
Colleges 20,704 20,318 18,769 18,499 16,532 13,979 12,378 ‐40.2%
Universities 3,008 3,120 2,823 2,814 2,518 2,457 2,451 ‐18.5%
The percent of the system’s fall entering undergraduate students enrolled in developmental education courses in their first two years decreased in all subjects between Fall 2009 and Fall 2016. The system percent of student that took any developmental courses decreased from 41.8 percent to 33.0 percent, as shown in Table 4. The largest decrease occurred among students taking developmental math courses, dropping 9.7 percent from 32.9 percent for Fall 2009 to 23.2 percent for Fall 2015.
Table 4: Developmental Education (DE) Enrollment Rate by Subject Minnesota State Colleges and Universities
Subject Fall 2009
Fall 2010
Fall 2011
Fall 2012
Fall 2013
Fall 2014
Fall 2015
Change
Any DE 41.8% 42.3% 41.4% 41.3% 39.1% 35.4% 33.0% ‐8.8%
DE Math 32.9% 33.0% 32.3% 31.5% 30.2% 25.0% 23.2% ‐9.7%
DE Reading 14.1% 14.6% 14.4% 14.7% 14.0% 12.3% 10.4% ‐3.7%
DE Writing 16.4% 17.3% 17.5% 17.6% 16.1% 13.9% 13.1% ‐3.3%
We attribute much of this developmental education enrollment decline to the curricular and support innovations that have been implemented across our campuses, as outlined in the previous section. In addition, as Minnesota State continues to enhance the course placement process, more and more students are being placed into the appropriate course that addresses their academic needs, with more students being placed into college‐level courses and provided the academic and student support curriculum to support their success. It is anticipated that with the implementation of the DESR, Minnesota State will see continued enrollment declines in developmental education We cannot address academic preparation alone so our system is working closely with our external partners to increase the career and college readiness of students arriving to our colleges and universities. Minnesota State colleges and universities are collaborating with their K‐12 partners to improve practice and curriculum alignment so that we can ensure that more high school students graduate career and college‐ready. In addition, campuses continue to partner with their local adult basic education, workforce centers, businesses and industries to build seamless transitions into Minnesota State institutions. The system continues to collaborate with the Minnesota Department of Education Adult Basic Education, the Department of Employment and Economic Development, other state agencies, and community‐based organizations to improve students’ college transitions.
22
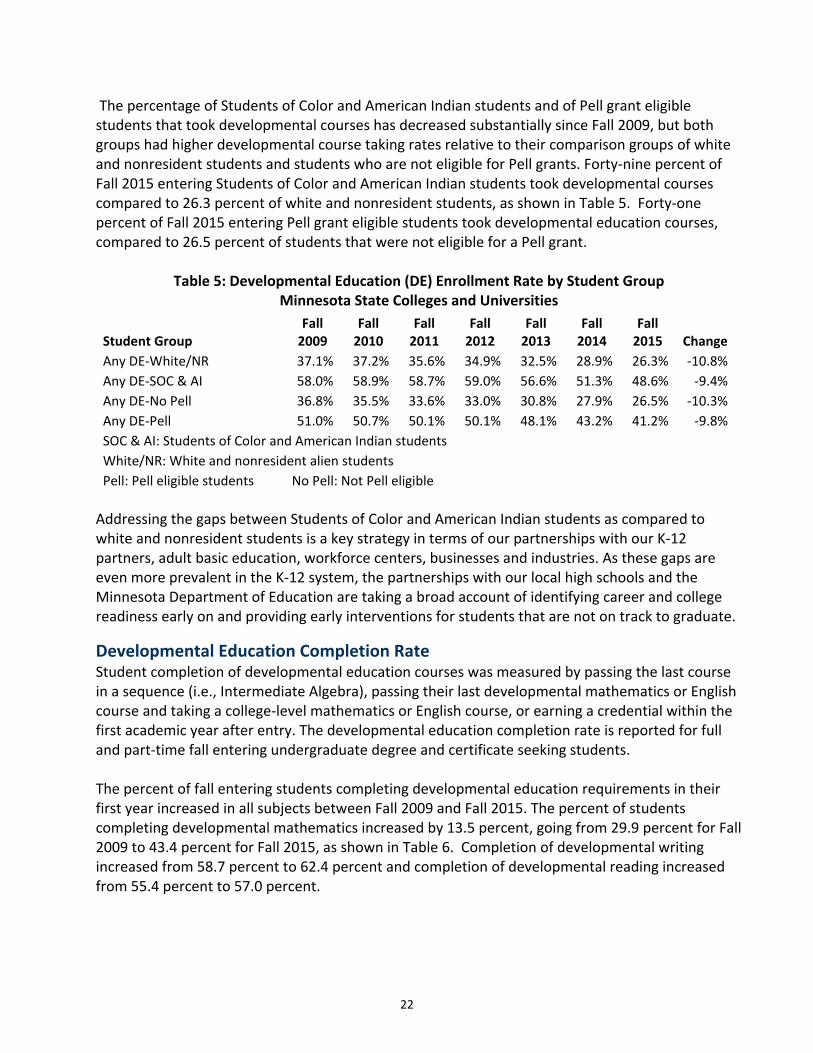
The percentage of Students of Color and American Indian students and of Pell grant eligible students that took developmental courses has decreased substantially since Fall 2009, but both groups had higher developmental course taking rates relative to their comparison groups of white and nonresident students and students who are not eligible for Pell grants. Forty‐nine percent of Fall 2015 entering Students of Color and American Indian students took developmental courses compared to 26.3 percent of white and nonresident students, as shown in Table 5. Forty‐one percent of Fall 2015 entering Pell grant eligible students took developmental education courses, compared to 26.5 percent of students that were not eligible for a Pell grant.
Table 5: Developmental Education (DE) Enrollment Rate by Student Group
Minnesota State Colleges and Universities
Student Group Fall 2009
Fall 2010
Fall 2011
Fall 2012
Fall 2013
Fall 2014
Fall 2015 Change
Any DE‐White/NR 37.1% 37.2% 35.6% 34.9% 32.5% 28.9% 26.3% ‐10.8%
Any DE‐SOC & AI 58.0% 58.9% 58.7% 59.0% 56.6% 51.3% 48.6% ‐9.4%
Any DE‐No Pell 36.8% 35.5% 33.6% 33.0% 30.8% 27.9% 26.5% ‐10.3%
Any DE‐Pell 51.0% 50.7% 50.1% 50.1% 48.1% 43.2% 41.2% ‐9.8%
SOC & AI: Students of Color and American Indian students White/NR: White and nonresident alien students Pell: Pell eligible students No Pell: Not Pell eligible Addressing the gaps between Students of Color and American Indian students as compared to white and nonresident students is a key strategy in terms of our partnerships with our K‐12 partners, adult basic education, workforce centers, businesses and industries. As these gaps are even more prevalent in the K‐12 system, the partnerships with our local high schools and the Minnesota Department of Education are taking a broad account of identifying career and college readiness early on and providing early interventions for students that are not on track to graduate.
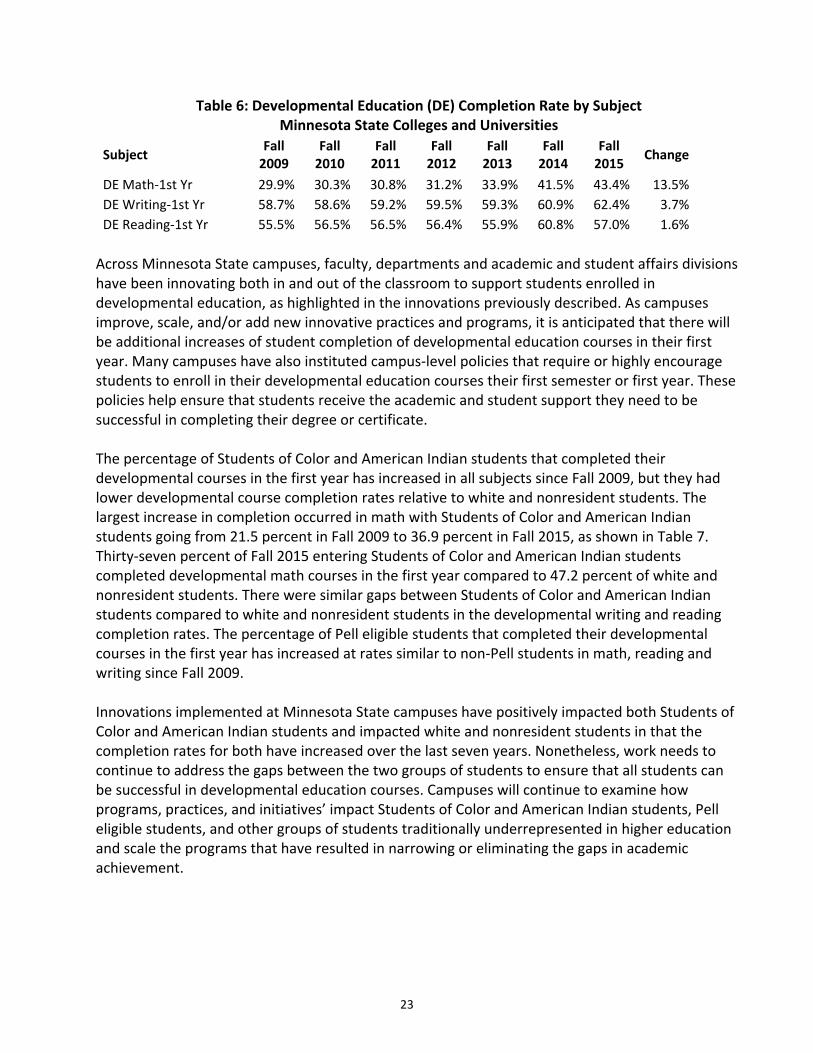
Developmental Education Completion Rate Student completion of developmental education courses was measured by passing the last course in a sequence (i.e., Intermediate Algebra), passing their last developmental mathematics or English course and taking a college‐level mathematics or English course, or earning a credential within the first academic year after entry. The developmental education completion rate is reported for full and part‐time fall entering undergraduate degree and certificate seeking students. The percent of fall entering students completing developmental education requirements in their first year increased in all subjects between Fall 2009 and Fall 2015. The percent of students completing developmental mathematics increased by 13.5 percent, going from 29.9 percent for Fall 2009 to 43.4 percent for Fall 2015, as shown in Table 6. Completion of developmental writing increased from 58.7 percent to 62.4 percent and completion of developmental reading increased from 55.4 percent to 57.0 percent.
23
Table 6: Developmental Education (DE) Completion Rate by Subject Minnesota State Colleges and Universities
Subject Fall 2009
Fall 2010
Fall 2011
Fall 2012
Fall 2013
Fall 2014
Fall 2015
Change
DE Math‐1st Yr 29.9% 30.3% 30.8% 31.2% 33.9% 41.5% 43.4% 13.5%
DE Writing‐1st Yr 58.7% 58.6% 59.2% 59.5% 59.3% 60.9% 62.4% 3.7%
DE Reading‐1st Yr 55.5% 56.5% 56.5% 56.4% 55.9% 60.8% 57.0% 1.6%
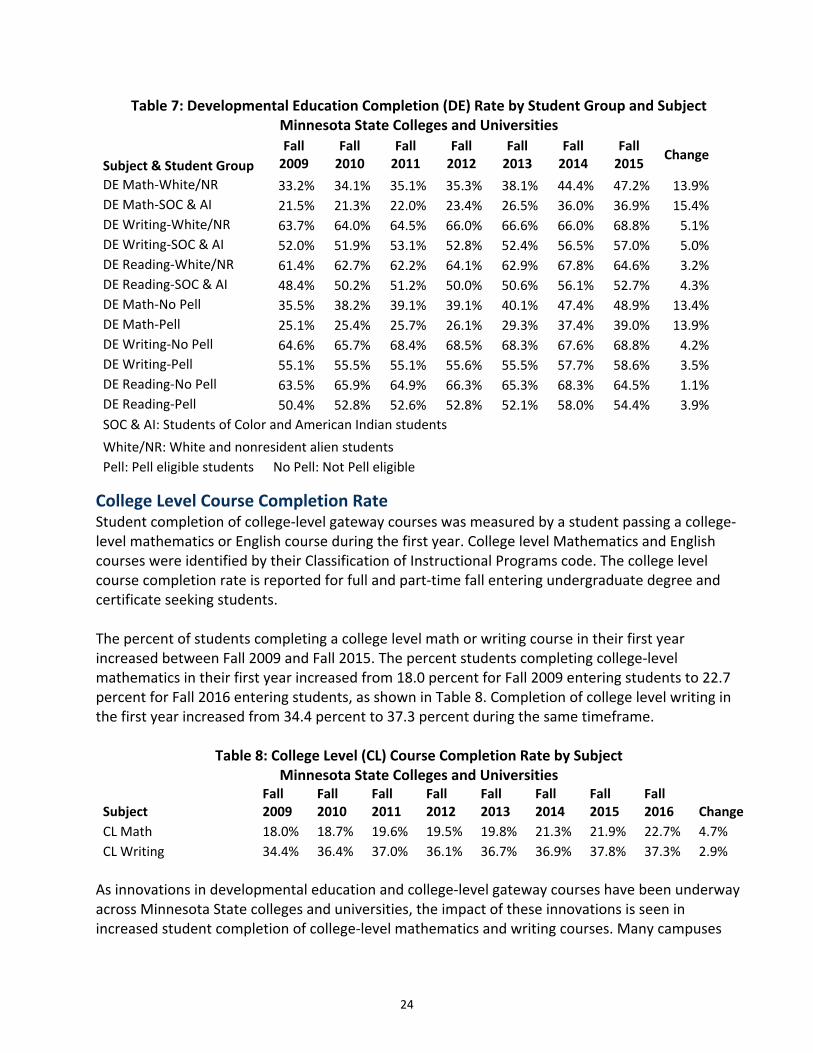
Across Minnesota State campuses, faculty, departments and academic and student affairs divisions have been innovating both in and out of the classroom to support students enrolled in developmental education, as highlighted in the innovations previously described. As campuses improve, scale, and/or add new innovative practices and programs, it is anticipated that there will be additional increases of student completion of developmental education courses in their first year. Many campuses have also instituted campus‐level policies that require or highly encourage students to enroll in their developmental education courses their first semester or first year. These policies help ensure that students receive the academic and student support they need to be successful in completing their degree or certificate. The percentage of Students of Color and American Indian students that completed their developmental courses in the first year has increased in all subjects since Fall 2009, but they had lower developmental course completion rates relative to white and nonresident students. The largest increase in completion occurred in math with Students of Color and American Indian students going from 21.5 percent in Fall 2009 to 36.9 percent in Fall 2015, as shown in Table 7. Thirty‐seven percent of Fall 2015 entering Students of Color and American Indian students completed developmental math courses in the first year compared to 47.2 percent of white and nonresident students. There were similar gaps between Students of Color and American Indian students compared to white and nonresident students in the developmental writing and reading completion rates. The percentage of Pell eligible students that completed their developmental courses in the first year has increased at rates similar to non‐Pell students in math, reading and writing since Fall 2009. Innovations implemented at Minnesota State campuses have positively impacted both Students of Color and American Indian students and impacted white and nonresident students in that the completion rates for both have increased over the last seven years. Nonetheless, work needs to continue to address the gaps between the two groups of students to ensure that all students can be successful in developmental education courses. Campuses will continue to examine how programs, practices, and initiatives’ impact Students of Color and American Indian students, Pell eligible students, and other groups of students traditionally underrepresented in higher education and scale the programs that have resulted in narrowing or eliminating the gaps in academic achievement.
24
Table 7: Developmental Education Completion (DE) Rate by Student Group and Subject Minnesota State Colleges and Universities
Subject & Student Group
Fall 2009
Fall 2010
Fall 2011
Fall 2012
Fall 2013
Fall 2014
Fall 2015
Change
DE Math‐White/NR 33.2% 34.1% 35.1% 35.3% 38.1% 44.4% 47.2% 13.9%
DE Math‐SOC & AI 21.5% 21.3% 22.0% 23.4% 26.5% 36.0% 36.9% 15.4%
DE Writing‐White/NR 63.7% 64.0% 64.5% 66.0% 66.6% 66.0% 68.8% 5.1%
DE Writing‐SOC & AI 52.0% 51.9% 53.1% 52.8% 52.4% 56.5% 57.0% 5.0%
DE Reading‐White/NR 61.4% 62.7% 62.2% 64.1% 62.9% 67.8% 64.6% 3.2%
DE Reading‐SOC & AI 48.4% 50.2% 51.2% 50.0% 50.6% 56.1% 52.7% 4.3%
DE Math‐No Pell 35.5% 38.2% 39.1% 39.1% 40.1% 47.4% 48.9% 13.4%
DE Math‐Pell 25.1% 25.4% 25.7% 26.1% 29.3% 37.4% 39.0% 13.9%
DE Writing‐No Pell 64.6% 65.7% 68.4% 68.5% 68.3% 67.6% 68.8% 4.2%
DE Writing‐Pell 55.1% 55.5% 55.1% 55.6% 55.5% 57.7% 58.6% 3.5%
DE Reading‐No Pell 63.5% 65.9% 64.9% 66.3% 65.3% 68.3% 64.5% 1.1%
DE Reading‐Pell 50.4% 52.8% 52.6% 52.8% 52.1% 58.0% 54.4% 3.9%
SOC & AI: Students of Color and American Indian students
White/NR: White and nonresident alien students Pell: Pell eligible students No Pell: Not Pell eligible
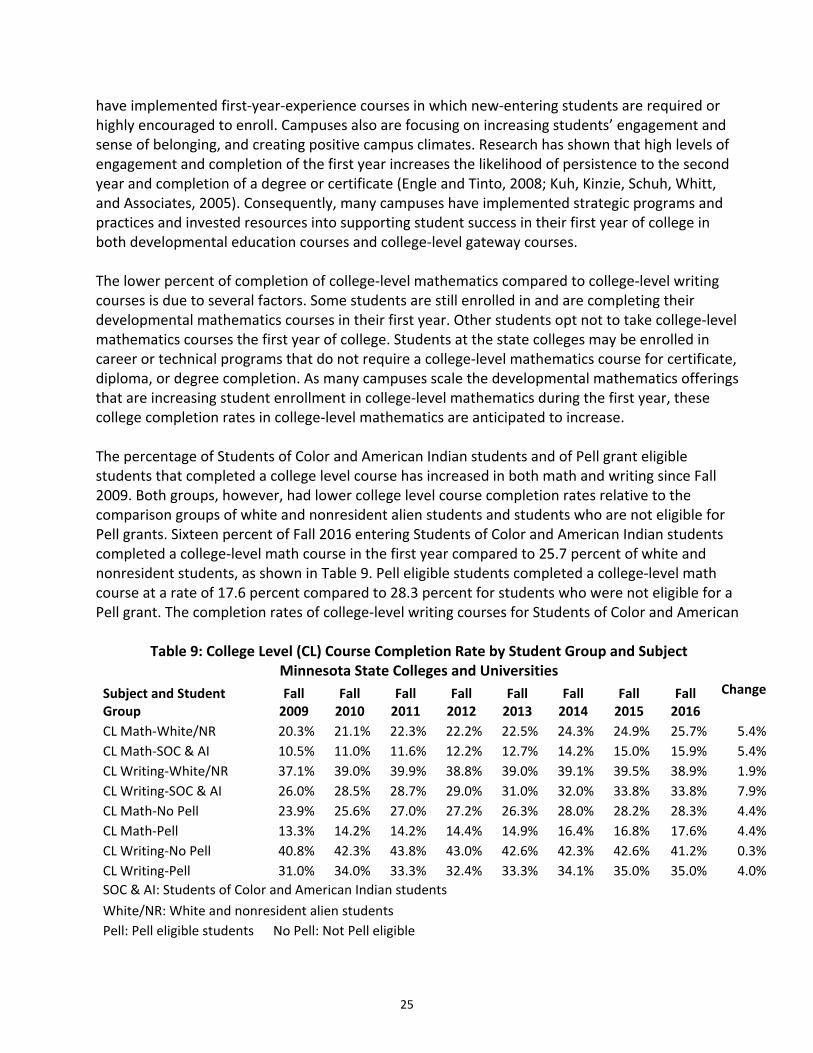
College Level Course Completion Rate Student completion of college‐level gateway courses was measured by a student passing a college‐level mathematics or English course during the first year. College level Mathematics and English courses were identified by their Classification of Instructional Programs code. The college level course completion rate is reported for full and part‐time fall entering undergraduate degree and certificate seeking students. The percent of students completing a college level math or writing course in their first year increased between Fall 2009 and Fall 2015. The percent students completing college‐level mathematics in their first year increased from 18.0 percent for Fall 2009 entering students to 22.7 percent for Fall 2016 entering students, as shown in Table 8. Completion of college level writing in the first year increased from 34.4 percent to 37.3 percent during the same timeframe.
Table 8: College Level (CL) Course Completion Rate by Subject Minnesota State Colleges and Universities
Subject Fall 2009
Fall 2010
Fall 2011
Fall 2012
Fall 2013
Fall 2014
Fall 2015
Fall 2016 Change
CL Math 18.0% 18.7% 19.6% 19.5% 19.8% 21.3% 21.9% 22.7% 4.7%
CL Writing 34.4% 36.4% 37.0% 36.1% 36.7% 36.9% 37.8% 37.3% 2.9%
As innovations in developmental education and college‐level gateway courses have been underway across Minnesota State colleges and universities, the impact of these innovations is seen in increased student completion of college‐level mathematics and writing courses. Many campuses
25
have implemented first‐year‐experience courses in which new‐entering students are required or highly encouraged to enroll. Campuses also are focusing on increasing students’ engagement and sense of belonging, and creating positive campus climates. Research has shown that high levels of engagement and completion of the first year increases the likelihood of persistence to the second year and completion of a degree or certificate (Engle and Tinto, 2008; Kuh, Kinzie, Schuh, Whitt, and Associates, 2005). Consequently, many campuses have implemented strategic programs and practices and invested resources into supporting student success in their first year of college in both developmental education courses and college‐level gateway courses. The lower percent of completion of college‐level mathematics compared to college‐level writing courses is due to several factors. Some students are still enrolled in and are completing their developmental mathematics courses in their first year. Other students opt not to take college‐level mathematics courses the first year of college. Students at the state colleges may be enrolled in career or technical programs that do not require a college‐level mathematics course for certificate, diploma, or degree completion. As many campuses scale the developmental mathematics offerings that are increasing student enrollment in college‐level mathematics during the first year, these college completion rates in college‐level mathematics are anticipated to increase. The percentage of Students of Color and American Indian students and of Pell grant eligible students that completed a college level course has increased in both math and writing since Fall 2009. Both groups, however, had lower college level course completion rates relative to the comparison groups of white and nonresident alien students and students who are not eligible for Pell grants. Sixteen percent of Fall 2016 entering Students of Color and American Indian students completed a college‐level math course in the first year compared to 25.7 percent of white and nonresident students, as shown in Table 9. Pell eligible students completed a college‐level math course at a rate of 17.6 percent compared to 28.3 percent for students who were not eligible for a Pell grant. The completion rates of college‐level writing courses for Students of Color and American
Table 9: College Level (CL) Course Completion Rate by Student Group and Subject Minnesota State Colleges and Universities
Subject and Student Group
Fall 2009
Fall 2010
Fall 2011
Fall 2012
Fall 2013
Fall 2014
Fall 2015
Fall 2016
Change
CL Math‐White/NR 20.3% 21.1% 22.3% 22.2% 22.5% 24.3% 24.9% 25.7% 5.4%
CL Math‐SOC & AI 10.5% 11.0% 11.6% 12.2% 12.7% 14.2% 15.0% 15.9% 5.4%
CL Writing‐White/NR 37.1% 39.0% 39.9% 38.8% 39.0% 39.1% 39.5% 38.9% 1.9%
CL Writing‐SOC & AI 26.0% 28.5% 28.7% 29.0% 31.0% 32.0% 33.8% 33.8% 7.9%
CL Math‐No Pell 23.9% 25.6% 27.0% 27.2% 26.3% 28.0% 28.2% 28.3% 4.4%
CL Math‐Pell 13.3% 14.2% 14.2% 14.4% 14.9% 16.4% 16.8% 17.6% 4.4%
CL Writing‐No Pell 40.8% 42.3% 43.8% 43.0% 42.6% 42.3% 42.6% 41.2% 0.3%
CL Writing‐Pell 31.0% 34.0% 33.3% 32.4% 33.3% 34.1% 35.0% 35.0% 4.0%
SOC & AI: Students of Color and American Indian students White/NR: White and nonresident alien students Pell: Pell eligible students No Pell: Not Pell eligible
26
Indian students and for Pell eligible students increased much more than the rates for white and nonresident students and those who are not Pell eligible, substantially reducing the gaps between these groups. The increases in college‐level course completion rates for Students of Color and American Indian students and for Pell eligible students reflect the innovations in curricular and student supports that have been implemented at Minnesota State campuses. It is especially notable that the gaps in college‐level writing course completion rates have narrowed substantially. Campuses will continue to enhance models to ensure that these completion rates continue to increase and that the gaps continue to narrow or are eliminated.
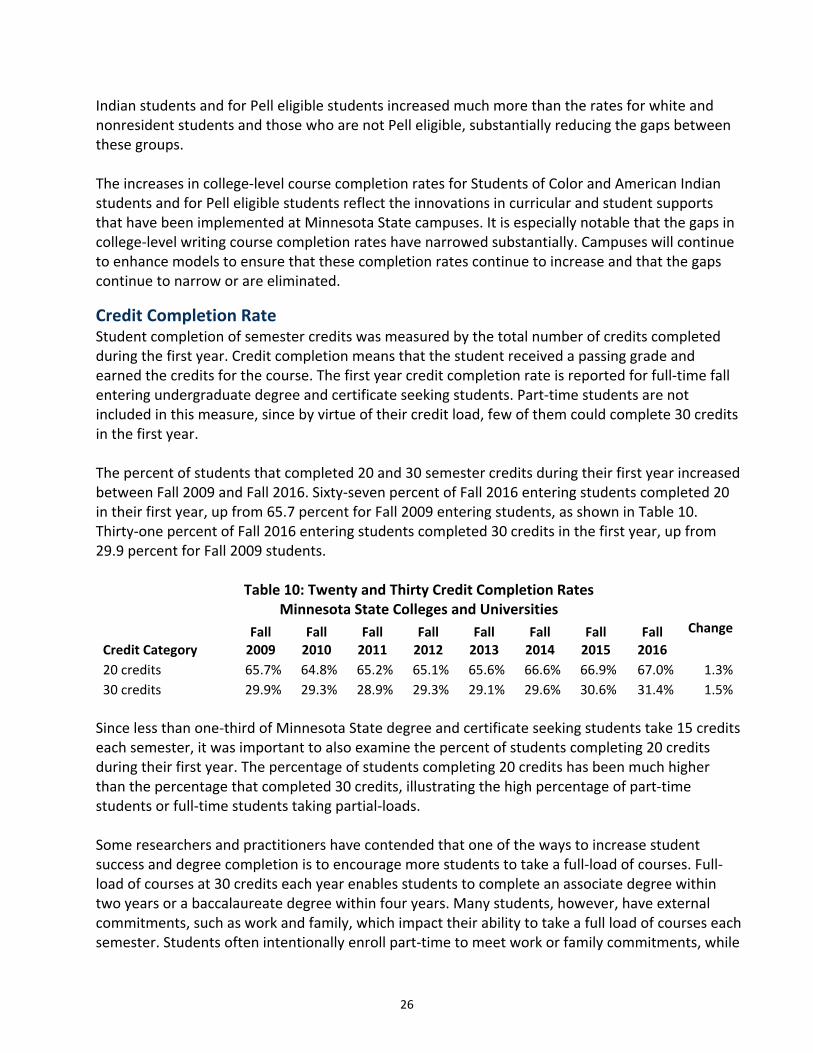
Credit Completion Rate Student completion of semester credits was measured by the total number of credits completed during the first year. Credit completion means that the student received a passing grade and earned the credits for the course. The first year credit completion rate is reported for full‐time fall entering undergraduate degree and certificate seeking students. Part‐time students are not included in this measure, since by virtue of their credit load, few of them could complete 30 credits in the first year. The percent of students that completed 20 and 30 semester credits during their first year increased between Fall 2009 and Fall 2016. Sixty‐seven percent of Fall 2016 entering students completed 20 in their first year, up from 65.7 percent for Fall 2009 entering students, as shown in Table 10. Thirty‐one percent of Fall 2016 entering students completed 30 credits in the first year, up from 29.9 percent for Fall 2009 students.
Table 10: Twenty and Thirty Credit Completion Rates Minnesota State Colleges and Universities
Credit Category Fall 2009
Fall 2010
Fall 2011
Fall 2012
Fall 2013
Fall 2014
Fall 2015
Fall 2016
Change
20 credits 65.7% 64.8% 65.2% 65.1% 65.6% 66.6% 66.9% 67.0% 1.3%
30 credits 29.9% 29.3% 28.9% 29.3% 29.1% 29.6% 30.6% 31.4% 1.5%
Since less than one‐third of Minnesota State degree and certificate seeking students take 15 credits each semester, it was important to also examine the percent of students completing 20 credits during their first year. The percentage of students completing 20 credits has been much higher than the percentage that completed 30 credits, illustrating the high percentage of part‐time students or full‐time students taking partial‐loads. Some researchers and practitioners have contended that one of the ways to increase student success and degree completion is to encourage more students to take a full‐load of courses. Full‐load of courses at 30 credits each year enables students to complete an associate degree within two years or a baccalaureate degree within four years. Many students, however, have external commitments, such as work and family, which impact their ability to take a full load of courses each semester. Students often intentionally enroll part‐time to meet work or family commitments, while
27
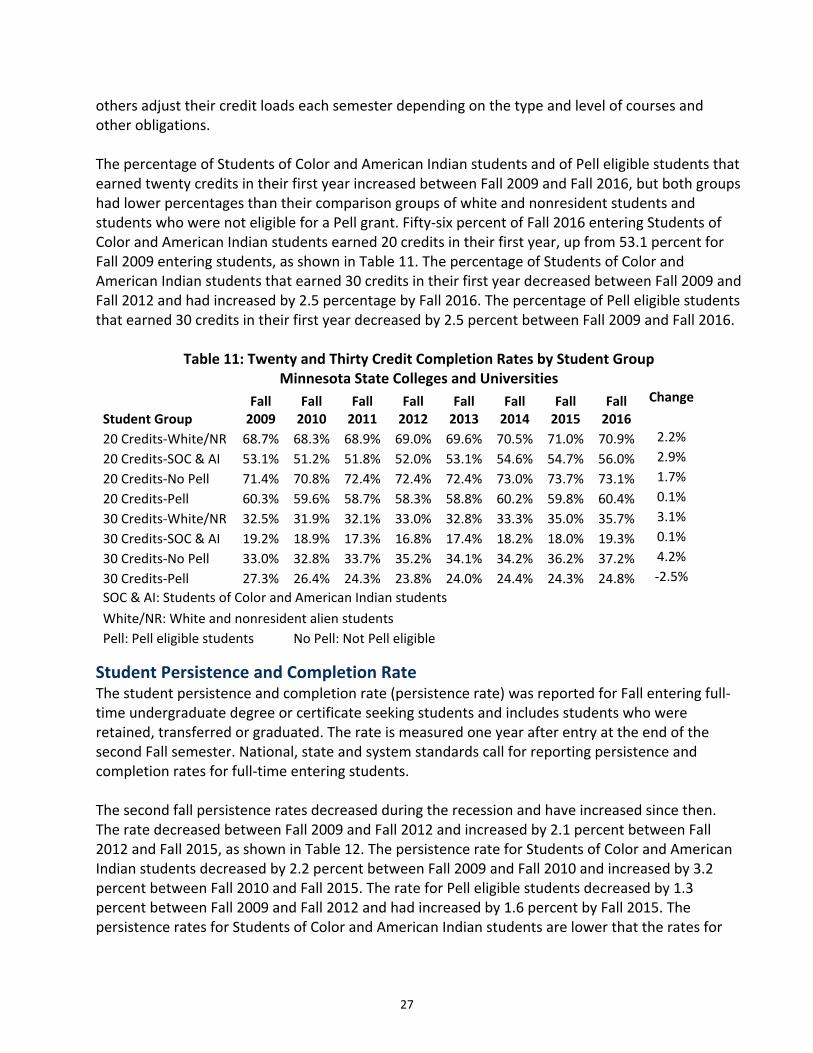
others adjust their credit loads each semester depending on the type and level of courses and other obligations. The percentage of Students of Color and American Indian students and of Pell eligible students that earned twenty credits in their first year increased between Fall 2009 and Fall 2016, but both groups had lower percentages than their comparison groups of white and nonresident students and students who were not eligible for a Pell grant. Fifty‐six percent of Fall 2016 entering Students of Color and American Indian students earned 20 credits in their first year, up from 53.1 percent for Fall 2009 entering students, as shown in Table 11. The percentage of Students of Color and American Indian students that earned 30 credits in their first year decreased between Fall 2009 and Fall 2012 and had increased by 2.5 percentage by Fall 2016. The percentage of Pell eligible students that earned 30 credits in their first year decreased by 2.5 percent between Fall 2009 and Fall 2016.
Table 11: Twenty and Thirty Credit Completion Rates by Student Group Minnesota State Colleges and Universities
Student Group Fall 2009
Fall 2010
Fall 2011
Fall 2012
Fall 2013
Fall 2014
Fall 2015
Fall 2016
Change
20 Credits‐White/NR 68.7% 68.3% 68.9% 69.0% 69.6% 70.5% 71.0% 70.9% 2.2%
20 Credits‐SOC & AI 53.1% 51.2% 51.8% 52.0% 53.1% 54.6% 54.7% 56.0% 2.9%
20 Credits‐No Pell 71.4% 70.8% 72.4% 72.4% 72.4% 73.0% 73.7% 73.1% 1.7%
20 Credits‐Pell 60.3% 59.6% 58.7% 58.3% 58.8% 60.2% 59.8% 60.4% 0.1%
30 Credits‐White/NR 32.5% 31.9% 32.1% 33.0% 32.8% 33.3% 35.0% 35.7% 3.1%
30 Credits‐SOC & AI 19.2% 18.9% 17.3% 16.8% 17.4% 18.2% 18.0% 19.3% 0.1%
30 Credits‐No Pell 33.0% 32.8% 33.7% 35.2% 34.1% 34.2% 36.2% 37.2% 4.2%
30 Credits‐Pell 27.3% 26.4% 24.3% 23.8% 24.0% 24.4% 24.3% 24.8% ‐2.5%
SOC & AI: Students of Color and American Indian students
White/NR: White and nonresident alien students
Pell: Pell eligible students No Pell: Not Pell eligible
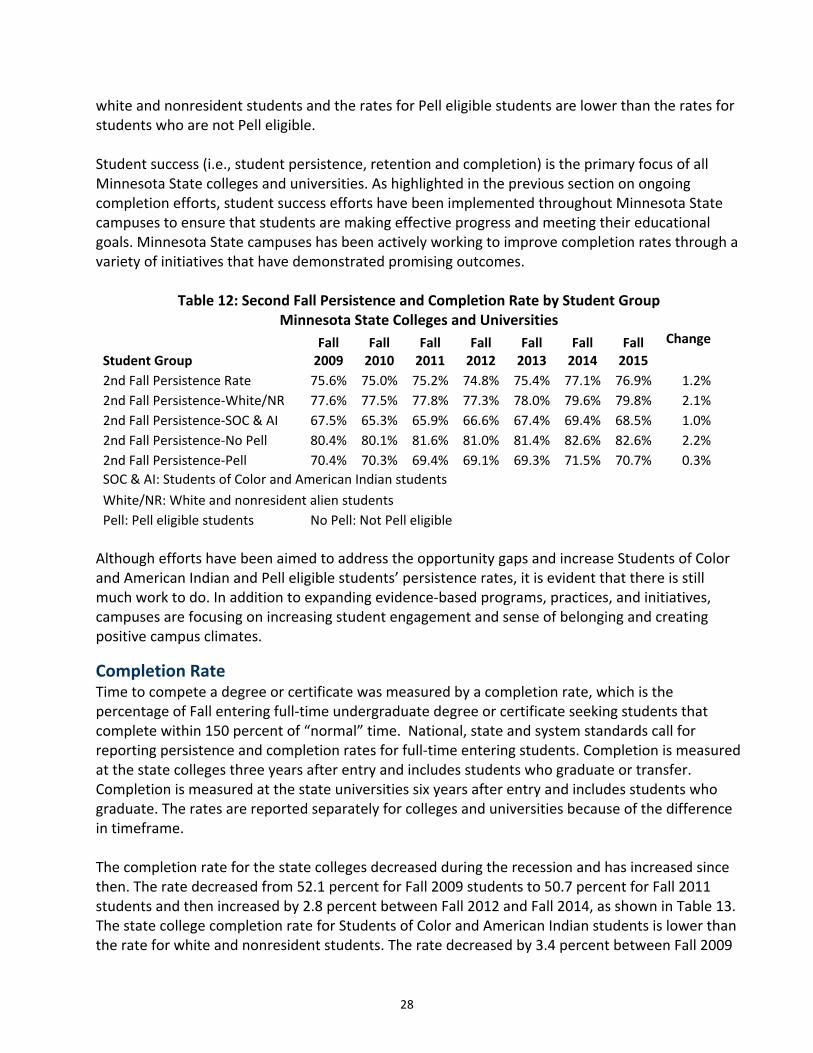
Student Persistence and Completion Rate The student persistence and completion rate (persistence rate) was reported for Fall entering full‐time undergraduate degree or certificate seeking students and includes students who were retained, transferred or graduated. The rate is measured one year after entry at the end of the second Fall semester. National, state and system standards call for reporting persistence and completion rates for full‐time entering students. The second fall persistence rates decreased during the recession and have increased since then. The rate decreased between Fall 2009 and Fall 2012 and increased by 2.1 percent between Fall 2012 and Fall 2015, as shown in Table 12. The persistence rate for Students of Color and American Indian students decreased by 2.2 percent between Fall 2009 and Fall 2010 and increased by 3.2 percent between Fall 2010 and Fall 2015. The rate for Pell eligible students decreased by 1.3 percent between Fall 2009 and Fall 2012 and had increased by 1.6 percent by Fall 2015. The persistence rates for Students of Color and American Indian students are lower that the rates for
28
white and nonresident students and the rates for Pell eligible students are lower than the rates for students who are not Pell eligible. Student success (i.e., student persistence, retention and completion) is the primary focus of all Minnesota State colleges and universities. As highlighted in the previous section on ongoing completion efforts, student success efforts have been implemented throughout Minnesota State campuses to ensure that students are making effective progress and meeting their educational goals. Minnesota State campuses has been actively working to improve completion rates through a variety of initiatives that have demonstrated promising outcomes.
Table 12: Second Fall Persistence and Completion Rate by Student Group Minnesota State Colleges and Universities
Student Group Fall 2009
Fall 2010
Fall 2011
Fall 2012
Fall 2013
Fall 2014
Fall 2015
Change
2nd Fall Persistence Rate 75.6% 75.0% 75.2% 74.8% 75.4% 77.1% 76.9% 1.2%
2nd Fall Persistence‐White/NR 77.6% 77.5% 77.8% 77.3% 78.0% 79.6% 79.8% 2.1%
2nd Fall Persistence‐SOC & AI 67.5% 65.3% 65.9% 66.6% 67.4% 69.4% 68.5% 1.0%
2nd Fall Persistence‐No Pell 80.4% 80.1% 81.6% 81.0% 81.4% 82.6% 82.6% 2.2%
2nd Fall Persistence‐Pell 70.4% 70.3% 69.4% 69.1% 69.3% 71.5% 70.7% 0.3%
SOC & AI: Students of Color and American Indian students White/NR: White and nonresident alien students
Pell: Pell eligible students No Pell: Not Pell eligible
Although efforts have been aimed to address the opportunity gaps and increase Students of Color and American Indian and Pell eligible students’ persistence rates, it is evident that there is still much work to do. In addition to expanding evidence‐based programs, practices, and initiatives, campuses are focusing on increasing student engagement and sense of belonging and creating positive campus climates.
Completion Rate Time to compete a degree or certificate was measured by a completion rate, which is the percentage of Fall entering full‐time undergraduate degree or certificate seeking students that complete within 150 percent of “normal” time. National, state and system standards call for reporting persistence and completion rates for full‐time entering students. Completion is measured at the state colleges three years after entry and includes students who graduate or transfer. Completion is measured at the state universities six years after entry and includes students who graduate. The rates are reported separately for colleges and universities because of the difference in timeframe. The completion rate for the state colleges decreased during the recession and has increased since then. The rate decreased from 52.1 percent for Fall 2009 students to 50.7 percent for Fall 2011 students and then increased by 2.8 percent between Fall 2012 and Fall 2014, as shown in Table 13. The state college completion rate for Students of Color and American Indian students is lower than the rate for white and nonresident students. The rate decreased by 3.4 percent between Fall 2009
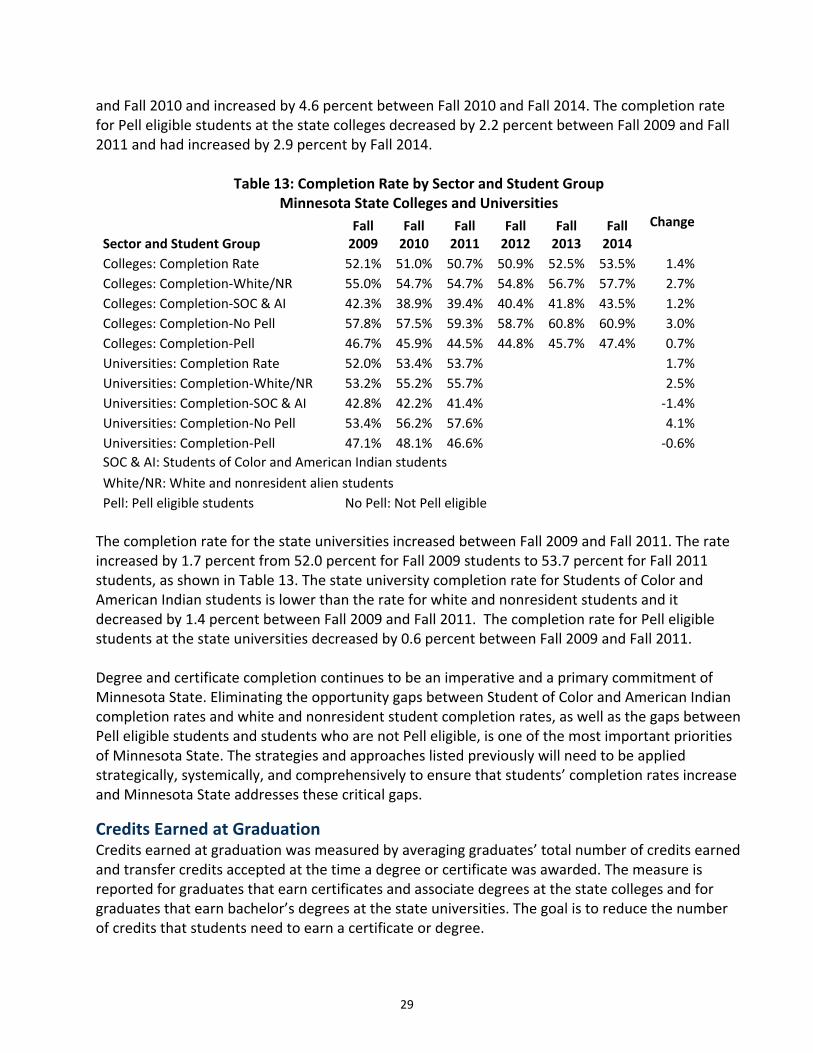
29
and Fall 2010 and increased by 4.6 percent between Fall 2010 and Fall 2014. The completion rate for Pell eligible students at the state colleges decreased by 2.2 percent between Fall 2009 and Fall 2011 and had increased by 2.9 percent by Fall 2014.
Table 13: Completion Rate by Sector and Student Group Minnesota State Colleges and Universities
Sector and Student Group Fall 2009
Fall 2010
Fall 2011
Fall 2012
Fall 2013
Fall 2014
Change
Colleges: Completion Rate 52.1% 51.0% 50.7% 50.9% 52.5% 53.5% 1.4%
Colleges: Completion‐White/NR 55.0% 54.7% 54.7% 54.8% 56.7% 57.7% 2.7%
Colleges: Completion‐SOC & AI 42.3% 38.9% 39.4% 40.4% 41.8% 43.5% 1.2%
Colleges: Completion‐No Pell 57.8% 57.5% 59.3% 58.7% 60.8% 60.9% 3.0%
Colleges: Completion‐Pell 46.7% 45.9% 44.5% 44.8% 45.7% 47.4% 0.7%
Universities: Completion Rate 52.0% 53.4% 53.7% 1.7%
Universities: Completion‐White/NR 53.2% 55.2% 55.7% 2.5%
Universities: Completion‐SOC & AI 42.8% 42.2% 41.4% ‐1.4%
Universities: Completion‐No Pell 53.4% 56.2% 57.6% 4.1%
Universities: Completion‐Pell 47.1% 48.1% 46.6% ‐0.6%
SOC & AI: Students of Color and American Indian students White/NR: White and nonresident alien students Pell: Pell eligible students No Pell: Not Pell eligible
The completion rate for the state universities increased between Fall 2009 and Fall 2011. The rate increased by 1.7 percent from 52.0 percent for Fall 2009 students to 53.7 percent for Fall 2011 students, as shown in Table 13. The state university completion rate for Students of Color and American Indian students is lower than the rate for white and nonresident students and it decreased by 1.4 percent between Fall 2009 and Fall 2011. The completion rate for Pell eligible students at the state universities decreased by 0.6 percent between Fall 2009 and Fall 2011. Degree and certificate completion continues to be an imperative and a primary commitment of Minnesota State. Eliminating the opportunity gaps between Student of Color and American Indian completion rates and white and nonresident student completion rates, as well as the gaps between Pell eligible students and students who are not Pell eligible, is one of the most important priorities of Minnesota State. The strategies and approaches listed previously will need to be applied strategically, systemically, and comprehensively to ensure that students’ completion rates increase and Minnesota State addresses these critical gaps.
Credits Earned at Graduation Credits earned at graduation was measured by averaging graduates’ total number of credits earned and transfer credits accepted at the time a degree or certificate was awarded. The measure is reported for graduates that earn certificates and associate degrees at the state colleges and for graduates that earn bachelor’s degrees at the state universities. The goal is to reduce the number of credits that students need to earn a certificate or degree.
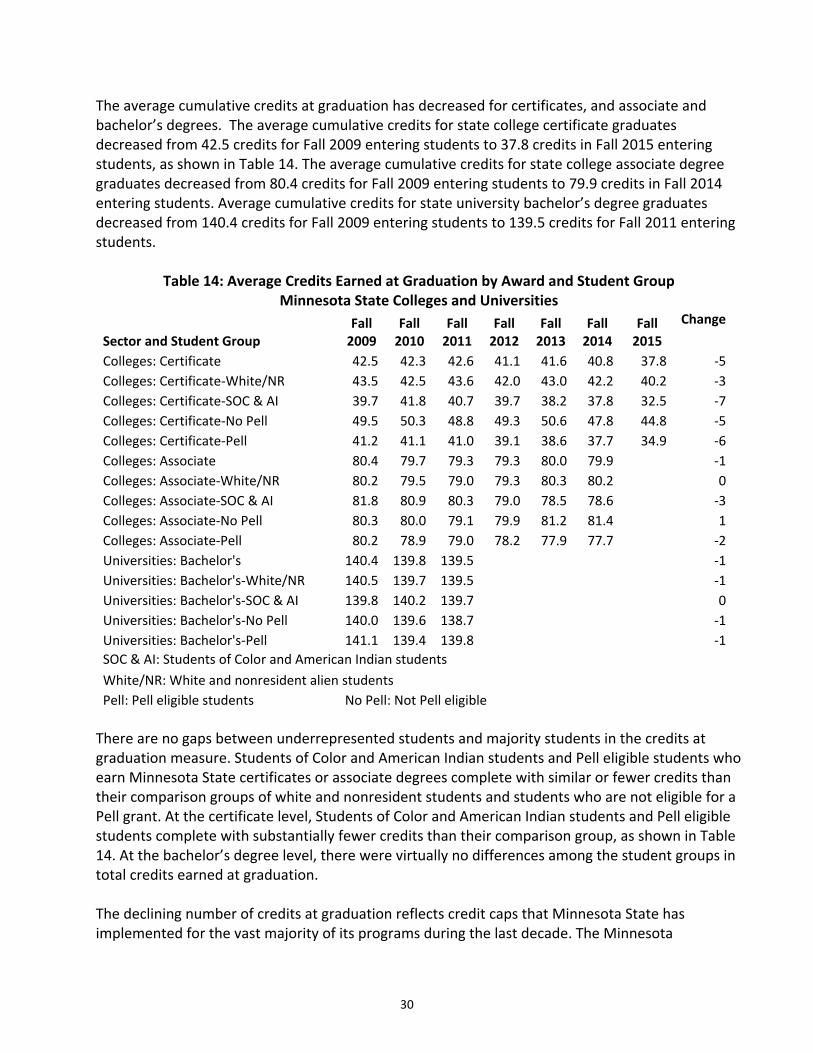
30
The average cumulative credits at graduation has decreased for certificates, and associate and bachelor’s degrees. The average cumulative credits for state college certificate graduates decreased from 42.5 credits for Fall 2009 entering students to 37.8 credits in Fall 2015 entering students, as shown in Table 14. The average cumulative credits for state college associate degree graduates decreased from 80.4 credits for Fall 2009 entering students to 79.9 credits in Fall 2014 entering students. Average cumulative credits for state university bachelor’s degree graduates decreased from 140.4 credits for Fall 2009 entering students to 139.5 credits for Fall 2011 entering students.
Table 14: Average Credits Earned at Graduation by Award and Student Group Minnesota State Colleges and Universities
Sector and Student Group Fall 2009
Fall 2010
Fall 2011
Fall 2012
Fall 2013
Fall 2014
Fall 2015
Change
Colleges: Certificate 42.5 42.3 42.6 41.1 41.6 40.8 37.8 ‐5
Colleges: Certificate‐White/NR 43.5 42.5 43.6 42.0 43.0 42.2 40.2 ‐3
Colleges: Certificate‐SOC & AI 39.7 41.8 40.7 39.7 38.2 37.8 32.5 ‐7
Colleges: Certificate‐No Pell 49.5 50.3 48.8 49.3 50.6 47.8 44.8 ‐5
Colleges: Certificate‐Pell 41.2 41.1 41.0 39.1 38.6 37.7 34.9 ‐6
Colleges: Associate 80.4 79.7 79.3 79.3 80.0 79.9 ‐1
Colleges: Associate‐White/NR 80.2 79.5 79.0 79.3 80.3 80.2 0
Colleges: Associate‐SOC & AI 81.8 80.9 80.3 79.0 78.5 78.6 ‐3
Colleges: Associate‐No Pell 80.3 80.0 79.1 79.9 81.2 81.4 1
Colleges: Associate‐Pell 80.2 78.9 79.0 78.2 77.9 77.7 ‐2
Universities: Bachelor's 140.4 139.8 139.5 ‐1
Universities: Bachelor's‐White/NR 140.5 139.7 139.5 ‐1
Universities: Bachelor's‐SOC & AI 139.8 140.2 139.7 0
Universities: Bachelor's‐No Pell 140.0 139.6 138.7 ‐1
Universities: Bachelor's‐Pell 141.1 139.4 139.8 ‐1
SOC & AI: Students of Color and American Indian students White/NR: White and nonresident alien students Pell: Pell eligible students No Pell: Not Pell eligible There are no gaps between underrepresented students and majority students in the credits at graduation measure. Students of Color and American Indian students and Pell eligible students who earn Minnesota State certificates or associate degrees complete with similar or fewer credits than their comparison groups of white and nonresident students and students who are not eligible for a Pell grant. At the certificate level, Students of Color and American Indian students and Pell eligible students complete with substantially fewer credits than their comparison group, as shown in Table 14. At the bachelor’s degree level, there were virtually no differences among the student groups in total credits earned at graduation. The declining number of credits at graduation reflects credit caps that Minnesota State has implemented for the vast majority of its programs during the last decade. The Minnesota
31
Legislature enacted language in 2007 that required the Minnesota State system to implement credit caps of 60 for associate degrees and 120 for bachelor’s degrees. The legislation granted the Board of Trustees the authority to grant waivers to the caps for specific programs. The vast majority of the college and university associate and bachelor’s degree programs comply with the credit caps. There are many factors that impact cumulative credits at graduation including students taking additional courses due to personal interest and changing their major and having to meet new major or degree program requirements.
32
CONCLUSIONS
Minnesota State has complied with three recent requirements enacted by the Legislature. The system submitted a required completion plan to the legislature in January 2016. This document constitutes the system’s report to the legislature on its activities and achievements related to improving student completion and includes the required reporting on the seven completion measures. A third report, the 2018 Developmental Education Plan that will be submitted to the legislature in February 2018, contains the system’s plan to reform developmental education offerings. Students of Color and American Indian students are compared throughout this report to white students and nonresident alien students. The nonresident alien category consists primarily of international students and students who are not permanent residents of the United States. Federal, state and system reporting standards specify that these students should not be included in a racial‐ethnic group, but rather reported as nonresident students. The Minnesota State Colleges and Universities have made substantial progress on all seven of the completion measures presented in this report. The key points of progress on each measure include:
Developmental Education Enrollment Rate:
The number of fall entering undergraduate degree and certificate seeking students that took developmental courses during their first two years decreased by 37.5 percent between Fall 2009 and Fall 2015.
The percent of undergraduate students enrolled in developmental courses in their first two years decreased from 41.8 percent to 33.0 percent between Fall 2009 and Fall 2015.
The percentage of Students of Color and American Indian students that took developmental courses decreased by 9.4 percent and the percent of Pell grant eligible students that took developmental courses also decreased by 9.8 percent since Fall 2009, but both groups had higher developmental course taking rates relative to their comparison groups of white and nonresident students and students who are not eligible for Pell grants.
Much of this developmental education enrollment decline is due to the curricular and support innovations that have been implemented across our campuses. It is anticipated that with the implementation of the DESR, Minnesota State will see continued enrollment declines in developmental education courses.
Developmental Completion Rate:
The percent of students completing developmental education requirements in their first year increased in math, reading and writing between Fall 2009 and Fall 2015.
The percentage of Students of Color and American Indian students that completed their developmental courses in the first year has increased in all three subjects since Fall 2009, but they had lower course completion rates relative to white and nonresident students.
33
The gaps between Students of Color and American Indian students relative to white and nonresident students in course completion decreased in developmental math and reading courses.
The percentage of Pell grant eligible students that completed their developmental courses in the first year has increased in all three subjects and the gap with students who were not eligible decreased in math and reading courses.
Across Minnesota State campuses, faculty members, departments, and academic and student
affairs divisions have been innovating both in and out of the classroom to support students
enrolled in developmental education. As campuses improve, scale, and/or add new innovative
practices and programs across campuses, it is anticipated that there will be additional increases
of student completion of developmental education courses in their first year.
College Level Course Completion Rate:
The percent of students completing a college level math course or a college level writing course in their first year increased between Fall 2009 and Fall 2015.
The percentage of Students of Color and American Indian students and of Pell grant eligible students that completed a college level course in their first year has increased in both subjects since Fall 2009, but both groups had lower college level course completion rates relative to their comparison groups of white and nonresident students and of students who are not eligible for Pell grants.
The gap between Students of Color and American Indian students as compared to white and nonresident students in completion of college level writing decreased substantially between Fall 2009 and Fall 2015.
As innovations in developmental education and college‐level gateway courses have been underway across Minnesota State colleges and universities, the impact of these innovations is seen in increased student completion of college‐level mathematics and writing courses. The increases in college‐level course completion rates for Students of Color and American Indian students and for Pell eligible students also reflect the innovations in curricular and student supports that have been implemented at Minnesota State campuses.
Credit Completion Rate
The percent of students that completed 20 and 30 semester credits during their first year increased between Fall 2009 and Fall 2016.
The percentage of Students of Color and American Indian students that earned twenty credits in their first year increased more than it did for white and nonresident students between Fall 2009 and Fall 2016, reducing the gap between the two groups.
Since less than one‐third of Minnesota State degree and certificate seeking students take 15 credits each semester, the percentage of students completing 20 credits during the first year has been much higher than the percentage that completed 30 credits. Many of our students have work and family commitments which impact their ability to take a full course load each semester.
34
Student Persistence and Completion Rate
The second fall persistence rate decreased during the recession and has increased by 2.1 percent since the low for Fall 2012 entering students.
The persistence rate for Students of Color and American Indian students has increased by 3.2 percent since the low for Fall 2010 entering students, but are lower than the rates for white and nonresident students.
Student success (i.e., persistence and completion rate and completion rate) is the primary focus of all Minnesota State colleges and universities. Minnesota State campuses has been actively working to improve completion rates through a variety of initiatives that have demonstrated promising outcomes. In addition to expanding evidence‐based programs, practices, and initiatives, campuses are focusing on increasing students’ engagement and their sense of belonging and creating positive campus climates.
Completion Rate
The state college completion rate decreased during the recession and has increased by 2.8 percent since the low for Fall 2011 entering students.
The state college completion rates for Students of Color and American Indian students and for Pell eligible students also has increased, but are lower than the rates for comparison groups of white and nonresident students and students who are not eligible for a Pell grant.
The completion rate for the state universities increased for entering students between Fall 2009 and Fall 2011.
Completion rates for Students of Color and American Indian students at the state universities are lower than the completion rates for white and nonresident students and have decreased between Fall 2009 and Fall 2011.
The completion rates for Pell eligible students at the state universities also decreased between Fall 2009 and Fall 2011 and were lower than the rate for students who are not Pell eligible.
Degree and certificate completion continues to be an imperative and constant agenda and a primary commitment of Minnesota State. In addition, eliminating the opportunity gaps between Student of Color and American Indian completion rates and white and nonresident student completion rates, as well as eliminating the gaps between Pell eligible students and students who are not Pell eligible, is one of the most important priorities of Minnesota State.
Credits Earned at Graduation
The average cumulative credits at graduation has decreased for certificate, and associate and bachelor’s degrees graduates.
There are no gaps between underrepresented students and majority students in the credits at graduation measure.
Students of Color and American Indian students and Pell eligible students who earn Minnesota State certificates or degrees complete with similar or fewer credits than students in their comparison groups of white and nonresident students and students who are not Pell eligible.
35
The goal is to reduce the number of credits that students need to complete a certificate or degree. The declining number of credits at graduation reflects credit caps that Minnesota State has implemented for the vast majority of its programs during the last decade. There are many factors that impact cumulative credits at graduation including students taking additional courses due to interest or changing their major and having to meet new major or degree program requirements.
36
REFERENCES
ACT. (2017). The Condition of College and Career Readiness 2017: Minnesota Key Findings. Retrieved from https://www.act.org/content/dam/act/unsecured/documents/cccr2017/Minnesota‐CCCR‐2017‐Final.pdf Bill and Melinda Gates Foundation. (2015, August 12). What we Do: Postsecondary Success Strategy Overview. Retrieved from Gates Foundation: http://www.gatesfoundation.org/What‐We‐Do/US‐Program/Postsecondary‐Success Engle, J. & Tinto, V. (2008). Moving beyond Access: College Success for Low‐income, First Generation Students. Retrieved from http://www.pellinstitute.org/downloads/publications‐Moving_Beyond_Access_2008.pdf Fergus, M. (2016, October). Getting Prepared: Recent High School Graduates and Developmental Education. Minnesota Office of Higher Education. Retrieved from http://www.ohe.state.mn.us/pdf/GettingPrepared2016.pdf Georgetown University. (2014). Recovery: Job Growth and Education Requirements through 2020. Retrieved from Georgetown Center on Education and the Workforce: https://cew.georgetown.edu/wp‐content/uploads/StateProjections_6.1.15_agc_v2.pdf Kuh, G.D., Kinzie, J., Schuh, J.H., Whitt, E.J., & Associates (2005). Student Success in College: Creating Conditions that Matter. San Francisco, CA: Jossey‐Bass. MDRC. (n.d.). Aid Like a Paycheck. Retrieved from MDRC: http://www.mdrc.org/project/aid‐paycheck#overview Minnesota Office of Higher Education. (n.d.). Facts about Enrollment. Retrieved from Minnesota Office of Higher Education: http://www.ohe.state.mn.us/mPg.cfm?pageID=945 Minnesota Office of Higher Education. (n.d.). Graduation Rates. Retrieved from Minnesota Office of Higher Education: http://www.ohe.state.mn.us/fc/754/pg.cfm Moxley, D., Najor‐Durack, A., & Dumbrigue, C. (2001). Keeping Students in Higher Education: Successful Practices and Strategies for Retention . London: Kogan Page. National Center for Education Statistics. (2017). The Condition of Education: Undergraduate Retention and Graduation Rates. Retrieved from https://nces.ed.gov/programs/coe/indicator_ctr.asp
37
Shaffer, L. (2014). Advising Financially At‐Risk Students: Detecting and Addressing Premature Affluence. NACADA Journal, 32‐41. Straumsheim, C. (2015, December 9). It's the Little Things. Retrieved from Inside Higher Ed: https://www.insidehighered.com/news/2015/12/09/using‐data‐driven‐advising‐colleges‐find‐more‐students‐eligible‐graduate?utm_source=Inside+Higher+Ed&utm_campaign=1093a31c03‐DNU20151209&utm_medium=email&utm_term=0_1fcbc04421‐1093a31c03‐198623889 The White House. (2015, Novemeber 19). Higher Education. Retrieved from White House: https://www.whitehouse.gov/issues/education/higher‐educationB Trostel, P. (2015). It’s Not Just the Money: The Benefits of College Education to Individuals and to Society. Margaret Chase Smith Policy Center and School of Economics Lumina Issue Papers. Retrieved from https://www.luminafoundation.org/resources/its‐not‐just‐the‐money U.S. Department of Education. (2015, July 27). Fact Sheet: Focusing Higher Education on Student Success. Retrieved from https://www.ed.gov/news/press‐releases/fact‐sheet‐focusing‐higher‐education‐student‐success
38
APPENDIX A: RELATED LEGISLATION
2015 Minnesota Session Law Chapter 69, Senate File 5, Article 3, Section 23
Section 1. COLLEGE COMPLETION; MINNESOTA STATE. The Board of Trustees of the Minnesota State Colleges and Universities shall develop a comprehensive plan to encourage students to complete degrees, diplomas, or certificates in their fields of study. The board must consult with students, faculty, and administrators of the state colleges and universities and the Office of Higher Education to create a plan that would increase program completion at each state college or university. Components of this plan may include, but are not limited to: (1) replacing developmental or remedial courses, when appropriate, with co‐requisite courses in which students with academic deficiencies are placed into introductory credit‐bearing coursework while receiving supplemental academic instruction on the same subject and during the same term; (2) expanding intrusive advising, including the use of early alert systems or requiring the approval of an advisor or counselor to register for certain classes; (3) developing meta‐majors in broad academic disciplines as an alternative to undecided majors; (4) making available alternative mathematics curriculum, including curriculum most relevant to the student's chosen area of study; (5) implementing "opt‐out scheduling" by automatically enrolling students in a schedule of courses chosen by the student's department but allowing students to disenroll from such courses if they wish; (6) facilitating the transfer of credits between state colleges and universities; and (7) strategies to encourage students to enroll full time, including the use of financial assistance to reduce a student's need to work. The development of the plan required under this section shall not discourage the development or delay the implementation or expansion of existing programs to encourage college completion. The Board of Trustees of the Minnesota State Colleges and Universities shall submit a report describing the plan developed under this section and an implementation schedule to the legislative committees with jurisdiction over higher education policy no later than January 15, 2016. This report must include identification of the financial and other resources needed by state colleges or universities to implement the plan.
39
2017 Minnesota Session Law Chapter 89, Article 2, Section 25
Sec. 25. DEVELOPMENTAL EDUCATION REFORM. (a) The Board of Trustees of the Minnesota State Colleges and Universities shall create a plan to reform developmental education offerings on system campuses aimed at reducing the number of students placed into developmental education. The plan must include, but is not limited to: (1) a systemwide multiple measures placement plan to guide campuses in placement of students into developmental education courses; (2) uniform cut scores for student placement, where appropriate, which will lead to fewer students being placed into developmental education courses; (3) other identified system policy changes, including an appeals process, that will decrease the number of students being placed into developmental education courses; (4) accelerated pathways in mathematics, reading, and composition to ensure students can complete developmental education work in no more than one year, including allowing for students to complete college‐level gateway courses in one year whenever possible; (5) a comprehensive examination of the cost structure of developmental education, including potential financial incentives for students or other mechanisms to lower the cost of developmental offerings for students; and (6) identified best practices and targeted support strategies such as the use of supplemental instruction, that may be used on every system campus around developmental education offerings. (b) The plan must include deadlines for implementation of proposed changes and must be submitted to the chairs and ranking minority members of the legislative committees with jurisdiction over higher education finance and policy by February 15, 2018. (c) The plan, in its entirety, shall be implemented by the start of the 2020‐2021 academic term, with individual provisions being implemented earlier as dictated by the plan.
40
APPENDIX B: COMPLETION MEASURE REPORT BY COLLEGE AND UNIVERSITY
See separate Appendix B document.
41
30 East 7th Street, Suite 350
St. Paul, MN 55101‐7804
651‐201‐1800
888‐667‐2848
www.MinnState.edu
This document is available in alternative formats to individuals with disabilities. To request an alternate format, contact Human Resources at 651‐201‐1664.
Individuals with hearing or speech disabilities may contact us via their preferred Telecommunications Relay Service.
Minnesota State is an affirmative action, equal opportunity employer and educator.