degolyer & macnaughton reserve report for polvo field
TRANSCRIPT
DeGolyer and MacNaughton 5001 Spring Valley Road
Suite 800 East
Dallas, Texas 75244
This is a digital representation of a DeGolyer and MacNaughton report. This file is intended to be a manifestation of certain data in the subject report and as such are subject to the same conditions thereof. The information and data contained in this file may be subject to misinterpretation; therefore, the signed and bound copy of this report should be considered the only authoritative source of such information.
DeGolyer and MacNaughton 5001 Spring Valley Road
Suite 800 East Dallas, Texas 75244
APPRAISAL REPORT as of
DECEMBER 31, 2013 on
RESERVES of the
POLVO FIELD in
BRAZIL owned by
HRT O&G EXPLORAÇÃO e PRODUÇÃO de PETRÓLEO LTDA.
NI 51-101
DeGolyer and MacNaughton
TABLE of CONTENTS
Page FOREWORD ............................................................................................................ 1
Scope of Investigation ........................................................................................................ 1 Authority ............................................................................................................................... 3 Source of Information ......................................................................................................... 3
GEOLOGY ............................................................................................................... 4 CLASSIFICATION of RESERVES ...................................................................... 6 ESTIMATION of RESERVES ............................................................................... 9 VALUATION of RESERVES ............................................................................... 13 SUMMARY and CONCLUSIONS ....................................................................... 17
Professional Qualification ...............................................................................................19 CERTIFICATE of QUALIFICATION ................................................................ 21
TABLES Table 1 – Summary of Gross and Net Oil Reserves Table 2 – Reservoir Parameters, All Reservoirs Table 3 – Reservoir Parameters, Turonian East Reservoir Table 4 – Projection of Proved Developed Reserves and Future Net Revenue Table 5 – Projection of Total Proved Reserves and Future Net Revenue Table 6 – Projection of Proved-plus-Probable Reserves and Future Net Revenue Table 7 – Projection of Proved-plus-Probable-plus-Possible Reserves and
Future Net Revenue
FIGURES Figure 1 – Location Map Figure 2 – Stratigraphic Column Figure 3 – Structure Map, Top of 80 Sand Reservoir Figure 4 – Isopach Map, Proved Net Oil, 80 Sand Reservoir Figure 5 – Structure Map, Top of 100 Sand Reservoir Figure 6 – Isopach Map, Proved Net Oil, 100 Sand Reservoir Figure 7 – Structure Map, Top of 110 Sand Reservoir Figure 8 – Isopach Map, Proved Net Oil, 110 Sand Reservoir Figure 9 – Structure Map, Top of 160-170 Sand Reservoir East Figure 10 – Isopach Map, Proved Net Oil, 160-170 Sand Reservoir East Figure 11 – Structure Map, Top of 160-170 Sand Reservoir West Figure 12 – Isopach Map, Proved Net Oil, 160-170 Sand Reservoir West Figure 13 – Structure Map, Top of Quissamã Reservoir Figure 14 – Isopach Map, Proved-plus-Probable-plus-Possible Net Oil, Quissamã
Reservoir Figure 15 – Production History Plot
DeGolyer and MacNaughton 5001 Spring Valley Road
Suite 800 East Dallas, Texas 75244
APPRAISAL REPORT as of
DECEMBER 31, 2013 on
RESERVES of the
POLVO FIELD in
BRAZIL owned by
HRT O&G EXPLORAÇÃO e PRODUÇÃO de PETRÓLEO LTDA.
NI 51-101
FOREWORD
Scope of Investigation This report presents an appraisal, as of December 31, 2013, of the extent of the
proved, probable, and possible crude oil reserves and the value of the proved, proved-plus-probable, and proved-plus-probable-plus-possible reserves of the Polvo field, located in the Campos Basin, Brazil. HRT O&G Exploração e Produção de Petróleo Ltda. (HRT O&G) has represented that it owns a 60-percent working interest in the Polvo field in license block BM-C-8 in the Campos Basin under the terms of exploration and production licenses, and is the field operator.
Estimates of proved reserves presented in
this report have been prepared using reserves definitions established by Canadian National Instrument 51–101. These reserves definitions are discussed in detail in the Classification of Reserves section of this report.
Reserves estimated in this report are
expressed as gross and net reserves. Gross reserves are defined as the total estimated petroleum to be produced from the properties after December 31, 2013.
2 DeGolyer and MacNaughton
Net reserves are defined as that portion of the gross reserves attributable to interests owned by HRT O&G after deducting all interests owned by others, including royalties paid in kind. HRT O&G has advised that its government royalty obligation is paid in cash; therefore, net reserves have not been reduced in consideration of this royalty obligation.
This report also presents values that were
estimated for proved, proved-plus-probable, and proved-plus-probable-plus-possible reserves of certain fields using prices and costs based on data provided by HRT O&G. A detailed explanation of the future price and cost assumptions is included in the Valuation of Reserves section of this report. All values in this report are expressed in United States dollars (U.S.$). No conversion from U.S.$ to Canadian dollars has been prepared. This evaluation was prepared under a forecast price and cost case, with no escalation applied to prices and costs.
Values of the net reserves in this report
are expressed in terms of estimated future gross revenue, future net revenue, and present worth. Future gross revenue is that revenue which will accrue to HRT O&G from the production and sale of the estimated net reserves. Future net revenue is calculated by deducting royalties paid in cash, operating expenses, capital costs, and the special participation fee from the future gross revenue. Operating expenses include field operating expenses, well workover expenses, leasing costs associated with the floating production, storage, and offloading vessel (FPSO), transportation expenses, compression charges, and an allocation of overhead that directly relates to production activities. Future income taxes have not been accounted for in this evaluation. Present worth is defined as the future net revenue discounted at a specified arbitrary discount rate compounded monthly over the expected period of realization. In this report present worth values using a nominal discount rate of 10 percent are reported in detail and values using nominal discount rates of 8, 12, 15, and 20 percent are reported as totals. The future net revenue estimated herein, discounted and undiscounted, should not be construed to represent fair market value.
Estimates of oil reserves and future net
revenue, as applicable, should be regarded only as estimates that may change as further production history and additional information become available. Not only are such estimates based on that information which is currently available, but such reserves and revenue estimates are also subject to the uncertainties inherent in the application of judgmental factors in interpreting such information.
3 DeGolyer and MacNaughton
Authority This report was authorized by Dr. Nilo Chagas de Azambuja Filho, Chief Executive Officer, HRT O&G.
Source of Information Information used in the preparation of this report was obtained from HRT O&G.
In the preparation of this report we have relied, without independent verification, upon information furnished by HRT O&G with respect to property interests owned, production from such properties, current costs of operation and development, current prices for production, agreements relating to current and future operations and sale of production, and various other information and data that were accepted as represented. A field examination of the properties was not considered necessary for the purposes of this report.
4 DeGolyer and MacNaughton
GEOLOGY
The Polvo field is located in the Campos Basin, offshore Brazil (Figure 1). The field lies about 100 kilometers east of Cabo Frio, Rio de Janeiro State.
In the Campos Basin, regional dip is
toward the southeast, reflecting basinward dip caused by the opening of the Atlantic Ocean during the early Cretaceous. This structural configuration is also present in the Polvo field.
Basement rocks in the Campos Basin are
Precambrian granites (Figure 2). As the basin began to open and fill, basalts of the Cabiúnas Formation flowed onto the granite basement. The earliest sediments in the basin are lacustrine shales and carbonates of the Lagoa Feia Formation, which is the primary hydrocarbon source formation for the basin. After the original rifting period, a massive sequence of continental and marine sediments accumulated in the basin. The lower part of this sequence is made up of conglomerates and carbonates, which are subsequently covered by a thick evaporite section composed predominantly of salt and anhydrite. Above the evaporites are mudstones and oolitic grainstones, deposited during Albian time when a broad carbonate platform developed in the region. In the Polvo field, the Albian carbonates are the Quissamã members of the Macaé Formation. These carbonates accumulated in shallow water on northeast-trending local structural highs atop basement or salt uplifts.
As basin subsidence continued, coastal
rivers flooded sands into the basin. These sands were deposited in environments ranging from deep-water turbidites to shallow-water deltaic and bay-lagoon settings. This style of sedimentation continued from the Cenomanian until the Miocene. In the Polvo field, the sandstones were deposited in coastal plains, lagoon, and bay-deltaic environments.
In the Polvo field, early exploration and
appraisal wells identified five oil-productive reservoir intervals located in separate areas of the field. From deepest to shallowest, these are the Quissamã carbonates, Turonian-age sandstones (160/170 reservoir), and Maastrichtian-age sandstones (80, 100, and 110 reservoirs). Ultimately, 13 exploration and appraisal wells were drilled to delineate the productive limits of these formations.
5 DeGolyer and MacNaughton
Early wells identified several areas of Quissamã carbonate accumulation, but after further evaluation only two of these areas were targeted for additional development, the Dev-7 and Dev-4&5 shoal areas, in the western part of the field. Six platform wells have been drilled and completed as producers from the Quissamã accumulation. Four wells are currently producing.
The Turonian and Maastrichtian
sandstones were found to be well developed and productive in separate accumulations east of the Quissamã wells. This part of the field was originally known as the Guarajuba field. At present, three wells produce from the Maastrichtian reservoir, three produce from the Turonian West reservoir, and one produces from the Turonian East reservoir.
Productive reservoir volumes were
estimated using standard volumetric methods based on geological mapping utilizing seismic data and well logs. Structure and isopach maps were drawn for each reservoir. Isopach maps of the sandstone reservoirs were drawn using limits based on stratigraphy and structural oil-water contacts. In many of the sandstone reservoirs, the productive sands were often cut by overlying unconformities that formed the northern, western, and eastern limits. The southern, downdip limit was often an estimated oil-water contact. Isopach maps of the Quissamã reservoirs were bounded by faulting, stratigraphy, and oil-water contact limits. The Dev-7 and Dev-4&5 areas are interpreted to be separated by faults and not in communication, as evidenced by different oil/water contact depths. These maps are shown on Figures 3 through 14.
Volumetric estimates for all evaluated
reservoirs are shown in Table 2. The volumetric estimates for the Turonian East reservoir are shown separately in Table 3.
6 DeGolyer and MacNaughton
CLASSIFICATION of RESERVES
Petroleum reserves included in this report are classified by degree of proof as proved, probable, or possible. For purposes of this report reserves are those quantities of oil or gas anticipated to be economically recoverable from known accumulations. The definitions of reserves shown below serve as the basis for the estimates contained herein. The definitions are in accordance with those prepared for the Canadian National Instrument 51-101 as presented in the Canadian Oil and Gas Evaluation Handbook (COGEH) Second Edition September 1, 2007, Volume 1 Reserves Definitions and Evaluation Practices and Procedures, Section 5. The petroleum reserves are classified in accordance with Sections 5.4.1, 5.4.2, and 5.4.3 of COGEH shown below. Section 5 of the COGEH contains the complete and official explanation of reserves definitions utilized herein. Reserves Categories – Reserves are estimated remaining quantities of oil and natural gas and related substances anticipated to be recoverable from known accumulations, as of a given date, based on
• analysis of drilling, geological, geophysical, and engineering data; • the use of established technology; • specified economic conditions, which are generally accepted as being
reasonable, and shall be disclosed. Reserves are classified according to the degree of certainty associated with the estimates.
Proved Reserves – Proved reserves are those reserves that can be estimated with a high degree of certainty to be recoverable. It is likely that the actual remaining quantities recovered will exceed the estimated proved reserves.
Probable Reserves – Probable reserves are those additional reserves that are less certain to be recovered than proved reserves. It is equally likely that the actual remaining quantities recovered will be greater or less than the sum of the estimated proved + probable reserves.
7 DeGolyer and MacNaughton
Possible Reserves – Possible reserves are those additional reserves that are less certain to be recovered than probable reserves. It is unlikely that the actual remaining quantities recovered will exceed the sum of the estimated proved + probable + possible reserves.
Development and Production Status – Each of the reserves categories (proved, probable, and possible) may be divided into developed and undeveloped categories.
Developed Reserves – Developed reserves are those reserves that are expected to be recovered from existing wells and installed facilities or, if facilities have not been installed, that would involve a low expenditure (e.g., when compared to the cost of drilling a well) to put the reserves on production. The developed category may be subdivided into producing and non-producing.
Developed Producing Reserves – Developed producing reserves are those reserves that are expected to be recovered from completion intervals open at the time of the estimate. These reserves may be currently producing or, if shut in, they must have previously been on production, and the date of resumption of production must be known with reasonable certainty.
Developed Non-producing Reserves – Developed non-producing reserves are those reserves that either have not been on production, or have previously been on production, but are shut in and the date of resumption of production is unknown.
Undeveloped Reserves – Undeveloped reserves are those reserves expected to be recovered from known accumulations where a significant expenditure (e.g., when compared to the cost of drilling a well) is required to render them capable of production. They must fully meet the requirements of the reserves category (proved, probable, possible) to which they are assigned.
8 DeGolyer and MacNaughton
In multi-well pools, it may be appropriate to allocate total pool reserves between the developed and undeveloped categories or to subdivide the developed reserves for the pool between developed producing and developed non-producing. This allocation should be based on the estimator’s assessment as to the reserves that will be recovered from specific wells, facilities, and completion intervals in the pool and their respective development and production status.
Levels of Certainty for Reported Reserves – The qualitative certainty levels contained in the definitions in Section 5.4.1 [Reserves Categories above] are applicable to “individual reserves entities,” which refers to the lowest level at which reserves calculations are performed, and to “reported reserves,” which refers to the highest level sum of individual entity estimates for which reserves estimates are presented. Reported Reserves should target the following levels of certainty under a specific set of economic conditions:
• at least a 90 percent probability that the quantities actually recovered will equal or exceed the estimated proved reserves,
• at least a 50 percent probability that the quantities actually recovered will equal or exceed the sum of the estimated proved + probable reserves,
• at least a 10 percent probability that the quantities actually recovered will equal or exceed the sum of the estimated proved + probable + possible reserves.
A quantitative measure of the certainty levels pertaining to estimates prepared for the various reserves categories is desirable to provide a clearer understanding of the associated risks and uncertainties. However, the majority of reserves estimates are prepared using deterministic methods that do not provide a mathematically derived quantitative measure of probability. In principle, there should be no difference between estimates prepared using probabilistic or deterministic methods.
9 DeGolyer and MacNaughton
ESTIMATION of RESERVES
Estimates of reserves were prepared by the use of appropriate geologic, petroleum engineering, and evaluation principles and techniques that are in accordance with practices generally recognized by the petroleum industry and in accordance with definitions established by the PRMS. The method or combination of methods used in the analysis of each reservoir was tempered by experience with similar reservoirs, stage of development, quality and completeness of basic data, and production history.
The volumetric method was used to
estimate the original oil in place (OOIP). Structure maps were prepared to delineate each reservoir, and isopach maps were constructed to estimate reservoir volume. Electrical logs, radioactivity logs, core analyses, and other available data were used to prepare these maps as well as to estimate representative values for porosity and water saturation.
Estimates of ultimate recovery were
obtained after applying recovery factors to OOIP. These recovery factors were based on consideration of the type of energy inherent in the reservoirs, analyses of the petroleum, the structural positions of the properties, and the production histories. Reservoir performance parameters such as cumulative production, producing rate, reservoir pressure, gas-oil ratio behavior, and water production were considered in estimating recovery efficiencies used in determining gross ultimate recovery.
For depletion-type reservoirs or other
reservoirs where performance has disclosed a reliable decline in producing-rate trends or other diagnostic characteristics, reserves were estimated by the application of appropriate decline curves or other performance relationships. In analyzing decline curves, reserves were estimated to the calculated economic limits based on a forecast price and cost case, with no escalation applied to prices and costs.
In certain cases where the previously
named methods could not be used, reserves were estimated by analogy based upon historical performance of wells within the same reservoir.
10 DeGolyer and MacNaughton
The reserves estimates presented herein were performance based and considered monthly production data to December 31, 2013. Estimated cumulative production, as of December 31, 2013, was deducted from the gross ultimate recovery to determine the estimated gross reserves.
The Polvo field was discovered in 1993 by
Petrobras with the drilling of the 1-RJS-486A well. In 2000, during the Agência Nacional de Petróleo’s (ANP) second licensing round, the BM-C-8 concession area containing the Polvo field was awarded to Devon Energy do Brasil Ltda. (Devon) and partners. Devon continued field delineation drilling and development. A portion of the BM-C-8 concession area was relinquished following declaration of commerciality and the establishment of the Polvo Development Area ring fence. The BM-C-8 concession extends 27 years following declaration of commerciality (2005). In 2011, BP acquired Devon’s interest in the Polvo field, and in 2013 HRT O&G acquired BP’s interest in the field. In all reserves cases contained herein, the economic limit was reached before license expiration.
Production commenced in the Polvo field
in August 2007. Figure 15 shows the historical field production. During December 2013, the average daily production was 11,634 barrels of oil per day and 36,470 barrels of water per day. Cumulative oil production through December 31, 2013, was 31.3 million barrels. The average gravity of the produced Polvo crude is 21 degrees API. The producing gas-oil ratio in the field is less than 100 cubic feet per barrel and all produced gas is either used as fuel or flared.
The water depth in Polvo field ranges
from 90 to 250 meters. The field was developed with a drilling/production platform and an FPSO, both in water depth of approximately 100 meters. A multiphase pipeline transports the produced fluids from the platform to the FPSO. The primary processing facilities are located on the FPSO, which has a production capacity of 150,000 barrels of fluid per day. All producing wells are horizontal/highly deviated and are completed with electric submersible pumps (ESP). Based on pressure measurements and historical water production data, most of the Polvo field reservoirs produce with moderate to active aquifer support. A single water-injection well has been completed in the Maastrichtian reservoir.
An evaluation of the OOIP in the
Turonian East reservoir was performed to assist in estimating the potential results of additional development drilling. Three wells have penetrated the eastern area of
11 DeGolyer and MacNaughton
the Turonian reservoir: 7-POL-24HP-RJS (POL_Oy), 7-POL-23HP-RJS (POL_Ox), and 9-POL-22D-RJS (POL_O). Of these three wells, the POL_O well was the only well with sufficient well log data to estimate net oil pay thickness, which confirmed the isopach map constructed for the Turonian East reservoir (Figure 10). The highly deviated well encountered an estimated 30.9 meters of net oil pay with an apparent dip-corrected true vertical thickness of approximately 26.6 meters. Reservoir quality in the Turonian is excellent, with a weighted-average porosity of about 30 percent. Two additional wells, classified as proved undeveloped and probable, are planned to target the Turonian reservoir in the north and northeastern updip area of the accumulation.
Proved developed reserves were estimated
by analysis of individual well oil rate versus time decline-curve analysis. Proved undeveloped reserves were estimated for one future well location, the POL_Z well in the Turonian East reservoir. This location is a direct offset to the POL_Oy well and approximately 20 feet updip. The POL_Z well is expected to be drilled and to produce during the third quarter of 2014. Additional proved undeveloped reserves were estimated in the other reservoirs based on extension of the economic limit of the field by approximately 1 year with the drilling of the POL_Z well. Probable reserves were estimated for one additional location in the Turonian East reservoir (the POL_E well). This well would be drilled in the first quarter of 2015 to the east of the POL_Z well location. Additional probable reserves were estimated for more favorable production behavior in all reservoirs than that considered in estimating proved reserves. Possible reserves were also estimated for the Maastrichtian and Turonian reservoirs considering more favorable behavior than that used to estimate probable reserves.
No gas reserves were estimated for the
Polvo field, since there are no plans for gas sales. Table 1 presents a summary of the gross
and net oil reserves of the Polvo field. Table 2 presents reservoir parameters and gross oil reserves for the entire Polvo field. Table 3 presents reservoir parameters and gross oil reserves for the Turonian East reservoir (160-170 sand). The oil quantities shown on Table 3 are included in the field total data shown on Table 2.
12 DeGolyer and MacNaughton
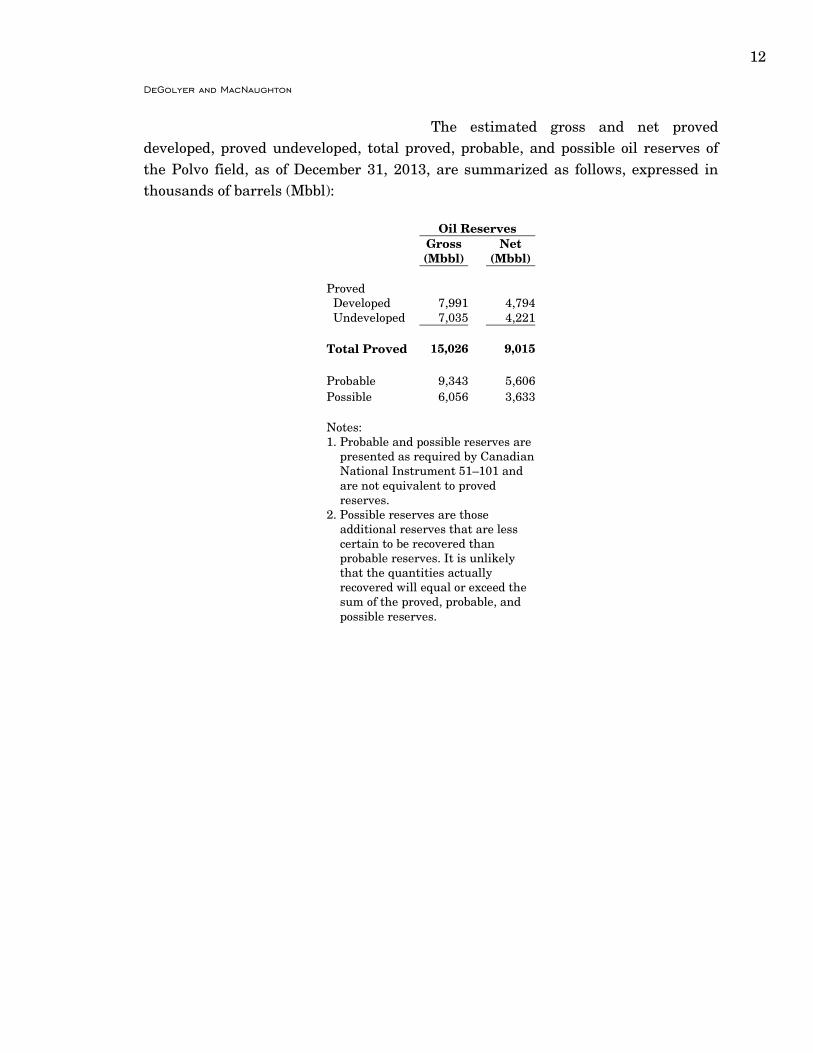
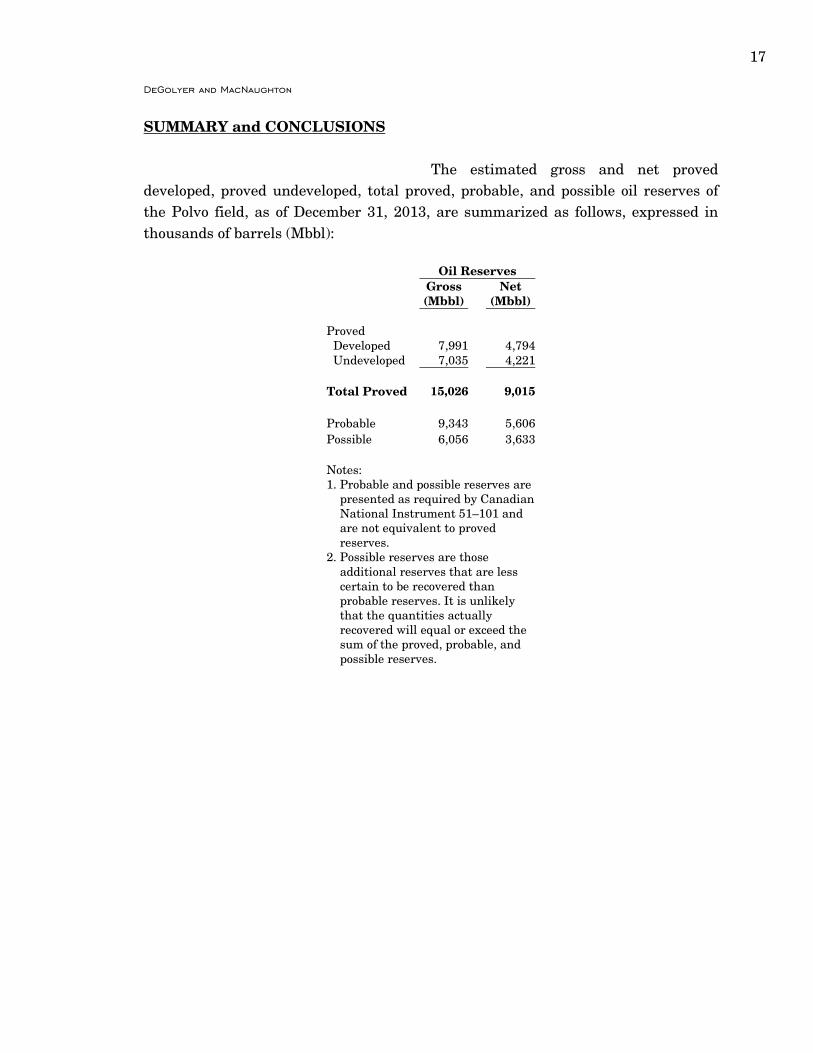
The estimated gross and net proved developed, proved undeveloped, total proved, probable, and possible oil reserves of the Polvo field, as of December 31, 2013, are summarized as follows, expressed in thousands of barrels (Mbbl):
Oil Reserves
Gross (Mbbl)
Net (Mbbl)
Proved Developed 7,991 4,794 Undeveloped 7,035 4,221 Total Proved 15,026 9,015 Probable 9,343 5,606 Possible 6,056 3,633 Notes: 1. Probable and possible reserves are
presented as required by Canadian National Instrument 51–101 and are not equivalent to proved reserves.
2. Possible reserves are those additional reserves that are less certain to be recovered than probable reserves. It is unlikely that the quantities actually recovered will equal or exceed the sum of the proved, probable, and possible reserves.
13 DeGolyer and MacNaughton
VALUATION of RESERVES
Revenue values in this report have been prepared using prices and costs and future price and cost assumptions that are compliant with Canadian National Instrument 51–101. A forecast price and cost case is presented herein using prices and costs provided by HRT O&G with no escalation applied to prices and costs. The future net revenue estimated herein, discounted and undiscounted, should not be construed to represent fair market value.
Values for proved, proved-plus-probable,
and proved-plus-probable-plus-possible reserves were based on projections of estimated future production and revenue prepared for these properties.
Estimates of future net revenue have
been made in accordance with the Government of Brazil’s Petroleum Law n° 9,478, the Petroleum Law of 1997. The fiscal terms outlined in the Petroleum Law of 1997 and assessable to HRT O&G as well as other economic assumptions used in this evaluation are presented as follows:
Brazilian Fiscal Terms
The Petroleum Law of 1997 affords the Brazilian Government three elements of government take: 1) petroleum levies consisting of royalties, a special participation fee, and surface rentals; 2) direct taxes, which are levied through the financial transaction tax, the corporate income tax, and two social contribution taxes; and 3) indirect taxes, which are levies on equipment and services used by companies engaged in exploration and production activities. Indirect tax levies for which HRT O&G may be responsible have not been included in the estimates of operating expenses and capital costs. Certain indirect levies are eligible for reimbursement from sales of refined products. The reimbursement of the indirect levies from refined product sales has not been accounted for in this evaluation.
14 DeGolyer and MacNaughton
Royalties
The federal royalty rate in Brazil varies by field between 5 and 10 percent. The Polvo field’s federal royalty rate is 10 percent as provided by HRT O&G. Oil royalty is assessed on the market value of the oil (and condensate), which is defined as the greater of the sales price or the market valuation as determined by the ANP. Gas royalty is levied on the market value of the gas production less gas injected.
Special Participation Fee
The special participation fee (SPF) is a tax assessed at the field level on a sliding scale basis that varies depending on the location of the field (onshore or offshore), water depth, level of production, and number of years on production. The tax basis for the SPF is similar to the tax basis for corporation tax (CIT) with some exceptions. Drilling costs are depreciated using a units-of-production basis for SPF, but expensed for CIT. An annual provision for abandonment costs is also deductible for SPF, but expensed in the year incurred for CIT. In years in which the SPF is paid there is an additional 1-percent research and development fee assessed.
Surface Rental Fees
Rental fees are payable to the ANP and vary by field, depending on stage of activity (exploration or development), geological characteristics, and location of sedimentary basin. The surface rental fees are included herein in the estimates of field operating expenses.
Corporate Income Tax
As advised by HRT O&G, Brazilian income taxes have not been considered in this evaluation.
15 DeGolyer and MacNaughton
Social Contribution Taxes
Two social contribution taxes are levied on the market value of oil and gas sales. The Contribution for the Worker’s Social Integration Program (PIS) is assessed at a rate of 1.65 percent and the Contribution for Social Security Funding (COFINS) is levied at a 7.6-percent rate. These taxes have not been considered in the future net revenues included herein.
Oil Prices
A price case compliant with provisions of Canadian National Instrument 51-101 was used in this evaluation. HRT O&G provided the 2013 crude oil sales data from the Polvo field. The 12-month average product price was U.S.$99.56 per barrel of oil, which was held constant over the life of the evaluation.
Operating Expenses and Capital Costs
The Polvo field operating costs were estimated based on information provided by HRT O&G related to the FPSO lease costs, platform cost, and other operating expenses. Based on these data, an algorithm of fixed and variable operating costs was developed for the field. The estimated gross fixed annual operating expenses were estimated to be U.S.$145 million per year and the gross variable expenses were estimated to be U.S.$5.50 per barrel. These cost estimates do not include any associated indirect taxes that may be assessed on these expenses. Capital costs have been estimated for the drilling of one additional proved undeveloped location and one additional probable location. The gross drilling, completion, and hook-up costs for each well were estimated to be U.S.$35 million based on the most recent drilling cost data provided by HRT O&G. Estimates of abandonment costs were based on information provided by HRT O&G and were included as an operating cost in the year following cessation of production. The gross
16 DeGolyer and MacNaughton
abandonment costs provided by HRT O&G were U.S.$80 million. All operating expenses and capital costs were projected in constant 2014 U.S. dollar terms. No general escalation that might result from inflation has been applied.
Exchange Rate
All costs and revenues included herein are estimated in U.S. dollars and have not been converted from other currencies.
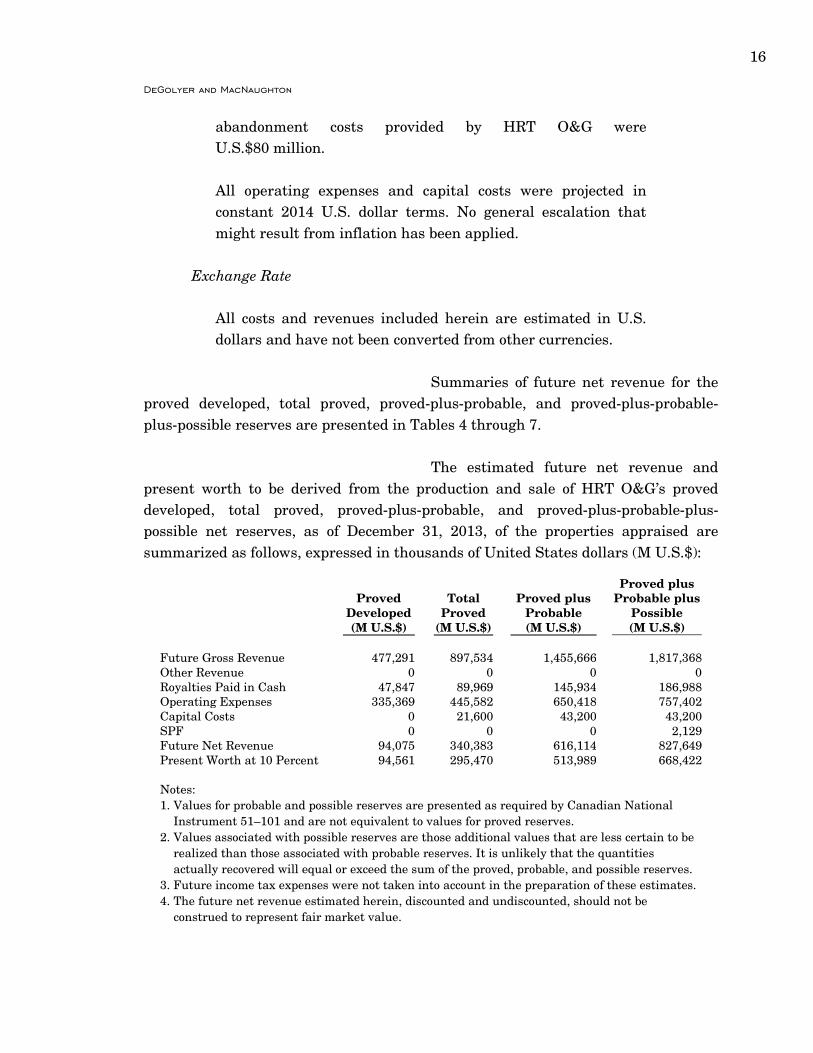
Summaries of future net revenue for the proved developed, total proved, proved-plus-probable, and proved-plus-probable-plus-possible reserves are presented in Tables 4 through 7.
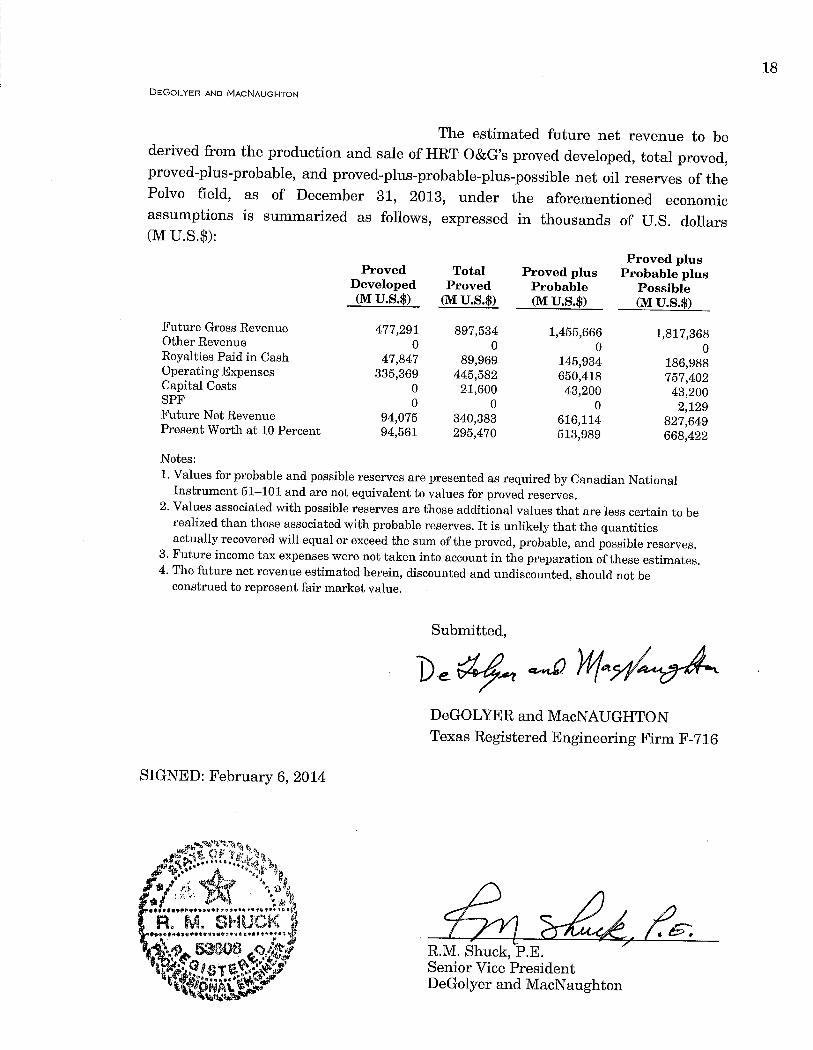
The estimated future net revenue and
present worth to be derived from the production and sale of HRT O&G’s proved developed, total proved, proved-plus-probable, and proved-plus-probable-plus-possible net reserves, as of December 31, 2013, of the properties appraised are summarized as follows, expressed in thousands of United States dollars (M U.S.$):
Proved Developed (M U.S.$)
Total Proved
(M U.S.$)
Proved plus Probable (M U.S.$)
Proved plus Probable plus
Possible (M U.S.$)
Future Gross Revenue 477,291 897,534 1,455,666 1,817,368 Other Revenue 0 0 0 0 Royalties Paid in Cash 47,847 89,969 145,934 186,988 Operating Expenses 335,369 445,582 650,418 757,402 Capital Costs 0 21,600 43,200 43,200 SPF 0 0 0 2,129 Future Net Revenue 94,075 340,383 616,114 827,649 Present Worth at 10 Percent 94,561 295,470 513,989 668,422 Notes: 1. Values for probable and possible reserves are presented as required by Canadian National
Instrument 51–101 and are not equivalent to values for proved reserves. 2. Values associated with possible reserves are those additional values that are less certain to be
realized than those associated with probable reserves. It is unlikely that the quantities actually recovered will equal or exceed the sum of the proved, probable, and possible reserves.
3. Future income tax expenses were not taken into account in the preparation of these estimates. 4. The future net revenue estimated herein, discounted and undiscounted, should not be
construed to represent fair market value.
17 DeGolyer and MacNaughton
SUMMARY and CONCLUSIONS
The estimated gross and net proved developed, proved undeveloped, total proved, probable, and possible oil reserves of the Polvo field, as of December 31, 2013, are summarized as follows, expressed in thousands of barrels (Mbbl):
Oil Reserves
Gross (Mbbl)
Net (Mbbl)
Proved Developed 7,991 4,794 Undeveloped 7,035 4,221 Total Proved 15,026 9,015 Probable 9,343 5,606 Possible 6,056 3,633 Notes: 1. Probable and possible reserves are
presented as required by Canadian National Instrument 51–101 and are not equivalent to proved reserves.
2. Possible reserves are those additional reserves that are less certain to be recovered than probable reserves. It is unlikely that the quantities actually recovered will equal or exceed the sum of the proved, probable, and possible reserves.
DeGolyer and MacNaughton
5001 Spring valley road Suite 800 east
Dallas, Texas 75244
CANADIAN NATIONAL INSTRUMENT 51-101 FORM 51-101F2
REPORT ON RESERVES DATA BY
INDEPENDENT QUALIFIED RESERVES EVALUATOR
To the board of directors of HRT Participacões em Petróleo S.A. (the “Company”):
1. We have evaluated the Company’s reserves data as of December 31, 2013. The reserves data are estimates of proved reserves and probable reserves and related future net revenue as of December 31, 2013, estimated using forecast prices and costs.
2. The reserves data are the responsibility of the Company’s management. Our
responsibility is to express an opinion on the reserves data based on our evaluation.
3. We carried out our evaluation in accordance with standards set out in the
Canadian Oil and Gas Evaluation Handbook (the "COGE Handbook") prepared jointly by the Society of Petroleum Evaluation Engineers (Calgary Chapter) and the Canadian Institute of Mining, Metallurgy & Petroleum (Petroleum Society).
4. Those standards require that we plan and perform an evaluation to assure
that reserves estimates are free of material misstatement. An evaluation also includes assessing whether the reserves data are in accordance with principles and definitions presented in the COGE Handbook.
5. The following table sets forth the estimated future net revenue (before
deduction of income taxes) in thousands of United States dollars (M U.S.$) for proved-plus-probable reserves, estimated using forecast prices and costs and calculated using a discount rate of 10 percent included in the reserves data of the Company evaluated by us for the year ended,
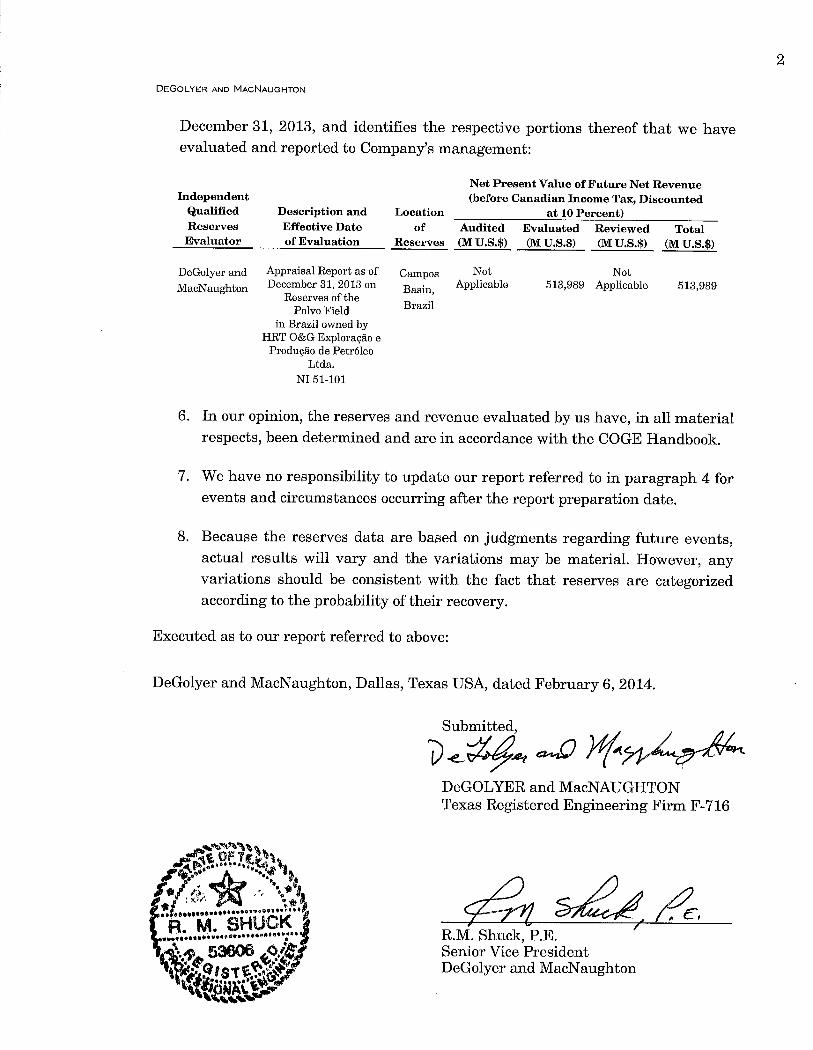
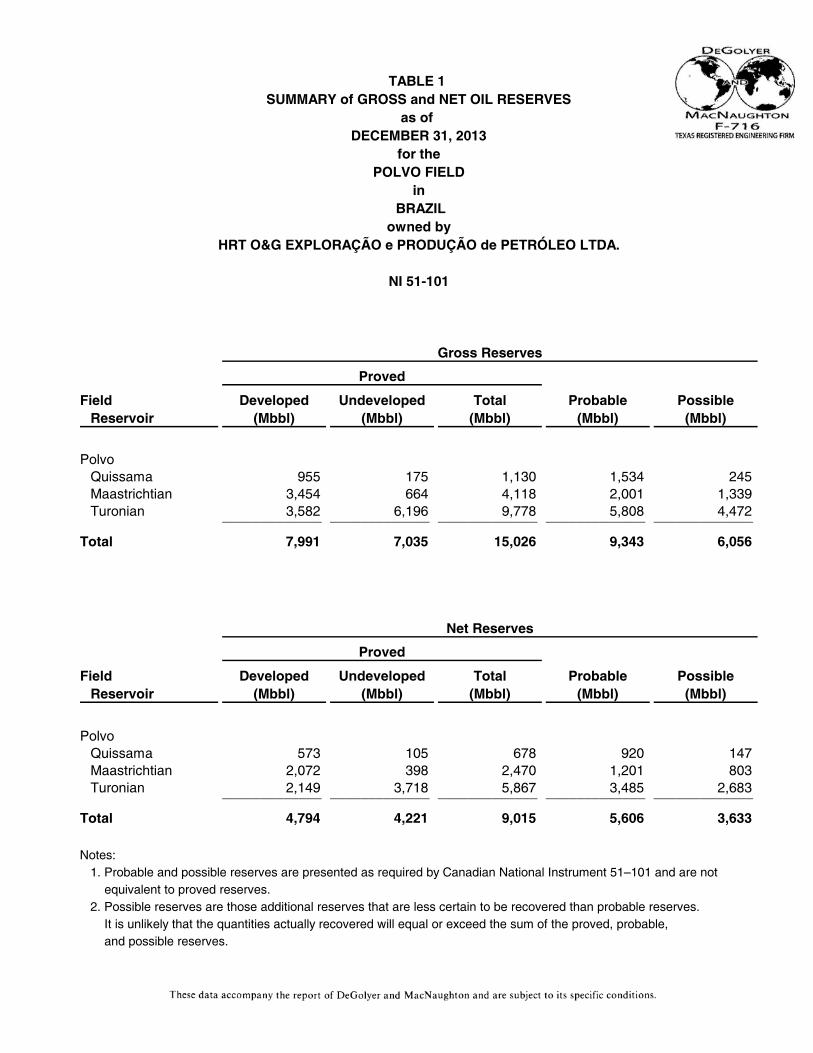
TABLE 1 SUMMARY of GROSS and NET OIL RESERVES
as of DECEMBER 31, 2013
for thePOLVO FIELD
in BRAZIL
owned byHRT O&G EXPLORAÇÃO e PRODUÇÃO de PETRÓLEO LTDA.
NI 51-101
Gross Reserves
Proved
Field Developed Undeveloped Total Probable PossibleReservoir (Mbbl) (Mbbl) (Mbbl) (Mbbl) (Mbbl)
PolvoQuissama 955 175 1,130 1,534 245Maastrichtian 3,454 664 4,118 2,001 1,339Turonian 3,582 6,196 9,778 5,808 4,472_____________ _____________ _____________ _____________ _____________
Total 7,991 7,035 15,026 9,343 6,056
Net Reserves
Proved
Field Developed Undeveloped Total Probable PossibleReservoir (Mbbl) (Mbbl) (Mbbl) (Mbbl) (Mbbl)
PolvoQuissama 573 105 678 920 147Maastrichtian 2,072 398 2,470 1,201 803Turonian 2,149 3,718 5,867 3,485 2,683_____________ _____________ _____________ _____________ _____________
Total 4,794 4,221 9,015 5,606 3,633
Notes:1. Probable and possible reserves are presented as required by Canadian National Instrument 51–101 and are not
equivalent to proved reserves.2. Possible reserves are those additional reserves that are less certain to be recovered than probable reserves.
It is unlikely that the quantities actually recovered will equal or exceed the sum of the proved, probable, and possible reserves.
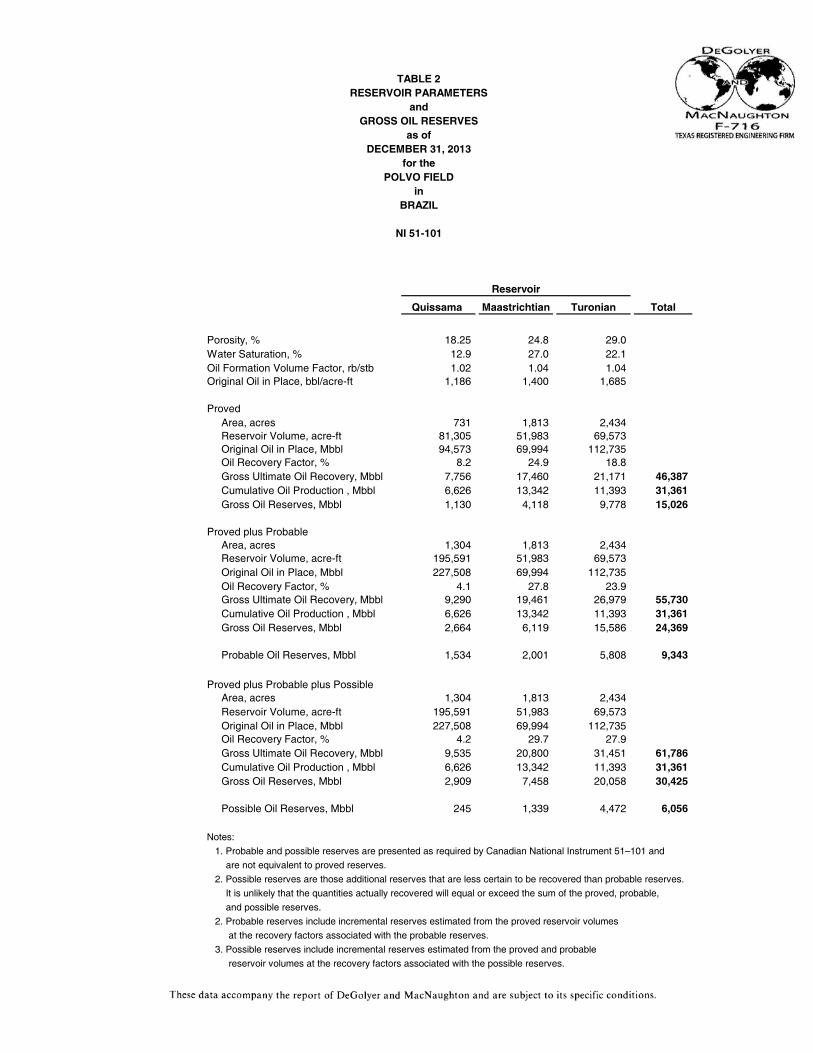
TABLE 2RESERVOIR PARAMETERS
andGROSS OIL RESERVES
as ofDECEMBER 31, 2013
for thePOLVO FIELD
inBRAZIL
NI 51-101
Reservoir
Quissama Maastrichtian Turonian Total
Porosity, % 18.25 24.8 29.0 Water Saturation, % 12.9 27.0 22.1 Oil Formation Volume Factor, rb/stb 1.02 1.04 1.04Original Oil in Place, bbl/acre-ft 1,186 1,400 1,685
ProvedArea, acres 731 1,813 2,434Reservoir Volume, acre-ft 81,305 51,983 69,573Original Oil in Place, Mbbl 94,573 69,994 112,735Oil Recovery Factor, % 8.2 24.9 18.8Gross Ultimate Oil Recovery, Mbbl 7,756 17,460 21,171 46,387Cumulative Oil Production , Mbbl 6,626 13,342 11,393 31,361Gross Oil Reserves, Mbbl 1,130 4,118 9,778 15,026
Proved plus ProbableArea, acres 1,304 1,813 2,434Reservoir Volume, acre-ft 195,591 51,983 69,573Original Oil in Place, Mbbl 227,508 69,994 112,735Oil Recovery Factor, % 4.1 27.8 23.9Gross Ultimate Oil Recovery, Mbbl 9,290 19,461 26,979 55,730Cumulative Oil Production , Mbbl 6,626 13,342 11,393 31,361Gross Oil Reserves, Mbbl 2,664 6,119 15,586 24,369
Probable Oil Reserves, Mbbl 1,534 2,001 5,808 9,343
Proved plus Probable plus PossibleArea, acres 1,304 1,813 2,434 Reservoir Volume, acre-ft 195,591 51,983 69,573 Original Oil in Place, Mbbl 227,508 69,994 112,735Oil Recovery Factor, % 4.2 29.7 27.9Gross Ultimate Oil Recovery, Mbbl 9,535 20,800 31,451 61,786Cumulative Oil Production , Mbbl 6,626 13,342 11,393 31,361Gross Oil Reserves, Mbbl 2,909 7,458 20,058 30,425
Possible Oil Reserves, Mbbl 245 1,339 4,472 6,056
Notes:
1. Probable and possible reserves are presented as required by Canadian National Instrument 51–101 and
are not equivalent to proved reserves.
2. Possible reserves are those additional reserves that are less certain to be recovered than probable reserves.
It is unlikely that the quantities actually recovered will equal or exceed the sum of the proved, probable,
and possible reserves.
2. Probable reserves include incremental reserves estimated from the proved reservoir volumes
at the recovery factors associated with the probable reserves.
3. Possible reserves include incremental reserves estimated from the proved and probable
reservoir volumes at the recovery factors associated with the possible reserves.
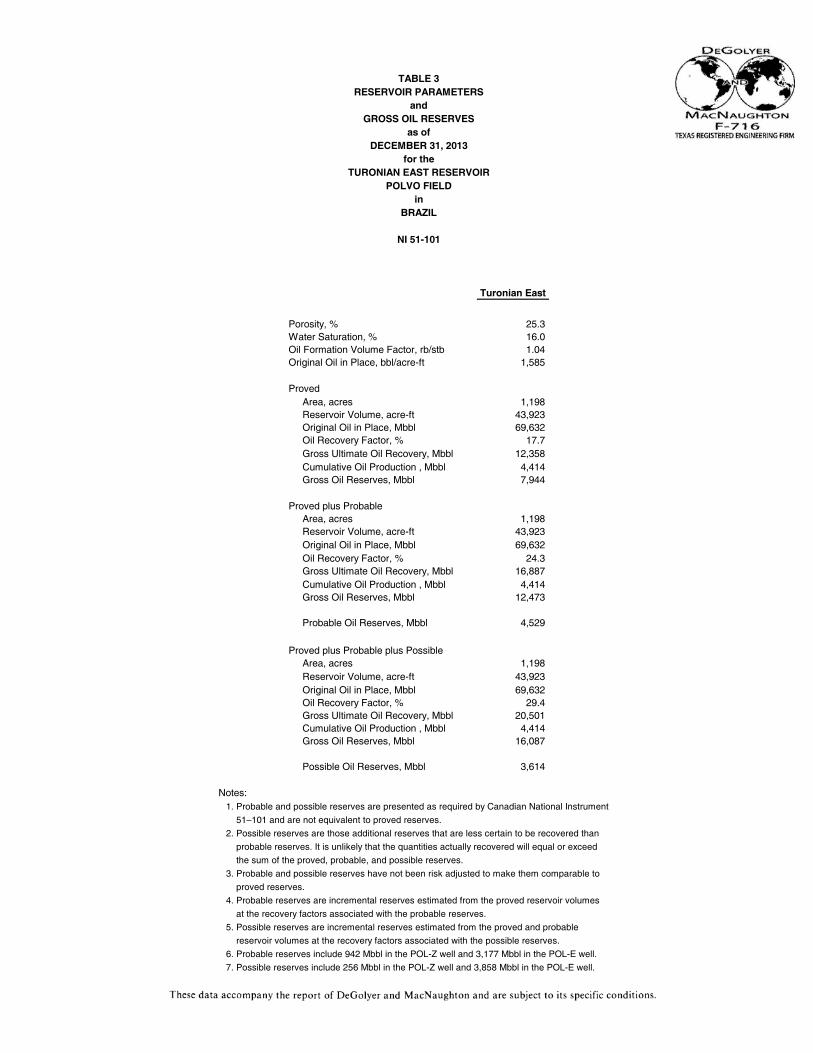
TABLE 3RESERVOIR PARAMETERS
andGROSS OIL RESERVES
as ofDECEMBER 31, 2013
for theTURONIAN EAST RESERVOIR
POLVO FIELDin
BRAZIL
NI 51-101
Turonian East
Porosity, % 25.3 Water Saturation, % 16.0 Oil Formation Volume Factor, rb/stb 1.04Original Oil in Place, bbl/acre-ft 1,585
ProvedArea, acres 1,198Reservoir Volume, acre-ft 43,923Original Oil in Place, Mbbl 69,632Oil Recovery Factor, % 17.7Gross Ultimate Oil Recovery, Mbbl 12,358Cumulative Oil Production , Mbbl 4,414Gross Oil Reserves, Mbbl 7,944
Proved plus ProbableArea, acres 1,198Reservoir Volume, acre-ft 43,923Original Oil in Place, Mbbl 69,632Oil Recovery Factor, % 24.3Gross Ultimate Oil Recovery, Mbbl 16,887Cumulative Oil Production , Mbbl 4,414Gross Oil Reserves, Mbbl 12,473
Probable Oil Reserves, Mbbl 4,529
Proved plus Probable plus PossibleArea, acres 1,198Reservoir Volume, acre-ft 43,923Original Oil in Place, Mbbl 69,632Oil Recovery Factor, % 29.4Gross Ultimate Oil Recovery, Mbbl 20,501Cumulative Oil Production , Mbbl 4,414Gross Oil Reserves, Mbbl 16,087
Possible Oil Reserves, Mbbl 3,614
Notes:1. Probable and possible reserves are presented as required by Canadian National Instrument
51–101 and are not equivalent to proved reserves.
2. Possible reserves are those additional reserves that are less certain to be recovered than
probable reserves. It is unlikely that the quantities actually recovered will equal or exceed
the sum of the proved, probable, and possible reserves.
3. Probable and possible reserves have not been risk adjusted to make them comparable to
proved reserves.
4. Probable reserves are incremental reserves estimated from the proved reservoir volumes
at the recovery factors associated with the probable reserves.
5. Possible reserves are incremental reserves estimated from the proved and probable
reservoir volumes at the recovery factors associated with the possible reserves.
6. Probable reserves include 942 Mbbl in the POL-Z well and 3,177 Mbbl in the POL-E well.
7. Possible reserves include 256 Mbbl in the POL-Z well and 3,858 Mbbl in the POL-E well.
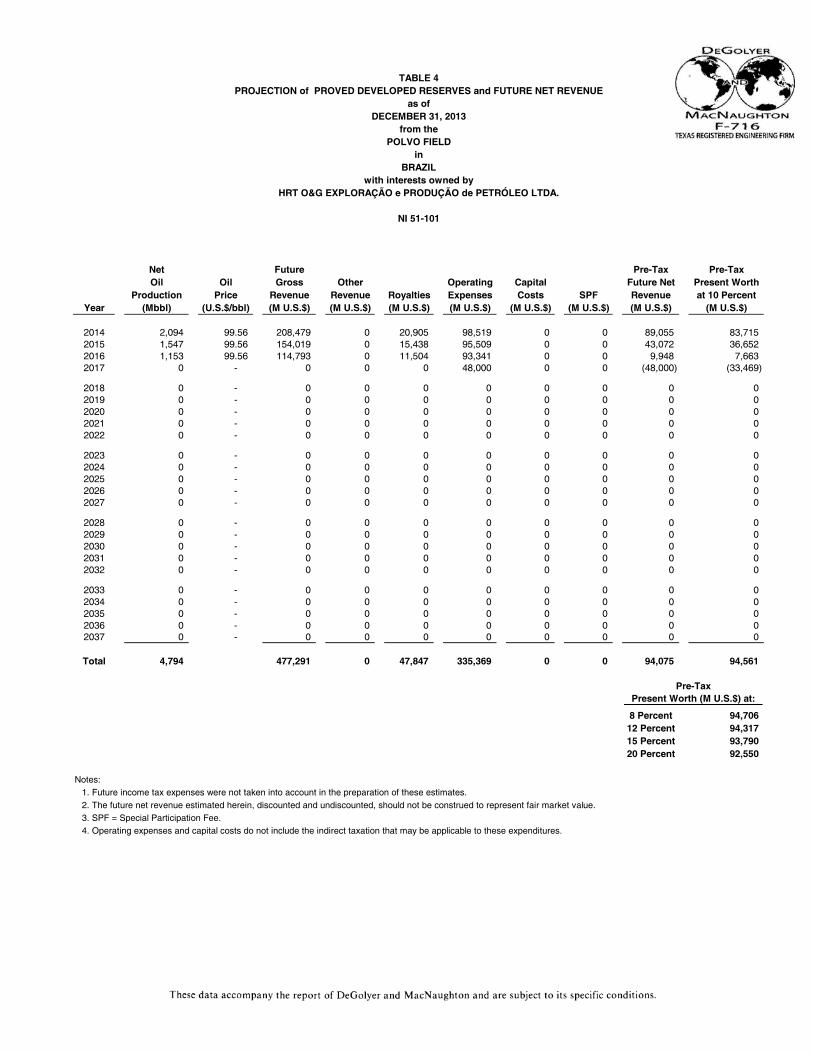
TABLE 4PROJECTION of PROVED DEVELOPED RESERVES and FUTURE NET REVENUE
as ofDECEMBER 31, 2013
from thePOLVO FIELD
inBRAZIL
with interests owned byHRT O&G EXPLORAÇÃO e PRODUÇÃO de PETRÓLEO LTDA.
NI 51-101
Net Future Pre-Tax Pre-TaxOil Oil Gross Other Operating Capital Future Net Present Worth
Production Price Revenue Revenue Royalties Expenses Costs SPF Revenue at 10 PercentYear (Mbbl) (U.S.$/bbl) (M U.S.$) (M U.S.$) (M U.S.$) (M U.S.$) (M U.S.$) (M U.S.$) (M U.S.$) (M U.S.$)
2014 2,094 99.56 208,479 0 20,905 98,519 0 0 89,055 83,7152015 1,547 99.56 154,019 0 15,438 95,509 0 0 43,072 36,6522016 1,153 99.56 114,793 0 11,504 93,341 0 0 9,948 7,6632017 0 - 0 0 0 48,000 0 0 (48,000) (33,469)
2018 0 - 0 0 0 0 0 0 0 02019 0 - 0 0 0 0 0 0 0 02020 0 - 0 0 0 0 0 0 0 02021 0 - 0 0 0 0 0 0 0 02022 0 - 0 0 0 0 0 0 0 0
2023 0 - 0 0 0 0 0 0 0 02024 0 - 0 0 0 0 0 0 0 02025 0 - 0 0 0 0 0 0 0 02026 0 - 0 0 0 0 0 0 0 02027 0 - 0 0 0 0 0 0 0 0
2028 0 - 0 0 0 0 0 0 0 02029 0 - 0 0 0 0 0 0 0 02030 0 - 0 0 0 0 0 0 0 02031 0 - 0 0 0 0 0 0 0 02032 0 - 0 0 0 0 0 0 0 0
2033 0 - 0 0 0 0 0 0 0 02034 0 - 0 0 0 0 0 0 0 02035 0 - 0 0 0 0 0 0 0 02036 0 - 0 0 0 0 0 0 0 02037 0 - 0 0 0 0 0 0 0 0
Total 4,794 477,291 0 47,847 335,369 0 0 94,075 94,561
Pre-TaxPresent Worth (M U.S.$) at:
8 Percent 94,70612 Percent 94,31715 Percent 93,79020 Percent 92,550
Notes:1. Future income tax expenses were not taken into account in the preparation of these estimates.2. The future net revenue estimated herein, discounted and undiscounted, should not be construed to represent fair market value.3. SPF = Special Participation Fee.4. Operating expenses and capital costs do not include the indirect taxation that may be applicable to these expenditures.

TABLE 5PROJECTION of TOTAL PROVED RESERVES and FUTURE NET REVENUE
as ofDECEMBER 31, 2013
from thePOLVO FIELD
inBRAZIL
with interests owned byHRT O&G EXPLORAÇÃO e PRODUÇÃO de PETRÓLEO LTDA.
NI 51-101
Net Future Pre-Tax Pre-TaxOil Oil Gross Other Operating Capital Future Net Present Worth
Production Price Revenue Revenue Royalties Expenses Costs SPF Revenue at 10 PercentYear (Mbbl) (U.S.$/bbl) (M U.S.$) (M U.S.$) (M U.S.$) (M U.S.$) (M U.S.$) (M U.S.$) (M U.S.$) (M U.S.$)
2014 2,502 99.56 249,099 0 24,965 100,759 21,600 0 101,775 95,6732015 2,782 99.56 276,976 0 27,768 102,302 0 0 146,906 125,0082016 2,285 99.56 227,495 0 22,804 99,567 0 0 105,124 80,9752017 1,446 99.56 143,964 0 14,432 94,954 0 0 34,578 24,110
2018 0 - 0 0 0 48,000 0 0 (48,000) (30,296)2019 0 - 0 0 0 0 0 0 0 02020 0 - 0 0 0 0 0 0 0 02021 0 - 0 0 0 0 0 0 0 02022 0 - 0 0 0 0 0 0 0 0
2023 0 - 0 0 0 0 0 0 0 02024 0 - 0 0 0 0 0 0 0 02025 0 - 0 0 0 0 0 0 0 02026 0 - 0 0 0 0 0 0 0 02027 0 - 0 0 0 0 0 0 0 0
2028 0 - 0 0 0 0 0 0 0 02029 0 - 0 0 0 0 0 0 0 02030 0 - 0 0 0 0 0 0 0 02031 0 - 0 0 0 0 0 0 0 02032 0 - 0 0 0 0 0 0 0 0
2033 0 - 0 0 0 0 0 0 0 02034 0 - 0 0 0 0 0 0 0 02035 0 - 0 0 0 0 0 0 0 02036 0 - 0 0 0 0 0 0 0 02037 0 - 0 0 0 0 0 0 0 0
Total 9,015 897,534 0 89,969 445,582 21,600 0 340,383 295,470
Pre-TaxPresent Worth (M U.S.$) at:
8 Percent 303,93412 Percent 287,25915 Percent 275,41120 Percent 256,879
Notes:1. Future income tax expenses were not taken into account in the preparation of these estimates.2. The future net revenue estimated herein, discounted and undiscounted, should not be construed to represent fair market value.3. SPF = Special Participation Fee.4. Operating expenses and capital costs do not include the indirect taxation that may be applicable to these expenditures.
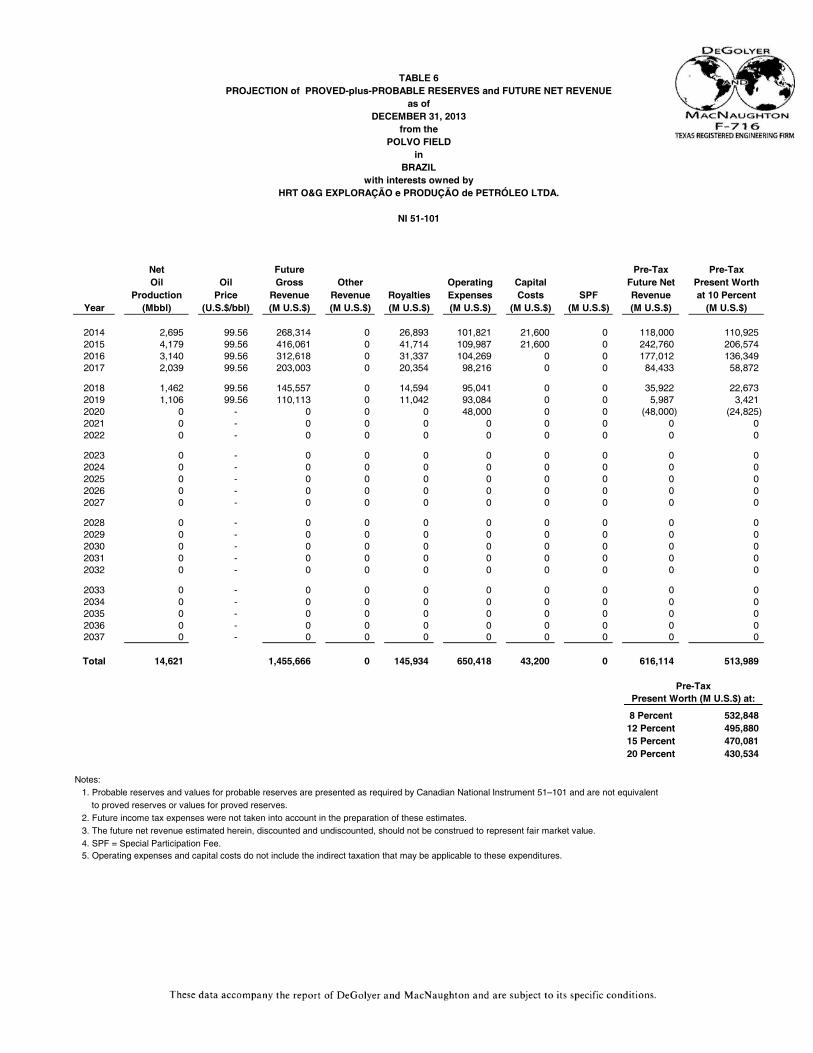
TABLE 6PROJECTION of PROVED-plus-PROBABLE RESERVES and FUTURE NET REVENUE
as ofDECEMBER 31, 2013
from thePOLVO FIELD
inBRAZIL
with interests owned byHRT O&G EXPLORAÇÃO e PRODUÇÃO de PETRÓLEO LTDA.
NI 51-101
Net Future Pre-Tax Pre-TaxOil Oil Gross Other Operating Capital Future Net Present Worth
Production Price Revenue Revenue Royalties Expenses Costs SPF Revenue at 10 PercentYear (Mbbl) (U.S.$/bbl) (M U.S.$) (M U.S.$) (M U.S.$) (M U.S.$) (M U.S.$) (M U.S.$) (M U.S.$) (M U.S.$)
2014 2,695 99.56 268,314 0 26,893 101,821 21,600 0 118,000 110,9252015 4,179 99.56 416,061 0 41,714 109,987 21,600 0 242,760 206,5742016 3,140 99.56 312,618 0 31,337 104,269 0 0 177,012 136,3492017 2,039 99.56 203,003 0 20,354 98,216 0 0 84,433 58,872
2018 1,462 99.56 145,557 0 14,594 95,041 0 0 35,922 22,6732019 1,106 99.56 110,113 0 11,042 93,084 0 0 5,987 3,4212020 0 - 0 0 0 48,000 0 0 (48,000) (24,825)2021 0 - 0 0 0 0 0 0 0 02022 0 - 0 0 0 0 0 0 0 0
2023 0 - 0 0 0 0 0 0 0 02024 0 - 0 0 0 0 0 0 0 02025 0 - 0 0 0 0 0 0 0 02026 0 - 0 0 0 0 0 0 0 02027 0 - 0 0 0 0 0 0 0 0
2028 0 - 0 0 0 0 0 0 0 02029 0 - 0 0 0 0 0 0 0 02030 0 - 0 0 0 0 0 0 0 02031 0 - 0 0 0 0 0 0 0 02032 0 - 0 0 0 0 0 0 0 0
2033 0 - 0 0 0 0 0 0 0 02034 0 - 0 0 0 0 0 0 0 02035 0 - 0 0 0 0 0 0 0 02036 0 - 0 0 0 0 0 0 0 02037 0 - 0 0 0 0 0 0 0 0
Total 14,621 1,455,666 0 145,934 650,418 43,200 0 616,114 513,989
Pre-TaxPresent Worth (M U.S.$) at:
8 Percent 532,84812 Percent 495,88015 Percent 470,08120 Percent 430,534
Notes:1. Probable reserves and values for probable reserves are presented as required by Canadian National Instrument 51–101 and are not equivalent
to proved reserves or values for proved reserves.2. Future income tax expenses were not taken into account in the preparation of these estimates.3. The future net revenue estimated herein, discounted and undiscounted, should not be construed to represent fair market value.4. SPF = Special Participation Fee.5. Operating expenses and capital costs do not include the indirect taxation that may be applicable to these expenditures.

TABLE 7PROJECTION of PROVED-plus-PROBABLE-plus-POSSIBLE RESERVES and FUTURE NET REVENUE
as ofDECEMBER 31, 2013
from thePOLVO FIELD
inBRAZIL
with interests owned byHRT O&G EXPLORAÇÃO e PRODUÇÃO de PETRÓLEO LTDA.
NI 51-101
Net Future Pre-Tax Pre-TaxOil Oil Gross Other Operating Capital Future Net Present Worth
Production Price Revenue Revenue Royalties Expenses Costs SPF Revenue at 10 PercentYear (Mbbl) (U.S.$/bbl) (M U.S.$) (M U.S.$) (M U.S.$) (M U.S.$) (M U.S.$) (M U.S.$) (M U.S.$) (M U.S.$)
2014 2,698 99.56 268,613 0 26,924 101,839 21,600 0 118,250 111,1602015 4,809 99.56 478,784 0 52,802 113,453 21,600 2,129 288,800 245,7512016 3,860 99.56 384,302 0 38,522 108,230 0 0 237,550 182,9802017 2,503 99.56 249,199 0 24,983 100,767 0 0 123,449 86,077
2018 1,822 99.56 181,398 0 18,181 97,020 0 0 66,197 41,7822019 1,415 99.56 140,877 0 14,126 94,784 0 0 31,967 18,2642020 1,147 99.56 114,195 0 11,450 93,309 0 0 9,436 4,8802021 0 - 0 0 0 48,000 0 0 (48,000) (22,472)2022 0 - 0 0 0 0 0 0 0 0
2023 0 - 0 0 0 0 0 0 0 02024 0 - 0 0 0 0 0 0 0 02025 0 - 0 0 0 0 0 0 0 02026 0 - 0 0 0 0 0 0 0 02027 0 - 0 0 0 0 0 0 0 0
2028 0 - 0 0 0 0 0 0 0 02029 0 - 0 0 0 0 0 0 0 02030 0 - 0 0 0 0 0 0 0 02031 0 - 0 0 0 0 0 0 0 02032 0 - 0 0 0 0 0 0 0 0
2033 0 - 0 0 0 0 0 0 0 02034 0 - 0 0 0 0 0 0 0 02035 0 - 0 0 0 0 0 0 0 02036 0 - 0 0 0 0 0 0 0 02037 0 - 0 0 0 0 0 0 0 0
Total 18,254 1,817,368 0 186,988 757,402 43,200 2,129 827,649 668,422
Pre-TaxPresent Worth (M U.S.$) at:
8 Percent 697,16312 Percent 641,10315 Percent 602,64520 Percent 544,738
Notes:1. Probable and possible reserves and values for probable and possible reserves are presented as required by Canadian National Instrument 51–101
and are not equivalent to proved reserves or values for proved reserves.2. Values associated with possible reserves are those additional values that are less certain to be realized than those associated with probable reserves.
It is unlikely that the quantities actually recovered will equal or exceed the sum of the proved, probable, and possible reserves.3. Future income tax expenses were not taken into account in the preparation of these estimates.4. The future net revenue estimated herein, discounted and undiscounted, should not be construed to represent fair market value.5. SPF = Special Participation Fee.6. Operating expenses and capital costs do not include the indirect taxation that may be applicable to these expenditures.
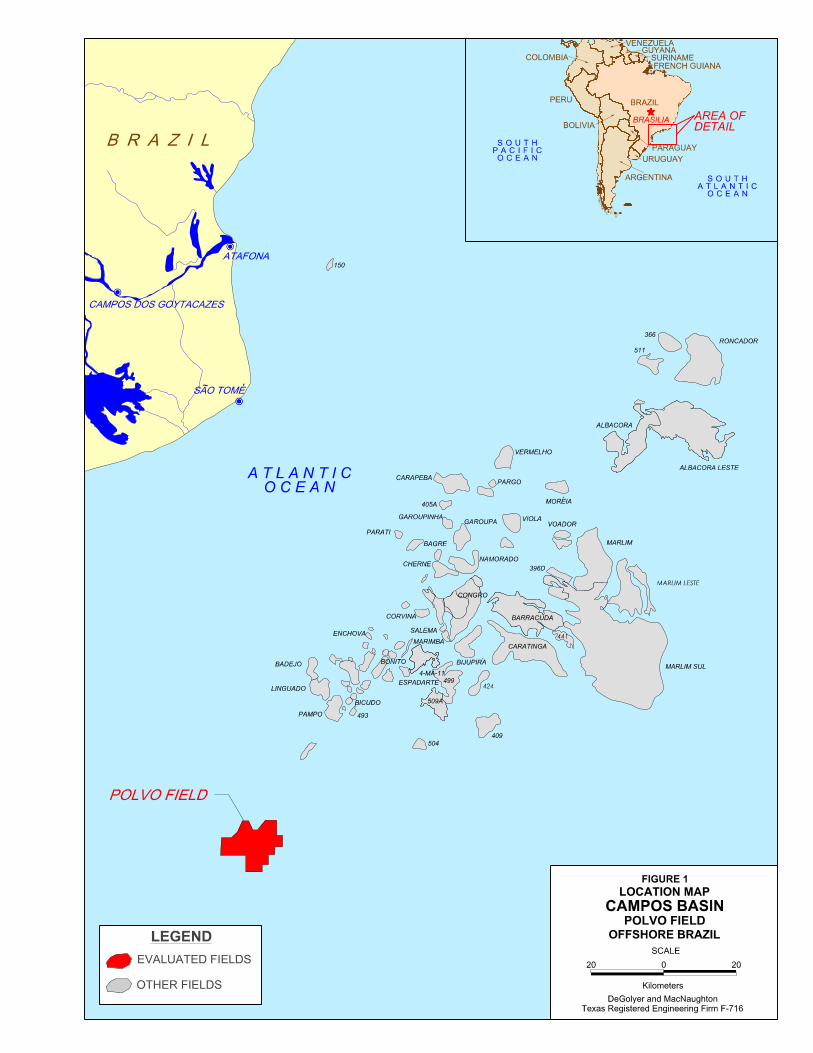
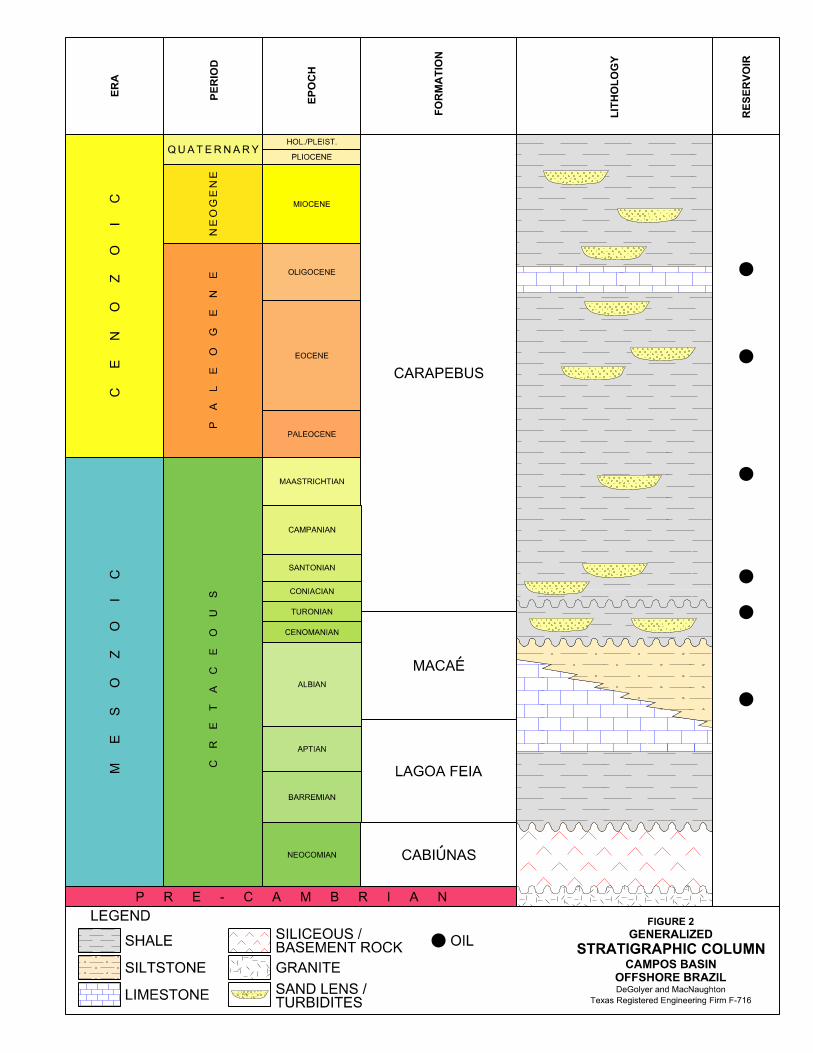

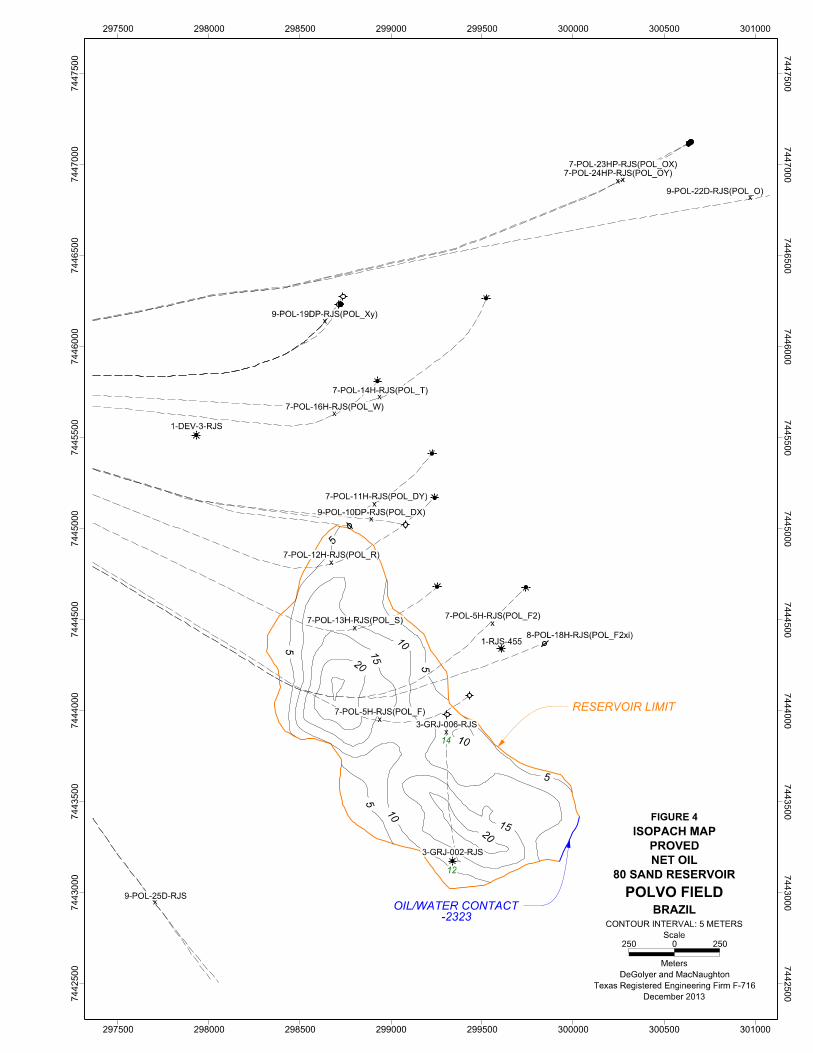
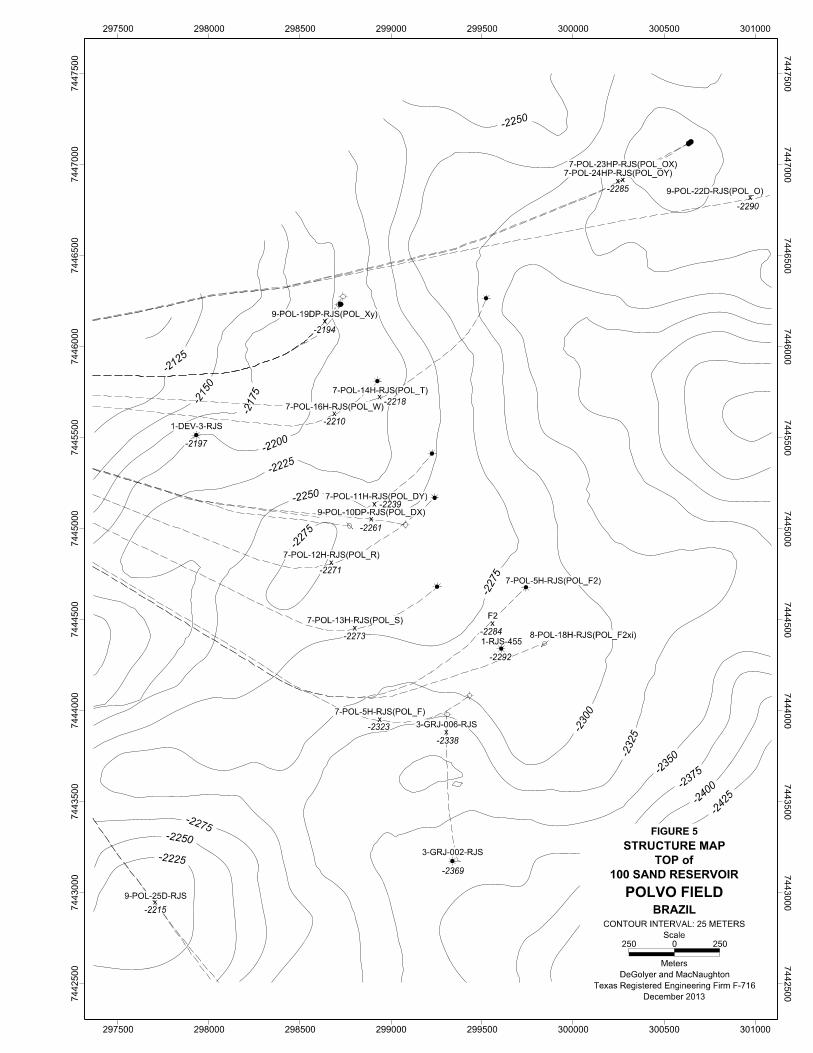
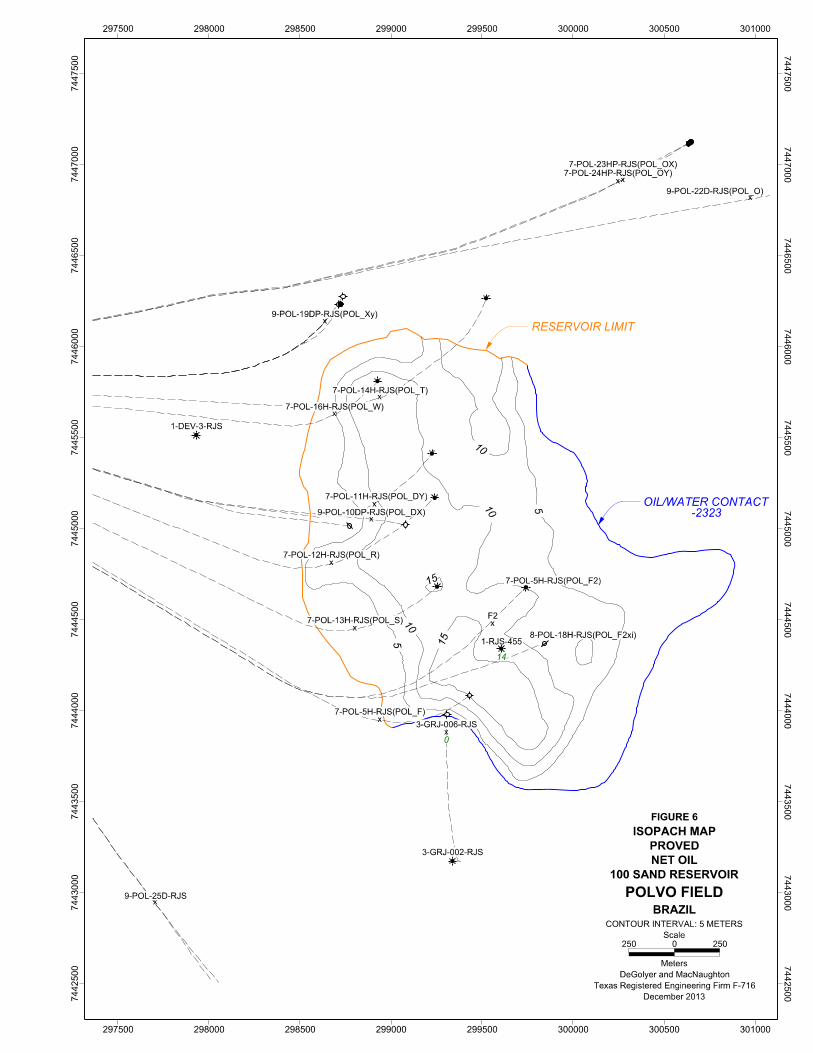
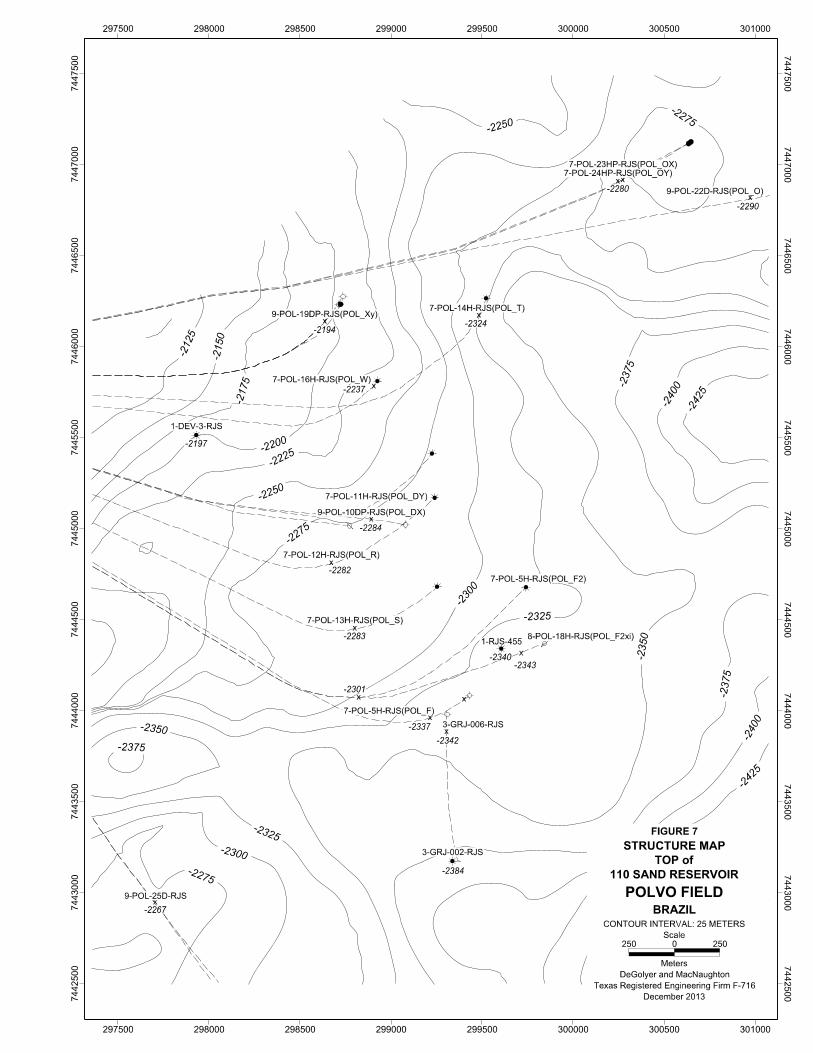
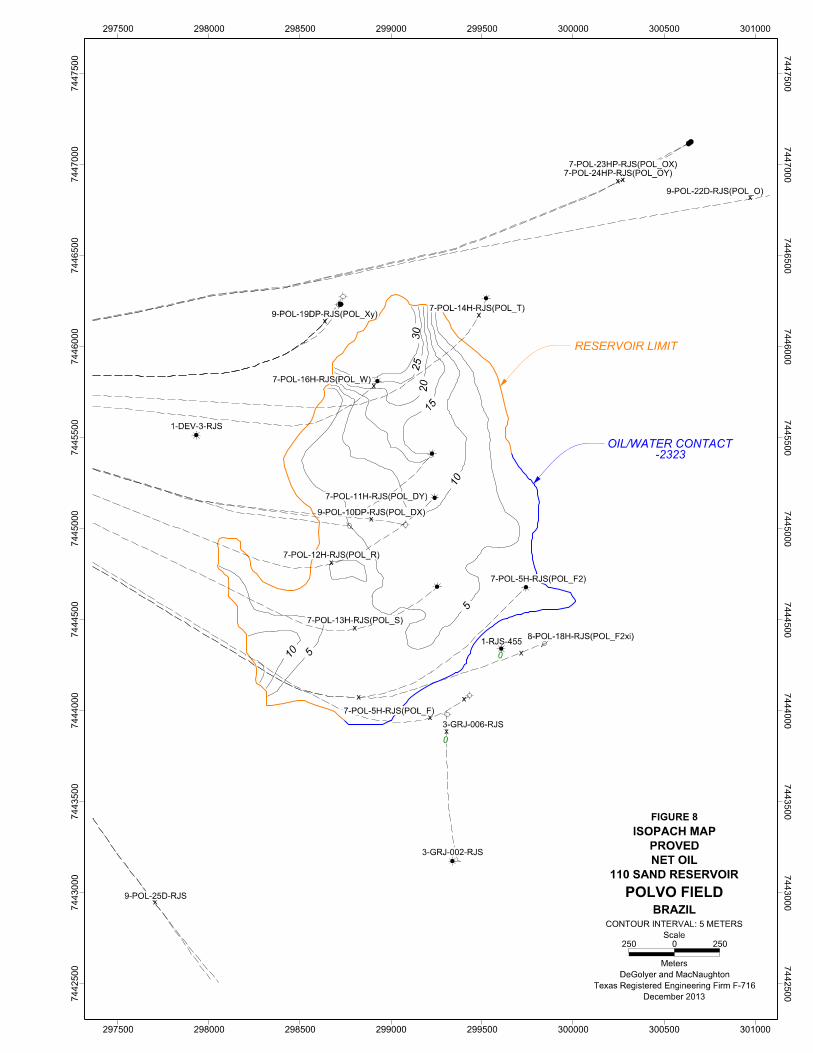
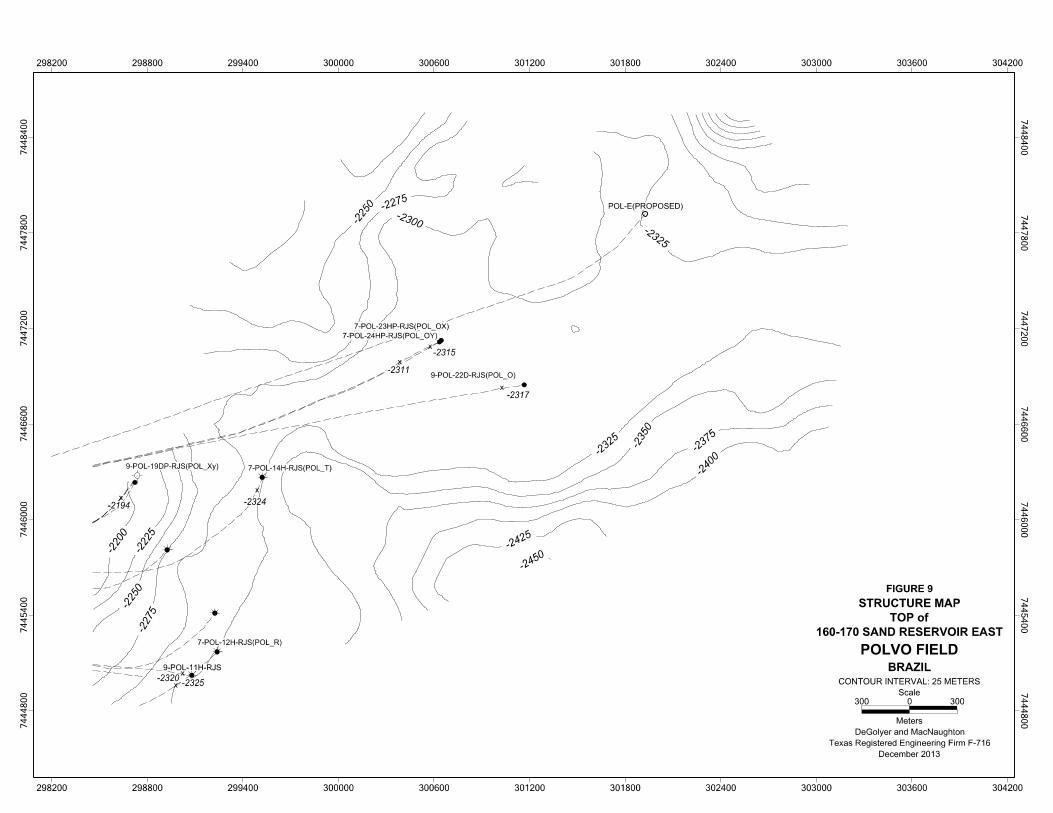
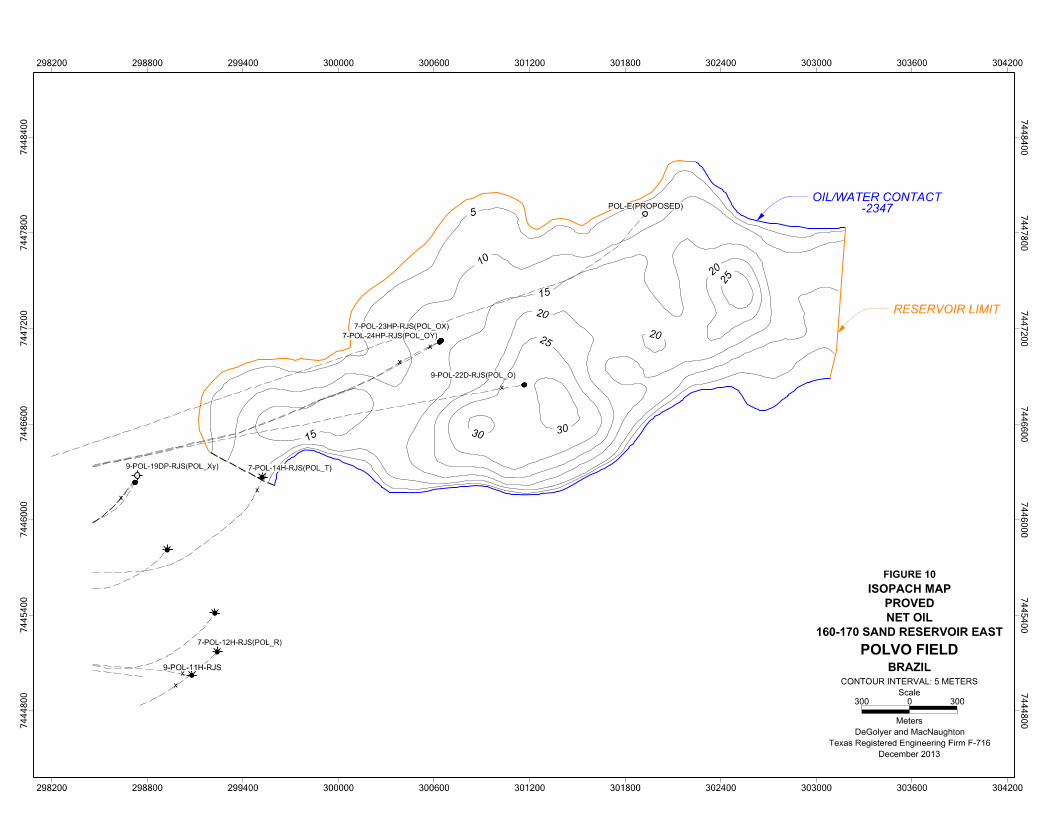
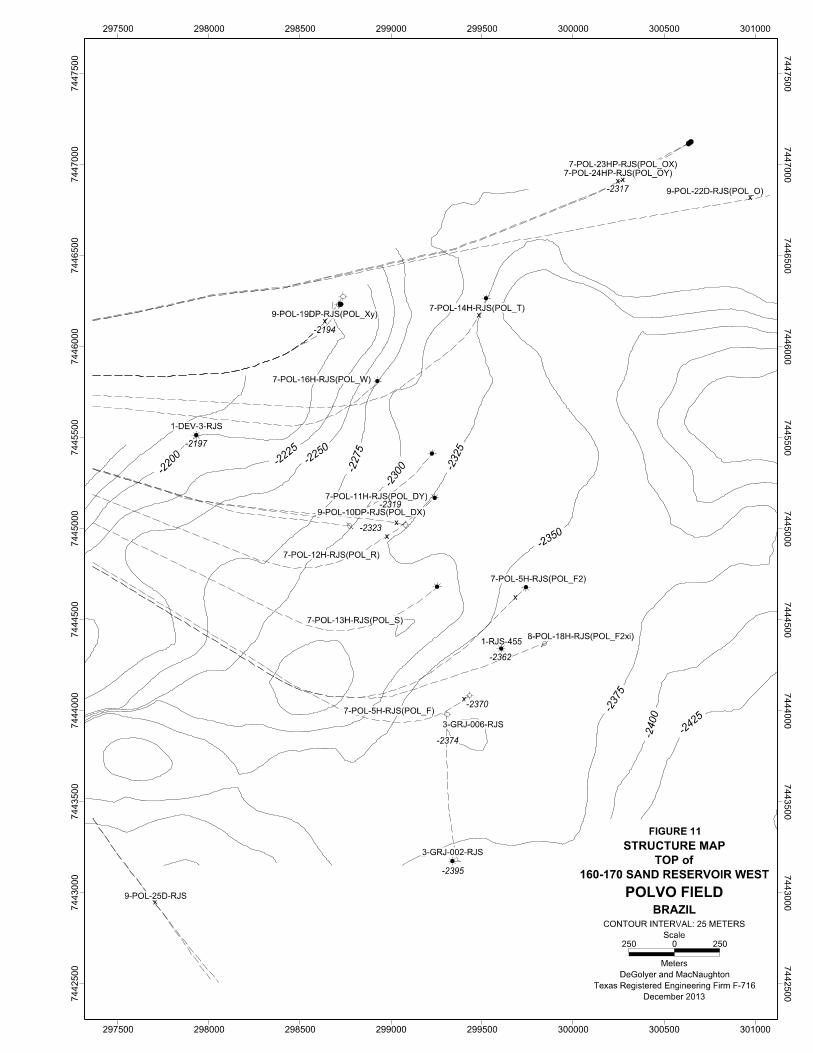
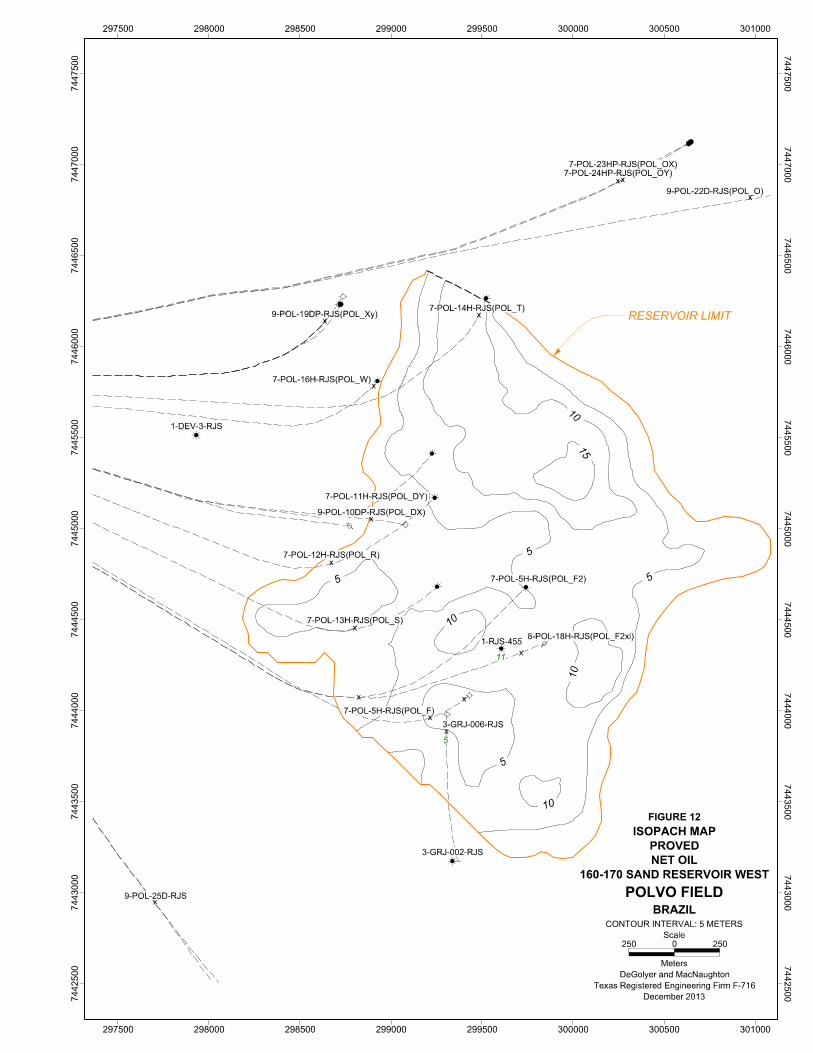
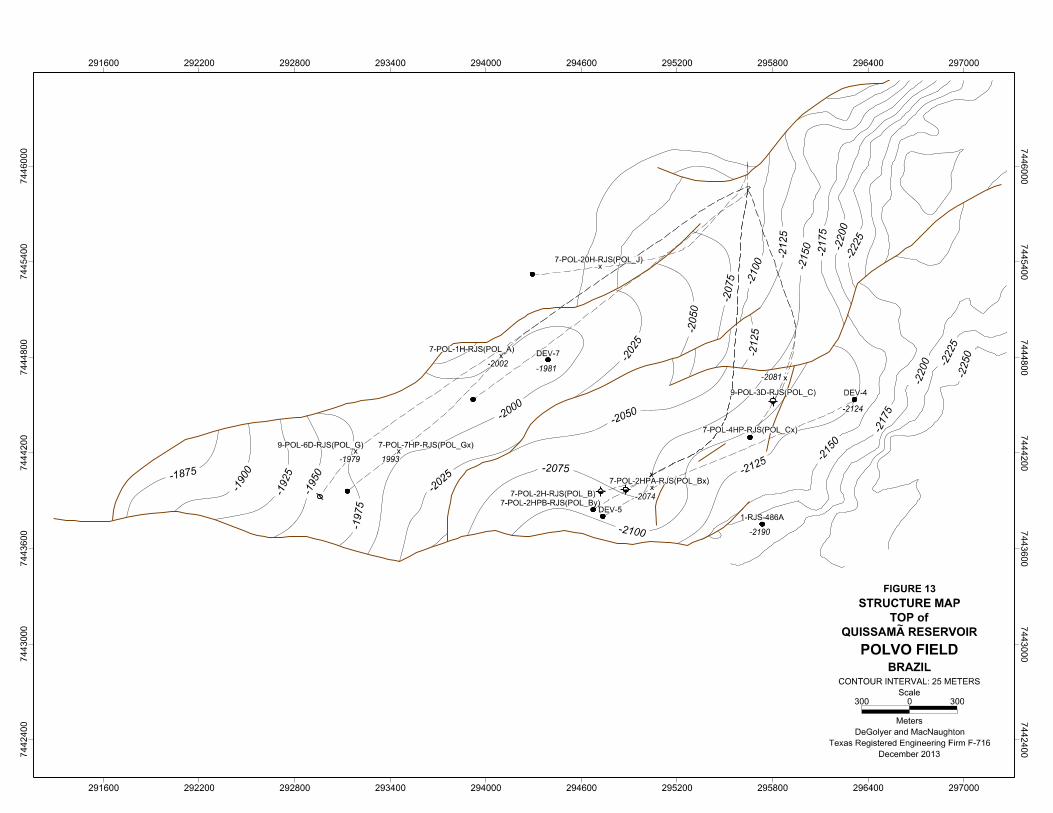
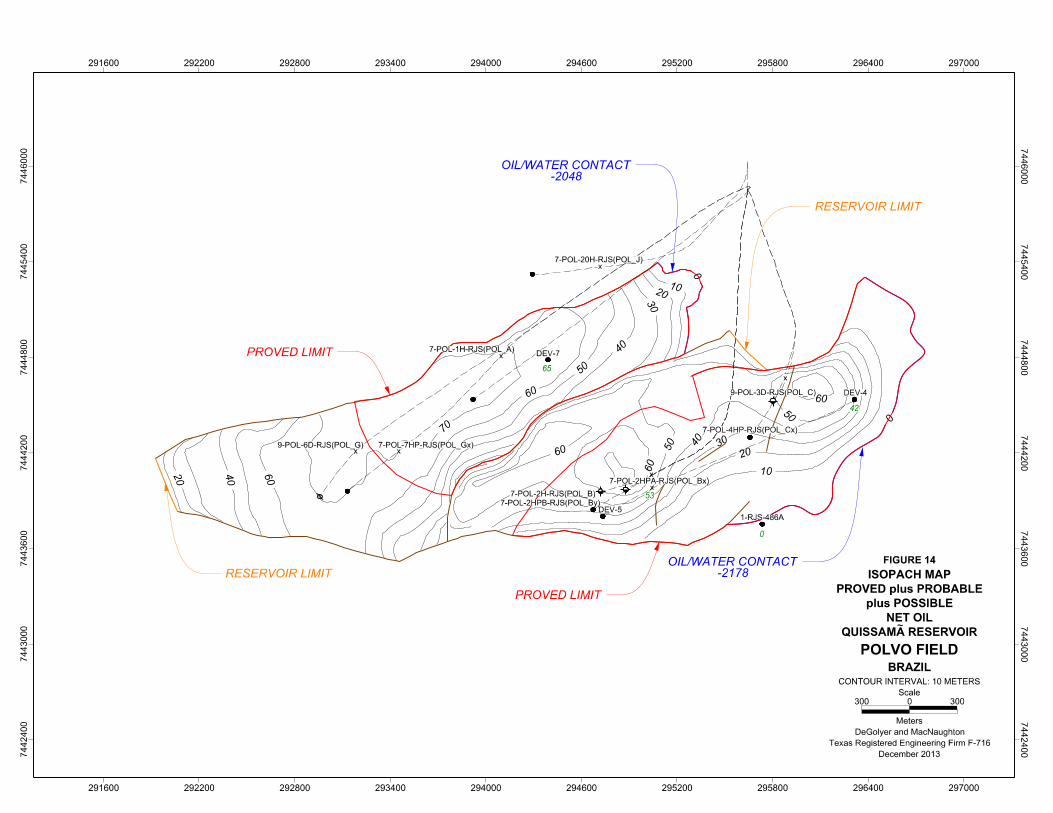
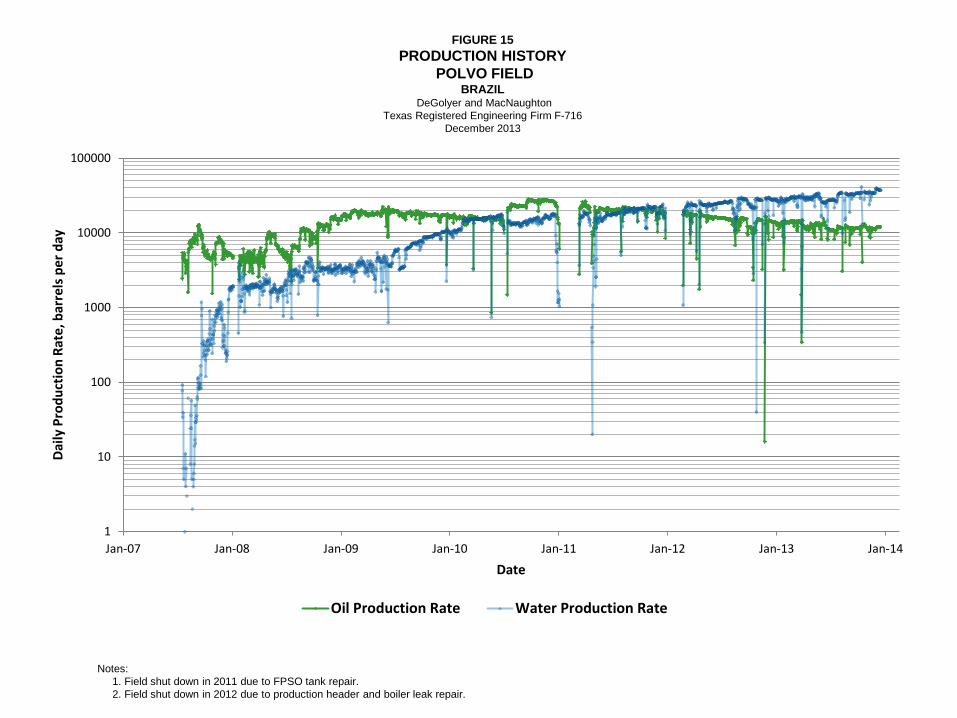
FIGURE 15 PRODUCTION HISTORY
POLVO FIELD BRAZIL
DeGolyer and MacNaughton Texas Registered Engineering Firm F-716
December 2013
Notes: 1. Field shut down in 2011 due to FPSO tank repair. 2. Field shut down in 2012 due to production header and boiler leak repair.
1
10
100
1000
10000
100000
Jan-07 Jan-08 Jan-09 Jan-10 Jan-11 Jan-12 Jan-13 Jan-14
Daily
Pro
duct
ion
Rate
, bar
rels
per
day
Date
Oil Production Rate Water Production Rate