defying gravity: the imperial economic conference and … · defying gravity: the imperial economic...
TRANSCRIPT
Available online at www.sciencedirect.com
ScienceDirect
www.elsevier.com/locate/eehExplorations in Economic History 53 (2014) 19–39
Defying gravity: The Imperial Economic Conference and thereorientation of Canadian trade☆
David S. Jacks
Simon Fraser University and NBER. Department of Economics, Simon Fraser University, 8888 University Drive, Burnaby, BC, V5A 1S6, Canada
Received 6 August 2013Available online 21 December 2013
Abstract
In the wake of the Great Depression, the Canadian government embarked on a stunning reversal in its commercial policy. A keyelement of its response was the promotion of intra-imperial trade at the Imperial Economic Conference of 1932. This paperaddresses whether or not Canada was able to defy gravity and divert trade flows towards other signatories at Ottawa. The resultssuggest that the conference was a failure from this perspective. Potential sources of this failure include unreasonable expectationsabout the likely reductions in trade costs and a neglect of key considerations related to certainty and credibility.© 2013 Elsevier Inc. All rights reserved.
Keywords: Imperial Economic Conference; Interwar trade; Preferential trade agreements
1. Introduction
The collapse of international trade in the wake ofthe Global Financial Crisis has led to fundamentalreconsiderations of the structure and sustainability of theglobal economy. Although the sources of this trade bustare still debated, changes in the composition of output andtrade, the role of inventories, and issues related to tradecredit and the spread of cross-border supply chains are allclearly implicated (cf. Alessandria et al., 2010; Bems et
☆ This paper was written while the author was a visitor at UCLA, and he thapaper's editor and referees along with Jeremy Atack, Jen Baggs, Mario Crusuggestions and appreciates the comments from seminars at Arizona, ANU, CUCMerced, Vanderbilt, Waterloo, and Western Ontario as well as from the 2Network in Economic History meetings, the 2011 European Historical Econthe 2011 Rocky Mountain Empirical Trade meetings. Finally, the author gCouncil of Canada for research support.
E-mail address: [email protected].
0014-4983/$ - see front matter © 2013 Elsevier Inc. All rights reserved.http://dx.doi.org/10.1016/j.eeh.2013.12.002
al., 2010; Chor and Manova, 2012; Eaton et al., 2010;Levchenko et al., 2010). What has been less contentiousis the appropriate response of policymakers with respectto commercial policy. In part, a firm and long-standingcommitment to the cause of free trade ensured the quickrecovery of international trade volumes to pre-crisishighs. This recent experience, of course, comes inmarkedcontrast to that of the interwar period.
In this paper, Canada's engagement with interna-tional markets during the interwar period is explored.
nks the Department of Economics for its hospitality. He also thanks thecini, Krishna Pendakur, Leah Platt Boustan, and Almos Tassonyi foraltech, Carleton, La Trobe, LSE, New South Wales, Queen's, Toronto,011 All-UC Group/Caltech/Huntington Conference, the 2011 Canadianomics Society meetings, the 2011 NBER DAE Summer Institute, andratefully acknowledges the Social Science and Humanities Research
20 D.S. Jacks / Explorations in Economic History 53 (2014) 19–39
In particular, the implications of the Canadian policyresponse in the wake of the Great Depression andthe erection of foreign trade barriers, most notably inthe form of Smoot-Hawley in the United States, areconsidered. Apart from home-grown tariff legislation,a key element of the Canadian response was thepromotion of intra-imperial trade at the ImperialEconomic (or Ottawa) Conference of 1932. Thisrepresented a stunning reversal in Canadian commer-cial policy which had previously emphasized main-taining continued access to US goods and markets.Thus, drawing on a well-established literature ininternational trade, the primary question which thispaper seeks to address is whether or not Canadian tradewas able to defy gravity–that is, defy the attractiveforce for Canadian exports and imports exerted by theeconomic mass and geographic proximity of the US–and divert trade flows towards other signatories atOttawa in 1932.
The choice of Canada as the observational unitis motivated by a number of reasons. First is thesheer size of the Canadian–US border trade and itslong-running preeminence. By 1927, Canada hadsurpassed the United Kingdom as the United State'slargest trading partner (Jacks et al., 2011), a position itholds into the present day and which represents thelargest bilateral trading relationship over the past 80years.1 What is more, this single border registeredroughly 5% of all world trade in the interwar period. Atthe same time, the Canadian response to the combinedpressures of the Great Depression in general andSmoot–Hawley in particular was to embark on itsmost pronounced reversal in commercial policy to date.Documenting the evolution of this vital tradingrelationship is, thus, important not only for ourunderstanding of history, but also of the context ofcommercial policy in the present.
Second, Canada provides insight into the dilemmafacing small- and medium-sized economies which aredominated by a few–generally large and proximate–trading partners. Historically, we can place areas likeAustralasia, the Low and Nordic Countries, and Latin
1 This blanket statement has a few notable exceptions whenthe United Kingdom–United States bilateral trading relationshipreasserted itself. These came in 1933 when Canadian–US commer-cial and diplomatic relations where close to their nadir and the waryears of 1940 through 1944 when the US engaged in an unusuallylarge and highly unrepresentative export trade with the UK. Puttingthings in further perspective, the volume of Canadian–US trade stillheld a commanding 15% lead on the runner-up, namely China andthe US, in 2012.
America in this category. In the contemporary setting,this may become more binding for the East AsianTigers, Japan, and–again–Australasia with the rise ofChina as a dominant player in international trade. Theparticularly Canadian experience explored here serves tohighlight the tension between the benefits of integrationwhich are often hard to identify and the more readily feltcosts which are borne in the face of significant reversals ina dominant trading partner's commercial policy andeconomic fortunes. Such costs may come in the form ofthe loss of electoral support for political parties whichhave previously championed the cause of furtherintegration or in the form of the loss of output andproductivity attendant on the misallocation of capital inthe presence of intermediate inputs and integratedeconomies (Bond et al., 2013). In any case, the topic ofdiversifying trade partners uncannily emerges any timeprogress along these lines falters. Unfortunately, little ofthe debate surrounding this decades-long issue addressesthe feasibility–as opposed to the desirability–of such are-orientation of trade flows. This paper represents a stepforward in this direction.
Finally and more generally, the experience ofcommercial policy in the interwar period has provento be one of the few decisive lessons learned fromeconomic history. A consensus has emerged within theeconomics profession, across the political spectrum,and more haltingly–but more surprisingly–throughoutthe electorate. This consensus holds that whilebroad-based protectionism may perhaps bolster thedomestic macroeconomy in its direct effects, indirectlyit will almost certainly raise the counter-protectionistire of other nations, suggesting little is likely to be wonin following this path. Additionally, the experience ofthe interwar with respect to unilateral changes incommercial policy initiated the pronounced movetowards multilateralism in the post-World War IIperiod (Baldwin, 2009; Snyder, 1940). Therefore, afurther consideration of the policy disaster of theinterwar may contribute to a wider appreciation of thisconsensus view.
Section 2 below sets the scene leading up to theevents surrounding the period from 1929 to 1932. Itreveals that the Canadian economy was highly exposedto changes in commercial and economic conditions inthe United States and, thus, unprepared for the GreatDepression. This fact might help explain why theCanadian economy had not regained the economicground lost during the depression even as late as 1939.Sections 3 through 5 represent the main contribution ofthe paper. Canadian trade statistics are particularly richfor this period and allow us to explore the effects of
21D.S. Jacks / Explorations in Economic History 53 (2014) 19–39
the 1932 Imperial Economic Conference on Canadianbilateral trade at a highly disaggregated level. Theresults suggest that the conference was a failure in thatthe cause of Canadian trade with the rest of the Empireseems to have been furthered little in its wake. The finalsections seek to identify the sources of this failure aswell as place the results in a broader context. Theydemonstrate that the implicit goals of the conferencecarried with them unreasonable expectations about thescale of the attendant reductions in bilateral trade costsand, thus, the scale of effects on bilateral trade flows.Furthermore, the discussion at Ottawa neglected keyconsiderations with respect to certainty over the likelycourse of Canadian commercial policy and credibilityin maintaining any set of provisions emerging from theconference itself.
2. Canadian Trade: Policy and Performance,1921–1939
Riding the tide of an immigration and investmentboom in the early 1920s, the Canadian economyexperienced significant growth in this period, withreal GDP per capita rising 50.9% in the years from1921 to 1929 (Maddison, 2004; Safarian, 1970). Thisgrowth was also mirrored in its trade statistics:Canadian real exports and imports grew by 30.3%and 20.8%, respectively. Underlying this trade boomwas the development of new resource exports such asnewsprint and non-ferrous minerals to the UnitedStates as well as a durable consumer goods sector,especially for automobiles, which serviced both themarket of Canada and the British Empire (Pomfret,2000). However, forces were mounting even from thebeginning of the decade which would draw thiseffervescence, especially in the external sector, to anend.
Of particular note in this respect was the riseof protectionist sentiment within the United Statesbeginning with the tariff bill of 1922. In response todeteriorating conditions in world agricultural marketsfollowing World War I, the Fordney–McCumbertariff soon found room to incorporate wider calls forindustrial protection. Although relatively innocuous interms of its effects on international trade in general andCanada–US trade in particular (Hart, 2002), Fordney–McCumber did act as an ominous warning of things tocome: namely the all-too-easy willingness on the partof the United States to sacrifice foreign access tothe domestic market in the face of slack businessconditions at home.
Deteriorating conditions in world agricultural marketswere also to have a more direct impact on the Canadianeconomy during this period. Canada's privilegedgeographic position and imperial ties had allowed forunrivaled access for its agricultural goods in Europeanmarkets during World War I. However, the share ofagriculture in Canadian exports was in secular declinefrom 1919. In terms of its wider external relations, theCanadian economy was also heavily reliant on ahandful of markets and a handful of goods. Even inthe face of efforts to promote trade diversification, atno time were more than 33% of all exports shipped todestinations other than the United Kingdom or theUnited States (Hart, 2002). Of course, anything whichthreatened demand from either nation, whether it bedeteriorating incomes or protectionist commercialpolicy, could potentially have serious implications forCanada.
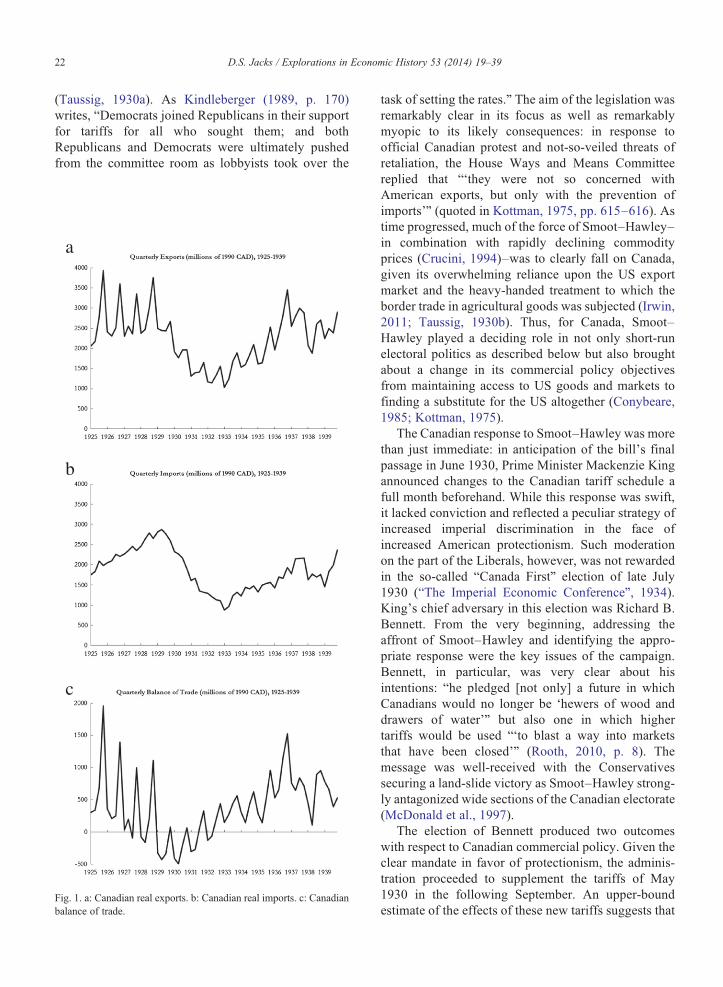
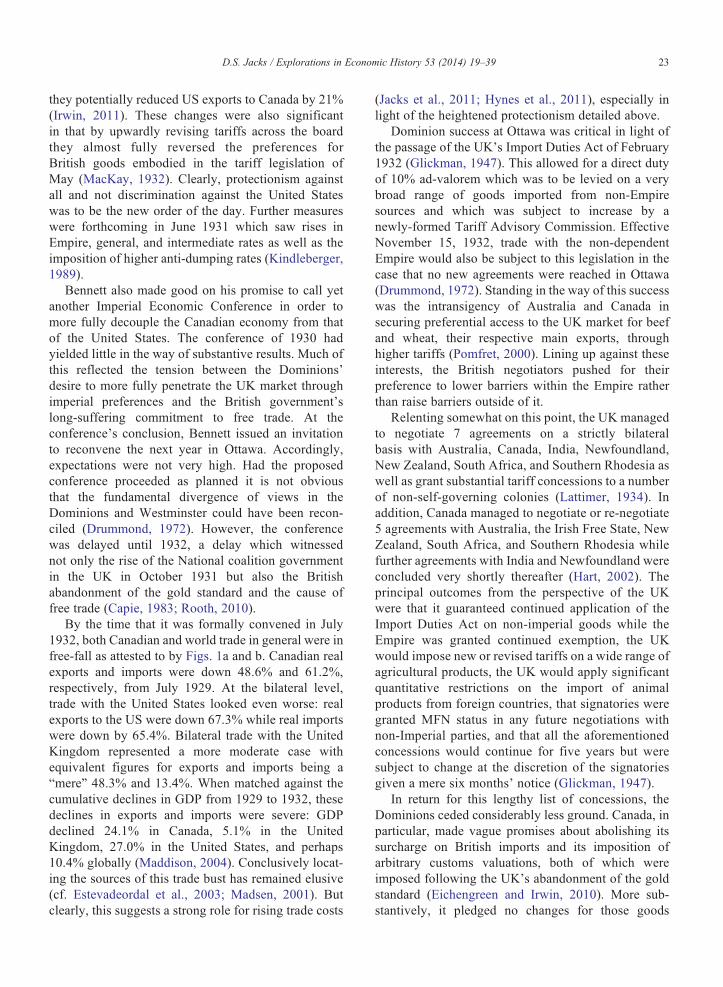
The combination of these forces was already beingsignaled in Canadian trade statistics from the middleof the decade. Fig. 1a and b, respectively, depict realquarterly exports and imports for the period fromJanuary 1925 to December 1939. In 1925, exportsclearly outstripped imports. However, comparing theevolution of the two series, it is clear that whereasexports had effectively plateaued imports continued toclimb throughout the late 1920s. In combination, thiswas to have strong implications for the Canadian tradebalance as depicted in Fig. 1c. From an excess ofexports over imports of 3.292 billion 1990 USD in1925 (or 7.94% of GDP in that year), the balance oftrade had declined to 1.083 billion 1990 USD in 1928(or 2.07% of GDP in that year). This necessarilyrepresented a significant drag in the years leading up to1929.
1929, of course, was to inaugurate a series of evenmore unfortunate developments for the Canadianmacroeconomy. The simultaneous peak in the eco-nomic activity of the United States as well as draftingof the Smoot–Hawley tariff bill in the summer of 1929constituted a serious threat to the two sources ofCanadian success in external–and particularly Ameri-can–markets: buoyant incomes and open commercialaccess. Little wonder then that the second and thirdquarter of 1929 represented the absolute peaks for the12-month moving averages of Canadian exports andimports, respectively.
However, any glimmer of hope which remained forCanada steadily diminished throughout the remainderof 1929 and the beginning of 1930 as the sessionand accompanying log-rolling process surroundingSmoot–Hawley was taken to unprecedented lengths
22 D.S. Jacks / Explorations in Economic History 53 (2014) 19–39
(Taussig, 1930a). As Kindleberger (1989, p. 170)writes, “Democrats joined Republicans in their supportfor tariffs for all who sought them; and bothRepublicans and Democrats were ultimately pushedfrom the committee room as lobbyists took over the
a
b
c
Fig. 1. a: Canadian real exports. b: Canadian real imports. c: Canadianbalance of trade.
task of setting the rates.” The aim of the legislation wasremarkably clear in its focus as well as remarkablymyopic to its likely consequences: in response toofficial Canadian protest and not-so-veiled threats ofretaliation, the House Ways and Means Committeereplied that “‘they were not so concerned withAmerican exports, but only with the prevention ofimports’” (quoted in Kottman, 1975, pp. 615–616). Astime progressed, much of the force of Smoot–Hawley–in combination with rapidly declining commodityprices (Crucini, 1994)–was to clearly fall on Canada,given its overwhelming reliance upon the US exportmarket and the heavy-handed treatment to which theborder trade in agricultural goods was subjected (Irwin,2011; Taussig, 1930b). Thus, for Canada, Smoot–Hawley played a deciding role in not only short-runelectoral politics as described below but also broughtabout a change in its commercial policy objectivesfrom maintaining access to US goods and markets tofinding a substitute for the US altogether (Conybeare,1985; Kottman, 1975).
The Canadian response to Smoot–Hawley was morethan just immediate: in anticipation of the bill's finalpassage in June 1930, Prime Minister Mackenzie Kingannounced changes to the Canadian tariff schedule afull month beforehand. While this response was swift,it lacked conviction and reflected a peculiar strategy ofincreased imperial discrimination in the face ofincreased American protectionism. Such moderationon the part of the Liberals, however, was not rewardedin the so-called “Canada First” election of late July1930 (“The Imperial Economic Conference”, 1934).King's chief adversary in this election was Richard B.Bennett. From the very beginning, addressing theaffront of Smoot–Hawley and identifying the appro-priate response were the key issues of the campaign.Bennett, in particular, was very clear about hisintentions: “he pledged [not only] a future in whichCanadians would no longer be ‘hewers of wood anddrawers of water’” but also one in which highertariffs would be used “‘to blast a way into marketsthat have been closed’” (Rooth, 2010, p. 8). Themessage was well-received with the Conservativessecuring a land-slide victory as Smoot–Hawley strong-ly antagonized wide sections of the Canadian electorate(McDonald et al., 1997).
The election of Bennett produced two outcomeswith respect to Canadian commercial policy. Given theclear mandate in favor of protectionism, the adminis-tration proceeded to supplement the tariffs of May1930 in the following September. An upper-boundestimate of the effects of these new tariffs suggests that
23D.S. Jacks / Explorations in Economic History 53 (2014) 19–39
they potentially reduced US exports to Canada by 21%(Irwin, 2011). These changes were also significantin that by upwardly revising tariffs across the boardthey almost fully reversed the preferences forBritish goods embodied in the tariff legislation ofMay (MacKay, 1932). Clearly, protectionism againstall and not discrimination against the United Stateswas to be the new order of the day. Further measureswere forthcoming in June 1931 which saw rises inEmpire, general, and intermediate rates as well as theimposition of higher anti-dumping rates (Kindleberger,1989).
Bennett also made good on his promise to call yetanother Imperial Economic Conference in order tomore fully decouple the Canadian economy from thatof the United States. The conference of 1930 hadyielded little in the way of substantive results. Much ofthis reflected the tension between the Dominions'desire to more fully penetrate the UK market throughimperial preferences and the British government'slong-suffering commitment to free trade. At theconference's conclusion, Bennett issued an invitationto reconvene the next year in Ottawa. Accordingly,expectations were not very high. Had the proposedconference proceeded as planned it is not obviousthat the fundamental divergence of views in theDominions and Westminster could have been recon-ciled (Drummond, 1972). However, the conferencewas delayed until 1932, a delay which witnessednot only the rise of the National coalition governmentin the UK in October 1931 but also the Britishabandonment of the gold standard and the cause offree trade (Capie, 1983; Rooth, 2010).
By the time that it was formally convened in July1932, both Canadian and world trade in general were infree-fall as attested to by Figs. 1a and b. Canadian realexports and imports were down 48.6% and 61.2%,respectively, from July 1929. At the bilateral level,trade with the United States looked even worse: realexports to the US were down 67.3% while real importswere down by 65.4%. Bilateral trade with the UnitedKingdom represented a more moderate case withequivalent figures for exports and imports being a“mere” 48.3% and 13.4%. When matched against thecumulative declines in GDP from 1929 to 1932, thesedeclines in exports and imports were severe: GDPdeclined 24.1% in Canada, 5.1% in the UnitedKingdom, 27.0% in the United States, and perhaps10.4% globally (Maddison, 2004). Conclusively locat-ing the sources of this trade bust has remained elusive(cf. Estevadeordal et al., 2003; Madsen, 2001). Butclearly, this suggests a strong role for rising trade costs
(Jacks et al., 2011; Hynes et al., 2011), especially inlight of the heightened protectionism detailed above.
Dominion success at Ottawa was critical in light ofthe passage of the UK's Import Duties Act of February1932 (Glickman, 1947). This allowed for a direct dutyof 10% ad-valorem which was to be levied on a verybroad range of goods imported from non-Empiresources and which was subject to increase by anewly-formed Tariff Advisory Commission. EffectiveNovember 15, 1932, trade with the non-dependentEmpire would also be subject to this legislation in thecase that no new agreements were reached in Ottawa(Drummond, 1972). Standing in the way of this successwas the intransigency of Australia and Canada insecuring preferential access to the UK market for beefand wheat, their respective main exports, throughhigher tariffs (Pomfret, 2000). Lining up against theseinterests, the British negotiators pushed for theirpreference to lower barriers within the Empire ratherthan raise barriers outside of it.
Relenting somewhat on this point, the UK managedto negotiate 7 agreements on a strictly bilateralbasis with Australia, Canada, India, Newfoundland,New Zealand, South Africa, and Southern Rhodesia aswell as grant substantial tariff concessions to a numberof non-self-governing colonies (Lattimer, 1934). Inaddition, Canada managed to negotiate or re-negotiate5 agreements with Australia, the Irish Free State, NewZealand, South Africa, and Southern Rhodesia whilefurther agreements with India and Newfoundland wereconcluded very shortly thereafter (Hart, 2002). Theprincipal outcomes from the perspective of the UKwere that it guaranteed continued application of theImport Duties Act on non-imperial goods while theEmpire was granted continued exemption, the UKwould impose new or revised tariffs on a wide range ofagricultural products, the UK would apply significantquantitative restrictions on the import of animalproducts from foreign countries, that signatories weregranted MFN status in any future negotiations withnon-Imperial parties, and that all the aforementionedconcessions would continue for five years but weresubject to change at the discretion of the signatoriesgiven a mere six months' notice (Glickman, 1947).
In return for this lengthy list of concessions, theDominions ceded considerably less ground. Canada, inparticular, made vague promises about abolishing itssurcharge on British imports and its imposition ofarbitrary customs valuations, both of which wereimposed following the UK's abandonment of the goldstandard (Eichengreen and Irwin, 2010). More sub-stantively, it pledged no changes for those goods
24 D.S. Jacks / Explorations in Economic History 53 (2014) 19–39
already enjoying preferential treatment and an im-provement in the terms of preference for over 200British goods. Compared to the relatively scant 900line-items in its tariff code, this easily represented themost important concession to the UK. Canada affectedsimilar changes–or at least, maintenance–of rates ofpreferential treatment in its agreements with the rest ofthe British Empire.
With such potentially far-reaching changes incommercial policy, especially with respect to the UKmarket, the cause of Imperial trade seemed poised for aturn for the better. Indeed, even a very casual glance atFig. 1a and b reveals a significant reversal in Canadiantrade volumes almost immediately following theenactment of the provisions of the Ottawa Conferencein November 15, 1932. Thus, a very historicallyuninformed opinion might ascribe a primary role forthe Ottawa Conference in reviving the fortunes ofCanadian trade in this period. Of course, a number ofconflating factors arose in the meantime such as theglobal recovery in GDP from the first quarter of 1933and the perhaps-related abandonment of the goldstandard by the US in the same period. So, a fewquestions remain. Did the Imperial Economic Confer-ence actually serve to boost the growth of imperialtrade over and beyond that of non-imperial nations? Ifnot, what were the sources of its failure? The followingsections seek to directly address these questions with aconsideration of the data used being the first point oforder.
3. Data
The primary source used in this study is the DominionBureau of Statistics' Monthly Report of the Trade ofCanada from January 1925 to December 1927 andQuarterly Report of the Trade of Canada from January1928 to December 1939. The coverage of the bilateraltrade data is uniquely wide across the commodity andcountry spectrum for this era. The dataset encompassesnine broad commodity classifications: Agricultural andVegetable Products; Animals and Animal Products;Fibers, Textiles, and Textile Products; Wood, WoodProducts, and Paper; Iron and Its Products; Non-FerrousMetals and Their Products; Non-Metallic Minerals andTheir Products; Chemicals and Allied Products; andMiscellaneous Commodities.2 Figures for total bilateral
2 Appendix 1 details the principal goods contained in eachcommodity classification while Appendix 2 details the principaldestinations and origins of Canadian exports and imports by eachcommodity classification.
exports and imports are separately reported whichcorrespond with the sum across the nine commodityclassifications. The dataset also spans the near universe ofpossible trading partners for Canada and consistentlyrecords those observations on bilateral trade which equalzero. Lacking monthly or quarterly data on export andimport prices disaggregated across commodities, allbilateral trade data have been deflated by the StatisticsCanada monthly wholesale consumer price index andthen summed up across quarters.
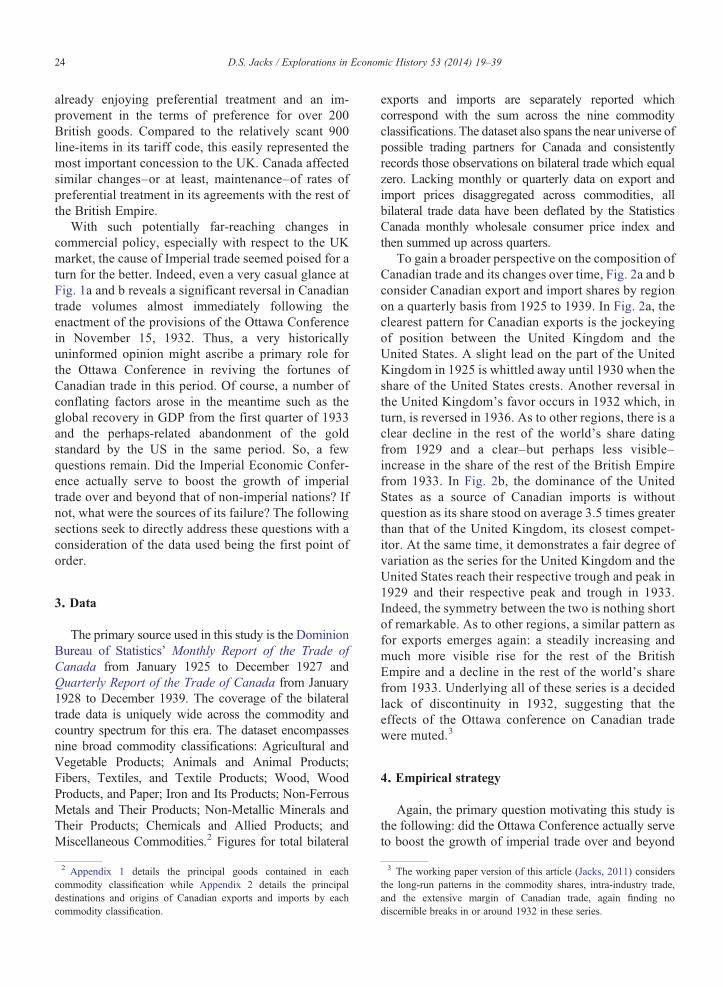
To gain a broader perspective on the composition ofCanadian trade and its changes over time, Fig. 2a and bconsider Canadian export and import shares by regionon a quarterly basis from 1925 to 1939. In Fig. 2a, theclearest pattern for Canadian exports is the jockeyingof position between the United Kingdom and theUnited States. A slight lead on the part of the UnitedKingdom in 1925 is whittled away until 1930 when theshare of the United States crests. Another reversal inthe United Kingdom's favor occurs in 1932 which, inturn, is reversed in 1936. As to other regions, there is aclear decline in the rest of the world's share datingfrom 1929 and a clear–but perhaps less visible–increase in the share of the rest of the British Empirefrom 1933. In Fig. 2b, the dominance of the UnitedStates as a source of Canadian imports is withoutquestion as its share stood on average 3.5 times greaterthan that of the United Kingdom, its closest compet-itor. At the same time, it demonstrates a fair degree ofvariation as the series for the United Kingdom and theUnited States reach their respective trough and peak in1929 and their respective peak and trough in 1933.Indeed, the symmetry between the two is nothing shortof remarkable. As to other regions, a similar pattern asfor exports emerges again: a steadily increasing andmuch more visible rise for the rest of the BritishEmpire and a decline in the rest of the world's sharefrom 1933. Underlying all of these series is a decidedlack of discontinuity in 1932, suggesting that theeffects of the Ottawa conference on Canadian tradewere muted.3
4. Empirical strategy
Again, the primary question motivating this study isthe following: did the Ottawa Conference actually serveto boost the growth of imperial trade over and beyond
3 The working paper version of this article (Jacks, 2011) considersthe long-run patterns in the commodity shares, intra-industry trade,and the extensive margin of Canadian trade, again finding nodiscernible breaks in or around 1932 in these series.
a
b
Fig. 2. a: Canadian export shares by region. b: Canadian import shares by region.
25D.S. Jacks / Explorations in Economic History 53 (2014) 19–39
that of non-imperial nations? In this regard, the moststraightforward way to proceed is to note that bilateraltrade flows are nearly always described by an equationlike the following (Jacks et al., 2011):
xijt ¼ GtMexi Mim
j ϕijt : ð1Þ
The first term represents exports from country i tocountry j at time t while the second term is a commontime-specific factor determining trade. The third andfourth terms are indices of the attributes of exporter i
and importer j, respectively, which are potentiallytime-varying. The final term represents factors whichdirectly affect bilateral trade intensity. Thus, bilateraltrade is a function of factors common to all countries,factors within particular countries such as size andproductivity, and factors specific to country-pairs. It isthese last country-pair specific factors which will be ofparticular interest as they are thought to capture thebilateral trade costs facing countries. Trade costs are allthe costs of transaction and transport associated with theexchange of goods across national borders. Broadly, they
26 D.S. Jacks / Explorations in Economic History 53 (2014) 19–39
include obvious barriers such as tariffs and transport costsbut also many others that are more difficult to observesuch as the costs of overcoming language barriers andexchange rate risk. Here, we wish to determine the degreeto which the Ottawa Conference served to lower bilateraltrade costs between its signatories and thereby raisebilateral trade flows in the same over and beyond that ofnon-signatories.
As a first step, an appropriate identification strategyis to make use of a simple difference-in-differencesspecification,4 such that year-on-year observations onbilateral trade in two quarters are pooled:
ln xijt� � ¼ βi þ β j þ β1 � T þ β2 � T � Ottawaij
þ εijt: ð2Þ
T is an indicator for the post-Ottawa Conferenceperiod which is common to all country-pairs andOttawa is an indicator for whether a particular Canadiantrading partner was a signatory at the OttawaConference.5 Note that this specification necessarilyassumes that any annual changes in other bilateral tradecost elements (e.g., maritime freight rates) are uncorre-lated with Ottawa. Likewise, it assumes there is nochange in the attributes of exporter i and importer j. Thelatter is the stronger of the two, and in later sections, weaddress this issue head-on by exploring a much moreexacting specification.
Another issue which arises is the appropriate meansfor estimating gravity equations such as (2). It has longbeen noticed that this particular specification presents aproblem in the presence of bilateral trade observationswhich are zero. The most common solutions have beeneither to employ a Tobit estimator or transform thedependent variable into ln(1 + xijt) and run OLS(otherwise known as scaled OLS). Recently, SantosSilva and Tenreyro (2006) have argued that in thepresence of heteroskedasticity such estimators arebiased and inconsistent. Instead, they argue forestimating (2) in its multiplicative form by use of aPoisson pseudo-maximum-likelihood (PPML) estima-tor. They demonstrate that in simulations the PPMLestimator performs markedly better than either thescaled OLS or Tobit estimator as well as argue thattheir estimation technique does a superior job of
4 Although more generally associated with the applied microliterature, the use of difference-in-differences gravity specificationsis not unprecedented (Baldwin and Harrigan, 2011; Hanson andXiang, 2004).5 Thus, Australia, India, the Irish Free State, New Zealand,
Newfoundland, South Africa, Southern Rhodesia, and the UnitedKingdom would be assigned a value of one for Ottawa.
handling zero observations. These claims have alsobeen corroborated for data from the interwar period(Ritschl and Wolf, 2011) and for the evaluation ofpreferential trade agreements in the present day(Egger et al., 2011). Cumulatively, this suggests thatthe use of the PPML estimator on bilateral trade levels–as opposed to logs–is the most appropriate wayforward.6
Finally, this paper fully exploits the multipledimensions of the dataset by distinguishing betweenCanadian bilateral exports and imports, by exploringsystematic differences across commodity classifica-tions and aggregates, and by considering year-on-year changes in trade volumes for given quarterscorresponding to the announcement of the OttawaConference's results on August 15, 1932 (Q3 1932)and the enactment of its provisions on November 15,1932 (Q4 1932). The rationale for using differentstarting points is that firms, in anticipation of theenactment of its provisions, may have entered newmarkets in the period from August 15, 1932, in anattempt to gain market share in the future.
5. Results
5.1. Baseline results
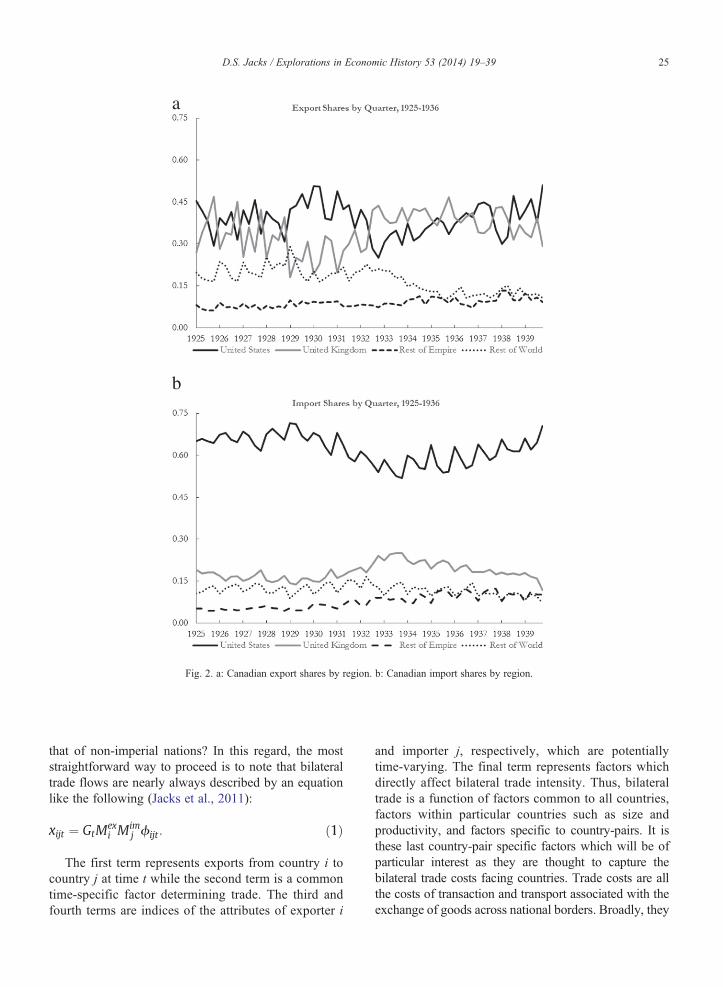
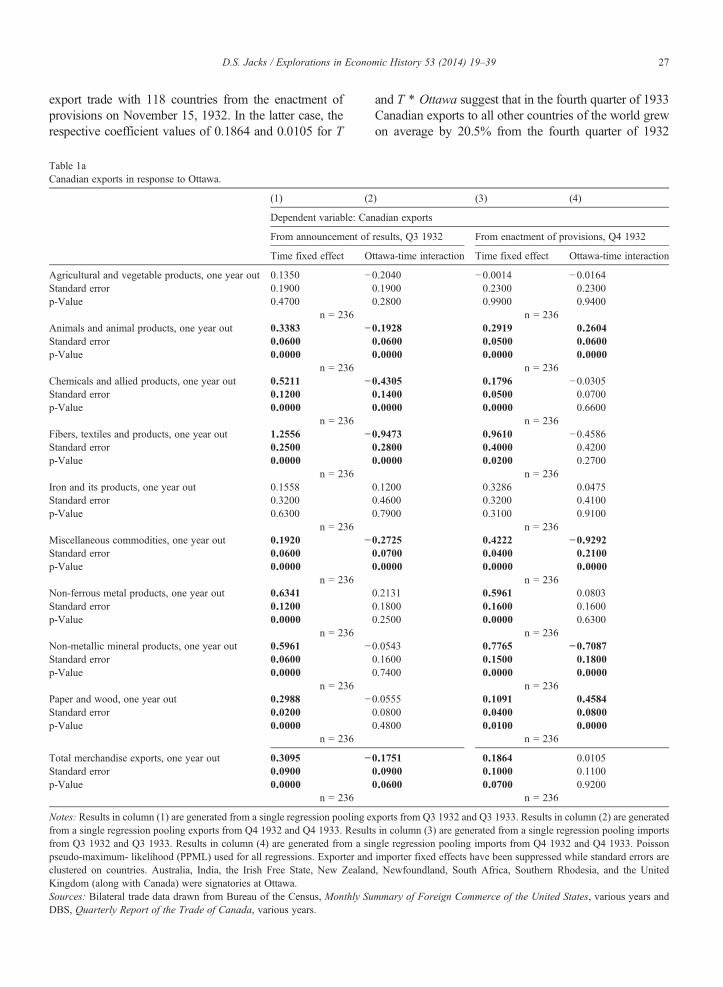
Tables 1a and 1b report the coefficients for T(an indicator for the post-Ottawa Conference period)and its interaction with Ottawa (an indicator forwhether a particular Canadian trading partner was asignatory at the Ottawa Conference). In this frame-work, the coefficient on T is interpreted as the growthrate shared in common by all countries. The coefficienton T ∗ Ottawa is then the differential growth inCanadian bilateral trade with signatories of theOttawa Conference which is observed at the end ofthe period.
Thus, the cell in the upper-left hand corner of Table 1areports the results of estimating Eq. (2) for Canadianexports of Agricultural and Vegetable Products, poolingthe observations for the third quarters of 1932 and 1933and representing Canadian export trade with 118 countriesfrom the announcement of results on August 15, 1932.Likewise, the cell in the lower-right hand corner ofTable 1a reports the results of estimating Eq. (2) for totalCanadian exports, pooling the observations for the fourthquarters of 1932 and 1933 and representing Canadian
6 It should also be noted that this approach abstracts away from theproblem of giving equal observational weight to large and smallcountries alike as is the case in the log–log specification.
27D.S. Jacks / Explorations in Economic History 53 (2014) 19–39
export trade with 118 countries from the enactment ofprovisions on November 15, 1932. In the latter case, therespective coefficient values of 0.1864 and 0.0105 for T
Table 1aCanadian exports in response to Ottawa.
(1) (2
Dependent variable: Can
From announcement of
Time fixed effect O
Agricultural and vegetable products, one year out 0.1350 −Standard error 0.1900p-Value 0.4700
n = 236Animals and animal products, one year out 0.3383 −Standard error 0.0600p-Value 0.0000
n = 236Chemicals and allied products, one year out 0.5211 −Standard error 0.1200p-Value 0.0000
n = 236Fibers, textiles and products, one year out 1.2556 −Standard error 0.2500p-Value 0.0000
n = 236Iron and its products, one year out 0.1558Standard error 0.3200p-Value 0.6300
n = 236Miscellaneous commodities, one year out 0.1920 −Standard error 0.0600p-Value 0.0000
n = 236Non-ferrous metal products, one year out 0.6341Standard error 0.1200p-Value 0.0000
n = 236Non-metallic mineral products, one year out 0.5961 −Standard error 0.0600p-Value 0.0000
n = 236Paper and wood, one year out 0.2988 −Standard error 0.0200p-Value 0.0000
n = 236
Total merchandise exports, one year out 0.3095 −Standard error 0.0900p-Value 0.0000
n = 236
Notes: Results in column (1) are generated from a single regression pooling efrom a single regression pooling exports from Q4 1932 and Q4 1933. Resultfrom Q3 1932 and Q3 1933. Results in column (4) are generated from a sinpseudo-maximum- likelihood (PPML) used for all regressions. Exporter andclustered on countries. Australia, India, the Irish Free State, New ZealandKingdom (along with Canada) were signatories at Ottawa.Sources: Bilateral trade data drawn from Bureau of the Census, Monthly SuDBS, Quarterly Report of the Trade of Canada, various years.
and T ∗ Ottawa suggest that in the fourth quarter of 1933Canadian exports to all other countries of the world grewon average by 20.5% from the fourth quarter of 1932
) (3) (4)
adian exports
results, Q3 1932 From enactment of provisions, Q4 1932
ttawa-time interaction Time fixed effect Ottawa-time interaction
0.2040 −0.0014 −0.01640.1900 0.2300 0.23000.2800 0.9900 0.9400
n = 2360.1928 0.2919 0.26040.0600 0.0500 0.06000.0000 0.0000 0.0000
n = 2360.4305 0.1796 −0.03050.1400 0.0500 0.07000.0000 0.0000 0.6600
n = 2360.9473 0.9610 −0.45860.2800 0.4000 0.42000.0000 0.0200 0.2700
n = 2360.1200 0.3286 0.04750.4600 0.3200 0.41000.7900 0.3100 0.9100
n = 2360.2725 0.4222 −0.92920.0700 0.0400 0.21000.0000 0.0000 0.0000
n = 2360.2131 0.5961 0.08030.1800 0.1600 0.16000.2500 0.0000 0.6300
n = 2360.0543 0.7765 −0.70870.1600 0.1500 0.18000.7400 0.0000 0.0000
n = 2360.0555 0.1091 0.45840.0800 0.0400 0.08000.4800 0.0100 0.0000
n = 236
0.1751 0.1864 0.01050.0900 0.1000 0.11000.0600 0.0700 0.9200
n = 236
xports from Q3 1932 and Q3 1933. Results in column (2) are generateds in column (3) are generated from a single regression pooling importsgle regression pooling imports from Q4 1932 and Q4 1933. Poissonimporter fixed effects have been suppressed while standard errors are, Newfoundland, South Africa, Southern Rhodesia, and the United
mmary of Foreign Commerce of the United States, various years and
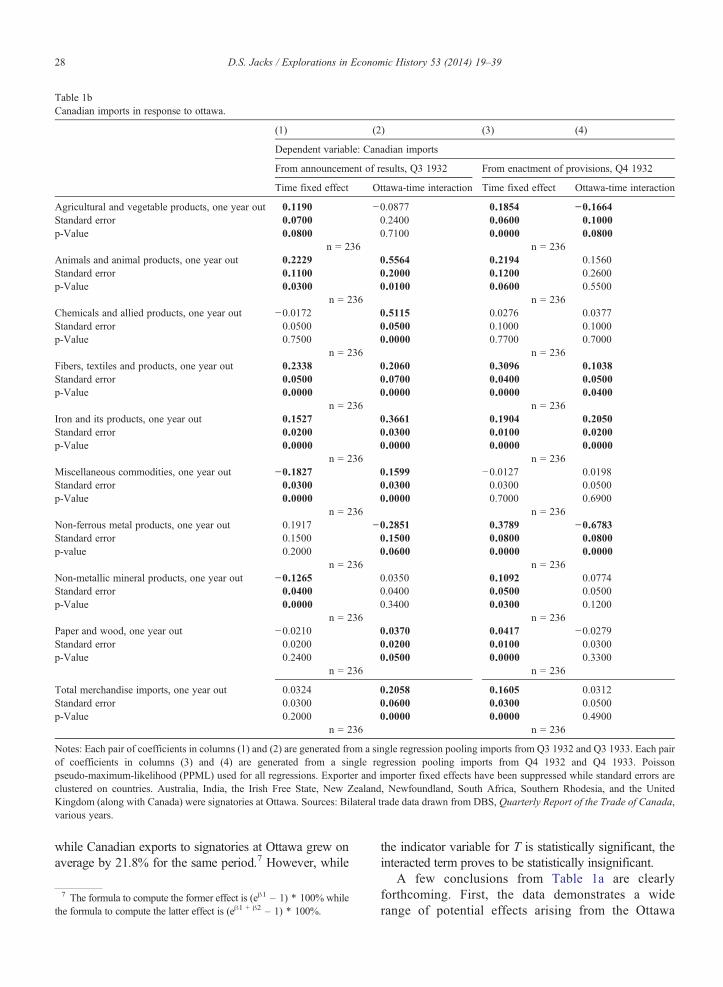
Table 1bCanadian imports in response to ottawa.
(1) (2) (3) (4)
Dependent variable: Canadian imports
From announcement of results, Q3 1932 From enactment of provisions, Q4 1932
Time fixed effect Ottawa-time interaction Time fixed effect Ottawa-time interaction
Agricultural and vegetable products, one year out 0.1190 −0.0877 0.1854 −0.1664Standard error 0.0700 0.2400 0.0600 0.1000p-Value 0.0800 0.7100 0.0000 0.0800
n = 236 n = 236Animals and animal products, one year out 0.2229 0.5564 0.2194 0.1560Standard error 0.1100 0.2000 0.1200 0.2600p-Value 0.0300 0.0100 0.0600 0.5500
n = 236 n = 236Chemicals and allied products, one year out −0.0172 0.5115 0.0276 0.0377Standard error 0.0500 0.0500 0.1000 0.1000p-Value 0.7500 0.0000 0.7700 0.7000
n = 236 n = 236Fibers, textiles and products, one year out 0.2338 0.2060 0.3096 0.1038Standard error 0.0500 0.0700 0.0400 0.0500p-Value 0.0000 0.0000 0.0000 0.0400
n = 236 n = 236Iron and its products, one year out 0.1527 0.3661 0.1904 0.2050Standard error 0.0200 0.0300 0.0100 0.0200p-Value 0.0000 0.0000 0.0000 0.0000
n = 236 n = 236Miscellaneous commodities, one year out −0.1827 0.1599 −0.0127 0.0198Standard error 0.0300 0.0300 0.0300 0.0500p-Value 0.0000 0.0000 0.7000 0.6900
n = 236 n = 236Non-ferrous metal products, one year out 0.1917 −0.2851 0.3789 −0.6783Standard error 0.1500 0.1500 0.0800 0.0800p-value 0.2000 0.0600 0.0000 0.0000
n = 236 n = 236Non-metallic mineral products, one year out −0.1265 0.0350 0.1092 0.0774Standard error 0.0400 0.0400 0.0500 0.0500p-Value 0.0000 0.3400 0.0300 0.1200
n = 236 n = 236Paper and wood, one year out −0.0210 0.0370 0.0417 −0.0279Standard error 0.0200 0.0200 0.0100 0.0300p-Value 0.2400 0.0500 0.0000 0.3300
n = 236 n = 236
Total merchandise imports, one year out 0.0324 0.2058 0.1605 0.0312Standard error 0.0300 0.0600 0.0300 0.0500p-Value 0.2000 0.0000 0.0000 0.4900
n = 236 n = 236
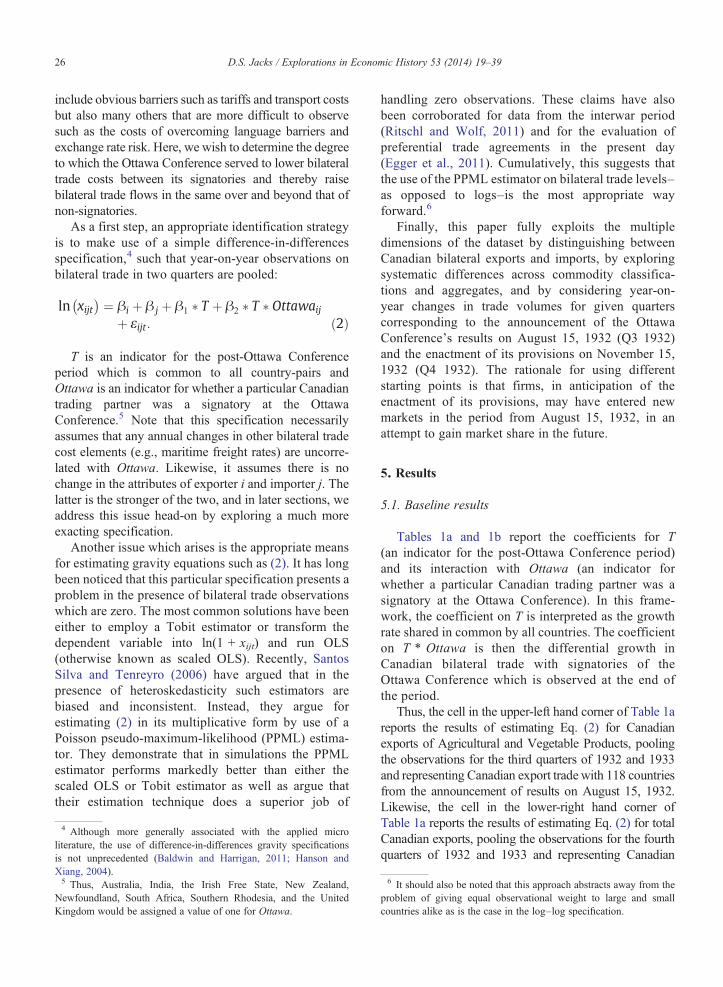
Notes: Each pair of coefficients in columns (1) and (2) are generated from a single regression pooling imports from Q3 1932 and Q3 1933. Each pairof coefficients in columns (3) and (4) are generated from a single regression pooling imports from Q4 1932 and Q4 1933. Poissonpseudo-maximum-likelihood (PPML) used for all regressions. Exporter and importer fixed effects have been suppressed while standard errors areclustered on countries. Australia, India, the Irish Free State, New Zealand, Newfoundland, South Africa, Southern Rhodesia, and the UnitedKingdom (along with Canada) were signatories at Ottawa. Sources: Bilateral trade data drawn from DBS, Quarterly Report of the Trade of Canada,various years.
28 D.S. Jacks / Explorations in Economic History 53 (2014) 19–39
while Canadian exports to signatories at Ottawa grew onaverage by 21.8% for the same period.7 However, while
7 The formula to compute the former effect is (eβ1 – 1) ∗ 100% whilethe formula to compute the latter effect is (eβ1 + β2 – 1) ∗ 100%.
the indicator variable for T is statistically significant, theinteracted term proves to be statistically insignificant.
A few conclusions from Table 1a are clearlyforthcoming. First, the data demonstrates a widerange of potential effects arising from the Ottawa
29D.S. Jacks / Explorations in Economic History 53 (2014) 19–39
conference across commodities. For instance, theMiscellaneous Commodities category registers a7.7% decline in Canadian exports to signatories inthe period from the third quarter of 1932 while theFibers, Textiles and Products category registers a 36.1%increase in the same period. Large differences such asthese arise for both periods, presumably reflecting thedifferential size and impact of the concessions agreedto at Ottawa. Second, even for all this heterogeneityacross commodities, the results for each productcategory tell a consistent story when considered as awhole. Thus, the negative coefficients on the interac-tion between T and Ottawa in the second columnfor Animals and Animal Products, Chemicals andAllied Products, Fibers, Textiles and Products, andMiscellaneous Commodities, are consistent with thelarge and statistically significant coefficient estimatedfor Total Merchandise Exports from Q3 1932 to Q31933. Finally and most importantly, the results fortotal exports suggest that a potential–and negative–differential growth effect for the announcement ofthe Ottawa conference (−16.1% in between Q3 1932and 1933) quickly petered out for the period betweenQ4 1932 and 1933 when the differential growtheffect stood at a meager (and statistically insignifi-cant) +1.1%.
With respect to Canadian imports, Table 1b corrob-orates the results above. Estimates of the T ∗ Ottawainteraction widely vary across commodities, but tell aconsistent story within periods. Furthermore, theypoint to the steady decline in any potential differentialgrowth effect of the Ottawa conference from theannouncement of its results (+22.9%) and to theenactment of its provisions (+3.2%). Cumulatively,these results suggests that the Ottawa Conference wassomewhat of a failure in that the cause of Canadiantrade with the rest of the Empire seems to have beenfurthered little in its wake. Identifying the sources ofthis failure as well as placing the results in a broadercontext is the objects of the final sections. In whatimmediately follows, the results presented in Tables 1aand 1b are subjected to a number of robustnessexercises.
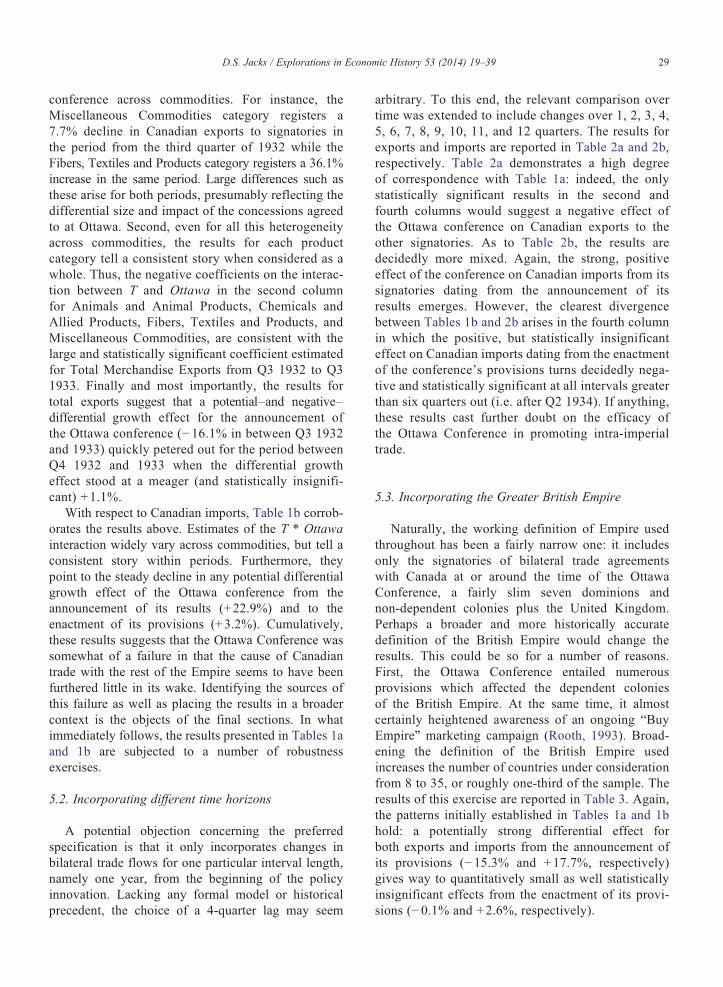
5.2. Incorporating different time horizons
A potential objection concerning the preferredspecification is that it only incorporates changes inbilateral trade flows for one particular interval length,namely one year, from the beginning of the policyinnovation. Lacking any formal model or historicalprecedent, the choice of a 4-quarter lag may seem
arbitrary. To this end, the relevant comparison overtime was extended to include changes over 1, 2, 3, 4,5, 6, 7, 8, 9, 10, 11, and 12 quarters. The results forexports and imports are reported in Table 2a and 2b,respectively. Table 2a demonstrates a high degreeof correspondence with Table 1a: indeed, the onlystatistically significant results in the second andfourth columns would suggest a negative effect ofthe Ottawa conference on Canadian exports to theother signatories. As to Table 2b, the results aredecidedly more mixed. Again, the strong, positiveeffect of the conference on Canadian imports from itssignatories dating from the announcement of itsresults emerges. However, the clearest divergencebetween Tables 1b and 2b arises in the fourth columnin which the positive, but statistically insignificanteffect on Canadian imports dating from the enactmentof the conference's provisions turns decidedly nega-tive and statistically significant at all intervals greaterthan six quarters out (i.e. after Q2 1934). If anything,these results cast further doubt on the efficacy ofthe Ottawa Conference in promoting intra-imperialtrade.
5.3. Incorporating the Greater British Empire
Naturally, the working definition of Empire usedthroughout has been a fairly narrow one: it includesonly the signatories of bilateral trade agreementswith Canada at or around the time of the OttawaConference, a fairly slim seven dominions andnon-dependent colonies plus the United Kingdom.Perhaps a broader and more historically accuratedefinition of the British Empire would change theresults. This could be so for a number of reasons.First, the Ottawa Conference entailed numerousprovisions which affected the dependent coloniesof the British Empire. At the same time, it almostcertainly heightened awareness of an ongoing “BuyEmpire” marketing campaign (Rooth, 1993). Broad-ening the definition of the British Empire usedincreases the number of countries under considerationfrom 8 to 35, or roughly one-third of the sample. Theresults of this exercise are reported in Table 3. Again,the patterns initially established in Tables 1a and 1bhold: a potentially strong differential effect forboth exports and imports from the announcement ofits provisions (−15.3% and +17.7%, respectively)gives way to quantitatively small as well statisticallyinsignificant effects from the enactment of its provi-sions (−0.1% and +2.6%, respectively).
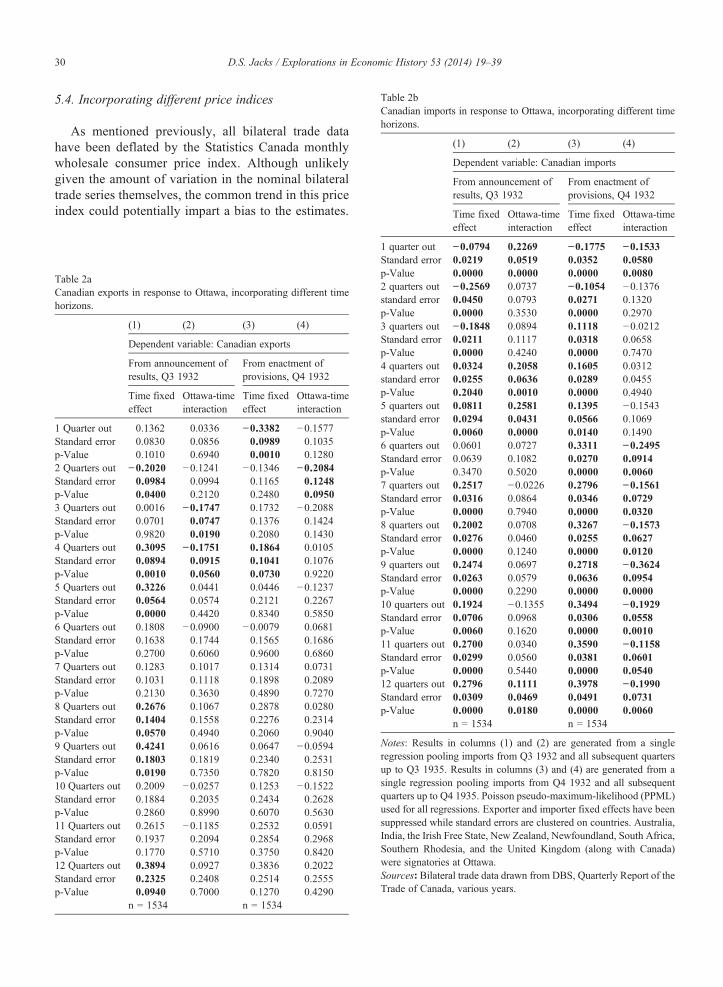
Table 2bCanadian imports in response to Ottawa, incorporating different timehorizons.
(1) (2) (3) (4)
Dependent variable: Canadian imports
From announcement ofresults, Q3 1932
From enactment ofprovisions, Q4 1932
Time fixed Ottawa-time Time fixed Ottawa-time
30 D.S. Jacks / Explorations in Economic History 53 (2014) 19–39
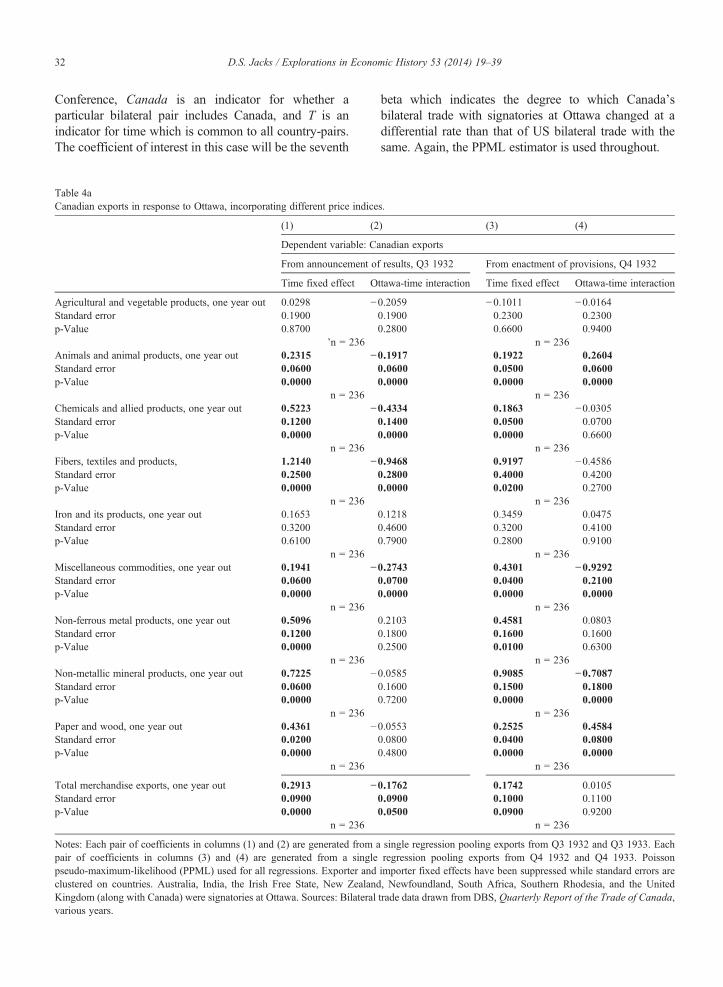
5.4. Incorporating different price indices
As mentioned previously, all bilateral trade datahave been deflated by the Statistics Canada monthlywholesale consumer price index. Although unlikelygiven the amount of variation in the nominal bilateraltrade series themselves, the common trend in this priceindex could potentially impart a bias to the estimates.
Table 2aCanadian exports in response to Ottawa, incorporating different timehorizons.
(1) (2) (3) (4)
Dependent variable: Canadian exports
From announcement ofresults, Q3 1932
From enactment ofprovisions, Q4 1932
Time fixedeffect
Ottawa-timeinteraction
Time fixedeffect
Ottawa-timeinteraction
1 Quarter out 0.1362 0.0336 −0.3382 −0.1577Standard error 0.0830 0.0856 0.0989 0.1035p-Value 0.1010 0.6940 0.0010 0.12802 Quarters out −0.2020 −0.1241 −0.1346 −0.2084Standard error 0.0984 0.0994 0.1165 0.1248p-Value 0.0400 0.2120 0.2480 0.09503 Quarters out 0.0016 −0.1747 0.1732 −0.2088Standard error 0.0701 0.0747 0.1376 0.1424p-Value 0.9820 0.0190 0.2080 0.14304 Quarters out 0.3095 −0.1751 0.1864 0.0105Standard error 0.0894 0.0915 0.1041 0.1076p-Value 0.0010 0.0560 0.0730 0.92205 Quarters out 0.3226 0.0441 0.0446 −0.1237Standard error 0.0564 0.0574 0.2121 0.2267p-Value 0.0000 0.4420 0.8340 0.58506 Quarters out 0.1808 −0.0900 −0.0079 0.0681Standard error 0.1638 0.1744 0.1565 0.1686p-Value 0.2700 0.6060 0.9600 0.68607 Quarters out 0.1283 0.1017 0.1314 0.0731Standard error 0.1031 0.1118 0.1898 0.2089p-Value 0.2130 0.3630 0.4890 0.72708 Quarters out 0.2676 0.1067 0.2878 0.0280Standard error 0.1404 0.1558 0.2276 0.2314p-Value 0.0570 0.4940 0.2060 0.90409 Quarters out 0.4241 0.0616 0.0647 −0.0594Standard error 0.1803 0.1819 0.2340 0.2531p-Value 0.0190 0.7350 0.7820 0.815010 Quarters out 0.2009 −0.0257 0.1253 −0.1522Standard error 0.1884 0.2035 0.2434 0.2628p-Value 0.2860 0.8990 0.6070 0.563011 Quarters out 0.2615 −0.1185 0.2532 0.0591Standard error 0.1937 0.2094 0.2854 0.2968p-Value 0.1770 0.5710 0.3750 0.842012 Quarters out 0.3894 0.0927 0.3836 0.2022Standard error 0.2325 0.2408 0.2514 0.2555p-Value 0.0940 0.7000 0.1270 0.4290
n = 1534 n = 1534
effect interaction effect interaction
1 quarter out −0.0794 0.2269 −0.1775 −0.1533Standard error 0.0219 0.0519 0.0352 0.0580p-Value 0.0000 0.0000 0.0000 0.00802 quarters out −0.2569 0.0737 −0.1054 −0.1376standard error 0.0450 0.0793 0.0271 0.1320p-Value 0.0000 0.3530 0.0000 0.29703 quarters out −0.1848 0.0894 0.1118 −0.0212Standard error 0.0211 0.1117 0.0318 0.0658p-Value 0.0000 0.4240 0.0000 0.74704 quarters out 0.0324 0.2058 0.1605 0.0312standard error 0.0255 0.0636 0.0289 0.0455p-Value 0.2040 0.0010 0.0000 0.49405 quarters out 0.0811 0.2581 0.1395 −0.1543standard error 0.0294 0.0431 0.0566 0.1069p-Value 0.0060 0.0000 0.0140 0.14906 quarters out 0.0601 0.0727 0.3311 −0.2495Standard error 0.0639 0.1082 0.0270 0.0914p-Value 0.3470 0.5020 0.0000 0.00607 quarters out 0.2517 −0.0226 0.2796 −0.1561Standard error 0.0316 0.0864 0.0346 0.0729p-Value 0.0000 0.7940 0.0000 0.03208 quarters out 0.2002 0.0708 0.3267 −0.1573Standard error 0.0276 0.0460 0.0255 0.0627p-Value 0.0000 0.1240 0.0000 0.01209 quarters out 0.2474 0.0697 0.2718 −0.3624Standard error 0.0263 0.0579 0.0636 0.0954p-Value 0.0000 0.2290 0.0000 0.000010 quarters out 0.1924 −0.1355 0.3494 −0.1929Standard error 0.0706 0.0968 0.0306 0.0558p-Value 0.0060 0.1620 0.0000 0.001011 quarters out 0.2700 0.0340 0.3590 −0.1158Standard error 0.0299 0.0560 0.0381 0.0601p-Value 0.0000 0.5440 0.0000 0.054012 quarters out 0.2796 0.1111 0.3978 −0.1990Standard error 0.0309 0.0469 0.0491 0.0731p-Value 0.0000 0.0180 0.0000 0.0060
n = 1534 n = 1534
Notes: Results in columns (1) and (2) are generated from a singleregression pooling imports from Q3 1932 and all subsequent quartersup to Q3 1935. Results in columns (3) and (4) are generated from asingle regression pooling imports from Q4 1932 and all subsequentquarters up to Q4 1935. Poisson pseudo-maximum-likelihood (PPML)used for all regressions. Exporter and importer fixed effects have beensuppressed while standard errors are clustered on countries. Australia,India, the Irish Free State, New Zealand, Newfoundland, South Africa,Southern Rhodesia, and the United Kingdom (along with Canada)were signatories at Ottawa.Sources: Bilateral trade data drawn from DBS, Quarterly Report of theTrade of Canada, various years.
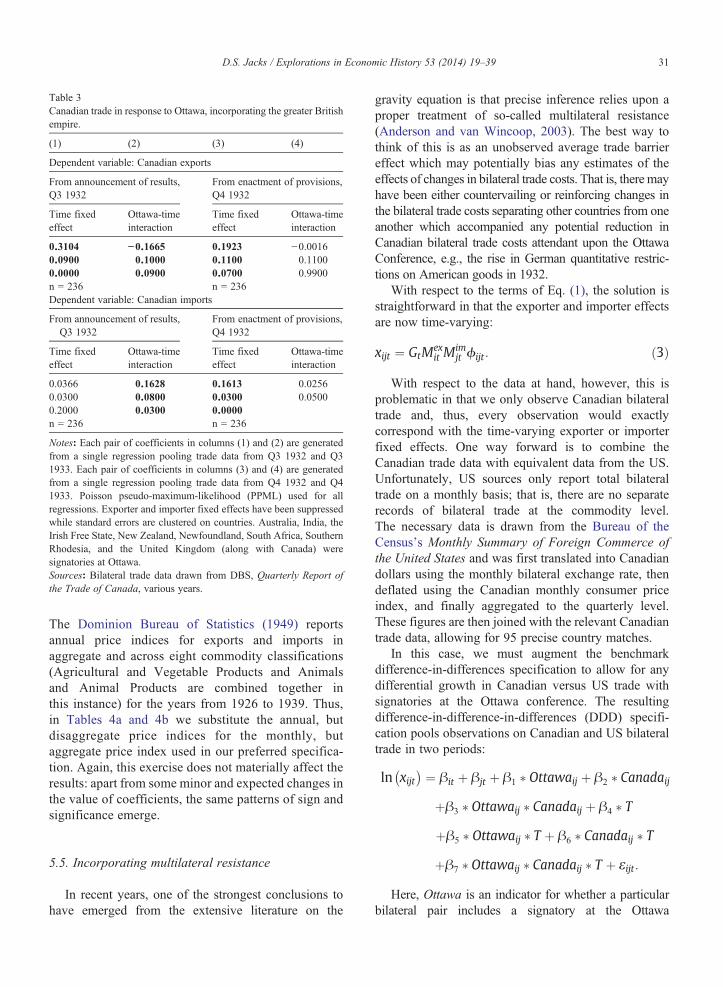
Table 3Canadian trade in response to Ottawa, incorporating the greater Britishempire.
(1) (2) (3) (4)
Dependent variable: Canadian exports
From announcement of results,Q3 1932
From enactment of provisions,Q4 1932
Time fixedeffect
Ottawa-timeinteraction
Time fixedeffect
Ottawa-timeinteraction
0.3104 −0.1665 0.1923 −0.00160.0900 0.1000 0.1100 0.11000.0000 0.0900 0.0700 0.9900n = 236 n = 236Dependent variable: Canadian imports
From announcement of results,Q3 1932
From enactment of provisions,Q4 1932
Time fixedeffect
Ottawa-timeinteraction
Time fixedeffect
Ottawa-timeinteraction
0.0366 0.1628 0.1613 0.02560.0300 0.0800 0.0300 0.05000.2000 0.0300 0.0000n = 236 n = 236
Notes: Each pair of coefficients in columns (1) and (2) are generatedfrom a single regression pooling trade data from Q3 1932 and Q31933. Each pair of coefficients in columns (3) and (4) are generatedfrom a single regression pooling trade data from Q4 1932 and Q41933. Poisson pseudo-maximum-likelihood (PPML) used for allregressions. Exporter and importer fixed effects have been suppressedwhile standard errors are clustered on countries. Australia, India, theIrish Free State, New Zealand, Newfoundland, South Africa, SouthernRhodesia, and the United Kingdom (along with Canada) weresignatories at Ottawa.Sources: Bilateral trade data drawn from DBS, Quarterly Report ofthe Trade of Canada, various years.
31D.S. Jacks / Explorations in Economic History 53 (2014) 19–39
The Dominion Bureau of Statistics (1949) reportsannual price indices for exports and imports inaggregate and across eight commodity classifications(Agricultural and Vegetable Products and Animalsand Animal Products are combined together inthis instance) for the years from 1926 to 1939. Thus,in Tables 4a and 4b we substitute the annual, butdisaggregate price indices for the monthly, butaggregate price index used in our preferred specifica-tion. Again, this exercise does not materially affect theresults: apart from some minor and expected changes inthe value of coefficients, the same patterns of sign andsignificance emerge.
5.5. Incorporating multilateral resistance
In recent years, one of the strongest conclusions tohave emerged from the extensive literature on the
gravity equation is that precise inference relies upon aproper treatment of so-called multilateral resistance(Anderson and van Wincoop, 2003). The best way tothink of this is as an unobserved average trade barriereffect which may potentially bias any estimates of theeffects of changes in bilateral trade costs. That is, there mayhave been either countervailing or reinforcing changes inthe bilateral trade costs separating other countries from oneanother which accompanied any potential reduction inCanadian bilateral trade costs attendant upon the OttawaConference, e.g., the rise in German quantitative restric-tions on American goods in 1932.
With respect to the terms of Eq. (1), the solution isstraightforward in that the exporter and importer effectsare now time-varying:
xijt ¼ GtMexit M
imjt ϕijt : ð3Þ
With respect to the data at hand, however, this isproblematic in that we only observe Canadian bilateraltrade and, thus, every observation would exactlycorrespond with the time-varying exporter or importerfixed effects. One way forward is to combine theCanadian trade data with equivalent data from the US.Unfortunately, US sources only report total bilateraltrade on a monthly basis; that is, there are no separaterecords of bilateral trade at the commodity level.The necessary data is drawn from the Bureau of theCensus's Monthly Summary of Foreign Commerce ofthe United States and was first translated into Canadiandollars using the monthly bilateral exchange rate, thendeflated using the Canadian monthly consumer priceindex, and finally aggregated to the quarterly level.These figures are then joined with the relevant Canadiantrade data, allowing for 95 precise country matches.
In this case, we must augment the benchmarkdifference-in-differences specification to allow for anydifferential growth in Canadian versus US trade withsignatories at the Ottawa conference. The resultingdifference-in-difference-in-differences (DDD) specifi-cation pools observations on Canadian and US bilateraltrade in two periods:
ln xijt� � ¼ βit þ βjt þ β1 � Ottawaij þ β2 � Canadaij
þβ3 � Ottawaij � Canadaij þ β4 � T
þβ5 � Ottawaij � T þ β6 � Canadaij � T
þβ7 � Ottawaij � Canadaij � T þ εijt:
Here, Ottawa is an indicator for whether a particularbilateral pair includes a signatory at the Ottawa
32 D.S. Jacks / Explorations in Economic History 53 (2014) 19–39
Conference, Canada is an indicator for whether aparticular bilateral pair includes Canada, and T is anindicator for time which is common to all country-pairs.The coefficient of interest in this case will be the seventh
Table 4aCanadian exports in response to Ottawa, incorporating different price indice
(1) (2
Dependent variable: C
From announcement o
Time fixed effect O
Agricultural and vegetable products, one year out 0.0298 −Standard error 0.1900p-Value 0.8700
'n = 236Animals and animal products, one year out 0.2315 −Standard error 0.0600p-Value 0.0000
n = 236Chemicals and allied products, one year out 0.5223 −Standard error 0.1200p-Value 0.0000
n = 236Fibers, textiles and products, 1.2140 −Standard error 0.2500p-Value 0.0000
n = 236Iron and its products, one year out 0.1653Standard error 0.3200p-Value 0.6100
n = 236Miscellaneous commodities, one year out 0.1941 −Standard error 0.0600p-Value 0.0000
n = 236Non-ferrous metal products, one year out 0.5096Standard error 0.1200p-Value 0.0000
n = 236Non-metallic mineral products, one year out 0.7225 −Standard error 0.0600p-Value 0.0000
n = 236Paper and wood, one year out 0.4361 −Standard error 0.0200p-Value 0.0000
n = 236
Total merchandise exports, one year out 0.2913 −Standard error 0.0900p-Value 0.0000
n = 236
Notes: Each pair of coefficients in columns (1) and (2) are generated from apair of coefficients in columns (3) and (4) are generated from a singlepseudo-maximum-likelihood (PPML) used for all regressions. Exporter andclustered on countries. Australia, India, the Irish Free State, New ZealandKingdom (along with Canada) were signatories at Ottawa. Sources: Bilateralvarious years.
beta which indicates the degree to which Canada'sbilateral trade with signatories at Ottawa changed at adifferential rate than that of US bilateral trade with thesame. Again, the PPML estimator is used throughout.
s.
) (3) (4)
anadian exports
f results, Q3 1932 From enactment of provisions, Q4 1932
ttawa-time interaction Time fixed effect Ottawa-time interaction
0.2059 −0.1011 −0.01640.1900 0.2300 0.23000.2800 0.6600 0.9400
n = 2360.1917 0.1922 0.26040.0600 0.0500 0.06000.0000 0.0000 0.0000
n = 2360.4334 0.1863 −0.03050.1400 0.0500 0.07000.0000 0.0000 0.6600
n = 2360.9468 0.9197 −0.45860.2800 0.4000 0.42000.0000 0.0200 0.2700
n = 2360.1218 0.3459 0.04750.4600 0.3200 0.41000.7900 0.2800 0.9100
n = 2360.2743 0.4301 −0.92920.0700 0.0400 0.21000.0000 0.0000 0.0000
n = 2360.2103 0.4581 0.08030.1800 0.1600 0.16000.2500 0.0100 0.6300
n = 2360.0585 0.9085 −0.70870.1600 0.1500 0.18000.7200 0.0000 0.0000
n = 2360.0553 0.2525 0.45840.0800 0.0400 0.08000.4800 0.0000 0.0000
n = 236
0.1762 0.1742 0.01050.0900 0.1000 0.11000.0500 0.0900 0.9200
n = 236
single regression pooling exports from Q3 1932 and Q3 1933. Eachregression pooling exports from Q4 1932 and Q4 1933. Poissonimporter fixed effects have been suppressed while standard errors are, Newfoundland, South Africa, Southern Rhodesia, and the Unitedtrade data drawn from DBS, Quarterly Report of the Trade of Canada,
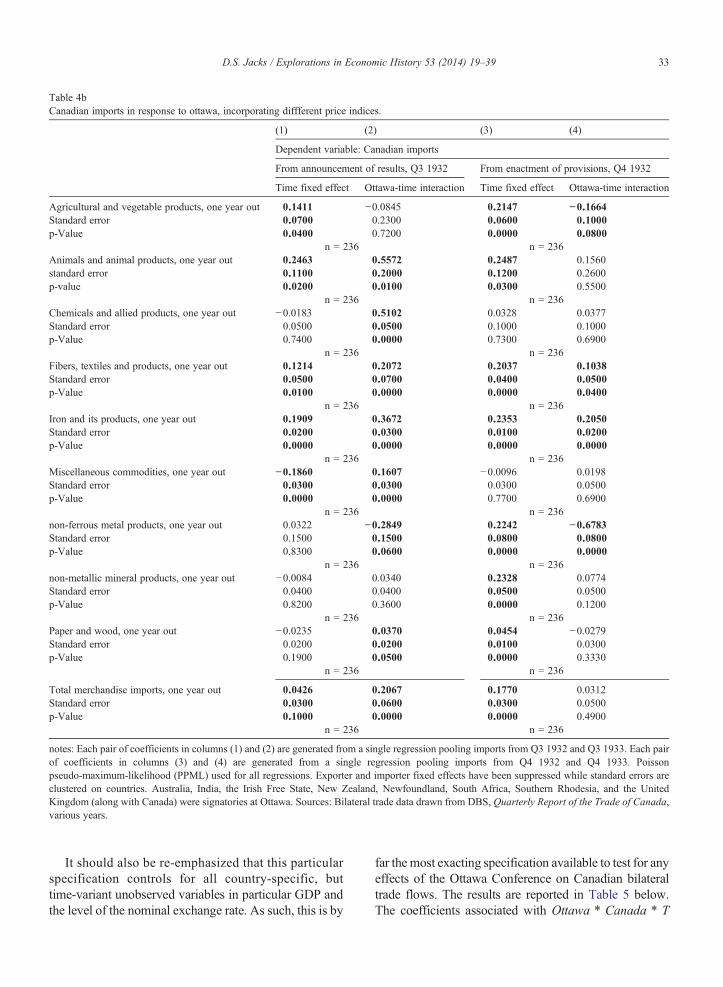
Table 4bCanadian imports in response to ottawa, incorporating diffferent price indices.
(1) (2) (3) (4)
Dependent variable: Canadian imports
From announcement of results, Q3 1932 From enactment of provisions, Q4 1932
Time fixed effect Ottawa-time interaction Time fixed effect Ottawa-time interaction
Agricultural and vegetable products, one year out 0.1411 −0.0845 0.2147 −0.1664Standard error 0.0700 0.2300 0.0600 0.1000p-Value 0.0400 0.7200 0.0000 0.0800
n = 236 n = 236Animals and animal products, one year out 0.2463 0.5572 0.2487 0.1560standard error 0.1100 0.2000 0.1200 0.2600p-value 0.0200 0.0100 0.0300 0.5500
n = 236 n = 236Chemicals and allied products, one year out −0.0183 0.5102 0.0328 0.0377Standard error 0.0500 0.0500 0.1000 0.1000p-Value 0.7400 0.0000 0.7300 0.6900
n = 236 n = 236Fibers, textiles and products, one year out 0.1214 0.2072 0.2037 0.1038Standard error 0.0500 0.0700 0.0400 0.0500p-Value 0.0100 0.0000 0.0000 0.0400
n = 236 n = 236Iron and its products, one year out 0.1909 0.3672 0.2353 0.2050Standard error 0.0200 0.0300 0.0100 0.0200p-Value 0.0000 0.0000 0.0000 0.0000
n = 236 n = 236Miscellaneous commodities, one year out −0.1860 0.1607 −0.0096 0.0198Standard error 0.0300 0.0300 0.0300 0.0500p-Value 0.0000 0.0000 0.7700 0.6900
n = 236 n = 236non-ferrous metal products, one year out 0.0322 −0.2849 0.2242 −0.6783Standard error 0.1500 0.1500 0.0800 0.0800p-Value 0.8300 0.0600 0.0000 0.0000
n = 236 n = 236non-metallic mineral products, one year out −0.0084 0.0340 0.2328 0.0774Standard error 0.0400 0.0400 0.0500 0.0500p-Value 0.8200 0.3600 0.0000 0.1200
n = 236 n = 236Paper and wood, one year out −0.0235 0.0370 0.0454 −0.0279Standard error 0.0200 0.0200 0.0100 0.0300p-Value 0.1900 0.0500 0.0000 0.3330
n = 236 n = 236
Total merchandise imports, one year out 0.0426 0.2067 0.1770 0.0312Standard error 0.0300 0.0600 0.0300 0.0500p-Value 0.1000 0.0000 0.0000 0.4900
n = 236 n = 236
notes: Each pair of coefficients in columns (1) and (2) are generated from a single regression pooling imports from Q3 1932 and Q3 1933. Each pairof coefficients in columns (3) and (4) are generated from a single regression pooling imports from Q4 1932 and Q4 1933. Poissonpseudo-maximum-likelihood (PPML) used for all regressions. Exporter and importer fixed effects have been suppressed while standard errors areclustered on countries. Australia, India, the Irish Free State, New Zealand, Newfoundland, South Africa, Southern Rhodesia, and the UnitedKingdom (along with Canada) were signatories at Ottawa. Sources: Bilateral trade data drawn from DBS, Quarterly Report of the Trade of Canada,various years.
33D.S. Jacks / Explorations in Economic History 53 (2014) 19–39
It should also be re-emphasized that this particularspecification controls for all country-specific, buttime-variant unobserved variables in particular GDP andthe level of the nominal exchange rate. As such, this is by
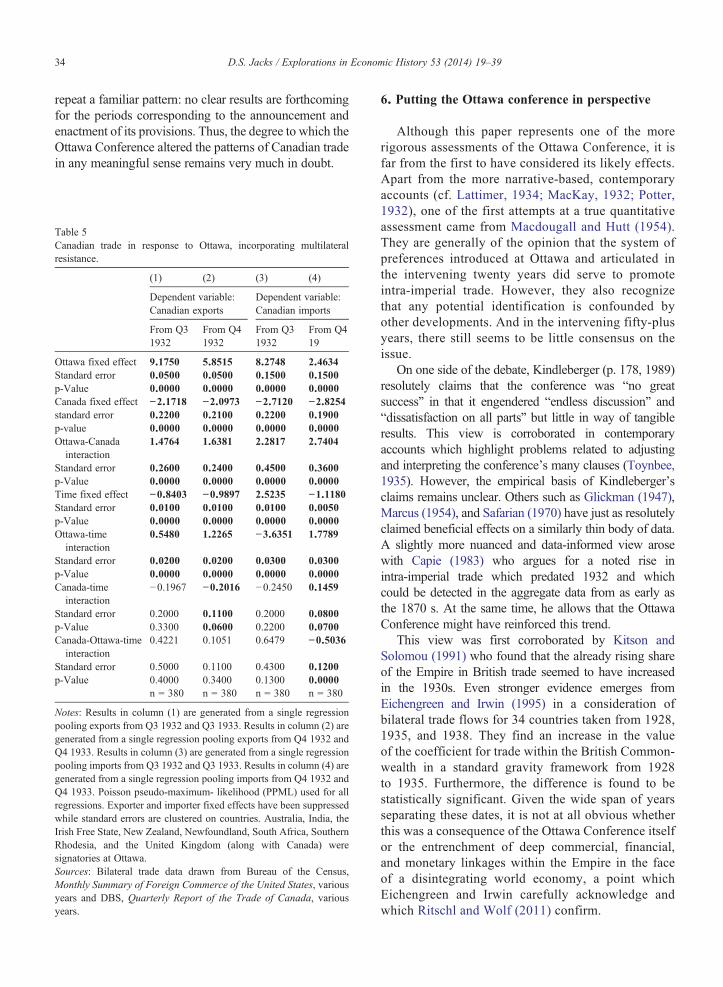
far the most exacting specification available to test for anyeffects of the Ottawa Conference on Canadian bilateraltrade flows. The results are reported in Table 5 below.The coefficients associated with Ottawa ∗ Canada ∗ T
34 D.S. Jacks / Explorations in Economic History 53 (2014) 19–39
repeat a familiar pattern: no clear results are forthcomingfor the periods corresponding to the announcement andenactment of its provisions. Thus, the degree to which theOttawa Conference altered the patterns of Canadian tradein any meaningful sense remains very much in doubt.
Table 5Canadian trade in response to Ottawa, incorporating multilateralresistance.
(1) (2) (3) (4)
Dependent variable:Canadian exports
Dependent variable:Canadian imports
From Q31932
From Q41932
From Q31932
From Q419
Ottawa fixed effect 9.1750 5.8515 8.2748 2.4634Standard error 0.0500 0.0500 0.1500 0.1500p-Value 0.0000 0.0000 0.0000 0.0000Canada fixed effect −2.1718 −2.0973 −2.7120 −2.8254standard error 0.2200 0.2100 0.2200 0.1900p-value 0.0000 0.0000 0.0000 0.0000Ottawa-Canadainteraction
1.4764 1.6381 2.2817 2.7404
Standard error 0.2600 0.2400 0.4500 0.3600p-Value 0.0000 0.0000 0.0000 0.0000Time fixed effect −0.8403 −0.9897 2.5235 −1.1180Standard error 0.0100 0.0100 0.0100 0.0050p-Value 0.0000 0.0000 0.0000 0.0000Ottawa-timeinteraction
0.5480 1.2265 −3.6351 1.7789
Standard error 0.0200 0.0200 0.0300 0.0300p-Value 0.0000 0.0000 0.0000 0.0000Canada-timeinteraction
−0.1967 −0.2016 −0.2450 0.1459
Standard error 0.2000 0.1100 0.2000 0.0800p-Value 0.3300 0.0600 0.2200 0.0700Canada-Ottawa-timeinteraction
0.4221 0.1051 0.6479 −0.5036
Standard error 0.5000 0.1100 0.4300 0.1200p-Value 0.4000 0.3400 0.1300 0.0000
n = 380 n = 380 n = 380 n = 380
Notes: Results in column (1) are generated from a single regressionpooling exports from Q3 1932 and Q3 1933. Results in column (2) aregenerated from a single regression pooling exports from Q4 1932 andQ4 1933. Results in column (3) are generated from a single regressionpooling imports from Q3 1932 and Q3 1933. Results in column (4) aregenerated from a single regression pooling imports from Q4 1932 andQ4 1933. Poisson pseudo-maximum- likelihood (PPML) used for allregressions. Exporter and importer fixed effects have been suppressedwhile standard errors are clustered on countries. Australia, India, theIrish Free State, New Zealand, Newfoundland, South Africa, SouthernRhodesia, and the United Kingdom (along with Canada) weresignatories at Ottawa.Sources: Bilateral trade data drawn from Bureau of the Census,Monthly Summary of Foreign Commerce of the United States, variousyears and DBS, Quarterly Report of the Trade of Canada, variousyears.
6. Putting the Ottawa conference in perspective
Although this paper represents one of the morerigorous assessments of the Ottawa Conference, it isfar from the first to have considered its likely effects.Apart from the more narrative-based, contemporaryaccounts (cf. Lattimer, 1934; MacKay, 1932; Potter,1932), one of the first attempts at a true quantitativeassessment came from Macdougall and Hutt (1954).They are generally of the opinion that the system ofpreferences introduced at Ottawa and articulated inthe intervening twenty years did serve to promoteintra-imperial trade. However, they also recognizethat any potential identification is confounded byother developments. And in the intervening fifty-plusyears, there still seems to be little consensus on theissue.
On one side of the debate, Kindleberger (p. 178, 1989)resolutely claims that the conference was “no greatsuccess” in that it engendered “endless discussion” and“dissatisfaction on all parts” but little in way of tangibleresults. This view is corroborated in contemporaryaccounts which highlight problems related to adjustingand interpreting the conference's many clauses (Toynbee,1935). However, the empirical basis of Kindleberger'sclaims remains unclear. Others such as Glickman (1947),Marcus (1954), and Safarian (1970) have just as resolutelyclaimed beneficial effects on a similarly thin body of data.A slightly more nuanced and data-informed view arosewith Capie (1983) who argues for a noted rise inintra-imperial trade which predated 1932 and whichcould be detected in the aggregate data from as early asthe 1870 s. At the same time, he allows that the OttawaConference might have reinforced this trend.
This view was first corroborated by Kitson andSolomou (1991) who found that the already rising shareof the Empire in British trade seemed to have increasedin the 1930s. Even stronger evidence emerges fromEichengreen and Irwin (1995) in a consideration ofbilateral trade flows for 34 countries taken from 1928,1935, and 1938. They find an increase in the valueof the coefficient for trade within the British Common-wealth in a standard gravity framework from 1928to 1935. Furthermore, the difference is found to bestatistically significant. Given the wide span of yearsseparating these dates, it is not at all obvious whetherthis was a consequence of the Ottawa Conference itselfor the entrenchment of deep commercial, financial,and monetary linkages within the Empire in the faceof a disintegrating world economy, a point whichEichengreen and Irwin carefully acknowledge andwhich Ritschl and Wolf (2011) confirm.
8 Canadian real exports to the UK stood at $185,293,223 whileCanadian real imports from the UK stood at $152,224,105 in August1929. Canadian real exports to the UK stood at $185,090,732 whileCanadian real imports from the UK stood at $79,123,309 in August1932. Canadian real exports to the US stood at $411,059,720 whileCanadian real imports from the US stood at $632,077,286 in August1929. Finally, the Canadian–UK bilateral trade cost in 1932 was equalto 0.9208. Assuming a value of eight for sigma, all that remains is tocalculate the hypothetical value for the bilateral trade cost in Eq. (6).
35D.S. Jacks / Explorations in Economic History 53 (2014) 19–39
Part of the confusion with respect to the effects ofthe Ottawa Conference is perhaps derived from themore fundamental confusion of what its purposes reallywere. From the perspective of the British, it has beenargued that the negotiations and generous concessions,while geared towards the short-term goal of tradecreation, also had an eye towards the long-run goal ofsubstituting the British Empire for global markets(Boyce, 2010). From the perspective of Canada and theother Dominions, gaining enhanced access to the UKmarket was clearly one of their more immediateobjectives. But whether this reflected a desire tosomehow replace the UK for the US as the primarydestination for Canadian exports or more modestly toreturn Canadian exports to the UK to their pre-1930levels is unclear (O'Brien and McDonald, 2009).Regardless of what their long-run aspirations were,however, all signatories hoped that the concessionsagreed to in Ottawa would significantly lower tradecosts among them.
In this respect, it is possible to gauge whetherexpectations of significant trade cost declines were evenreasonable. Jacks et al. (2011) use the following gravityequation which is consistent with nearly all leadingtheories of international trade,
xijxji ¼ xiixjjtijtjitiitjj
� �1−σ
: ð5Þ
Here, the product of bilateral exports is a function oftwo terms. The first term is the product of domestictrade, that is, how much a country in effect trades withitself. The second term is the product of two trade costratios which represent the extent to which bilateraltrade costs exceed domestic trade costs. Finally, σ isthe elasticity of substitution between domestic andforeign goods. By calculating the logarithm of thisexpression and taking its first difference, it becomespossible to decompose the growth in bilateral trade intofour components: the contribution of output growth,the contribution of changes in income similarity,the contribution of changes in ad-valorem-equivalentbilateral trade costs, and the contribution of changes inmultilateral factors.
Thus, assuming all else constant, the relationshipbetween bilateral exports and bilateral trade costs isgiven by
Δ ln xijxji� � ¼ 2 1−σð ÞΔ ln 1þ τij
� �: ð6Þ
This implies that, given conditions in August 1932,trade costs would have needed to decline by a sizeable9.5% to return Canada–UK bilateral trade to its August1929 level.8 Likewise, ad-valorem-equivalent bilateraltrade costs would have needed to decline by anastounding 38.7% in order for Canada–UK bilateraltrade to reach the August 1929 level of Canada–USbilateral trade. To put these figures in perspective,ad-valorem-equivalent trade costs between Canada andthe UK fell by 13.0% for the entire period from 1870 to1913, a time of rapidly declining communication andtransportation costs and significant change in theinstitutions and policy environment surrounding worldtrade (Jacks et al., 2010). Clearly, such potentialdeclines would represent overly ambitious–if notaudacious–expectations on the downward trajectory oftrade costs following the Ottawa Conference.
7. Conclusion
This paper has explored the effects of the ImperialEconomic Conference of, 1932, particularly in thecontext of subsequent Canadian bilateral export andimport performance. The results have not been particu-larly kind to the traditional literature which has held thatthe conference promoted the cause of imperial trade, atleast from the Canadian perspective. Across commodi-ties, across exports and imports, across different timehorizons, across alternative transformations of the data,and across different specifications, we identify feweconomically and statistically significant effects of theconference in the extensive bilateral trade data at hand.Indeed, the data suggest that any hopes of recovering theground lost from 1929 were wedded with unrealisticexpectations as to the efficacy and limits of commercialpolicy.
The paper has also highlighted the asymmetric natureof the forces shaping North American economic history,as seen in the trading relation between Canada and theUnited States. Although the former is dominated by
36 D.S. Jacks / Explorations in Economic History 53 (2014) 19–39
the latter, especially with respect to commercialpolicy, the experience of the years from 1929 to1932 demonstrated the utter folly of either countryattempting to “defy gravity” and sever the links ofcapital and trade which had served to not only deepenthe division of labor between them but also enhancetheir joint material well-being. In this sense, the paperhas implicitly invoked the perennial dilemma ofsmall-to-medium sized economies in tying theirfortunes to a dominant trade partner and suffering attheir whim or going it alone and thereby foregoingpotential productivity and welfare gains. Likewise, thepaper has served as a reminder that there have been atleast some lessons learned from economic history,particularly in the context of commercial policy. Andnowhere can this be seen more clearly than in therecent experience surrounding the second great tradebust of the past century: at no time did the Canadiancommitment to free trade seriously waver in the pastfew years.
At the same time, the paper opens a number ofissues. One of the most glaring of which is that we stilllack a complete quantitative assessment of the forceswhich were responsible for the collapse of world tradefrom 1929 to 1933 and which provided the backdropto the developments at Ottawa. Pet theories abound,but even eighty years on, not enough work has beendone in systematically relating changes in the variouspolicy, transaction, and transport frictions as well asglobal output in driving the trade bust. Apart fromantiquarian interests, this episode is important in that itrepresents one of the few documented and generalizedtrade collapses in world history. What is more, themechanisms seemingly at work in the case ofCanadian bilateral trade in this period suggest theremay be some here-to-fore unexplored forces to beconsidered.
First is the role of certainty over the likely courseof commercial policy in the decision set of exportersand importers alike. Leo Amery was almost certainlycorrect in his prognosis that “unless the manufacturersand farmers of the Empire have some definiteassurance they cannot embark on any policy ofdevelopment…who is going to build a railway ordevelop a port on the assurance of an export trade, theconditions of which may be destroyed before thebuilding is finished?” (1932, p. 687). Given theevidence on the necessary role of beachhead activityby exporting firms and the existence of substantialfixed costs to trading activity (Bernard et al., 2007),such concerns are likely to have been a critical elementholding back the re-orientation of Canadian trade in
this period. This is especially true in light of the factthat informational barriers to trade have almostcertainly fallen over time. Thus, it stands to reasonthat if these constraints are important in the present,they were almost certainly more binding in the past, apoint which has been recently and strongly emphasizedin the literature on the political economy of tradeagreements (Limao and Maggi, 2013).
Second, and very much relatedly, the question ariseswhether the Canadian commitment to re-orienting itstrade away from the United States and towards therest of the British Empire was even credible. Ofcourse, developments over the past eighty yearssuggest not. However, contemporary accounts alsoseemed doubtful on this front (“Afterthoughts onthe Conference”, 1932; “An Ottawa Impression”,1932). This doubt was certainly not assuaged whenas early as January 1933 Canadian Prime MinisterBennett opened the door to trade negotiations withthe United States, remarking before the TorontoBoard of Trade that “geographically, we are part ofthe North American continent…and it gives me nojoy to remind you also that financially it is in thesame position” (quoted in O'Brien and McDonald,2009, p. 352). Clearly, from the perspective of firmsengaged in international trade, the official Canadianposition of defying the inexorable pull exerted by thecombined economic mass and geographic proximity ofthe US was untenable. And the subsequent re-orientationtowards the US in its commercial policy was, therefore,likely expected.
Finally, a thread of analysis which is prominent inaccounts from the 1930s but which has been succes-sively played down through time is the role ofendogenous changes in consumer taste. It is standardin much of the literature to assume that some degree ofhome bias in international trade exists. It is alsostandard to assume that this bias is constant. Theexperience of the interwar period suggests that unob-served changes in home–or in this case, imperial–biasbrought about by the radical changes in commercialpolicy may have significantly altered the orientation ofworld trade in this period. Frieden (2006) and Irwin(2011) both present some compelling examples of theworldwide consumer response to US goods in the wakeof Smoot–Hawley. Generalizing this response andframing it within the context of standard models ofconsumer demand as well as incorporating the afore-mentioned elements of certainty and credibility remainpromising ways forward for assessing the forces drivingthe collapse and re-orientation of trade, both in the pastand present.
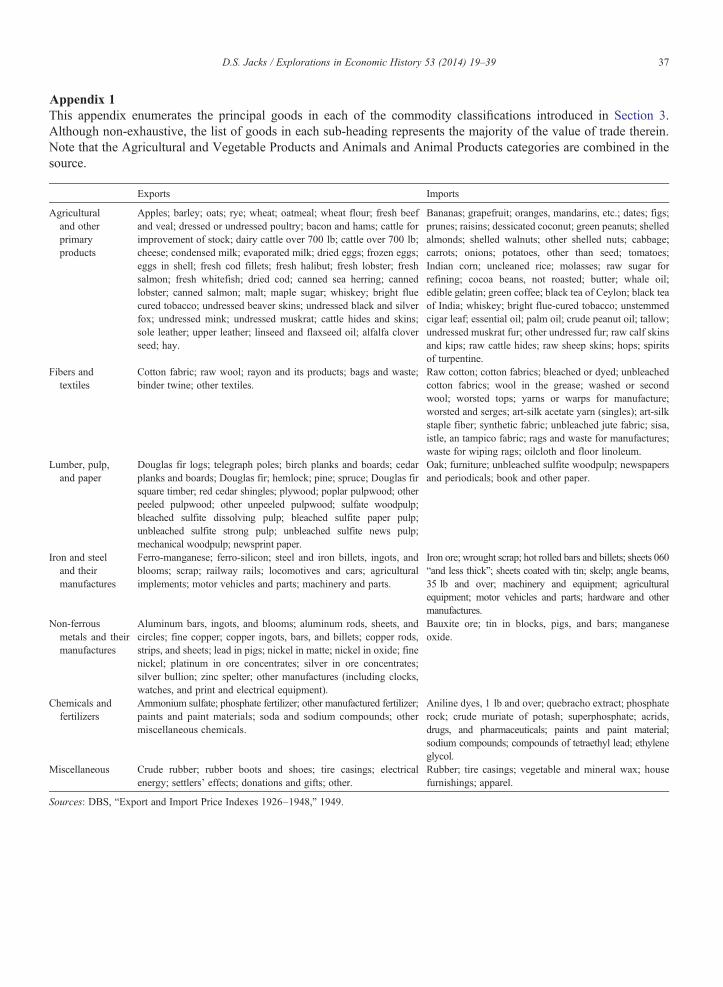
Appendix 1This appendix enumerates the principal goods in each of the commodity classifications introduced in Section 3.Although non-exhaustive, the list of goods in each sub-heading represents the majority of the value of trade therein.Note that the Agricultural and Vegetable Products and Animals and Animal Products categories are combined in thesource.
Exports Imports
Agriculturaland otherprimaryproducts
Apples; barley; oats; rye; wheat; oatmeal; wheat flour; fresh beefand veal; dressed or undressed poultry; bacon and hams; cattle forimprovement of stock; dairy cattle over 700 lb; cattle over 700 lb;cheese; condensed milk; evaporated milk; dried eggs; frozen eggs;eggs in shell; fresh cod fillets; fresh halibut; fresh lobster; freshsalmon; fresh whitefish; dried cod; canned sea herring; cannedlobster; canned salmon; malt; maple sugar; whiskey; bright fluecured tobacco; undressed beaver skins; undressed black and silverfox; undressed mink; undressed muskrat; cattle hides and skins;sole leather; upper leather; linseed and flaxseed oil; alfalfa cloverseed; hay.
Bananas; grapefruit; oranges, mandarins, etc.; dates; figs;prunes; raisins; dessicated coconut; green peanuts; shelledalmonds; shelled walnuts; other shelled nuts; cabbage;carrots; onions; potatoes, other than seed; tomatoes;Indian corn; uncleaned rice; molasses; raw sugar forrefining; cocoa beans, not roasted; butter; whale oil;edible gelatin; green coffee; black tea of Ceylon; black teaof India; whiskey; bright flue-cured tobacco; unstemmedcigar leaf; essential oil; palm oil; crude peanut oil; tallow;undressed muskrat fur; other undressed fur; raw calf skinsand kips; raw cattle hides; raw sheep skins; hops; spiritsof turpentine.
Fibers andtextiles
Cotton fabric; raw wool; rayon and its products; bags and waste;binder twine; other textiles.
Raw cotton; cotton fabrics; bleached or dyed; unbleachedcotton fabrics; wool in the grease; washed or secondwool; worsted tops; yarns or warps for manufacture;worsted and serges; art-silk acetate yarn (singles); art-silkstaple fiber; synthetic fabric; unbleached jute fabric; sisa,istle, an tampico fabric; rags and waste for manufactures;waste for wiping rags; oilcloth and floor linoleum.
Lumber, pulp,and paper
Douglas fir logs; telegraph poles; birch planks and boards; cedarplanks and boards; Douglas fir; hemlock; pine; spruce; Douglas firsquare timber; red cedar shingles; plywood; poplar pulpwood; otherpeeled pulpwood; other unpeeled pulpwood; sulfate woodpulp;bleached sulfite dissolving pulp; bleached sulfite paper pulp;unbleached sulfite strong pulp; unbleached sulfite news pulp;mechanical woodpulp; newsprint paper.
Oak; furniture; unbleached sulfite woodpulp; newspapersand periodicals; book and other paper.
Iron and steeland theirmanufactures
Ferro-manganese; ferro-silicon; steel and iron billets, ingots, andblooms; scrap; railway rails; locomotives and cars; agriculturalimplements; motor vehicles and parts; machinery and parts.
Iron ore; wrought scrap; hot rolled bars and billets; sheets 060“and less thick”; sheets coated with tin; skelp; angle beams,35 lb and over; machinery and equipment; agriculturalequipment; motor vehicles and parts; hardware and othermanufactures.
Non-ferrousmetals and theirmanufactures
Aluminum bars, ingots, and blooms; aluminum rods, sheets, andcircles; fine copper; copper ingots, bars, and billets; copper rods,strips, and sheets; lead in pigs; nickel in matte; nickel in oxide; finenickel; platinum in ore concentrates; silver in ore concentrates;silver bullion; zinc spelter; other manufactures (including clocks,watches, and print and electrical equipment).
Bauxite ore; tin in blocks, pigs, and bars; manganeseoxide.
Chemicals andfertilizers
Ammonium sulfate; phosphate fertilizer; other manufactured fertilizer;paints and paint materials; soda and sodium compounds; othermiscellaneous chemicals.
Aniline dyes, 1 lb and over; quebracho extract; phosphaterock; crude muriate of potash; superphosphate; acrids,drugs, and pharmaceuticals; paints and paint material;sodium compounds; compounds of tetraethyl lead; ethyleneglycol.
Miscellaneous Crude rubber; rubber boots and shoes; tire casings; electricalenergy; settlers' effects; donations and gifts; other.
Rubber; tire casings; vegetable and mineral wax; housefurnishings; apparel.
Sources: DBS, “Export and Import Price Indexes 1926–1948,” 1949.
37D.S. Jacks / Explorations in Economic History 53 (2014) 19–39
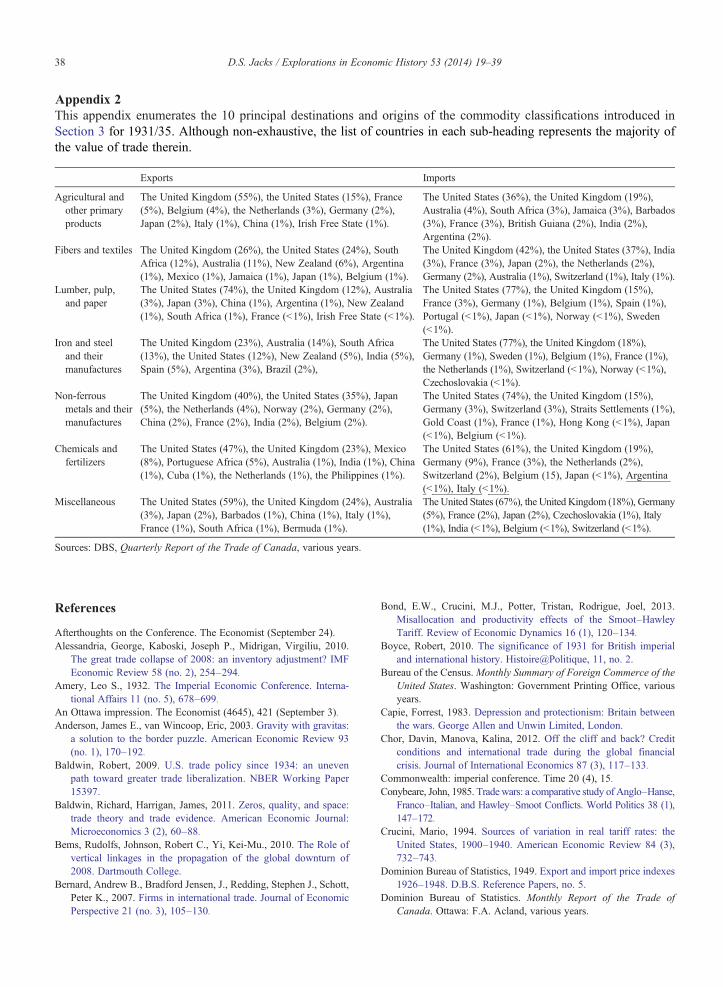
Appendix 2This appendix enumerates the 10 principal destinations and origins of the commodity classifications introduced inSection 3 for 1931/35. Although non-exhaustive, the list of countries in each sub-heading represents the majority ofthe value of trade therein.
Exports Imports
Agricultural andother primaryproducts
The United Kingdom (55%), the United States (15%), France(5%), Belgium (4%), the Netherlands (3%), Germany (2%),Japan (2%), Italy (1%), China (1%), Irish Free State (1%).
The United States (36%), the United Kingdom (19%),Australia (4%), South Africa (3%), Jamaica (3%), Barbados(3%), France (3%), British Guiana (2%), India (2%),Argentina (2%).
Fibers and textiles The United Kingdom (26%), the United States (24%), SouthAfrica (12%), Australia (11%), New Zealand (6%), Argentina(1%), Mexico (1%), Jamaica (1%), Japan (1%), Belgium (1%).
The United Kingdom (42%), the United States (37%), India(3%), France (3%), Japan (2%), the Netherlands (2%),Germany (2%), Australia (1%), Switzerland (1%), Italy (1%).
Lumber, pulp,and paper
The United States (74%), the United Kingdom (12%), Australia(3%), Japan (3%), China (1%), Argentina (1%), New Zealand(1%), South Africa (1%), France (b1%), Irish Free State (b1%).
The United States (77%), the United Kingdom (15%),France (3%), Germany (1%), Belgium (1%), Spain (1%),Portugal (b1%), Japan (b1%), Norway (b1%), Sweden(b1%).
Iron and steeland theirmanufactures
The United Kingdom (23%), Australia (14%), South Africa(13%), the United States (12%), New Zealand (5%), India (5%),Spain (5%), Argentina (3%), Brazil (2%),
The United States (77%), the United Kingdom (18%),Germany (1%), Sweden (1%), Belgium (1%), France (1%),the Netherlands (1%), Switzerland (b1%), Norway (b1%),Czechoslovakia (b1%).
Non-ferrousmetals and theirmanufactures
The United Kingdom (40%), the United States (35%), Japan(5%), the Netherlands (4%), Norway (2%), Germany (2%),China (2%), France (2%), India (2%), Belgium (2%).
The United States (74%), the United Kingdom (15%),Germany (3%), Switzerland (3%), Straits Settlements (1%),Gold Coast (1%), France (1%), Hong Kong (b1%), Japan(b1%), Belgium (b1%).
Chemicals andfertilizers
The United States (47%), the United Kingdom (23%), Mexico(8%), Portuguese Africa (5%), Australia (1%), India (1%), China(1%), Cuba (1%), the Netherlands (1%), the Philippines (1%).
The United States (61%), the United Kingdom (19%),Germany (9%), France (3%), the Netherlands (2%),Switzerland (2%), Belgium (15), Japan (b1%), Argentina(b1%), Italy (b1%).
Miscellaneous The United States (59%), the United Kingdom (24%), Australia(3%), Japan (2%), Barbados (1%), China (1%), Italy (1%),France (1%), South Africa (1%), Bermuda (1%).
The United States (67%), the United Kingdom (18%), Germany(5%), France (2%), Japan (2%), Czechoslovakia (1%), Italy(1%), India (b1%), Belgium (b1%), Switzerland (b1%).
Sources: DBS, Quarterly Report of the Trade of Canada, various years.
38 D.S. Jacks / Explorations in Economic History 53 (2014) 19–39
References
Afterthoughts on the Conference. The Economist (September 24).Alessandria, George, Kaboski, Joseph P., Midrigan, Virgiliu, 2010.
The great trade collapse of 2008: an inventory adjustment? IMFEconomic Review 58 (no. 2), 254–294.
Amery, Leo S., 1932. The Imperial Economic Conference. Interna-tional Affairs 11 (no. 5), 678–699.
An Ottawa impression. The Economist (4645), 421 (September 3).Anderson, James E., van Wincoop, Eric, 2003. Gravity with gravitas:
a solution to the border puzzle. American Economic Review 93(no. 1), 170–192.
Baldwin, Robert, 2009. U.S. trade policy since 1934: an unevenpath toward greater trade liberalization. NBER Working Paper15397.
Baldwin, Richard, Harrigan, James, 2011. Zeros, quality, and space:trade theory and trade evidence. American Economic Journal:Microeconomics 3 (2), 60–88.
Bems, Rudolfs, Johnson, Robert C., Yi, Kei-Mu., 2010. The Role ofvertical linkages in the propagation of the global downturn of2008. Dartmouth College.
Bernard, Andrew B., Bradford Jensen, J., Redding, Stephen J., Schott,Peter K., 2007. Firms in international trade. Journal of EconomicPerspective 21 (no. 3), 105–130.
Bond, E.W., Crucini, M.J., Potter, Tristan, Rodrigue, Joel, 2013.Misallocation and productivity effects of the Smoot–HawleyTariff. Review of Economic Dynamics 16 (1), 120–134.
Boyce, Robert, 2010. The significance of 1931 for British imperialand international history. Histoire@Politique, 11, no. 2.
Bureau of the Census.Monthly Summary of Foreign Commerce of theUnited States. Washington: Government Printing Office, variousyears.
Capie, Forrest, 1983. Depression and protectionism: Britain betweenthe wars. George Allen and Unwin Limited, London.
Chor, Davin, Manova, Kalina, 2012. Off the cliff and back? Creditconditions and international trade during the global financialcrisis. Journal of International Economics 87 (3), 117–133.
Commonwealth: imperial conference. Time 20 (4), 15.Conybeare, John, 1985. Tradewars: a comparative study of Anglo–Hanse,
Franco–Italian, and Hawley–Smoot Conflicts. World Politics 38 (1),147–172.
Crucini, Mario, 1994. Sources of variation in real tariff rates: theUnited States, 1900–1940. American Economic Review 84 (3),732–743.
Dominion Bureau of Statistics, 1949. Export and import price indexes1926–1948. D.B.S. Reference Papers, no. 5.
Dominion Bureau of Statistics. Monthly Report of the Trade ofCanada. Ottawa: F.A. Acland, various years.
39D.S. Jacks / Explorations in Economic History 53 (2014) 19–39
Dominion Bureau of Statistics. Quarterly Report of the Trade ofCanada. Ottawa: F.A. Acland, various years.
Drummond, Ian M., 1972. British economic policy and the empire,1919–1939. George Allen and Unwin Limited, London.
Eaton, Jonathan, Kortum, Sam, Neiman, Brent, Romalis, John, 2010.Trade and the global recession. NBER Working Paper 16666.
Egger, Peter, Larch, Mario, Staub, Kevin E., Winkelmann, Rainer,2011. The trade effects of endogenous preferential tradeagreements. American Economic Journal: Economic Policy 3(3), 113–143.
Eichengreen, Barry, Irwin, Douglas A., 1995. Trade blocs, currencyblocs and the reorientation of world trade in the 1930s. Journal ofInternational Economics 38 (1), 1–24.
Eichengreen, Barry, Irwin, Douglas A., 2010. The slide to protection-ism in the Great Depression: who succumbed and why? Journal ofEconomic History 70 (4), 871–897.
Estevadeordal, Antoni, Frantz, Brian, Taylor, Alan M., 2003. The riseand fall of world trade, 1870–1939. Quarterly Journal ofEconomics 118 (2), 359–407.
Frieden, Jeffry, 2006. Global capitalism: its fall and rise in thetwentieth century. W.W. Norton, New York.
Glickman, David L., 1947. The British Imperial Preference System.Quarterly Journal of Economics 61 (no. 3), 439–470.
Hanson, Gordon H., Xiang, Chng, 2004. The home–market effect andbilateral trade patterns. American Economic Review 94 (4),1108–1129.
Hart, Michael, 2002. A trading nation: Canadian trade policy fromcolonialism to globalization. University of British Columbia Press,Vancouver.
Hynes, William, Jacks, David S., O'Rourke, Kevin H., 2011.Commodity market disintegration in the interwar period. EuropeanReview of Economic History 16 (2), 119–143.
Irwin, Douglas A., 2011. Peddling protectionism: Smoot–Hawley andthe Great Depression. Princeton University Press, Princeton.
Jacks, David S., 2011. Defying gravity: The 1932 Imperial EconomicConference and the Reorientation of Canadian Trade. NBERWorking Paper 17242.
Jacks, David S., Meissner, Christopher M., Novy, Dennis, 2010.Trade costs in the first wave of globalization. Explorations inEconomic History 47 (2), 127–141.
Jacks, David S., Meissner, Christopher M., Novy, Dennis, 2011.Trade booms, trade busts, and trade costs. Journal of InternationalEconomics 83 (2), 185–201.
Kindleberger, Charles P., 1989. Commercial policy between the wars.In: Mathias, Peter, Pollard, Sidney (Eds.), The IndustrialEconomies: The Development of Economic and Social Policies.Cambridge University Press, Cambridge.
Kitson, Michael, Solomou, Solomos, 1991. Trade policy and theregionalization of imports in interwar Britain. Bulletin ofEconomic Research 43 (2), 151–168.
Kottman, Richard N., 1975. Herbert Hoover and the Smoot–HawleyTariff: Canada, a case study. Journal of American History 62 (no.3), 609–635.
Lattimer, John E., 1934. The Ottawa trade agreements. Journal ofFarm Economics 16 (no. 4), 565–581.
Levchenko, Andrei A., Lewis, Logan T., Tesar, Linda L., 2010. Thecollapse of international trade during the 2008–2009 crisis: in searchof the smoking gun. IMF Economic Review 58 (2), 214–253.
Limao, Nuno, Maggi, Giovanni, 2013. Uncertainty and tradeagreements. NBER Working Paper 18703.
Macdougall, Donald, Hutt, Rosemary, 1954. Imperial preference: aquantitative analysis. Economic Journal 64 (254), 233–257.
MacKay, Robert A., 1932. Imperial economics at Ottawa. PacificAffairs 5 (no. 10), 873–885.
Maddison, Angus, 2004. The world economy: historical statistics.OECD, Paris.
Madsen, Jakob B., 2001. Trade barriers and the collapse of worldtrade during the Great Depression. Southern Economic Journal 67(no. 4), 848–868.
Marcus, Edward, 1954. Canada and the international business cycle,1927–1939. Bookman Associates, New York.
McDonald, Judith A., O'Brien, Anthony Patrick, Colleen, M.,Callahan, 1997. Trade wars: Canada's reaction to the Smoot–Hawley tariff. Journal of Economic History 57 (4), 802–826.
O'Brien, Anthony Patrick, McDonald, Judith A., 2009. Retreat fromprotectionism: R.B. Bennett and the movement to freer trade inCanada, 1930–1935. Journal of Policy History 21 (no. 4), 331–365.
Pomfret, Richard, 2000. Trade policy in Canada and Australia in thetwentieth century. Australian Economic History Review 40 (2),114–126.
Potter, Pitman, 1932. The British Imperial Economic Conference.American Journal of International Law 26 (no. 4), 811–813.
Ritschl, Albrecht O., Wolf, Nikolaus, 2011. Endogeneity of currencyareas and trade blocs: evidence from a natural experiment. Kyklos64 (2), 291–312.
Rooth, Tim, 1993. British protectionism and the internationaleconomy: overseas commercial policy in the 1930s. CambridgeUniversity Press, Cambridge.
Rooth, Tim, 2010. Retreating from globalisation: the British Empire/Commonwealth Experience between the wars. University ofPortsmouth.
Safarian, A. Edward, 1970. The Canadian economy in the GreatDepression. McClelland and Stewart Limited, Toronto.
Santos Silva, J.M.C., Tenreyro, Silvana, 2006. The log of gravity.Review of Economics and Statistics 88 (no. 4), 641–658.
Snyder, Richard C., 1940. Commercial policy as reflected in treaties from1931 to 1939. American Economic Review 30 (no. 4), 787–802.
Taussig, Frank W., 1930a. The tariff, 1929–30. Quarterly Journal ofEconomics 44 (no. 2), 175–204.
Taussig, Frank W., 1930b. The Tariff Act of 1930. Quarterly Journalof Economics 45 (no. 1), 1–21.
The Imperial Economic Conference with particular reference to theUnited-Kingdom–Canada agreement. International Affairs 13 (no.2), 245–252.
Toynbee, Arnold J., 1935. Survey of international affairs 1934.Humphrey Milford, London.