deformation style and history of the eketahuna region, hikurangi forearc, new zealand, from shallow...
TRANSCRIPT
This article was downloaded by: [York University Libraries]On: 15 November 2014, At: 16:11Publisher: Taylor & FrancisInforma Ltd Registered in England and Wales Registered Number: 1072954 Registered office: MortimerHouse, 37-41 Mortimer Street, London W1T 3JH, UK
New Zealand Journal of Geology and GeophysicsPublication details, including instructions for authors and subscription information:http://www.tandfonline.com/loi/tnzg20
Deformation style and history of the Eketahunaregion, Hikurangi forearc, New Zealand, from shallowseismic reflection dataGeoffroy Lamarche a b , Sarah Beanland a c & Jonathan Ravens aa Institute of Geological & Nuclear Sciences , P.O. Box 1320, Wellington, New Zealandb Laboratoire de Geodynamique , ORSTOM , BP 48, Villefranche sur Mer, 06230, Francec Institute of Geological & Nuclear Sciences , P.O. Box 30 368, Lower Hutt, New ZealandPublished online: 23 Mar 2010.
To cite this article: Geoffroy Lamarche , Sarah Beanland & Jonathan Ravens (1995) Deformation style and history of theEketahuna region, Hikurangi forearc, New Zealand, from shallow seismic reflection data, New Zealand Journal of Geologyand Geophysics, 38:1, 105-115, DOI: 10.1080/00288306.1995.9514642
To link to this article: http://dx.doi.org/10.1080/00288306.1995.9514642
PLEASE SCROLL DOWN FOR ARTICLE
Taylor & Francis makes every effort to ensure the accuracy of all the information (the “Content”) containedin the publications on our platform. However, Taylor & Francis, our agents, and our licensors make norepresentations or warranties whatsoever as to the accuracy, completeness, or suitability for any purpose ofthe Content. Any opinions and views expressed in this publication are the opinions and views of the authors,and are not the views of or endorsed by Taylor & Francis. The accuracy of the Content should not be reliedupon and should be independently verified with primary sources of information. Taylor and Francis shallnot be liable for any losses, actions, claims, proceedings, demands, costs, expenses, damages, and otherliabilities whatsoever or howsoever caused arising directly or indirectly in connection with, in relation to orarising out of the use of the Content.
This article may be used for research, teaching, and private study purposes. Any substantial or systematicreproduction, redistribution, reselling, loan, sub-licensing, systematic supply, or distribution in anyform to anyone is expressly forbidden. Terms & Conditions of access and use can be found at http://www.tandfonline.com/page/terms-and-conditions
New Zealand Journal of Geology and Geophysics, 1995, Vol. 38: 105-1150028-8306/95/3801-0105 $2.50/0 © The Royal Society of New Zealand 1995
105
Deformation style and history of the Eketahuna region, Hikurangi forearc,New Zealand, from shallow seismic reflection data
GEOFFROY LAMARCHE*SARAH BEANLAND†
JONATHAN RAVENS
Institute of Geological & Nuclear SciencesP.O. Box 1320Wellington, New Zealand
* Present address: ORSTOM, Laboratoire de Geodynamique,BP 48, 06230 Villefranche sur Mer, France.
†Postal address: Institute of Geological & Nuclear Sciences,P.O. Box 30 368, Lower Hutt, New Zealand.
Abstract A shallow seismic reflection survey across theEketahuna region, located at the inboard edge of theobliquely convergent Hikurangi subduction margin, NewZealand, records deformation of a Miocene-Pliocene forearcbasin sequence and underlying greywacke basement. Asuite of northeast-trending strike-slip and reverse faultsdeforms the region into northwest-tilted blocks. Southeast-verging folding associated with the faults includes openhanging-wall anticlines and footwall synclines, and faultpropagation folds above non-emergent fault tips. Secondaryfaults commonly disrupt synclinal cores. Faults emergefrom the greywacke basement at near-vertical (strike-slipfaults) or 35-70° (reverse faults) dips. Faults in theL'ketahuna and adjacent Dannevirke and Wairarapa Basinsare shown from seismic reflection data to have been active,at least in part, contemporaneously with submarinedeposition of Miocene-Pliocene sediments in the forearcbasin. In the southern part of the basin, widespreadPleistocene uplift and erosion of greywacke basement causedan influx of coarse detritus into the basin. Still later,emergence of the forearc region occurred. Whereas uplift ofthe forearc is considered to be due to large scale processes(such as underplating, subduction of thick, buoyant oceaniccrust, or an influx of sediments to the Hikurangi trough),widespread and closely spaced disruption of the forearcbasin may be due to encroachment of the Hikurangi marginon the continental crust of the Chatham Rise causingincreased coupling across the subduction interface.
Keywords forearc basin; active faulting, seismicreflection; Hikurangi margin; oblique subduction
INTRODUCTION
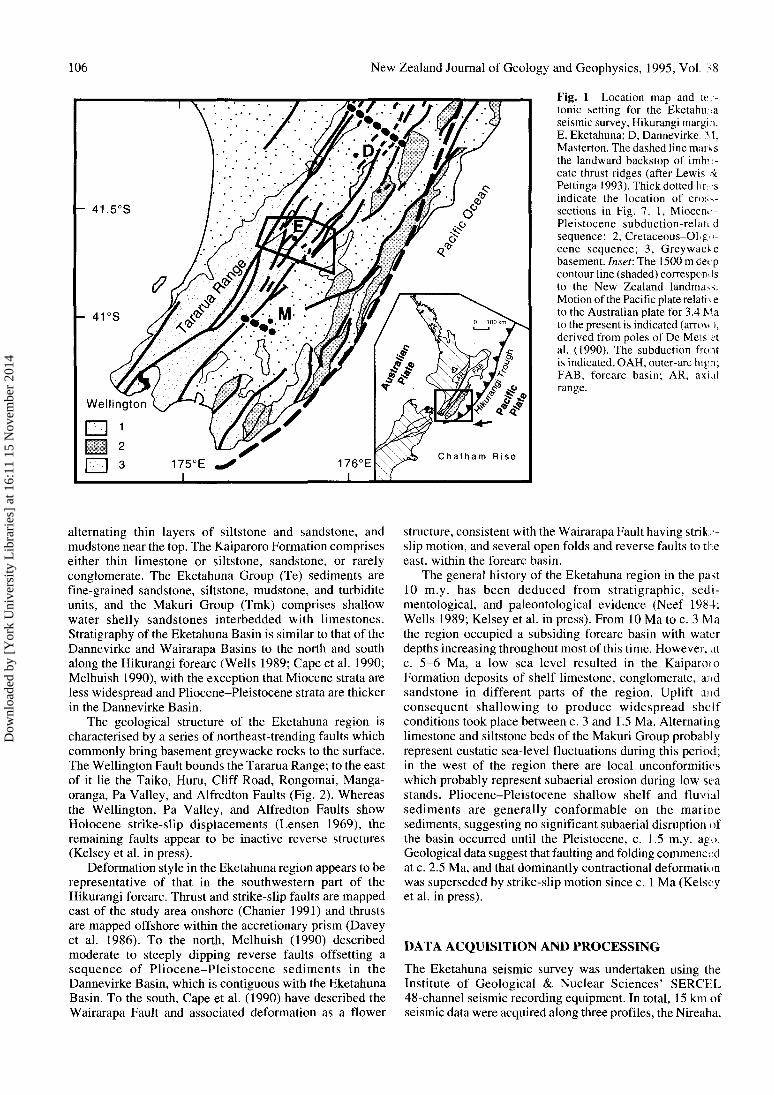
The Hikurangi subduction margin accommodates obliqueconvergence between the Pacific and Australian plates (Fig.1). In overall architecture, the southeastern part of the margin
G94015Received 28 April 1994; accepted 25 October 1994
resembles accretionary subduction margins elsewhere inthe world (Dickinson & Seely 1979), comprising upliftedaxial ranges, a strike-slip fault zone, a forearc basin, anouter arc high and trench-slope deposits (Cole & Lewis1981; van der Lingen 1982; Davey et al. 1986; Lewis &Pettinga 1993). In contrast to more typical subductionmargins (Dickinson & Seely 1979; Byrne et al. 1989), thesoutheastern part of the Hikurangi margin involves basementrocks that extend trenchward of the outer arc high (Lewis &Pettinga 1993). Furthermore, the forearc basin has beenuplifted above sea level and extensively deformed. Subaerialexposure of the Hikurangi margin makes it an excellentlocation in which to elucidate a complex history of forearcsedimentation and deformation and thus to provide insightinto the structural roles of the forearc basin in accommo-dating plate convergence at subduction margins in general.
Shallow seismic reflection data were acquired acrossthe Eketahuna region, within the Hikurangi forearc, insoutheast North Island (Fig. 1), by the Institute of Geological& Nuclear Sciences (formally DSIR Geology andGeophysics). The objective of the seismic reflection surveywas to investigate the subsurface nature of a series of faultswhich bring Mesozoic basement greywacke to the surfaceand tilt and fold a sequence of Miocene-Pleistocene coversediments. We sought information concerning faultgeometries and displacements, relationships between faultingand folding, and involvement of greywacke basement in thedeformation. The seismic reflection survey was carried outcontemporaneously with structural mapping in the samearea, the results of which are presented by Kelsey et al. (inpress) and form the basis for the geological correlationspresented in this paper.
GEOLOGICAL SETTING
The Eketahuna region contains a sequence of mainly marineMiocene-Pliocene sediments, representing deposition in aforearc basin (Neef 1984), which is up to 3 km thick andoverlies an unconformity on Mesozoic basement greywacke.The region is bounded to the west by the Tararua Range,representing basement greywacke rocks of the axial ranges,and to the east by hills of highly deformed Jurassic-Cretaceous greywacke and Cretaceous-Cenozoic marinesediments, which represent a pre-subduction passive marginsequence and complex basins and outer arc highs associatedwith subduction (Fig. 1) (Rait et al. 1991).
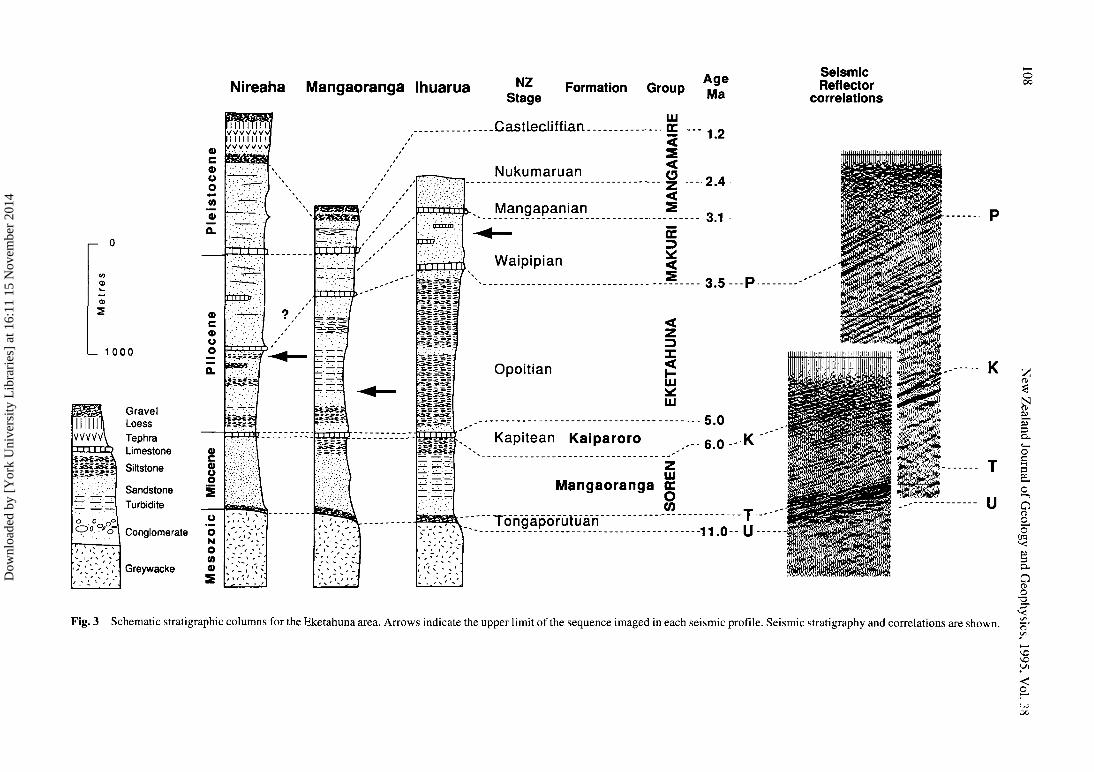
The stratigraphy of the Eketahuna region was establishedby Neef (1984) and elaborated on by Kelsey et al. (in press).Above the unconformity on basement are the mid-upperMiocene Soren Group, and the Pliocene Eketahuna andMakuri Groups (Fig. 2, 3). The Soren Group is subdividedinto the Mangaoranga and Kaiparoro Formations. TheMangaoranga Formation consists of basal conglomerate(Tsg) and overlying sediments (Tss) comprising sandstone,
Dow
nloa
ded
by [
Yor
k U
nive
rsity
Lib
rari
es]
at 1
6:11
15
Nov
embe
r 20
14
106 New Zealand Journal of Geology and Geophysics, 1995, Vol !
- 41.5°S
<7- 41°S
C h a t h a m R i s e
Fig. 1 Location map and te -tonic setting for the Eketahunaseismic survey, Hikurangi margi i.E, Eketahuna; D, Dannevirke M,Masterton. The dashed line marksthe landward backstop of imb:<-cate thrust ridges (after Lewis 4Pettinga 1993). Thick dotted lir, -sindicate the location of croi.N-sections in Fig. 7. 1, Miocem-Pleistocene subduction-relau dsequence; 2, Cretaceous-Ol<g•••-cene sequence; 3, Greywackebasement. Inset: The 1500 m deepcontour line (shaded) correspondsto the New Zealand landma^s.Motion of the Pacific plate relativeto the Australian plate for 3.4 Mato the present is indicated (arrow ),derived from poles of De Mets etal. (1990). The subduction frontis indicated. OAH, outer-arc high;FAB, forearc basin; AR, axi.ilrange.
alternating thin layers of siltstone and sandstone, andmudstone near the top. The Kaiparoro Formation compriseseither thin limestone or siltstone, sandstone, or rarelyconglomerate. The Eketahuna Group (Te) sediments arefine-grained sandstone, siltstone, mudstone, and turbiditeunits, and the Makuri Group (Tmk) comprises shallowwater shelly sandstones interbedded with limestones.Stratigraphy of the Eketahuna Basin is similar to that of theDannevirke and Wairarapa Basins to the north and southalong the Hikurangi forearc (Wells 1989; Cape et al. 1990;Melhuish 1990), with the exception that Miocene strata areless widespread and Pliocene-Pleistocene strata are thickerin the Dannevirke Basin.
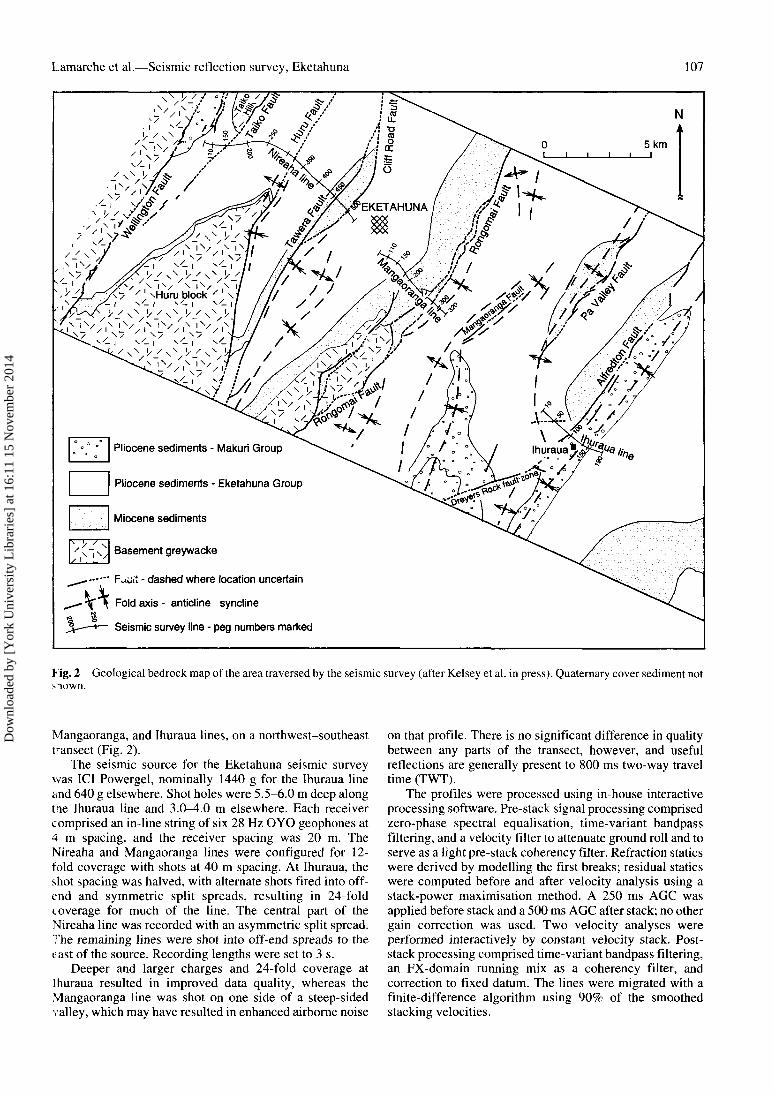
The geological structure of the Eketahuna region ischaracterised by a series of northeast-trending faults whichcommonly bring basement greywacke rocks to the surface.The Wellington Fault bounds the Tararua Range; to the eastof it lie the Taiko, Hum, Cliff Road, Rongomai, Manga-oranga, Pa Valley, and Alfredton Faults (Fig. 2). Whereasthe Wellington, Pa Valley, and Alfredton Faults showHolocene strike-slip displacements (Lensen 1969), theremaining faults appear to be inactive reverse structures(Kelsey et al. in press).
Deformation style in the Eketahuna region appears to berepresentative of that in the southwestern part of theHikurangi forearc. Thrust and strike-slip faults are mappedeast of the study area onshore (Chanier 1991) and thrustsare mapped offshore within the accretionary prism (Daveyet al. 1986). To the north, Melhuish (1990) describedmoderate to steeply dipping reverse faults offsetting asequence of Pliocene-Pleistocene sediments in theDannevirke Basin, which is contiguous with the EketahunaBasin. To the south, Cape et al. (1990) have described theWairarapa Fault and associated deformation as a flower
structure, consistent with the Wairarapa Fault having strike-slip motion, and several open folds and reverse faults to theeast, within the forearc basin.
The general history of the Eketahuna region in the past10 m.y. has been deduced from stratigraphic, sedi-mentological, and paleontological evidence (Neef 1984;Wells 1989; Kelsey et al. in press). From 10 Ma to c. 3 Mathe region occupied a subsiding forearc basin with waterdepths increasing throughout most of this time. However, atc. 5-6 Ma, a low sea level resulted in the KaiparoroFormation deposits of shelf limestone, conglomerate, andsandstone in different parts of the region. Uplift andconsequent shallowing to produce widespread shelfconditions took place between c. 3 and 1.5 Ma. Alternatinglimestone and siltstone beds of the Makuri Group probablyrepresent eustatic sea-level fluctuations during this period;in the west of the region there are local unconformitieswhich probably represent subaerial erosion during low seastands. Pliocene-Pleistocene shallow shelf and fluvialsediments are generally conformable on the marinesediments, suggesting no significant subaerial disruption ofthe basin occurred until the Pleistocene, c. 1.5 m.y. ago.Geological data suggest that faulting and folding commencrdat c. 2.5 Ma, and that dominantly contractional deformationwas superseded by strike-slip motion since c. 1 Ma (Kelseyet al. in press).
DATA ACQUISITION AND PROCESSING
The Eketahuna seismic survey was undertaken using theInstitute of Geological & Nuclear Sciences' SERCEL48-channel seismic recording equipment. In total, 15 km ofseismic data were acquired along three profiles, the Nireaha,
Dow
nloa
ded
by [
Yor
k U
nive
rsity
Lib
rari
es]
at 1
6:11
15
Nov
embe
r 20
14
Lamarche et al.—Seismic reflection survey, Eketahuna 107
N
5 km
Pliocene sediments - Makuri Group
Pliocene sediments - Eketahuna Group
Miocene sediments
Basement greywacke
F^jit - dashed where location uncertain
Fold axis - anticline syncline
Seismic survey line - peg numbers marked
Fig. 2 Geological bedrock map of the area traversed by the seismic survey (after Kelsey et al. in press). Quaternary cover sediment notsnown.
Mangaoranga, and Ihuraua lines, on a northwest-southeasttransect (Fig. 2).
The seismic source for the Eketahuna seismic surveywas ICI Powergel, nominally 1440 g for the Ihuraua lineand 640 g elsewhere. Shot holes were 5.5-6.0 m deep alongthe Ihuraua line and 3.0-4.0 m elsewhere. Each receivercomprised an in-line string of six 28 Hz OYO geophones at4 m spacing, and the receiver spacing was 20 m. TheNireaha and Mangaoranga lines were configured for 12-fold coverage with shots at 40 m spacing. At Ihuraua, theshot spacing was halved, with alternate shots fired into off-end and symmetric split spreads, resulting in 24-foldcoverage for much of the line. The central part of theNireaha line was recorded with an asymmetric split spread.The remaining lines were shot into off-end spreads to theeast of the source. Recording lengths were set to 3 s.
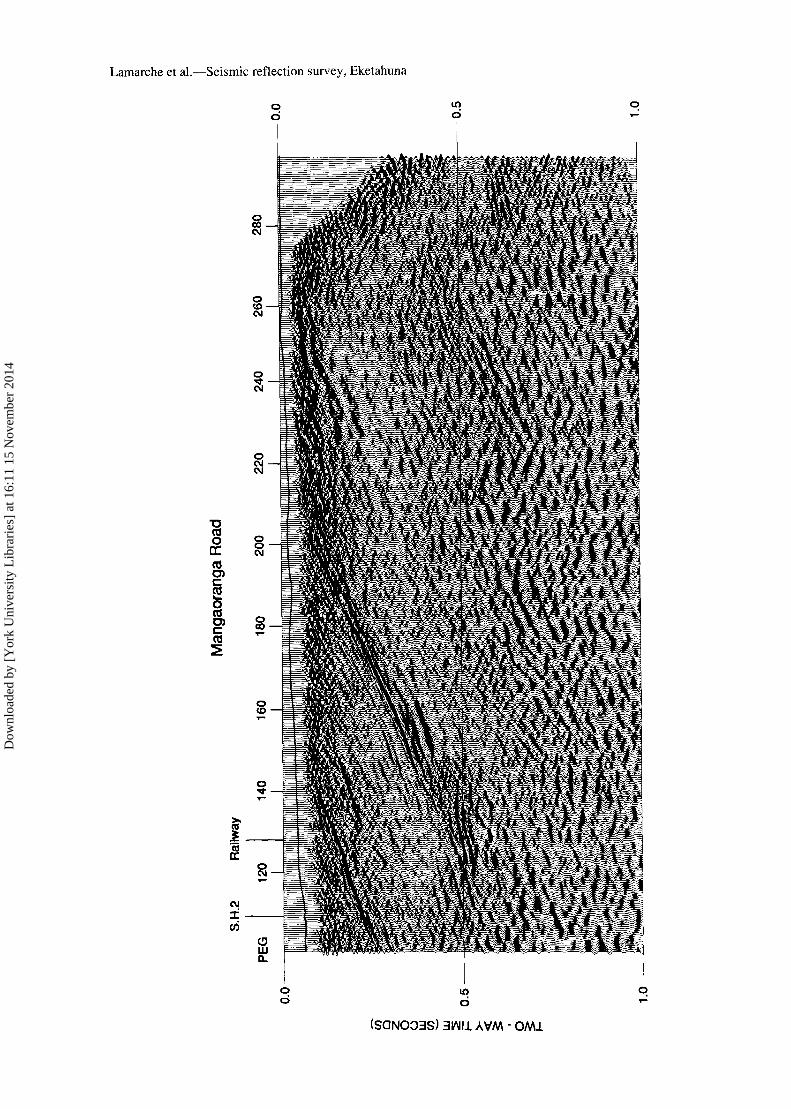
Deeper and larger charges and 24-fold coverage atIhuraua resulted in improved data quality, whereas theMangaoranga line was shot on one side of a steep-sidedvalley, which may have resulted in enhanced airborne noise
on that profile. There is no significant difference in qualitybetween any parts of the transect, however, and usefulreflections are generally present to 800 ms two-way traveltime (TWT).
The profiles were processed using in-house interactiveprocessing software. Pre-stack signal processing comprisedzero-phase spectral equalisation, time-variant bandpassfiltering, and a velocity filter to attenuate ground roll and toserve as a light pre-stack coherency filter. Refraction staticswere derived by modelling the first breaks; residual staticswere computed before and after velocity analysis using astack-power maximisation method. A 250 ms AGC wasapplied before stack and a 500 ms AGC after stack; no othergain correction was used. Two velocity analyses wereperformed interactively by constant velocity stack. Post-stack processing comprised time-variant bandpass filtering,an FX-domain running mix as a coherency filter, andcorrection to fixed datum. The lines were migrated with afinite-difference algorithm using 90% of the smoothedstacking velocities.
Dow
nloa
ded
by [
Yor
k U
nive
rsity
Lib
rari
es]
at 1
6:11
15
Nov
embe
r 20
14
i— 0
C/J
<D
in
_ 1 000
GravelLoess
VVVVV\ TephraLimestone
Siltstone
SandstoneTurbid ite
O .0 o °Conglomerate
Greywacke
Nireaha Mangaoranga Ihuarua
c
oow
a.
ac0)ooa.
c
oce
S
ooN
o(0a>S
ism
-—̂
"II I1 & b
1
r
? /''/
//
'•';' ' '}' ^
a
* * -
NZStage
Formation GroupAgema
111111
.CastLedJftian gc --
Nukumaruan
Mangapanian
I - «<<
Waipipian
2.4
3.1
3.5 P
OpoitianLU
Ui
Kapitean Kaiparoro
uiMangaoranga oc
(0To n g apo f utUan
5.0
6.0 K
T11.0 U
SeismicReflector
correlations
o
n
c
o
ooI"fs(X
9o•13
Fig. 3 Schematic stratigraphic columns for the Eketahuna area. Arrows indicate the upper limit of the sequence imaged in each seismic profile. Seismic stratigraphy and correlations are shown. =•
o
Dow
nloa
ded
by [
Yor
k U
nive
rsity
Lib
rari
es]
at 1
6:11
15
Nov
embe
r 20
14
Lamarche et al.—Seismic reflection survey, Eketahuna
(SQNO03S) 31M1 AVM - OM1
Dow
nloa
ded
by [
Yor
k U
nive
rsity
Lib
rari
es]
at 1
6:11
15
Nov
embe
r 20
14
0.0
Rongomai fault zone
Tss
^Sgs8*i i l f f * T T ' ' * ' W 2 l " l * » 5 h " > > l p ' " ' ' ' * ' ' I I W f ^ 1 ' 11 in WHHtttlB»'*'liJl' ;* l l» ^ i [ | itUiUtLitlfl Kill III li!!'!' "I ff r * » * ^ " ^
0.0
COQ
OOwwat
I0.5
1.0
0.5
1.0
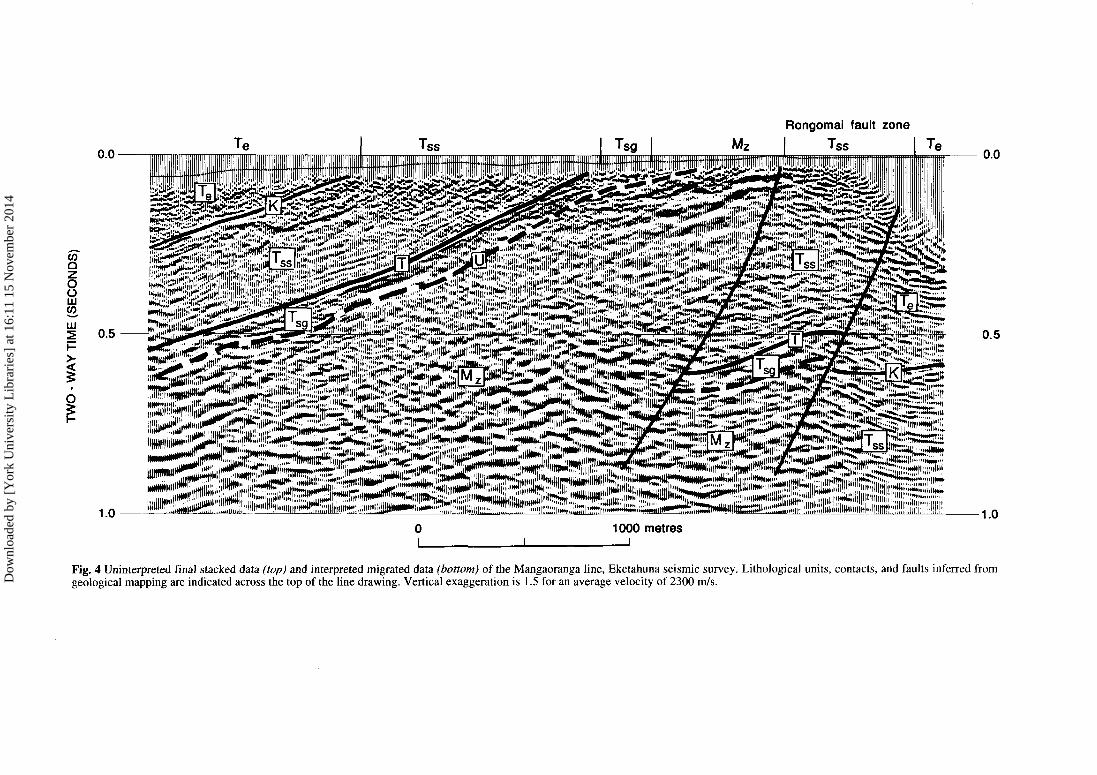
Fig. 4 Uninterpreted final stacked data (top) and interpreted migrated data (bottom) of the Mangaoranga line, Eketahuna seismic survey. Lithological units, contacts, and faults inferred fromgeological mapping are indicated across the top of the line drawing. Vertical exaggeration is 1.5 for an average velocity of 2300 m/s.D
ownl
oade
d by
[Y
ork
Uni
vers
ity L
ibra
ries
] at
16:
11 1
5 N
ovem
ber
2014
Lamarche et al.—Seismic reflection survey, Eketahuna 109
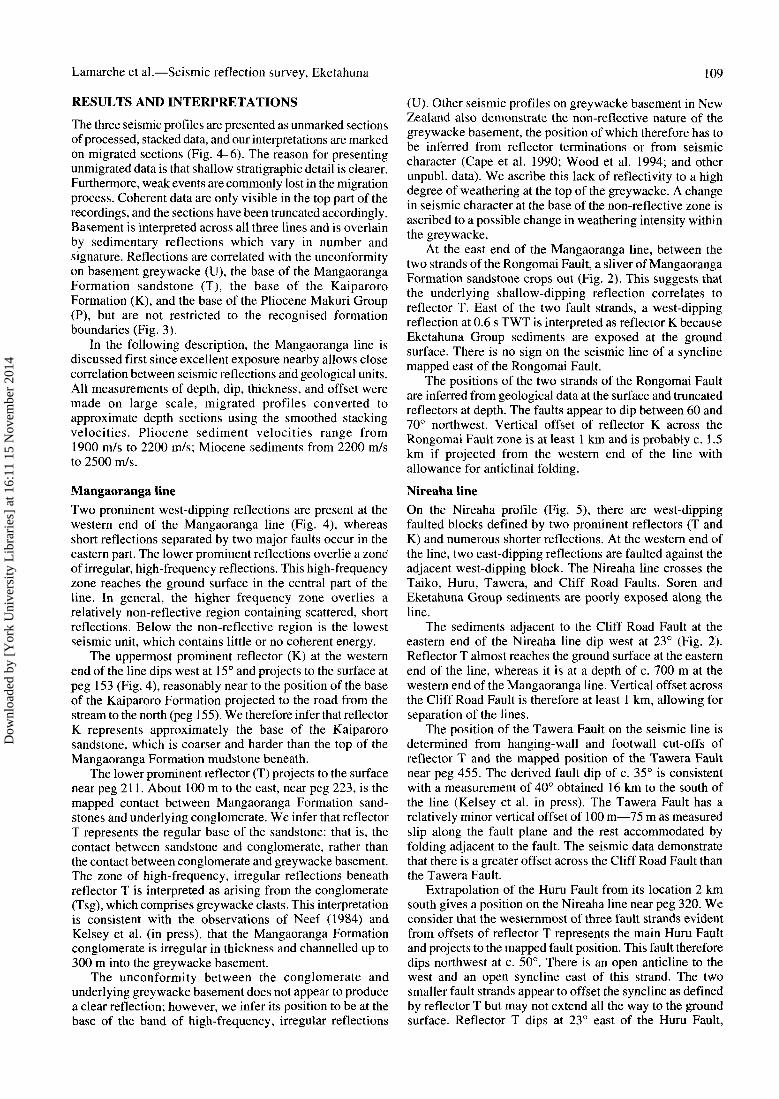
RESULTS AND INTERPRETATIONS
The three seismic profiles are presented as unmarked sectionsof processed, stacked data, and our interpretations are markedon migrated sections (Fig. 4-6). The reason for presentingunmigrated data is that shallow stratigraphic detail is clearer.Furthermore, weak events are commonly lost in the migrationprocess. Coherent data are only visible in the top part of therecordings, and the sections have been truncated accordingly.Basement is interpreted across all three lines and is overlainby sedimentary reflections which vary in number andsignature. Reflections are correlated with the unconformityon basement greywacke (U), the base of the MangaorangaFormation sandstone (T), the base of the KaiparoroFormation (K), and the base of the Pliocene Makuri Group(P), but are not restricted to the recognised formationboundaries (Fig. 3).
In the following description, the Mangaoranga line isdiscussed first since excellent exposure nearby allows closecorrelation between seismic reflections and geological units.All measurements of depth, dip, thickness, and offset weremade on large scale, migrated profiles converted toapproximate depth sections using the smoothed stackingvelocities. Pliocene sediment velocities range from1900 m/s to 2200 m/s; Miocene sediments from 2200 m/sto 2500 m/s.
Mangaoranga lineTwo prominent west-dipping reflections are present at thewestern end of the Mangaoranga line (Fig. 4), whereasshort reflections separated by two major faults occur in theeastern part. The lower prominent reflections overlie a zoneof irregular, high-frequency reflections. This high-frequencyzone reaches the ground surface in the central part of theline. In general, the higher frequency zone overlies arelatively non-reflective region containing scattered, shortreflections. Below the non-reflective region is the lowestseismic unit, which contains little or no coherent energy.
The uppermost prominent reflector (K) at the westernend of the line dips west at 15° and projects to the surface atpeg 153 (Fig. 4), reasonably near to the position of the baseof the Kaiparoro Formation projected to the road from thestream to the north (peg 155). We therefore infer that reflectorK represents approximately the base of the Kaiparorosandstone, which is coarser and harder than the top of theMangaoranga Formation mudstone beneath.
The lower prominent reflector (T) projects to the surfacenear peg 211. About 100 m to the east, near peg 223, is themapped contact between Mangaoranga Formation sand-stones and underlying conglomerate. We infer that reflectorT represents the regular base of the sandstone: that is, thecontact between sandstone and conglomerate, rather thanthe contact between conglomerate and greywacke basement.The zone of high-frequency, irregular reflections beneathreflector T is interpreted as arising from the conglomerate(Tsg), which comprises greywacke clasts. This interpretationis consistent with the observations of Neef (1984) andKelsey et al. (in press), that the Mangaoranga Formationconglomerate is irregular in thickness and channelled up to300 m into the greywacke basement.
The unconformity between the conglomerate andunderlying greywacke basement does not appear to producea clear reflection; however, we infer its position to be at thebase of the band of high-frequency, irregular reflections
(U). Other seismic profiles on greywacke basement in NewZealand also demonstrate the non-reflective nature of thegreywacke basement, the position of which therefore has tobe inferred from reflector terminations or from seismiccharacter (Cape et al. 1990; Wood et al. 1994; and otherunpubl. data). We ascribe this lack of reflectivity to a highdegree of weathering at the top of the greywacke. A changein seismic character at the base of the non-reflective zone isascribed to a possible change in weathering intensity withinthe greywacke.
At the east end of the Mangaoranga line, between thetwo strands of the Rongomai Fault, a sliver of MangaorangaFormation sandstone crops out (Fig. 2). This suggests thatthe underlying shallow-dipping reflection correlates toreflector T. East of the two fault strands, a west-dippingreflection at 0.6 s TWT is interpreted as reflector K becauseEketahuna Group sediments are exposed at the groundsurface. There is no sign on the seismic line of a synclinemapped east of the Rongomai Fault.
The positions of the two strands of the Rongomai Faultare inferred from geological data at the surface and truncatedreflectors at depth. The faults appear to dip between 60 and70° northwest. Vertical offset of reflector K across theRongomai Fault zone is at least 1 km and is probably c. 1.5km if projected from the western end of the line withallowance for anticlinal folding.
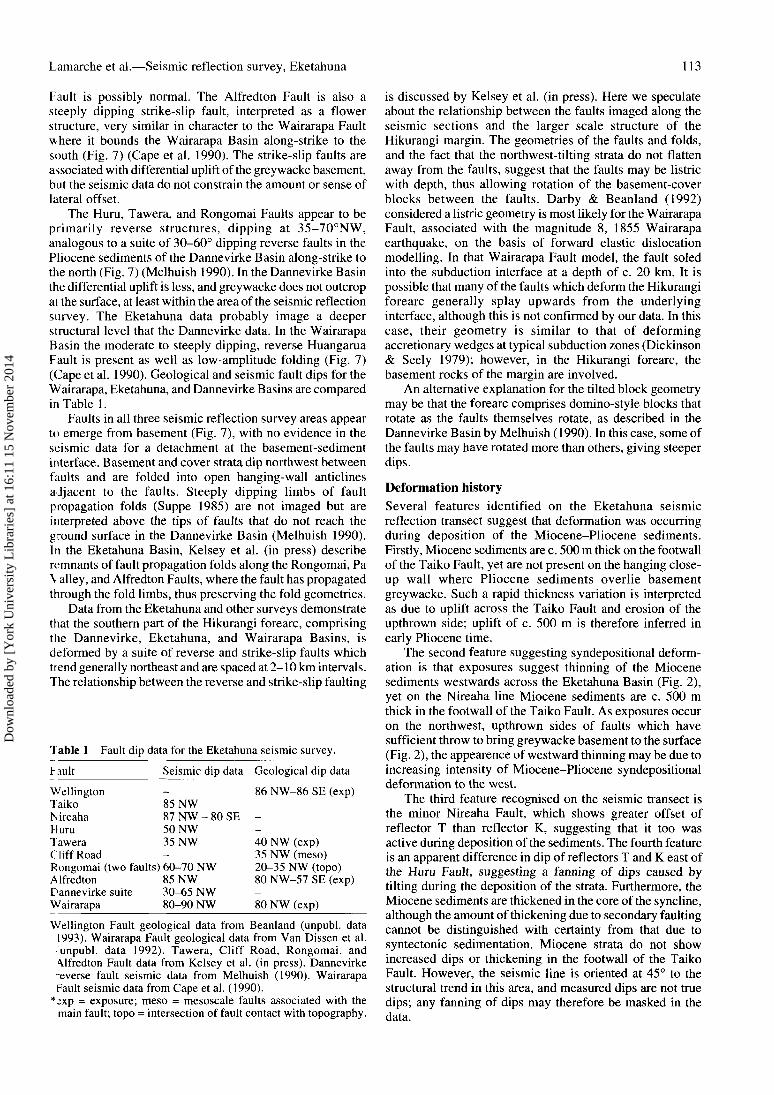
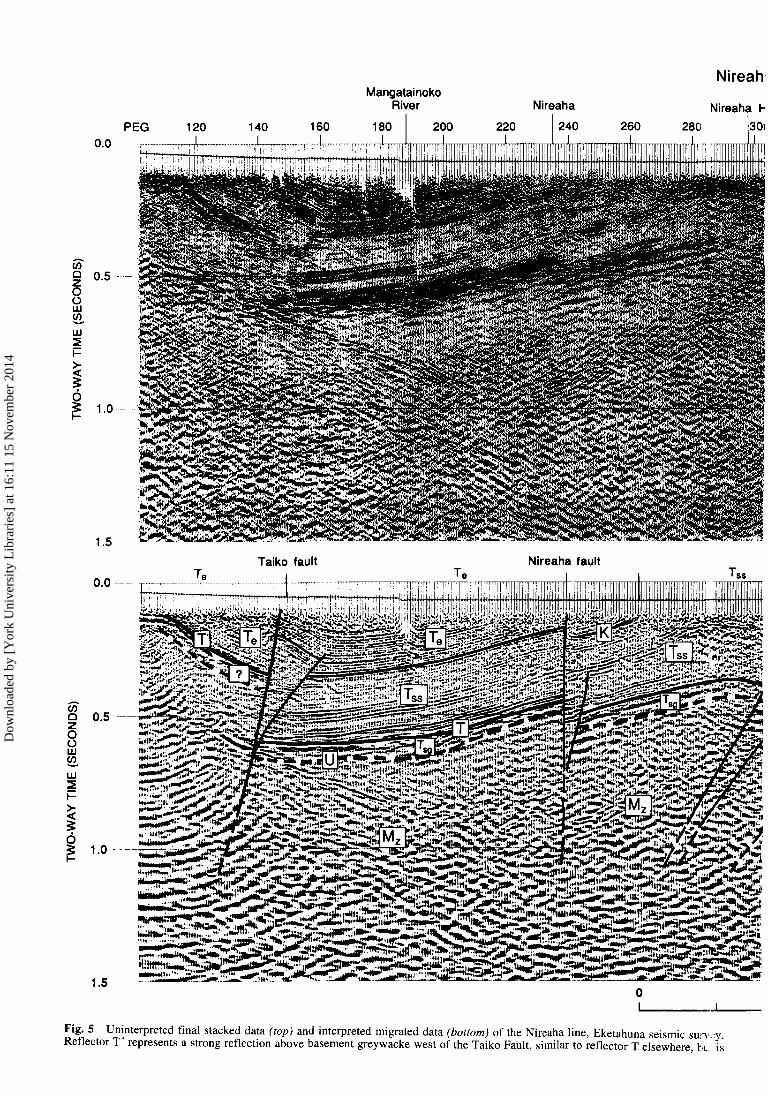
Nireaha lineOn the Nireaha profile (Fig. 5), there are west-dippingfaulted blocks defined by two prominent reflectors (T andK) and numerous shorter reflections. At the western end ofthe line, two east-dipping reflections are faulted against theadjacent west-dipping block. The Nireaha line crosses theTaiko, Huru, Tawera, and Cliff Road Faults. Soren andEketahuna Group sediments are poorly exposed along theline.
The sediments adjacent to the Cliff Road Fault at theeastern end of the Nireaha line dip west at 23° (Fig. 2).Reflector T almost reaches the ground surface at the easternend of the line, whereas it is at a depth of c. 700 m at thewestern end of the Mangaoranga line. Vertical offset acrossthe Cliff Road Fault is therefore at least 1 km, allowing forseparation of the lines.
The position of the Tawera Fault on the seismic line isdetermined from hanging-wall and footwall cut-offs ofreflector T and the mapped position of the Tawera Faultnear peg 455. The derived fault dip of c. 35° is consistentwith a measurement of 40° obtained 16 km to the south ofthe line (Kelsey et al. in press). The Tawera Fault has arelatively minor vertical offset of 100 m—75 m as measuredslip along the fault plane and the rest accommodated byfolding adjacent to the fault. The seismic data demonstratethat there is a greater offset across the Cliff Road Fault thanthe Tawera Fault.
Extrapolation of the Huru Fault from its location 2 kmsouth gives a position on the Nireaha line near peg 320. Weconsider that the westernmost of three fault strands evidentfrom offsets of reflector T represents the main Huru Faultand projects to the mapped fault position. This fault thereforedips northwest at c. 50°. There is an open anticline to thewest and an open syncline east of this strand. The twosmaller fault strands appear to offset the syncline as definedby reflector T but may not extend all the way to the groundsurface. Reflector T dips at 23° east of the Huru Fault,
Dow
nloa
ded
by [
Yor
k U
nive
rsity
Lib
rari
es]
at 1
6:11
15
Nov
embe
r 20
14
110 New Zealand Journal of Geology and Geophysics, 1995, Vol. 38
PEG 40 60 80
IhurauaBartons Line
100S.H.52
180
COQ
UJCO.
UJ
F>
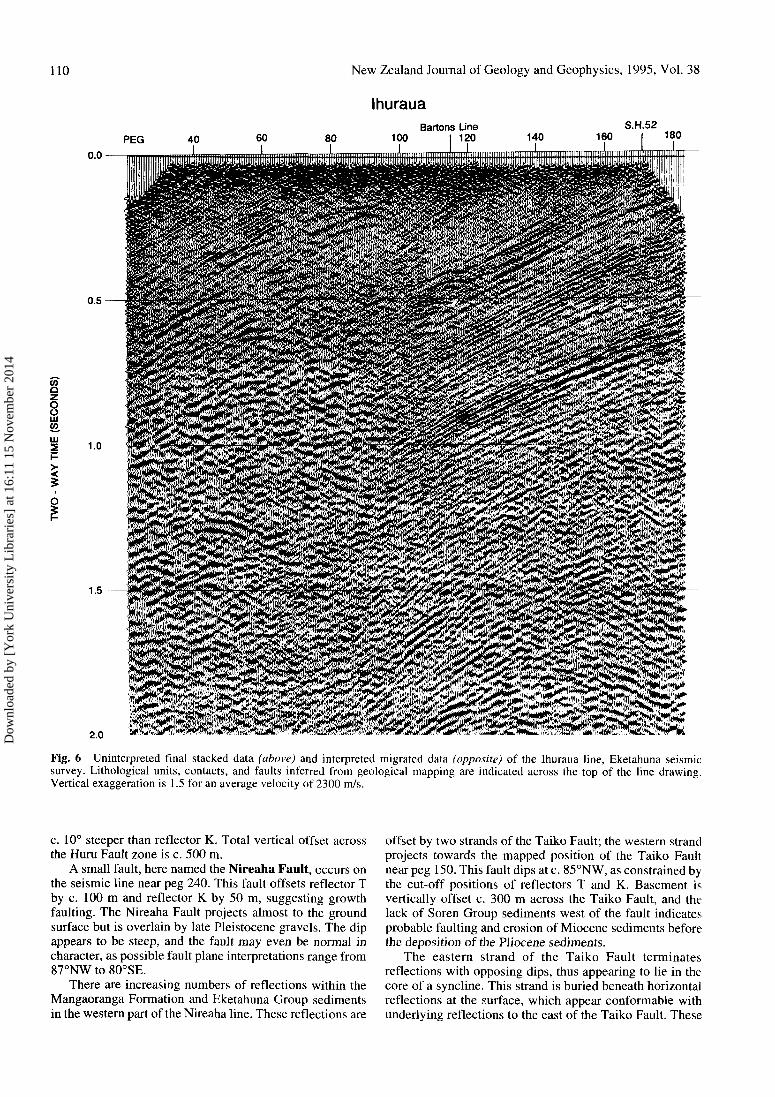
Fig. 6 Uninterpreted final stacked data (above) and interpreted migrated data (opposite) of the Ihuraua line, Eketahuna seismicsurvey. Lithological units, contacts, and faults inferred from geological mapping are indicated across the top of the line drawing.Vertical exaggeration is 1.5 for an average velocity of 2300 m/s.
c. 10° steeper than reflector K. Total vertical offset acrossthe Huru Fault zone is c. 500 m.
A small fault, here named the Nireaha Fault, occurs onthe seismic line near peg 240. This fault offsets reflector Tby c. 100 m and reflector K by 50 m, suggesting growthfaulting. The Nireaha Fault projects almost to the groundsurface but is overlain by late Pleistocene gravels. The dipappears to be steep, and the fault may even be normal incharacter, as possible fault plane interpretations range from87°NW to 80°SE.
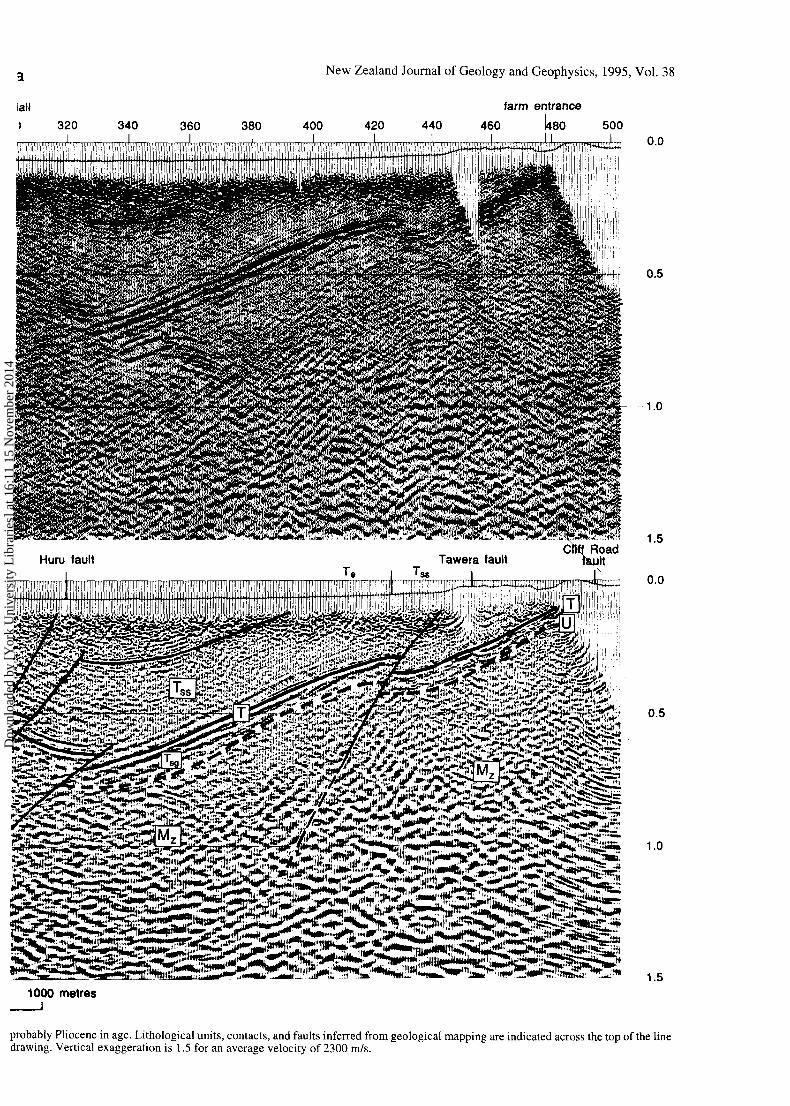
There are increasing numbers of reflections within theMangaoranga Formation and Eketahuna Group sedimentsin the western part of the Nireaha line. These reflections are
offset by two strands of the Taiko Fault; the western strandprojects towards the mapped position of the Taiko Faultnear peg 150. This fault dips at c. 85°NW, as constrained bythe cut-off positions of reflectors T and K. Basement isvertically offset c. 300 m across the Taiko Fault, and thelack of Soren Group sediments west of the fault indicates,probable faulting and erosion of Miocene sediments beforethe deposition of the Pliocene sediments.
The eastern strand of the Taiko Fault terminatesreflections with opposing dips, thus appearing to lie in thecore of a syncline. This strand is buried beneath horizontalreflections at the surface, which appear conformable withunderlying reflections to the east of the Taiko Fault. These
Dow
nloa
ded
by [
Yor
k U
nive
rsity
Lib
rari
es]
at 1
6:11
15
Nov
embe
r 20
14
Lamarche et al.—Seismic reflection survey, Eketahuna
Alfredton fault
111
Tmk
^ ^ ^ ^ S ^ S ^
2 0
1000 metres•
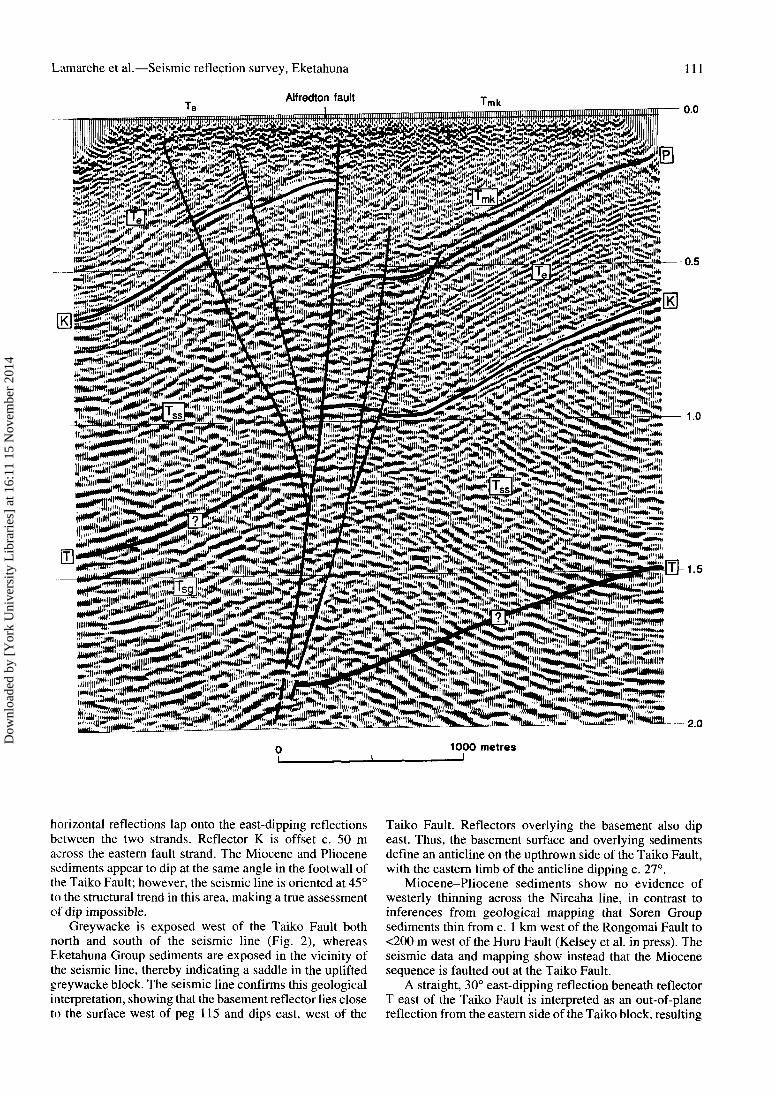
horizontal reflections lap onto the east-dipping reflectionsbetween the two strands. Reflector K is offset c. 50 macross the eastern fault strand. The Miocene and Pliocenesediments appear to dip at the same angle in the footwall ofthe Taiko Fault; however, the seismic line is oriented at 45°to the structural trend in this area, making a true assessmentof dip impossible.
Greywacke is exposed west of the Taiko Fault bothnorth and south of the seismic line (Fig. 2), whereasEketahuna Group sediments are exposed in the vicinity ofthe seismic line, thereby indicating a saddle in the upliftedgreywacke block. The seismic line confirms this geologicalinterpretation, showing that the basement reflector lies closeto the surface west of peg 115 and dips east, west of the
Taiko Fault. Reflectors overlying the basement also dipeast. Thus, the basement surface and overlying sedimentsdefine an anticline on the upthrown side of the Taiko Fault,with the eastern limb of the anticline dipping c. 27°.
Miocene-Pliocene sediments show no evidence ofwesterly thinning across the Nireaha line, in contrast toinferences from geological mapping that Soren Groupsediments thin from c. 1 km west of the Rongomai Fault to<200 m west of the Hum Fault (Kelsey et al. in press). Theseismic data and mapping show instead that the Miocenesequence is faulted out at the Taiko Fault.
A straight, 30° east-dipping reflection beneath reflectorT east of the Taiko Fault is interpreted as an out-of-planereflection from the eastern side of the Taiko block, resulting
Dow
nloa
ded
by [
Yor
k U
nive
rsity
Lib
rari
es]
at 1
6:11
15
Nov
embe
r 20
14
112 New Zealand Journal of Geology and Geophysics, 1995, Vol. 38
-~- \ II Axial Range „ \ ^
Wellington F.
NW SE
Nireaha Line Mangaoranga Line Ihuraua Line
0 km1 i i i i
No vertical exagerationWairarapa F Chester Masterton F.
® 0 Anticline
Huangarua F.GladstoneAnticline
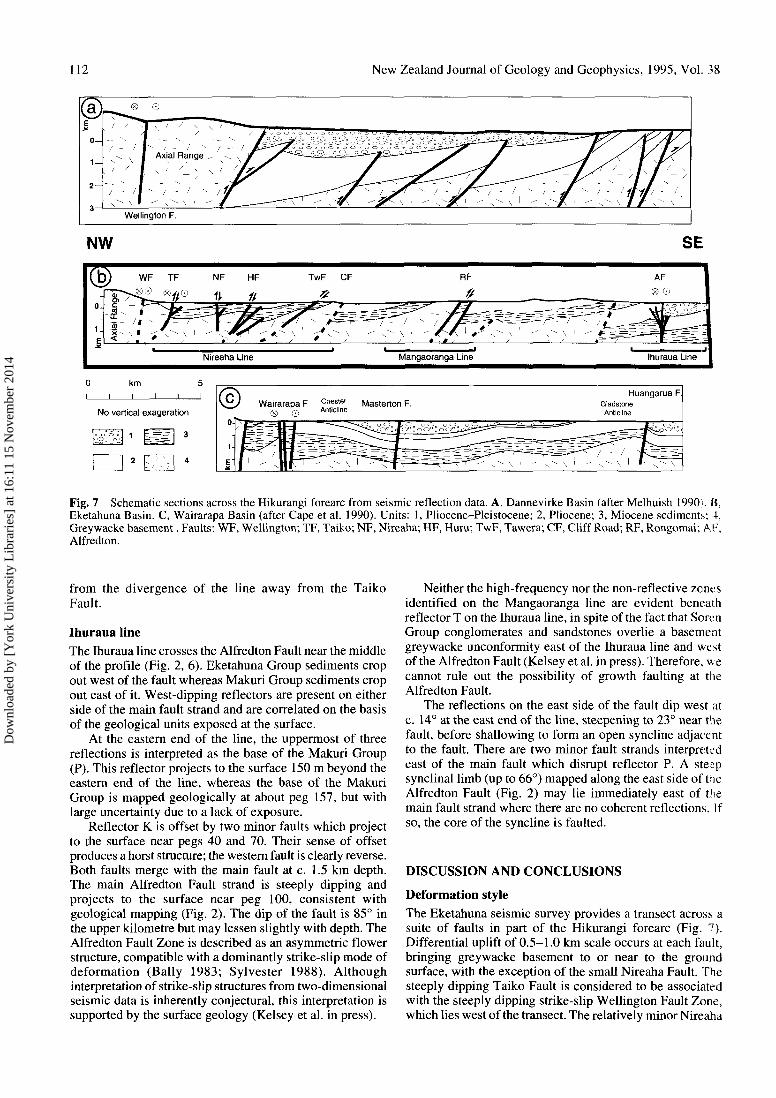
Fig. 7 Schematic sections across the Hikurangi forearc from seismic reflection data. A, Dannevirke Basin (after Melhuish 1990). B,Eketahuna Basin. C, Wairarapa Basin (after Cape et al. 1990). Units: 1, Pliocene-Pleistocene; 2, Pliocene; 3, Miocene sediments; 4,Greywacke basement. Faults: WF, Wellington; TF, Taiko; NF, Nireaha; HF, Huru; TwF, Tawera; CF, Cliff Road; RF, Rongomai; AF,Alfredton.
from the divergence of the line away from the TaikoFault.
Ihuraua lineThe Ihuraua line crosses the Alfredton Fault near the middleof the profile (Fig. 2, 6). Eketahuna Group sediments cropout west of the fault whereas Makuri Group sediments cropout east of it. West-dipping reflectors are present on eitherside of the main fault strand and are correlated on the basisof the geological units exposed at the surface.
At the eastern end of the line, the uppermost of threereflections is interpreted as the base of the Makuri Group(P). This reflector projects to the surface 150 m beyond theeastern end of the line, whereas the base of the MakuriGroup is mapped geologically at about peg 157, but withlarge uncertainty due to a lack of exposure.
Reflector K is offset by two minor faults which projectto the surface near pegs 40 and 70. Their sense of offsetproduces a horst structure; the western fault is clearly reverse.Both faults merge with the main fault at c. 1.5 km depth.The main Alfredton Fault strand is steeply dipping andprojects to the surface near peg 100, consistent withgeological mapping (Fig. 2). The dip of the fault is 85° inthe upper kilometre but may lessen slightly with depth. TheAlfredton Fault Zone is described as an asymmetric flowerstructure, compatible with a dominantly strike-slip mode ofdeformation (Bally 1983; Sylvester 1988). Althoughinterpretation of strike-slip structures from two-dimensionalseismic data is inherently conjectural, this interpretation issupported by the surface geology (Kelsey et al. in press).
Neither the high-frequency nor the non-reflective zonesidentified on the Mangaoranga line are evident beneathreflector T on the Ihuraua line, in spite of the fact that SorenGroup conglomerates and sandstones overlie a basementgreywacke unconformity east of the Ihuraua line and westof the Alfredton Fault (Kelsey et al. in press). Therefore, wecannot rule out the possibility of growth faulting at theAlfredton Fault.
The reflections on the east side of the fault dip west atc. 14° at the east end of the line, steepening to 23° near ttiefault, before shallowing to form an open syncline adjacentto the fault. There are two minor fault strands interpretedeast of the main fault which disrupt reflector P. A steepsynclinal limb (up to 66°) mapped along the east side of theAlfredton Fault (Fig. 2) may lie immediately east of themain fault strand where there are no coherent reflections. Ifso, the core of the syncline is faulted.
DISCUSSION AND CONCLUSIONS
Deformation styleThe Eketahuna seismic survey provides a transect across asuite of faults in part of the Hikurangi forearc (Fig. 7).Differential uplift of 0.5-1.0 km scale occurs at each fault,bringing greywacke basement to or near to the groundsurface, with the exception of the small Nireaha Fault. Thesteeply dipping Taiko Fault is considered to be associatedwith the steeply dipping strike-slip Wellington Fault Zone,which lies west of the transect. The relatively minor Nireaha
Dow
nloa
ded
by [
Yor
k U
nive
rsity
Lib
rari
es]
at 1
6:11
15
Nov
embe
r 20
14
Lamarche et al.—Seismic reflection survey, Eketahuna 113
Fault is possibly normal. The Alfredton Fault is also asteeply dipping strike-slip fault, interpreted as a flowerstructure, very similar in character to the Wairarapa Faultwhere it bounds the Wairarapa Basin along-strike to thesouth (Fig. 7) (Cape et al. 1990). The strike-slip faults areassociated with differential uplift of the greywacke basement,but the seismic data do not constrain the amount or sense oflateral offset.
The Hum, Tawera, and Rongomai Faults appear to beprimarily reverse structures, dipping at 35-70°NW,analogous to a suite of 30-60° dipping reverse faults in thePliocene sediments of the Dannevirke Basin along-strike tothe north (Fig. 7) (Melhuish 1990). In the Dannevirke Basinthe differential uplift is less, and greywacke does not outcropal the surface, at least within the area of the seismic reflectionsurvey. The Eketahuna data probably image a deeperstructural level that the Dannevirke data. In the WairarapaBasin the moderate to steeply dipping, reverse HuangaruaFault is present as well as low-amplitude folding (Fig. 7)(Cape et al. 1990). Geological and seismic fault dips for theWairarapa, Eketahuna, and Dannevirke Basins are comparedin Table 1.
Faults in all three seismic reflection survey areas appearto emerge from basement (Fig. 7), with no evidence in theseismic data for a detachment at the basement-sedimentinterface. Basement and cover strata dip northwest betweenfaults and are folded into open hanging-wall anticlinesadjacent to the faults. Steeply dipping limbs of faultpropagation folds (Suppe 1985) are not imaged but areinterpreted above the tips of faults that do not reach theground surface in the Dannevirke Basin (Melhuish 1990).In the Eketahuna Basin, Kelsey et al. (in press) describeremnants of fault propagation folds along the Rongomai, PaV alley, and Alfredton Faults, where the fault has propagatedthrough the fold limbs, thus preserving the fold geometries.
Data from the Eketahuna and other surveys demonstratethat the southern part of the Hikurangi forearc, comprisingthe Dannevirke, Eketahuna, and Wairarapa Basins, isdeformed by a suite of reverse and strike-slip faults whichtrend generally northeast and are spaced at 2-10 km intervals.The relationship between the reverse and strike-slip faulting
Table 1 Fault dip data for the Eketahuna seismic survey.
Fault
WellingtonTaikoMreahaHuruTaweraCliff Road
Seismic dip data
85 NW87 NW - 80 SE50 NW35 NW-
Rongomai (two faults) 60-70 NWAlfredtonDannevirke suiteWairarapa
85 NW30-65 NW80-90 NW
Geological dip data
86 NW-86 SE (exp)—__40 NW (exp)35 NW (meso)20-35 NW (topo)80 NW-57 SE (exp)—80 NW (exp)
Wellington Fault geological data from Beanland (unpubl. data1993). Wairarapa Fault geological data from Van Dissen et al.unpubl. data 1992). Tawera, Cliff Road, Rongomai, and\lfredton Fault data from Kelsey et al. (in press). Dannevirke-everse fault seismic data from Melhuish (1990). WairarapaFault seismic data from Cape et al. (1990).
*jxp = exposure; meso = mesoscale faults associated with themain fault; topo = intersection of fault contact with topography.
is discussed by Kelsey et al. (in press). Here we speculateabout the relationship between the faults imaged along theseismic sections and the larger scale structure of theHikurangi margin. The geometries of the faults and folds,and the fact that the northwest-tilting strata do not flattenaway from the faults, suggest that the faults may be listricwith depth, thus allowing rotation of the basement-coverblocks between the faults. Darby & Beanland (1992)considered a listric geometry is most likely for the WairarapaFault, associated with the magnitude 8, 1855 Wairarapaearthquake, on the basis of forward elastic dislocationmodelling. In that Wairarapa Fault model, the fault soledinto the subduction interface at a depth of c. 20 km. It ispossible that many of the faults which deform the Hikurangiforearc generally splay upwards from the underlyinginterface, although this is not confirmed by our data. In thiscase, their geometry is similar to that of deformingaccretionary wedges at typical subduction zones (Dickinson& Seely 1979); however, in the Hikurangi forearc, thebasement rocks of the margin are involved.
An alternative explanation for the tilted block geometrymay be that the forearc comprises domino-style blocks thatrotate as the faults themselves rotate, as described in theDannevirke Basin by Melhuish (1990). In this case, some ofthe faults may have rotated more than others, giving steeperdips.
Deformation historySeveral features identified on the Eketahuna seismicreflection transect suggest that deformation was occurringduring deposition of the Miocene-Pliocene sediments.Firstly, Miocene sediments are c. 500 m thick on the footwallof the Taiko Fault, yet are not present on the hanging close-up wall where Pliocene sediments overlie basementgreywacke. Such a rapid thickness variation is interpretedas due to uplift across the Taiko Fault and erosion of theupthrown side; uplift of c. 500 m is therefore inferred inearly Pliocene time.
The second feature suggesting syndepositional deform-ation is that exposures suggest thinning of the Miocenesediments westwards across the Eketahuna Basin (Fig. 2),yet on the Nireaha line Miocene sediments are c. 500 mthick in the footwall of the Taiko Fault. As exposures occuron the northwest, upthrown sides of faults which havesufficient throw to bring greywacke basement to the surface(Fig. 2), the appearence of westward thinning may be due toincreasing intensity of Miocene-Pliocene syndepositionaldeformation to the west.
The third feature recognised on the seismic transect isthe minor Nireaha Fault, which shows greater offset ofreflector T than reflector K, suggesting that it too wasactive during deposition of the sediments. The fourth featureis an apparent difference in dip of reflectors T and K east ofthe Huru Fault, suggesting a fanning of dips caused bytilting during the deposition of the strata. Furthermore, theMiocene sediments are thickened in the core of the syncline,although the amount of thickening due to secondary faultingcannot be distinguished with certainty from that due tosyntectonic sedimentation. Miocene strata do not showincreased dips or thickening in the footwall of the TaikoFault. However, the seismic line is oriented at 45° to thestructural trend in this area, and measured dips are not truedips; any fanning of dips may therefore be masked in thedata.
Dow
nloa
ded
by [
Yor
k U
nive
rsity
Lib
rari
es]
at 1
6:11
15
Nov
embe
r 20
14
114 New Zealand Journal of Geology and Geophysics, 1995, Vol. ?
Finally, in the west of the Eketahuna Basin, just north ofthe area of Fig. 2, is an exposure of an angular unconformityof c. 8° at the base of the Pliocene Makuri Group (see Neef1984, fig. 16). Although it is possible that an unconformitymight form in these shallow water strata due to sea-levelfluctuations, the angle of 8° suggests a tectonic cause,therefore indicating some Pliocene deformation on thenearby structure, the northern part of the Hum Fault.
Geological data show little other evidence for synde-positional faulting in the Eketahuna Basin: the strata appearconformable with no angular differences distinguishedbetween attitudes measured in Miocene and Pliocenesediments (Kelsey et al. in press). From this it is inferred byKelsey et al. (in press) that almost all faulting and foldingpostdates the youngest conformable unit mapped in thebasin, a limestone dated c. 2.4 Ma. The seismic datapresented here suggest that at least some faults, or somesegments of faults, were active during the deposition ofMiocene and Pliocene sediments.
Seismic data in both the Wairarapa and DannevirkeBasins also record deformation during the deposition ofMiocene and/or Pliocene strata. In the Wairarapa Basin,erosional unconformities are identified between Mioceneand Pliocene sediments across the Chester and Gladstoneanticlines (Fig. 7) (Cape et al. 1990). In the DannevirkeBasin, Melhuish (1990) described progressively greateroffsets of four Pliocene horizons across more than 10 faultson 13 seismic profiles. In addition, the Dannevirke datashow thickening of sediments in fault footwalls and thinningacross hanging-wall anticlines. These features demonstrateactive deformation during an interval deduced to last from3.6 to 2.3 Ma, followed by a quiescent phase between 2.3and c. 0.5 Ma (Melhuish 1990).
Whereas Kelsey et al. (in press) considered there was nosignificant deformation until c. 2.5 Ma, the seismic datasuggest progressive deformation from the late Mioceneuntil c. 2.5 Ma. At that time, at least in the DannevirkeBasin, deformation appears to have lessened. There is generalagreement (e.g., Neef 1984) that rapid uplift of greywackeranges leading to a sudden influx of coarse detritus into thethree basins, an increase in rates of faulting and folding, andemergence of the forearc above sea level, occurred duringthe past 1.5-0.5 m.y. or so.
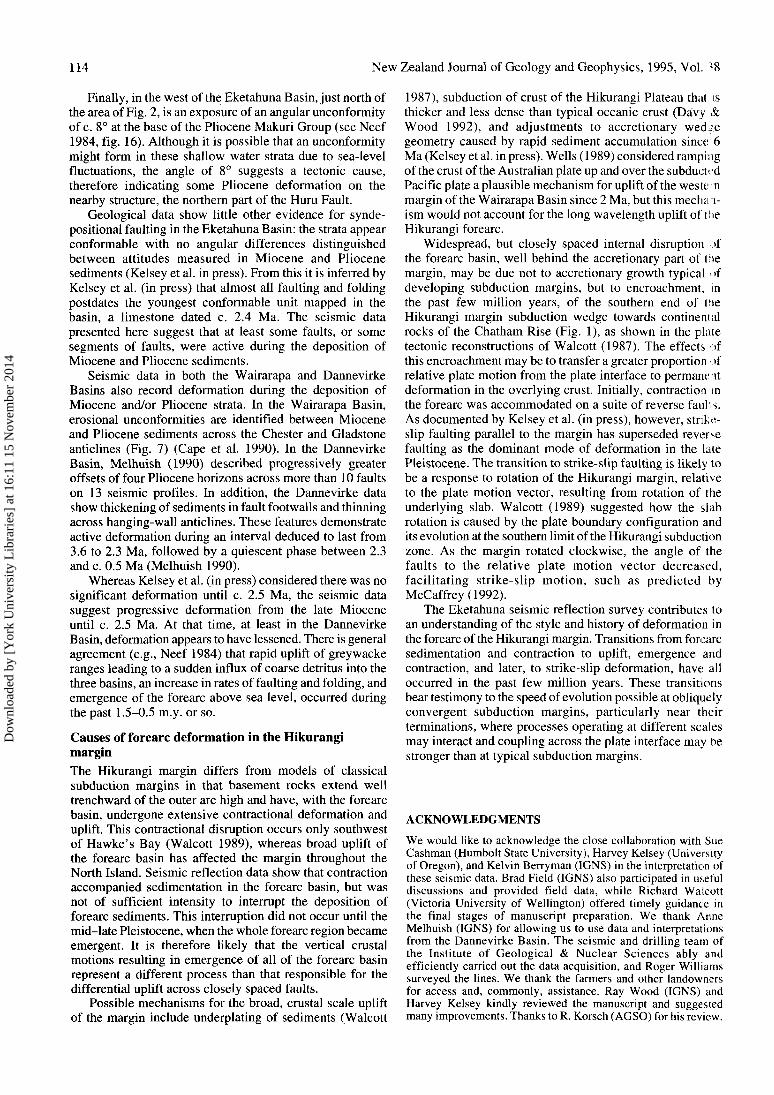
Causes of forearc deformation in the HikurangimarginThe Hikurangi margin differs from models of classicalsubduction margins in that basement rocks extend welltrenchward of the outer arc high and have, with the forearcbasin, undergone extensive contractional deformation anduplift. This contractional disruption occurs only southwestof Hawke's Bay (Walcott 1989), whereas broad uplift ofthe forearc basin has affected the margin throughout theNorth Island. Seismic reflection data show that contractionaccompanied sedimentation in the forearc basin, but wasnot of sufficient intensity to interrupt the deposition offorearc sediments. This interruption did not occur until themid-late Pleistocene, when the whole forearc region becameemergent. It is therefore likely that the vertical crustalmotions resulting in emergence of all of the forearc basinrepresent a different process than that responsible for thedifferential uplift across closely spaced faults.
Possible mechanisms for the broad, crustal scale upliftof the margin include underplating of sediments (Walcott
1987), subduction of crust of the Hikurangi Plateau that isthicker and less dense than typical oceanic crust (Davy &Wood 1992), and adjustments to accretionary weduegeometry caused by rapid sediment accumulation since: 6Ma (Kelsey et al. in press). Wells (1989) considered rampingof the crust of the Australian plate up and over the subductedPacific plate a plausible mechanism for uplift of the weste rnmargin of the Wairarapa Basin since 2 Ma, but this mechsin-ism would not account for the long wavelength uplift of theHikurangi forearc.
Widespread, but closely spaced internal disruption >fthe forearc basin, well behind the accretionary part of 1 demargin, may be due not to accretionary growth typical ofdeveloping subduction margins, but to encroachment, inthe past few million years, of the southern end of theHikurangi margin subduction wedge towards continentalrocks of the Chatham Rise (Fig. 1), as shown in the platetectonic reconstructions of Walcott (1987). The effects ofthis encroachment may be to transfer a greater proportion ofrelative plate motion from the plate interface to permane ntdeformation in the overlying crust. Initially, contraction inthe forearc was accommodated on a suite of reverse faults.As documented by Kelsey et al. (in press), however, strike-slip faulting parallel to the margin has superseded reversefaulting as the dominant mode of deformation in the latePleistocene. The transition to strike-slip faulting is likely tobe a response to rotation of the Hikurangi margin, relativeto the plate motion vector, resulting from rotation of theunderlying slab. Walcott (1989) suggested how the slabrotation is caused by the plate boundary configuration andits evolution at the southern limit of the Hikurangi subductionzone. As the margin rotated clockwise, the angle of thefaults to the relative plate motion vector decreased,facilitating strike-slip motion, such as predicted byMcCaffrey (1992).
The Eketahuna seismic reflection survey contributes toan understanding of the style and history of deformation inthe forearc of the Hikurangi margin. Transitions from forearcsedimentation and contraction to uplift, emergence andcontraction, and later, to strike-slip deformation, have alloccurred in the past few million years. These transitionsbear testimony to the speed of evolution possible at obliquelyconvergent subduction margins, particularly near theirterminations, where processes operating at different scalesmay interact and coupling across the plate interface may bestronger than at typical subduction margins.
ACKNOWLEDGMENTS
We would like to acknowledge the close collaboration with SueCashman (Humbolt State University), Harvey Kelsey (Universityof Oregon), and Kelvin Berryman (IGNS) in the interpretation ofthese seismic data. Brad Field (IGNS) also participated in usefuldiscussions and provided field data, while Richard Walcott(Victoria University of Wellington) offered timely guidance inthe final stages of manuscript preparation. We thank AnneMelhuish (IGNS) for allowing us to use data and interpretationsfrom the Dannevirke Basin. The seismic and drilling team ofthe Institute of Geological & Nuclear Sciences ably andefficiently carried out the data acquisition, and Roger Williamssurveyed the lines. We thank the farmers and other landownersfor access and, commonly, assistance. Ray Wood (IGNS) andHarvey Kelsey kindly reviewed the manuscript and suggestedmany improvements. Thanks to R. Korsch (AGSO) for his review.
Dow
nloa
ded
by [
Yor
k U
nive
rsity
Lib
rari
es]
at 1
6:11
15
Nov
embe
r 20
14
Lamarche et al.—Seismic reflection survey, Eketahuna 115
REFERENCES
Bally, A. W. 1983: Seismic expression of structural styles. Vol. 3.Studies in geology series 15. The American Associationof Petroleum Geologists, Tulsa, U.S.A.
Byrne, D. E.; Davis, D. M.; Sykes, L. R. 1989: Loci and maximumsize of thrust earthquakes and the mechanics of the shallowregion of subduction zones. Tectonics 7 (4): 833-857.
Cape, C. D.; Lamb, S. H.; Vella, P.; Wells, P. E.; Woodward, D. J.1990: Geological structure of Wairarapa Valley, NewZealand, from seismic reflection profiling. Journal of theRoyal Society of New Zealand 20: 85-105.
Chanier, F. 1991: Le prisme d'accrétion d'Hikurangi: un témoinde 1'évolution géodynamique d'une marge activepéripacifique (Nouvelle-Zélande). Thèse de doctorat,Université des Sciences et Technologies de Lille.
Cole, J. W.; Lewis, K. B. 1981: Evolution of the Taupo-Hikurangisubduction system. Tectonophysics 72: 1-21.
Darby, D. J.; Beanland, S. 1992: Possible source models for the1855 Wairarapa earthquake, New Zealand. Journal ofgeophysical research 97 (B9): 12375-12389.
Davey, F. J.; Hampton, M.; Childs, J.; Fisher, M. A.; Lewis, K.;Pettinga, J. R. 1986: Structure of a growing accretionaryprism, Hikurangi margin, New Zealand. Geology 14:663-666.
Davy, B. W.; Wood, R. 1992: The Hikurangi Plateau andsubduction effects. Geological Society of New Zealandmiscellaneous publication 63A: 58.
De Mets, C.; Gordon, R. G.; Argus, S.; Stein, S. 1990: Currentplate motions. Geophysical journal international 101:425-478.
Dickinson, W. R.; Seely, D. R. 1979: Structure and stratigraphyof forearc regions. Bulletin of the American Association ofPetroleum Geologists 63: 2-31.
Kelsey, H. M.; Cashman, S. M.; Beanland, S.; Berryman, K. R. inpress: Structural evolution along the inner part of theobliquely convergent Hikurangi margin, New Zealand.Tectonics.
Lensen, G. J. 1969: Sheet N153—Eketahuna. Late Quaternarytectonic map of New Zealand 1:63,360. Wellington, NewZealand. Department of Scientific and Industrial Research.
Lewis, K. B.; Pettinga, J. R. 1993: The emerging, imbricatefrontal wedge of the Hikurangi margin. In: Ballance, P. F.ed. South Pacific sedimentary basins. Sedimentary basinsof the world, 2. Amsterdam, Elsevier Science PublishersB.V. Pp. 225-250.
McCaffrey, R. 1992: Oblique plate convergence, slip vectors, andforearc deformation. Journal of geophysical research 97:8905-8915.
Melhuish, A. 1990: Late Cenozoic deformation along the Pacific-Australian plate margin, Dannevirke region, New Zealand.Unpublished M.Sc. thesis, lodged in the Library, VictoriaUniversity of Wellington, New Zealand.
Neef, G. 1984: Late Cenozoic and early Quaternary stratigraphyof the Eketahuna district (N153). New Zealand GeologicalSurvey bulletin 96: 101 p.
Rait, G.; Chanier, F.; Waters, D. A. 1991: Landward- and seaward-directed thrusting accompanying the onset of subductionbeneath New Zealand. Geology 19: 230-233.
Suppe, J. 1985: Principles of structural geology. Englewood Cliffs,New Jersey, Prentice-Hall Inc. 537 p.
Sylvester, A. G. 1988: Strike-slip faults. Geological Society ofAmerica bulletin 100: 1666-1703.
van der Lingen, G. J. 1982: Development of the North Islandsubduction system, New Zeland. In: Leggett, J. K. ed.Trench-forearc geology. London, The Geological Societyof London, Blackwell Scientific Publications. Pp. 259-272.
Walcott, R.I. 1987: Geodetic strain and the deformational historyof the North Island of New Zealand during the lateCainozoic. Philosophical transactions of the Royal Societyof London A321: 163-181.
Walcott, R. I. 1989: Paleomagnetically observed rotations alongthe Hikurangi margin of New Zealand. In: Kissel, C.; Laj,C. ed. Paleomagnetic rotations and continentaldeformations. Series C. mathematical and physicalsciences 254. Dordrech, Kluwer. Pp. 459-471.
Wells, P. 1989: Burial history of late Neogene sedimentary basinson part of the New Zealand convergent plate margin.Basin research 2: 145-160.
Wood, R. A.; Pettinga, J. R.; Bannister, S. C.; Lamarche, G.;Morran, J. M. 1994: Tectonic setting and structuralevolution of Hanmer strike-slip basin New Zealand.Geological Society of America bulletin 106: 1459-1473.
Dow
nloa
ded
by [
Yor
k U
nive
rsity
Lib
rari
es]
at 1
6:11
15
Nov
embe
r 20
14
MangatainokoRiver Nireaha
PEG 120
Nireah
Nireaha H
30i
0.0
wQ 0.5OOLJJ
LU
I -
I§ , o
1.5
0.0
Taiko fault Nireaha fault
| 0.5O
oLU
LU
1 1.0
1.5
Fig. 5 Uninterpreted final stacked data (top) and interpreted migrated data (bottom) of the Nireaha line, Eketahuna seismic surv -yReflector T represents a strong reflection above basement greywacke west of the Taiko Fault, similar to reflector T elsewhere, bt is
Dow
nloa
ded
by [
Yor
k U
nive
rsity
Lib
rari
es]
at 1
6:11
15
Nov
embe
r 20
14
New Zealand Journal of Geology and Geophysics, 1995, Vol. 38
0.0) 320 340 360 380 400 420 440 460
*fiS5S<BZ53
1.0
!*22ST*^. 1.51000 metres
probably Pliocene in age. Lithological units, contacts, and faults inferred from geological mapping are indicated across the top of the linedrawing. Vertical exaggeration is 1.5 for an average velocity of 2300 m/s.
Dow
nloa
ded
by [
Yor
k U
nive
rsity
Lib
rari
es]
at 1
6:11
15
Nov
embe
r 20
14