defect detection for vertical cracks in hot-slabs using ... · defect detection for vertical cracks...
TRANSCRIPT
Defect Detection for Vertical Cracks in Hot-slabsusing Dual Light Switching Lighting Method
Yong-Ju Jeon, Doo-chul Choi, Sang Jun Lee, Jong Pil Yun and Sang Woo Kim
Abstract—This paper presents an automated inspection algorithmfor a hot-slab. The hot-slabs surface typically have various shapeof scales composed of oxidized substances. These scales do notaffect the typical quality of the slab. However, the scales must bedistinguished from the defects through inspection for a high accuracydefect detection. To minimize the influence of scales and to detectdefects more effectively, we propose a dual light switching lightingmethod and a defect detection algorithm based on Gabor filters andmorphological analysis.
Keywords—Defect detection, Visual inspection, Automatic inspec-tion, Slab
I. INTRODUCTION
IN recent years, product quality has been an improtant issuefor the steel industry [1]. To create high-quality prod-
ucts, many applications are adopted in steel making idustry[2], [3]. However, most surface-inspeciton systems are stillmanually operated in steel-making industry [4]. Therefore,non-dustructive automatic inspection systems have been highdemand in the steel industry.
The automatic inspection systems have many kind of ad-vantage as follows [5]: (1) human do not need to workin hazardous environments;, (2) the performance is betterthan humans work;, (3) the quality and productivity of steelproducts produced by using these systems is high. However,the manual inspection can not be guaranteed the reliabilityand accuracy because it highly depends on the experience ofhuman inspectors. Therefore, to overcome the limitation ofmanual inspection, many automated inspection systems havebeen successfully implemented within various industries [6]–[8].
In this paper, we propose an automated visual inspec-tion system for the detection of vertical cracks in hot-slabs.Automated visual inspection has been developed in variousindustries such as textiles [9], circuit [10], LCD panels [11],and steel products [12]–[14] for fast speed and diagnosticcapabilities [15]. The goal of this study was to develop a defectdetection algorithm based on image processing techniquesfor vertical cracks in hot-slabs. The slabs are in the form
Yong-Ju Jeon, Doo-chul Choi and Sang Jun Lee are with Departmentof Electrical Engineering (EE), Pohang University of Science and Technol-ogy (POSTECH), Pohang 790-784, South Korea (e-mail: {jjeon83, dooshe,lsj4u}@postech.edu)
Jong Pil Yun is with System Research Group, Engineering Research Center,Pohang Iron and Steel Company (POSCO), Pohang 790-300, South Korea (e-mail: [email protected])
Sang Woo Kim is with Department of Electrical Engineering (EE) andDepartment of Creative IT Excellence Engineering (CITE), Pohang Universityof Science and Technology (POSTECH), Pohang, 790-784, South Korea (e-mail: [email protected])
of steel blocks with a rectangular. Fig.5 shows slab surfaceimage including vertical cracks which is our target of defectdetection. A hot-slab is a semifinished product fabricatedby a continuous casting process. We focus on the detectionof vertical cracks in slabs. The vertical cracks are criticaldefects because vertical cracks on the slab surface directlyinfluence the quality of the final product such as thick plate.However, the hot-slab surface presents some difficult factorsfor defect detection, such as scales. The hot-slab surface ispartially covered with scales composed of oxidized substancescaused during hot-process manufacturing. The presence ofscales strongly affects the optical properties of the slab surface.Therefore, we need to reduce the number of pseudo defectsthat occur because of the presence of scales.
In this paper, we propose a defect detection method forvertical cracks on slab surfaces that are partially covered withscales. To reduce the effect of scales, we propose dual lightswitching lighting (DLSL) method. To distinguish the verticalcracks from the other noise components such as the scales, weselect a set of suitable criteria. The remainder of this paperis organized as follows. The lighting method, gabor filtering,and pair detection and path cost criteria are psented in Section2, and experimental results and conclusions are discussed inSection 3.
II. METHODSA. Dual Light Switching Lighting
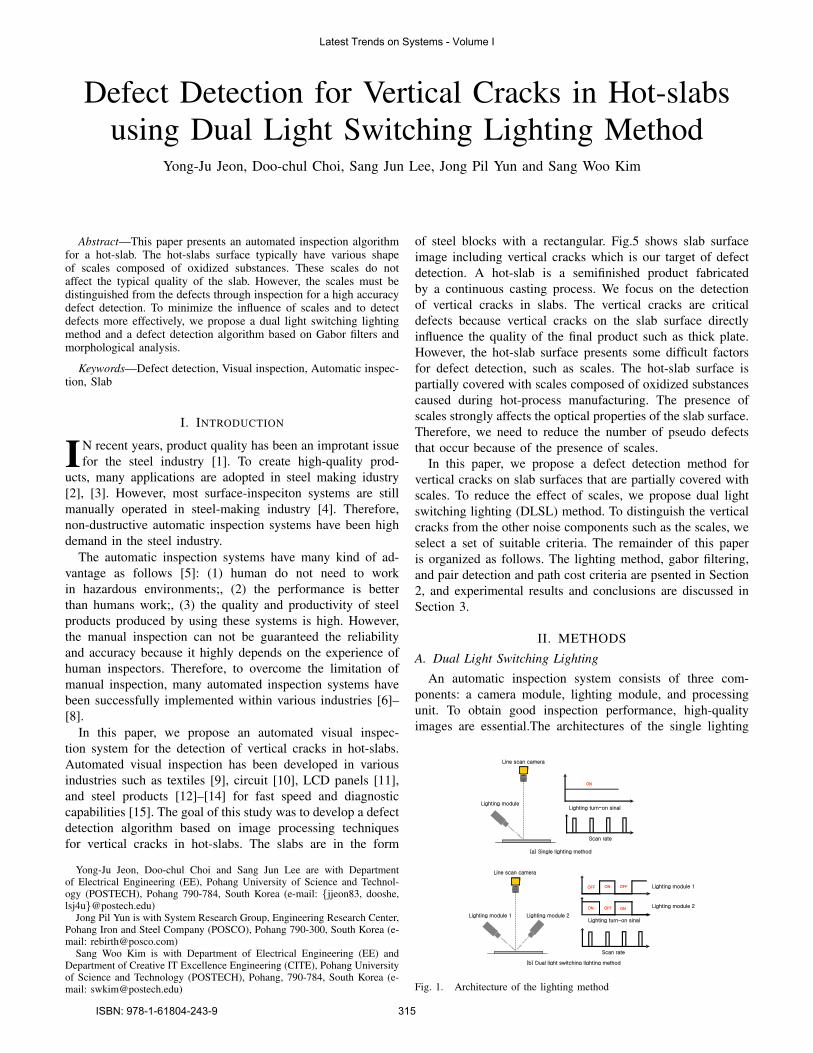
An automatic inspection system consists of three com-ponents: a camera module, lighting module, and processingunit. To obtain good inspection performance, high-qualityimages are essential.The architectures of the single lighting
(a) Single lighting method
ON OFFOFF
ON
Line scan camera
Lighting moduleLighting turn-on sinal
Line scan camera
Lighting module 1 Lighting module 2
Lighting module 1
Lighting module 2
Lighting turn-on sinal
Scan rate
ON OFF
Scan rate
ON
(b) Dual light switching lighting method
Fig. 1. Architecture of the lighting method
Latest Trends on Systems - Volume I
ISBN: 978-1-61804-243-9 315
(a) single lighting method
(b) Dual light switching lighting method
Background field
Dark field Bright field
Pattern field
Background field
Pattern field
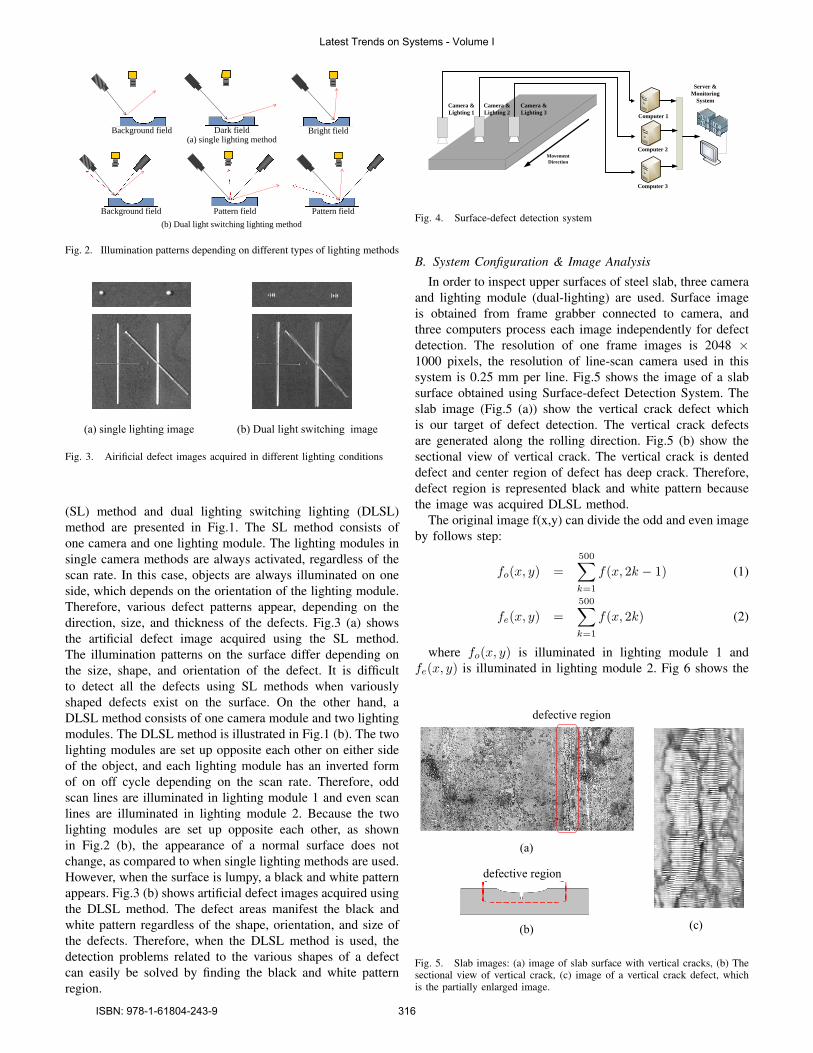
Fig. 2. Illumination patterns depending on different types of lighting methods
Fig. 3. Airificial defect images acquired in different lighting conditions
(SL) method and dual lighting switching lighting (DLSL)method are presented in Fig.1. The SL method consists ofone camera and one lighting module. The lighting modules insingle camera methods are always activated, regardless of thescan rate. In this case, objects are always illuminated on oneside, which depends on the orientation of the lighting module.Therefore, various defect patterns appear, depending on thedirection, size, and thickness of the defects. Fig.3 (a) showsthe artificial defect image acquired using the SL method.The illumination patterns on the surface differ depending onthe size, shape, and orientation of the defect. It is difficultto detect all the defects using SL methods when variouslyshaped defects exist on the surface. On the other hand, aDLSL method consists of one camera module and two lightingmodules. The DLSL method is illustrated in Fig.1 (b). The twolighting modules are set up opposite each other on either sideof the object, and each lighting module has an inverted formof on off cycle depending on the scan rate. Therefore, oddscan lines are illuminated in lighting module 1 and even scanlines are illuminated in lighting module 2. Because the twolighting modules are set up opposite each other, as shownin Fig.2 (b), the appearance of a normal surface does notchange, as compared to when single lighting methods are used.However, when the surface is lumpy, a black and white patternappears. Fig.3 (b) shows artificial defect images acquired usingthe DLSL method. The defect areas manifest the black andwhite pattern regardless of the shape, orientation, and size ofthe defects. Therefore, when the DLSL method is used, thedetection problems related to the various shapes of a defectcan easily be solved by finding the black and white patternregion.
Camera & Lighting 1
Camera & Lighting 2
Camera & Lighting 3
MovementDirection
Computer 1
Computer 2
Computer 3
Server &Monitoring
System
Fig. 4. Surface-defect detection system
B. System Configuration & Image Analysis
In order to inspect upper surfaces of steel slab, three cameraand lighting module (dual-lighting) are used. Surface imageis obtained from frame grabber connected to camera, andthree computers process each image independently for defectdetection. The resolution of one frame images is 2048 ×1000 pixels, the resolution of line-scan camera used in thissystem is 0.25 mm per line. Fig.5 shows the image of a slabsurface obtained using Surface-defect Detection System. Theslab image (Fig.5 (a)) show the vertical crack defect whichis our target of defect detection. The vertical crack defectsare generated along the rolling direction. Fig.5 (b) show thesectional view of vertical crack. The vertical crack is denteddefect and center region of defect has deep crack. Therefore,defect region is represented black and white pattern becausethe image was acquired DLSL method.
The original image f(x,y) can divide the odd and even imageby follows step:
fo(x, y) =
500∑k=1
f(x, 2k − 1) (1)
fe(x, y) =500∑k=1
f(x, 2k) (2)
where fo(x, y) is illuminated in lighting module 1 andfe(x, y) is illuminated in lighting module 2. Fig 6 shows the
Fig. 5. Slab images: (a) image of slab surface with vertical cracks, (b) Thesectional view of vertical crack, (c) image of a vertical crack defect, whichis the partially enlarged image.
Latest Trends on Systems - Volume I
ISBN: 978-1-61804-243-9 316
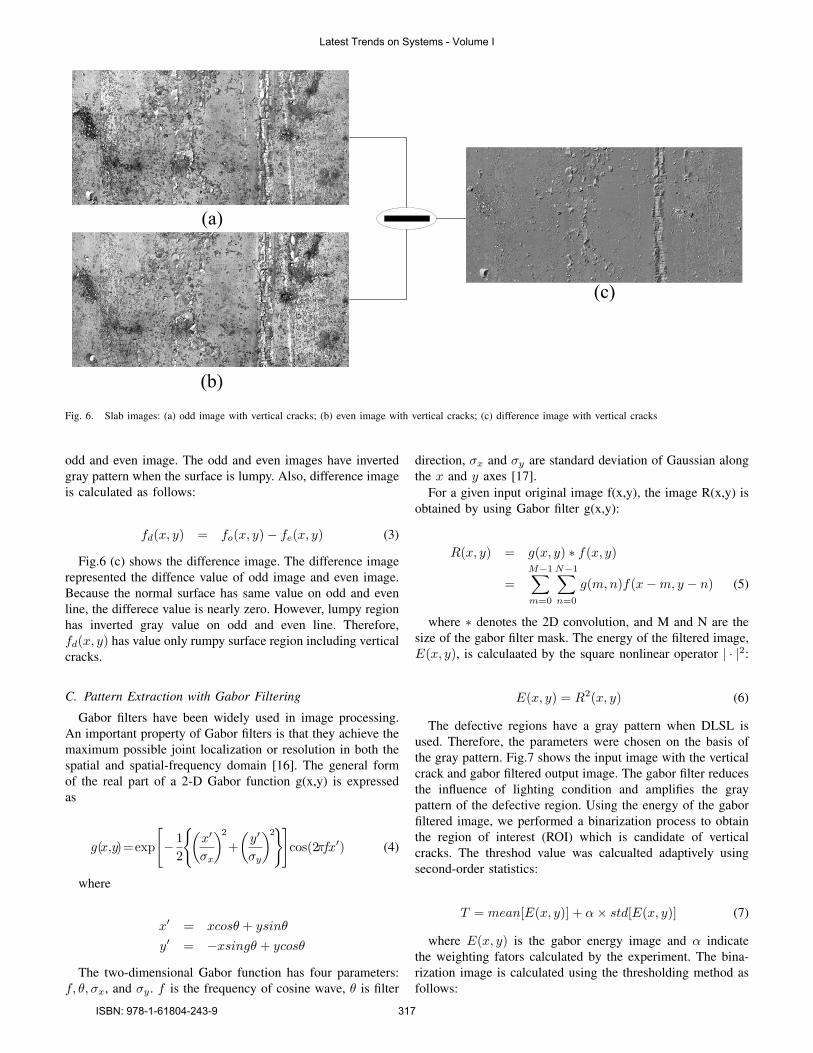
Fig. 6. Slab images: (a) odd image with vertical cracks; (b) even image with vertical cracks; (c) difference image with vertical cracks
odd and even image. The odd and even images have invertedgray pattern when the surface is lumpy. Also, difference imageis calculated as follows:
fd(x, y) = fo(x, y)− fe(x, y) (3)
Fig.6 (c) shows the difference image. The difference imagerepresented the diffence value of odd image and even image.Because the normal surface has same value on odd and evenline, the differece value is nearly zero. However, lumpy regionhas inverted gray value on odd and even line. Therefore,fd(x, y) has value only rumpy surface region including verticalcracks.
C. Pattern Extraction with Gabor Filtering
Gabor filters have been widely used in image processing.An important property of Gabor filters is that they achieve themaximum possible joint localization or resolution in both thespatial and spatial-frequency domain [16]. The general formof the real part of a 2-D Gabor function g(x,y) is expressedas
g(x,y)=exp
[− 1
2
{(x′
σx
)2+
(y′
σy
)2}]cos(2πfx′) (4)
where
x′ = xcosθ + ysinθ
y′ = −xsingθ + ycosθ
The two-dimensional Gabor function has four parameters:f, θ, σx, and σy . f is the frequency of cosine wave, θ is filter
direction, σx and σy are standard deviation of Gaussian alongthe x and y axes [17].
For a given input original image f(x,y), the image R(x,y) isobtained by using Gabor filter g(x,y):
R(x, y) = g(x, y) ∗ f(x, y)
=M−1∑m=0
N−1∑n=0
g(m,n)f(x−m, y − n) (5)
where ∗ denotes the 2D convolution, and M and N are thesize of the gabor filter mask. The energy of the filtered image,E(x, y), is calculaated by the square nonlinear operator | · |2:
E(x, y) = R2(x, y) (6)
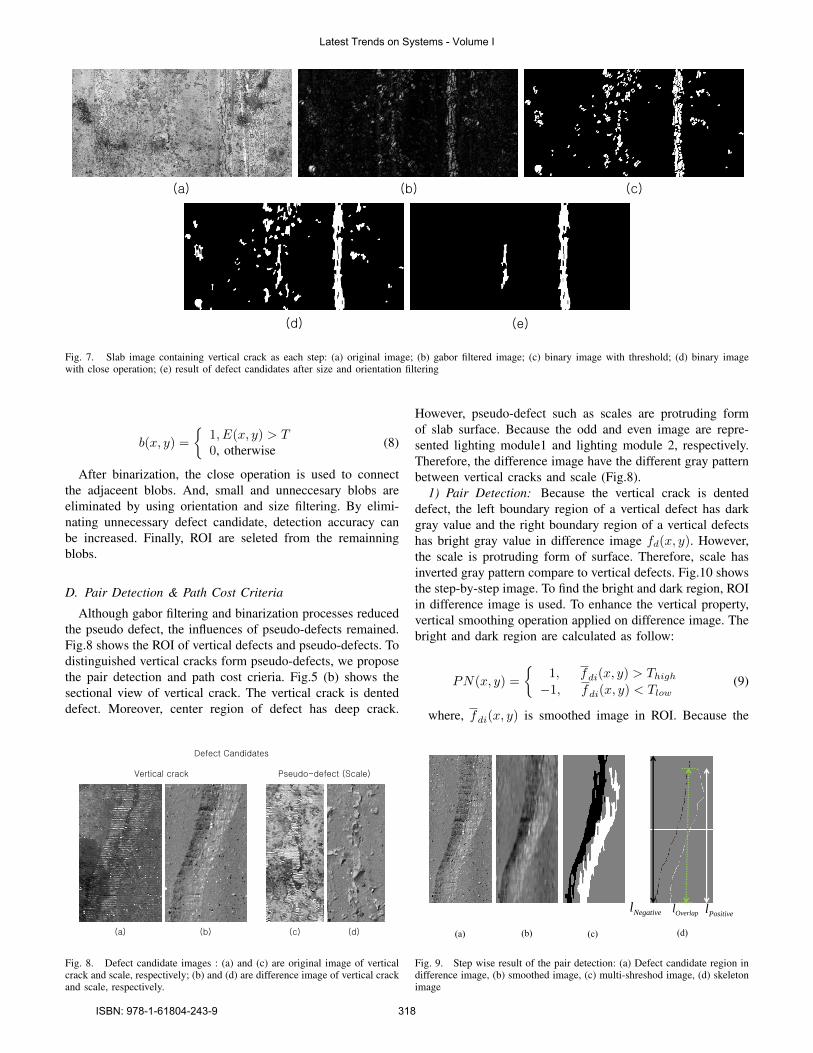
The defective regions have a gray pattern when DLSL isused. Therefore, the parameters were chosen on the basis ofthe gray pattern. Fig.7 shows the input image with the verticalcrack and gabor filtered output image. The gabor filter reducesthe influence of lighting condition and amplifies the graypattern of the defective region. Using the energy of the gaborfiltered image, we performed a binarization process to obtainthe region of interest (ROI) which is candidate of verticalcracks. The threshod value was calcualted adaptively usingsecond-order statistics:
T = mean[E(x, y)] + α× std[E(x, y)] (7)
where E(x, y) is the gabor energy image and α indicatethe weighting fators calculated by the experiment. The bina-rization image is calculated using the thresholding method asfollows:
Latest Trends on Systems - Volume I
ISBN: 978-1-61804-243-9 317
(a)
(e)(d)
(b) (c)
Fig. 7. Slab image containing vertical crack as each step: (a) original image; (b) gabor filtered image; (c) binary image with threshold; (d) binary imagewith close operation; (e) result of defect candidates after size and orientation filtering
b(x, y) =
{1, E(x, y) > T0, otherwise (8)
After binarization, the close operation is used to connectthe adjaceent blobs. And, small and unneccesary blobs areeliminated by using orientation and size filtering. By elimi-nating unnecessary defect candidate, detection accuracy canbe increased. Finally, ROI are seleted from the remainningblobs.
D. Pair Detection & Path Cost Criteria
Although gabor filtering and binarization processes reducedthe pseudo defect, the influences of pseudo-defects remained.Fig.8 shows the ROI of vertical defects and pseudo-defects. Todistinguished vertical cracks form pseudo-defects, we proposethe pair detection and path cost crieria. Fig.5 (b) shows thesectional view of vertical crack. The vertical crack is denteddefect. Moreover, center region of defect has deep crack.
(a) (b) (c) (d)
Vertical crack Pseudo-defect (Scale)
Defect Candidates
Fig. 8. Defect candidate images : (a) and (c) are original image of verticalcrack and scale, respectively; (b) and (d) are difference image of vertical crackand scale, respectively.
However, pseudo-defect such as scales are protruding formof slab surface. Because the odd and even image are repre-sented lighting module1 and lighting module 2, respectively.Therefore, the difference image have the different gray patternbetween vertical cracks and scale (Fig.8).
1) Pair Detection: Because the vertical crack is denteddefect, the left boundary region of a vertical defect has darkgray value and the right boundary region of a vertical defectshas bright gray value in difference image fd(x, y). However,the scale is protruding form of surface. Therefore, scale hasinverted gray pattern compare to vertical defects. Fig.10 showsthe step-by-step image. To find the bright and dark region, ROIin difference image is used. To enhance the vertical property,vertical smoothing operation applied on difference image. Thebright and dark region are calculated as follow:
PN(x, y) =
{1, fdi(x, y) > Thigh−1, fdi(x, y) < Tlow
(9)
where, fdi(x, y) is smoothed image in ROI. Because the
OverlaplNegativelPositivel
Fig. 9. Step wise result of the pair detection: (a) Defect candidate region indifference image, (b) smoothed image, (c) multi-shreshod image, (d) skeletonimage
Latest Trends on Systems - Volume I
ISBN: 978-1-61804-243-9 318
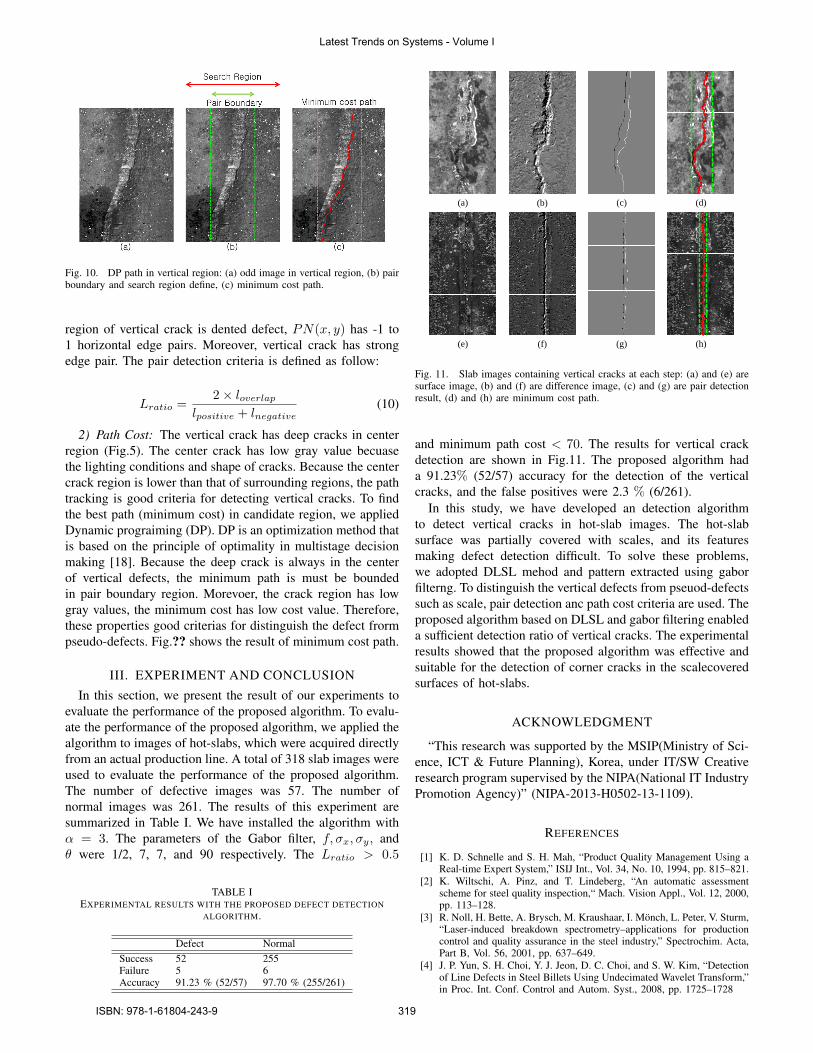
Fig. 10. DP path in vertical region: (a) odd image in vertical region, (b) pairboundary and search region define, (c) minimum cost path.
region of vertical crack is dented defect, PN(x, y) has -1 to1 horizontal edge pairs. Moreover, vertical crack has strongedge pair. The pair detection criteria is defined as follow:
Lratio =2× loverlap
lpositive + lnegative(10)
2) Path Cost: The vertical crack has deep cracks in centerregion (Fig.5). The center crack has low gray value becuasethe lighting conditions and shape of cracks. Because the centercrack region is lower than that of surrounding regions, the pathtracking is good criteria for detecting vertical cracks. To findthe best path (minimum cost) in candidate region, we appliedDynamic prograiming (DP). DP is an optimization method thatis based on the principle of optimality in multistage decisionmaking [18]. Because the deep crack is always in the centerof vertical defects, the minimum path is must be boundedin pair boundary region. Morevoer, the crack region has lowgray values, the minimum cost has low cost value. Therefore,these properties good criterias for distinguish the defect frormpseudo-defects. Fig.?? shows the result of minimum cost path.
III. EXPERIMENT AND CONCLUSION
In this section, we present the result of our experiments toevaluate the performance of the proposed algorithm. To evalu-ate the performance of the proposed algorithm, we applied thealgorithm to images of hot-slabs, which were acquired directlyfrom an actual production line. A total of 318 slab images wereused to evaluate the performance of the proposed algorithm.The number of defective images was 57. The number ofnormal images was 261. The results of this experiment aresummarized in Table I. We have installed the algorithm withα = 3. The parameters of the Gabor filter, f, σx, σy, andθ were 1/2, 7, 7, and 90 respectively. The Lratio > 0.5
TABLE IEXPERIMENTAL RESULTS WITH THE PROPOSED DEFECT DETECTION
ALGORITHM.
Defect NormalSuccess 52 255Failure 5 6Accuracy 91.23 % (52/57) 97.70 % (255/261)
(a) (b) (c) (d)
(e) (f) (g) (h)
Fig. 11. Slab images containing vertical cracks at each step: (a) and (e) aresurface image, (b) and (f) are difference image, (c) and (g) are pair detectionresult, (d) and (h) are minimum cost path.
and minimum path cost < 70. The results for vertical crackdetection are shown in Fig.11. The proposed algorithm hada 91.23% (52/57) accuracy for the detection of the verticalcracks, and the false positives were 2.3 % (6/261).
In this study, we have developed an detection algorithmto detect vertical cracks in hot-slab images. The hot-slabsurface was partially covered with scales, and its featuresmaking defect detection difficult. To solve these problems,we adopted DLSL mehod and pattern extracted using gaborfilterng. To distinguish the vertical defects from pseuod-defectssuch as scale, pair detection anc path cost criteria are used. Theproposed algorithm based on DLSL and gabor filtering enableda sufficient detection ratio of vertical cracks. The experimentalresults showed that the proposed algorithm was effective andsuitable for the detection of corner cracks in the scalecoveredsurfaces of hot-slabs.
ACKNOWLEDGMENT
“This research was supported by the MSIP(Ministry of Sci-ence, ICT & Future Planning), Korea, under IT/SW Creativeresearch program supervised by the NIPA(National IT IndustryPromotion Agency)” (NIPA-2013-H0502-13-1109).
REFERENCES
[1] K. D. Schnelle and S. H. Mah, “Product Quality Management Using aReal-time Expert System,” ISIJ Int., Vol. 34, No. 10, 1994, pp. 815–821.
[2] K. Wiltschi, A. Pinz, and T. Lindeberg, “An automatic assessmentscheme for steel quality inspection,“ Mach. Vision Appl., Vol. 12, 2000,pp. 113–128.
[3] R. Noll, H. Bette, A. Brysch, M. Kraushaar, I. Monch, L. Peter, V. Sturm,“Laser-induced breakdown spectrometry–applications for productioncontrol and quality assurance in the steel industry,” Spectrochim. Acta,Part B, Vol. 56, 2001, pp. 637–649.
[4] J. P. Yun, S. H. Choi, Y. J. Jeon, D. C. Choi, and S. W. Kim, “Detectionof Line Defects in Steel Billets Using Undecimated Wavelet Transform,”in Proc. Int. Conf. Control and Autom. Syst., 2008, pp. 1725–1728
Latest Trends on Systems - Volume I
ISBN: 978-1-61804-243-9 319
[5] B. R. Suresh, R. A. Fundakowski, T. S. Levitt, and J. E. Overland, “Real-time automated visual inspection system for hot steel slabs,” IEEE Trans.Pattern Anal. Mach. Intell. Vol. PAMI-5, No. 6, 1983, pp. 563–572.
[6] D. B. Perng, C. C. Chou, and S. M. Lee, “Illumination system for wirebonding inspection,” Appl. Opt., Vol. 46, No. 6, 2007, pp. 845–854.
[7] M. Rallo, M. S. Millan, and J. Escofet, “Referenceless segmentation offlaws in woven fabrics,” Appl. Opt., Vol. 46, No. 27, 2007, pp. 6688–6699.
[8] H. I. Shafeek, E. S. Gadelmawla, A. A. Abdel-Shafy, and I. M. Elewa,“Automatic inspection of gas pipeline welding defects using an expertvision system,” NDT and E Int., Vol. 37, 2004, pp. 301–307.
[9] C. H. Chan and G. K. Pang, “Fabric Defect Detection by FourierAnalysis,” IEEE Trans. Ind. Appl., Vol. 36, No. 5, 2000, pp. 1267–1276.
[10] P. C. Chang, L. Y. Chen, and C. Y. Fan, “A case-based evolutionarymodel for defect classification of printed circuit board images,” J. Intell.Manuf., Vol. 19, 2008, pp. 203–214.
[11] D. M. Tsai and S. C. Lai, “Defect detection in periodically patternedsurfaces using indepeendent component analysis,” Pattern Recognit.,Vol. 41, 2008, pp. 2812–2832.
[12] J. P. Yun, Y. J. Jeon, D. C. Choi, and S. W. Kim, “Real-time defectdetection of steel wire rods using wavelet filters optimized by univriatedynamic encoding algorithm for searches,” J. Opt. Soc. Am. A, Vol. 29,No. 5, 2012, pp. 797–807.
[13] S. Ghorai, A. Mukherjee, M. Gangadaran, and P. K. Dutta, “AutomaticDefect Detection on Hot-Rolled Flat Steel Products”, IEEE Trans.Instrum. Meas., Vol. 62, No. 3, 2013, pp. 612–621.
[14] S. G. Ryu, D. C. Choi, Y. J. Jeon, S. J. Lee, J. P. Yun, and S. W. Kim,“Detection of Scarfing Faults on the Edges of Slabs,” ISIJ Int., Vol. 54,No. 1, 2014, pp. 112–118.
[15] R. T. Chin and C. A. Harlow, “Automated visual inspection: A survey,”IEEE Trans. Pattern Anal. Mach. Intell., Vol. PAMI-4, No. 6, 1982, pp.557–573.
[16] Y. Shu and Z. Tan, “Fabric Defects Automatic Detection Using GaborFilters,” in Proc. 5th World Congr. Intell. Control Autom., 2004, pp.3378–3380.
[17] Q. Li, J. You, L. Zhang, and P. Bhattacharya, “A Multiscale Approachto Retinal Vessel Segmentation Using Gabor Filters and Scale Multi-plication,” in Proc. IEEE Int. Conf. Syst. Man and Cybern., 2006, pp.3521–3527.
[18] J. P. Yun, D. C. Choi, Y. J. Jeon, C. H. Park, and S. W. Kim, “Defectinspection system for steel wire rods produced by hot rolling process,”Int. J. Adv. Manuf. Technol., Vol. 70, 2014, pp. 1625–1634
Latest Trends on Systems - Volume I
ISBN: 978-1-61804-243-9 320