deep financial integration and volatilitybsorense/kalemli_ozcansorensenvolosovych_sep8_2013.pdfdeep...
TRANSCRIPT

Deep Financial Integration and Volatility
Sebnem Kalemli-OzcanUniversity of Maryland, CEPR and NBER
Bent SorensenUniversity of Houston and CEPR
Vadym VolosovychErasmus University Rotterdam, Tinbergen Institute and ERIM ∗
September 2013
AbstractWe investigate the relationship between foreign direct ownership of firms andfirm- and region-level output volatility using a novel panel data set for Euro-pean countries. We document a positive, highly robust, relationship betweenfirm-level foreign ownership and volatility of value added. This relationshipholds cross-sectionally and in panels with firm fixed effects where the relation-ship captures within firm variation over time. Considering domestic firms withassets in foreign countries, we document that it is international diversification,rather than the nationality of the owner, that explains this positive correlation.Our results can also be found at the aggregate-level, where we show that region-level volatility is correlated positively with foreign investment in the region. Weshow that this positive relation between aggregate volatility and foreign invest-ment can be explained by the the granularity of the firm size distribution andthe fact that foreign ownership is concentrated among the largest firms.
JEL: E32, F15, F36, O16.
Keywords: firm output volatility, foreign ownership, regional integration, ag-gregate output volatility.
∗Kalemli-Ozcan: University of Maryland, Department of Economics, 4118D Tydings Hall, College Park,MD, 20742 USA, Tel: +1(301)4053486, e-mail: [email protected]; Sorensen: Department of Economics,University of Houston, 204 McElhinney Hall, Houston, TX 77204 USA, Tel: +1(713)7433841, e-mail: [email protected]; Volosovych: Erasmus University Rotterdam, Burg. Oudlaan 50, Room H14-30, 3062 PARotterdam, the Netherlands, Tel: +31(10)4081286, e-mail: [email protected]. We thank Nick Bloom,Nicola Cetorelli, Philipp Harms, Jean Imbs, Jens Iversen, Jan De Loecker, Eswar Prasad, Romain Ranciere,Jae Sim, Robert Vermeulen, seminar participants at numerous universities as well as participants in theFifth Annual CEPR Workshop on Global Interdependence, the 2009 UCLA-DEGIT XIV Workshop, the2009 Summer Meetings of Econometric Society in Boston, the 7th INFINITI conference in InternationalEconomics and Finance in Dublin, the 2009 Midwest Macro Meetings (International Trade), the Global-ization Conference at Trinity College, the 2009 NBER Universities Research Conference, the 2009 SpringMeeting of NBER-IFM group, the 2009 NBER Summer Institute-Productivity group, and in the 2008 IEFSWorld Congress. Five thorough referees helped us improve the paper substantially. Essential parts of thispaper were prepared while Sebnem Kalemli-Ozcan was visiting Bilkent University in 2007 and the EuropeanCentral Bank as 2008 Duisenberg Fellow. She thanks the economists at both institutions for providing astimulating research environment. Sebnem Kalemli-Ozcan is also grateful for financial support during 2008from the Marie Curie Actions of the 7th Framework Programme for EU Enlargement.
1 Introduction
We investigate the relationship between financial integration and volatility. Finan-
cial integration may take many forms, such as bank lending, portfolio investment,
and foreign direct investment, and the impact on volatility may differ depending on
the exact form of financial integration. We focus on foreign equity investment and
establish stylized facts about the relationship between foreign equity investment and
volatility at the firm level and at the regional level during 1996–2008. Aggregating
our firm-level data to the regional level, rather than the country level, leaves us
with enough degrees of freedom for testing the statistical significance of relations
and allows us to use fixed effects to neutralize effects of country-level variables, such
as monetary and fiscal policy.
We examine if foreign investors are relatively more willing to invest in risky firms
and projects by testing if there is a positive relationship between firm-level foreign
investment and firm-level volatility. We find with very high statistical significance
that this is so, robust to the set of countries considered and the types of firms
considered. The positive relation can be a result of foreigners investing in highly
volatile firms or of foreigners tilting investment towards risky, high return, projects
once they invest in a firm.1 We do not sort out directions of causality but notice that
either direction of causality requires foreign investors to be willing to accept more
volatility of output. Our interpretation of the result is that foreigners are willing to
1See Obstfeld (1994) and Acemoglu and Zilibotti (1997).
1

accept higher volatility of domestic firms because they are diversified internationally.
As a further test of the diversification story, we investigate if domestic owners with
international assets also hold relatively more volatile domestic firms. We find that
they do, consistent with our interpretation.2
We employ an extensive firm-level data set, the AMADEUS database (Analyze
Major Databases from European Sources), provided by Bureau van Dijk Electronic
Publishing (BvD) for the period 1996–2008. The data set encompasses all Euro-
pean countries, 100+ regions and 4+ million unique firms, covering the universe of
listed firms and most privately-held firms. We define a measure of “deep” financial
integration by calculating the share of assets in our dataset, for each region, owned
by foreigners. This measure captures foreign direct investment (FDI) and portfolio
equity financing.
We first study the relation between foreign ownership and firm-level volatility
and document a significant positive relation between the two. We find an effect
which is both statistically and economically significant: if the largest owner of a
given firm is a foreign company, value added growth is 30% more volatile, where
sales and operating revenue growth is 20% more volatile. We verify that this result
is strongly robust and not purely cross-sectional. It survives the inclusion of firm-
specific dummies with the implication that positive changes in foreign ownership
are associated with increasing volatility.
2Faccio, Marchica, and Mura (2011) empirically verify, using AMADEUS data, that companieswith diversified owners take more risk, as measured by return on assets.
2
Foreign owners are likely to own property in their domestic economy and there-
fore have internationally diversified assets and we interpret their higher willingness
to take on risk as a reflection of this diversification. We can examine if international
diversification is associated with investment in more volatile firms by testing if do-
mestic firms who own foreign subsidiaries also are more volatile than other domestic
firms. We find that such domestic firms are significantly more volatile (15% more in
terms of operating revenue) implying that volatility is correlated with international
diversification, per se.3 Verifying our results from the side of foreign assets is of
interest because there is almost no country-level evidence on this issue due to the
low quality of country-level foreign asset data compared to foreign liability data
from Balance-of-Payments Statistics.
Finally, we aggregate value added over the firms in a given region in our data
in order to examine if the volatility of our aggregated data correlates with our
measure of deep financial integration at the regional level. Alternatively, we ex-
amine if volatility of regional GDP from Eurostat correlates with deep financial
integration. In both cases, we find that the micro-level patterns carry over to the
“macro-regional” level. The macro-level estimates from the regional analysis, using
both forms of aggregation, are economically significant, explaining about one-third
of the variation in the data.
We examine why the micro-level relationship survives aggregation: if foreign
3In online Appendix B, we develop a simple model illustrating this mechanism.
3

ownership is randomly allocated across firms and firms “typically” are small, the
firm-level pattern will not carry over to aggregated data due to the law of large
numbers. However, if firm sizes are “granular,” as put forward by Gabaix (2011),
with the largest firms being so large that their volatility mechanically explains part
of aggregate volatility, then we expect to see firm-level patterns carry over to the
aggregate level. We estimate power laws for firm sizes for each country and we find
evidence of granular firm size distributions in all countries. Further, we show that
foreign ownership is concentrated in large firms. Together, these findings imply that
the firm-level foreign-ownership/volatility relation should carry over to aggregated
data, possibly with even higher correlations, consistent with our findings.
At the macro-level, there is an extensive literature on volatility and economic
integration/development. Several theoretical papers, such as Obstfeld (1994), and
Acemoglu and Zilibotti (1997), have focused on financial diversification. These mod-
els incorporate a trade-off between productivity and risk at the microeconomic level:
firms (or owners) must choose between safe low-productivity production and risky
high-productivity production. Firms in developed countries can pool risks via finan-
cial assets and therefore pick high-return high-risk projects more often compared to
firms in financially underdeveloped countries. This type of model implies a negative
relationship between aggregate and firm-level volatility but a positive relationship
between development and firm-level volatility. It also implies a steady increase in
firm-level volatility and a steady decline in aggregate volatility as countries develop.
4

Koren and Tenreyo (2013) show that firm-level volatility have declined along with
aggregate volatility (see also Davis, Haltiwanger, Jarmin, and Miranda (2007)) and
develop a model of technological diversification which can explain this.4 Levchenko,
Ranciere, and Thoenig (2009) find a positive effect of financial liberalization on
volatility of production across industries while Kose, Prasad, and Terrones (2009)
find a positive effect of financial liberalization on risk sharing, implying that con-
sumption volatility decreases relative to output volatility and they find that output
volatility increased with financial liberalization.
Micro-level studies focusing on real output volatility are rather rare. Thes-
mar and Thoenig (2004) find an increase in firm-level volatility for listed French
companies following financial deregulation. Correa and Suarez (2009) find the op-
posite result—firm-level sales and employment in a sample of listed firms become
less volatile after bank deregulation in the United States. Studies connecting micro
and macro level observations in terms of foreign investment and volatility are non-
existing till now.
Overall, we uncover a highly robust, highly significant, relation between foreign
ownership and volatility. Considering the size of our data set as well as the robust-
ness across (European) countries and types of firms, these are stylized facts that
theoretical models need to confront.
The paper proceeds as follows. Section 2 describes our data. Section 3 presents
4In earlier work, Koren and Tenreyro (2007) find a robust negative relation between country-levelvolatility and development.
5
our results and Section 4 concludes.
2 Data and Construction of Variables
We construct a unique data set composed of firm-level observations from AMADEUS
and region-level observations corresponding to the Nomenclature of Territorial Units
for Statistics of Europe (NUTS-2), provided by Eurostat. AMADEUS provides
financial information, information on foreign and domestic owners of each firm,
and locational information which allows us to assign firm-level data to Eurostat’s
NUTS-2 level regions. We focus on a homogenous sample of 16 countries: Austria,
Belgium, Denmark, Finland, France, Germany, Greece, Ireland, Italy, Netherlands,
Norway, Portugal, Spain, Sweden, Switzerland, and the United Kingdom, for the
years 1996–2008.
2.1 Firm-Level Variables
For our 16 countries, AMADEUS lists 4.7 million firms which have at least one year
with reported assets and an outcome variable—either sales, revenue, or employment.
Table A.3 in the online appendix lists the exact number of firms available by year and
variable. From the AMADEUS Financials database, we draw information for 1996–
2008 and combine these data with data on foreign ownership from the AMADEUS
Ownership database, using firm IDs. During this process, we lose firms for which
data are not available in both samples, as documented in Table A.3.
6
We work with two types of samples. In the sample of permanent firms over a
specified period, we keep all firms with outcomes non-missing in every year. In the
sample of all firms, we allow firms to have missing outcomes at the beginning or
the end of any given regression sample but we drop firms that have “holes” in the
time-series.
Assets, sales, and operating revenue are measured in euros while employment
is in persons. The distribution of these (logged) variables does not change much
over time and is very close to normal; i.e., the distribution of the data before the
log-transformation is very close to log-normal. The distribution of employment is
skewed with many firms having only one employee (lawn service, painters, etc.). To
limit the potential impact of outliers, we winsorize the variables before performing
our empirical analysis.5
Volatility Measures. For robustness and comparability with previous work, we
experimented with several measures of volatility. The literature on firm-level volatil-
ity, which mostly focuses on large publicly traded firms from data sets such as COM-
PUSTAT, uses the standard deviation of outcome growth (“sd”) and this is our first
measure.6 The distribution of (winsorized) standard deviations of operating revenue
is displayed in Panel A of Figure 1. The distribution is close to normal except for
5Figure A.1 in the online appendix presents the distribution, with the number of firms on thevertical axis, of the logarithm of the firm-level operating revenue for four different years whileFigure A-2 in the online appendix shows total assets (before and after winsorizing) and otheroutcomes for 2006.
6We calculate firm outcome growth as the rate of change (rather than log-differences becausegrowth-rates at the firm-level often are so large that the usual logarithmic approximation is a badapproximation to the growth-rate.
7
the pile-ups at the points of winsorizing. For small firms, measures based on stan-
dard deviations may have bad properties because, say, a firm growing from 1 to 2
employees have a growth rate of 100%.7
We study how volatility changes over time but, because our time-series dimen-
sion is very limited, we cannot construct rolling windows of regular standard de-
viations and instead we follow Morgan, Rime, and Strahan (2004) and construct
a year-by-year volatility measure that can be used for panel-data analysis. First,
we regress firm-level outcome growth on firm-fixed effects and year-fixed effects:
(Yit − Yit−1)/Yit−1 = φi + γt + vit. The residuals vit reflect how much outcome
growth differs from the average growth (across all firms) in year t and from the
average growth (over time) of firm i. For each firm, we use the absolute value of
these residuals as our time-varying volatility measure: sdt ≡ |vit|. Intuitively, the
sdt measure is the one year equivalent of the standard deviation measure, sd.8
Foreign Ownership. The AMADEUS Ownership database contains detailed in-
formation on owners of both listed and private firms including name, country of
residence, and type (e.g., bank, industrial or financial company). The database
refers to each record of ownership as an “ownership link” and BvD traces a link
between two entities even when the ownership percentage is very small (sometimes
7In the working paper version of this article, we verify that the results are robust to using thecoefficient of variation (“cv”) as an alternative measure of volatility.
8Using data from the ZEPHYR database, we dropped firms involved in a full merger or acqui-sition when the merger resulted in spuriously high growth for the acquirer. The number of firmsinvolved in M&A activity as defined in ZEPHYR is, however, a small fraction of our sample so ourresults do not depend on whether we drop such firms or not.
8

less than 1%). For listed firms, very small stock holders are typically unknown.9
We compute Foreign Ownership (FO) as follows. For a firm i, FOi is the sum of
all percentages of direct ownership by foreigners. For example, if a Company A
has three foreign owners with stakes 10%, 15%, and 35%, respectively, FO for this
company is 60%. Owners of unknown origin (typically small) are assigned to the
home country. Panel B of Figure 1 shows the distribution of foreign ownership in
2002.
The distribution is concentrated around 0 with less than 1% of firms 100% foreign
owned (fully-owned affiliate of multinationals or greenfield investment). There is a
noticeable spike in the number of firms around 50% ownership which likely reflects
the desire of large investors to obtain a controlling share over 50%.10
Other Measures of Ownership. We measure each firm’s Foreign Minority Own-
ership (FMO) by computing the sum of all percentages of foreign direct ownership
after excluding the largest stake in the company; Domestic Minority Ownership
(DMO) is computed analogously, for domestic owners. If a Company A has two
foreign owners with stakes 50% and 15%, and two domestic owners with stakes 25%
and 10%, the largest owner for this company is foreign (with stake 50%), FMO
is 15%, and DMO is 35%. We define a binary variable Largest Owner is Foreign
9Countries have different rules for when the identity of a minority owner needs to be disclosed;for example, France, Germany, the Netherlands, and Sweden demand that listed firms disclose allowners with more than a 5% stake, while disclosure is required at 3% in the United Kingdom, andat 2% in Italy. See Schouten and Siems (2010).
10In the online appendix, Figure A.3 presents the distribution of foreign ownership for differentyears while Figure A.4 presents the distribution of foreign ownership for the subset of firms withstrictly positive foreign ownership.
9
(LOF) taking the value unity if the largest owner is foreign and zero otherwise.11
The majority of these firms have a foreign ownership share of 100% while few firms
have a foreign ownership share under 40% and there is a spike around 50%.
Most companies have a very small degree of minority ownership and firms are
more diversified domestically than internationally.12 Domestic minority owners’
share (DMO) exhibits much more variation as can be seen from the lower right
panel. Finally, we use the number of foreign and domestic owners, respectively, as
alternative measures of ownership. The number of owners can also be thought of as
a concentration measure.
Firm-Level Controls. We use firms’ total assets as a size control because large
firms potentially are better able to smooth shocks through averaging of shocks to
different products, processes, etc. We control for firm age because young firms tend
to be more volatile. Davis, Haltiwanger, Jarmin, and Miranda (2007) show that size
and age are important determinants of firm dynamics.
2.2 Region-Level Variables
We use regional NUTS-2 level data for 100+ regions from our 16 countries. Countries
with only one NUTS-2 region during the years of our analysis, such as Denmark,
11In the rare case of a tie between the largest foreign and the largest domestic investor, we assignthe value 1 to the LOF-dummy. Figure A.5 in the online appendix shows the distribution of foreignownership for the sample of firms where the largest owner is foreign.
12Online Appendix Figure A.6 presents the distribution of FMO and DMO in a given year, 2006.The upper right graph shows that among all firms with non-zero foreign ownership, the amount offoreign minority ownership is concentrated at ownership shares up to 20%.
10
are left out of the regional analysis.
Regional Volatility Measures. We measure regional volatility in two ways. First,
we aggregate firm-level outcomes (sales, operating revenue, value added) to the
regional-level and calculate the volatility of the aggregated outcomes. Second, we
calculate regional volatility using data on regional GDP from Eurostat. We use
nominal GDP per capita in euros, deflated by national CPI.13 Volatility is calculated
from formulas similar to those used at the firm-level.
Deep Financial Integration. Our measure of deep financial integration is the
share of aggregated assets owned by foreign investors FIj =∑
i FOijTOASij /TOASTj ,
where FOij is the percentage foreign ownership at the firm-level for a firm i located
in region j and TOASTj =∑
i TOASij , where TOASij is the total assets of company
i.14
We proxy region size by the sum of total assets of the firms in that region
and, as another control, use annual average population series from Eurostat. It is
important to control for region size because volatility may be lower in large regions
due to averaging over a larger number of firms. These variables also partially control
for selection problems in AMADEUS where some countries, such as Germany, are
less likely to collect data for smaller firms.
13We use the Harmonized Consumer Price Index from Eurostat.14Figure A.7 in the online appendix shows the distribution of this measure for two typical regions.
11

2.3 Descriptive Statistics
Table 1 shows means, standard deviations, min and max values of our (filtered and
winsorized) variables at the firm and regional levels. Volatility has a mean of 0.359
with a standard deviation of 0.62 with a maximum of 4.66 and a minimum very
close to 0. Foreign ownership is 1.27% on average with a standard deviation of 10.8.
Foreign minority ownership is typically small while domestic minority ownership is
larger at 4.09% with a large standard error of 14%. Firm age is 20 years on average
with a large standard deviation and a maximum of 909.15 Average firm assets are 3.8
million euros but the standard deviation of assets is very large and the winsorized
maximum is 45.8 billion euros. Average assets of foreign owned firms are much
larger, 31.78 million and the maximum is 20.2 billion. Clearly foreign owned firms
are typically much larger than domestically owned firms.
4.3% of all firms have some foreign ownership while 6.5% are exporters and
0.05% are listed. Exporters appear to have lower volatility on average, maybe due
to diversified markets. Of firms with some foreign ownership, 25.8% are fully owned
by foreigners while 17.8% are “subsidiaries;” i.e., firms with only one foreign owner.
More than half of the firms with some foreign ownership have majority foreign
ownership.
15We checked on some of the firms of very high age and it appears that some European firmsindeed are extremely old. The oldest firm is an Italian publishing house in Rome “A.T.S. ItaliaEditrice S.R.L.” while the hotel “Hotel Pichlmayrgut Gmbh & CO KG” in Austria is incorporatedin 1117 according to AMADEUS. The latter date corresponds to the date given on the coat of armsdisplayed at the hotel’s WEB-page (www.pichlmayrgut.at).
12

Panel B displays region-level statistics. The time varying volatility measure,
using AMADEUS data, has a mean of 6.1% with a standard deviation of 8.5%, a
minimum near 0 and a maximum of 67%. Average volatility and its dispersion is
much lower when calculated from Eurostat data, likely due to the inclusion of the
government sector in the regional GDP data. On average, about 7.16% of companies’
assets in a region are majority-owned by foreigners, with one region have more
than 50% of assets controlled by foreign majority owners). Asset-weighted foreign
minority ownership is small on average while domestic minority ownership is 7.15%
of assets. The average amount of assets in a given region is about 15.3 billion euros.
We also report statistics that gauge the importance of the foreign owned firms
for regional volatility—foreign-owned firms make up a significant share of regional
economic activity as shown; 13% of the regional assets are owned by firms that have
some foreign ownership with the maximum being 69%.
3 Empirical Analysis
We start by examining the relation between firm-level ownership and volatility. We
focus on value added, operating revenue, and sales. Value added is our preferred
measure because GDP is the sum of the value added of agents in the economy and
while we do not have all agents in the economy, aggregating over the value added
of the firms that we do have, results in a significant fraction of regional GDP. Sales
are often used to study volatility, so we briefly show results for sales, but besides
13
value added we, due to data availability, mainly show results for operating revenue
which behaves quite similarly to sales.16
3.1 Firm-Level Specifications and Results
We regress volatility of firm outcomes on indicators of foreign and domestic owner-
ship and firm size and age. We include country (or region, see online Appendix A)
and sector dummies implying that these regressions solely exploit firm-level varia-
tion. The firm-level regression data are winsorized at the 99% level to remove large
outliers.17
3.1.1 Cross-Sectional Regressions.
We estimate cross-sectional regressions using various samples for calculating volatil-
ity and foreign ownership. The majority of the results are presented for firm-level
volatility measured over 2002–2008 and ownership variables measured in 2002. We
first perform a specification search. We consider a regression of volatility on the
share of foreign ownership and a semi-logarithmic regression of log-volatility on (the
share of) foreign ownership (where the logarithmic transformation downweigh large
values). We further examine the validity of the semi-logarithmic form by including
16Sales are not available for firms in Denmark, Ireland, Norway, and the United Kingdom. Wealso briefly show results for employment, which is less appropriate for our purposes since manyEuropean countries have labor regulations aimed at limiting employment volatility.
17Direct inspection of the raw data reveals occasional large errors, such as numbers coded in, say,kroners, rather than in the millions of kroners claimed in the documentation.
14
a quadratic term in foreign ownership, as in two following models:
V OLijc [log(V OLijc)] = µc + µs + αFOijc + β FO2ijc + X′ijcδ + εijc , (1)
V OLijc [log(V OLijc)] = µc + µs + α log (1 + FOijc) + X′ijcδ + εijc , (2)
where V OLijc is volatility of firm i in region j in country c. µc is a country or region-
specific constant and µs is a set of industry dummies that are based on the firm’s
primary industry code at the 2-digit NACE level. FOijc is percent foreign ownership,
and X′ijc is a vector of controls, namely, firm size and age. In equation (2), a number
1 is added to foreign ownership before taking logs, because many firms have zero
foreign ownership. FO is measured in percent, so that the addition of unity have
little effect (except on the very smallest ownership shares) on the interpretation of
α as the elasticity of volatility with respect to the ownership share.18
The results of Ordinary Least Squares (OLS) regressions of equations (1) and
(2) are displayed in Table 2 with the left-hand side being volatility in panel A and
log-volatility in panel B. The first seven columns display results for value added and
the last seven columns display results for operating revenue.
We first verify that volatility significantly declines unconditionally with firm size
in columns (1) and (8) and with firm age in columns (2) and (9). Columns (3) and
(10) show that, unconditionally, volatility of value added increases significantly with
18If we did not add unity, we would need to truncate very tiny ownership shares as log(x) tendsto minus infinity for x approaching 0.
15

foreign ownership while volatility of operating revenue declines. Columns (4) and
(11) demonstrate that the relations are not linear in the foreign ownership share as
the quadratic term is negative and highly significant. Columns (6) and (12) show
that when we condition on size and age, the relation between volatility and foreign
ownership is robustly increasing and concave for both value added and operating
revenue. This leads us to substitute the quadratic form with the logarithmic in
columns (7) and (13). Comparing panels A and B, we see a more significant relation
between volatility and foreign ownership in panel B and as the log-log specification is
also a priori attractive because it downweighs outliers and provide simple elasticities,
we proceed with this specification.
The correlation between foreign ownership and volatility will partly be due
foreign owners’ production choices. Foreign owners may have more influence the
larger their ownership share is but if they already are majority owners, further in-
creases in ownership will not increase their influence as they are likely to have almost
full control already. We therefore examine the role of majority ownership. We define
LOFijc as a dummy that takes the value 1 if the largest owner is foreign and we
estimate the relation
log(V OLijc) = µc + µs + αLOFijc + β log(1 + FOijc) (3)
+γ LOFijc · log(1 + FOijc) + X′ijcδ + εijc .
16

This relation allows us to test if the correlation of foreign ownership with volatil-
ity changes when the majority owner is foreign together with the incremental effect
of foreign ownership over majority ownership. For minority foreign owned compa-
nies, the marginal effect of log foreign ownership is β, while for majority foreign
owned companies, the marginal effect is β + γ. For robustness, we estimate the
similar regression
log(V OLijc) = µc + µs + αLOFijc + βFOijc + γ LOFijc · FOijc +X′ijcδ+ εijc , (4)
where the share of foreign ownership is used directly.
The results from estimating equation (4) are reported in columns (1) and (3)
of Table 3 for the volatility of value added and operating revenue; respectively.
We observe that β + γ ≈ 0 implying that correlations don’t increase further with
foreign ownership if the majority owner is already foreign. More precisely, the
semi-elasticities for firms where the largest owner is foreign implied by the results
in columns (1) and (3) are 0.048 and –0.080, respectively, and the elasticities in
columns (2) and (4) are 0.023 and -0.007, respectively. These numbers are econom-
ically small.19 The coefficient to foreign ownership is 0.474 while the coefficient to
the largest owner is foreign dummy is 0.258—the former coefficient implies that a
minority owner with a 49% share has a correlation of 0.232, so there is no significant
discontinuity at 50% ownership.
19A formal test cannot reject that the first and fourth of those elasticities are zero.
17

The results, for our preferred log-log specification in columns (2) and (4), are sim-
ilar except the results indicate some jump in the correlations with majority owner-
ship as the coefficient to the largest owner is foreign dummy is 0.205, for value added,
while the coefficient to log foreign ownership is 0.066 and 0.066*log(1+49)=0.116.
The results are robust and doesn’t change much if we instead use operating revenue
in order to have a larger sample.
Table 4 explores if the results are robust to various choices we have made as well
as explores volatility of sales and employment. Columns (1) and (2) of panel A re-
peats earlier results while column (3) considers the volatility of sales—sales are used
in Gabaix’s (2011) study of granularity of fluctuations. The impact of foreign own-
ership on sales is fairly similar to that of operating revenue with a larger coefficient,
reflecting the operating revenue is likely to be less volatile than sales. Volatility of
employment, in column (4), has a low correlation with foreign ownership which, me-
chanically, is consistent with the coefficient to value added being higher than that to
sales: if operating revenue is approximately value added plus wages and employment
and wages display low variance, then the volatility of operating revenue is likely to
be lower than that of value added. Because we have short samples, one may worry
about the precision of the estimated standard errors, so column (5) report results
with bootstrapped standard errors for operating revenue. Those standard errors are
virtually similar to the clustered standard errors reported in other columns. The fi-
nal column, (6), drops outliers (“trims”) rather than winsorizes. Trimming is better
18

if outliers mainly reflect errors while winsorizing, which keeps, but downweighs, the
information in the outliers are better if such outliers are correctly measured large
values. It is not obvious for our data which approach is better but fortunately the
estimates are little affected by the choice.
In panel B of Table 4, we repeat the regressions of panel A, but ask further
if domestic diversification is correlated with higher volatility by including in the
regression the log-share of assets owned by domestic minority owners. The coefficient
to that variable is robustly negative across all the columns. The estimated coefficient
is numerically smaller than the positive coefficient for foreign minority ownership,
but we do not have an interpretation of this finding.
Our interpretation of the findings regarding foreign ownership is that foreign
owners are willing to take more risk in a given domestic firm because they are inter-
nationally diversified. It is reasonable to expect most foreign owners to hold foreign
assets but we can not easily verify this with our data. However, we can examine
this hypothesis as we can identify domestic owners who hold foreign assets, and we
explore a number of specifications which include variables that capture domestic
foreign ownership in Table 5 using volatility of operating revenue. Column (1) of
panel A includes a dummy for whether the domestic firm holds foreign assets. The
point estimate for this variable is large at 0.142 with a very large t-statistic over
12. This provides strong evidence that international diversification, rather than the
actual nationality of owners, allow owners to take more risk in the domestic firm. (It
19

is important to keep in mind here that we use unconsolidated data, which implies
that we do not examine volatility of the consolidated multinational firm; rather, we
show that the domestic operations of multinational firms are more volatile.) In col-
umn (2), we instead use the log of foreign assets and find a coefficient of 0.021 with
high statistical significance—if a domestic firm owns a significant part of a foreign
firm, both firms are more volatile than purely domestic firms in each country. (The
latter statement extrapolate our results a little, because we consider foreign assets in
all countries and do not restrict the foreign asset measure to the countries we study.)
In panel B of Table 5, we use the specification with a dummy for largest owner is
foreign and the results regarding domestic foreign ownership are very similar to what
we found in panel A.
An issue with the AMADEUS data set is that coverage varies by countries,
mainly in the coverage of small firms. We, therefore, in Table 6, consider a battery
of robustness checks involving different samples. In panel A, column (1), we consider
exporting (typically larger) firms only—the coefficients for this, quite different, set of
firms are similar, though slightly smaller. Limited liability firms in column (2) give
results very close to our previous results. Column (3) considers firms that have non-
zero foreign ownership and this column is not directly comparable with the other
columns because we select on our variable of interest; however, we still find that
volatility increases with the share of foreign ownership. Independent companies,
in column (4), are similar to our base sample and firms with a single majority
20

owner, in column (5), again give similar results with slightly lower estimates for the
coefficient to foreign ownership. Excluding public firms, in column (6), results in a
slightly larger coefficient to foreign ownership.
Panel B studies if differences in coverage across countries may impact on our
results. Countries with good coverage only (many small firms), in column (1), give
results very close to the baseline results and poor coverage countries, in column (2),
give virtually similar results. We pick only emerging countries in Central and East-
ern Europe in column (3), and even for this sample our qualitative results hold: the
coefficient to foreign ownership is a little smaller (although similar for value added
as reported in the online appendix), compared to the baseline sample.
In addition to these exercises, we built several random samples which reflect
the countries economic size.20 We repeat our main regressions using three, quite
different, methods of sampling from the data in such a way that no countries are
over-represented. We select three stratified samples, giving the countries weights
in the sampling equal to their relative GDP. The first sample is a 3% stratified
sample where the number of firms from each country is proportional to the GDP
of that country (3% turn out to be number that exhausts the number of firms in
the countries with the poorest coverage) and the second sample is a 25% stratified
sample, where the firms from poor coverage countries are drawn with replacement
(i.e., they may enter the sample more than once). The second method has been used
20We thank an anonymous referee for suggesting this.
21
in the literature. Both these methods ascertains that the results are not caused by
some countries being over-weighted. We suggest a third, propensity score, sampling
method: if Germany has the smallest number of firms, relative to GDP, we sample
the same number of firms, relative to GDP, for all other countries. However, we
sample firms that are most similar to those of Germany in terms of size and assets.
This is done by using propensity scores which have become a popular method to
obtain observationally similar samples, but we believe this particular use of the
method is new. Either of these sampling methods delivers estimated coefficients
to foreign ownership that are very similar to those reported in previous tables as
shown in columns (4)–(6) of panel B of Table 6. Overall, non-random sampling
across countries is unlikely to be the cause of our findings.
3.1.2 Propensity Score Matching
Foreign owned firms differ systematically from other firms; for example, they are
larger, older, and concentrated in certain sectors or countries. However, we can
compare foreign firms to domestic firms, which are observationally similar using
propensity score matching. Propensity score matching addresses a self-selection
problem arising if firms’ foreign-owned status is non-random. In particular, system-
atic correlations between foreign-ownership and other firm characteristics could lead
to biased estimates. The matching procedure controls for this potential selection
bias by creating an appropriate control group of domestic firms. We then repeat
22
our regressions using this, smaller, matched sample. This is particularly relevant in
our case as only a minority of firms have foreign owners. The matching proceeds as
follows.
We match domestic firms with no foreign ownership to the set of firms with
non-zero foreign ownership. The matching is done for the year 2002 and is based
on the estimated “propensity score,” the logistic probability of having some foreign
ownership. We allow the probabilities to depend on firm age, total assets, country-
and industry-dummies at the 2-digit NACE level. The coefficients obtained from
the logistic estimation reveal, not surprisingly, that firm size is the most important
determinant of foreign ownership (with a t-statistic of 175), age is a negative predic-
tor of foreign ownership (with a t-statistic of around 9), and certain countries and
sectors are significantly more likely to attract foreign ownership.
Based on the estimated propensity scores, we select the sample of firms with no
foreign ownership which best match the sample of firms with non-zero foreign own-
ership. We apply nearest neighbor propensity score matching without replacement,
a procedure which matches each firm with foreign ownership to the firm without
foreign ownership that have the closest propensity scores.21 Average age and average
size are similar in the matched samples.22
21We use Stata’s psmatch2 command, version 3.0.0 written by Leuven and Sianesi (2003).22In Figure A.10 in the online appendix, we display the frequency distributions of estimated
propensity scores for firms with non-zero foreign ownership, for the matched firms with no foreignownership, and for the un-matched firms with no foreign ownership. The sample of matched firmswith no foreign ownership displays a distribution of propensity scores that is very similar to that offirms with some foreign ownership indicating that these samples are observationally similar. Themean of log-assets in the sample with foreign ownership is 15.29 and in the matched sample of
23
The results of the volatility regression using the matched sample, in Table 7,
indicate that our findings are not spurious due to certain observable characteristics
being different for foreign owned firms because the results for the matched sample
are very similar to those obtained using the full sample. The average effect of foreign
ownership is estimated to be about 0.1—close to our un-matched estimates. We have
24,879 firms with foreign ownership in the matched sample resulting in a matched
sample of 49,758 firms.
3.1.3 Dynamic Regressions
We explore the dynamic patterns in the data by using a panel of permanent firms
and the specification:
log(SDijct) = µi + µt + µc · µt + µs · µt + αLOFijct (5)
+β log(1 + FMOijct) + γ log(1 +DMOijct) + X′ijctδ + εijct ,
where SDijct is the time-varying volatility measure for firm i in region j in coun-
try c at time t and the foreign ownership variables are time-varying and indexed
similarly. µi is a firm-specific constant which absorbs cross-sectional differences be-
tween plants, µt is a time-fixed effect, and µc · µt and µs · µt are country×year (or
region×year) and industry×year fixed effects. We also include country×year and
firms with no foreign ownership it is 15.33, compared to 13.69 in the sample of unmatched firms.Formally doing the balancing tests, we find that 40 out of 48 variables, that we match on, pass thetest at the 5% level.
24
industry×year dummies—if foreigners invest in countries/regions or sectors that
they correctly anticipate will be volatile over the relevant years, the interacted dum-
mies will absorb the impact of this. Of course, by including these effects we stack
the cards against finding results because some sectors may become more volatile
because they have gained in foreign diversification. If increased foreign ownership
causes more volatile output, we should find a positive coefficient to foreign owner-
ship. We cannot rule out causality in the other direction, but if we found coefficients
of zero in the dynamic regressions, it would hint at no causality from foreign own-
ership.
Table 8 shows the results. The first column in Table 8 includes year dummies
but no other dummies. Domestic cross-ownership is now estimated to be positive—
an estimate which reverses sign when we include dummy variables for country×year
and industry×year. This may reflect that domestic investors prefer certain sectors.
Overall, the first two columns establish that the results found in the cross-sectional
regressions are quite robust to the change in measure and inclusion of country×year
and industry×year fixed effects.
The focus of Table 8 is columns (3)–(9), where firm-specific fixed effects are
included—these fixed effects remove permanent differences between firms and there-
fore remove most of the variation in the data. The results are then driven by changes
over time and reveal if increasing foreign ownership goes hand-in-hand with increas-
ing volatility. It does: the largest foreign owner dummy is significant at the 5% level
25
with a positive sign although the coefficient is smaller than found in the cross-section.
The economic effect is not that big but considering the limited time variation this
coefficient is identified from, this result is about as strong as one could expect. Firm
size remains significant, indicating that volatility becomes smaller as assets grow.
One may worry that the largest-owner-is-foreign dummy variable has limited
time variation and we therefore also show results, in columns (6) and (9), using
overall foreign ownership.23 The dummy for largest foreign ownership takes a value
of about 0.03, significant at about the 5% level. The relation between foreign owner-
ship and volatility therefore survives in the dynamic setting but it is clearly weaker
than in the cross-section. For log foreign ownership the result is similar, although
significance declines when year 2008 is included.
In columns (8) and (9), we include the number of domestic owners, which we
interpret as a measure of ownership concentration. We find a negative effect for
domestic diversification with a t-statistic which is significant at the 10 (near 5)%
level. We find a negative significant coefficient to the number of foreign owners
which we interpret to mean that foreign ownership correlates with volatility but the
correlation gets watered down if foreign ownership is diffuse.
23We found that over a two-year period, about 17% of firms change from domestic to foreignmajority owner, while about 12% changes from foreign to domestic owner, so the worry is somewhatunfounded.
26

3.2 Region-Level Aggregation and Results
3.2.1 Granular Size Distributions
Next, we study if the firm-level correlations survive aggregation. Foreign ownership
can correlate with volatility in aggregate data for many reasons but we want to
examine if aggregate volatility is a direct effect of firm level volatility. Firm-specific
patterns may wash out in aggregated data due to the law of large numbers if firm
size is approximately normally distributed. However, Gabaix (2011) demonstrates
for listed U.S. firms, that the size distribution is “granular;” i.e., follows a power
with law P (S > x) = x−ζ . If ζ is unity, size (S) will follow Zipf’s law but as long as
ζ is numerically less than 2, the size distribution will be heavy tailed with infinite
variance and convergence of averages across firm to the theoretical mean will be
slow. In this case, the features of individual large firms may survive aggregation in
moderate sized samples.
We estimated the parameter −ζ for each of the countries in the sample and
these are reported in panel A of Table 9. We find ζ ≈ 1.3 with little variation across
countries: firm size is robustly granular in our data. If foreign ownership is relatively
large in the largest firms, which directly affect aggregates, we expect to see the
relation between foreign ownership and volatility survive aggregation. Columns (3)-
(5) show that the average amount of foreign ownership is clearly larger in large
firms, while column (6) confirms this using a regression which delivers standard
27
errors, which we do not report, but the relation is significant in all countries.
Granularity can be tested at any level of aggregation and in panel B we report
summaries of regressions at the regional level. These estimates have coefficients
closer to minus unity on average. We do not detail the findings but clearly the
regional results support the granularity hypothesis.
3.2.2 Aggregate Volatility
Figure A.8 in the online appendix compares the volatility of our aggregated data
and the Eurostat data. Both measures are high in 2001 and decline in 2002; the
trend for both measures is downwards although Eurostat volatility has a peak in
2003 which is not found in the AMADEUS aggregate. The volatility of the Eurostat
output data is the lowest, which is intuitive as this is the average over a much larger
set of firms (including the government sector).
We estimate the effect of regional financial integration on aggregate volatility
using:
log(SDAGGjct ) = µj + µt + µc · µt + α log(1 + FI)jct + X′jctδ + εjct , (6)
where SDAGGjct is the time-varying standard deviation of aggregated firm outcome
growth. We use value added, which can be summed over firm without double count-
ing and for which the aggregate over our firms constitute a subset of regional GDP,
28
and operating revenue as an approximation to value added, which is available for
more firms (Gabaix (2011) uses sales). As before, µj is a region-specific constant,
µt is a year-specific constant, and µc ·µt is a country×time dummy. FI is the asset-
weighted average of the total foreign ownership (or majority foreign ownership).
X′jct is the vector of controls.
The left-most three columns of Table 10 display results for the volatility of
AMADEUS aggregated outcomes while the right-most column displays results for
the volatility of regional GDP from Eurostat. Using asset-weighted foreign owner-
ship for financial integration we find a coefficient of 0.784 for value added and 0.468
for operating revenue, with sales in between. These coefficients are all significant at
the 5% level. We evaluate the economic significance of the coefficient by comparing
the implied variation in volatility when financial integration moves from the 10th
percentile to the 90th percentile, evaluated after controlling for other regressors, in
particular the dummy variables, to the actual variation in volatility.24 We find that
the 90%–10% range of integration (after controlling for other regressors) explains
12% of the 90%–10% range in the (raw) volatility data.
For volatility of GDP from Eurostat, we find a coefficient of 0.939, also significant
at the 5% level which is quite similar to the result found for aggregated value added.
The economic significance is that, for the last column, the 90-10 range of financial
24If X90 and X10 denote the 90th and 10th percentile of the residual of log(1 +FI), respectively,m is mean log-volatility, and the regression coefficient is α, we consider the predicted variation tobe exp(m+ α ∗X90) − exp(m+ α ∗X10). The variation needs to be evaluated around the mean oflog-volatility because the exponential function is highly non-linear.
29
integration (after controlling for other regressors) explains about 10% of the 90-
10 range of volatility. The similarity of the Eurostat results to the results using
the AMADEUS aggregate is reassuring because the Eurostat data set contains the
output of all establishments in a region while AMADEUS is a sample of firms.
The main drawback of our aggregation is that there are few firms in some regions
and outliers can therefore potentially distort the results. Another issue is that the
location of a firm’s headquarters may not indicate where most of the firm’s output is
produced. The similarity of the two sets of results indicates that our results are not
spuriously driven by these issues. In the case of Eurostat volatility, we, with high
significance, find lower volatility in large populous regions, likely due to averaging
over a larger number of firms.
4 Conclusion
We uncover a highly significant positive association between firm-level volatility and
foreign ownership. A firm whose largest owner is foreign has about 30% more volatile
valued added. The positive association between foreign ownership and volatility car-
ries over to the regional-level where we show that our measure of financial integration
can explain up to 12% of the variation in aggregate volatility. Our results also hold
in dynamic regressions with firm- and region-fixed effects.
We interpret our results as a reflection of foreign investors being more tolerant
of risk. The positive correlation between foreign ownership and volatility can be
30
a result of foreigners investing in volatile firms or of foreign owners altering the
production structure causing firms to be more volatile. We are not able to pin down
directions of causality in this paper, but both mechanisms require foreign owners to
be more tolerant of domestic firm risk than average domestic owners. To sort out
if the higher risk tolerance is due to the identity of the owner (i.e., the parameters
of his or her utility function) or rather due to international diversification, we test
if it is international diversification, per se, which correlates with higher volatility.
We do this by testing if domestic owners who hold foreign assets also own domestic
firms with relatively high volatility. The results confirm this with high statistical
significance, implying that international diversification allows owners to take more
risk in the domestic firm.
Finally, we interpret the relation between our firm-level results and our “aggre-
gate” level findings (positive correlation between volatility and foreign ownership at
the regional level) using the granularity theory developed by Gabaix (2011). Volatil-
ity of large firms will directly impact the aggregate volatility if such firms are very
large; i.e., if the distribution of firm sizes is granular (heavy tailed). We verify
that the distributions are robustly granular across countries and we further show
that foreign ownership is concentrated among relatively large firms. Together these
findings imply that the firm-level correlations will survive aggregation.
Our results do not imply that financial integration is undesirable because of
higher volatility. Foreigners likely invest in high return-high variance projects which
31

increase growth and volatility can be seen as a side-effect. It is an important avenue
for future research to fill in the many unexplored relations between foreign ownership
and firm-level outcomes.
REFERENCES
Acemoglu, Daron and Fabrizio Zilibotti (1997). “Was Prometheus Unbound by Chance?
Risk, Diversification and Growth.” Journal of Political Economy, 105, 709–51.
Correa, Ricardo and Gustavo Suarez (2009). “Firm Volatility and Banks: Evidence
from U.S. Banking Deregulation.” Finance and Economics Discussion Se-
ries 2009-46. Washington, DC: Federal Reserve Board.
Davis, Steven J., John Haltiwanger, Ron Jarmin, and Javier Miranda (2007). “Volatil-
ity and Dispersion in Business Growth Rates: Publicly Traded versus Privately
Held Firms.” In NBER Macroeconomics Annual 2006, ed. Daron Acemoglu,
Kenneth Rogoff, and Michael Woodford, 107–80. Cambridge, MA: MIT Press.
Faccio, Mara, Maria-Teresa Marchica, and Roberto Mura (2011). “Large Shareholder
Diversification and Corporate Risk-Taking,” Review of Financial Studies, 24,
3601–3641.
Gabaix, Xavier (2011). “The Granular Origins of Aggregate Fluctuations.” Econo-
metrica, 79, 733–772.
Koren, Miklos and Silvana Tenreyro (2007). “Volatility and Development,” Quar-
terly Journal of Economics, 122, 243–87.
Koren, Miklos and Silvana Tenreyro (2013). “Technological Diversification.” Amer-
ican Economic Review, 103, 378–414.
32

Kose, Ayhan M., Eswar Prasad, and Marco E. Terrones (2009). “Does Financial
Globalization Promote Risk Sharing?” Journal of Development Economics,
89, 258–270.
Leuven, Edwin and Barbara Sianesi (2003). “PSMATCH2: Stata Module to Per-
form Full Mahalanobis and Propensity Score Matching, Common Support
Graphing, and Covariate Imbalance Testing.”
http://ideas.repec.org/c/boc/bocode/s432001.html.
Levchenko Andrei A., Romain Ranciere, and Mathias Thoenig (2009). “Growth and
Risk at the Industry-level: The Real Effects of Financial Liberalization.”
Journal of Development Economics, 89, 210–222.
Morgan, Donald, Bertrand Rime, and Philip E. Strahan (2004). “Bank Integration
and State Business Cycles.” Quarterly Journal of Economics, 119, 1555–85.
Obstfeld, Maurice (1994). “Risk-Taking, Global Diversification, and Growth.” Amer-
ican Economic Review, 84, 1310–29.
Schouten, Michael C. and Mathias M. Siems (2010). “The Evolution of Ownership
Disclosure Rules Across Countries,” Journal of Corporate Law Studies, 10,
451–483.
Thesmar, David and Mathias Thoenig (2004). “Financial Market Development and
the Rise in Firm Level Uncertainty.” CEPR Discussion Paper 4761.
33

Panel A: Distribution of Volatility (Operating Revenue)
0
10000
20000
30000
40000
Num
ber o
f Firm
s
−4 −2 0 2Log Volatility, SD
skewness 0.410
kurtosis 3.572
Panel B: Distribution of Foreign Ownership
20
25
30
35
40
45
50
ntage Share of Firms
Zero Foreign
Owne
rship
0
5
10
15
up to 20 21‐40 41‐60 61 ‐ 80 81‐99.99 '100
Percen
with Non
‐Z
Ownership Percentage
Figure 1: Distribution of Firm-Level Volatility and Foreign OwnershipNotes: Volatility is the standard deviation of sales-growth 2002–2008, winsorized at 1 and 99%.Distribution of Foreign Ownership is for the sub-sample of firms with non-zero foreign ownershipin 2002.
34

Table 1: Descriptive Statistics
Panel A: Firm-level data
Firm Outcome Operating Revenue (1,061,359 firms)
Mean Std. Dev. Min Max
Volatility, sd 0.359 0.62 0 4.66Foreign Ownership (%) 1.27 10.8 0 100Foreign Minority Ownership (%) 0.04 1.23 0 75Domestic Minority Ownership (%) 4.09 14 0 96Firm Age (years) 19.9 12.1 1 909Total Assets (million 2005 euros) 3.80 92.1 0.0010 45,809Total Assets, Firms with Non-Zero 31.78 219.5 0.0013 20,194Foreign Ownership (million 2005 euros)
Percent Firms Average Volatility
Out of All Firms (1,047,463 firms)
Non-Zero Foreign Ownership 4.3 0.384Exporters 6.5 0.244Listed 0.05 0.429
Out of Firms with Non-Zero Foreign Ownership(45,545 firms)
100% Foreign Ownership 25.8 0.366Foreign Subsidiaries 17.8 0.381Largest Owner is Foreign 41.3 0.347Foreigners Hold > 50% 51.8 0.397
Panel B: Region-Level data
Mean Std. Dev. Min Max
Time-varying Volatility (AMADEUS), sdt 0.061 0.085 0.00024 0.67Time-varying Volatility (EUROSTAT), sdt 0.013 0.015 0.00022 0.097Financial Integration (%) 7.16 9.49 0 51.5Financial Integration (Majority Owners) (%) 9.24 12.4 0 54.7Financial Integration (Minority Owners) (%) 0.47 1.78 0 18.9Financial Integration (Domestic) (%) 7.15 7.24 0 42.9Total Assets (billion 2005 euros) 15.3 23.1 0.056 147Fraction of Foreign-Owned Assets 0.13 0.15 0 0.69
Notes: The firm-level statistics are reported for the outcome (operating revenue) which gives thelargest sample. “Exporters” are firms reporting non-zero export revenue. “Listed” are publiccompanies listed on stock exchanges. “100% Foreign Ownership” are companies that are fullyowned by foreigners, while “Foreign subsidiaries” are companies that are fully owned by a singleforeign owner. “Largest Owner is Foreign” refers to firms where the owner with the largest stakeis foreign, while “Foreigners Hold > 50%” are companies where foreigners own more than 50%.“Fraction of Foreign-Owned Assets” is the fraction of assets owned by firms who have non-zeroforeign ownership in a given region. Region-level variables are based on aggregated firm outcome(operating revenue), except for Time-varying Volatility (EUROSTAT) which is based on directregion-level data from Eurostat. See online Appendix C for detailed explanations.
35
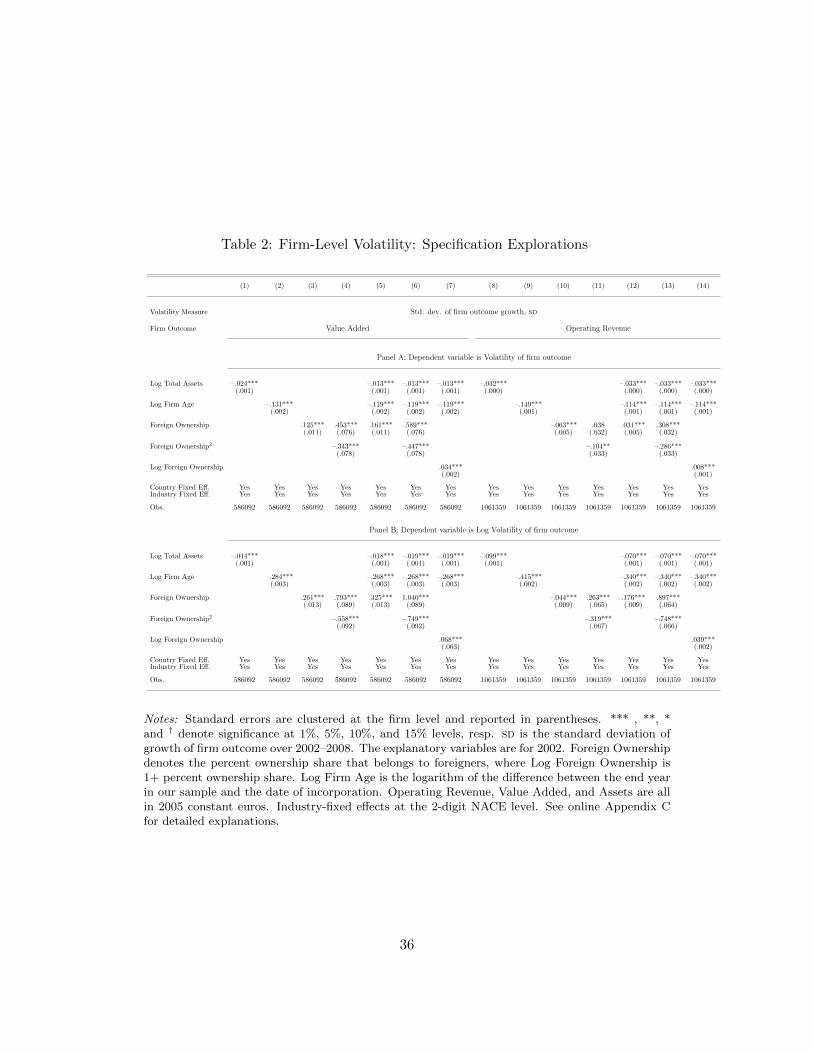
Table 2: Firm-Level Volatility: Specification Explorations
(1) (2) (3) (4) (5) (6) (7) (8) (9) (10) (11) (12) (13) (14)
Volatility Measure Std. dev. of firm outcome growth, sd
Firm Outcome Value Added Operating Revenue
Panel A: Dependent variable is Volatility of firm outcome
Log Total Assets –.024*** –.013*** –.013*** –.013*** –.042*** –.033*** –.033*** –.033***(.001) (.001) (.001) (.001) (.000) (.000) (.000) (.000)
Log Firm Age –.131*** –.119*** –.119*** –.119*** –.149*** –.114*** –.114*** –.114***(.002) (.002) (.002) (.002) (.001) (.001) (.001) (.001)
Foreign Ownership .125*** .453*** .161*** .589*** –.063*** .038 .031*** .308***(.011) (.076) (.011) (.076) (.005) (.032) (.005) (.032)
Foreign Ownership2 –.343*** –.447*** –.104** –.286***(.078) (.078) (.033) (.033)
Log Foreign Ownership .034*** .008***(.002) (.001)
Country Fixed Eff. Yes Yes Yes Yes Yes Yes Yes Yes Yes Yes Yes Yes Yes YesIndustry Fixed Eff. Yes Yes Yes Yes Yes Yes Yes Yes Yes Yes Yes Yes Yes Yes
Obs. 586092 586092 586092 586092 586092 586092 586092 1061359 1061359 1061359 1061359 1061359 1061359 1061359
Panel B: Dependent variable is Log Volatility of firm outcome
Log Total Assets –.044*** –.018*** –.019*** –.019*** –.099*** –.070*** –.070*** –.070***(.001) (.001) (.001) (.001) (.001) (.001) (.001) (.001)
Log Firm Age –.284*** –.268*** –.268*** –.268*** –.415*** –.340*** –.340*** –.340***(.003) (.003) (.003) (.003) (.002) (.002) (.002) (.002)
Foreign Ownership .261*** .793*** .325*** 1.040*** –.044*** .263*** .176*** .897***(.013) (.089) (.013) (.089) (.009) (.065) (.009) (.064)
Foreign Ownership2 –.558*** –.749*** –.319*** –.748***(.092) (.092) (.067) (.066)
Log Foreign Ownership .068*** .039***(.003) (.002)
Country Fixed Eff. Yes Yes Yes Yes Yes Yes Yes Yes Yes Yes Yes Yes Yes YesIndustry Fixed Eff. Yes Yes Yes Yes Yes Yes Yes Yes Yes Yes Yes Yes Yes Yes
Obs. 586092 586092 586092 586092 586092 586092 586092 1061359 1061359 1061359 1061359 1061359 1061359 1061359
Notes: Standard errors are clustered at the firm level and reported in parentheses. *** , **, *and † denote significance at 1%, 5%, 10%, and 15% levels, resp. sd is the standard deviation ofgrowth of firm outcome over 2002–2008. The explanatory variables are for 2002. Foreign Ownershipdenotes the percent ownership share that belongs to foreigners, where Log Foreign Ownership is1+ percent ownership share. Log Firm Age is the logarithm of the difference between the end yearin our sample and the date of incorporation. Operating Revenue, Value Added, and Assets are allin 2005 constant euros. Industry-fixed effects at the 2-digit NACE level. See online Appendix Cfor detailed explanations.
36
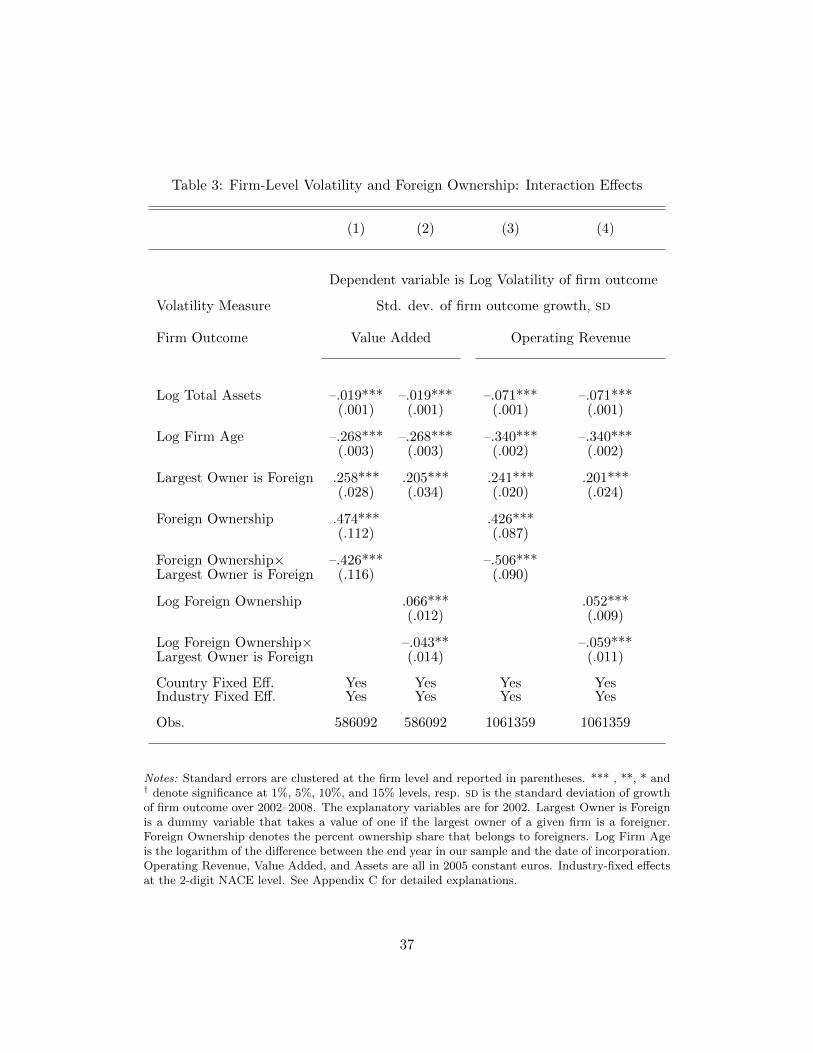
Table 3: Firm-Level Volatility and Foreign Ownership: Interaction Effects
(1) (2) (3) (4)
Dependent variable is Log Volatility of firm outcome
Volatility Measure Std. dev. of firm outcome growth, sd
Firm Outcome Value Added Operating Revenue
Log Total Assets –.019*** –.019*** –.071*** –.071***(.001) (.001) (.001) (.001)
Log Firm Age –.268*** –.268*** –.340*** –.340***(.003) (.003) (.002) (.002)
Largest Owner is Foreign .258*** .205*** .241*** .201***(.028) (.034) (.020) (.024)
Foreign Ownership .474*** .426***(.112) (.087)
Foreign Ownership× –.426*** –.506***Largest Owner is Foreign (.116) (.090)
Log Foreign Ownership .066*** .052***(.012) (.009)
Log Foreign Ownership× –.043** –.059***Largest Owner is Foreign (.014) (.011)
Country Fixed Eff. Yes Yes Yes YesIndustry Fixed Eff. Yes Yes Yes Yes
Obs. 586092 586092 1061359 1061359
Notes: Standard errors are clustered at the firm level and reported in parentheses. *** , **, * and† denote significance at 1%, 5%, 10%, and 15% levels, resp. sd is the standard deviation of growthof firm outcome over 2002–2008. The explanatory variables are for 2002. Largest Owner is Foreignis a dummy variable that takes a value of one if the largest owner of a given firm is a foreigner.Foreign Ownership denotes the percent ownership share that belongs to foreigners. Log Firm Ageis the logarithm of the difference between the end year in our sample and the date of incorporation.Operating Revenue, Value Added, and Assets are all in 2005 constant euros. Industry-fixed effectsat the 2-digit NACE level. See Appendix C for detailed explanations.
37

Table 4: Firm-Level Volatility and Foreign Ownership
Sample: All firms
(1) (2) (3) (4) (5) (6)
Dependent variable: Log Volatility of firm outcome
Volatility Measure Std. dev. of firm outcome growth, sd
Standard Errors Clustered Clustered Clustered Clustered Bootstrap Clustered
Handling Outliers Winsorized Winsorized Winsorized Winsorized Winsorized Trimmed
Firm Outcome Value Operating Sales Employment Operating OperatingAdded Revenue Revenue Revenue
Panel A: Effects of Foreign Ownership
Log Foreign Ownership .068*** .039*** .049*** .005** .039*** .041***(.003) (.002) (.002) (.002) (.002) (.002)
Log Total Assets –.019*** –.070*** –.070*** –.181*** –.070*** –.068***(.001) (.001) (.001) (.001) (.001) (.001)
Log Firm Age –.268*** –.340*** –.353*** –.296*** –.340*** –.337***(.003) (.002) (.003) (.002) (.002) (.002)
Panel B: Effects of Majority/Minority Foreign Ownership
Largest Owner is Foreign .287*** .166*** .205*** .018** .166*** .175***(.011) (.008) (.010) (.007) (.008) (.008)
Log Foreign Minority Ownership .045*** .039*** .039*** –.006 .039*** .046***(.010) (.007) (.008) (.008) (.007) (.008)
Log Domestic Minority Ownership –.015*** –.021*** –.009*** –.013*** –.021*** –.020***(.001) (.001) (.001) (.001) (.001) (.001)
Log Total Assets –.018*** –.070*** –.070*** –.180*** –.070*** –.067***(.001) (.001) (.001) (.001) (.001) (.001)
Log Firm Age –.267*** –.339*** –.353*** –.295*** –.339*** –.336***(.003) (.002) (.003) (.002) (.002) (.002)
Country Fixed Eff. yes yes yes yes yes yesIndustry Fixed Eff. yes yes yes yes yes yes
Firms 586092 1061359 763370 628476 1061359 1038815
Notes: Standard errors are clustered at the firm level (column 1-4, 6) or bootstrapped (column 5)and reported in parentheses. *** , **, * and † denote significance at 1%, 5%, 10%, and 15% levels,resp. Outliers in terms of volatility estimates and Total Assets are handled by winsorizing the data(“Winsorize”) or dropping the outliers (“Trimmed”). sd is the standard deviation of growth of firmoutcome over 2002–2008. The explanatory variables are for 2002. Log Foreign Ownership denotesthe logarithm of 1 + percent ownership share that belongs to foreigners. Largest Owner is Foreignis a dummy variable that takes a value of one if the largest owner of a given firm is a foreigner. LogForeign Minority Ownership denotes the logarithm of 1 + the remaining percent ownership sharebelonging to foreigners after the share of the largest owner is excluded; Log Domestic MinorityOwnership is calculated similarly. Log Firm Age is the logarithm of the difference between the endyear in our sample and the date of incorporation. Sales, Operating Revenue, Value Added, andAssets are all in 2005 constant euros. For firms in Denmark, Ireland, Great Britain, and Norway,sales are not available. Employment is the number of full-time employees. Industry-fixed effects atthe 2-digit NACE level. See Appendix C for detailed explanations.
38
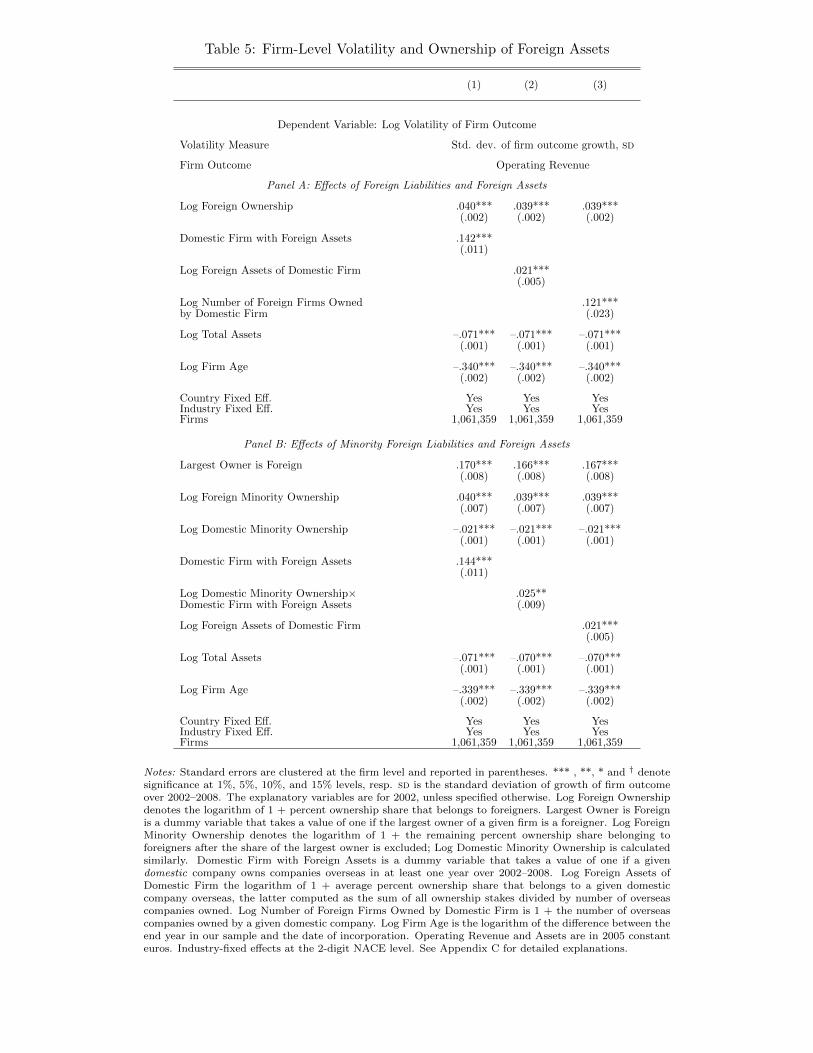
Table 5: Firm-Level Volatility and Ownership of Foreign Assets
(1) (2) (3)
Dependent Variable: Log Volatility of Firm Outcome
Volatility Measure Std. dev. of firm outcome growth, sd
Firm Outcome Operating Revenue
Panel A: Effects of Foreign Liabilities and Foreign Assets
Log Foreign Ownership .040*** .039*** .039***(.002) (.002) (.002)
Domestic Firm with Foreign Assets .142***(.011)
Log Foreign Assets of Domestic Firm .021***(.005)
Log Number of Foreign Firms Owned .121***by Domestic Firm (.023)
Log Total Assets –.071*** –.071*** –.071***(.001) (.001) (.001)
Log Firm Age –.340*** –.340*** –.340***(.002) (.002) (.002)
Country Fixed Eff. Yes Yes YesIndustry Fixed Eff. Yes Yes YesFirms 1,061,359 1,061,359 1,061,359
Panel B: Effects of Minority Foreign Liabilities and Foreign Assets
Largest Owner is Foreign .170*** .166*** .167***(.008) (.008) (.008)
Log Foreign Minority Ownership .040*** .039*** .039***(.007) (.007) (.007)
Log Domestic Minority Ownership –.021*** –.021*** –.021***(.001) (.001) (.001)
Domestic Firm with Foreign Assets .144***(.011)
Log Domestic Minority Ownership× .025**Domestic Firm with Foreign Assets (.009)
Log Foreign Assets of Domestic Firm .021***(.005)
Log Total Assets –.071*** –.070*** –.070***(.001) (.001) (.001)
Log Firm Age –.339*** –.339*** –.339***(.002) (.002) (.002)
Country Fixed Eff. Yes Yes YesIndustry Fixed Eff. Yes Yes YesFirms 1,061,359 1,061,359 1,061,359
Notes: Standard errors are clustered at the firm level and reported in parentheses. *** , **, * and † denotesignificance at 1%, 5%, 10%, and 15% levels, resp. sd is the standard deviation of growth of firm outcomeover 2002–2008. The explanatory variables are for 2002, unless specified otherwise. Log Foreign Ownershipdenotes the logarithm of 1 + percent ownership share that belongs to foreigners. Largest Owner is Foreignis a dummy variable that takes a value of one if the largest owner of a given firm is a foreigner. Log ForeignMinority Ownership denotes the logarithm of 1 + the remaining percent ownership share belonging toforeigners after the share of the largest owner is excluded; Log Domestic Minority Ownership is calculatedsimilarly. Domestic Firm with Foreign Assets is a dummy variable that takes a value of one if a givendomestic company owns companies overseas in at least one year over 2002–2008. Log Foreign Assets ofDomestic Firm the logarithm of 1 + average percent ownership share that belongs to a given domesticcompany overseas, the latter computed as the sum of all ownership stakes divided by number of overseascompanies owned. Log Number of Foreign Firms Owned by Domestic Firm is 1 + the number of overseascompanies owned by a given domestic company. Log Firm Age is the logarithm of the difference between theend year in our sample and the date of incorporation. Operating Revenue and Assets are in 2005 constanteuros. Industry-fixed effects at the 2-digit NACE level. See Appendix C for detailed explanations.
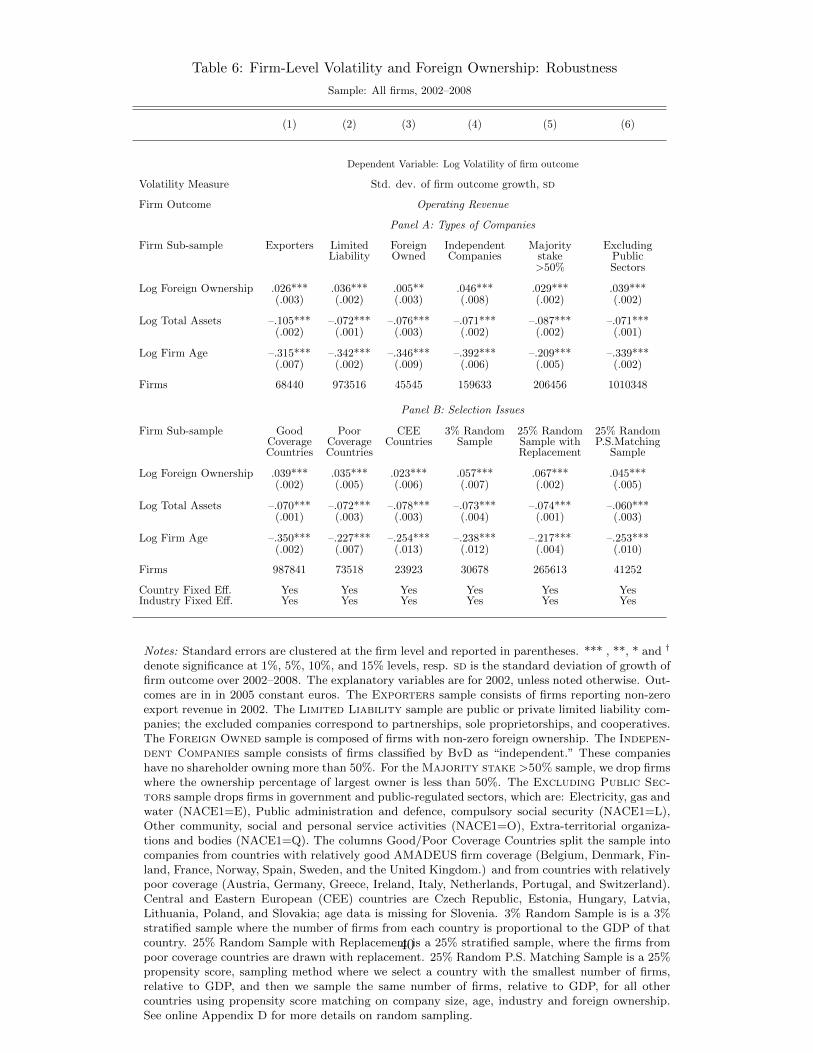
Table 6: Firm-Level Volatility and Foreign Ownership: Robustness
Sample: All firms, 2002–2008
(1) (2) (3) (4) (5) (6)
Dependent Variable: Log Volatility of firm outcome
Volatility Measure Std. dev. of firm outcome growth, sd
Firm Outcome Operating Revenue
Panel A: Types of Companies
Firm Sub-sample Exporters Limited Foreign Independent Majority ExcludingLiability Owned Companies stake Public
>50% Sectors
Log Foreign Ownership .026*** .036*** .005** .046*** .029*** .039***(.003) (.002) (.003) (.008) (.002) (.002)
Log Total Assets –.105*** –.072*** –.076*** –.071*** –.087*** –.071***(.002) (.001) (.003) (.002) (.002) (.001)
Log Firm Age –.315*** –.342*** –.346*** –.392*** –.209*** –.339***(.007) (.002) (.009) (.006) (.005) (.002)
Firms 68440 973516 45545 159633 206456 1010348
Panel B: Selection Issues
Firm Sub-sample Good Poor CEE 3% Random 25% Random 25% RandomCoverage Coverage Countries Sample Sample with P.S.MatchingCountries Countries Replacement Sample
Log Foreign Ownership .039*** .035*** .023*** .057*** .067*** .045***(.002) (.005) (.006) (.007) (.002) (.005)
Log Total Assets –.070*** –.072*** –.078*** –.073*** –.074*** –.060***(.001) (.003) (.003) (.004) (.001) (.003)
Log Firm Age –.350*** –.227*** –.254*** –.238*** –.217*** –.253***(.002) (.007) (.013) (.012) (.004) (.010)
Firms 987841 73518 23923 30678 265613 41252
Country Fixed Eff. Yes Yes Yes Yes Yes YesIndustry Fixed Eff. Yes Yes Yes Yes Yes Yes
Notes: Standard errors are clustered at the firm level and reported in parentheses. *** , **, * and †
denote significance at 1%, 5%, 10%, and 15% levels, resp. sd is the standard deviation of growth offirm outcome over 2002–2008. The explanatory variables are for 2002, unless noted otherwise. Out-comes are in in 2005 constant euros. The Exporters sample consists of firms reporting non-zeroexport revenue in 2002. The Limited Liability sample are public or private limited liability com-panies; the excluded companies correspond to partnerships, sole proprietorships, and cooperatives.The Foreign Owned sample is composed of firms with non-zero foreign ownership. The Indepen-dent Companies sample consists of firms classified by BvD as “independent.” These companieshave no shareholder owning more than 50%. For the Majority stake >50% sample, we drop firmswhere the ownership percentage of largest owner is less than 50%. The Excluding Public Sec-tors sample drops firms in government and public-regulated sectors, which are: Electricity, gas andwater (NACE1=E), Public administration and defence, compulsory social security (NACE1=L),Other community, social and personal service activities (NACE1=O), Extra-territorial organiza-tions and bodies (NACE1=Q). The columns Good/Poor Coverage Countries split the sample intocompanies from countries with relatively good AMADEUS firm coverage (Belgium, Denmark, Fin-land, France, Norway, Spain, Sweden, and the United Kingdom.) and from countries with relativelypoor coverage (Austria, Germany, Greece, Ireland, Italy, Netherlands, Portugal, and Switzerland).Central and Eastern European (CEE) countries are Czech Republic, Estonia, Hungary, Latvia,Lithuania, Poland, and Slovakia; age data is missing for Slovenia. 3% Random Sample is is a 3%stratified sample where the number of firms from each country is proportional to the GDP of thatcountry. 25% Random Sample with Replacement is a 25% stratified sample, where the firms frompoor coverage countries are drawn with replacement. 25% Random P.S. Matching Sample is a 25%propensity score, sampling method where we select a country with the smallest number of firms,relative to GDP, and then we sample the same number of firms, relative to GDP, for all othercountries using propensity score matching on company size, age, industry and foreign ownership.See online Appendix D for more details on random sampling.
40
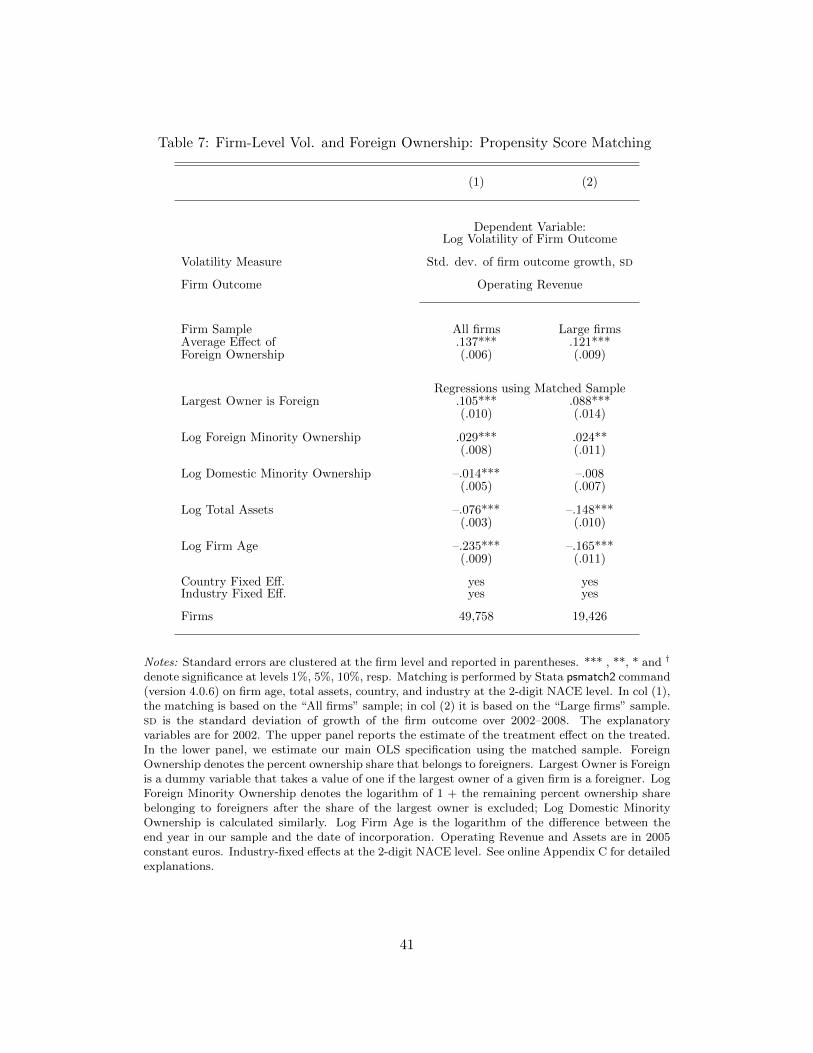
Table 7: Firm-Level Vol. and Foreign Ownership: Propensity Score Matching
(1) (2)
Dependent Variable:Log Volatility of Firm Outcome
Volatility Measure Std. dev. of firm outcome growth, sd
Firm Outcome Operating Revenue
Firm Sample All firms Large firmsAverage Effect of .137*** .121***Foreign Ownership (.006) (.009)
Regressions using Matched SampleLargest Owner is Foreign .105*** .088***
(.010) (.014)
Log Foreign Minority Ownership .029*** .024**(.008) (.011)
Log Domestic Minority Ownership –.014*** –.008(.005) (.007)
Log Total Assets –.076*** –.148***(.003) (.010)
Log Firm Age –.235*** –.165***(.009) (.011)
Country Fixed Eff. yes yesIndustry Fixed Eff. yes yes
Firms 49,758 19,426
Notes: Standard errors are clustered at the firm level and reported in parentheses. *** , **, * and †
denote significance at levels 1%, 5%, 10%, resp. Matching is performed by Stata psmatch2 command(version 4.0.6) on firm age, total assets, country, and industry at the 2-digit NACE level. In col (1),the matching is based on the “All firms” sample; in col (2) it is based on the “Large firms” sample.sd is the standard deviation of growth of the firm outcome over 2002–2008. The explanatoryvariables are for 2002. The upper panel reports the estimate of the treatment effect on the treated.In the lower panel, we estimate our main OLS specification using the matched sample. ForeignOwnership denotes the percent ownership share that belongs to foreigners. Largest Owner is Foreignis a dummy variable that takes a value of one if the largest owner of a given firm is a foreigner. LogForeign Minority Ownership denotes the logarithm of 1 + the remaining percent ownership sharebelonging to foreigners after the share of the largest owner is excluded; Log Domestic MinorityOwnership is calculated similarly. Log Firm Age is the logarithm of the difference between theend year in our sample and the date of incorporation. Operating Revenue and Assets are in 2005constant euros. Industry-fixed effects at the 2-digit NACE level. See online Appendix C for detailedexplanations.
41
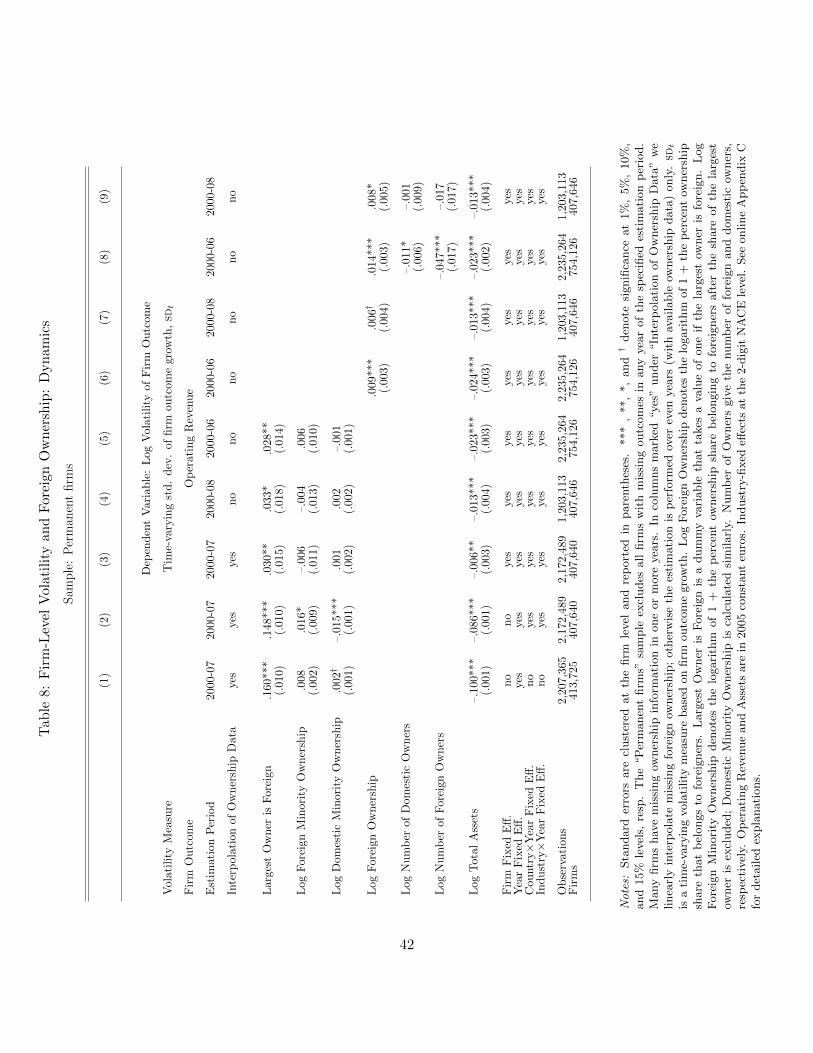
Tab
le8:
Fir
m-L
evel
Vol
atil
ity
and
For
eign
Ow
ner
ship
:D
yn
amic
s
Sam
ple
:P
erm
anen
tfi
rms
(1)
(2)
(3)
(4)
(5)
(6)
(7)
(8)
(9)
Dep
end
ent
Var
iab
le:
Log
Vol
atil
ity
ofF
irm
Ou
tcom
e
Vol
atil
ity
Mea
sure
Tim
e-va
ryin
gst
d.
dev
.of
firm
outc
ome
gro
wth
,sd
t
Fir
mO
utc
ome
Op
erat
ing
Rev
enu
e
Est
imat
ion
Per
iod
2000
-07
2000
-07
2000
-07
2000
-08
2000
-06
2000
-06
200
0-08
2000
-06
2000
-08
Inte
rpol
atio
nof
Ow
ner
ship
Dat
aye
sye
sye
sn
on
on
on
on
on
o
Larg
est
Ow
ner
isF
ore
ign
.160
***
.148
***
.030
**.0
33*
.028
**(.
010)
(.01
0)(.
015)
(.01
8)(.
014)
Log
For
eign
Min
ori
tyO
wn
ersh
ip.0
08
.016
*–.
006
–.00
4.0
06(.
002)
(.00
9)(.
011)
(.01
3)(.
010)
Log
Dom
esti
cM
inori
tyO
wn
ersh
ip.0
02†
–.01
5***
.001
.002
–.00
1(.
001)
(.00
1)(.
002)
(.00
2)(.
001)
Log
For
eign
Ow
ner
ship
.009
***
.006†
.014
***
.008
*(.
003)
(.004
)(.
003)
(.005
)
Log
Nu
mb
erof
Dom
esti
cO
wn
ers
–.01
1*–.
001
(.00
6)(.
009
)
Log
Nu
mb
erof
Fore
ign
Ow
ner
s–.
047
***
–.0
17(.
017)
(.017
)
Log
Tot
alA
sset
s–.1
00**
*–.
086*
**–.
006**
–.01
3***
–.02
3***
–.02
4***
–.013
***
–.0
23**
*–.
013**
*(.
001)
(.00
1)(.
003)
(.00
4)(.
003)
(.00
3)
(.00
4)(.
002
)(.
004)
Fir
mF
ixed
Eff
.n
on
oye
sye
sye
syes
yes
yes
yes
Yea
rF
ixed
Eff
.ye
syes
yes
yes
yes
yes
yes
yes
yes
Cou
ntr
y×
Yea
rF
ixed
Eff
.n
oye
sye
sye
syes
yes
yes
yes
yes
Ind
ust
ry×
Yea
rF
ixed
Eff
.n
oye
sye
sye
sye
sye
syes
yes
yes
Ob
serv
ati
ons
2,2
07,3
652,
172,
489
2,17
2,48
91,
203,
113
2,23
5,26
42,
235,
264
1,2
03,
113
2,235
,264
1,203
,113
Fir
ms
413,7
2540
7,64
040
7,64
040
7,64
675
4,12
675
4,12
640
7,646
754
,126
407
,646
Notes:
Sta
ndard
erro
rsare
clust
ered
at
the
firm
level
and
rep
ort
edin
pare
nth
eses
.***
,**,
*,
and†
den
ote
signifi
cance
at
1%
,5%
,10%
,and
15%
level
s,re
sp.
The
“P
erm
anen
tfirm
s”sa
mple
excl
udes
all
firm
sw
ith
mis
sing
outc
om
esin
any
yea
rof
the
spec
ified
esti
mati
on
per
iod.
Many
firm
shav
em
issi
ng
owner
ship
info
rmati
on
inone
or
more
yea
rs.
Inco
lum
ns
mark
ed“yes
”under
“In
terp
ola
tion
of
Ow
ner
ship
Data
”w
elinea
rly
inte
rpola
tem
issi
ng
fore
ign
owner
ship
;oth
erw
ise
the
esti
mati
on
isp
erfo
rmed
over
even
yea
rs(w
ith
available
owner
ship
data
)only
.sd
t
isa
tim
e-va
ryin
gvola
tility
mea
sure
base
don
firm
outc
om
egro
wth
.L
og
Fore
ign
Ow
ner
ship
den
ote
sth
elo
gari
thm
of
1+
the
per
cent
owner
ship
share
that
bel
ongs
tofo
reig
ner
s.L
arg
est
Ow
ner
isF
ore
ign
isa
dum
my
vari
able
that
takes
ava
lue
of
one
ifth
ela
rges
tow
ner
isfo
reig
n.
Log
Fore
ign
Min
ori
tyO
wner
ship
den
ote
sth
elo
gari
thm
of
1+
the
per
cent
owner
ship
share
bel
ongin
gto
fore
igner
saft
erth
esh
are
of
the
larg
est
owner
isex
cluded
;D
om
esti
cM
inori
tyO
wner
ship
isca
lcula
ted
sim
ilarl
y.N
um
ber
of
Ow
ner
sgiv
eth
enum
ber
of
fore
ign
and
dom
esti
cow
ner
s,re
spec
tivel
y.O
per
ati
ng
Rev
enue
and
Ass
ets
are
in2005
const
ant
euro
s.In
dust
ry-fi
xed
effec
tsat
the
2-d
igit
NA
CE
level
.See
online
App
endix
Cfo
rdet
ailed
expla
nati
ons.
42

Table 9: Granularity of Firms
(1) (2) (3) (4) (5) (6) (7)
Outcome for Company Size Sales
Panel A: Granularity at Country Level
Country Power Law Average % Average % Average % Regression Coefficient TotalCoefficient of Foreign of Foreign of Foreign Log Foreign Ownership Number of
Ownership Ownership Ownership - Log Size Companies(Top 200 Comp.) (Top 200 Comp.) (Rest of Comp.) (Rest Top 25%) (All Comp.)
Austria –1.25 24.7 28.4 32.7 .134*** 1404Belgium –1.29 27.1 1.2*** 4.4*** .076*** 65446Germany –1.46 19.9 7.0*** 13.6*** .076*** 24402Denmark –1.51 31.5 3.1*** 9.4*** .105*** 25508Spain –1.21 32.6 0.8*** 2.4*** .048*** 373950Finland –1.19 15.2 0.8*** 2.6*** .050*** 43949France –1.38 14.7 0.7*** 2.3*** .050*** 488009Great Britain –1.41 7.4 3.4*** 9.5 .081*** 199757Greece –1.34 28.2 1.6*** 4.4*** .130*** 18149Ireland –1.09 16.1 4.6*** 13.5† .122*** 6626Italy –1.52 21.1 0.3*** 0.8*** .025*** 257887Netherlands –1.38 20.2 9.1*** 16.7* .143*** 3153Norway –1.39 16.6 1.2*** 3.4*** .052*** 106269Portugal –1.32 18.4 0.6*** 2.0*** .045*** 42673Sweden –1.24 13.2 0.47*** 1.51*** .031*** 136517
Panel B: Granularity at Region Level
Descriptive Statistics of the Power Law Coefficient from the Log Rank - Log Size RegressionEstimated over Top 200 Companies in a Region
Regions in Country No. Regions Mean Median St.Dev. St.Dev./√N Min Max
Austria 2 –1.00 –1.00 0.14 0.10 –1.10 –0.90Belgium 11 –1.18 –1.14 0.23 0.07 –1.74 –0.94Germany 31 –0.95 –0.95 0.16 0.03 –1.27 –0.65Denmark 5 –1.21 –1.23 0.24 0.11 –1.44 –0.83Spain 15 –1.40 –1.31 0.23 0.06 –1.75 –1.15Finland 5 –1.08 –1.13 0.15 0.07 –1.23 –0.84France 24 –1.34 –1.33 0.16 0.03 –1.59 –0.97Great Britain 35 –1.00 –1.03 0.18 0.03 –1.28 –0.60Greece 10 –1.41 –1.40 0.13 0.04 –1.59 –1.23Ireland 2 –0.93 –0.93 0.20 0.14 –1.07 –0.78Italy 21 –1.33 –1.32 0.20 0.04 –1.76 –0.90Netherlands 4 –1.00 –1.00 0.10 0.05 –1.11 –0.89Norway 7 –1.35 –1.35 0.19 0.07 –1.60 –1.07Portugal 7 –1.24 –1.24 0.22 0.08 –1.59 –0.93Sweden 8 –1.19 –1.20 0.12 0.04 –1.34 –1.00
All Regions 187 –1.17 –1.17 0.25 0.02 –1.76 –0.60
Notes: The table presents the estimates of the the Power Law Coefficient (Gabaix 2009) for top 200companies by size in a country (panel B) and statistics of the coefficient for top 200 companies ina region, aggregated by country (panel B). The measure of firm size is firm Operating Revenue inconstant 2005 Euros. We include countries with at least 500 companies with available outcome. ThePower Law Coefficient is the estimate of the slope in the regression the following form: ln(i− s) =constant + ς̂ ln S(i) + error, where i is the firm’s rank in terms of the measure of firm size S andthe largest firm has the rank 1. The optimal shift s to reduce the small-sample bias is set to 0.5.The Average % of Foreign Ownership is the percent ownership share that belongs to foreignersin top 200 companies for which the power law regression is estimated (column 3), the rest of thecompanies in the country (column 4) and the rest of the companies in the top quartile (25%) ofthe distribution of firm sizes (column 5). *** , **, * in columns 4 and 5 denote the cases whenthe percentage of foreign ownership in this sub-group is significantly lower than the percentage offoreign ownership for top 200 firms at 1%, 5%, 10% levels, resp. Column 6 reports the coefficientfrom the regression of the logarithm of 1 + the percent ownership share that belongs to foreignerson the logarithm of firm size using all firms in the country; *** , **, * denote significance at 1%,5%, 10% levels, resp. Column 7 reports the sample total number of firms in the country in oursample.
43

Table 10: Regional Volatility and Financial Integration: Aggregation
(1) (2) (3) (4) (5)
Dependent Variable: Log Volatility ofAggregated Firm Outcome or Regional GDP
Volatility Measure Time-varying std. dev. of regional outcome growth, sdt
Aggregated Firm Outcome Value Operating OperatingAdded Revenue Revenue
Regional Outcome Regional GDPper capita
Log Financial Integration .784** .468** .623** .939**(.379) (.191) (.297) (.428)
Log Region Total Assets –4.09*** –.637 –3.807(1.20) (1.04) (1.70)
Log Population –.961(5.23)
Region Fixed Eff. yes yes yes yesYear Fixed Eff. yes yes yes yesCountry×Year Fixed Eff. yes yes yes yes
Observations 150 221 150 140
Notes: Standard errors are clustered at the region level and reported in parentheses. *** , **, *,and † denote significance at 1%, 5%, 10%, and 15%, resp. The panel regression is estimated over2000–2008. sdt is a time-varying volatility measure based on firm outcome growth. For regressionswith volatility of Aggregated Firm Outcome we use regions with at least 50 firms; for regressionswith volatility of Eurostat GDP we use regions with at least 1,000 firms. Log Financial Integrationis the logarithm of 1 + the weighted average of firm-level foreign ownership percentages within agiven region using firm assets as the weights. Region Total Assets is the sum of total assets offirms within a given region. Population is average annual population of the region from Eurostat.Firm-level Value Added, Operating Revenue, and Assets are all in 2005 constant euros. See onlineAppendix C for detailed explanations. Population data are from Eurostat.
44