de-risking strategies for alternative transport fuel and ... wyman - de-risking alternative...
TRANSCRIPT

© Oliver Wyman
De-risking Strategies for Alternative Transport Fuel and Power-Train Infrastructure Development 30 November 2012
Alexander Franke, Partner
Richard Smith-Bingham, Program Director
CONFIDENTIALITY
Our clients’ industries are extremely competitive. The confidentiality of companies' plans and data is obviously critical. will
protect the confidentiality of all such client information.
Similarly, management consulting is a competitive business. We view our approaches and insights as proprietary and therefore
look to our clients to protect 's interests in our presentations, methodologies and analytical techniques. Under no circumstances
should this material be shared with any third party without the written consent of .
Copyright ©

2 © Oliver Wyman 2
Agenda
1
2
3
Alternative fuel infrastructure investment context
Case studies
Elements to enable and de-risk infrastructure development

Alternative fuel infrastructure
investment context
1
4 © Oliver Wyman 4
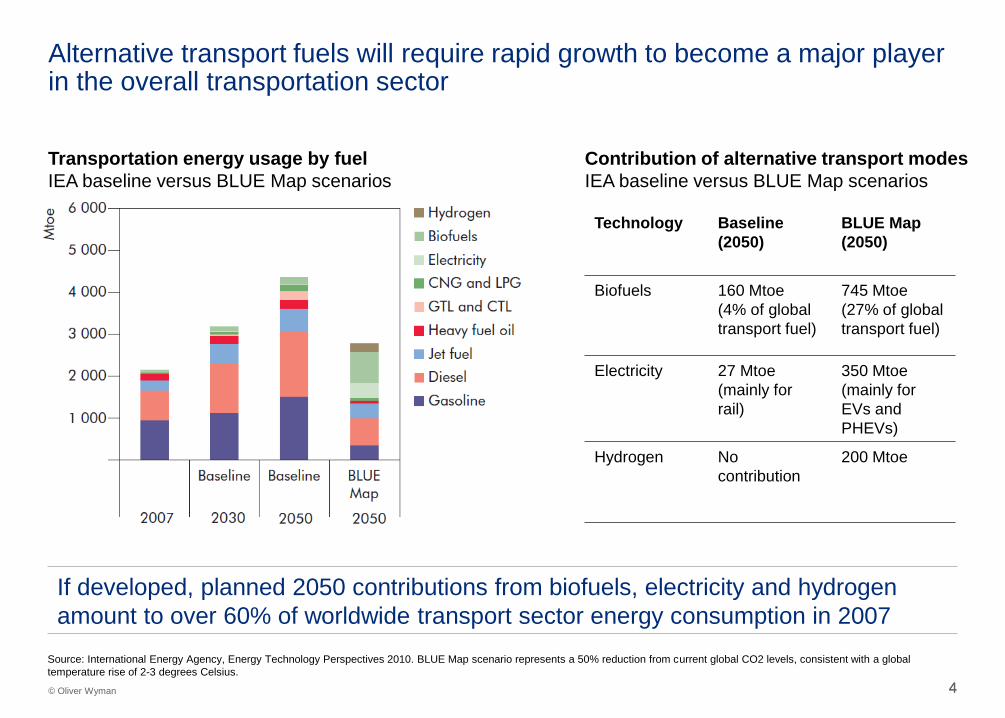
Alternative transport fuels will require rapid growth to become a major player in the overall transportation sector
Transportation energy usage by fuel
IEA baseline versus BLUE Map scenarios
Source: International Energy Agency, Energy Technology Perspectives 2010. BLUE Map scenario represents a 50% reduction from current global CO2 levels, consistent with a global
temperature rise of 2-3 degrees Celsius.
If developed, planned 2050 contributions from biofuels, electricity and hydrogen
amount to over 60% of worldwide transport sector energy consumption in 2007
Contribution of alternative transport modes
IEA baseline versus BLUE Map scenarios
Technology Baseline
(2050)
BLUE Map
(2050)
Biofuels 160 Mtoe
(4% of global
transport fuel)
745 Mtoe
(27% of global
transport fuel)
Electricity 27 Mtoe
(mainly for
rail)
350 Mtoe
(mainly for
EVs and
PHEVs)
Hydrogen No
contribution
200 Mtoe
5 © Oliver Wyman 5
The drive for increased use of alternative fuels needs to factor in changing dynamics in global fossil fuel markets
-3
-2
-1
0
1
2
2009 2014 2019 2024 2029 2034
US natural gas net exports2
In trillion cubic feet
Net Exports (incl. LNG) Net LNG exports
Sources: IEA, Golden Rules for a Golden Age of Gas, 2012; IEA World Energy Outlook, 2012; Bloomberg; EIA; Oliver Wyman Analysis
1. Bloomberg Consensus forecasts as of 11/28/2011 and of 11/28/2012 for NYMEX WTI; 2. EIA, Annual Energy Outlook 2012
50
70
90
110
130
2012 2013 2014 2015 2016
WTI price forecasts1
USD per barrel
2011 estimate 2012 estimate
• Oil production boom
– 23% increase in output since 2005
– Likely to surpass Saudi Arabia as the
world’s largest oil producer by 2020
– Increased production has led to lower
forecasted prices for WTI Crude
• Natural gas production boom
– 27% increase in natural gas production
since 2005 due to shale gas development
– Expectation of a further 11% growth by
2020 resulting in net exporter status
Lower forecasted prices for crude and products will impact negatively on the
attractiveness of alternative fuels in the absence of a price on carbon
Example: United States
6 6 © Oliver Wyman
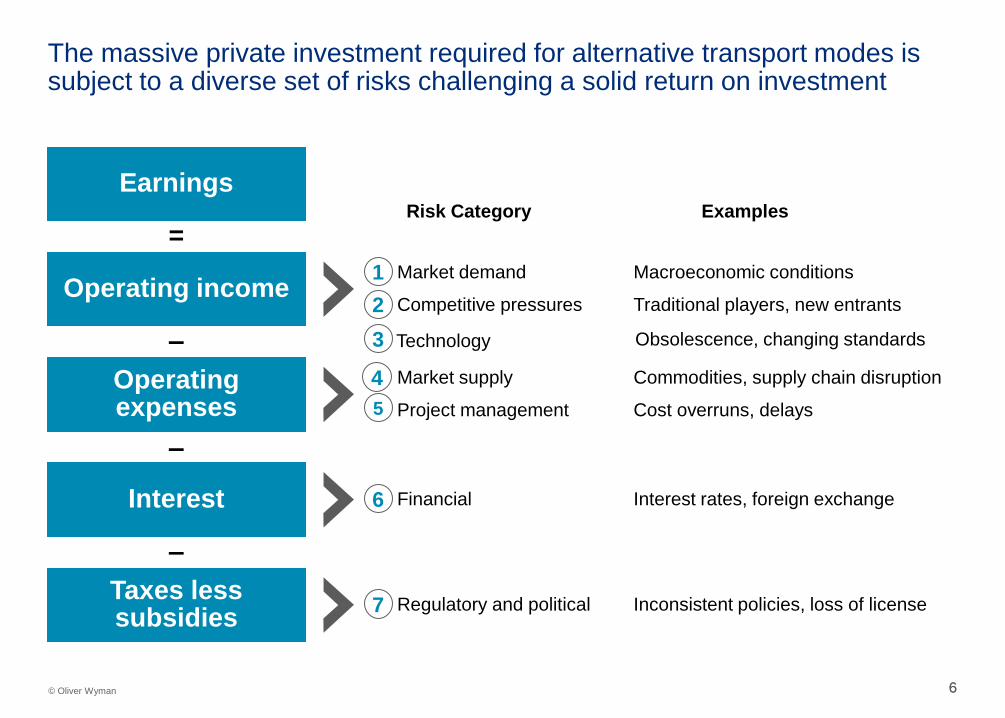
The massive private investment required for alternative transport modes is subject to a diverse set of risks challenging a solid return on investment
Earnings
• Market demand
• Competitive pressures Operating income
Operating expenses
Interest
Taxes less subsidies
–
–
–
=
• Market supply
• Project management
• Financial
• Regulatory and political
1
2
3
4
5
6
7
Risk Category Examples
Macroeconomic conditions
Traditional players, new entrants
Commodities, supply chain disruption
Cost overruns, delays
Interest rates, foreign exchange
Inconsistent policies, loss of license
Technology Obsolescence, changing standards

Case studies 2
8 8 © Oliver Wyman
Aviation biofuels in the
Midwestern United States
Electric vehicle charging
stations in Europe
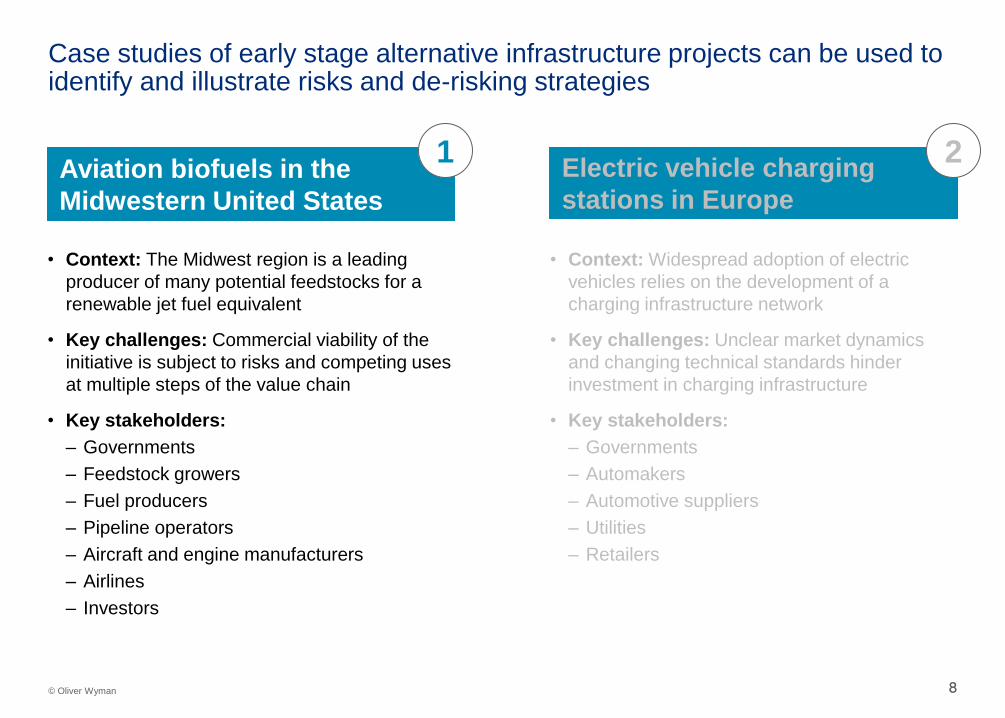
• Context: The Midwest region is a leading
producer of many potential feedstocks for a
renewable jet fuel equivalent
• Key challenges: Commercial viability of the
initiative is subject to risks and competing uses
at multiple steps of the value chain
• Key stakeholders:
– Governments
– Feedstock growers
– Fuel producers
– Pipeline operators
– Aircraft and engine manufacturers
– Airlines
– Investors
• Context: Widespread adoption of electric
vehicles relies on the development of a
charging infrastructure network
• Key challenges: Unclear market dynamics
and changing technical standards hinder
investment in charging infrastructure
• Key stakeholders:
– Governments
– Automakers
– Automotive suppliers
– Utilities
– Retailers
Case studies of early stage alternative infrastructure projects can be used to identify and illustrate risks and de-risking strategies
1 2
9 9 © Oliver Wyman
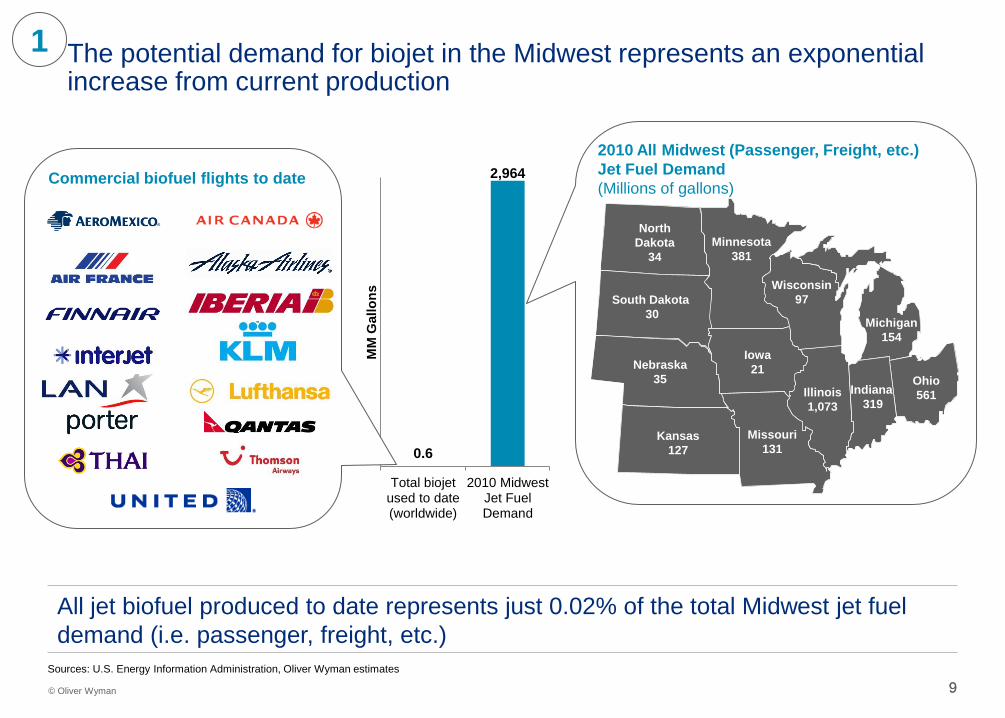
The potential demand for biojet in the Midwest represents an exponential increase from current production
Sources: U.S. Energy Information Administration, Oliver Wyman estimates
1
0.6
2,964
Total biojetused to date(worldwide)
2010 MidwestJet FuelDemand
MM
Gallo
ns
North
Dakota
34
South Dakota
30
Nebraska
35
Kansas
127
Missouri
131
Iowa
21
Minnesota
381
Wisconsin
97
Illinois
1,073
Indiana
319
Ohio
561
Michigan
154
Commercial biofuel flights to date
2010 All Midwest (Passenger, Freight, etc.)
Jet Fuel Demand
(Millions of gallons)
All jet biofuel produced to date represents just 0.02% of the total Midwest jet fuel
demand (i.e. passenger, freight, etc.)

10 10 © Oliver Wyman
Examined on following page
Raw material production Fuel production Fuel blending Storage &
aircraft use
Transport Transport Transport
Source: Sustainable Way for Alternative Fuel and Energy in Aviation (SWAFEA)
Notes: Fuel production pathways for oils / animal fat: Hydroprocessing, Direct catalytic conversion of oil to jet (DCCOJ), Catalytic hydrothermolysis then hydroprocessing to jet (CH-HRJ). For
biomass: Alcohol to jet (ATJ), Direct catalytic conversion of sugar to jet (DCCSJ); Direct fermentation of sugar to jet (DFSJ); Hydrotreated depolymerized cellulosic jet (HDCJ).
• Which type of feedstock should be used?
– Plant based oils / animal fats
– Biomass
• Where should inputs be sourced?
– Agriculturally (dedicated crops or residues)
– Secondarily (industrial by-products, solid waste)
• Can existing agricultural infrastructure (trucks, trains) be used?
• How does feedstock affect plant placement?
• Which technological pathway for production should be used?
– Total of eight potential pathways
– Three for use with plant base oils / animal fats
– Five for use with biomass
• Can and should biojet be blended with traditional jet fuel at this stage?
• How quickly can regulatory approval to blend fuel be achieved?
– Two pathways (hydroprocessing, Fischer-Tropsch) currently approved up to 50/50 blend
– Remaining six awaiting approval
• Will incentives for biofuel use require a “physical trail” or will a “paper trail” be sufficient?
• Will biojet be cost competitive with traditional jet fuel?
• Is the volume of biojet enough to justify use of existing pipelines?
• How do existing pipelines affect plant placement?
• If blended, what is required to use existing infrastructure?
• If not blended, what additional infrastructure is needed for biojet?
The use of biofuels introduces risks and questions into each stage of the jet fuel supply chain
1

11 11 © Oliver Wyman
Illustrative risk “deep dive”: each challenge can be further understood by identifying underlying risk drivers
1
New technology expense
Competing technology progress
Energy policy change
Agricultural policy change
Transportation policy change
Carbon “price” change
Which type of feedstock
should be used? Technological risks
Market supply risks
Regulatory and
political risks
Crop use competition
Land use competition
Production cost volatility
Weather/other output disruption
- Illustrative listing -
Question Risk category Risk drivers
12 12 © Oliver Wyman
Technology expense
Competing technology progress
Energy policy change
Agricultural policy change
Transportation policy change
Carbon “price” change
Choice of
feedstock Technological risks
Market supply risks
Regulatory and
political risks
Crop use competition
Land use competition
Production cost volatility
Weather/other output disruption
Question Risk category Risk drivers
Agricultural
production
incentive
Commodity risk management
Supply chain risk management
R&D Incentives,
production tax credit
Long-term consistency
and harmonization of
portfolio targets,
subsidization, etc.
Mitigation strategies
New
Established 1 Identified risk drivers will require both established and new de-risking strategies for public and private stakeholders

13 © Oliver Wyman 13
Risk
Categories
Key issues Potential De-risking Strategies Key participants
Competitive • Higher cost of biojet production than
traditional jet fuel, especially at the early
stages of market development
• Potential decreases in petroleum price
due to increased domestic production
• Vulnerability of feedstock output and
prices to weather and climatic events
• Unwanted impact on food crop output
and prices
• Subsidies or credits for biojet
development
• Stronger low carbon mandate
• Long-term supply contracts and
financial hedging measures
• Policy clarity on land use – aligned
with incentive structures
• Government
• Government
• Airlines / biojet
processors
• Government
Technology • Uncertainty about the most cost-
effective pathways for the production of
biojet – currently two pathways approved,
with six more under development
• High infrastructure set-up costs with
delays in achieving scale until broader
regulatory approvals
• RD&D funding / support for proof of
concept of pathways
• Faster approval processes
• Government /
airlines /
universities
• ASTM1 /
processors
Regulatory
and political
• Potential unequal treatment of biojet
versus traditional jet fuel – possibility that
government incentives may require
physical trail to ensure biojet is being used
• Smart incentive structure focused
on a strong “paper” trail rather than a
more costly physical trail
• Government
Regulatory clarity regarding feedstock processing and the low carbon agenda would go a long way towards encouraging investment in biojet
1
1: ASTM International, formerly American Society for Testing and Materials, publishes standards adopted by biojet end users

14 14 © Oliver Wyman
Aviation biofuels in the
Midwestern United States
Electric vehicle charging
stations in Europe
• Context: The Midwest region is a leading
producer of many potential feedstocks for a
renewable jet fuel equivalent
• Key challenges: Commercial viability of the
initiative is subject to risks and competing uses
at multiple steps of the value chain
• Key stakeholders:
– Governments
– Feedstock growers
– Fuel producers
– Pipeline operators
– Aircraft and engine manufacturers
– Airlines
– Investors
• Context: Widespread adoption of electric
vehicles relies on the development of a
charging infrastructure network
• Key challenges: Unclear market dynamics
and changing technical standards hinder
investment in charging infrastructure
• Key stakeholders:
– Governments
– Automakers
– Automotive suppliers
– Utilities
– Retailers
Case studies of early stage alternative infrastructure projects can be used to identify and illustrate risks and de-risking strategies
1 2
15 15 © Oliver Wyman
Sources: IEA, Technology Roadmap, Electric and plug-in hybrid electric vehicles, 2011
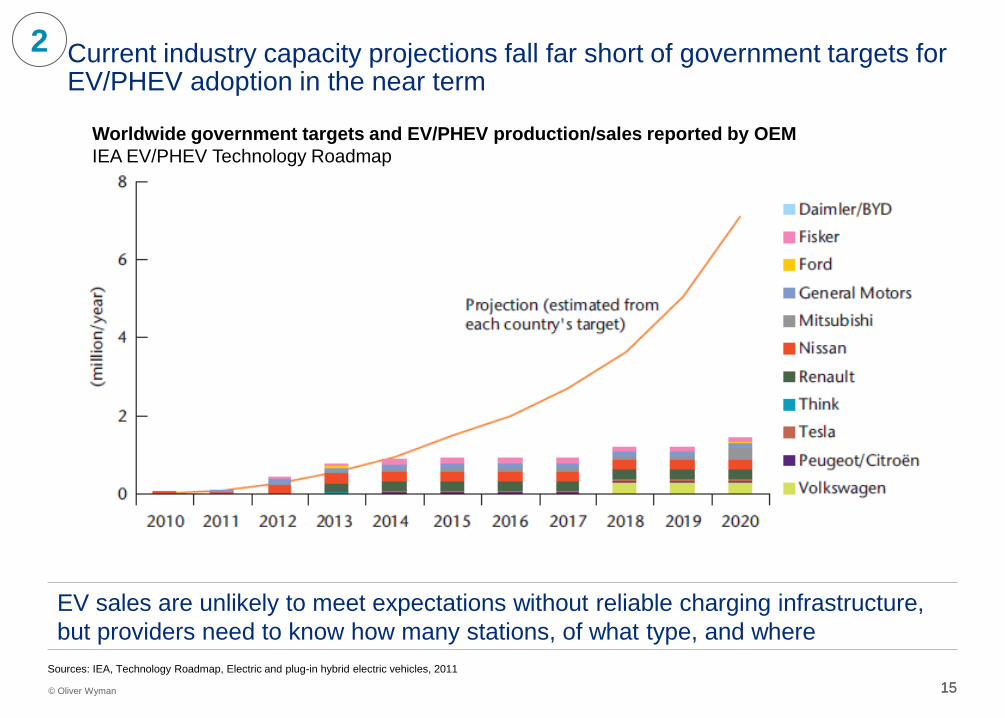
Current industry capacity projections fall far short of government targets for EV/PHEV adoption in the near term
2
EV sales are unlikely to meet expectations without reliable charging infrastructure,
but providers need to know how many stations, of what type, and where
Worldwide government targets and EV/PHEV production/sales reported by OEM
IEA EV/PHEV Technology Roadmap

16 16 © Oliver Wyman
The complexity and overlaps in the charging infrastructure value chain give rise to many risks for emerging business models
2
Charging Infrastructure
Location providers
Hardware providers
Automotive OEMs
Electric utilities
• How will expansion of EV charging affect grid stability?
• Can EVs support network loads as a storage system?
• …
• What are the technical requirements for charging?
• What are the implications of separate hardware standards for infrastructure investment and customer perception?
• …
• What is the relationship between infrastructure development and EV uptake?
• What options are available for socket and plug standardization?
• …
• What level of charging should be available at different locations?
• …
• How can infrastructure be designed to ensure interoperability across Europe?
• How can billing models be harmonized to improve customer experience?
• … • How many charging stations are
required and where should they be located?

17 © Oliver Wyman 17
Risk
Categories
Key issues Potential De-risking Strategies Key participants
Market
demand
• Slow adoption of EVs due to, e.g.,
range anxiety, charging complexity /
inconvenience, purchase price,
manufacturer lead times for
innovations
• Scale of need for public charging
infrastructure dependent on vehicle
usage and extent of privately-owned
stations at homes and offices
• Consumer awareness programs in likely
markets focusing on range, battery
longevity, density of charging network
• Uptake incentives, e.g., tax credits for EV
purchase, free charging, free road tax, free
parking, use of bus lanes
• Consumer mapping to understand
patterns of use, charging expectations,
gaps in network coverage
• OEMs
• Governments
• OEMs / utilities
Technology • Existence of multiple charging
protocols, plugs, voltages, swapping
• Rapid technological development
(including potential game-changer in
inductive charging)
• Potential grid instability due to high
levels of (rapid) charging
• Dominance of certain platforms in due
course
• Communication between market
players to ensure the interoperability of
components and consumer convenience
• V2G protocols to ensure demand load
leveling and vehicle storage capabilities
• Hardware
providers /
OEMs
• Utilities
Financial • Lack of clarity around business
model viability due to high set-up
costs versus the margin for electricity
and multiple potential players
• Higher cost of capital due to
technology optionality and potential
for radical change
• Participants taking stakes at multiple
points in the value chain
• Transfer of set-up costs to public /
private sector employers, etc.
• Profit and cost-sharing between ley
players and the public sector
• OEMs /
utilities
• Other
businesses /
government /
local authorities
De-risking initiatives need to focus as much on the EV market as on the infrastructure network to ensure charging platforms achieve scale
2

Elements to enable and de-risk
infrastructure development
3
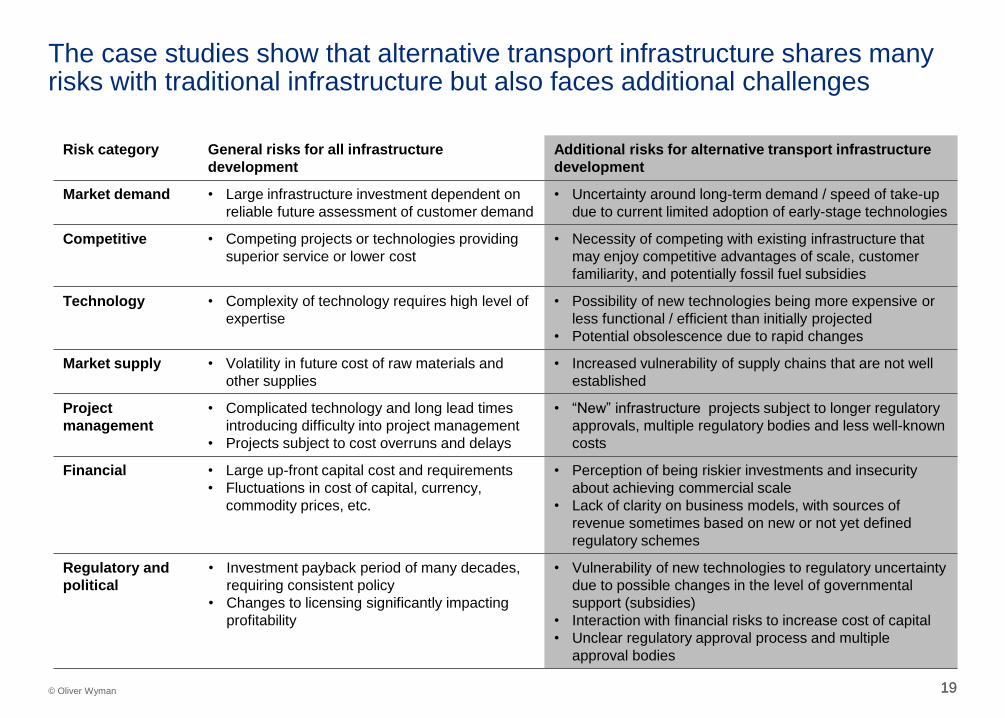
19 19 © Oliver Wyman
Risk category General risks for all infrastructure
development
Additional risks for alternative transport infrastructure
development
Market demand • Large infrastructure investment dependent on
reliable future assessment of customer demand
• Uncertainty around long-term demand / speed of take-up
due to current limited adoption of early-stage technologies
Competitive • Competing projects or technologies providing
superior service or lower cost
• Necessity of competing with existing infrastructure that
may enjoy competitive advantages of scale, customer
familiarity, and potentially fossil fuel subsidies
Technology • Complexity of technology requires high level of
expertise
• Possibility of new technologies being more expensive or
less functional / efficient than initially projected
• Potential obsolescence due to rapid changes
Market supply • Volatility in future cost of raw materials and
other supplies
• Increased vulnerability of supply chains that are not well
established
Project
management
• Complicated technology and long lead times
introducing difficulty into project management
• Projects subject to cost overruns and delays
• “New” infrastructure projects subject to longer regulatory
approvals, multiple regulatory bodies and less well-known
costs
Financial • Large up-front capital cost and requirements
• Fluctuations in cost of capital, currency,
commodity prices, etc.
• Perception of being riskier investments and insecurity
about achieving commercial scale
• Lack of clarity on business models, with sources of
revenue sometimes based on new or not yet defined
regulatory schemes
Regulatory and
political
• Investment payback period of many decades,
requiring consistent policy
• Changes to licensing significantly impacting
profitability
• Vulnerability of new technologies to regulatory uncertainty
due to possible changes in the level of governmental
support (subsidies)
• Interaction with financial risks to increase cost of capital
• Unclear regulatory approval process and multiple
approval bodies
The case studies show that alternative transport infrastructure shares many risks with traditional infrastructure but also faces additional challenges
20 20 © Oliver Wyman
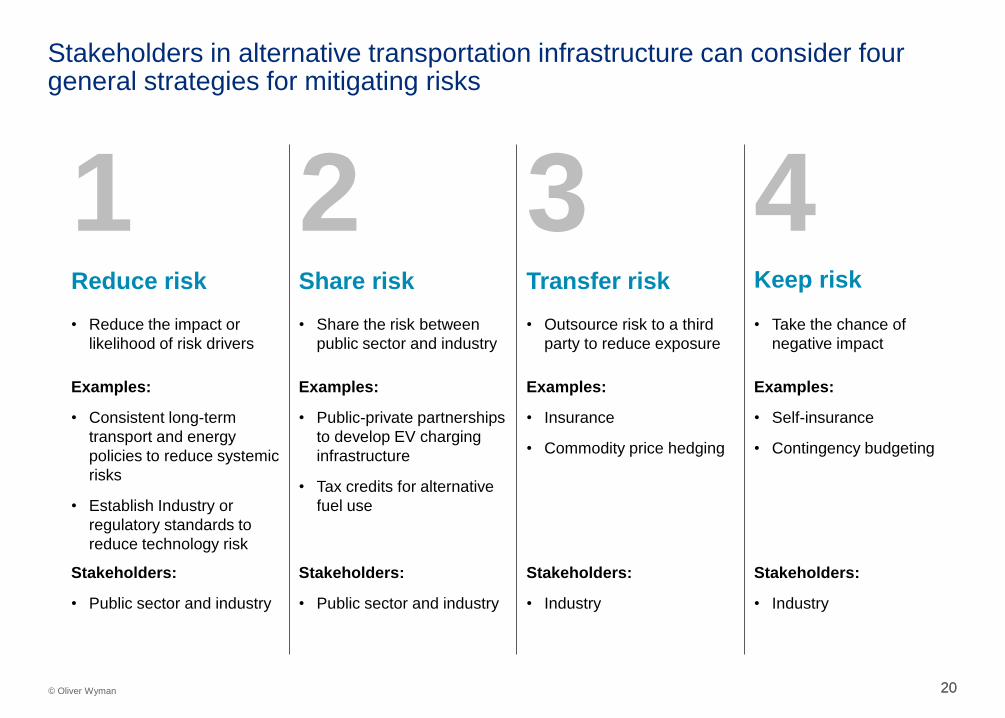
Stakeholders in alternative transportation infrastructure can consider four general strategies for mitigating risks
1 2 3 4 Reduce risk Share risk Transfer risk Keep risk
• Reduce the impact or
likelihood of risk drivers
• Share the risk between
public sector and industry
• Outsource risk to a third
party to reduce exposure
• Take the chance of
negative impact
Examples:
• Consistent long-term
transport and energy
policies to reduce systemic
risks
• Establish Industry or
regulatory standards to
reduce technology risk
Examples:
• Public-private partnerships
to develop EV charging
infrastructure
• Tax credits for alternative
fuel use
Examples:
• Insurance
• Commodity price hedging
Examples:
• Self-insurance
• Contingency budgeting
Stakeholders:
• Public sector and industry
Stakeholders:
• Public sector and industry
Stakeholders:
• Industry
Stakeholders:
• Industry

21 © Oliver Wyman 21
more mature less mature
Risks will increasingly be the responsibility of industry as markets mature, but the public sector must play a critical role in the early stages
Primarily
industry
Public
sector &
industry
Primarily
public
sector
Market maturity
Ris
k r
esp
on
sib
ilit
y
Regulatory and
political
Regulatory and
political
Technology
Financial
Market demand
Market supply
Project
management
Competitive
Project management,
market supply, market
demand, competitive,
financial, technology
Project
management,
market supply,
market demand,
competitive
Longer public
sector commitment
Shorter public
sector commitment

22 © Oliver Wyman 22
Summary: developing effective risk mitigation requires an ongoing examination of underlying risk drivers and potential mitigation options
1
2
3
Understand risk drivers at a detailed level
• A structured analysis of key challenges allows the identification of the highest-
impact risks to infrastructure investments
Identify and consolidate risk mitigation tactics
• Policymakers should focus on risks that cannot be addressed in a satisfactory
manner by industry
Review progress on an ongoing basis
• The roles of public sector and industry will evolve as technologies and markets
develop
QUALIFICATIONS,
ASSUMPTIONS AND LIMITING
CONDITIONS
This report is for the exclusive use of the client named herein. This report is not intended for general circulation or publication,
nor is it to be reproduced, quoted or distributed for any purpose without the prior written permission of . There are no third party
beneficiaries with respect to this report, and does not accept any liability to any third party.
Information furnished by others, upon which all or portions of this report are based, is believed to be reliable but has not been
independently verified, unless otherwise expressly indicated. Public information and industry and statistical data are from sources
we deem to be reliable; however, we make no representation as to the accuracy or completeness of such information. The
findings contained in this report may contain predictions based on current data and historical trends. Any such predictions are
subject to inherent risks and uncertainties. accepts no responsibility for actual results or future events.
The opinions expressed in this report are valid only for the purpose stated herein and as of the date of this report. No obligation
is assumed to revise this report to reflect changes, events or conditions, which occur subsequent to the date hereof.
All decisions in connection with the implementation or use of advice or recommendations contained in this report are the sole
responsibility of the client. This report does not represent investment advice nor does it provide an opinion regarding the fairness
of any transaction to any and all parties.