de martini - ucla smerc conf. mar 22, 2013
TRANSCRIPT
© 2012, Newport Consulting Group
Evolution of Distributed Power Systems
Paul De Martini
March 22, 2013
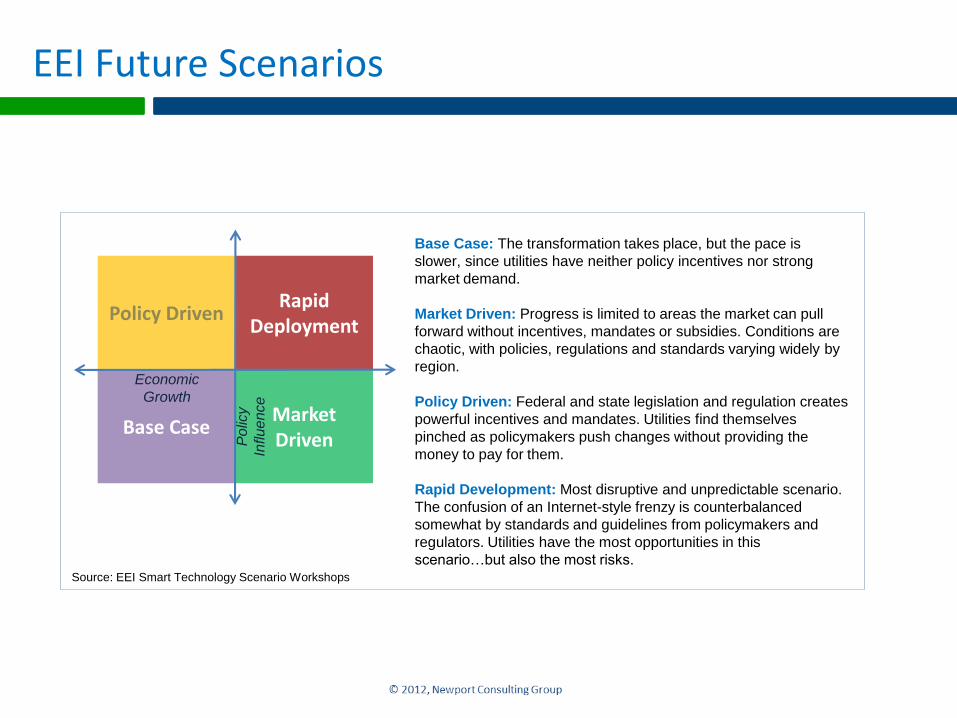
Base Case: The transformation takes place, but the pace is
slower, since utilities have neither policy incentives nor strong
market demand.
Market Driven: Progress is limited to areas the market can pull
forward without incentives, mandates or subsidies. Conditions are
chaotic, with policies, regulations and standards varying widely by
region.
Policy Driven: Federal and state legislation and regulation creates
powerful incentives and mandates. Utilities find themselves
pinched as policymakers push changes without providing the
money to pay for them.
Rapid Development: Most disruptive and unpredictable scenario.
The confusion of an Internet-style frenzy is counterbalanced
somewhat by standards and guidelines from policymakers and
regulators. Utilities have the most opportunities in this
scenario…but also the most risks.
Market Driven
Policy DrivenRapid
Deployment
Base Case
Po
licy
Influe
nce
Economic
Growth
Source: EEI Smart Technology Scenario Workshops
EEI Future Scenarios
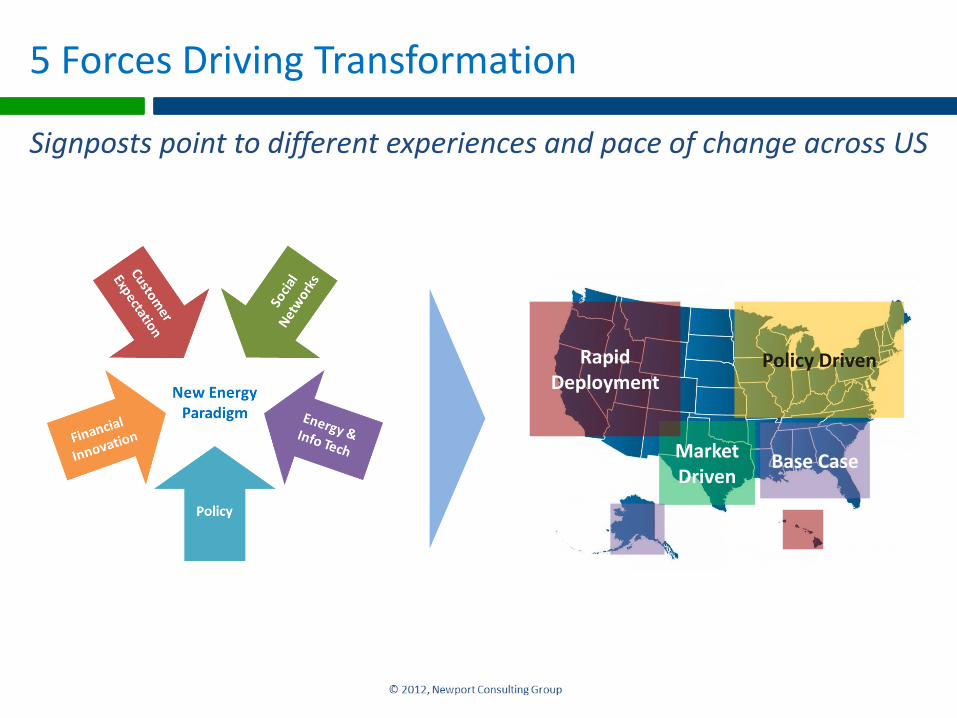
Signposts point to different experiences and pace of change across US
Market Driven
Policy DrivenRapid Deployment
Base Case
5 Forces Driving Transformation
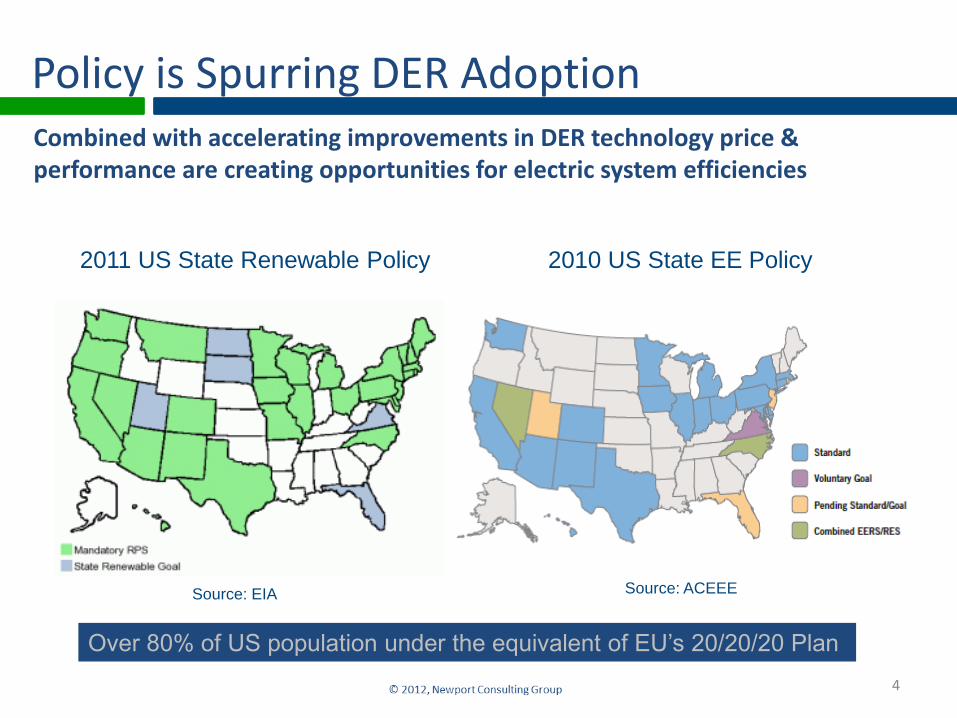
Source: ACEEESource: EIA
2011 US State Renewable Policy 2010 US State EE Policy
Policy is Spurring DER AdoptionCombined with accelerating improvements in DER technology price & performance are creating opportunities for electric system efficiencies
4
Over 80% of US population under the equivalent of EU’s 20/20/20 Plan
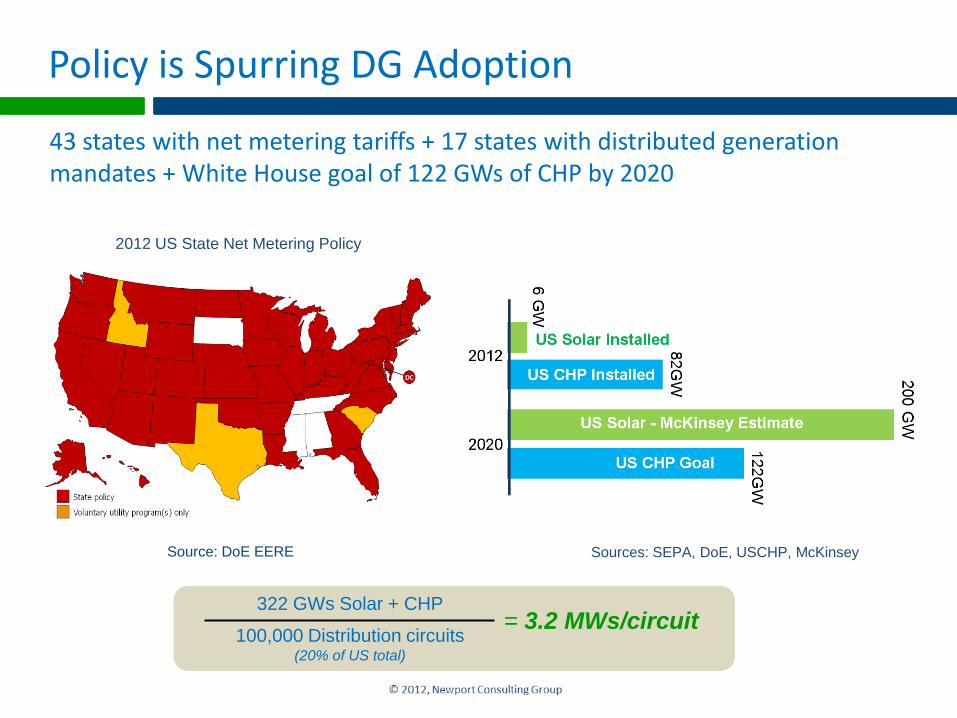
Source: DoE EERE
2012 US State Net Metering Policy
Policy is Spurring DG Adoption
43 states with net metering tariffs + 17 states with distributed generation mandates + White House goal of 122 GWs of CHP by 2020
Sources: SEPA, DoE, USCHP, McKinsey
322 GWs Solar + CHP
100,000 Distribution circuits(20% of US total)
= 3.2 MWs/circuit
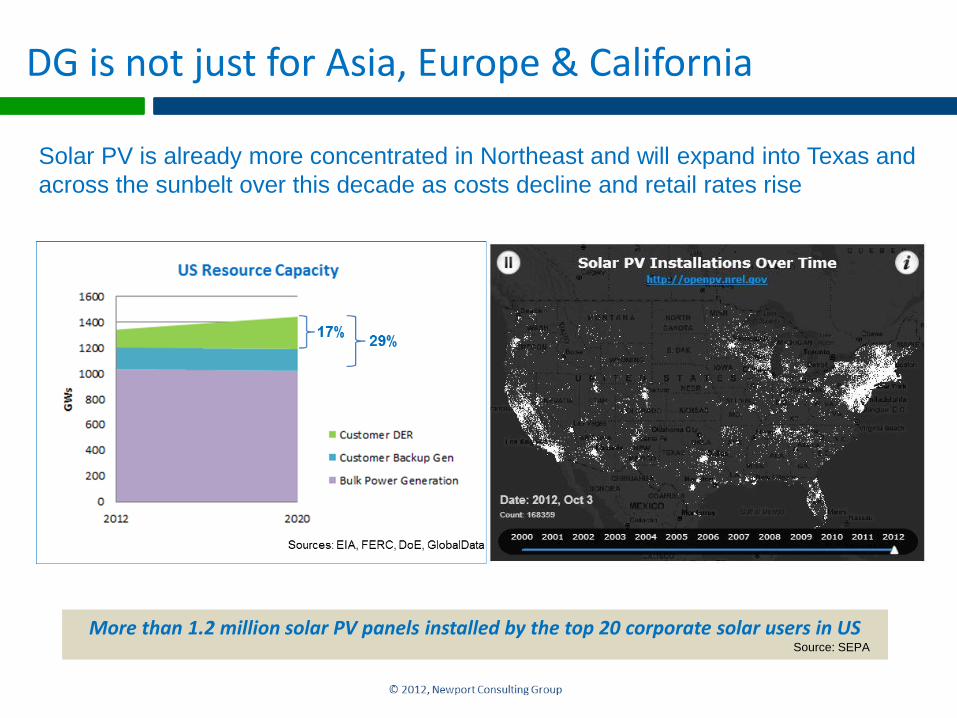
DG is not just for Asia, Europe & California
Solar PV is already more concentrated in Northeast and will expand into Texas and
across the sunbelt over this decade as costs decline and retail rates rise
More than 1.2 million solar PV panels installed by the top 20 corporate solar users in US Source: SEPA
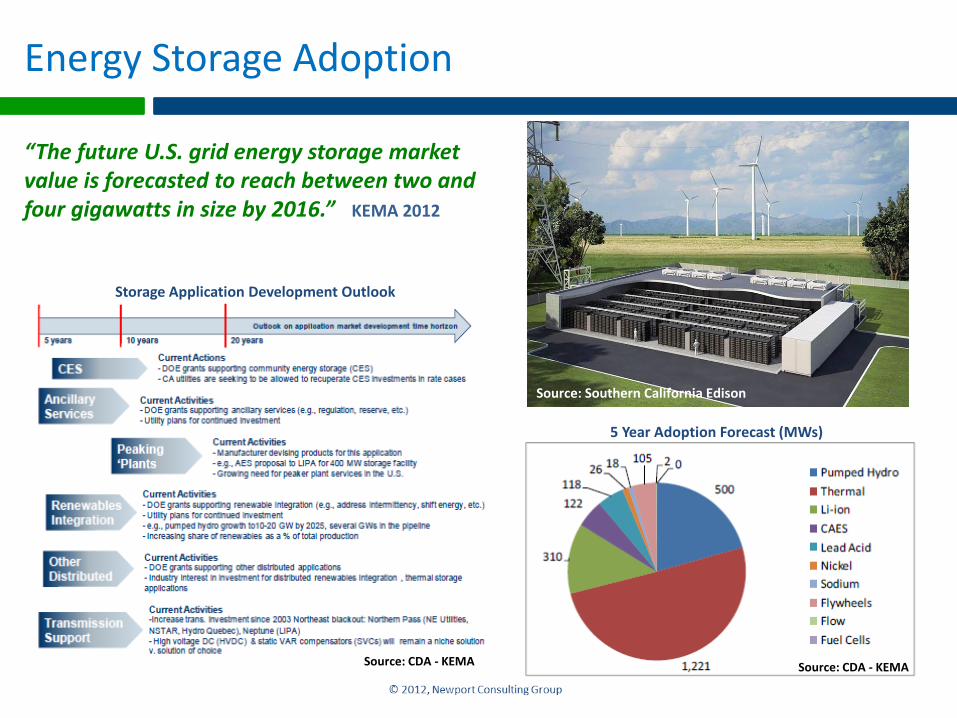
Energy Storage Adoption
Source: CDA - KEMA Source: CDA - KEMA
5 Year Adoption Forecast (MWs)
Storage Application Development Outlook
Source: Southern California Edison
“The future U.S. grid energy storage market value is forecasted to reach between two and four gigawatts in size by 2016.” KEMA 2012
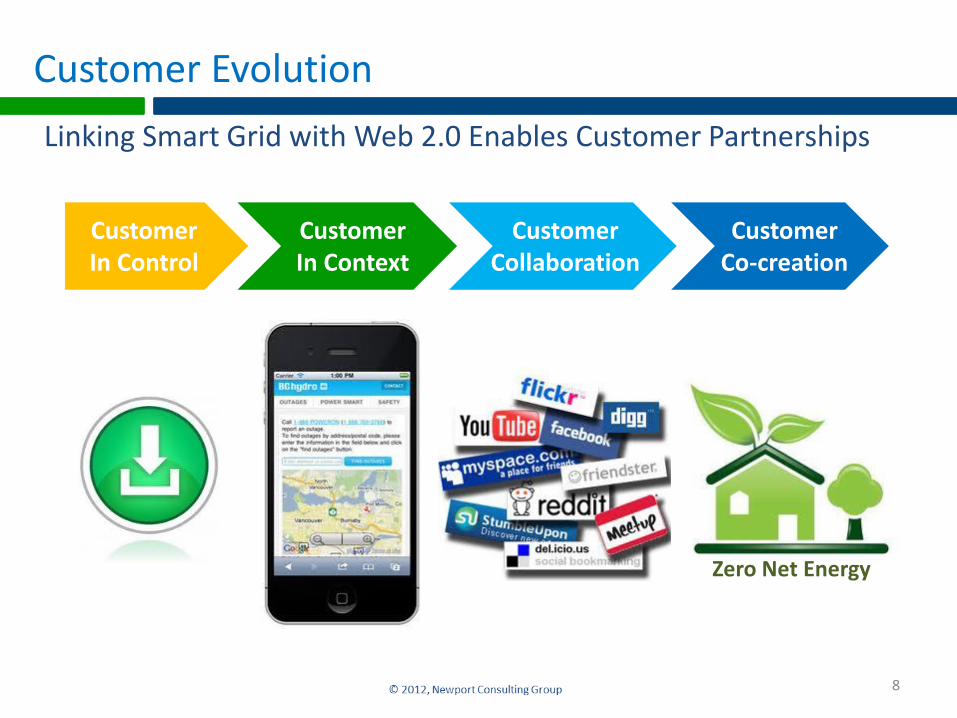
Customer Evolution
Linking Smart Grid with Web 2.0 Enables Customer Partnerships
8
CustomerIn Control
CustomerIn Context
CustomerCollaboration
CustomerCo-creation
Zero Net Energy
Transactive Energy
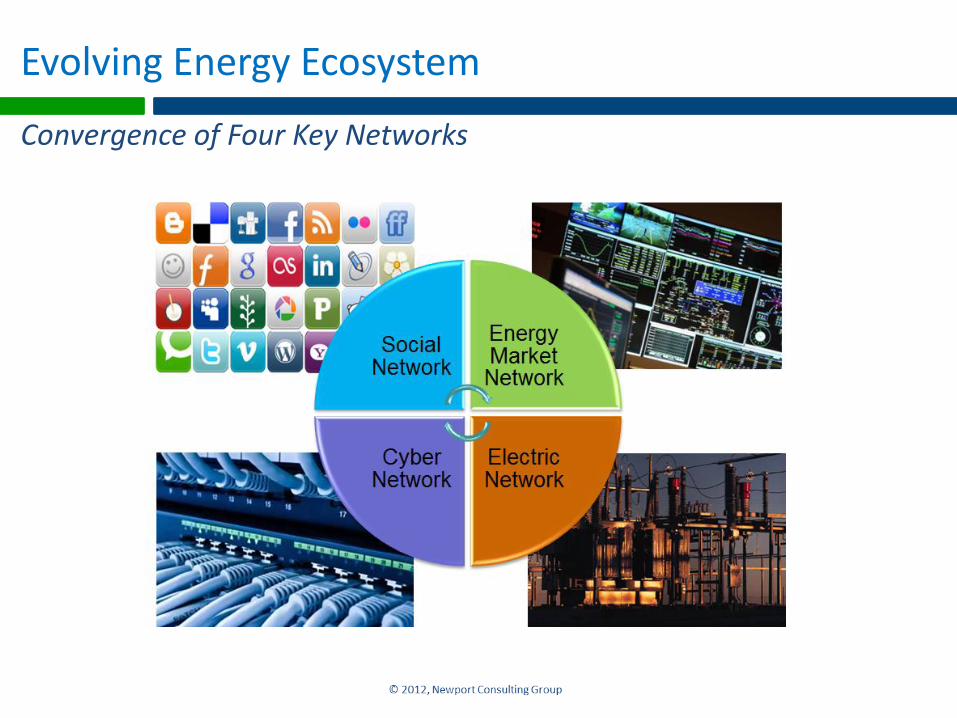
Evolving Energy Ecosystem
Convergence of Four Key Networks
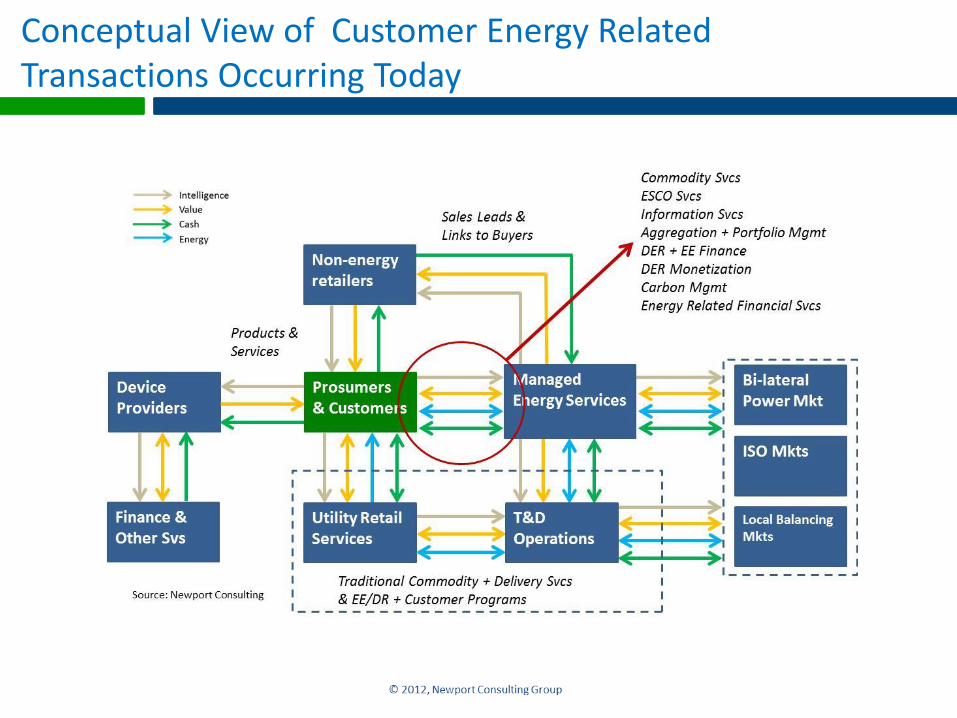
Conceptual View of Customer Energy Related Transactions Occurring Today
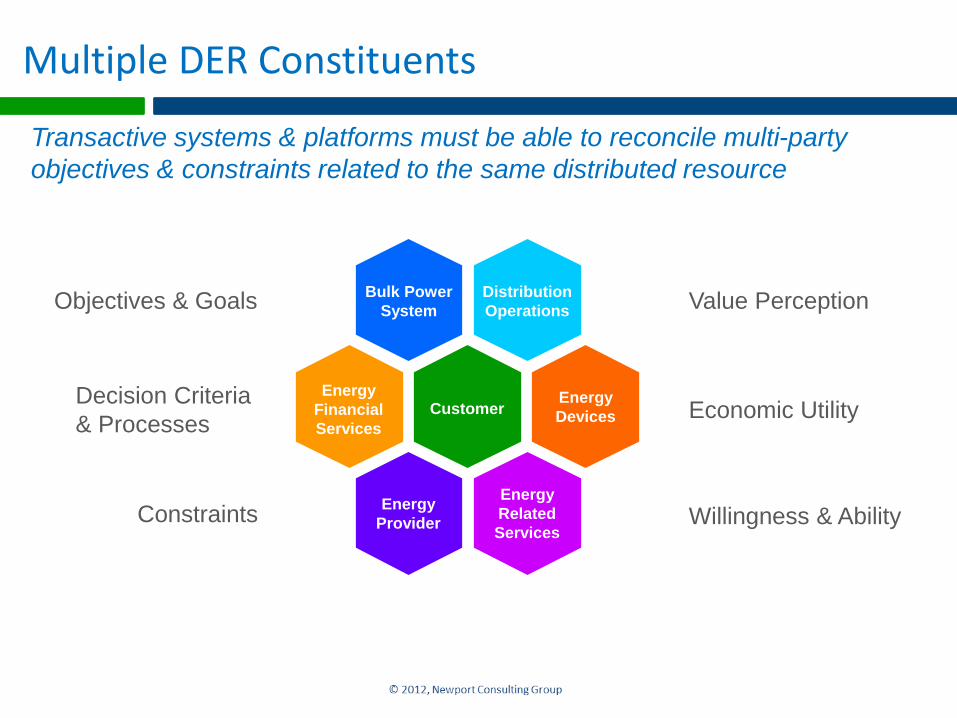
Multiple DER Constituents
Transactive systems & platforms must be able to reconcile multi-party
objectives & constraints related to the same distributed resource
Bulk Power
System
Distribution
Operations
Customer
Energy
Provider
Energy
Related
Services
Energy
Devices
Energy
Financial
Services
Objectives & Goals
Decision Criteria
& Processes
Constraints
Value Perception
Economic Utility
Willingness & Ability
Transactive Energy
Refers to techniques for managing the generation, consumption or flow of electric power within an electric power system through the use of economic or market based constructs while considering grid reliability constraints.
The term “transactive” comes from considering that decisions are made based on a value. These decisions may be analogous to or literally economic transactions.
Transactive Energy Workshop Proceedings 2012, prepared by the GridWise® Architecture Council,
March 2012, PNNL-SA-90082 (http://www.gridwiseac.org/historical/tew2012/tew2012.aspx)
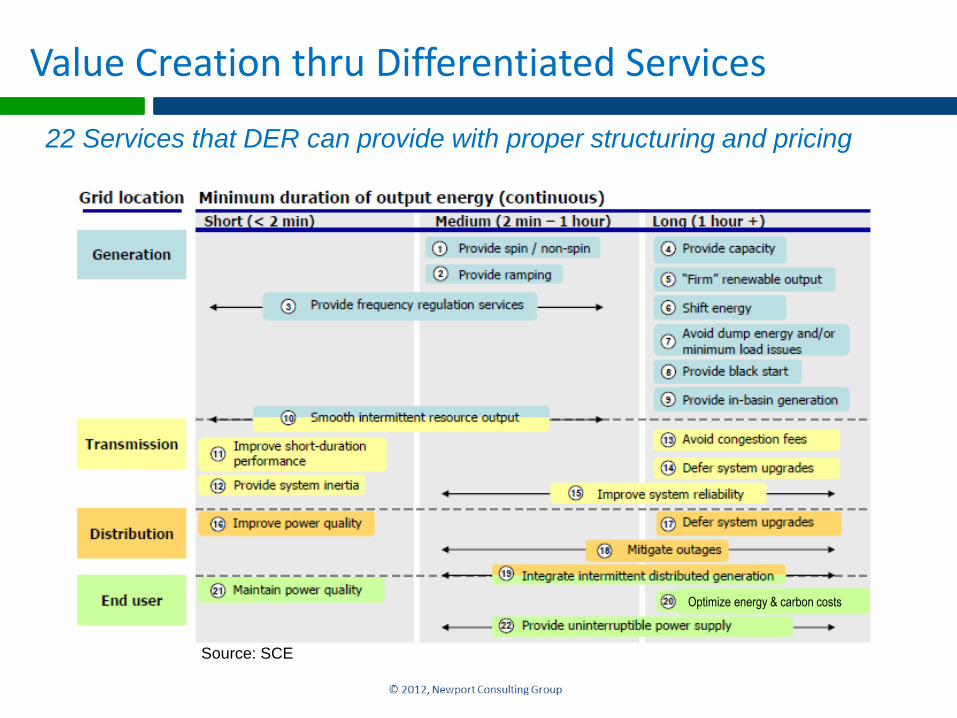
Value Creation thru Differentiated Services
22 Services that DER can provide with proper structuring and pricing
Source: SCE
Optimize energy & carbon costs
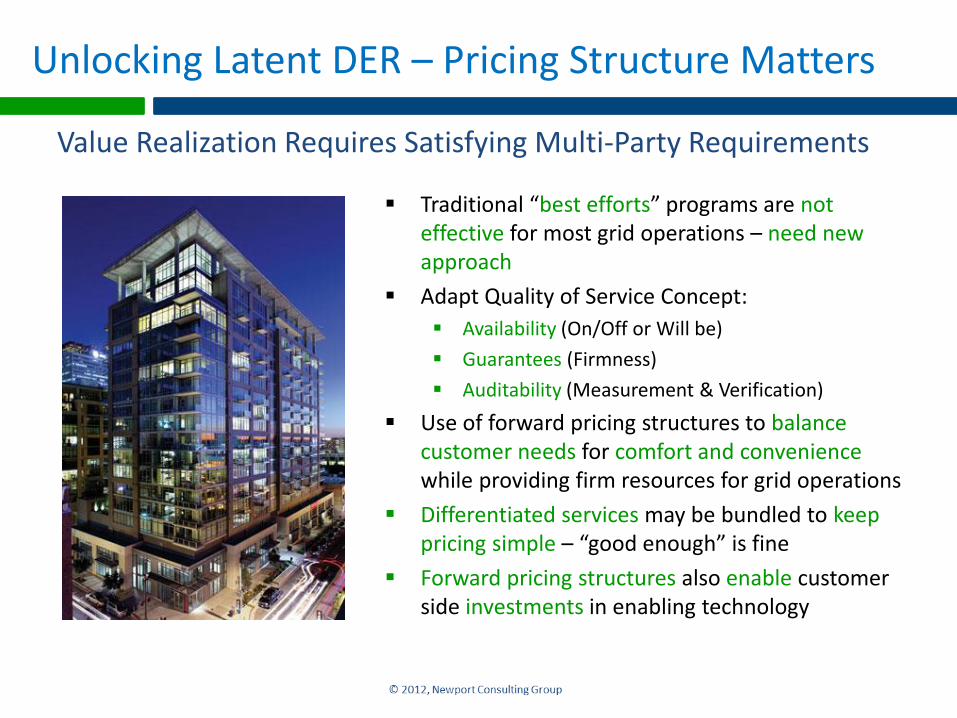
Unlocking Latent DER – Pricing Structure Matters
Traditional “best efforts” programs are not effective for most grid operations – need new approach
Adapt Quality of Service Concept:
Availability (On/Off or Will be)
Guarantees (Firmness)
Auditability (Measurement & Verification)
Use of forward pricing structures to balance customer needs for comfort and convenience while providing firm resources for grid operations
Differentiated services may be bundled to keep pricing simple – “good enough” is fine
Forward pricing structures also enable customer side investments in enabling technology
Value Realization Requires Satisfying Multi-Party Requirements
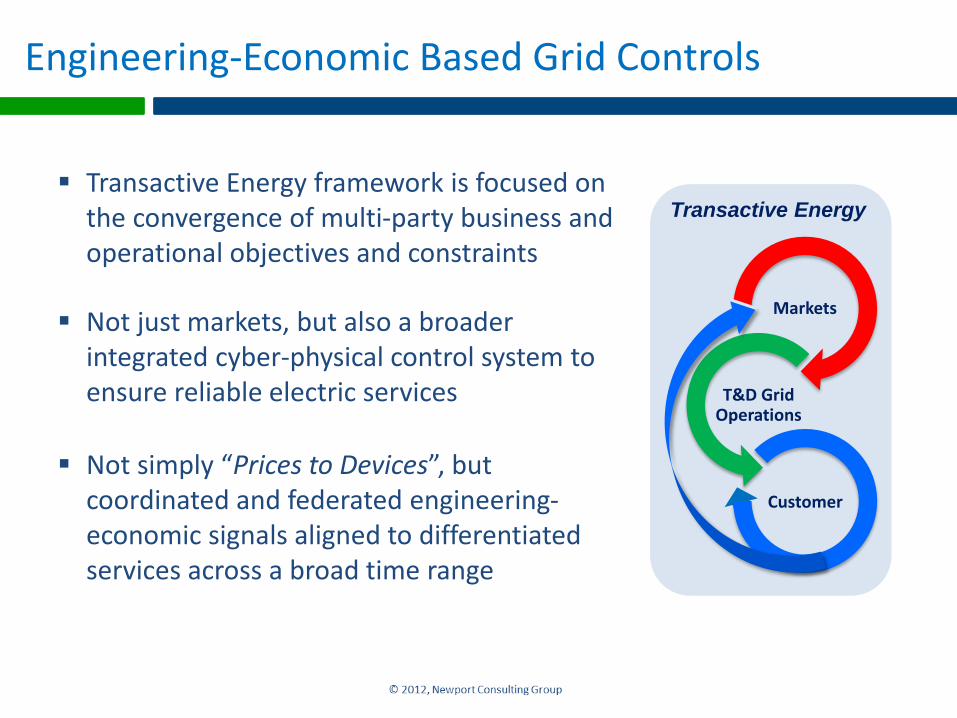
Engineering-Economic Based Grid Controls
Transactive Energy framework is focused on the convergence of multi-party business and operational objectives and constraints
Not just markets, but also a broader integrated cyber-physical control system to ensure reliable electric services
Not simply “Prices to Devices”, but coordinated and federated engineering-economic signals aligned to differentiated services across a broad time range
Transactive Energy
Markets
T&D Grid Operations
Customer
Distributed Energy Resources Platform
Responsive Demand
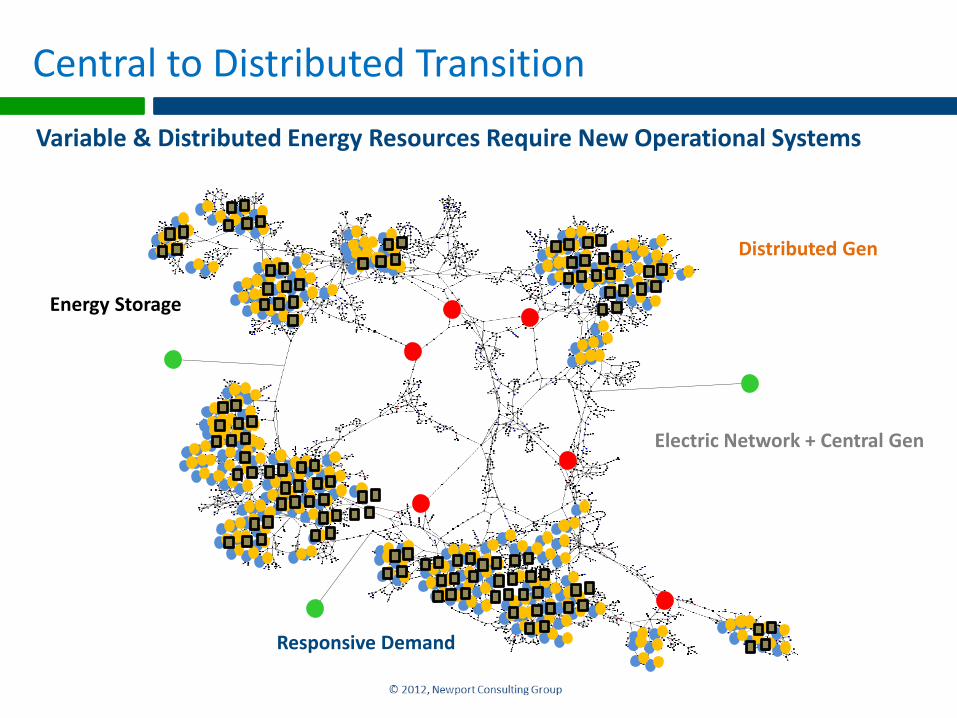
Central to Distributed Transition
Variable & Distributed Energy Resources Require New Operational Systems
Distributed Gen
Electric Network + Central Gen
Energy Storage
Net Zero Energy
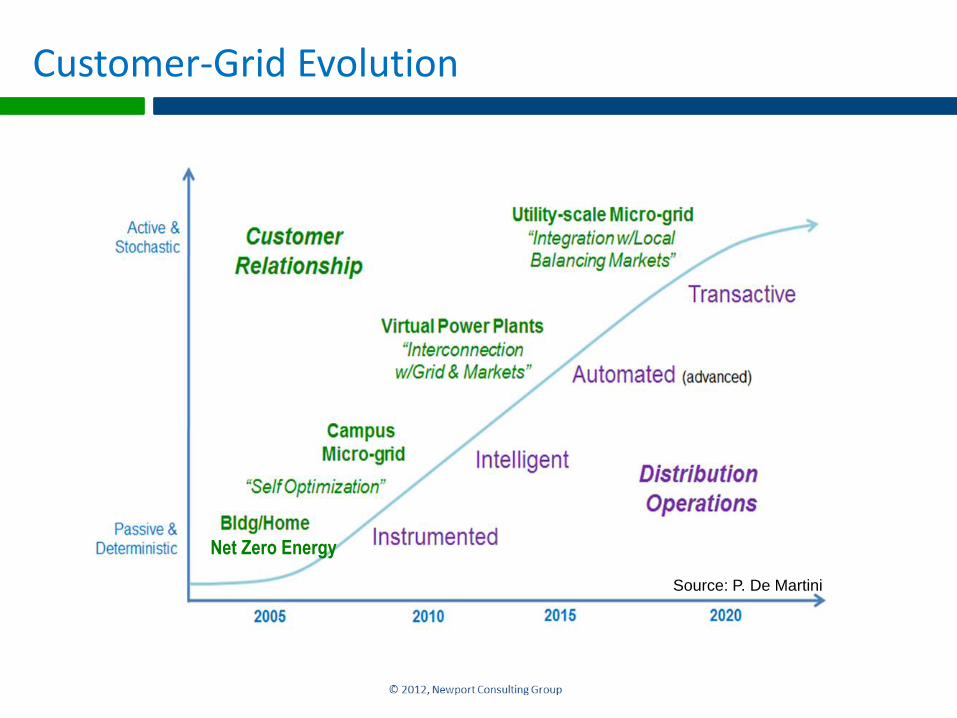
Source: P. De Martini
Customer-Grid Evolution
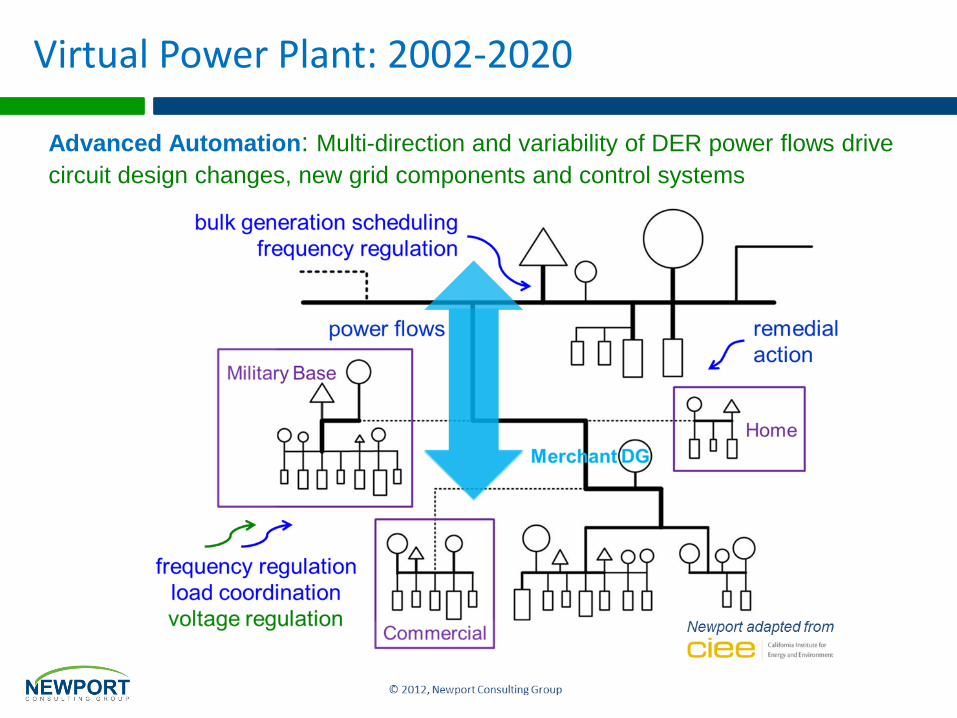
Virtual Power Plant: 2002-2020
Advanced Automation: Multi-direction and variability of DER power flows drive
circuit design changes, new grid components and control systems
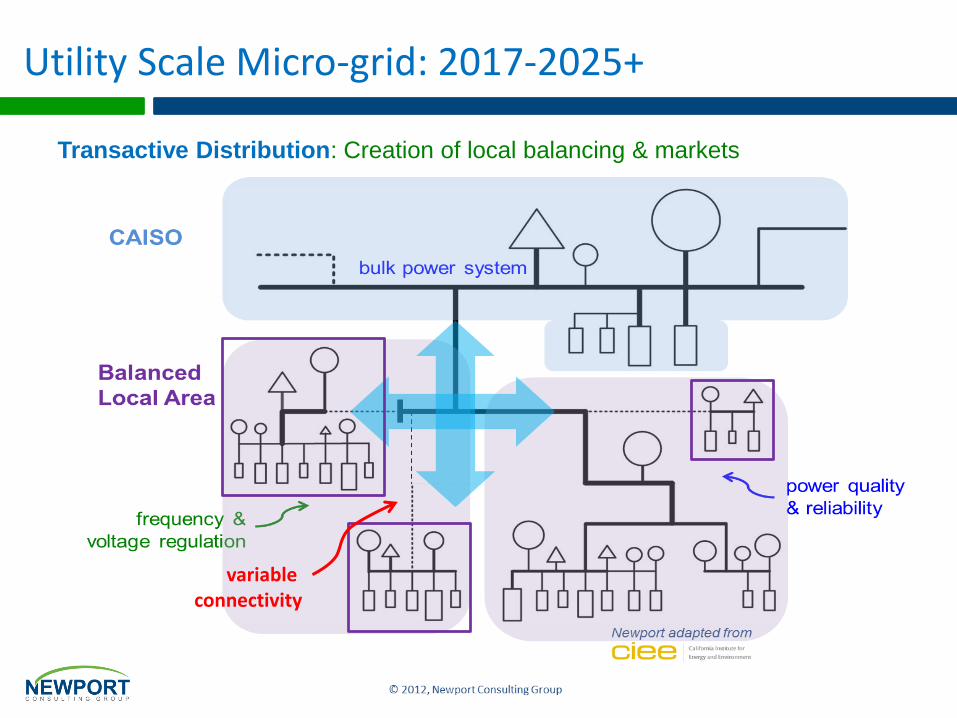
Operational Evolution: 1978-2001Utility Scale Micro-grid: 2017-2025+
Transactive Distribution: Creation of local balancing & markets
variable connectivity
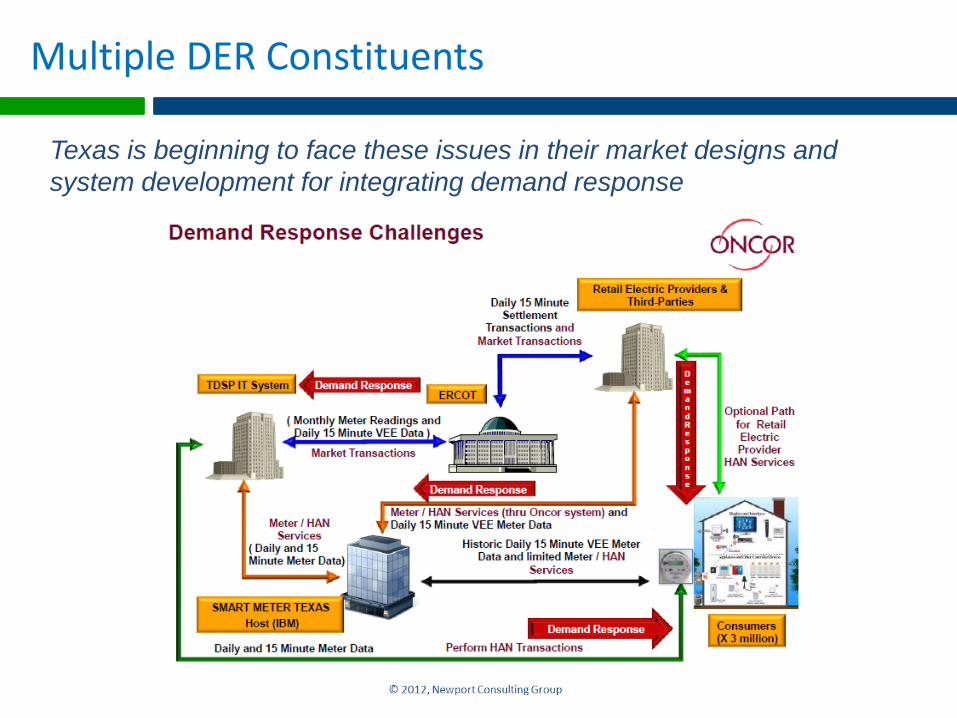
Multiple DER Constituents
Transactive schemes must be able to reconcile multi-party
objectives & constraints related to the same distributed resourceTexas is beginning to face these issues in their market designs and
system development for integrating demand response
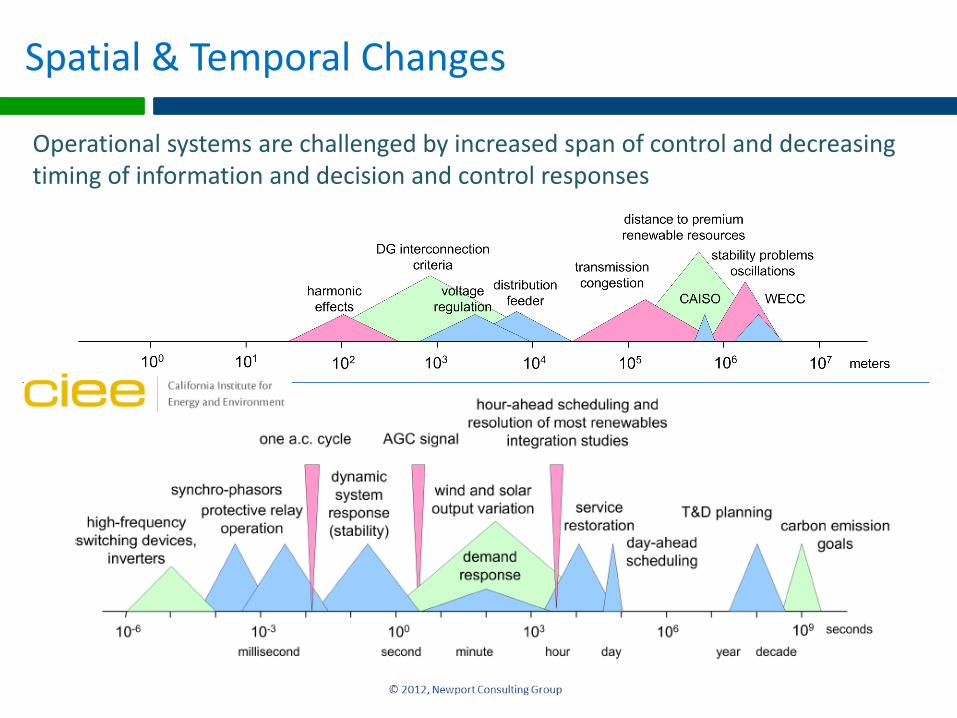
Spatial & Temporal Changes
Operational systems are challenged by increased span of control and decreasing timing of information and decision and control responses
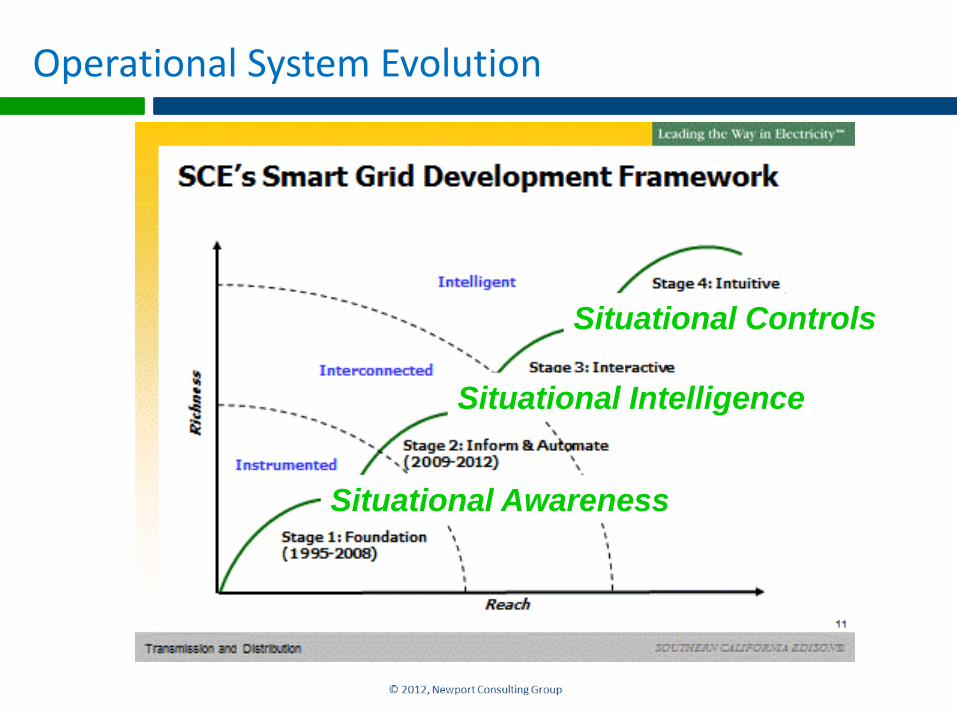
Operational System Evolution
Situational Awareness
Situational Intelligence
Situational Controls
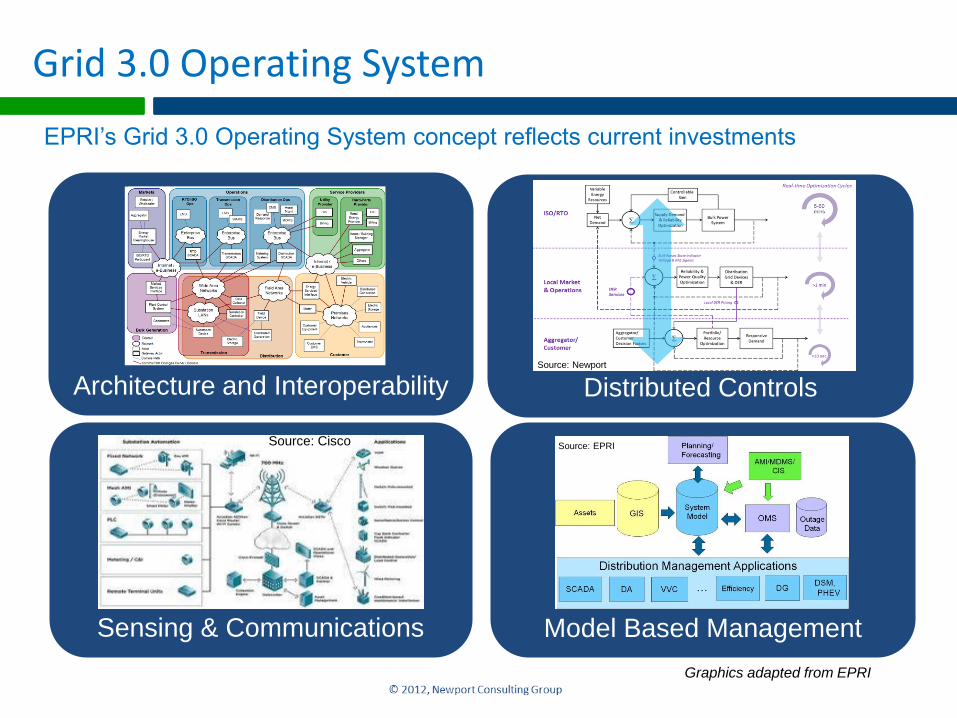
Grid 3.0 Operating System
Sensing & Communications
Distributed Controls
Model Based Management
Architecture and InteroperabilitySource: Newport
Source: EPRI
EPRI’s Grid 3.0 Operating System concept reflects current investments
Graphics adapted from EPRI
Source: Cisco
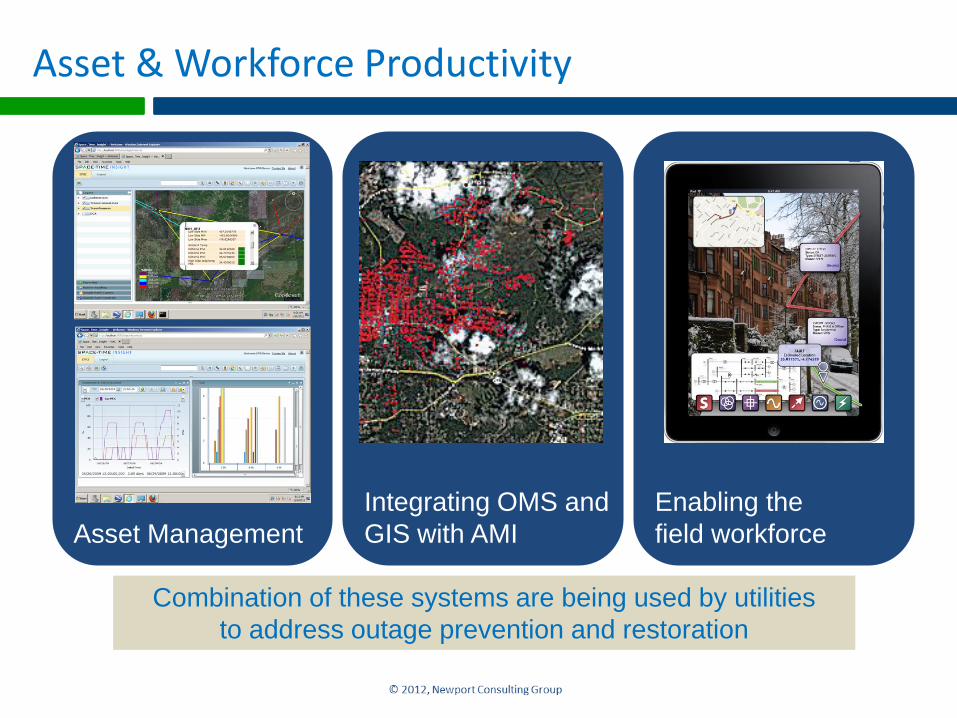
Asset & Workforce Productivity
Asset Management
Enabling the
field workforce
Integrating OMS and
GIS with AMI
Combination of these systems are being used by utilities
to address outage prevention and restoration
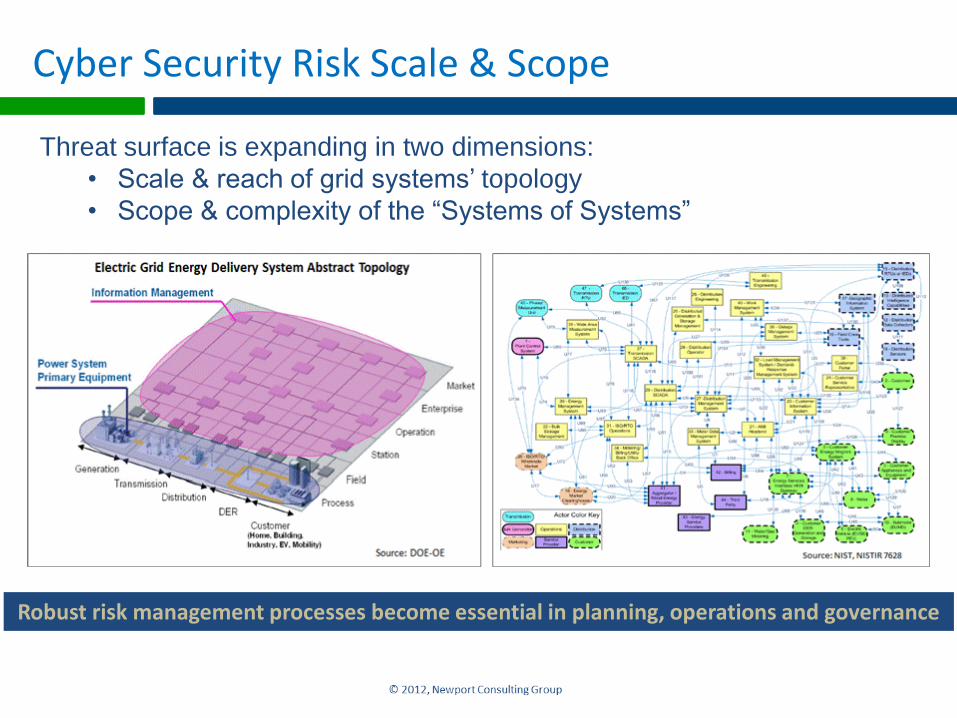
Cyber Security Risk Scale & Scope
Threat surface is expanding in two dimensions:
• Scale & reach of grid systems’ topology
• Scope & complexity of the “Systems of Systems”
Robust risk management processes become essential in planning, operations and governance
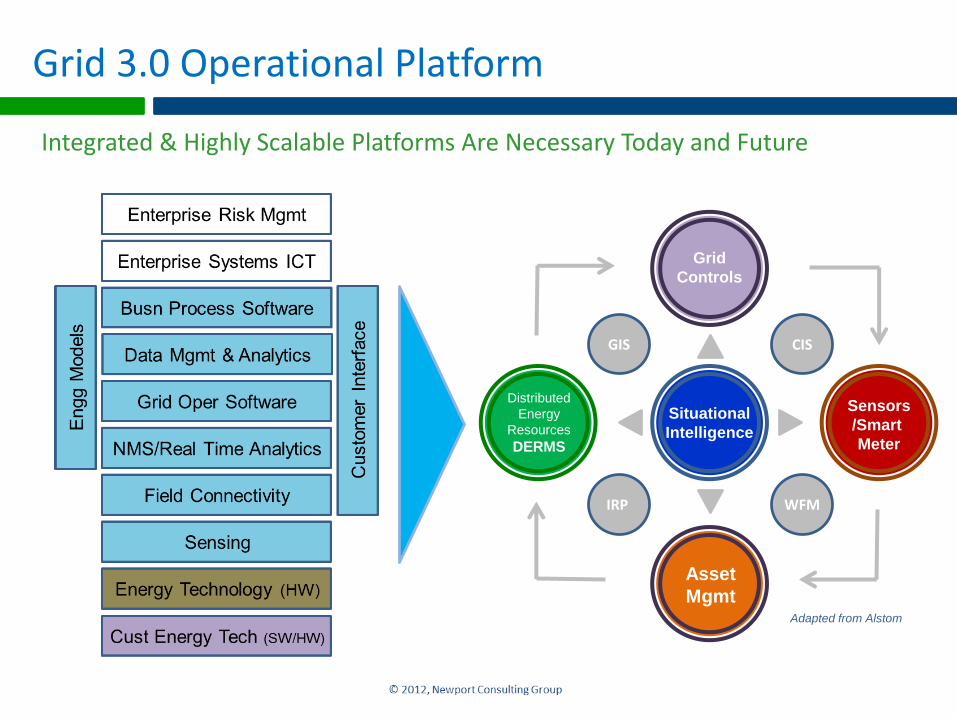
Grid 3.0 Operational Platform
Adapted from Alstom
Integrated & Highly Scalable Platforms Are Necessary Today and Future
GIS CIS
WFMIRP
Distributed
Energy
Resources
DERMS
Grid
Controls
Asset
Mgmt
Sensors
/Smart
Meter
Situational
Intelligence
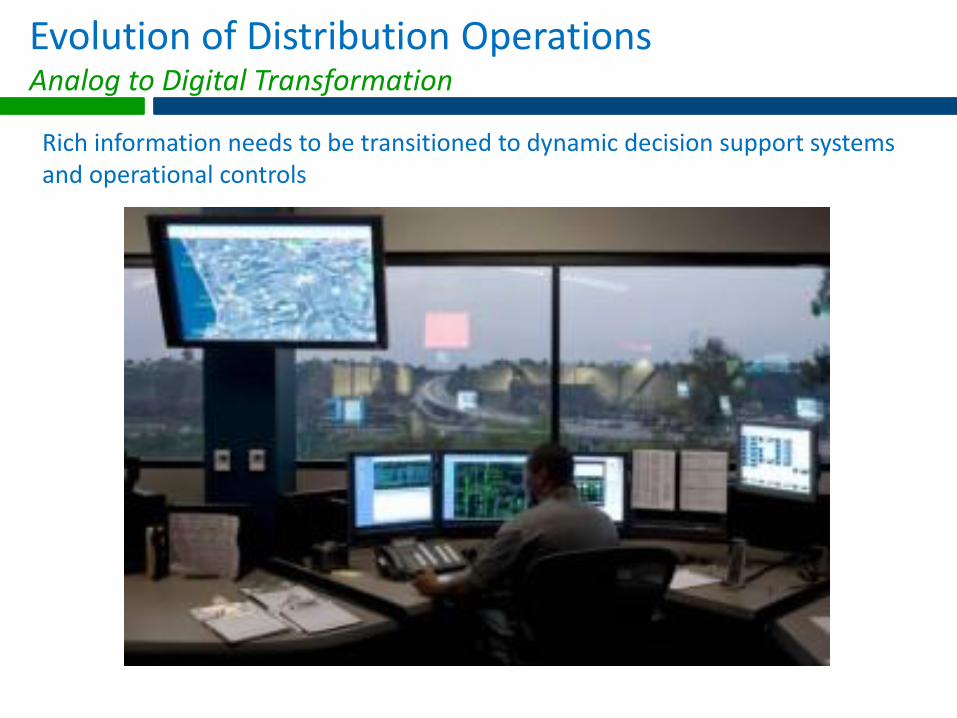
Evolution of Distribution OperationsAnalog to Digital Transformation
29
Images: A. von Meier
Rich information needs to be transitioned to dynamic decision support systems and operational controls
Investment Challenges & Strategies
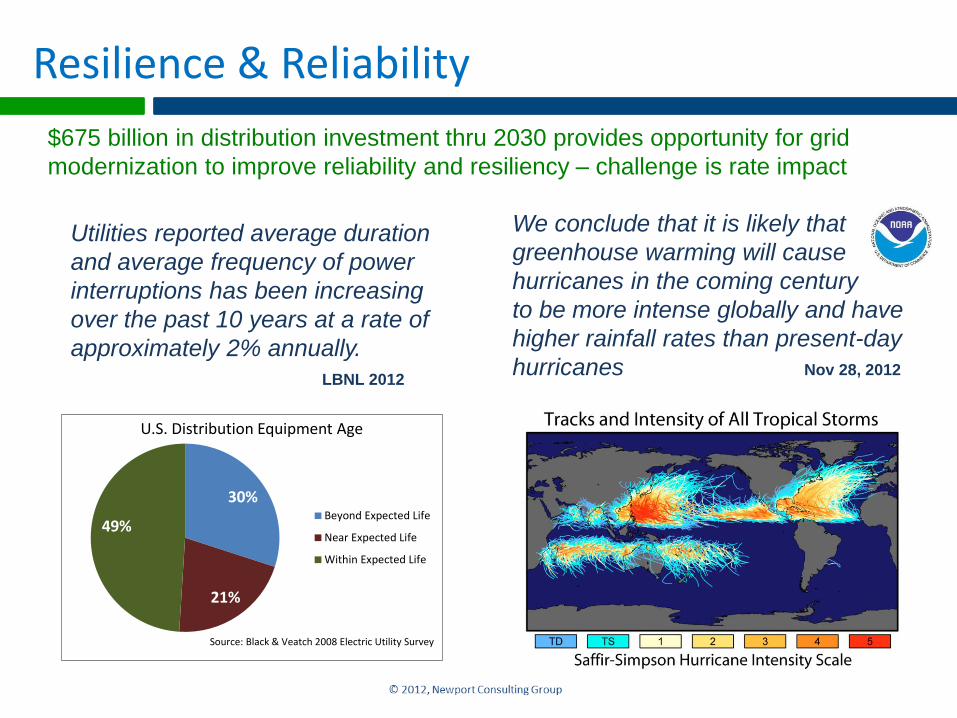
Resilience & Reliability
We conclude that it is likely that
greenhouse warming will cause
hurricanes in the coming century
to be more intense globally and have
higher rainfall rates than present-day
hurricanes Nov 28, 2012
30%
21%
49%
U.S. Distribution Equipment Age
Beyond Expected Life
Near Expected Life
Within Expected Life
Source: Black & Veatch 2008 Electric Utility Survey
Utilities reported average duration
and average frequency of power
interruptions has been increasing
over the past 10 years at a rate of
approximately 2% annually.
LBNL 2012
$675 billion in distribution investment thru 2030 provides opportunity for grid
modernization to improve reliability and resiliency – challenge is rate impact
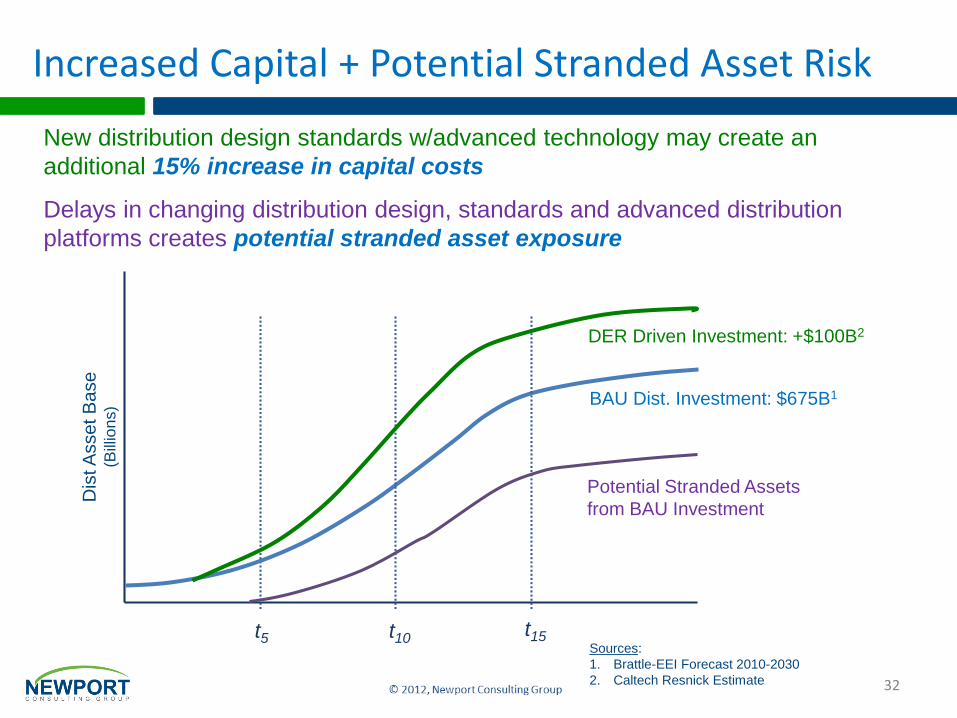
Increased Capital + Potential Stranded Asset RiskD
istA
sse
t B
ase
(Bill
ion
s)
t5 t10t15
Potential Stranded Assets
from BAU Investment
BAU Dist. Investment: $675B1
32
Sources:
1. Brattle-EEI Forecast 2010-2030
2. Caltech Resnick Estimate
DER Driven Investment: +$100B2
$775B +15%
New distribution design standards w/advanced technology may create an
additional 15% increase in capital costs
Delays in changing distribution design, standards and advanced distribution
platforms creates potential stranded asset exposure
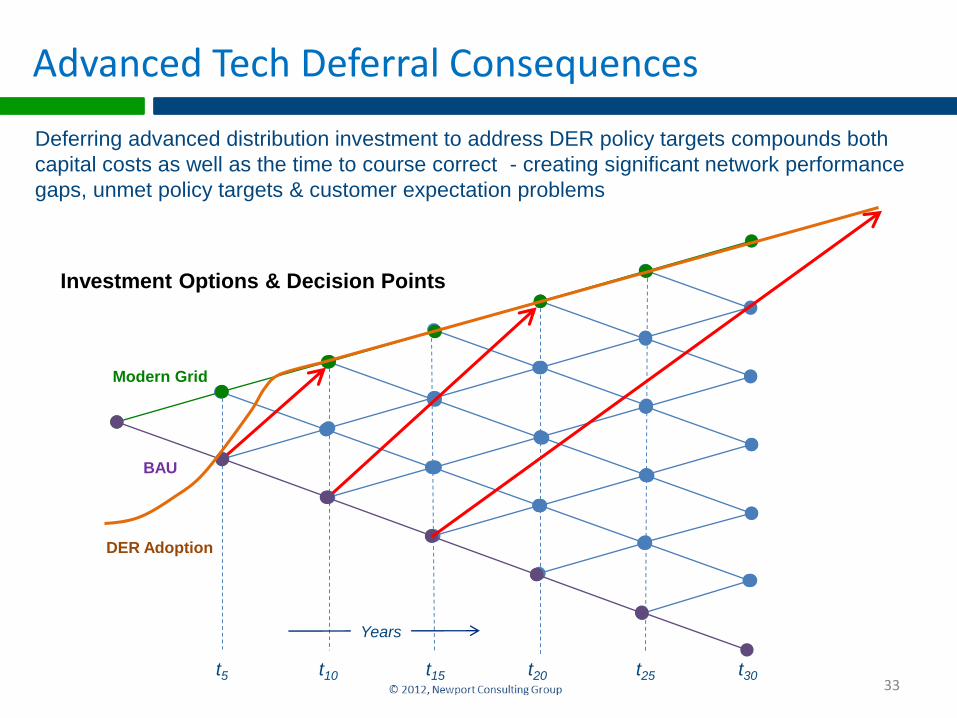
Advanced Tech Deferral Consequences
Modern Grid
BAU
t5 t10 t15 t20 t25 t30
Deferring advanced distribution investment to address DER policy targets compounds both
capital costs as well as the time to course correct - creating significant network performance
gaps, unmet policy targets & customer expectation problems
DER Adoption
33
Investment Options & Decision Points
Years
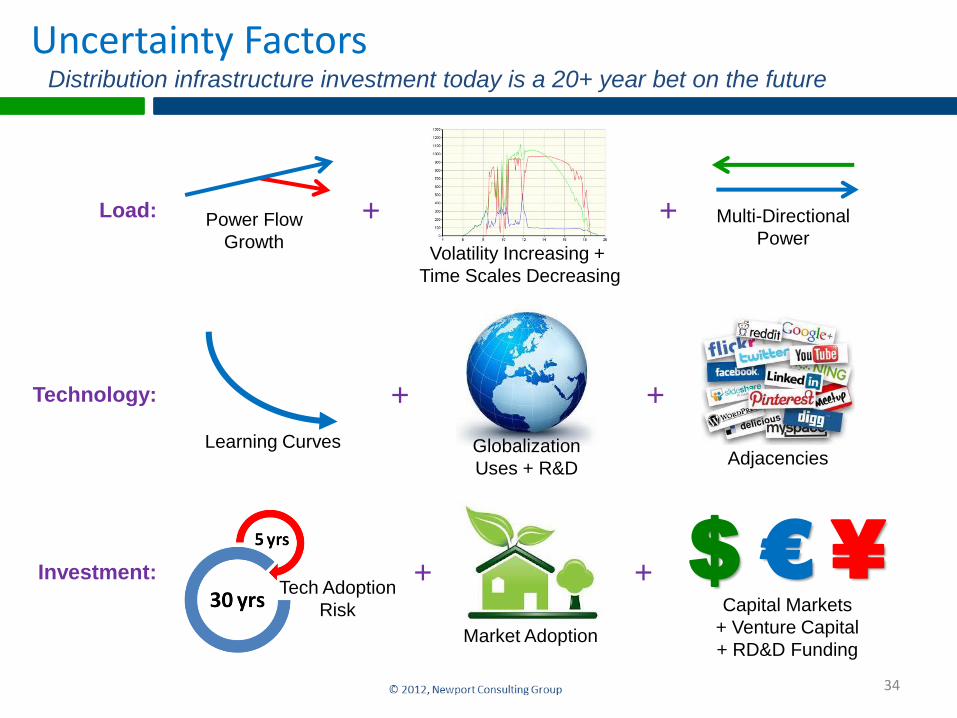
Uncertainty Factors
34
Load: Power Flow
Growth
+ + Multi-Directional
PowerVolatility Increasing +
Time Scales Decreasing
Technology: + +
AdjacenciesLearning Curves Globalization
Uses + R&D
Investment:
Market Adoption
+ + $ € ¥Capital Markets
+ Venture Capital
+ RD&D Funding
Tech Adoption
Risk
Distribution infrastructure investment today is a 20+ year bet on the future
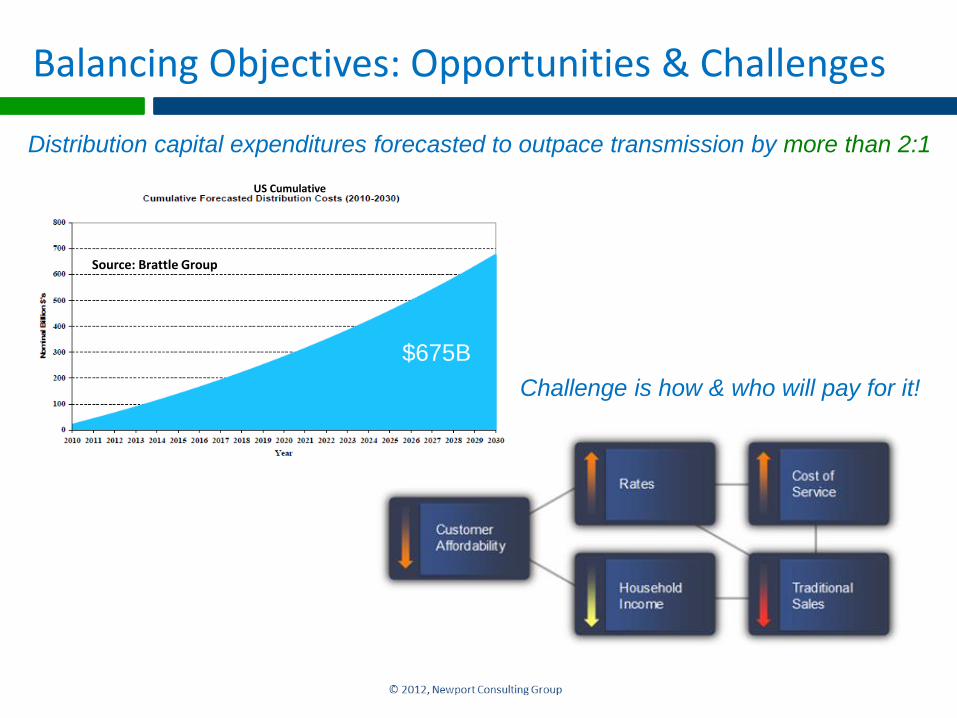
Balancing Objectives: Opportunities & Challenges
Distribution capital expenditures forecasted to outpace transmission by more than 2:1
Challenge is how & who will pay for it!
US Cumulative
Source: Brattle Group
$675B

www.newportcg.com