de grouchy, c. j. l., sanloup, c., cochain, b. , drewitt ...€¦ · lutetium incorporation in...
TRANSCRIPT

de Grouchy, C. J. L., Sanloup, C., Cochain, B., Drewitt, J. W. E., Kono, Y.,& Crépisson, C. (2017). Lutetium incorporation in magmas at depth: changesin melt local environment and the influence on partitioning behaviour. Earthand Planetary Science Letters, 464, 155-165.https://doi.org/10.1016/j.epsl.2017.02.017
Peer reviewed version
Link to published version (if available):10.1016/j.epsl.2017.02.017
Link to publication record in Explore Bristol ResearchPDF-document
This is the author accepted manuscript (AAM). The final published version (version of record) is available onlinevia Elsevier at http://www.sciencedirect.com/science/article/pii/S0012821X17300857 . Please refer to anyapplicable terms of use of the publisher.
University of Bristol - Explore Bristol ResearchGeneral rights
This document is made available in accordance with publisher policies. Please cite only the publishedversion using the reference above. Full terms of use are available:http://www.bristol.ac.uk/pure/about/ebr-terms
Lutetium incorporation in magmas at depth: changes in melt
local environment and the influence on partitioning behaviour
Charlotte J. L. de Grouchy1∗, Chrystele Sanloup2, Benjamin Cochain2, James W. E.Drewitt3, Yoshio Kono4, Celine Crepisson2
1Centre for Science at Extreme Conditions and School of Physics and Astronomy, University ofEdinburgh, EH9 3FD, UK. *Corresponding author ([email protected]).
2Sorbonne Universites, UPMC Univ Paris 06, CNRS, Institut des Sciences de la Terre de Paris(ISTeP), 75005 Paris, France
3School of Earth Sciences, University of Bristol, Wills Memorial Building, Queens Road, Bristol,BS8 1RJ, UK.
4HPCAT, Geophysical Laboratory, Carnegie Institution of Washington, USA
Abstract
The structure of two Lu doped (4000 ppm) model end member silicate liquids, a highly
polymerised haplogranite (Si-Al-Na-K-O) and a less polymerised anorthite-diopside (Si-
Al-Mg-Ca-O), have been studied up to 8 GPa using in situ x-ray diffraction techniques.
The results are the first to identify trace rare Earth element incorporation in silicate
melts at high pressure. At pressures below 5 GPa, the bonding environment of Lu-O
was found to be dependent on composition with coordination number CNLu−O = 8 and
bond distance rLu−O = 2.36 A in the haplogranite melt, decreasing to CNLu−O = 6 and
rLu−O = 2.29 A in the anorthite-diopside melt. This compositional variance in coordi-
nation number at low pressure is consistent with observations made for Y-O in glasses
at ambient conditions and is coincident with a dramatic increase in the partition coeffi-
cients previously observed for rare Earth elements with increasing melt polymerisation.
With increasing pressure we find that CNLu−O and rLu−O remain constant in the haplo-
granite melt. However, an abrupt change in both Lu-O coordination and bond distance
is observed at 5 GPa in the anorthite-diopside melt, with CNLu−O increasing from 6 to
8-fold and rLu−O from 2.29 to 2.39 A. This occurs over a similar pressure range where a
change in the P-dependence in the reported rare Earth element partition coefficients is
observed for garnet-, clinopyroxene-, and olivine-melt systems. This work shows that
standard models for predicting trace elements at depth must incorporate the effect of
pressure-induced structural transformations in the melt in order to realistically predict
partitioning behaviour.
Preprint submitted to EPSL December 10, 2016

1. Introduction1
Trace elements are highly fractionated during planetary differentiation events, be-2
cause of differential partitioning between minerals, melts and metals at high pressures3
(P ) and temperatures (T ). The resulting partition coefficients are used as key indicators4
of depth, temperature, composition and potential age of melting events since planetary5
formation (McIntire (1963)). Trace element partitioning behaviour at mantle pressures6
is of particular interest for dating early crust formation on Earth and the Lu/Hf iso-7
tope system is regularly used to constrain early Earth melting processes (Guitreau et al.8
(2012)). Many studies have shown that variables such as composition, P , T and oxygen9
fugacity have a control on the mineral/melt partitioning of trace elements (see Wood10
and Blundy (2013) and references within). Although it has long been recognised that11
crystal chemistry and composition play a major role in controlling how elements parti-12
tion (Blundy and Wood, 1994), fewer studies have focused on the influence of the melt13
structure due to the lack of systematic experimental data (Corgne et al., 2012).14
Variations in the melt however do influence partitioning significantly, as first re-15
ported by several compositional studies, e.g. olivine/melt Ni partitioning (Hart and16
Davis, 1978), rare earth elements (REEs) partitioning between granitic and gabbroic17
melts (Ryerson and Hess, 1978; Schmidt et al., 2006), REE clinopyroxene/melt parti-18
tioning (Gaetani, 2004), titanite/melt trace element partitioning (Prowatke and Klemme,19
2005), REE forsterite/melt partitioning (Evans et al., 2008). As the polymerisation of20
the melt was increased, a two orders of magnitude increase in partition coefficient for21
trivalent rare earth elements such as Lu, Y, La, is observed with high field strength22
elements (HFSE) such as Hf and Zr unaffected (Prowatke and Klemme, 2005; Schmidt23
et al., 2006). Prowatke and Klemme (2005) concluded that the polymerisation of the24
melt reduces the number of non-bridging oxygens available to bond with the trivalent25
cations, resulting in a preference for REEs to enter less polymerised melt structures.26
This was confirmed by a molecular dynamic study of Y in silicate melts (Haigis et al.,27
2013), that demonstrated the greater affinity of Y for Ca than for Si or Al in depolymer-28
ized melts, due to the weaker nature of the Ca-O bond compared to the Si(Al)-O bonds,29
resulting in more non-bridging oxygens being effectively available for Y. If pressure also30
has a significant effect on the melt structure and influence the compatibility of ele-31
ments, then our current perception of how these element pairs behave at the conditions32
of melting may be altered.33
To predict partitioning ratios, current models are based on experimental data for34
2

partition coefficients measured within individual systems and extrapolated for different35
size and charge of cations. One model that is frequently used to predict partitioning36
ratios is the ‘lattice strain model’ (Blundy and Wood, 1994). This incorporates the37
effect of ionic radius, charge and cation size in a model that links the parabolic relation38
between the partition coefficient and ionic radius with the size of the ion and Young’s39
modulus or elasticity of the lattice site. No explicit term for the effect of melt structure40
is included as it is assumed to be negligible and can be summarised within the initial41
measured partitioning ratio D0, which normalises the partition coefficient of a chosen42
cation with a specific melt composition.43
Amongst the few existing studies on REE partitioning with pressure, only the gar-44
net/melt, clinopyroxene/melt and olivine/melt systems have been studied over a P -45
range large enough to cover most terrestrial magmatic processes i.e. up to 5-6 GPa,46
other studies being restricted to below 3.5 GPa. The garnet/melt studies show a change47
in the P -dependence of mineral/melt partitioning, with an initially large decrease in48
partition coefficient and a compatibility plateau after 5 GPa. (Figure 1). For Hf and Zr49
this trend was not observed and they were largely unaffected. This would suggest that at50
P >5 GPa partition coefficients between REE and 4+ cations may become similar. The51
transition to majorite may be the cause of this change in REEs partitioning behaviour52
(Draper et al., 2003), however, it does so at the cost of a reduced site elasticity and53
reduced cation size which is incompatible with mineral physics rules. To solve inconsis-54
tencies in apparent site elasticity trends, van Westrenen and Draper (2007) introduced55
corrections for T including an empirical correction for site elasticity by fitting a larger56
set of garnet/melt partitioning data. Under increased T , Dmineral/melt is expected to get57
closer to unity due to the induced thermal disorder on crystal lattice sites. This better58
parameterisation of the lattice strain model clearly improved its robustness, although59
site elasticity values outside the 500-600 GPa range still cannot be reproduced. Be-60
sides, later datasets showed the strongest P -change of Dgarnet/meltLu between 3 and 8 GPa61
(Figure 1), where data were collected over a 100 K T -range only (Suzuki et al., 2012).62
Datasets collected on larger P -ranges (up to 17 GPa for (Corgne et al., 2012) and 2063
GPa for Suzuki et al. (2012) vs up to 10 GPa for van Westrenen and Draper (2007))64
point out a worsening of the predictive value of the model at higher pressures. Clinopy-65
roxene/melt partitioning studies at P up to 3.5 GPa have been parameterized by Wood66
and Blundy (1997) and subsequent papers. The exploration of a larger compositional67
space at 1.5 GPa demonstrated the dependence of DCPx/meltREE on melt polymerization68
3

rather than crystal composition (Gaetani, 2004), an effect restrained to compositions69
closed to the lherzolite solidus. Higher P data collected up to 12 GPa (Suzuki et al.,70
2012) show an overall similar P -trend to the garnet/melt system (Figure 1). In the71
case of olivine/melt data, the REE partition coefficients decrease with increasing silica72
in the melt at room P (Evans et al., 2008). This is at odds with the main stream of73
studies showing the opposite behaviour (Hart and Davis, 1978; Ryerson and Hess, 1978;74
Prowatke and Klemme, 2005; Schmidt et al., 2006), and might be taken with caution as75
the authors pointed out the poor fit statistics (Evans et al., 2008). Under high P , REE76
partition coefficients between olivine and peridotitic melt for 3+ cations decrease with77
increasing pressure between 2-10 GPa (Imai et al., 2012). As for garnet, the apparent78
site elasticity behaves anomalously with P , decreasing by 200 GPa of which the T -effect79
can only explain a maximum of 33 GPa. Instead, Imai et al. (2012) proposed that elas-80
ticity of the cation site in the melt affects partitioning as changes on the crystal lattice81
alone would not produce a large enough effect. It is currently challenging to test this82
hypothesis without a proper understanding of site elasticity in melts. It is nonetheless83
true that the large compressibility difference between melts and crystals that exists at84
ambient pressure largely diminishes with pressure (see Sanloup (2016) for a review and85
references therein) as the melt becomes much harder to compress. Consequently, it86
is expected that the strain energy resulting from the insertion of REE elements in the87
melt ceases to be negligible. However, the fine P -mesh available for the Gt/melt system88
implies that the strong change in P -dependence of DGt/meltLu excludes a purely gradual89
transformation, an effect that could be artificially smoothed for CPx/melt, Olivine/melt90
systems due to the insufficient mapping of the P space. Rather, the observations on91
garnet/melt, clinopyroxene/melt and olivine/melt systems, taken together, point to a92
potential change in trace element local environment. As pointed out by Haigis et al.93
(2013), if melt properties exert some control on element partitioning, their influence is94
hidden in the adjustable parameters used in current lattice strain models, and as such,95
cannot be predicted nor explained by the model. In their development of a predictive96
mineral-melt partitioning model for clinopyroxene, Wood and Blundy (1997) assumed97
that mineral-like trace element sites are present in silicate melt. However, if the nature98
of the quasi-crystalline components changes, the energetics of partitioning are such that99
partitioning should also change (van Westrenen et al., 2000).100
Studies on silicate glasses, and more recently liquids, have shown that structural101
alterations do occur within the liquid with increasing pressure. For example, major102
4
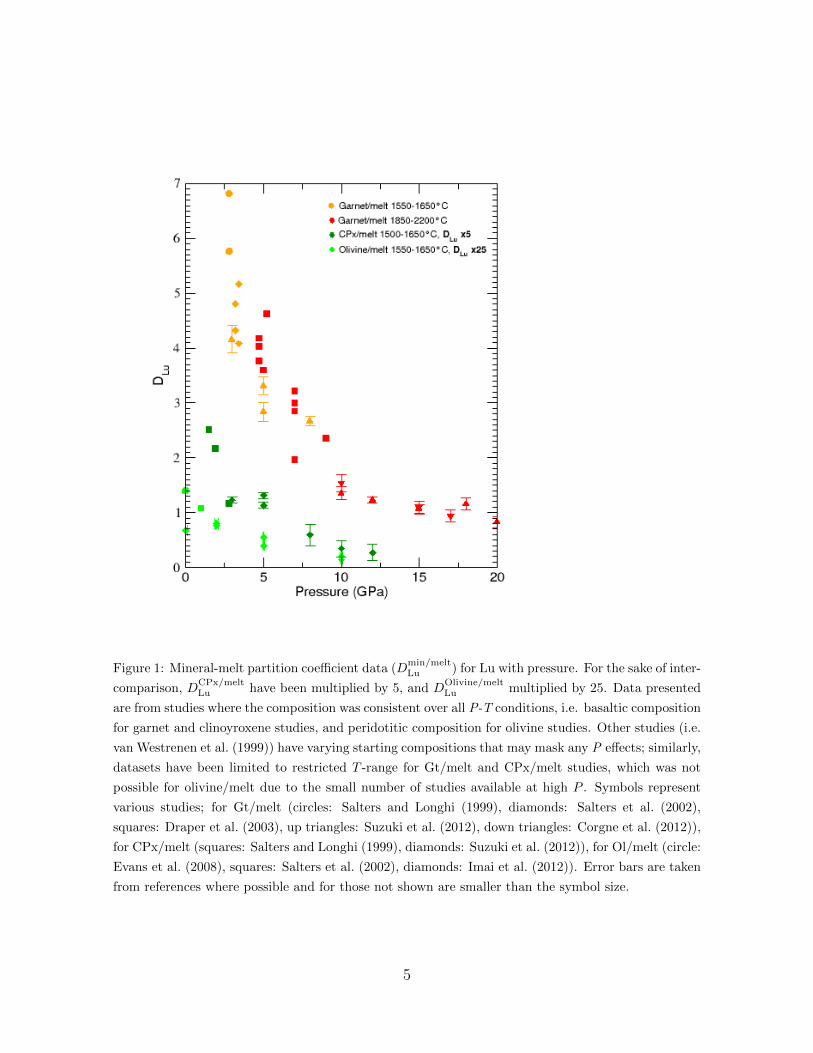
Figure 1: Mineral-melt partition coefficient data (Dmin/meltLu ) for Lu with pressure. For the sake of inter-
comparison, DCPx/meltLu have been multiplied by 5, and D
Olivine/meltLu multiplied by 25. Data presented
are from studies where the composition was consistent over all P-T conditions, i.e. basaltic composition
for garnet and clinoyroxene studies, and peridotitic composition for olivine studies. Other studies (i.e.
van Westrenen et al. (1999)) have varying starting compositions that may mask any P effects; similarly,
datasets have been limited to restricted T -range for Gt/melt and CPx/melt studies, which was not
possible for olivine/melt due to the small number of studies available at high P . Symbols represent
various studies; for Gt/melt (circles: Salters and Longhi (1999), diamonds: Salters et al. (2002),
squares: Draper et al. (2003), up triangles: Suzuki et al. (2012), down triangles: Corgne et al. (2012)),
for CPx/melt (squares: Salters and Longhi (1999), diamonds: Suzuki et al. (2012)), for Ol/melt (circle:
Evans et al. (2008), squares: Salters et al. (2002), diamonds: Imai et al. (2012)). Error bars are taken
from references where possible and for those not shown are smaller than the symbol size.
5
element coordination changes have been reported in silicate melts at high pressure, in-103
cluding Si-O coordination change from 4 to 6 above 15-35 GPa (Sanloup et al., 2013;104
Sato and Funamori, 2010) and the change in Al-O coordination from fully 4-fold co-105
ordination to 50% 6-fold between 2-12 GPa (Drewitt et al., 2015; Yarger et al., 1995).106
However as yet no minor element incorporation in silicate melts has been studied in107
situ at high pressure. Simon et al. (2013) have investigated the local structural environ-108
ment of Y in silicate glasses using Extended X-ray Absorption Fine Structure (EXAFS)109
at ambient conditions. They studied the bonding environment of Y within the same110
glasses as Prowatke and Klemme (2005) and discovered that increasing melt polymeri-111
sation leads to an increase in Y coordination from 6 to 8, with a corresponding increase112
in average bond distance from 2.28 A to 2.38 A. Ponader and Brown (1989) observed a113
similar compositional variance for La with CNLa−O increasing from 7 to 9 in the higher114
polymerised melt, with rLa−O also lengthening from 2.42 to 2.59 A. In contrast, Farges115
(1996) observed a constant CN of 6 for HFSE Zr in silicate glasses, at the exception116
of a minor amount of octahedral Zr in their most polymerised rhyolitic composition.117
All these studies suggest that an increase in REE coordination results in an increase in118
bond length and indicate that important structural changes within the melt, not just119
the crystal lattice, impact REE local structure and partitioning. Nevertheless, to date120
all these studies have been carried out on quenched glass systems and not in situ at the121
conditions of melt formation.122
X-ray diffraction at high pressure and temperature is a well-established technique123
for studying silicate liquid structures in situ (see the initial study by Funamori et al.124
(2004) to the current highest P-T range (Sanloup et al. (2013)) but has not previously125
been applied to trace element studies due to the low concentrations of trace elements126
(<0.1 wt%) required to represent natural systems. X-ray diffraction has the benefit of127
providing information on both the short and medium range structure of the melt, includ-128
ing absolute distance and average coordination numbers, without relying on structural129
models. In this study we employ two end member melt compositions, silicic haplogran-130
ite and a ‘model basalt’ iron-free anorthite-diopside to monitor structural changes at131
high pressure and temperature that may affect the incorporation of Lu at 4000 ppm132
concentration into the melt.133
6

Table 1: Compositions from electron microprobe analysis of both initial and recovered samples. HPG
(haplogranite) and AnD (anorthite-diopside) compositions given in wt.% oxide. Analyses are based on
average of a minimum of 10 sample spots, standard deviations are shown in brackets. *The low totals
for the HPG composition are due to the presence of water in the sample and correspond well with the
amounts added during synthesis.
Oxide HPG initial HPG recovered AnD Initial AnD Recovered
SiO2 71.6 (7) 73.2 (4) 48.8 (5) 46.9 (7)
Al2O3 10.5 (3) 10.7 (1) 14.7 (2) 14.4 (4)
Na2O 3.3 (3) 3.6 (2) - -
K2O 3.7 (1) 3.8 (1) - -
MgO - - 10.2 (2) 14.2 (2)
CaO - - 22.7 (2) 21.6 (2)
Lu2O3 3.9 (1) 3.9 (1) 3.6 (1) 3.3 (1)
Totals 93.0* (6) 95.7* (3) 100.2 (6) 100.5 (6)
2. Experimental Methods134
2.1. Glass Synthesis135
The haplogranite (HPG) and anorthite-diopside (AnD) glasses were synthesised by136
mixing appropriate amounts of reagent grade oxides (SiO2, Al2O3, MgO) and carbonates137
(K2CO3, Ca2CO3, Na2CO3) from Alfa Aesar (Table 1). The corresponding degree of138
polymerization as expressed by the NBO/T ratio is 0.4 for the HPG glass, and 1.28139
for the AnD glass. The mixed powders were ground in an agate pestle and mortar140
and decarbonated via a slow ramp for 12 hours at 1273 K, then fused at 1873 K in a141
platinum crucible for 1 hour. The molten glass was quenched by immediately placing142
the crucible into cold water. The glass was checked for homogeneity, crushed and re-143
ground under acetone and finally fused again three times. Lu was added in the form of144
high purity Lu2O3 (>99.99%) at the desired concentration (Table 1) to a portion of the145
ground glass in order to have both a doped and plain sample of each composition for146
comparison. This glass was crushed, re-ground, re-melted at 1873 K and re-fused three147
times to ensure homogeneous distribution of Lu. All glasses were free from bubbles and148
contained no signs of crystallisation. The samples were crushed to a fine homogeneous149
powder before being loaded. The samples were free from iron to minimize the number of150
elements with bond lengths between 2.2-2.4 A, as these overlap the Lu-O bond distance.151
7

In order to lower the melting temperature of the haplogranite to temperatures152
achievable in a resistively heated diamond anvil cell (<1270 K), water was added to the153
sample through high pressure addition in a piston-cylinder press. Platinum capsules154
were welded containing finely ground haplogranite with 8-10 wt.% H2O and held for155
4 hours at 2 GPa and 1670 K to ensure full homogenisation. The samples were fast156
quenched by immediately cutting power to the press. Final totals of water were between157
6-8% over 4 runs as estimated from the recovered sample analysis (Section 2.3).158
2.2. X-ray Diffraction159
Two experimental methods were used to obtain structural data at high pressure and160
temperature conditions. 1) Measurements on HPG melts were carried out up to 8 GPa161
and 1100 K using angle-dispersive x-ray diffraction in resistively heated diamond anvil162
cells (DACs) on beamline I-15 at the Diamond Light Source (Harwell Campus, UK).163
2) Experiments on the AnD melts up to 8 GPa and 2000 K were collected on beamline164
16-BM-B, HP-CAT, at the Advanced Photon Source (Argonne National Laboratory,165
USA) by energy-dispersive x-ray diffraction. High P-T conditions were generated by166
use of a Paris-Edinburgh press. Ambient temperature AnD glass data were collected167
using DACs on beamline 13-ID-D, GSECARS, at the Advanced Photon Source by168
angle-dispersive x-ray diffraction to ensure that the obtained structural data are not169
dependent on the type of pressure apparatus (Figure 4 top panel). Ambient pressure170
AnD glass data were collected on the PSICHE beamline at Synchrotron Soleil, Paris,171
France (for Lu doped AnD glass) and at P02.2 beamline at PETRA III synchrotron in172
Hamburg, Germany (for plain AnD glass).173
To create the high temperature conditions in the DAC, we have used the internal174
heating technique developed by Fei and Mao (1994) using a Pt wire. Sample was loaded175
into the 250 µm hole of a rhenium gasket previously indented to 90 µm thickness. In176
order to access the highest possible Q-range, we used 70◦ opening Boehler-Almax seats.177
Temperature was recorded by a K-type thermocouple placed on the very edge of the178
gasket indent as close to the sample chamber as possible. Thermocouples were previ-179
ously calibrated using materials of known melting temperature (Pb and Na2CO3) in180
order to constrain the error in temperature and the thermal gradient within the sample181
chamber. High energy x-rays (0.2637 A wavelength) were used to achieve maximum182
signal intensity from the low scattering sample with a beam focussed to 70×70 µm2).183
Diffraction patterns were collected for the glass and melt for 60 s using a Perkin Elmer184
detector at each pressure point (Table 2), and a background dark image was collected185
8

after each measurement in order to subtract the inherent electronic noise of the detec-186
tor. Pressure was determined before each experiment by ruby fluorescence and at high187
temperature it was monitored by a Pt foil inserted into the sample chamber. Diffraction188
on the Pt calibrant was collected for 10 s at each pressure before and during heating.189
For each loading, measurements were collected on the samples, and afterwards the gas-190
ket was unloaded and replaced in the cell in order to collect the background scattering191
signal.192
A detailed description of the Paris-Edinburgh press experimental techniques and cell193
design can be found in Kono et al. (2014). The experimental conditions are detailed in194
Table 2 with pressure determined from the cell-volume change of the pressure transmit-195
ting medium in the form of an MgO cylinder. Temperature was estimated by previous196
power calibrations using this cell assembly (Kono et al. (2014)). This calibration also197
accounts for the effect on pressure of the distance between the sample and MgO ring at198
high temperature using the P-V-T relation of MgO and elastic wave velocity measure-199
ments (Kono et al. (2010)). Diffraction patterns on the MgO were collected at room200
temperature and above the melting temperature. X-ray diffraction was collected for201
2 hours using an energy-dispersive germanium solid-state detector at ten 2θ angles (2◦,202
2.7◦, 3.5◦, 5◦, 7◦, 10◦, 15◦, 20◦, 27◦, 35◦) enabling coverage up to 20 A−1 in reciprocal203
space with Q = 4πE sin θ/12.398, where E is the energy of the x-rays in keV up to204
>100 keV.205
2.3. Recovered Sample Analysis206
Recovered HPG quenched samples were polished for electron microprobe analysis207
at the EMMAC (The Edinburgh Materials and Micro-Analysis Centre), University of208
Edinburgh. Analyses were carried out using a CAMECA SX100 electron microprobe209
with an accelerating voltage of 15 keV and 8 µm beam size. Where glass was recovered210
the samples retained a stoichiometry nearly identical to their starting compositions211
(Table 1); therefore it is unlikely the samples underwent any major chemical change212
during the experiments and no loss of Lu. Back scattered electron images taken of213
the sample show no evidence for quench crystallisation and the sample appears glassy214
(Figure 2b). Bubbles are present in the HPG which is probably due to exsolution215
of water during quenching indicating that water remained in the sample during the216
experiment. The low microprobe totals (Table 1) for the HPG composition are due217
to the presence of water in the sample. Quenched AnD samples were analysed at the218
Centre de Microanalyse Camparis, University Pierre and Marie Curie. These results219
9

Figure 2: Left: Recovered sample from AnD experiment A8-a using a Paris-Edinburgh press. Right:
Recovered sample from HPG experiment D8 from resistive heated DAC polished within Re gasket.
Spots are bubbles within the hydrous sample.
(Table 1) show that when the sample quenched to a glass (Figure 2a) the composition220
after the experiment was nearly identical.221
2.4. Data Processing222
Angle-dispersive diffraction patterns were radially integrated using FIT2D (Ham-223
mersley (1996)), with a mask applied to crystalline Bragg peaks that arise from diffrac-224
tion of the single crystal diamond anvils. The measured experimental intensity, I(Q),225
contains scattering by both the sample and background contributions, where Q =226
4πλ
sin θ and λ is the x-ray beam wavelength. In order to isolate the intensity that con-227
tains only the structural information, corrections for background intensity, IB(Q), and228
attenuation, A(Q), from the sample must be made to the measured intensity given by229
I(Q) = Is(Q) + A(Q)IB(Q) + Iinc(Q), (1)
where Is(Q) represents the scattering from the sample containing only structural230
information, and Iinc(Q) represents the incoherent scattering from the atoms, arising231
from the sum of the self∑
α cαfα(Q)2 and Compton scattering∑
α cαCα(Q), where232
cα is the concentration of species α. The values for the self and Compton scattering233
10
amplitudes are documented by Hajdu (1972); Hubbell et al. (1975). The Faber-Ziman234
total structure factor, S(Q), (Faber and Ziman (1965)) is then determined by;235
S(Q)− 1 =K[Is(Q)− A(Q)IB(Q)]− Iinc(Q)
〈f 2(Q)〉, (2)
where K is required to normalise the data to the incoherent scattering profile and the236
total structure factor is normalised to the average scattering 〈f 2(Q)〉 = (∑
α cαfα(Q))2.237
The radial distribution functions, G(r), are then obtained from a Fourier transform of238
the S(Q) as:239
G(r)− 1 =1
2π2rn0
∞∫0
Q[S(Q)− 1] sin(Qr)dQ, (3)
where n0 is the atomic density in atoms per A3 and the experimental values are listed240
in Table 2. The densities were estimated by fixing CNSi−O = 4 and dSi−O = 1.61 A and241
integrating under the Si-O contribution for each run (cf section 3.2 and Table 2), as242
well as applying self-consistency checks. These included ensuring the S(Q) followed the243
sum rule∫∞0
[S(Q) − 1]Q2dQ = −2πn0, and that at low-r any unphysical oscillations244
were minimised as G(r = 0) = 0 (Zeidler et al. (2009); Drewitt et al. (2013)).245
For the energy dispersive x-ray diffraction data collected on HP-CAT, Bragg peaks246
arising from the diffraction of graphite in the cell assembly, and fluorescence of indium247
on the detector and Lu were removed at each angle. If peaks were at >30% concentra-248
tion between the energies of interest (25 to 55 keV) the data were discarded. Where249
required, fits were made to the data to extrapolate the signal after the Bragg peaks were250
removed. The aEDXD program developed by Changyong Park (see Kono et al. (2014))251
was then used to scale the primary beam by least squares fitting at the highest 2θ angle,252
and an evenly spaced S(Q) function was produced by error weighted spline smoothing253
of the merged data in Q-space. This technique is based on the highest diffraction angle254
oscillating around 1 because as Q → ∞, S(Q) → 1. The G(r) was then obtained by255
Fourier Transform of the spline smoothened S(Q) (Equation 3).256
For the sake of comparison between EDX and ADX data, all S(Q) were cut at257
12 A−1 in order to have the same spatial resolution in the direct space on obtained258
G(r).259
11
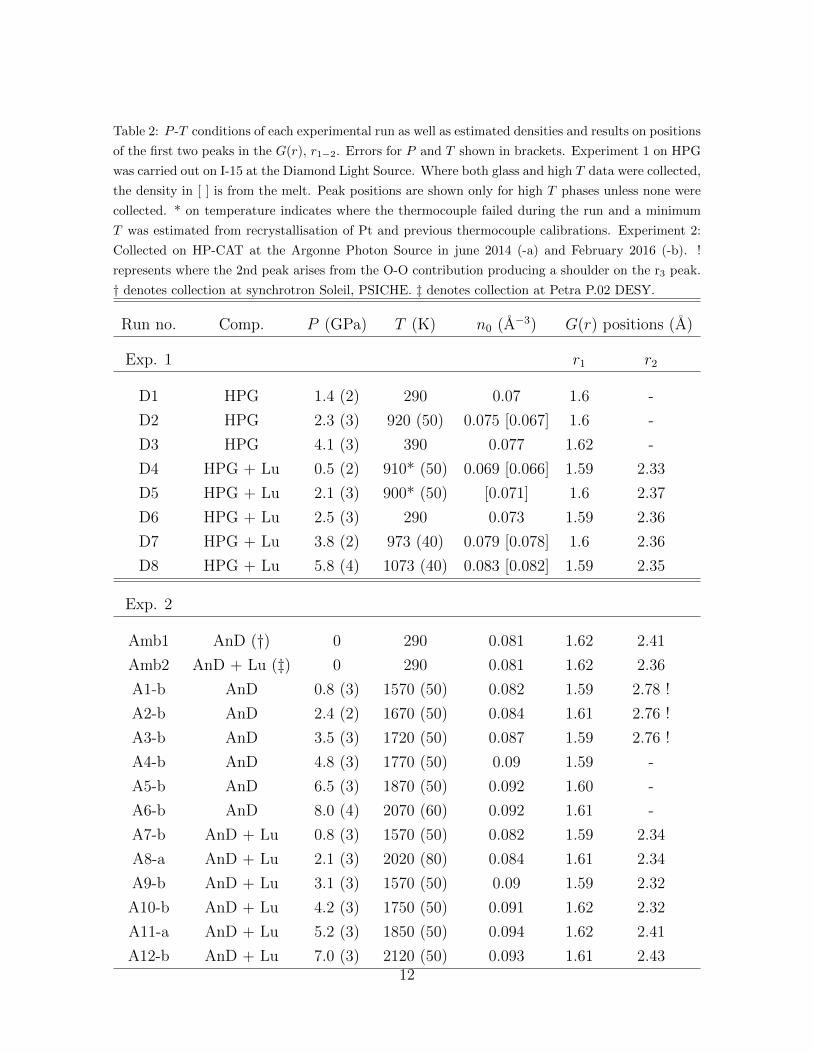
Table 2: P -T conditions of each experimental run as well as estimated densities and results on positions
of the first two peaks in the G(r), r1−2. Errors for P and T shown in brackets. Experiment 1 on HPG
was carried out on I-15 at the Diamond Light Source. Where both glass and high T data were collected,
the density in [ ] is from the melt. Peak positions are shown only for high T phases unless none were
collected. * on temperature indicates where the thermocouple failed during the run and a minimum
T was estimated from recrystallisation of Pt and previous thermocouple calibrations. Experiment 2:
Collected on HP-CAT at the Argonne Photon Source in june 2014 (-a) and February 2016 (-b). !
represents where the 2nd peak arises from the O-O contribution producing a shoulder on the r3 peak.
† denotes collection at synchrotron Soleil, PSICHE. ‡ denotes collection at Petra P.02 DESY.
Run no. Comp. P (GPa) T (K) n0 (A−3) G(r) positions (A)
Exp. 1 r1 r2
D1 HPG 1.4 (2) 290 0.07 1.6 -
D2 HPG 2.3 (3) 920 (50) 0.075 [0.067] 1.6 -
D3 HPG 4.1 (3) 390 0.077 1.62 -
D4 HPG + Lu 0.5 (2) 910* (50) 0.069 [0.066] 1.59 2.33
D5 HPG + Lu 2.1 (3) 900* (50) [0.071] 1.6 2.37
D6 HPG + Lu 2.5 (3) 290 0.073 1.59 2.36
D7 HPG + Lu 3.8 (2) 973 (40) 0.079 [0.078] 1.6 2.36
D8 HPG + Lu 5.8 (4) 1073 (40) 0.083 [0.082] 1.59 2.35
Exp. 2
Amb1 AnD (†) 0 290 0.081 1.62 2.41
Amb2 AnD + Lu (‡) 0 290 0.081 1.62 2.36
A1-b AnD 0.8 (3) 1570 (50) 0.082 1.59 2.78 !
A2-b AnD 2.4 (2) 1670 (50) 0.084 1.61 2.76 !
A3-b AnD 3.5 (3) 1720 (50) 0.087 1.59 2.76 !
A4-b AnD 4.8 (3) 1770 (50) 0.09 1.59 -
A5-b AnD 6.5 (3) 1870 (50) 0.092 1.60 -
A6-b AnD 8.0 (4) 2070 (60) 0.092 1.61 -
A7-b AnD + Lu 0.8 (3) 1570 (50) 0.082 1.59 2.34
A8-a AnD + Lu 2.1 (3) 2020 (80) 0.084 1.61 2.34
A9-b AnD + Lu 3.1 (3) 1570 (50) 0.09 1.59 2.32
A10-b AnD + Lu 4.2 (3) 1750 (50) 0.091 1.62 2.32
A11-a AnD + Lu 5.2 (3) 1850 (50) 0.094 1.62 2.41
A12-b AnD + Lu 7.0 (3) 2120 (50) 0.093 1.61 2.4312

Figure 3: S(Q) for samples listed in Table 2. Black solid lines show Lu doped samples and red dashed
curves are the undoped samples at similar pressures. Top panel (A) shows HPG data with pressures
shown for the Lu-doped measurements, and undoped glass spectra within 0.5 GPa of these. Glass
measurements are shown due to a lack of high-T data at each P , however as discussed in Section 3.1,
the HPG glass is analogous to the melt. Lower Panel (B) shows AnD melt experiments at >1500 K
and undoped samples are within 1 GPa of given P .
13

3. Results260
3.1. Overall structural description261
Ambient and high temperature data were collected on Lu-doped and undoped sam-262
ples at similar pressure points and when possible, quench measurements were taken on263
all runs (Table 2). The S(Q) and G(r) are shown in Figures 3 and 4. During heating264
HPG samples, at temperatures >850 K the samples either recrystallised or remained265
amorphous due to the strong glass forming nature of SiO2-rich liquids. On these time266
scales (>1 hour) recrystallization would be expected to occur above the glass transi-267
tion temperature at ∼850 K (Dingwell, 1998). Therefore, if recrystallization did not268
occur at these temperatures, the samples were in the super-cooled liquid state. Two269
experiments (D2 and D7) were conducted at T exceeding the liquidus temperature for270
haplogranite (Holtz et al. (1992)). From our results, the local environment of Lu in the271
melt phase and the ambient temperature glass phase are identical as no changes were272
observed in the corresponding G(r) (grey and red solid lines on Figure 4). In Figure273
3A the first sharp diffraction peak (FSDP) is seen at 1.98 A−1 at 0.5 GPa-room T with274
little change over the P -range presented here (up to 2.01 A−1 at 5.8 GPa-room T ). This275
is higher than in the dry HPG glass where the FSDP is at 1.67 A−1 and reflects the276
depolymerisation of the glass induced by water (Anderson et al., 2014), an effect also277
reported by forsterite-enstatite melts (Yamada et al., 2007). Alteration to the S(Q)278
from the scattering of Lu is seen in the 2nd peak between 3-5 A−1, where the peak279
appears less broad in the Lu-doped case with slightly greater intensity on the upward280
slope at 3-4 A−1.281
The measured S(Q) for the Lu doped AnD compositions are shown in the lower282
panel (B) of Figure 3 along with undoped samples for comparison. The FSDP shows a283
gradual increase from 2.05 to 2.1 A−1 from ambient conditions to 7 GPa. An increase in284
the FSDP has been seen for other silicate glass and melt compositions and is attributed285
to the collapse of open cages in the SiO2 network (Benmore et al. (2010); Meade et al.286
(1992)). A similar increase in intensity between 3-4 A−1, as observed in the HPG, is287
seen in the Lu-doped AnD S(Q).288
The resulting real space distribution functions, G(r), are shown in Figure 4B. The289
main peak positions, atomic densities and uncertainties in real space for each data290
point are detailed in Table 2. In both compositions the first peak in the G(r), r1, is291
attributed to the dSi−O at 1.61(2) A with 4-fold coordination as shown in other silicate292
glass, liquid and crystalline structures (Sato and Funamori (2010); Meade et al. (1992)).293
14

Figure 4: Radial distribution functions from the S(Q) shown in Figure 3 and detailed in Table 2.
Black solid lines are Lu-doped and red dashed are undoped samples as described in Figure 3. In the
HPG (A) grey solid line was collected at high-T and show the similarity between molten high P HPG
samples and their respective glass. * highlights the effect of Lu-O on the G(r) and r2 position. In the
AnD (B), at >5 GPa, the + marks where the peak shifts to higher r. In the AnD (B) dotted orange
line was collected using a DAC at room T and is similar to the G(r) obtained using a PE cell.
15
In the HPG, the second peak, r2, only appears within the doped samples (D4-D8) at294
2.36 (3) A and is attributed to the Lu-O bond distance. In the undoped AnD, the295
second contribution arises from the Ca-O correlations at ∼2.4 A and overlaps the Lu-296
O distance. However the r2 peak in the doped AnD can be clearly seen to increase297
in intensity and shift to lower r with the introduction of Lu in the ambient samples298
(Figure 4B). The correlations observed at 3.0(2) A in the HPG and 3.2(3) A in the299
AnD are attributed to the sum of the O-O and Si-Si contributions and match well with300
G(r) observed in other studies (Crepisson et al. (2014); Sanloup et al. (2013)) and with301
MD simulations by Vuilleumier et al. (2009) on similar compositions. In the HPG,302
this correlation sharpens in the presence of Lu, potentially reflecting increased ordering303
of the Si-Si distribution, an effect not observed for the AnD melts within the noise304
level. In the HPG a fourth correlation is visible at 4 A, this can be attributed to the305
2nd interaction of Si-O and is much more pronounced in the HPG due to the higher306
concentration of SiO2.307
3.2. Fit of the Lu-O contribution308
The radial distribution function G(r) is the sum of all the individual ion-ion inter-309
actions within the sample, where each individual Gaussian, g(r)ind, represents a single310
ion-ion contribution. This was fit using the following relations:311
G(r) =∑
g(r)ind =1
n0S∞
∑i
xiAi
σi√
2πexp
(−(r − di)2
2σ2i
), (4)
where;312
Ai =CNi∫
4πr2
σi√2πexp−
((r−di)22σ2
i
)dr. (5)
The coordination number for the individual ion-ion contributions, CNi, is related313
to the integral under each individual Gaussian by the density, n0, and concentration,314
xi, of the species. The interatomic distance is di and σi = k√di defines the width of the315
Gaussian using an adjustable parameter k (Hosemann and Bagchi (1962)), with values316
ranging from 0.07 to 0.2 depending on the ion-ion contribution. Over this pressure and317
temperature range it is assumed that the Si-O coordination, CNSi−O, of 4 and bond318
length, rSi−O, of 1.61 A remain unchanged (Benmore et al. (2010); Sanloup et al. (2013);319
Sato and Funamori (2010)). Other known peak positions, i.e. Al-O for HPG and Al-O,320
Mg-O and Ca-O for AnD, and coordination numbers are taken from literature (Guillot321
16

Figure 5: Measured G(r) (black markers) from Figure 4 shown with Gaussian fits to both the plain (up-
per panels) and doped (lower panels) samples. Individual Gaussians, gind(r), for ion-ion contributions
are labelled (dotted lines) along with the total sum of Gaussians (solid black line). Left panels show
the AnD compositions and right panels, the HPG. Lu-O contributions are shown in the doped figures
by a thick black line and are labelled as Lu-O. Major element fit parameters are identical between the
doped and undoped samples using parameters described in Table 3.
17

Table 3: Ion-ion contributions used to model individual Gaussians, g(r)ind for both compositions. *
indicates values taken from references cited in the text, all others are fitted. The coordination numbers
obtained for Lu are an average over a minimum of 10 fits with error of ±0.3 for each final value. di =
bond length, CNi = coordination of individual bond. ‘-’ indicates that the value is identical to above
mentioned.
P -independent contributions
HPG AnD
Si-O Lu-O Si-O Mg-O
di CNi di CNi di CNi di CNi
1.6 (2) 4∗ 2.36 (3) 8.1 1.6 (2) 4∗ 2.00 (5) 5∗
P -dependent contributions
HPG AnD
P Al-O P Al-O Ca-O Lu-O
(GPa) di CNi (GPa) di CNi di CNi di CNi
0.5 1.73 (1) 4.1∗ 0.8 1.73 (1) 4.3∗ 2.40 (2) 7∗ 2.29 (2) 6.2
2.1 - 4.1∗ 2.1 - 4.5∗ - 7.2∗ 2.32 (2) -
2.5 - 4.2∗ 3.1 - 4.5∗ - 7.4∗ 2.30 (2) -
3.8 - 4.4∗ 4.5 - 4.6∗ - 7.6∗ 2.32 (2) -
5.8 - 4.6∗ 5.2 - 4.7∗ - 8.2∗ 2.39 (2) 7.9
7.8 - 4.9∗ - 8.3∗ 2.41 (2) -
and Sator (2007a,b); Sun et al. (2011); Drewitt et al. (2015), and listed in Table 3). Na322
contribution is insignificant to the total G(r) due to its light scattering so is not shown323
here, as in rhyolitic G(r) models by Vuilleumier et al. (2009). Bond distances above324
3 A (e.g. K-O, Si-Si) do not contribute to the signal below the Lu-O contribution and325
were fitted as a single contribution.326
Initially the undoped data for each pressure are fitted with a sum of Gaussians to327
obtain interatomic distances for major element ion-ion contributions at r < 2.5 A along328
with the O-O contribution (Figure 5), and the same parameters are used to fit the Lu-329
doped data. This results in the isolation of the fit parameters required for CNLu−O and330
dLu−O (Table 3 and Figure 5). This technique limits the uncertainty that arises from331
fitting complex pair distribution functions but errors in the average coordination arise332
from the asymmetry of the real g(r)ind correlations and their high r oscillations.333
18
3.3. Lutetium incorporation334
In the HPG melt, a bond distance rLu−O = 2.36(3) A was observed and found to be335
invariable with pressure within the accuracy of this technique. The average CNLu−O336
was determined to be 8.1(3) at all pressure and temperature conditions. For the AnD337
a CNLu−O of 6.2 (3) and a rLu−O of 2.29 (2) A were determined for the lowest pressure338
data (<5 GPa) and the ambient doped glass. The higher pressure points show a clear339
shift in fit correlation to a higher rLu−O of 2.40 (3) A and an estimated CNLu−O of 7.9340
(3) (Table 3, Figure 6). This change appears to be abrupt, occurring within 1 GPa341
(from the accuracy of our data points), and it only affects the Lu-O contribution. This342
is unlike major element coordination changes which undergo a transition over a broad343
pressure range (Sato and Funamori (2010); Drewitt et al. (2015); Yarger et al. (1995)).344
At two pressure points data were also collected at three temperatures over a 400 K345
range (Supplementary Material). The Lu-O contribution in AnD seems unaffected by346
T at least within the uncertainties of the method, i.e. 0.2 A on bond length and 0.2 on347
the coordination number.348
Crystalline oxide bond lengths for Lu-O are in good agreement with the distance of349
the r2 correlation at ambient pressure. Six-fold coordinated Lu-O in oxides is reported350
to be 2.24 A and 8-fold coordinated Lu-O at 2.32 A which agree with tabulated ionic351
radii by Shannon (1976). Studies on other REE glasses, e.g. YbSiAlO/N, have found352
similar parameters with Yb-O coordination at 6 and a bond length of 2.22 A (Uhlig353
et al. (1998)). Other REE-O such as Dy and La in sodium silicates show decreasing354
bond length with atomic radii due to the lanthanide contraction, with 6-fold Dy-O at355
2.29 A and La-O at 2.48 A. In this study, a coordination CNLu−O of 6 gives rise to a356
bond distance of 2.29 A, and CNLu−O of 8 gives 2.36-2.4 A, as might be expected in the357
liquid this distance is slightly longer than those of the solids.358
4. Discussion359
To our knowledge this is the first experimental study of its kind to identify the360
structural incorporation of trace elements in situ within a silicate melt structure at361
high pressure, previous EXAFS data having been measured on glasses at ambient con-362
ditions. As the ambient pressure results presented for CNLu−O in glasses corroborate363
coordinations and bond lengths of Y, a geochemical proxy for Lu but with a lower364
absorption K-edge energy that makes it suitable for EXAFS analysis (Simon et al.,365
2013), this method appears to provide a reliable tool for determining REE speciation366
19
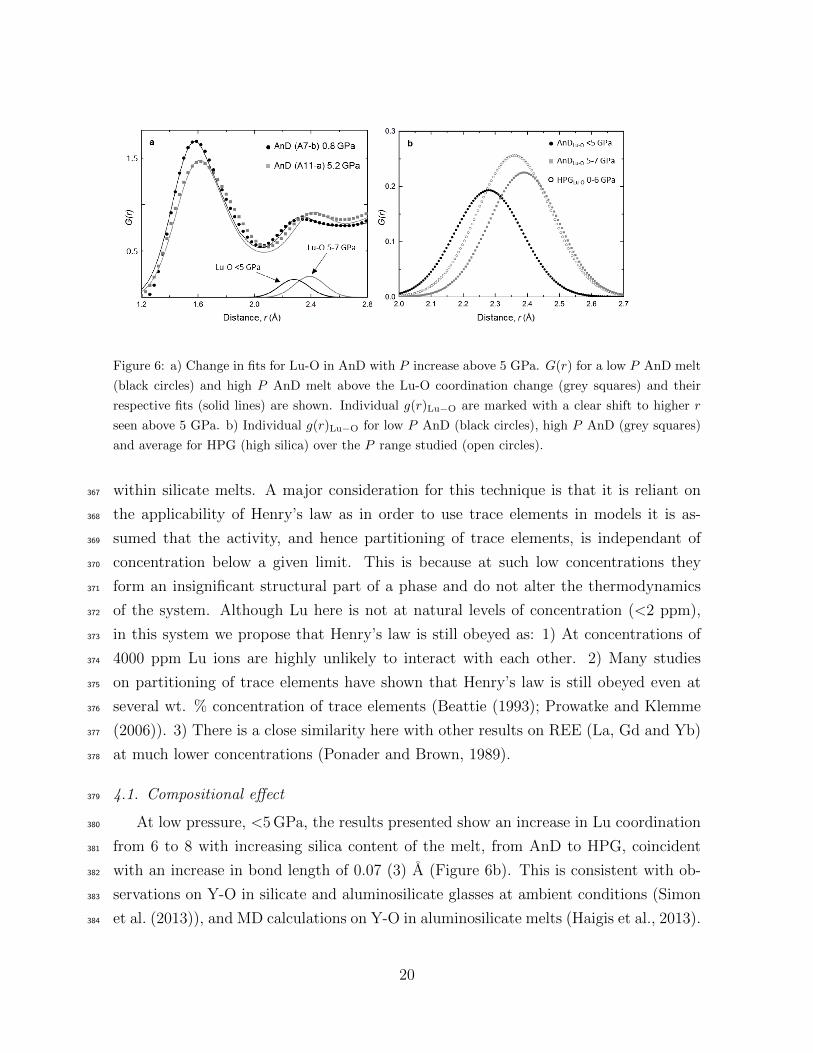
Figure 6: a) Change in fits for Lu-O in AnD with P increase above 5 GPa. G(r) for a low P AnD melt
(black circles) and high P AnD melt above the Lu-O coordination change (grey squares) and their
respective fits (solid lines) are shown. Individual g(r)Lu−O are marked with a clear shift to higher r
seen above 5 GPa. b) Individual g(r)Lu−O for low P AnD (black circles), high P AnD (grey squares)
and average for HPG (high silica) over the P range studied (open circles).
within silicate melts. A major consideration for this technique is that it is reliant on367
the applicability of Henry’s law as in order to use trace elements in models it is as-368
sumed that the activity, and hence partitioning of trace elements, is independant of369
concentration below a given limit. This is because at such low concentrations they370
form an insignificant structural part of a phase and do not alter the thermodynamics371
of the system. Although Lu here is not at natural levels of concentration (<2 ppm),372
in this system we propose that Henry’s law is still obeyed as: 1) At concentrations of373
4000 ppm Lu ions are highly unlikely to interact with each other. 2) Many studies374
on partitioning of trace elements have shown that Henry’s law is still obeyed even at375
several wt. % concentration of trace elements (Beattie (1993); Prowatke and Klemme376
(2006)). 3) There is a close similarity here with other results on REE (La, Gd and Yb)377
at much lower concentrations (Ponader and Brown, 1989).378
4.1. Compositional effect379
At low pressure, <5 GPa, the results presented show an increase in Lu coordination380
from 6 to 8 with increasing silica content of the melt, from AnD to HPG, coincident381
with an increase in bond length of 0.07 (3) A (Figure 6b). This is consistent with ob-382
servations on Y-O in silicate and aluminosilicate glasses at ambient conditions (Simon383
et al. (2013)), and MD calculations on Y-O in aluminosilicate melts (Haigis et al., 2013).384
20

As discussed in the introduction, this compositional effect is attributed to the higher385
availability of non-bridging oxygens in the basaltic network due to the presence of oxy-386
gens weakly bonded to Ca atoms (Haigis et al., 2013). This is reflected in the narrower387
distribution around a shorter mean Lu-O distance calculated for less polymerised melts388
(Haigis et al., 2013) and observed in the present work (Figure 6b and width parameters389
reported in Table 3). The results for the HPG presented here are all for a hydrous com-390
position. We measure the same Lu-O coordination number in our hydrous composition391
than reported in dry silicate glasses for Y (Simon et al., 2013). This indicates that392
the absence of water would not affect our results. Since water de-polymerises the melt393
structure (Mysen et al., 1980) as can been seen by the shift of the first sharp diffraction394
peak to high Q-values initially reported for hydrous forsterite-enstatite melts (Yamada395
et al., 2007) and observed here as well (cf section 3.1), this in turn implies that Lu does396
not enter the ring structure as expected from its large size.397
4.2. Pressure effect398
Within the HPG there is no observable pressure effect on Lu incorporation within399
the melt structure up to 8 GPa. Silica rich melts are predominantly comprised of400
interconnected rings of tetrahedra that form cages (Kohara et al., 2011). As pressure401
increases these collapse as the network is compressed and reaches a packing limit around402
5 GPa (Wang et al., 2014). However as Lu is unlikely to be accommodated within the403
cages there is little compressional effect on its speciation within the melt. Within the404
AnD, however, an increase in P causes an abrupt coordination increase between 4-405
5 GPa, accompanied by an increase in the bond length from 2.29 to 2.40 A (Figure 6).406
Therefore above 5 GPa the CNLu−O and rLu−O are similar to that of the HPG. At high407
pressures, as the packing limit of the melt is reached, Lu is forced onto ‘crystal-like’408
sites and coordination increases. The presence of these ‘crystal-like’ sites in the melt409
was suggested by van Westrenen et al. (2000), who suggested that oxide like, J2O3, and410
garnet like, J3Al5O12, sites might exist in the melt structure and influence partition411
coefficients due to the site elasticity and radii. van Westrenen et al. (2000) showed that412
partitioning behaviour between silicate melt and garnets could be better explained by413
the presence of J3Al5O12 sites with 8-fold coordination within the melt, rather than 6-414
fold J2O3 sites. As pressure increases and the melt is packed more closely together it is415
likely that more ‘crystal-like’ sites are created within the melt with a higher coordination416
environment. These have a similar bonding environment to sites within minerals such as417
garnet and therefore a reduction at high P in partition coefficient between the melt and418
21

minerals, where REE3+ are usually compatible, would be expected. It is also interesting419
to note that Ca atoms, that constitute the second shell of neighbours around Lu after420
O atoms in depolymerised melts (Haigis et al., 2013), get progressively bonded to more421
O atoms in the 0-10 GPa interval with a Ca-O coordination number increasing from 7422
to 9 (Guillot and Sator, 2007a; Sun et al., 2011; Drewitt et al., 2015).423
4.3. Impact on Partition Coefficients424
The coordination change from 6 to 8 as melt polymerisation increases (i.e. from425
the AnD to the HPG) corresponds with results presented by Prowatke and Klemme426
(2005) and Schmidt et al. (2006) on the dramatic increase in REE partition coefficients427
with melt polymerisation. This increase in compatibility and preference to incorporate428
in the mineral as polymerisation of the melt increases has been proposed to be due429
to the energetics associated with bonding to predominantly bridging oxygens. In de-430
polymerised melts the large sites and freely available non-bridging oxygens mean that431
at lower P the REEs can more easily incorporate into the melt structure than in the432
crystal lattice. Although we find that Lu has the same coordination in polymerised433
melts as the basaltic melts at >5 GPa, existing partitioning studies would suggest that434
the site or mechanism for Lu incorporation in these melts is different as opposite par-435
titioning behaviour is observed (between low pressure basaltic and granitic melts an436
increase in DLu is witnessed, but a decrease in DLu between low pressure and >5 GPa437
basaltic melts).438
From these results we propose that in basaltic systems, the melt has a much stronger439
influence on Dmin/melt with pressure than previously expected. The observed decrease440
in compatibility with P (Figure 1) could occur in relation with the observed change of441
local structural environment of Lu in the melt. The coordination change in the melt442
at 5 GPa results in the plateauing of the Dmin/meltREE as there is little preference for either443
the mineral or melt at this pressure. This change of local structural environment most444
likely implies a variation of the volume change of the partitioning reaction between445
mineral and melt. This is consistent with the previous findings from Corgne et al.446
(2012) who attributed the factor of 2 mismatch between their measured Dgarnet/meltREE and447
those predicted by the van Westrenen&Draper (2007) model to the P -dependence of448
the reaction volume change that is not accounted for.449
In other words, the change of local environment of Lu in melts implies that both the450
pre-exponential term, D0, and site elasticity terms be revised in the lattice strain models451
to explicitly model not only the crystal part but also the melt contribution to element452
22
partitioning. Structural changes in the melts have been advocated to explain the abrupt453
changes in the P -dependence of Dmagma/metal for Ni, Co, W circa 5 GPa (Kegler et al.,454
2008; Cottrell et al., 2009; Keppler and Rubie, 1993; Sanloup et al., 2011) and 35 GPa455
(Sanloup, 2016). The observed change of P -dependence of Dmagma/metal for Ni, Co,456
W, of Dmineral/meltLu for garnet, clinopyroxene and olivine/melt systems above 5 GPa457
can either be a mere coincidence, or suggest instead an important structural control458
from the silicate melt. The comparison of molten basalt density with crystalline basalt459
(i.e. eclogite) density shows that the large crystal-melt density difference at room P460
is divided by 3 at 5 GPa, and almost vanishes above 50 GPa (Sanloup, 2016). The461
structural control of magmas on element partitioning may thus occur through both462
abrupt changes of coordination number as reported here for Lu, and through large463
changes of melt compressibility.464
5. Conclusions465
This study shows that x-ray diffraction techniques can be used to study trace ele-466
ment incorporation in liquids at high pressure and can reliably determine the nearest-467
neighbour bond distances for minor elements. Our results show an increase in coordi-468
nation from 6 to 8 of Lu with increasing polymerisation of the melt, consistent with469
an increase in the Dmineral/melt partitioning ratio from <1 to >100. These results are470
consistent with other studies carried out on Y, Zr, Th and La with changing glass471
polymerisation. This data suggest that the coordination of REE in highly polymerised472
compositions is similar in the glass and melt and also remains constant up to 6 GPa.473
An abrupt coordination increase from 6 to 8 is observed at 4-5 GPa in less poly-474
merised systems. This coordination change suggests that at >5 GPa compression of475
the melt results in the formation of ‘crystal like’ sites that accommodate Lu at high476
pressure. This change in Lu incorporation is likely to strongly affect the partitioning477
of Lu at depth, as is the increased stiffness of magmas at high pressures.478
Overall these results indicate that not only composition but also pressure induces479
structural changes in the melt that underpin drastic changes in REE partitioning, and480
subsequently cause distinct changes in the predicted Lu/Hf ratios from deep magmas.481
As the melt structure changes with pressure, using a single melt term to normalise the482
effects of melt on trace element partitioning will not accurately predict partitioning483
behaviour at depth during magma formation or differentiation. In order to fully under-484
stand how partitioning is affected by melt structural changes, standard models should485
23

be implemented with detailed insight into the exact geometry and elasticity of the REE486
sites within the melt network with varying pressure.487
6. Acknowledgements488
C.D.G. was supported by EPSRC for PhD studentship funding with the Condensed489
Matter Doctoral Training Centre (CM-CDT) under grant number EP/G03673X/1. We490
thank Diamond Light Source for access to beamline I-15 (proposal EE9022-1) that491
contributed to some of the results presented here. Portions of this work were performed492
at HPCAT (Sector 16), Advanced Photon Source (APS), Argonne National Laboratory.493
HPCAT operations are supported by DOE-NNSA under Award No. DE-NA0001974494
and DOE-BES under Award No. DE-FG02-99ER45775, with partial instrumentation495
funding by NSF. The Advanced Photon Source is a U.S. Department of Energy (DOE)496
Office of Science User Facility operated for the DOE Office of Science by Argonne497
National Laboratory under Contract No. DE-AC02-06CH11357. We thank N. Guignot498
on PSICHE beamline at Soleil and Z. Konopkova on P02.2 at PETRAIII. This work499
was supported by the European Research Council under the European Community’s500
Seventh Framework Programme (FP7/20072013 Grant Agreement No. 259649 to C.501
Sanloup). We thank G. Bromiley for his help in proofreading this manuscript.502
24
7. References503
Anderson, A. J., Yan, H., Mayanovic, R. A., Solferino, G., Benmore, C. J., 2014. High-504
energy X-ray diffraction of a hydrous silicate liquid under conditions of high pressure505
and temperature in a modified hydrothermal diamond anvil cell. High Press. Res.506
34 (1), 100–109.507
Beattie, P., 1993. On the occurrence of apparent non-Henry’s law behaviour in experi-508
mental partitioning studies. Geochim. Cosmochim. Acta 57, 47–55.509
Benmore, C. J., Soignard, E., Amin, S. A., Guthrie, M., Shastri, S. D., Lee, P. L.,510
Yarger, J. L., 2010. Structural and topological changes in silica glass at pressure.511
Phys. Rev. B 81, 054105.512
Blundy, J., Wood, B. J., 1994. Prediction of crystal-melt partition coefficients from513
elastic moduli. Nature 372, 452–454.514
Corgne, A., Armstrong, L. S., Keshav, S., Fei, Y., McDonough, W. F., Minarik, W. G.,515
Moreno, K., 2012. Trace element partitioning between majoritic garnet and silicate516
melt at 10-17 GPa: Implications for deep mantle processes. Lithos 148, 128–141.517
Cottrell, E., Walter, M. J., Walker, D., 2009. Metal-silicate partitioning of tungsten at518
high pressure and temperature: Implications for equilibrium core formation in Earth.519
Earth Planet. Sci. Lett. 281, 275–287.520
Crepisson, C., Morard, G., Bureau, H., Prouteau, G., Morizet, Y., Petitgirard, S.,521
Sanloup, C., 2014. Magmas trapped at depth and the continental lithosphere-522
asthenosphere boundary. Earth Planet. Sci. Lett. 393, 105–112.523
Dingwell, D. B., 1998. The glass transition in hydrous granitic melts. Phys. Earth524
Planet. Int. 107, 1–8.525
Draper, D. S., Xirouchakis, D., Agee, C. B., 2003. Trace element partitioning between526
garnet and chondritic melt from 5 to 9 GPa: implications for the onset of the majorite527
transition in the martian mantle. Phys. Earth Planet. Int. 139, 149–169.528
Drewitt, J. W. E., Jahn, S., Sanloup, C., de Grouchy, C., Garbarino, G., Hennet, L.,529
2015. Development of chemical and topological structure in aluminosilicate liquids530
and glasses at high pressure. J. Phys.: Cond. Matt. 27, 105103.531
25

Drewitt, J. W. E., Sanloup, C., Bytchkov, A., Brassamin, S., Hennet, L., 2013. Struc-532
ture of (FexCa1−xO)y(SiO2)1−y liquids and glasses from high-energy x-ray diffraction:533
Implications for the structure of natural basaltic magmas. Phys. Rev. B 87, 224201.534
Evans, T. M., O’Neill, H. S. C., Tuff, J., 2008. The influence of melt composition on535
the partitioning of REEs, Y, Sc, Zr and Al between forsterite and melt in the system536
CMAS. Geochim. Cosmochim. Acta 72 (23), 5708–5721.537
Faber, T., Ziman, J., 1965. A theory of the electrical properties of liquid metals. Philos.538
Mag. 11, 153–173.539
Farges, F., 1996. Does Zr-F ‘complexation’ occur in magmas? Chem. Geol 127 (4),540
253–268.541
Fei, Y., Mao, H., 1994. In situ determination of the NiAs phase of FeO at high pressure542
and temperature . Science 266 (5191), 1678–1680.543
Funamori, N., Yamamoto, S., Yagi, T., Kikegawa, T., 2004. Exploratory studies of544
silicate melt structure at high pressures and temperatures by in situ X-ray diffraction.545
J. Geophys. Res. 109, B03203.546
Gaetani, G., 2004. The influence of melt structure on trace element partitioning near547
the peridotite solidus. Contrib. Mineral. Petrol. 147 (5), 511–527.548
Guillot, B., Sator, N., 2007a. A computer simulation study of natural silicate melts.549
Part I: low pressure properties. Geochim. Cosmochim. Acta 71, 1249–1265.550
Guillot, B., Sator, N., 2007b. A computer simulation study of natural silicate melts.551
Part II: High pressure properties. Geochim. Cosmochim. Acta 71, 4538–4556.552
Guitreau, M., Blichert-Toft, J., Martin, J., Mojszis, S., Albarede, F., 2012. Hafnium553
isotope evidence from Archean granitic rocks for deep mantle origin of continental554
crust. Earth Planet. Sci. Lett. 337, 211–213.555
Haigis, V., Salanne, M., Simon, S., Wilke, M., Jahn, S., 2013. Molecular dynamics556
simulations of Y in silicate melts and implications for trace element partitioning.557
Chem. Geol. 346 (SI), 14–21.558
Hajdu, F., 1972. Revised parameters of the analytic fits for coherent and incoherent559
scattered x-ray intensities of the first 36 atoms. Acta Cryst., 250–252.560
26

Hammersley, A., 1996. Fit2D. ESRF publication No ESRF98HA01T.561
Hart, S. R., Davis, K. E., 1978. Nickel partitioning between olivine and silicate melt.562
Earth Planet. Sci. Lett. 40, 203–219.563
Holtz, F., Pichavant, M., Barbey, P., Johannes, W., 1992. Effects of H2O on liquidus564
phase relations in the haplogranite system at 2 and 5 kbar . Am. Mineral. 77 (11-12),565
1223–1241.566
Hosemann, R., Bagchi, S. N., 1962. Direct Analysis of Diffraction by Matter. North-567
Holland, Amsterdam.568
Hubbell, J. H., Veigele, W. J., Briggs, E. A., Brown, R. T., Cromer, D. T., Hower-569
ton, R. J., 1975. Atomic form factors, incoherent scattering functions, and photon570
scattering cross sections. J. Phys. Chem. Ref. Data 4, 471.571
Imai, T., Takahashi, E., Suzuki, T., Hirata, T., 2012. Element partitioning between572
olivine and melt up to 10 GPa: Implications for the effect of pressure. Phys. Earth573
Planet. Int. 212, 64–75.574
Kegler, P., Holzheid, A., Frost, D. J., Rubie, D. C., Dohmen, R., Palme, H., 2008. New575
Ni and Co metal-silicate partitioning data and their relevance for an early terrestrial576
magma ocean. Earth Planet. Sci. Lett. 268, 28–40.577
Keppler, H., Rubie, D. C., 1993. Pressure-induced coordination changes of transition-578
metal ions in silicate melts. Nature 364, 54–56.579
Kohara, S., Akola, J., Morita, H., Suzuya, K., Weber, J. K. R., Wilding, M. C., Ben-580
more, C. J., 2011. Relationship between topological order and glass forming ability in581
densely packed enstatite and forsterite composition glasses. P. Natl. Acad. Sci. 108,582
14780–14785.583
Kono, Y., Irifune, T., Higo, Y., Inoue, T., Barnhoorn, A., 2010. P-V-T relation of MgO584
derived by simultaneous elastic wave velocity and in situ x-ray measurements: A new585
pressure scale for the mantle transition region. Phys. Earth Planet. Int. 183, 196–211.586
Kono, Y., Park, C., Kenney-Benson, C., Shen, G., Wang, Y., 2014. Toward comprehen-587
sive studies of liquids at high pressures and high temperatures: Combined structure,588
elastic wave velocity, and viscosity measurements in the Paris-Edinburgh cell. Phys.589
Earth Planet. Int. 228, 269–280.590
27

McIntire, W., 1963. Trace element partitioning coefficients - a review of theory and591
applications to geology. Geochim. Cosmochim. Acta 27, 1209–1264.592
Meade, C., Hemley, R. J., Mao, H. K., 1992. High-pressure x-ray diffraction of SiO2593
glass. Phys. Rev. Lett. 69, 1387–1390.594
Mysen, B. O., Virgo, D., Harrison, W., Scarfe, C., 1980. Solubility mechanisms of H2O595
in silicate melts at high pressures and temperatures: a Raman spectroscopic study.596
Am. Miner. 65, 900–914.597
Ponader, C., Brown, G., 1989. Rare earth elements in silicate glass/melt systems: I.598
effects of composition on the coordination environments of La, Gd, and Yb. Geochim.599
Cosmochim. Acta 53, 2893–2903.600
Prowatke, S., Klemme, S., 2005. Effect of melt composition on the partitioning of trace601
elements between titanite and silicate melts. Geochim. Cosmochim. Acta 69, 695–709.602
Prowatke, S., Klemme, S., 2006. Rare earth element partitioning between titanite and603
silicate melts: Henry’s law revisited. Geochim. Cosmochim. Acta 70, 4997–5012.604
Ryerson, F., Hess, P., 1978. Implications of liquid-liquid distribution coefficients to605
mineral-liquid partitioning. Geochim. Cosmochim. Acta 42, 921–932.606
Salters, V., Longhi, J., Bizimis, M., 2002. Near mantle solidus trace element partitioning607
at pressures up to 3.4 GPa. G3 3.608
Salters, V. J. M., Longhi, J., 1999. Trace element partitioning during the initial stages609
of melting beneath mid-ocean ridges. Earth Planet. Sci. Lett. 166, 15–30.610
Sanloup, C., JUL 1 2016. Density of magmas at depth. Chem. Geol. 429, 51–59.611
Sanloup, C., Drewitt, J. W. E., Konopkova, Z., Dalladay-Simpson, P., Morton, D. M.,612
Rai, N., van Westrenen, W., Morgenroth, W., 2013. Structural change in molten613
basalt at deep mantle conditions. Nature 503, 104–107.614
Sanloup, C., van Westrenen, W., Dasgupta, R., Maynard-Casely, H. E., Perrillat, J.-P.,615
2011. Compressibility change in iron-rich melt and implications for core formation616
models. Earth Planet. Sci. Lett. 306, 118–122.617
28

Sato, T., Funamori, N., 2010. High-pressure structural transformation of SiO2 glass up618
to 100 GPa. Phys. Rev. B 82, 184102.619
Schmidt, M. W., Connolly, J. A. D., Gunther, D., Bogaerts, M., 2006. Element parti-620
tioning: The role of melt structure and composition. Nature 312, 1646–1650.621
Shannon, R. D., 1976. Revised effective ionic radii and systematic studies of interatomic622
distances in halides and chalcogenides. Acta Crystallogr., 751–767.623
Simon, S., Wilke, M., Chernikov, R., Klemme, S., Hennet, L., 2013. The influence624
of composition on the local structure around yttrium in quenched silicate melts -625
insights from EXAFS. Chem. Geol. 346, 3–13.626
Sun, N., Stixrude, L., de Koker, N., Karki, B. B., 2011. First principles molecular627
dynamics simulations of diopside (CaMgSi2O6) liquid to high pressure. Geochim.628
Cosmochim. Acta 75, 3792–3802.629
Suzuki, T., Hirata, T., Yokoyama, T. D., Imai, T., Takahashi, E., 2012. Pressure effect630
on element partitioning between minerals and silicate melt: Melting experiments on631
basalt up to 20 GPa. Phys. Earth Planet. Int. 208, 59–73.632
Uhlig, H., Hoffmann, M. J., Lamparter, P., Steeb, S., 1998. Atomic structure of rare633
earth Si-Al-O-N glasses. Z. Naturforsch. 53, 259–264.634
van Westrenen, W., Allan, N. L., Blundy, J. D., Purton, J. A., Wood, B. J., 2000.635
Atomistic simulation of trace element incorporation into garnets — comparison with636
experimental garnet-melt partitioning data. Geochim. Cosmochim. Acta 64, 1629–637
1639.638
van Westrenen, W., Draper, D. S., 2007. Quantifying garnet-melt trace element par-639
titioning using lattice-strain theory: new crystal-chemical and thermodynamic con-640
straints. Contrib. Mineral. Petrol. 154 (6), 717–730.641
van Westrenen, W., Wood, B. J., Blundy, J., 1999. Crystal-chemistry controls on trace642
element partitioning between garnet and anhydrous silicate melts. Am. Mineral. 84,643
838–847.644
Vuilleumier, R., Sator, N., Guillot, B., 2009. Computer modeling of natural silicate645
melts: What can we learn from ab initio simulations. Geochim. Cosmchim. Acta 73,646
6313–6339.647
29

Wang, Y. B., Sakamaki, T., Skinner, L. B., Jing, Z., Yu, T., Kono, Y., Park, C., Shen,648
G., Rivers, M. L., Sutton, S. R., 2014. Atomistic insight into viscosity and density of649
silicate melts under pressure. Nature Comm. 5, 3241.650
Wood, B., Blundy, J., 1997. A predictive model for rare earth element partitioning651
between clinopyroxene and anhydrous silicate melt. Contrib. Mineral. Petrol. 129 (2-652
3), 166–181.653
Wood, B. J., Blundy, J. D., 2013. Trace Element Partitioning : The Influences of Ionic654
Radius, Cation Charge, Pressure, and Temperature. Vol. 437. JAI-Elsevier Science655
inc., pp. 421–448.656
Yamada, A., Inoue, T., Urakawa, S., Funakoshi, K.-i., Funamori, N., Kikegawa, T.,657
Ohfuji, H., Irifune, T., 2007. In situ X-ray experiment on the structure of hydrous658
Mg-silicate melt under high pressure and high temperature. Geophys. Res. Lett.659
34 (10).660
Yarger, J. L., Smith, K. H., Nieman, R. A., Diefenbacher, J., Wolf, G. H., Poe, B. T.,661
McMillan, P. F., 1995. Al coordination changes in high-pressure aluminosilicate liq-662
uids. Science 270, 1964–1967.663
Zeidler, A., Drewitt, J. W. E., Salmon, P. S., Barnes, A. C., Crichton, W. A., Klotz,664
S., Fischer, H. E., Benmore, C. J., Ramos, S., Hannon, A. C., 2009. Establishing the665
structure of GeS2 at high pressures and temperatures: a combined approach using666
x-ray and neutron diffraction. J. Phys. Cond. Matt. 21 (47).667
30